
The Key Controlling Factors and Mechanisms for the Formation of Sandstone-Type Uranium Deposits in the Central Part of the Ulanqab Depression, Erlian Basin


Abstract
1. Introduction
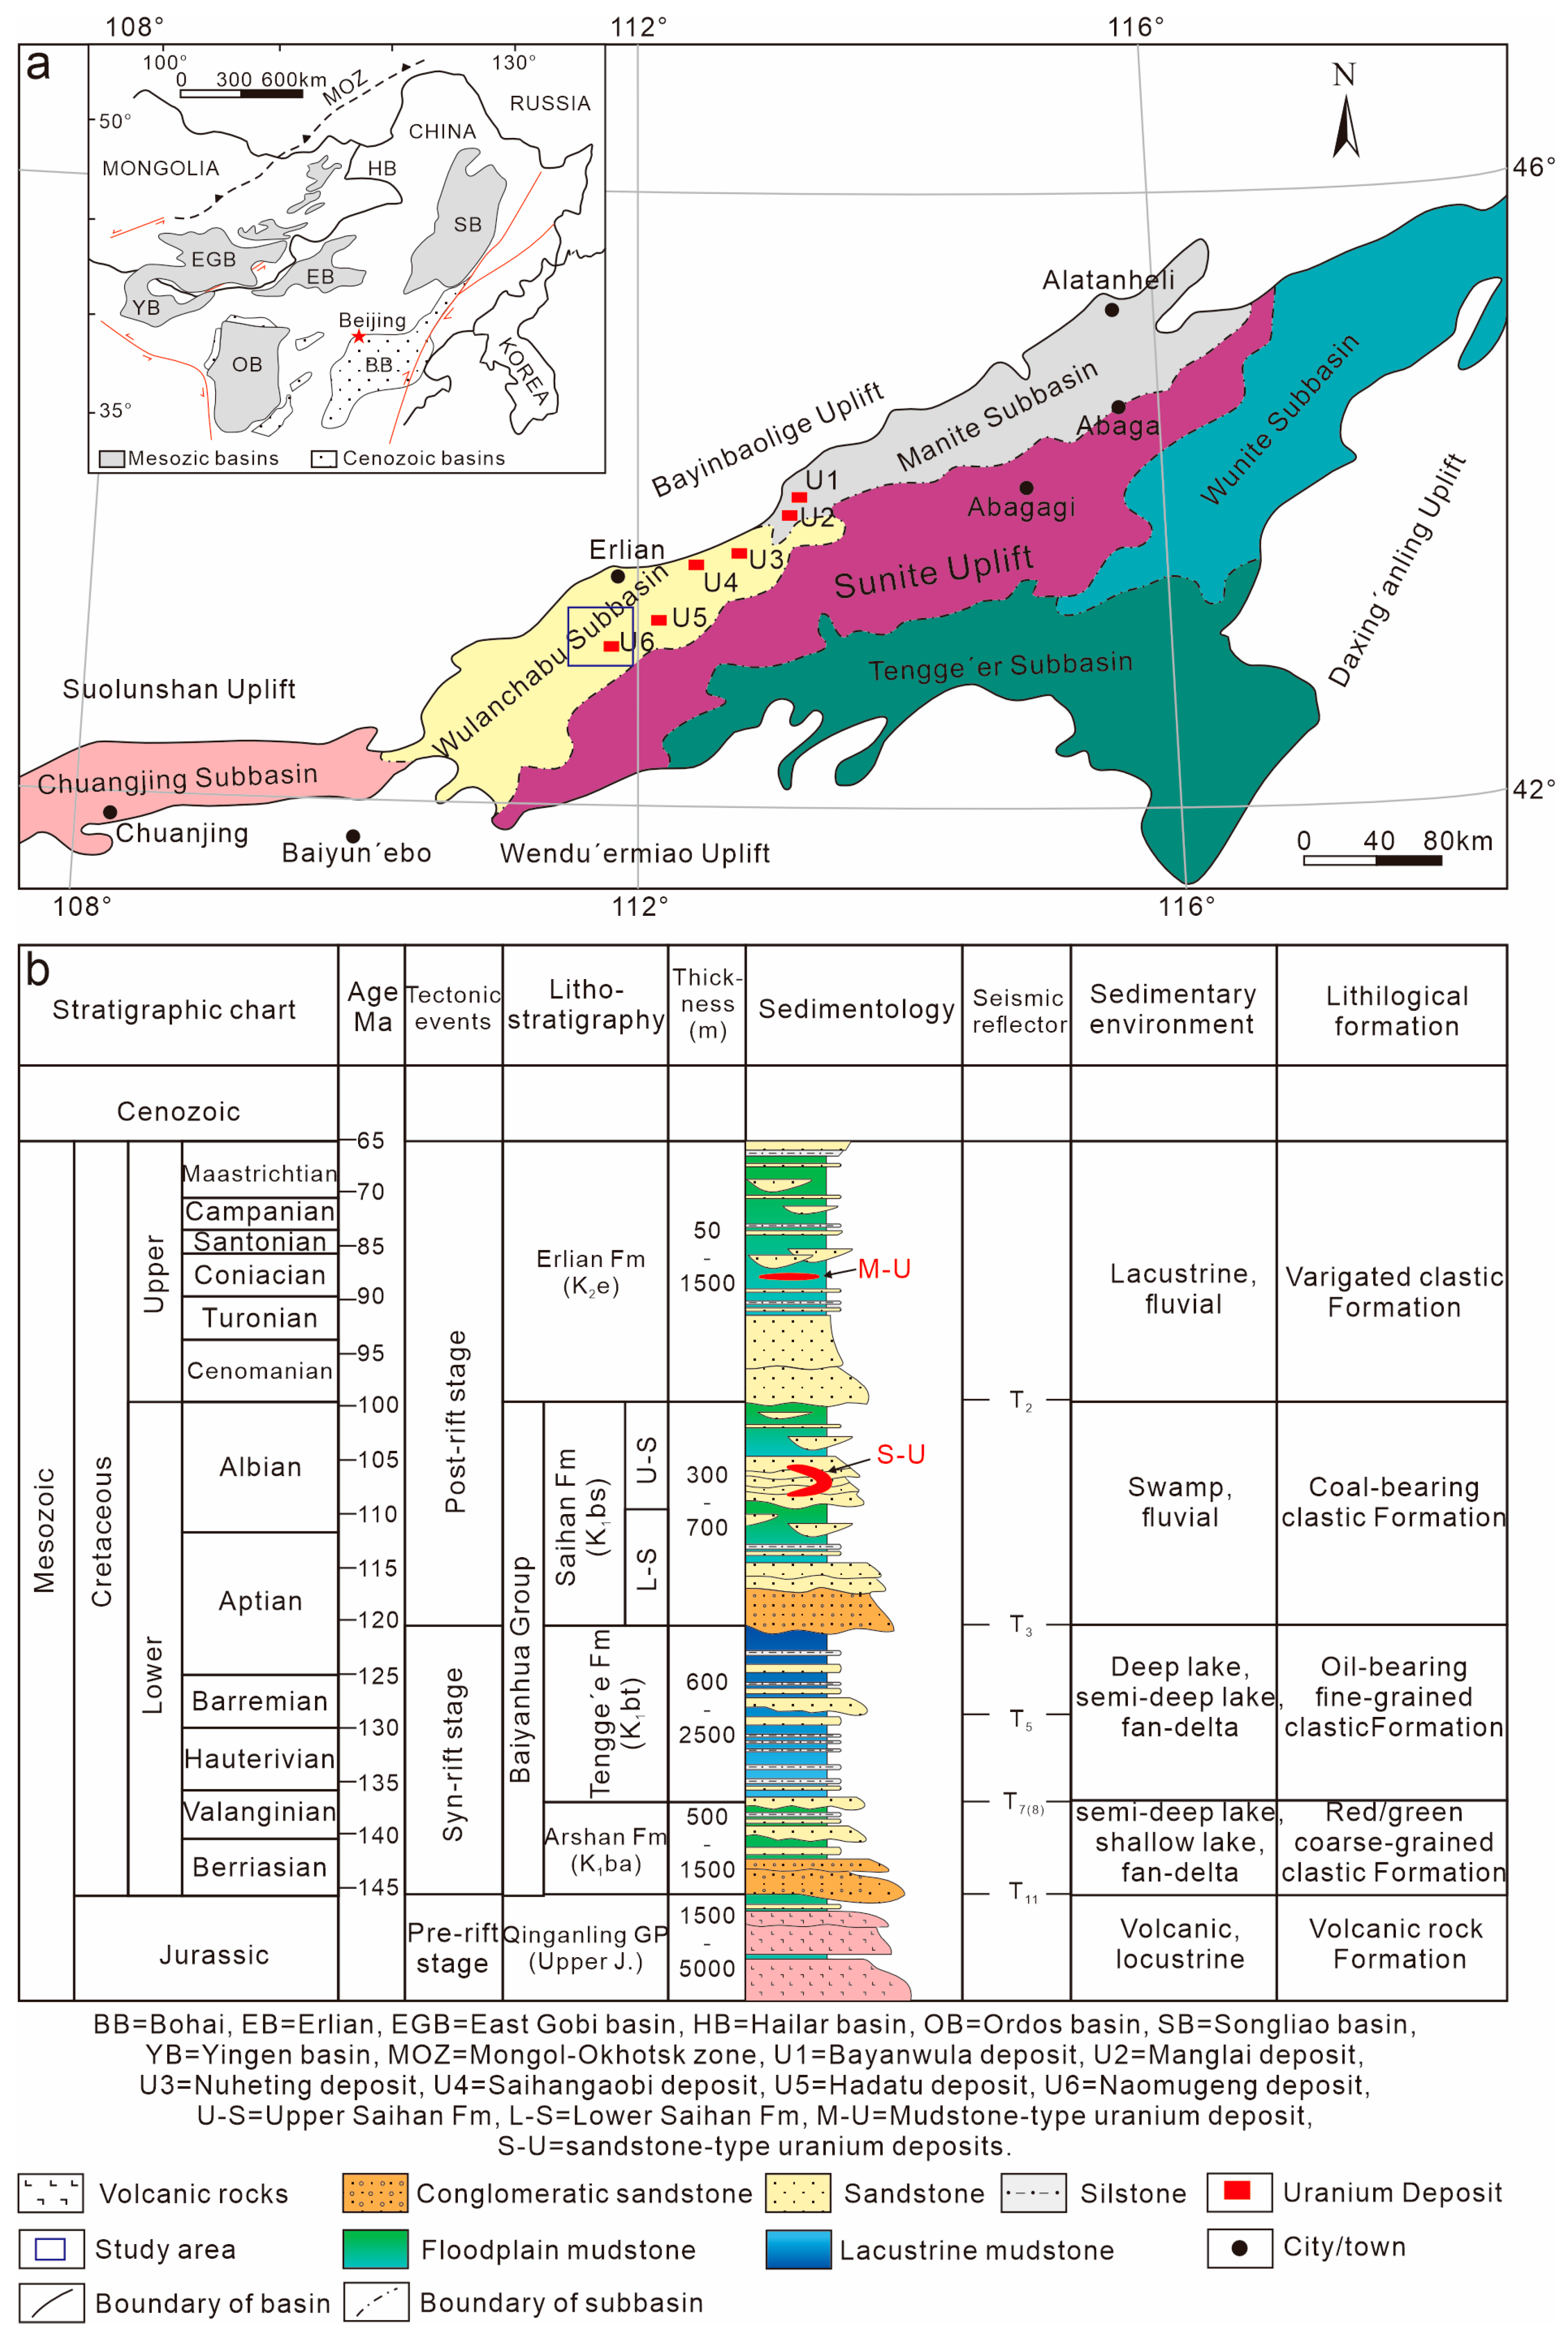
2. Geological Setting
3. Samples and Tests Methods
4. Results
4.1. Macroscopic Identification of Interlayer Oxidation Zones
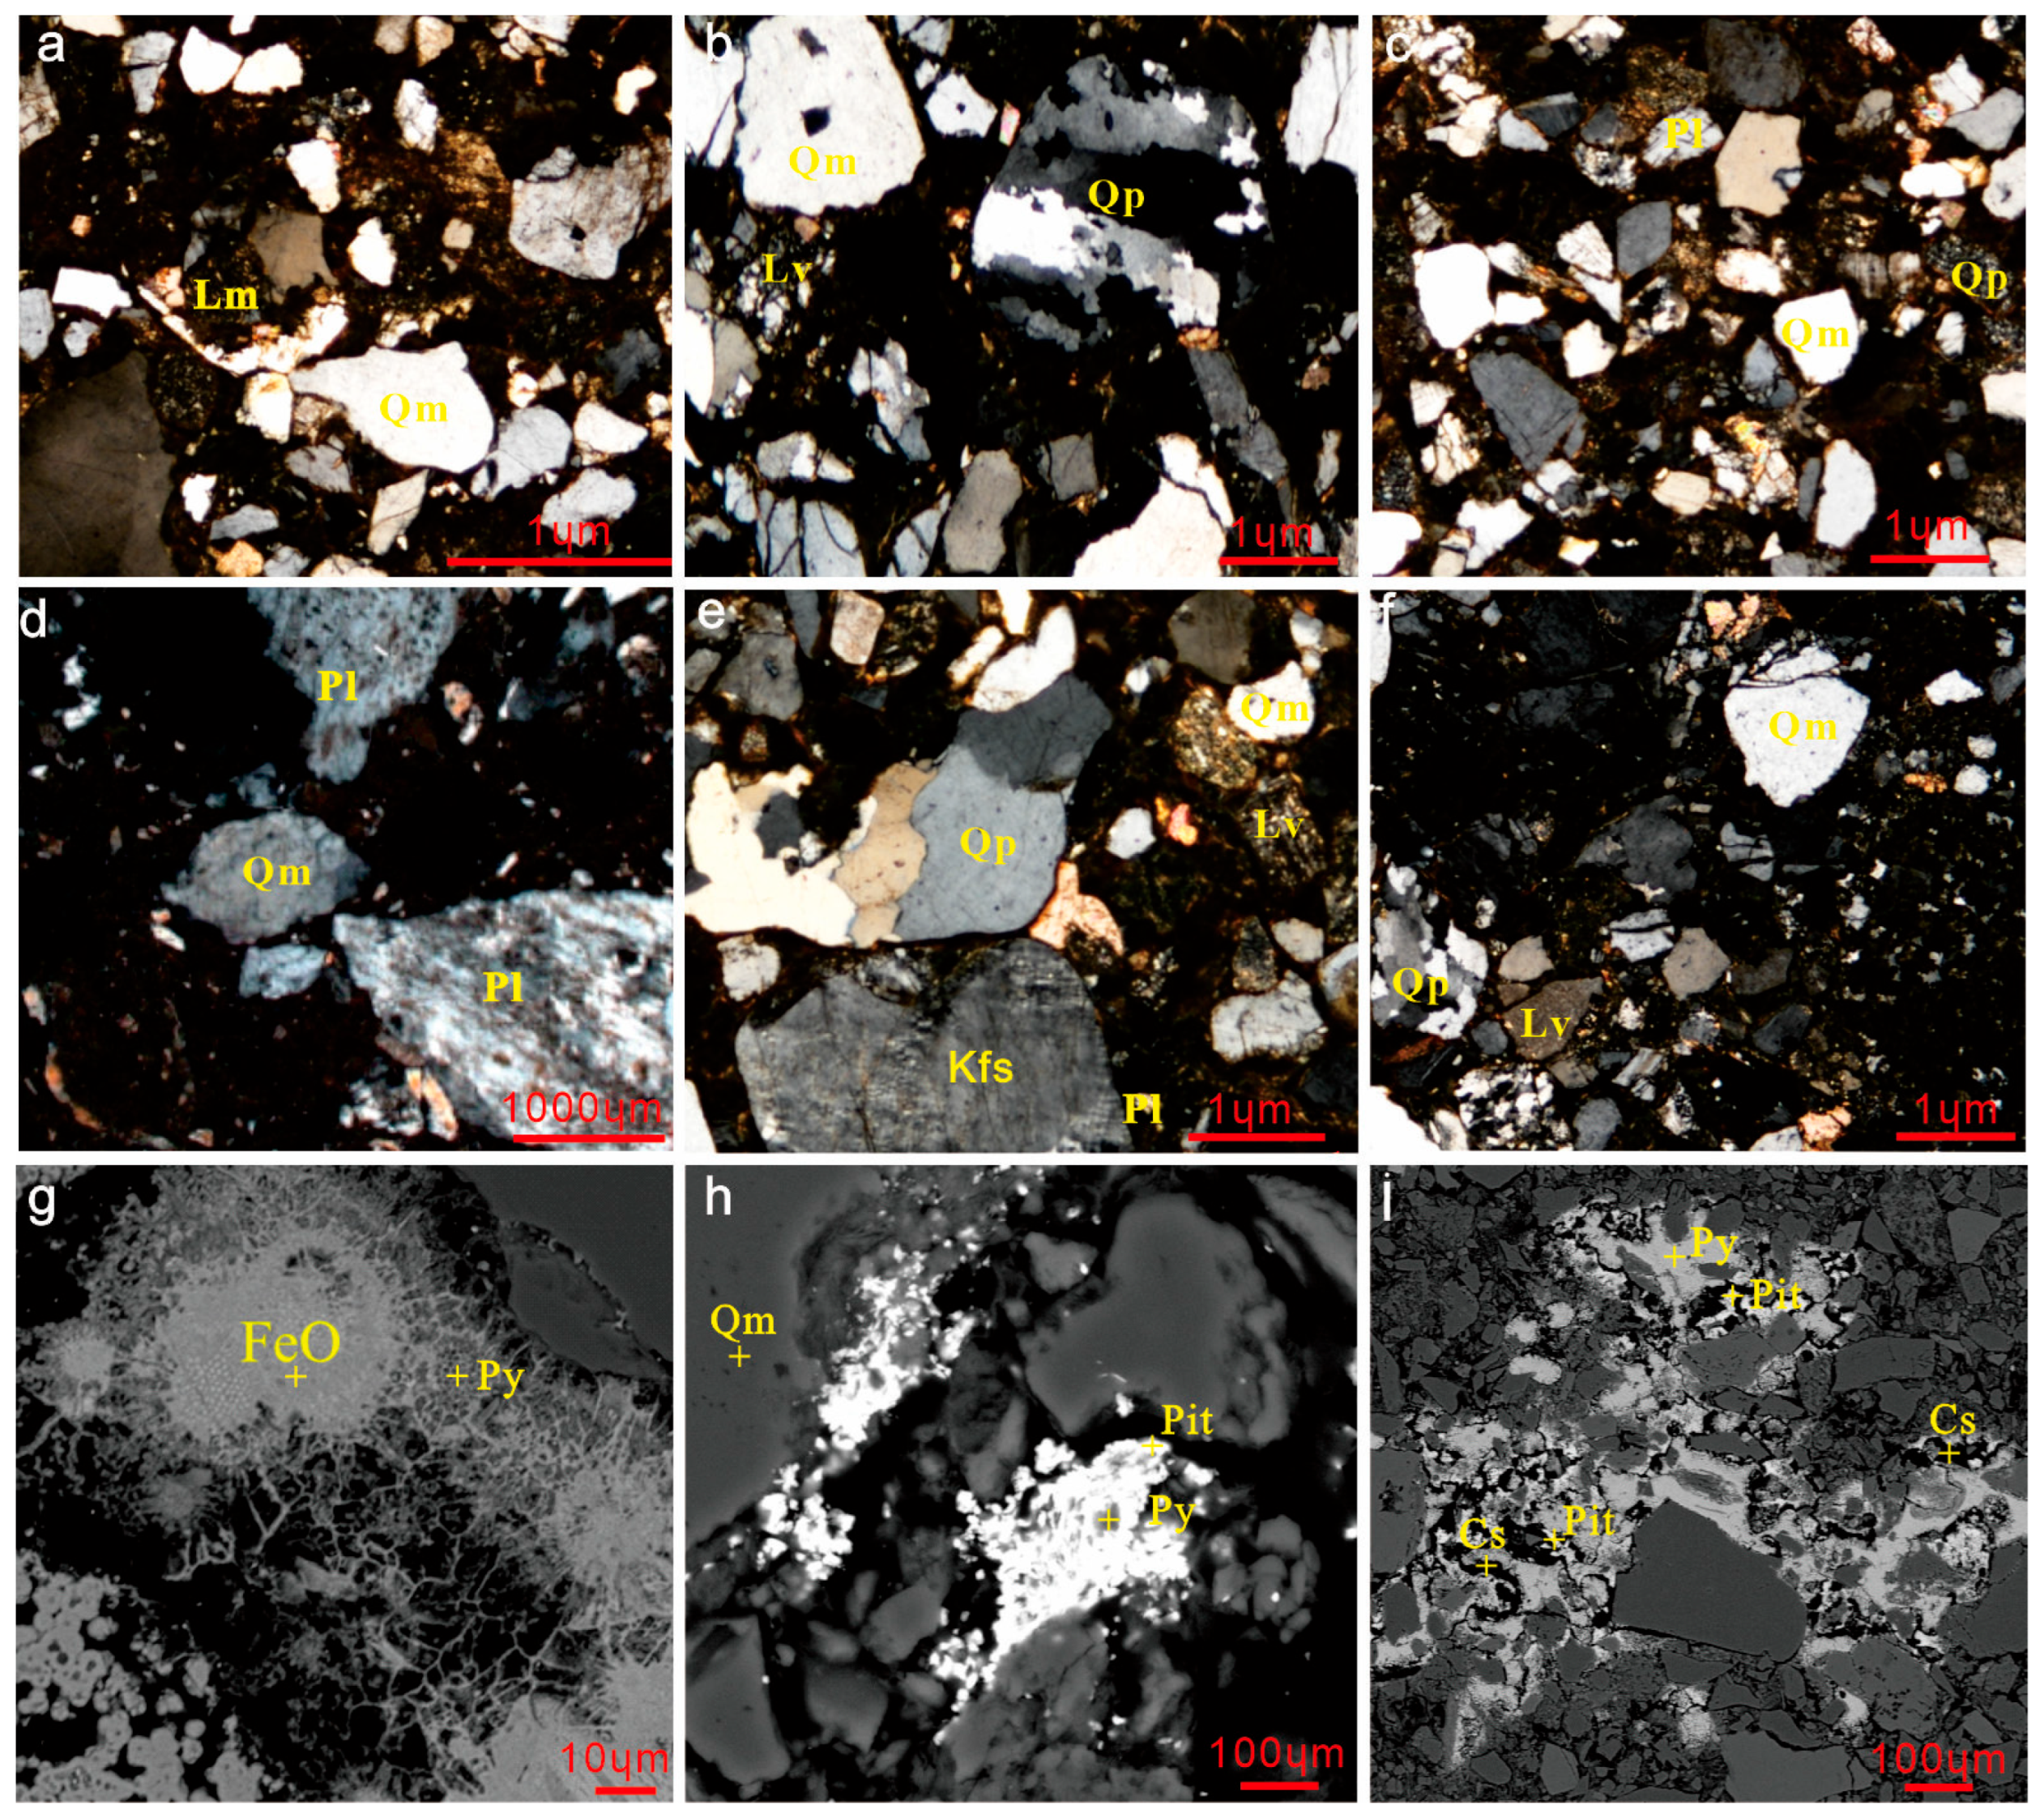
4.2. Clastic Grain Characteristics of Interlayer Oxidation Zone
4.3. Environmentally Sensitive Parameters of Interlayer Oxidation Zones
4.3.1. Reduction Zone
4.3.2. Strong Oxidation Zone
4.3.3. Weak Oxidation Zone
4.3.4. Transition Zone
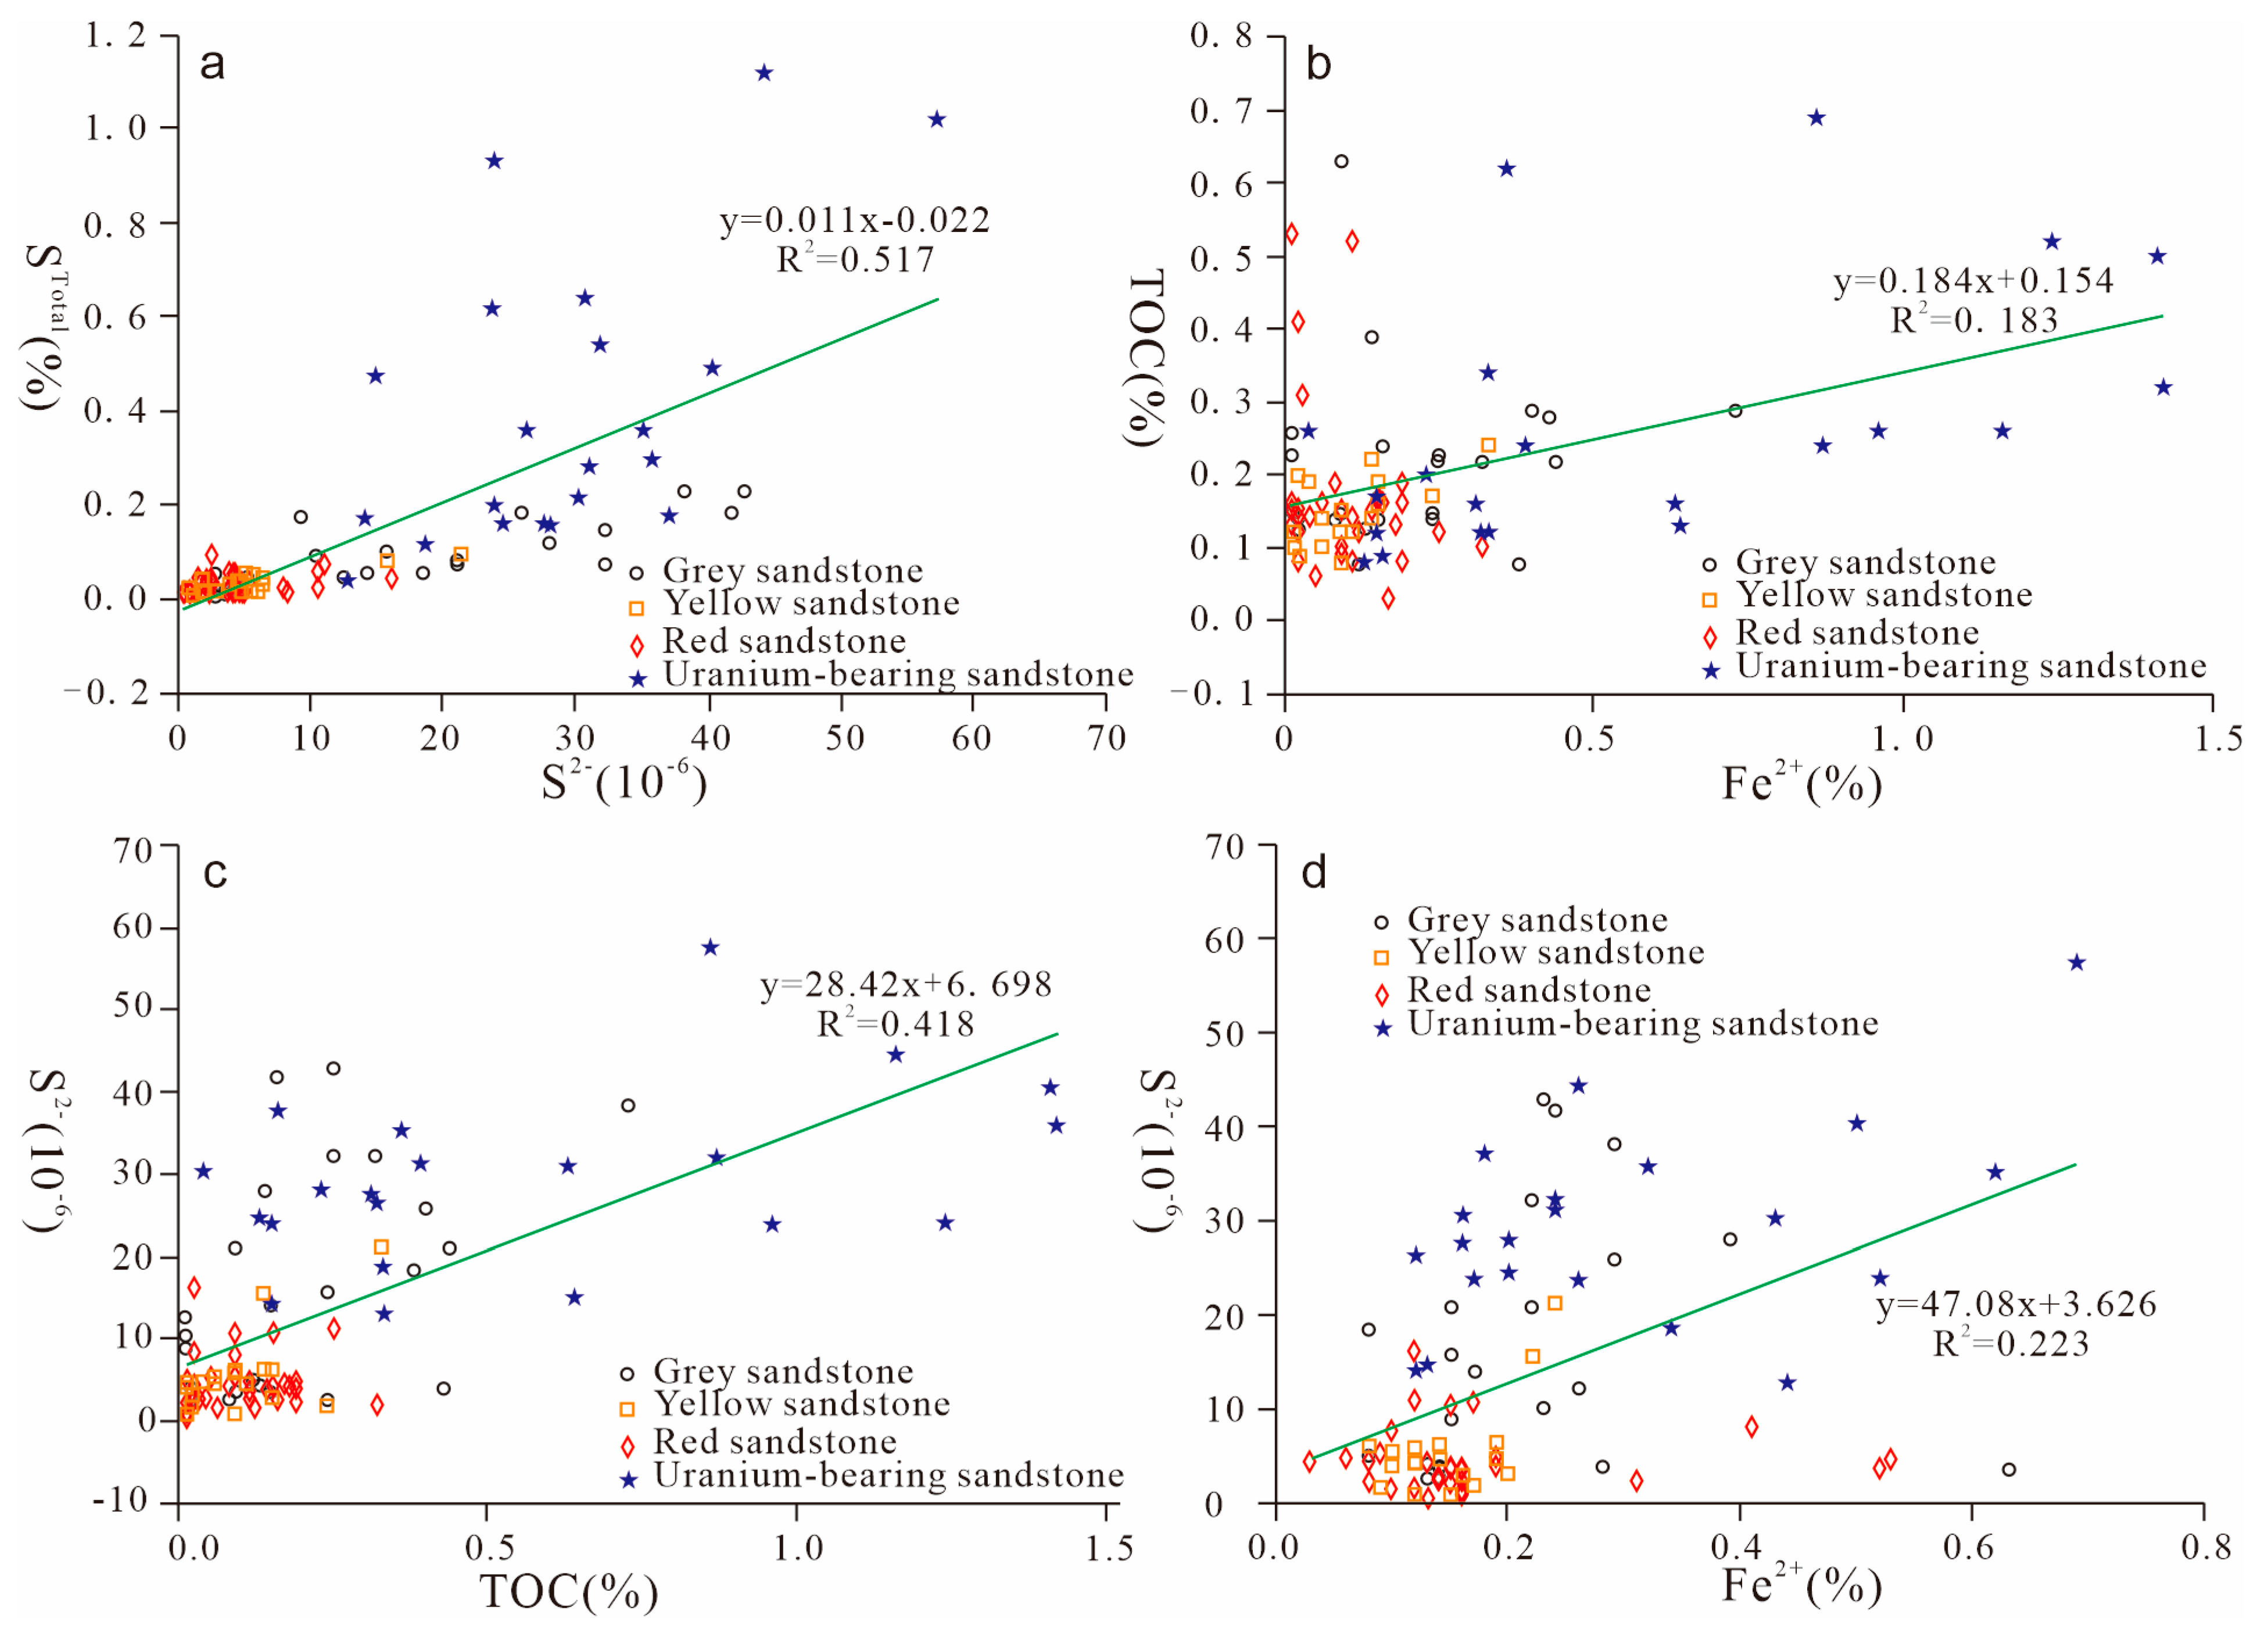
4.4. Geochemical Element Association Characteristics of Interlayer Oxidation Zones

5. Discussion
5.1. Spatial Architecture and Dynamic Evolution of Interlayer Oxidation Zones
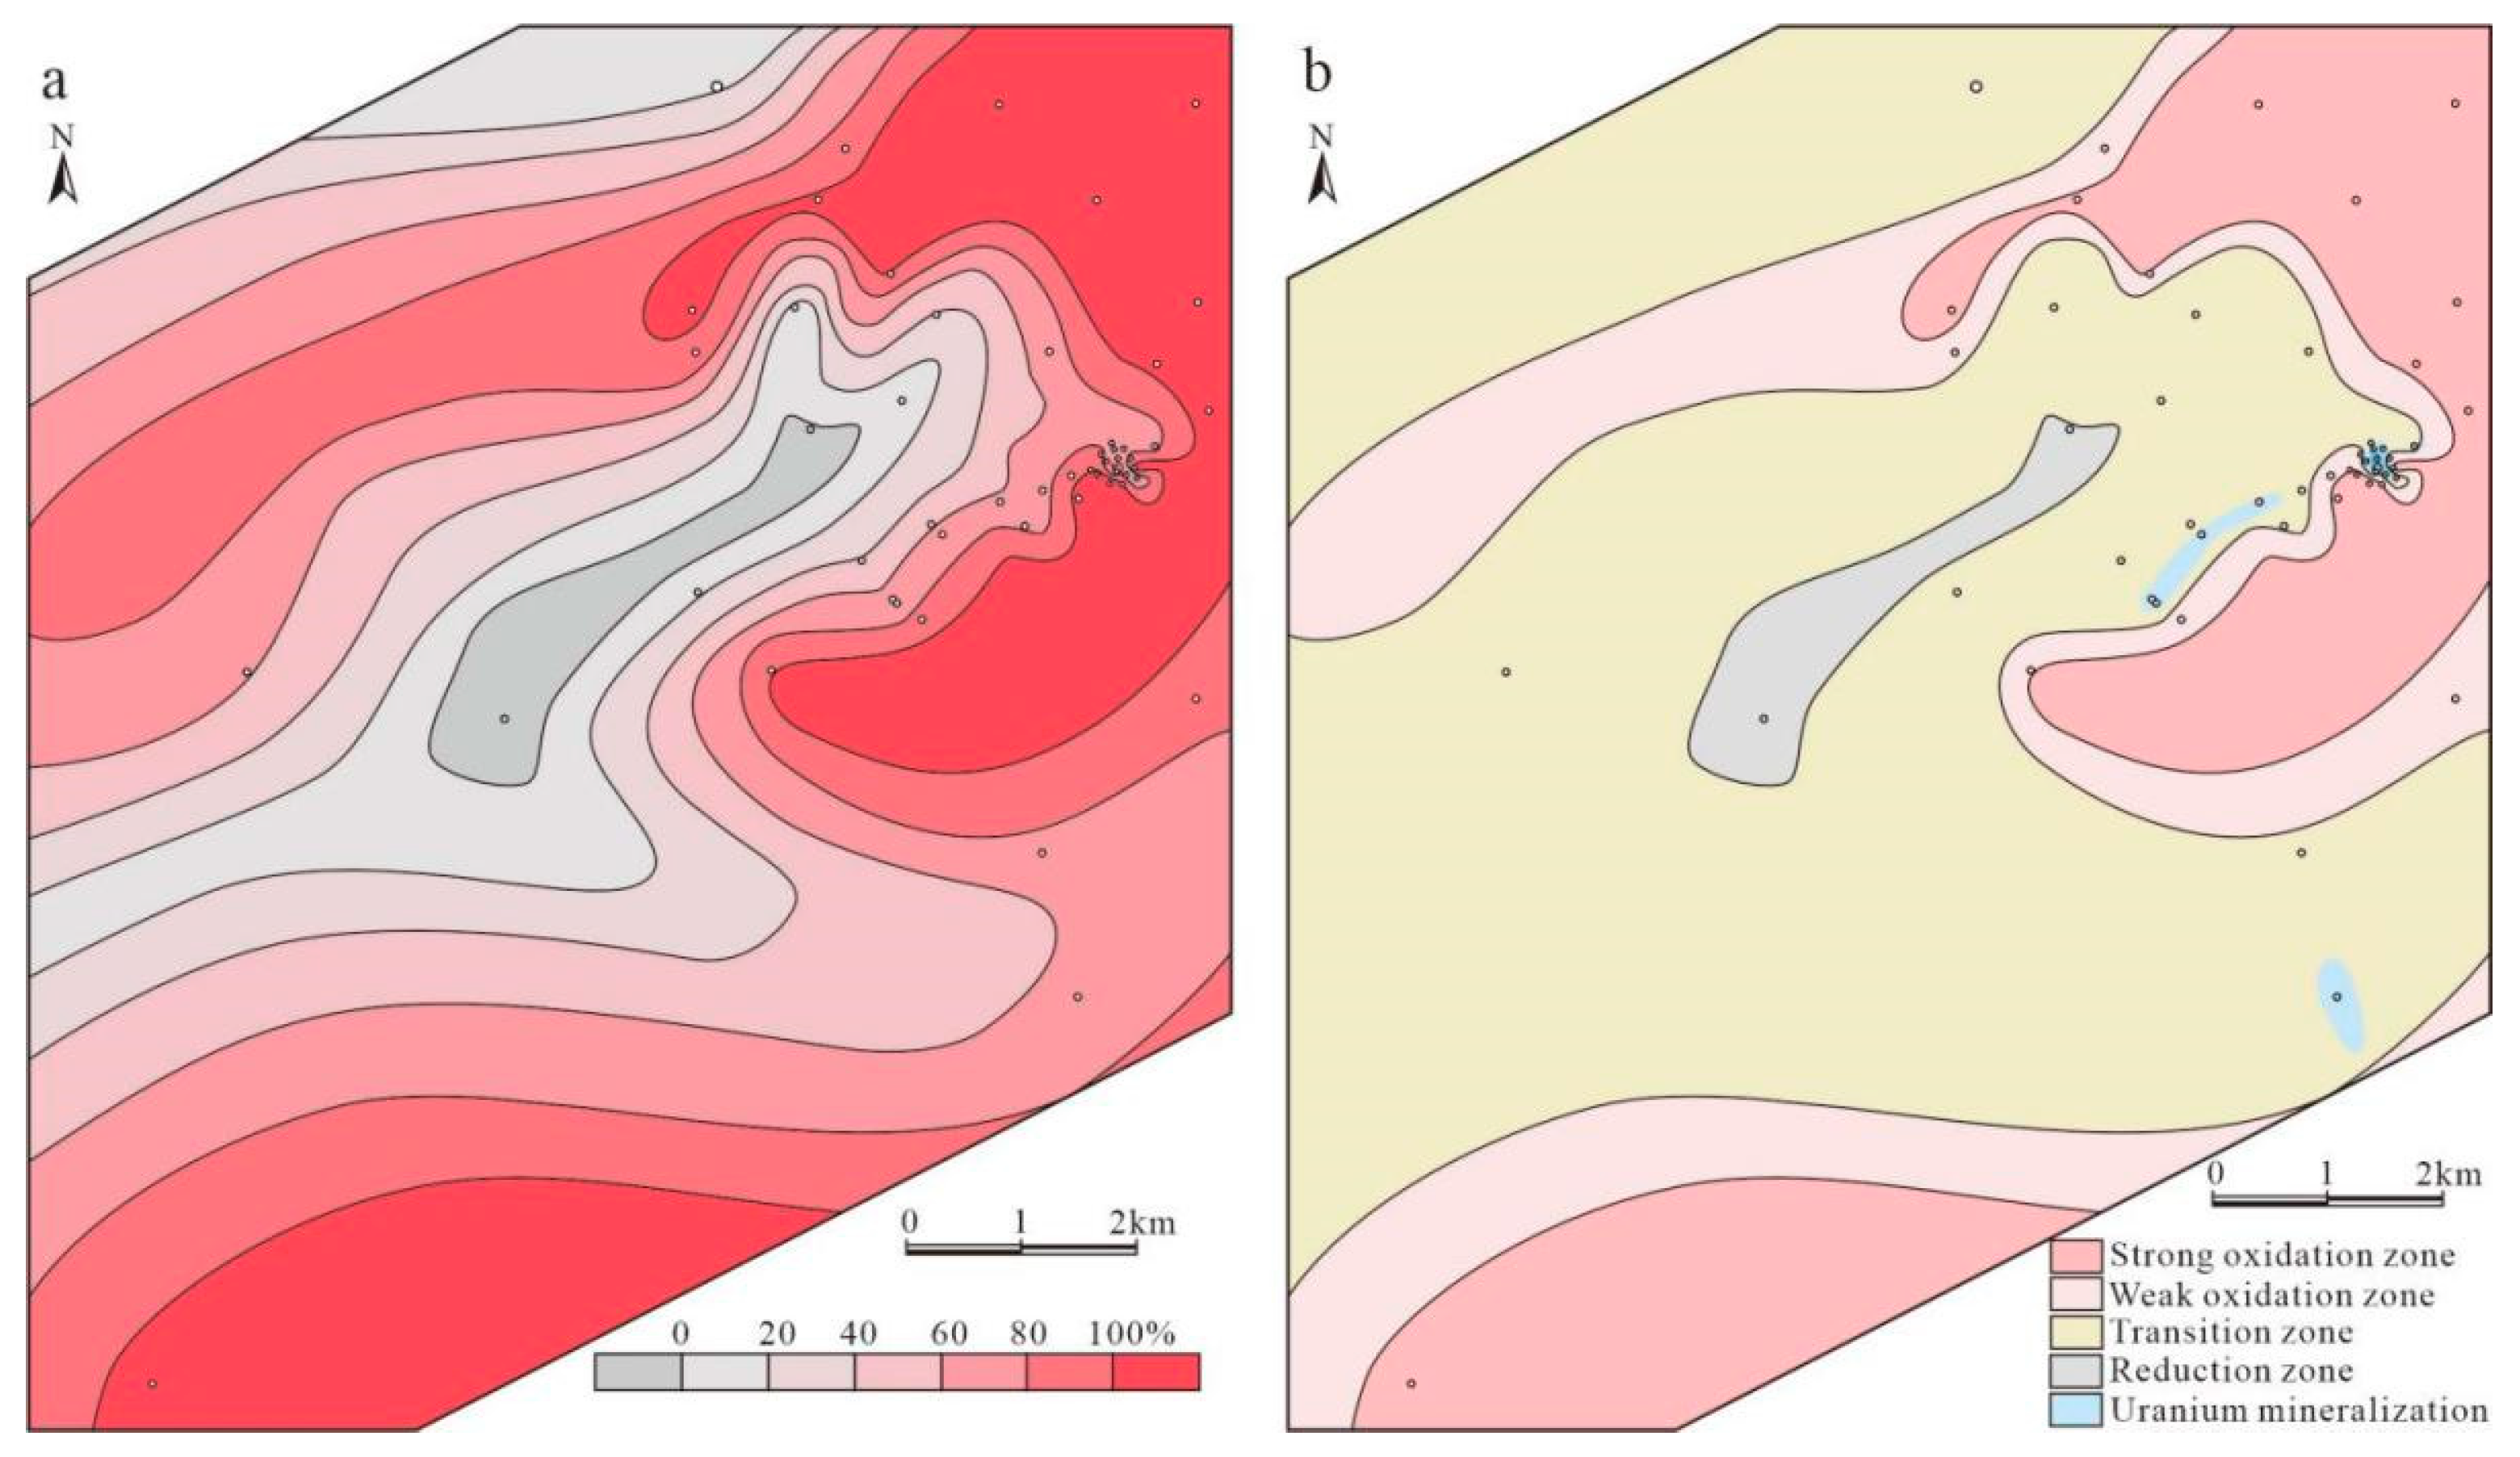
5.1.1. Distribution Pattern of Interlayer Oxidation Zone
5.1.2. Evolution of Interlayer Oxidation Zones
5.2. Controlling Factors of Interlayer Oxidation
5.2.1. Influence of Reservoir Architecture and Geometry
5.2.2. Sedimentary Facies Control
5.3. Relationship Between Interlayer Oxidation and Uranium Mineralization
6. Conclusions
- (1)
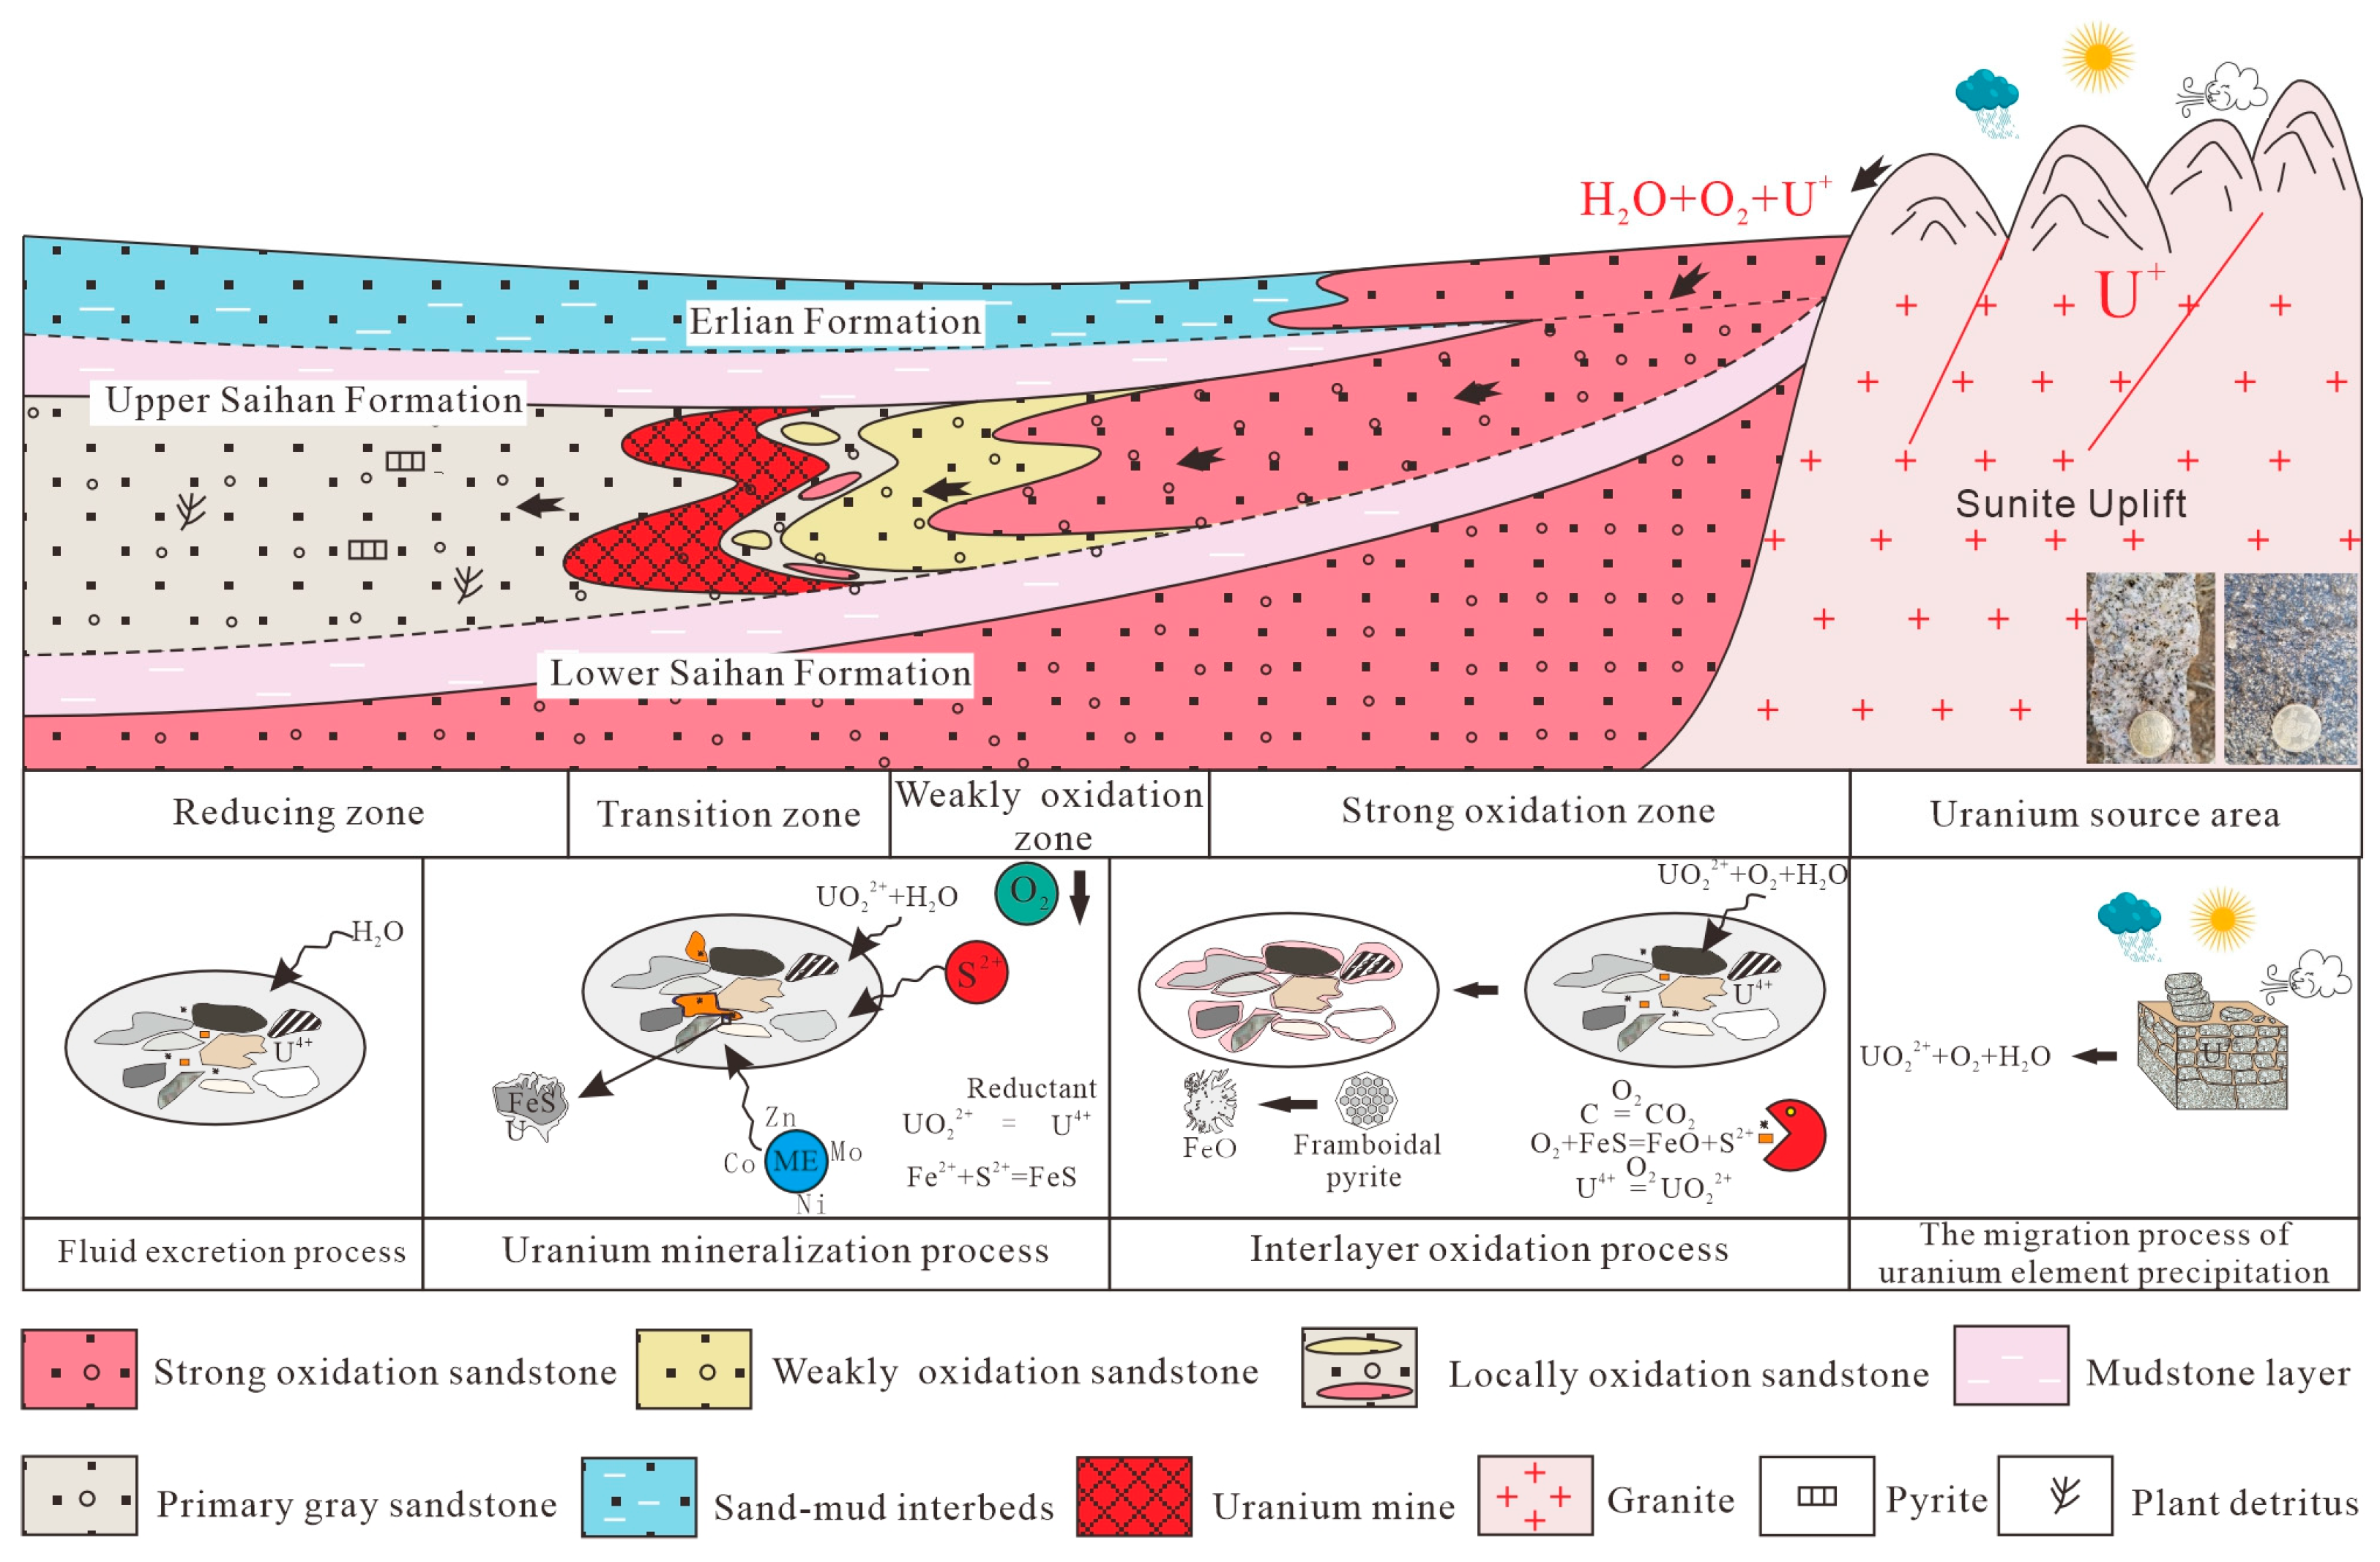
- The sandbodies comprise red sandstone (strong oxidation), yellow sandstone (weak oxidation), gray mineralized sandstone (transition zone), and primary gray sandstone (reduction zone). While clastic mineral content shows minimal variation across zones, feldspar dissolution is prevalent in oxidized regions. Environmentally sensitive parameters increase progressively from strong oxidation to transition zones, with Co, Ni, Zn, and Mo enrichment in mineralized areas.
- (2)
- Interlayer oxidation development is controlled by reservoir heterogeneity and sedimentary environments. Oxidation subzones occur in sandbodies with moderate thickness (40–80 m), sand-to-mud ratios (40%–80%), and 2–10 mudstone barriers (~20 m thick), predominantly in braided channels and channel margins. Reduction zones form in thicker sandbodies (~100 m) with higher sand contents (~80%) and fewer barriers (2–8 layers, 40–80 m thick), mainly in channel margins. Transition zones dominate braided distributary channels and floodplains.
- (3)
- Uranium mineralization involves redox-driven fluid–rock interactions: Oxygenated fluids oxidize Fe2+ → Fe3+, S2− → SO42−, and U(IV) → U(VI) (uranyl migration). Oxygen depletion triggers Fe3+ → Fe2+ reduction, forming pyrite with S2−, while uranyl complexes reduce to pitchblende. Partial U4+ reacts with SiO44− to form coffinite, accompanied by transition metal enrichment.
Author Contributions
Funding
Data Availability Statement
Acknowledgments
Conflicts of Interest
References
- Galloway, W.E. Uranium Mineralization in a Coastal Plain Fluvial Aquifer System; Catahoula Formation, Texas. Econ. Geol. 1978, 73, 1655–1676. [Google Scholar] [CrossRef]
- Cai, Y.L.; Ouyang, F.; Luo, X.R.; Zhang, Z.L.; Wen, M.L.; Luo, X.N.; Tang, R. Geochemical Characteristics and Constraints on Provenance, Tectonic Setting, and Paleoweathering of Middle Jurassic Zhiluo Formation Sandstones in the Northwest Ordos Basin, North-Central China. Minerals 2022, 12, 603. [Google Scholar] [CrossRef]
- Cheng, Y.H.; Wang, S.Y.; Zhang, T.F.; Teng, X.M.; Ao, C.; Jin, R.S.; Li, H.L. Regional sandstone-hosteduranogenic mineralization processes rooted in Oligo-Miocene tectonic inversion in the Songliao Basin, NE China. Gondwana Res. 2020, 88, 88–105. [Google Scholar] [CrossRef]
- Cheng, Y.H.; Jin, R.S.; Miao, P.S.; Wang, S.Y.; Teng, X.M. Two Metallogenic Models of Sedimentary-Hosted Uranium Deposit: Jingchuan and Tale Types. Earth Sci. 2025, 50, 46–57, (In Chinese with English Abstract). [Google Scholar]
- Wang, S.Y.; Cheng, Y.H.; Xu, D.H.; Miao, P.S.; Jin, R.S.; Zhang, T.F.; Xu, Z.L.; Cheng, X.Y.; Zhao, L.; Li, C.; et al. Late Cretaceous-Cenozoic tectonic sedimentary evolution and U-enrichment in the southern Songliao Basin. Ore Geol. Rev. 2020, 126, 103786. [Google Scholar] [CrossRef]
- Wang, S.Y.; Cheng, Y.H.; Jin, R.S.; Miao, P.S.; Zhang, T.F.; Xu, Z.L.; Ao, C.; Teng, X.M.; Cheng, X.Y. Detrital zircon U-Pb ages of the cretaceous strata in the southern Songliao Basin, NE China: Constraints on basin-and-range evolution. Sedimentary Geol. 2022, 433, 106133. [Google Scholar] [CrossRef]
- Peng, H.; Jiao, Y.Q.; Dong, F.S.; Guo, X.D. Relationships between uranium occurrence, pyrite and carbonaceous debris in Fuxin Formation in the Songliao Basin: Evidenced by mineralogy and sulfur isotopes. Ore Geol. Rev. 2022, 140, 104580. [Google Scholar] [CrossRef]
- Peng, H.; Jiao, Y.Q.; Fu, X.F.; Wu, L.Q.; Guo, X.D.; Wang, Q.S.; Liu, C. Provenance and uranium source tracing for uranium-bearing series in the south of Songliao Basin: Evidence from zircon U-Pb chronology and lithogeochemistry. J. Geochem. Explor. 2025, 272, 107703. [Google Scholar] [CrossRef]
- Feng, Z.B.; Nie, F.J.; Jiang, L.; Xia, F.; Cai, J.F.; Zhang, B.C.; Lu, Y.Y.; Zhang, L.L. Roles of Multisourced Fluids in the Formation of Sandstone-Hosted Uranium Deposits in the SW Songliao Basin, NE China. J. Earth Sci. 2023, 34, 54–69. [Google Scholar] [CrossRef]
- Huang, S.H.; Qin, M.K.; Guo, Q.; Liu, Z.Y.; Zhang, L.L. Diagenesis of Sand-Mudstone from Qingshankou Formation and Their Uranium Mineralization in DL Deposit, Southwestern Songliao Basin. Earth Sci. 2023, 48, 4441–4464, (In Chinese with English Abstract). [Google Scholar]
- Yu, H.J.; Song, H.; Wang, Z.X.; Qiao, P.; Fan, Y.Q.; Xu, Z.Q.; Li, M.; Du, Q.M.; Zhang, C.J. Study on Uranium Occurrence State and Uranium ore Process Mineralogy in Qiaoergu Uranium Deposit of Erlia Basin. Mineral. Petrol. 2024, 44, 30–39, (In Chinese with English Abstract). [Google Scholar]
- Sun, D.; Li, H.M.; Xia, F.; Nie, F.J.; Huang, G.W.; Zhang, Z.B.; Meng, F.M.; Pan, J.Y.; Hu, Y.J. Provenance and Tectonic Setting of the Lower Cretaceous Huanhe Formation in the Northwestern Ordos Basin and Its Implications for Uranium Mineralization. ACS Omega 2024, 9, 3324–3341. [Google Scholar] [CrossRef] [PubMed]
- Zhang, Y.C.; Rong, H.; Jiao, Y.Q.; Cao, M.Q.; Li, Q.C.; Guo, L.L.; Guo, C.Q.; Zhou, M.W. Occurrence State of Fe-Ti Oxides and Its Response to Uranium Mineralization Process in Interlayer Oxidation Zone of Qianjiadian Uranium Deposit. Earth Sci. 2024, 49, 2024–2043, (In Chinese with English Abstract). [Google Scholar]
- Wang, Q.S.; Peng, H.; Liu, C.; Zhang, Z.Y.; Zhou, Y.H.; Guo, X.D.; Ju, N.; Fu, Q.L.; Hao, Y. Constraints of reducing media on uranium mineralization in the uranium-bearing rock systems of the southern Songliao basin. Ore Geol. Rev. 2025, 176, 106406. [Google Scholar] [CrossRef]
- Nie, F.J.; Li, M.G.; Yan, Z.B.; Zhang, C.Y.; Jiang, M.Z.; Feng, Z.B.; Shen, K.F. Lateral oxidation mineralisation in palaeo-channel, sandstone-type uranium deposit—A case study from Bayanwula Area, Erlian Basin, Inner Mongolia, China. AusIMM Bull. 2013, 6, 32–37. [Google Scholar]
- Reynolds, R.L.; Goldhaber, M.B. Iron Disulfide Minerals and the Genesis of Roll-Type Uranium Deposits. Econ. Geol. 1983, 78, 105–120. [Google Scholar] [CrossRef]
- Suh, C.E.; Dada, S.S.; Ajayi, T.R.; Matheis, G. Integrated Structural and Mineral Alteration Study of the Zona Uranium Anomaly, Northeast Nigeria. J. Afr. Earth Sci. 1998, 27, 129–140. [Google Scholar] [CrossRef]
- Zammit, C.M.; Brugger, J.; Southam, G.; Reith, F. In Situ Recovery of Uranium-The Microbial Influence. Hydrometallurgy 2014, 150, 236–244. [Google Scholar] [CrossRef]
- Hall, S.M.; Mihalasky, M.J.; Tureck, K.R.; Hammarstrom, J.M.; Hannon, M.T. Genetic and Grade and Tonnage Models for SandstoneHosted Roll-Type Uranium Deposits, Texas Coastal Plain, USA. Ore Geol. Rev. 2017, 80, 716–753. [Google Scholar] [CrossRef]
- Christophe, B.; Michel, C.; Sylvain, B.; Etienne, D.; Marc, P.; Liu, X.D.; Peng, Y.B.; Yang, J.X. Primary uranium sources for sedimentary-hosted uranium deposits in NE China: Insight from basement igneous rocks of the Erlian Basin. Miner. Depos. 2017, 52, 297–315. [Google Scholar]
- Li, Q.; Wu, B.L.; Luo, J.J.; Yang, S.L.; Wang, M.; Liu, M.Y.; Lin, Z.Y.; Zhang, X.R.; Zhang, L.; Wang, J.; et al. Characters and Metallogenetic Significance of Organic Matter in Coal from the Daying Sandstone-Hosted Uranium Deposit in the Northern Ordos Basin, China. Minerals 2023, 13, 1002. [Google Scholar] [CrossRef]
- Tian, M.M.; Li, Z.Y.; Zhang, Y.L.; Jia, L.C.; Ning, J.; Li, J.M.; He, H.H.; Tang, G.L. Genetic mechanism of tabular-shaped orebody of the hailijin sandstone-type uranium deposit in the songliao basin: Constraints on the clay mineralogy of ore-bearing sandstone. Minerals 2023, 13, 1324. [Google Scholar] [CrossRef]
- Hobday, D.K.; Galloway, W.E. Groundwater Processes and Sedimentary Uranium Deposits. Hydrogeol. J. 1999, 7, 127–138. [Google Scholar] [CrossRef]
- Qiao, H.M.; Xu, G.Z.; Zhang, F.X.; Shang, G.F.; Song, Z.; Liu, Z.G. Study on Iron Geochemical Behavior in the Interlayer Oxidation Zone Sandstone-type Uranium Metallogenetic Process: A case from Shihongtan uranium deposit in the Turpan-Hami Basin of Xinjiang. Acta Sedimentol. Sin. 2013, 31, 461–467, (In Chinese with English Abstract). [Google Scholar]
- Jiao, Y.Q.; Wu, L.Q.; Rong, H. Model of Inner and Outer Reductive Media within Uranium Reservoir Sandstone of Sandstone-Type Uranium Deposits and Its Ore Controlling Mechanism: Case Studies in Daying and Qianjiadian Uranium Deposits. Earth Sci. 2018, 43, 459–474, (In Chinese with English Abstract). [Google Scholar]
- Yang, S.L. Geochemical characteristics of interlayer oxidation zone in Qianjiadian sandstone-type uranium deposits, Songliao Basin. J. Palaeogeogr. Chin. Ed. 2020, 22, 321–332, (In Chinese with English Abstract). [Google Scholar]
- Cao, M.Q.; Rong, H.; Chen, Z.Y.; Jiao, Y.Q.; Li, H.L.; Wang, Y.; Li, Q.C. Quantitative Characterization and Controlling Factors of the Interlayer Oxidation Zone of Qianjiadian Uranium Deposit, Songliao Basin. Earth Sci. 2021, 46, 3453–3466, (In Chinese with English Abstract). [Google Scholar]
- Hu, X.W.; Yang, X.Y.; Ren, Y.S.; Du, G.F.; Wu, Z.J. Genesis of interlayer oxidation zone-type uranium deposit in the channel conglomerates, Beisantai area, Junggar Basin: An insight into uranium mineralization. Ore Geol. Rev. 2022, 140, 557–573. [Google Scholar] [CrossRef]
- Dou, L.R.; Chang, L. Fault linkage patterns and their control on the formation of the petroleum systems of the Erlian Basin, Eastern China. Mar. Pet. Geol. 2003, 20, 1213–1224. [Google Scholar] [CrossRef]
- Guo, Z.X.; Zhao, X.Z.; Yang, Y.T.; Zhang, R.F.; Han, C.Y.; Shi, Y.P.; Jiang, S.Q.; Tao, M.H. Jurassic-earliest Cretaceous tectonostratigraphic evolution of the Erlian Basin, Northeast China: Records of polyphase intracontinental deformation in Northeast Asia. Mar. Pet. Geol. 2018, 96, 405–428. [Google Scholar] [CrossRef]
- Cheng, Y.H.; Wang, S.Y.; Jin, R.S.; Li, J.G.; Ao, C.; Teng, X.M. Global Miocene tectonics andregional sandstone-style uranogenic mineralization processes. Ore Geol. Rev. 2019, 106, 238–250. [Google Scholar] [CrossRef]
- Jiang, Z.; Han, X.Z.; Hu, H.; Lai, Q.; Guo, P.; Li, Z.N. Geochemical characteristics of thorium and their sedimentary environment indication of Engeriyin uranium deposit in Sunid Left Banner, Inner Mongolia. Geol. Bull. China 2024, 43, 926–937, (In Chinese with English Abstract). [Google Scholar]
- Fu, S.; Liu, Z.; Zhang, Y.M.; Wang, X.; Tian, N.; Yao, N.; Xiong, Y.; Chen, P.; Li, L.; Wang, H.L. Depositional systems and sequence stratigraphy of mesozoic lacustrine rift basins in NE China: A case study of the Wulan-Hua sag in the southern Erlian Basin. J. Asian Earth Sci. 2019, 174, 68–98. [Google Scholar] [CrossRef]
- Xu, Y.X.; Lv, Y.H.; Kang, S.H.; Miao, A.S. The Characteristics of Oxidation Zone and Its Relation to Uranium Mineralization in the Lower Member of Saihan Formation in the North Western Margin of Wulanchabu Depression. Uranium Geol. 2022, 38, 447–459, (In Chinese with English Abstract). [Google Scholar]
- Nie, F.J.; Yan, Z.B.; Feng, Z.B.; Li, M.G.; Xia, F.; Zhang, C.Y.; Wang, Y.G.; Yang, J.X.; Kang, S.H.; Shen, K.F. Genetic models and exploration implication of the paleochannel sandstone-type uranium deposits in the Erlian Basin, North China—A review and comparative study. Ore Geol. Rev. 2020, 127, 103821. [Google Scholar] [CrossRef]
- Qin, Y.W. Characteristics of Paleo-Valley Oxidation Zone and Uranium Mineralization of Lower Cretaceous Saihan Formation in Basaiqi Area, Erlian Basin; Jilin University: Changchun, China, 2022; pp. 17–57, (In Chinese with English Abstract). [Google Scholar]
- Lazaro, H.M.; Mohamed, S.M.; John, W.K.; Iyabo, T.U.; Titus, A.M.; Farai, F.M.; Innocent, J.L.; Mwingereza, J.K. The isotopic and elemental patterns of uranium ore as tools for its provenance determination: A systematic review. Sci. Justice 2025, 65, 101252. [Google Scholar]
- Tang, C.; Xu, Z.L.; Duan, M.; Meng, L.S.; Liu, H.J.; Wei, J.L.; Zhang, C.; Zhao, L.J. Genetic Model of the Luhai Sandstone-Type Uranium Deposit in the Erlian Basin, Inner Mongolia. Minerals 2025, 15, 294. [Google Scholar] [CrossRef]
- Fu, S.; Liu, Z.; Song, L.J.; Ge, J.W.; Tian, N.; Yin, K.W.; Wang, X. A new division of late Cretaceous Erlian Basin tectonic units based on differential basement characteristics. Geoenergy Sci. Eng. 2025, 245, 21353. [Google Scholar] [CrossRef]
- Yu, R.A.; Li, T.; Yang, T.X.; Zhao, H.L.; Tu, J.R.; Hu, Y.X.; Tang, Y.X. Provenance and Tectonic Evolution of the Middle and Lower Jurassic Strata Constraints on the Uranium Mineralization in Southwest Margin of Ordos Basin. Earth Sci. 2024, 49, 1793–1809. [Google Scholar]
- Christophe, B.; Fabrice, M.; Vincent, H.; Michel, C.; Sylvain, B.; Liu, X.D.; Peng, Y.B. Sedimentology, stratigraphy and palynological occurrences of the late Cretaceous Erlian Formation, Erlian Basin, Inner Mongolia, People’s Republic of China. Cretac. Res. 2014, 48, 177–192. [Google Scholar]
- Christophe, B.; Michel, C.; Fabrice, M.; Raymond, M.; Liu, X.D.; Peng, Y.B. The Nuheting deposit, Erlian Basin, NE China: Synsedimentary to diagenetic uranium mineralization. Ore Geol. Rev. 2015, 69, 118–139. [Google Scholar]
- Liang, H.B.; Wu, C.L.; Li, L.B.; Mao, X.P.; Bai, S.P. Unifying Division of Sequence Stratigraphy Unit and Framework Sequence Stratigraphy of Erlian Basin. Earth Sci. 2010, 35, 97–106, (In Chinese with English Abstract). [Google Scholar]
- Qi, J.F.; Zhao, X.Z.; Li, X.P.; Yang, M.H.; Xiao, Y.; Yu, F.S.; Dong, Y.Q. The distribution of Early Cretaceous faulted-sags and their relationship with basement structure with in ErlIan Basin. Earth Sci. Front. 2015, 22, 118–128, (In Chinese with English Abstract). [Google Scholar]
- Cheng, Y.H.; Jin, R.S.; Cuney, M.; Petrov, V.A.; Miao, P.S. The strata constraint on large scale sandstone-type uranium mineraliiation in Mesco-Cenozoic basins, northern China. Acta Geol. Sin. 2024, 98, 1953–1976, (In Chinese with English Abstract). [Google Scholar]
- Nie, F.J.; Li, M.G.; Yan, Z.B.; Xia, F.; Zhang, C.Y.; Yang, J.X.; Kang, S.H.; Shen, K.F. Segmentation of the target layer Saihan Formation and sandstone-type uranium mineralization in ErlianBasin. Geol. Bull. China 2015, 34, 1952–1963, (In Chinese with English Abstract). [Google Scholar]
- Lu, C.; Jiao, Y.Q.; Peng, Y.B.; Yang, J.X.; Chen, F.Z. Effect of the episodic rifting in the western manite depression in Erlian Basin on sandstone-type uranium mineralization. Acta Geol. Sin. 2016, 90, 3483–3491, (In Chinese with English Abstract). [Google Scholar]
- Wang, X.M.; Jiao, Y.Q.; Du, Y.S.; Ling, W.L.; Wu, L.Q.; Cui, T.; Zhou, Q. REE mobility and Ce anomaly in bauxite deposit of WZD Area, Northern Guizhou, China. J. Geochem. Explor. 2013, 133, 103–117. [Google Scholar] [CrossRef]
- Blatt, H.; Middleton, G.; Murray, R. Origin of Sedimentary Rocks, 2nd ed.; Prentice-Hall: Hoboken, NJ, USA, 1980; pp. 18–266. [Google Scholar]
- Nesbitt, H.W.; Young, G.M. Prediction of some weathering trends of plutonic and volcanic rocks based on the Thermodynamic and Kinetic considerations. Geochim. Cosmochim. Acta 1984, 48, 1523–1534. [Google Scholar] [CrossRef]
- Pettijohn, F.J.; Potter, P.E.; Siever, R. Sand and Sandstone, 2nd ed.; Springer: New York, NY, USA, 1987; pp. 24–63. [Google Scholar]
- Herron, M.M. Geochemical classification of terrigenous sands and shales from core or log data. J. Sediment. Petrol. 1988, 58, 820–829. [Google Scholar]
- Rollinson, H.R. Using Geochemical Data: Evaluation, Presentation, Interpretation; Longman Scientific Technical Press: London, UK, 1993; pp. 1–213. [Google Scholar]
- Pei, X.Z.; Gu, N.; Liu, C.J.; Li, R.B.; Li, Z.C.; Chen, Y.X.; Pei, L.; Liu, Z.Q.; Chen, G.C.; Yang, J. Detrital composition, gechemical characteristics and provenance analysis for the Maerzheng Formation sandstone in Gerizhuotuo Area, Southern Margin of East Kunlun region. Geol. Rev. 2015, 61, 307–323. [Google Scholar]
- Zhang, P.F.; Wang, J.J.; Lu, S.F.; Wu, H.; Liu, C.; Gao, W.Z.; Li, W.B.; Zhou, N.W.; Chen, G.H.; Wu, C.X.; et al. Geochemical characteristics and paleo-environment of Lower Cretaceous lacustrine shale in the A’nan Sag, Erlian Basin, Northern China. Mar. Pet. Geol. 2025, 178, 107420. [Google Scholar] [CrossRef]
- Taylor, S.R.; McLennan, S.M. The continental crust: Its composition and evolution. J. Geol. 1985, 94, 57–72. [Google Scholar]
- Qiu, L.F.; Li, X.D.; Liu, W.S.; Hu, B.Q.; Gao, L.; He, Z.B. Uranium Deposits of Erlian Basin (China): Role of Carbonaceous Debris Organic Matter and Hydrocarbon Fluids on Uranium Mineralization. Minerals 2021, 11, 532. [Google Scholar] [CrossRef]
- Yang, D.Y. Development characteristics of interlayer oxidation zone type of sandstone uranium deposits in the southwestern Turfan-Hami basin. Sci. China Ser. 2004, 47, 419. [Google Scholar] [CrossRef]
- McLennan, S.M.; Taylor, S.R. Rare earth element mobility associated with uranium mineralization. Nature 1979, 282, 247–250. [Google Scholar] [CrossRef]
- Yu, W.H. An Experimental Study on the Mechanism Controlling Trace Metal Distribution in Surface Water During Water/Colloid Interactions; Graduate School of the Chinese Academy of Sciences: Beijing, China, 2005; pp. 39–113, (In Chinese with English Abstract). [Google Scholar]
- Zhang, L.; Hu, F.F.; Wu, Z.Q.; Wang, X.K.; Liu, K.P.; Mao, N. Geochemical characteristics and water rock interaction of the ancient interlayer oxidation zone of the Zhiluo Formation in the Xunyi-Yijun area, southern Ordos Basin. Geol. Explor. 2023, 59, 1250–1259, (In Chinese with English Abstract). [Google Scholar]
- Liu, W.H.; Guo, C.Q.; Rong, H.; Liu, Y.; Wang, Q.W.; Chang, K.Y. Relationship between architecture of uranium reservoirs and mineralization: A case study from the northern Songliao Basin, China. Geoenergy Sci. Eng. 2025, 253, 214006. [Google Scholar] [CrossRef]
- Zhang, F.; Jiao, Y.Q.; Wu, L.Q.; Rong, H.; Wang, J.Y.; Zhang, C.C. Geochemical characteristics of uranium-rich dispersed organic matter and their geological significance for uranium mineralization: A case study from the Ordos Basin. J. Geochem. Explor. 2024, 264, 107528. [Google Scholar] [CrossRef]
- Nie, F.J.; Xia, F.; Yan, Z.B. Study on Uranium Loss of Weijing Granite and Sandstone-type Uranium Mineralization in Erlian Basin. Acta Geosci. Sin. 2022, 43, 626–632, (In Chinese with English Abstract). [Google Scholar]
- Lehmann, B. Uranium Ore Deposits. Econ. Geol. 2008, 2, 16–26. [Google Scholar]
- Gong, X.Z.; Wang, T. Understanding and thinking about sandstone-type uranium sedimentary system. Geosci. Remote Sens. 2024, 7, 53–63. [Google Scholar]
- Zhao, K.; Zhou, Y.P.; Chen, K.Y.; Bao, Z.A.; Zhang, Y.; An, F.; Wu, B.L.; Li, G.R.; Yuan, H.L. Compositions of in-situ trace elements, S and Pb isotopes of pyrite in Mengqiguer deposit, Yili basin, NW China: Implications for uranium mineralization processes of sandstone-type uranium deposit. Ore Geol. Rev. 2025, 179, 106503. [Google Scholar] [CrossRef]


| Sample Number | Lithology | Depth (m) | U (10−6) | Th (10−6) | Th/U | TOC (%) | Fe2+ (%) | Fe3+ (%) | Fe2+/Fe3+ | S2− (10−6) | Stotal (%) |
|---|---|---|---|---|---|---|---|---|---|---|---|
| 3-1-U3 | Gray middle sandstone | 713.34 | 10.70 | 3.22 | 0.30 | 0.24 | 0.22 | 0.39 | 0.56 | 7.62 | 0.06 |
| 3-1-U8 | Gray coarse sandstone | 714.64 | 19.20 | 6.34 | 0.33 | 0.16 | 0.25 | 0.38 | 0.66 | 11.90 | 0.07 |
| 3-U11 | Gray glutenite | 763.47 | 37.80 | 8.75 | 0.23 | 0.04 | 0.24 | 1.63 | 0.15 | 35.10 | 0.25 |
| 1-4-U1 | Gray coarse sandstone | 612.80 | 15.10 | 6.01 | 0.40 | 0.08 | 0.14 | 0.78 | 0.18 | 2.58 | 0.03 |
| 1-4-U3 | Gray coarse sandstone | 613.40 | 8.42 | 6.20 | 0.74 | 0.02 | 0.13 | 0.34 | 0.38 | 2.74 | 0.02 |
| 1-4-U7 | Gray coarse sandstone | 615.05 | 34.70 | 6.41 | 0.18 | 0.09 | 0.15 | 0.27 | 0.56 | 21.00 | 0.08 |
| 1-4-U13 | Gray coarse sandstone | 619.03 | 38.60 | 5.21 | 0.13 | 0.13 | 0.13 | 0.61 | 0.21 | 4.35 | 0.04 |
| 1-20-U10 | Gray coarse sandstone | 611.30 | 28.80 | 5.99 | 0.21 | 0.02 | 0.14 | 0.24 | 0.60 | 4.11 | 0.02 |
| 1-15-U2 | Gray fine sandstone | 651.50 | 47.80 | 4.43 | 0.09 | 0.63 | 1.56 | 1.69 | 0.92 | 12.20 | 0.20 |
| 1-15-U4 | Gray fine sandstone | 652.35 | 45.40 | 9.65 | 0.21 | 0.52 | 2.07 | 1.31 | 1.58 | 13.10 | 0.20 |
| 3-1-U10 | Red coarse sandstone | 715.24 | 19.60 | 8.73 | 0.45 | 0.17 | 0.23 | 2.02 | 0.11 | 1.20 | 0.04 |
| 3-3-H2 | Red coarse sandstone | 686.85 | 1.24 | 6.20 | 5.00 | 0.05 | 0.06 | 0.28 | 0.21 | 5.00 | 0.01 |
| 1-2-H1 | Red coarse sandstone | 596.45 | 2.00 | 8.77 | 4.39 | 0.01 | 0.40 | 0.80 | 0.50 | 4.52 | 0.01 |
| 1-13-H4 | Red coarse sandstone | 620.25 | 2.00 | 5.54 | 2.77 | 0.02 | 0.12 | 1.66 | 0.07 | 3.00 | 0.05 |
| 1-20-H6 | Red coarse sandstone | 624.95 | 5.29 | 7.47 | 1.41 | 0.08 | 0.19 | 0.80 | 0.24 | 3.40 | 0.01 |
| 2-U5 | Red fine sandstone | 329.12 | 4.30 | 11.20 | 2.60 | 0.05 | 0.02 | 3.48 | 0.01 | 0.77 | 0.02 |
| 1-H1 | Red fine sandstone | 552.21 | 3.03 | 6.01 | 1.98 | 0.01 | 0.10 | 0.58 | 0.17 | 4.57 | 0.01 |
| 1-9-H3 | Red coarse sandstone | 615.55 | 1.00 | 3.02 | 3.02 | 0.03 | 0.08 | 2.30 | 0.03 | 4.68 | 0.01 |
| 1-11-H2 | Red coarse sandstone | 639.45 | 2.95 | 4.74 | 1.61 | 0.10 | 0.11 | 0.27 | 0.40 | 4.36 | 0.01 |
| 1-12-H2 | Red coarse sandstone | 635.25 | 6.36 | 6.12 | 0.96 | 0.07 | 0.13 | 0.49 | 0.27 | 3.20 | 0.01 |
| 3-1-U1 | Yellow coarse sandstone | 712.39 | 2.04 | 4.15 | 2.03 | 0.21 | 0.24 | 0.77 | 0.31 | 6.04 | 0.07 |
| 3-H2 | Yellow coarse sandstone | 654.15 | 1.24 | 4.20 | 3.39 | 0.01 | 0.12 | 1.73 | 0.07 | 0.86 | 0.02 |
| 4-H3 | Yellow coarse sandstone | 588.34 | 4.12 | 4.87 | 1.18 | 0.06 | 0.45 | 2.51 | 0.18 | 5.41 | 0.04 |
| 1-4-H3 | Yellow fine sandstone | 609.95 | 3.58 | 6.23 | 1.74 | 0.20 | 0.17 | 1.18 | 0.14 | 1.94 | 0.02 |
| 1-4-H6 | Yellow coarse sandstone | 623.95 | 1.34 | 1.59 | 1.19 | 0.15 | 0.16 | 2.52 | 0.06 | 2.90 | 0.01 |
| 1-20-H5 | Yellow coarse sandstone | 599.15 | 3.22 | 4.56 | 1.42 | 0.20 | 0.10 | 1.22 | 0.08 | 1.94 | 0.01 |
| 1-1-U12 | Yellow coarse sandstone | 617.45 | 4.54 | 4.22 | 0.93 | 0.09 | 0.22 | 2.86 | 0.08 | 5.72 | 0.05 |
| 3-2-H8 | Yellow coarse sandstone | 754.95 | 7.54 | 6.77 | 0.90 | 0.13 | 0.11 | 0.51 | 0.22 | 4.84 | 0.03 |
| 1-2-U2 | Yellow fine sandstone | 606.80 | 12.90 | 5.75 | 0.45 | 0.11 | 0.12 | 0.52 | 0.23 | 4.68 | 0.01 |
| 1-9-H4 | Yellow coarse sandstone | 625.05 | 3.79 | 4.57 | 1.21 | 0.11 | 0.28 | 0.35 | 0.80 | 5.08 | 0.01 |
| 1-2-U6 | Uranium ore body | 609.05 | 397.00 | 4.21 | 0.01 | 0.13 | 0.54 | 0.27 | 2.00 | 24.60 | 0.16 |
| 1-2-U11 | Uranium ore body | 612.95 | 3210.00 | 7.12 | 0.00 | 1.92 | 0.56 | 2.05 | 0.27 | 101.00 | 2.42 |
| 1-2-U18 | Uranium ore body | 624.15 | 369.00 | 14.53 | 0.04 | 0.33 | 0.34 | 1.12 | 0.30 | 18.70 | 0.12 |
| 1-4-U14 | Uranium ore body | 633.30 | 952.00 | 7.48 | 0.01 | 0.17 | 0.32 | 0.47 | 0.68 | 7.42 | 0.05 |
| 1-13-U5 | Uranium ore body | 601.30 | 1380.00 | 6.00 | 0.00 | 0.15 | 0.12 | 0.22 | 0.54 | 14.20 | 0.17 |
| 1-13-U8 | Uranium ore body | 603.15 | 167.00 | 7.75 | 0.05 | 0.13 | 0.58 | 1.41 | 0.41 | 115.00 | 3.73 |
| 1-13-U15 | Uranium ore body | 607.50 | 758.00 | 7.86 | 0.01 | 0.23 | 0.20 | 0.44 | 0.45 | 28.00 | 0.16 |
| 1-20-U2 | Uranium ore body | 606.70 | 312.00 | 6.82 | 0.02 | 0.12 | 0.16 | 0.34 | 0.47 | 27.20 | 0.14 |
| 1-20-U4 | Uranium ore body | 607.55 | 173.00 | 8.94 | 0.05 | 0.31 | 0.16 | 0.30 | 0.53 | 27.70 | 0.16 |
| 1-20-U6 | Uranium ore body | 609.05 | 234.00 | 5.54 | 0.02 | 0.27 | 0.52 | 0.28 | 1.88 | 19.70 | 0.09 |
| Sample Number | Lithology | Depth (m) | SiO2 | TiO2 | Al2O3 | Fe2O3T | MnO | MgO | CaO | Na2O | K2O | P2O5 | SO3 | FeO | Fe2O3 | Loss |
|---|---|---|---|---|---|---|---|---|---|---|---|---|---|---|---|---|
| 3-1-U3 | Gray middle sandstone | 713.34 | 77.33 | 0.18 | 10.03 | 1.01 | 0.09 | 0.61 | 1.05 | 1.66 | 2.99 | 0.02 | 0.13 | 0.28 | 0.70 | 4.42 |
| 3-1-U8 | Gray coarse sandstone | 714.64 | 76.38 | 0.19 | 10.45 | 1.05 | 0.08 | 0.59 | 1.06 | 1.82 | 3.23 | 0.02 | 0.14 | 0.32 | 0.69 | 4.88 |
| 3-U11 | Gray glutenite | 763.47 | 78.89 | 0.19 | 9.22 | 2.55 | 0.03 | 0.40 | 0.95 | 1.56 | 2.60 | 0.15 | 0.50 | 0.31 | 2.21 | 2.38 |
| 1-4-U1 | Gray coarse sandstone | 612.80 | 81.91 | 0.14 | 9.05 | 1.31 | 0.01 | 0.36 | 0.50 | 1.34 | 3.00 | 0.05 | 0.23 | 0.18 | 1.11 | 2.53 |
| 1-4-U3 | Gray coarse sandstone | 613.40 | 78.70 | 0.20 | 11.83 | 0.72 | 0.01 | 0.30 | 0.40 | 1.88 | 3.53 | 0.05 | 0.16 | 0.17 | 0.53 | 2.66 |
| 1-4-U7 | Gray coarse sandstone | 615.05 | 82.78 | 0.21 | 8.97 | 0.65 | 0.01 | 0.35 | 0.42 | 1.46 | 3.07 | 0.05 | 0.54 | 0.19 | 0.44 | 1.99 |
| 1-4-U13 | Gray coarse sandstone | 619.03 | 82.98 | 0.13 | 8.49 | 1.08 | 0.02 | 0.30 | 0.76 | 1.22 | 2.60 | 0.05 | 0.28 | 0.17 | 0.89 | 2.54 |
| 1-20-U10 | Gray coarse sandstone | 611.30 | 80.37 | 0.20 | 10.29 | 0.64 | 0.02 | 0.30 | 0.57 | 1.76 | 3.32 | 0.04 | 0.15 | 0.18 | 0.44 | 2.73 |
| 1-15-U2 | Gray fine sandstone | 651.50 | 68.46 | 0.14 | 8.84 | 8.58 | 1.32 | 0.31 | 0.59 | 1.25 | 2.81 | 0.10 | 1.27 | 5.87 | 2.06 | 6.65 |
| 1-15-U4 | Gray fine sandstone | 652.35 | 69.43 | 0.29 | 11.05 | 4.74 | 0.63 | 0.51 | 0.47 | 1.57 | 3.88 | 0.09 | 1.29 | 2.66 | 1.78 | 5.89 |
| MEAN | 77.72 | 0.19 | 9.82 | 2.23 | 0.22 | 0.40 | 0.68 | 1.55 | 3.10 | 0.06 | 0.47 | 1.03 | 1.09 | - | ||
| 3-1-U10 | Red coarse sandstone | 715.24 | 66.18 | 0.28 | 11.40 | 3.18 | 0.03 | 0.77 | 0.88 | 2.59 | 3.03 | 0.07 | 6.32 | 0.96 | 2.11 | 5.18 |
| 3-3-H2 | Red coarse sandstone | 686.85 | 82.79 | 0.11 | 8.76 | 0.61 | 0.01 | 0.24 | 0.65 | 1.71 | 2.79 | 0.04 | 0.43 | 0.08 | 0.52 | 2.07 |
| 1-2-H1 | Red coarse sandstone | 596.45 | 78.80 | 0.12 | 9.52 | 1.34 | 0.03 | 0.61 | 0.79 | 1.76 | 3.13 | 0.06 | 0.38 | 0.14 | 1.18 | 3.45 |
| 1-13-H4 | Red coarse sandstone | 620.25 | 79.62 | 0.12 | 10.24 | 1.25 | 0.02 | 0.39 | 0.62 | 1.64 | 2.81 | 0.05 | 0.15 | 0.15 | 1.08 | 3.39 |
| 1-20-H6 | Red coarse sandstone | 624.95 | 77.35 | 0.20 | 11.57 | 1.44 | 0.02 | 0.40 | 0.67 | 1.64 | 2.85 | 0.06 | 0.15 | 0.24 | 1.17 | 3.83 |
| 2-U5 | Red fine sandstone | 329.12 | 76.73 | 0.27 | 13.38 | 1.03 | 0.02 | 0.36 | 0.67 | 1.67 | 3.20 | 0.05 | 0.15 | 0.44 | 0.54 | 3.20 |
| 1-H1 | Red fine sandstone | 552.21 | 82.01 | 0.12 | 9.07 | 0.78 | 0.01 | 0.26 | 0.57 | 1.54 | 3.22 | 0.04 | 0.01 | 0.13 | 0.64 | 1.87 |
| 1-9-H3 | Red coarse sandstone | 615.55 | 82.97 | 0.11 | 8.42 | 0.67 | 0.02 | 0.22 | 1.27 | 1.28 | 2.86 | 0.06 | 0.14 | 0.10 | 0.56 | 2.50 |
| 1-11-H2 | Red coarse sandstone | 639.45 | 81.68 | 0.10 | 8.85 | 0.62 | 0.03 | 0.25 | 1.42 | 1.46 | 3.11 | 0.04 | 0.07 | 0.14 | 0.46 | 2.75 |
| 1-12-H2 | Red coarse sandstone | 635.25 | 83.84 | 0.13 | 8.81 | 0.91 | 0.01 | 0.21 | 0.34 | 1.13 | 2.89 | 0.04 | 0.13 | 0.17 | 0.72 | 2.11 |
| MEAN | 79.20 | 0.16 | 10.00 | 1.18 | 0.02 | 0.37 | 0.79 | 1.64 | 2.99 | 0.05 | 0.79 | 0.25 | 0.90 | - | ||
| 3-1-U1 | Yellow coarse sandstone | 712.39 | 79.45 | 0.19 | 9.90 | 1.03 | 0.02 | 0.22 | 0.84 | 1.46 | 2.75 | 0.06 | 2.14 | 0.80 | 0.14 | 2.56 |
| 3-H2 | Yellow coarse sandstone | 654.15 | 77.97 | 0.24 | 9.78 | 2.67 | 0.02 | 0.54 | 0.66 | 1.61 | 2.75 | 0.09 | 0.04 | 0.15 | 2.50 | 3.14 |
| 4-H3 | Yellow coarse sandstone | 588.34 | 74.15 | 0.26 | 10.65 | 3.93 | 0.02 | 0.53 | 0.36 | 1.95 | 3.70 | 0.06 | 0.11 | 0.19 | 3.72 | 3.59 |
| 1-4-H3 | Yellow fine sandstone | 609.95 | 81.44 | 0.15 | 8.20 | 1.87 | 0.02 | 0.34 | 1.25 | 1.28 | 2.93 | 0.06 | 0.15 | 0.22 | 1.63 | 2.76 |
| 1-4-H6 | Yellow coarse sandstone | 623.95 | 80.08 | 0.14 | 8.68 | 3.66 | 0.04 | 0.27 | 0.60 | 1.31 | 2.94 | 0.06 | 0.09 | 0.21 | 3.43 | 2.48 |
| 1-20-H5 | Yellow coarse sandstone | 599.15 | 76.17 | 0.10 | 8.38 | 1.89 | 0.08 | 0.13 | 4.57 | 1.31 | 2.72 | 0.05 | 0.11 | 0.13 | 1.75 | 4.94 |
| 1-1-U12 | Yellow coarse sandstone | 617.45 | 72.79 | 0.13 | 8.86 | 4.27 | 0.08 | 0.34 | 3.12 | 1.46 | 3.05 | 0.03 | 0.08 | 0.15 | 4.10 | 5.29 |
| 3-2-H8 | Yellow coarse sandstone | 754.95 | 77.58 | 0.20 | 11.13 | 0.95 | 0.01 | 0.43 | 0.59 | 2.16 | 3.43 | 0.05 | 0.24 | 0.14 | 0.79 | 3.04 |
| 1-2-U2 | Yellow fine sandstone | 606.80 | 79.72 | 0.15 | 9.85 | 0.95 | 0.01 | 0.06 | 0.79 | 1.79 | 3.41 | 0.05 | 0.13 | 0.15 | 0.78 | 2.91 |
| 1-9-H4 | Yellow coarse sandstone | 625.05 | 84.22 | 0.13 | 8.58 | 0.96 | 0.01 | 0.19 | 0.47 | 1.43 | 2.84 | 0.05 | 0.10 | 0.36 | 0.56 | 1.58 |
| MEAN | 78.36 | 0.17 | 9.40 | 2.22 | 0.03 | 0.31 | 1.33 | 1.58 | 3.05 | 0.06 | 0.32 | 0.25 | 1.94 | - | ||
| 1-2-U6 | Uranium ore body | 609.05 | 81.84 | 0.11 | 9.05 | 0.68 | 0.02 | 0.04 | 1.08 | 1.31 | 2.87 | 0.04 | 1.01 | 0.10 | 0.57 | 2.31 |
| 1-2-U11 | Uranium ore body | 612.95 | 68.62 | 0.14 | 7.86 | 3.51 | 0.02 | 0.03 | 1.00 | 1.16 | 2.42 | 0.06 | 10.70 | 0.72 | 2.71 | 4.92 |
| 1-2-U18 | Uranium ore body | 624.15 | 69.43 | 0.70 | 14.06 | 2.03 | 0.03 | 0.13 | 0.94 | 1.81 | 2.96 | 0.10 | 0.88 | 0.44 | 1.54 | 6.54 |
| 1-4-U14 | Uranium ore body | 633.30 | 78.06 | 0.21 | 9.51 | 1.15 | 0.04 | 0.57 | 2.32 | 1.41 | 2.88 | 0.07 | 0.33 | 0.41 | 0.69 | 3.83 |
| 1-13-U5 | Uranium ore body | 601.30 | 83.00 | 0.12 | 8.01 | 0.67 | 0.02 | 0.18 | 0.46 | 1.23 | 2.55 | 0.05 | 1.29 | 0.15 | 0.50 | 1.79 |
| 1-13-U8 | Uranium ore body | 603.15 | 61.80 | 0.26 | 7.95 | 5.29 | 0.01 | 0.40 | 0.34 | 1.12 | 2.16 | 0.05 | 13.08 | 0.75 | 4.46 | 8.04 |
| 1-13-U15 | Uranium ore body | 607.50 | 80.66 | 0.23 | 9.26 | 1.08 | 0.02 | 0.21 | 0.38 | 1.76 | 2.33 | 0.06 | 1.23 | 0.26 | 0.79 | 2.66 |
| 1-20-U2 | Uranium ore body | 606.70 | 83.99 | 0.23 | 7.88 | 0.82 | 0.02 | 0.25 | 0.56 | 1.19 | 2.72 | 0.04 | 0.88 | 0.21 | 0.59 | 2.09 |
| 1-20-U4 | Uranium ore body | 607.55 | 82.36 | 0.23 | 8.93 | 0.75 | 0.01 | 0.27 | 0.43 | 1.39 | 2.98 | 0.04 | 1.01 | 0.21 | 0.52 | 2.17 |
| 1-20-U6 | Uranium ore body | 609.05 | 82.12 | 0.14 | 9.64 | 0.66 | 0.01 | 0.22 | 0.57 | 1.33 | 2.95 | 0.05 | 0.53 | 0.15 | 0.49 | 2.35 |
| MEAN | 77.19 | 0.24 | 9.22 | 1.66 | 0.02 | 0.23 | 0.81 | 1.37 | 2.68 | 0.06 | 3.09 | 0.34 | 1.29 | - | ||
| Sample Number | Lithology | Depth (m) | Rb | Ba | Sr | Zr | Hf | Y | Pb | Sc | V | Cr | Cu | Co | Ni | Zn | Mo |
|---|---|---|---|---|---|---|---|---|---|---|---|---|---|---|---|---|---|
| 3-1-U3 | Gray middle sandstone | 713.34 | 88.50 | 564.20 | 138.20 | 47.10 | 1.46 | 10.96 | 17.00 | 2.72 | 48.80 | 9.65 | 4.26 | 3.18 | 7.06 | 20.00 | 0.33 |
| 3-1-U8 | Gray coarse sandstone | 714.64 | 109.00 | 529.90 | 166.50 | 77.10 | 2.30 | 15.30 | 15.70 | 3.71 | 72.50 | 14.60 | 68.00 | 4.77 | 8.90 | 26.70 | 0.35 |
| 3-U11 | Gray glutenite | 763.47 | 101.00 | 439.90 | 111.10 | 118.00 | 3.09 | 14.70 | 14.20 | 8.71 | 79.60 | 38.10 | 22.10 | 6.75 | 20.50 | 56.50 | 0.26 |
| 1-4-U1 | Gray coarse sandstone | 612.80 | 97.70 | 589.10 | 130.90 | 76.30 | 2.08 | 21.70 | 15.90 | 3.33 | 97.50 | 13.00 | 7.80 | 2.59 | 6.33 | 22.00 | 0.93 |
| 1-4-U3 | Gray coarse sandstone | 613.40 | 136.00 | 573.20 | 153.20 | 83.80 | 2.48 | 11.80 | 20.00 | 3.60 | 130.80 | 10.00 | 7.67 | 11.10 | 6.58 | 27.10 | 0.50 |
| 1-4-U7 | Gray coarse sandstone | 615.05 | 106.00 | 468.90 | 124.00 | 68.50 | 2.14 | 11.90 | 24.70 | 3.15 | 58.20 | 13.60 | 6.25 | 23.10 | 8.30 | 22.70 | 0.58 |
| 1-4-U13 | Gray coarse sandstone | 619.03 | 84.90 | 577.80 | 150.60 | 47.10 | 1.39 | 10.60 | 13.50 | 3.44 | 41.30 | 13.30 | 7.63 | 6.02 | 8.40 | 39.10 | 0.49 |
| 1-20-U10 | Gray coarse sandstone | 611.30 | 115.00 | 514.80 | 144.10 | 61.60 | 1.88 | 10.40 | 12.80 | 3.28 | 108.20 | 10.50 | 7.48 | 4.46 | 8.50 | 28.20 | 0.24 |
| 1-15-U2 | Gray fine sandstone | 651.50 | 104.00 | 446.60 | 109.20 | 59.90 | 1.84 | 19.90 | 15.30 | 4.10 | 23.20 | 39.80 | 5.52 | 12.60 | 17.90 | 30.00 | 1.30 |
| 1-15-U4 | Gray fine sandstone | 652.35 | 155.00 | 453.80 | 109.80 | 130.00 | 3.12 | 28.00 | 19.40 | 6.12 | 30.80 | 23.80 | 6.22 | 9.88 | 12.80 | 60.90 | 1.10 |
| MEAN | 109.71 | 515.82 | 133.76 | 76.94 | 2.18 | 15.53 | 16.85 | 4.22 | 69.09 | 18.64 | 14.29 | 8.45 | 10.53 | 33.32 | 0.61 | ||
| 3-1-U10 | Red coarse sandstone | 715.24 | 124.00 | 690.40 | 168.20 | 138.00 | 3.81 | 20.70 | 31.70 | 6.09 | 49.00 | 26.00 | 7.89 | 22.50 | 30.10 | 42.20 | 4.50 |
| 3-3-H2 | Red coarse sandstone | 686.85 | 85.00 | 724.70 | 207.00 | 36.00 | 1.01 | 8.08 | 14.70 | 2.36 | 15.20 | 8.00 | 4.41 | 1.43 | 4.22 | 14.20 | 0.34 |
| 1-2-H1 | Red coarse sandstone | 596.45 | 84.40 | 487.60 | 148.70 | 35.10 | 1.01 | 11.40 | 14.40 | 2.28 | 15.50 | 5.60 | 4.07 | 2.17 | 4.09 | 15.10 | 0.44 |
| 1-13-H4 | Red coarse sandstone | 620.25 | 101.00 | 535.30 | 166.00 | 46.70 | 1.44 | 9.77 | 14.30 | 2.66 | 18.30 | 10.20 | 3.38 | 2.66 | 5.77 | 18.80 | 0.20 |
| 1-20-H6 | Red coarse sandstone | 624.95 | 123.00 | 568.80 | 176.40 | 62.60 | 1.82 | 11.80 | 17.70 | 3.60 | 25.40 | 14.10 | 5.18 | 3.75 | 8.60 | 29.40 | 0.37 |
| 2-U5 | Red fine sandstone | 329.12 | 128.00 | 525.20 | 148.10 | 101.00 | 4.29 | 12.20 | 16.80 | 4.05 | 286.60 | 16.50 | 6.80 | 3.60 | 8.10 | 36.30 | 0.77 |
| 1-H1 | Red fine sandstone | 552.21 | 111.00 | 559.40 | 159.60 | 50.60 | 1.52 | 11.20 | 15.00 | 2.38 | 74.00 | 7.05 | 3.20 | 2.38 | 4.60 | 16.40 | 1.08 |
| 1-9-H3 | Red coarse sandstone | 615.55 | 81.30 | 630.40 | 167.30 | 32.40 | 0.97 | 8.79 | 14.20 | 2.24 | 12.40 | 6.30 | 3.90 | 1.97 | 5.55 | 14.40 | 0.39 |
| 1-11-H2 | Red coarse sandstone | 639.45 | 103.00 | 537.80 | 149.80 | 44.80 | 1.37 | 11.20 | 14.90 | 2.42 | 17.00 | 5.70 | 4.37 | 2.80 | 5.24 | 18.10 | 0.49 |
| 1-12-H2 | Red coarse sandstone | 635.25 | 106.00 | 531.70 | 128.20 | 72.60 | 2.12 | 17.50 | 17.50 | 3.29 | 19.60 | 9.90 | 6.63 | 3.36 | 6.41 | 24.80 | 0.93 |
| MEAN | 104.67 | 579.13 | 161.93 | 61.98 | 1.94 | 12.26 | 17.12 | 3.14 | 53.30 | 10.94 | 4.98 | 4.66 | 8.27 | 22.97 | 0.95 | ||
| 3-1-U1 | Yellow coarse sandstone | 712.39 | 120.00 | 431.90 | 157.60 | 86.60 | 2.76 | 15.70 | 18.80 | 3.80 | 70.60 | 10.40 | 17.20 | 13.50 | 10.80 | 17.20 | 1.70 |
| 3-H2 | Yellow coarse sandstone | 654.15 | 111.00 | 559.40 | 159.60 | 50.60 | 1.52 | 14.70 | 15.00 | 2.38 | 74.00 | 7.05 | 3.20 | 2.38 | 4.60 | 16.40 | 1.08 |
| 4-H3 | Yellow coarse sandstone | 588.34 | 0.55 | 21.60 | 541.70 | 30.00 | 0.90 | 21.00 | 3.19 | 83.90 | 174.20 | 8.00 | 56.00 | 42.70 | 7.78 | 5.64 | 18.20 |
| 1-4-H3 | Yellow fine sandstone | 609.95 | 87.00 | 633.80 | 151.90 | 59.60 | 2.01 | 13.50 | 14.60 | 3.46 | 88.60 | 14.20 | 8.31 | 4.47 | 8.60 | 23.30 | 1.44 |
| 1-4-H6 | Yellow coarse sandstone | 623.95 | 86.60 | 535.60 | 143.90 | 51.10 | 1.45 | 10.80 | 14.50 | 3.11 | 70.30 | 11.90 | 3.90 | 3.14 | 5.95 | 21.50 | 1.04 |
| 1-20-H5 | Yellow coarse sandstone | 599.15 | 88.90 | 598.00 | 159.00 | 43.90 | 1.27 | 14.00 | 14.10 | 2.95 | 207.00 | 8.50 | 6.45 | 2.66 | 4.68 | 23.50 | 1.41 |
| 1-1-U12 | Yellow coarse sandstone | 617.45 | 83.90 | 541.70 | 174.20 | 82.30 | 2.17 | 12.84 | 18.20 | 5.64 | 56.60 | 30.00 | 7.78 | 17.40 | 42.70 | 56.00 | 0.55 |
| 3-2-H8 | Yellow coarse sandstone | 754.95 | 87.50 | 658.00 | 177.50 | 50.40 | 1.46 | 10.30 | 16.50 | 3.39 | 17.90 | 24.30 | 5.25 | 3.30 | 9.20 | 24.90 | 0.49 |
| 1-2-U2 | Yellow fine sandstone | 606.80 | 120.00 | 652.60 | 184.20 | 57.10 | 1.81 | 7.96 | 18.60 | 2.97 | 577.20 | 11.30 | 11.40 | 5.84 | 6.11 | 24.50 | 0.67 |
| 1-9-H4 | Yellow coarse sandstone | 625.05 | 91.60 | 588.30 | 171.80 | 42.20 | 1.09 | 12.50 | 14.70 | 2.55 | 43.30 | 8.60 | 5.63 | 4.23 | 6.03 | 18.40 | 0.59 |
| MEAN | 87.71 | 522.09 | 202.14 | 55.38 | 1.64 | 13.33 | 14.82 | 11.42 | 137.97 | 13.43 | 12.51 | 9.96 | 10.65 | 23.13 | 2.72 | ||
| 1-2-U6 | Uranium ore body | 609.05 | 86.20 | 660.20 | 187.20 | 37.10 | 1.06 | 8.60 | 27.90 | 2.16 | 23.00 | 8.80 | 7.12 | 6.39 | 7.30 | 16.70 | 3.49 |
| 1-2-U11 | Uranium ore body | 612.95 | 85.90 | 348.00 | 143.60 | 52.80 | 1.38 | 9.68 | 25.20 | 3.25 | 146.20 | 14.00 | 6.02 | 35.80 | 25.20 | 37.60 | 21.20 |
| 1-2-U18 | Uranium ore body | 624.15 | 129.00 | 465.00 | 158.90 | 201.00 | 5.46 | 28.60 | 54.10 | 9.47 | 110.20 | 36.90 | 77.80 | 105.00 | 91.20 | 85.00 | 40.50 |
| 1-4-U14 | Uranium ore body | 633.30 | 96.40 | 1960.00 | 202.40 | 67.80 | 2.04 | 42.60 | 15.90 | 4.57 | 65.00 | 19.20 | 12.40 | 42.60 | 27.50 | 106.00 | 144.00 |
| 1-13-U5 | Uranium ore body | 601.30 | 78.50 | 561.70 | 160.00 | 40.70 | 1.14 | 10.30 | 17.90 | 2.74 | 50.50 | 10.80 | 6.07 | 26.10 | 16.60 | 124.00 | 1.48 |
| 1-13-U8 | Uranium ore body | 603.15 | 84.80 | 136.20 | 151.10 | 75.80 | 2.06 | 11.30 | 27.10 | 4.83 | 41.90 | 19.20 | 7.46 | 21.00 | 16.60 | 45.60 | 9.11 |
| 1-13-U15 | Uranium ore body | 607.50 | 97.10 | 511.40 | 134.60 | 82.40 | 2.40 | 15.60 | 118.00 | 4.69 | 31.70 | 16.00 | 9.77 | 45.20 | 40.30 | 36.10 | 0.75 |
| 1-20-U2 | Uranium ore body | 606.70 | 83.20 | 393.00 | 100.30 | 54.70 | 1.80 | 14.00 | 14.50 | 3.26 | 149.40 | 12.20 | 5.48 | 16.40 | 11.80 | 19.20 | 1.54 |
| 1-20-U4 | Uranium ore body | 607.55 | 95.90 | 565.90 | 143.50 | 81.80 | 2.49 | 14.40 | 16.30 | 3.96 | 43.10 | 17.50 | 5.33 | 6.73 | 8.80 | 18.00 | 16.70 |
| 1-20-U6 | Uranium ore body | 609.05 | 91.70 | 657.60 | 167.60 | 50.00 | 1.64 | 9.62 | 15.40 | 2.85 | 57.90 | 10.40 | 4.23 | 6.66 | 7.20 | 23.20 | 9.80 |
| MEAN | 92.87 | 625.90 | 154.92 | 74.41 | 2.15 | 16.47 | 33.23 | 4.18 | 71.89 | 16.50 | 14.17 | 31.19 | 25.25 | 51.14 | 24.86 | ||
| Sample Number | Lithology | Depth (m) | La | Ce | Pr | Nd | Sm | Eu | Gd | Tb | Dy | Ho | Er | Tm | Yb | Lu |
|---|---|---|---|---|---|---|---|---|---|---|---|---|---|---|---|---|
| 3-1-U3 | Gray middle sandstone | 713.34 | 16.63 | 31.00 | 3.75 | 13.83 | 2.56 | 0.59 | 2.13 | 0.36 | 1.92 | 0.43 | 1.11 | 0.18 | 1.17 | 0.18 |
| 3-1-U8 | Gray coarse sandstone | 714.64 | 24.90 | 45.40 | 5.52 | 19.80 | 3.59 | 0.69 | 3.05 | 0.52 | 2.72 | 0.59 | 1.52 | 0.25 | 1.62 | 0.25 |
| 3-U11 | Gray glutenite | 763.47 | 18.30 | 36.10 | 4.55 | 16.50 | 3.44 | 0.73 | 2.99 | 0.48 | 2.47 | 0.56 | 1.37 | 0.24 | 1.39 | 0.23 |
| 1-4-U1 | Gray coarse sandstone | 612.80 | 29.00 | 56.40 | 6.69 | 23.60 | 4.32 | 0.76 | 3.37 | 0.62 | 3.51 | 0.72 | 1.96 | 0.32 | 1.86 | 0.26 |
| 1-4-U3 | Gray coarse sandstone | 613.40 | 25.40 | 48.00 | 5.64 | 19.10 | 3.31 | 0.64 | 2.21 | 0.39 | 2.07 | 0.42 | 1.21 | 0.22 | 1.30 | 0.18 |
| 1-4-U7 | Gray coarse sandstone | 615.05 | 32.50 | 58.20 | 6.68 | 22.30 | 3.49 | 0.55 | 2.37 | 0.41 | 2.13 | 0.43 | 1.19 | 0.22 | 1.29 | 0.18 |
| 1-4-U13 | Gray coarse sandstone | 619.03 | 19.50 | 38.00 | 4.59 | 15.80 | 2.98 | 0.56 | 2.09 | 0.37 | 1.86 | 0.38 | 1.04 | 0.18 | 1.09 | 0.15 |
| 1-20-U10 | Gray coarse sandstone | 611.30 | 22.00 | 40.50 | 4.81 | 16.20 | 2.72 | 0.55 | 1.84 | 0.33 | 1.79 | 0.36 | 1.05 | 0.19 | 1.09 | 0.16 |
| 1-15-U2 | Gray fine sandstone | 651.50 | 44.20 | 97.40 | 9.89 | 36.00 | 6.25 | 0.98 | 4.60 | 0.72 | 3.62 | 0.69 | 1.85 | 0.29 | 1.80 | 0.27 |
| 1-15-U4 | Gray fine sandstone | 652.35 | 59.40 | 118.00 | 13.40 | 47.60 | 8.18 | 1.28 | 5.94 | 0.94 | 4.82 | 0.96 | 2.66 | 0.42 | 2.64 | 0.40 |
| MEAN | 29.18 | 56.90 | 6.55 | 23.07 | 4.08 | 0.73 | 3.06 | 0.51 | 2.69 | 0.55 | 1.50 | 0.25 | 1.53 | 0.23 | ||
| 3-1-U10 | Red coarse sandstone | 715.24 | 51.00 | 76.60 | 9.15 | 31.10 | 5.47 | 0.82 | 4.10 | 0.68 | 3.65 | 0.74 | 2.01 | 0.33 | 1.97 | 0.27 |
| 3-3-H2 | Red coarse sandstone | 686.85 | 13.60 | 25.80 | 3.20 | 11.20 | 2.05 | 0.49 | 1.60 | 0.28 | 1.45 | 0.30 | 0.81 | 0.15 | 0.78 | 0.11 |
| 1-2-H1 | Red coarse sandstone | 596.45 | 15.80 | 28.80 | 3.58 | 12.90 | 2.50 | 0.57 | 1.90 | 0.34 | 1.93 | 0.40 | 1.10 | 0.20 | 1.12 | 0.15 |
| 1-13-H4 | Red coarse sandstone | 620.25 | 17.50 | 32.00 | 3.98 | 14.10 | 2.54 | 0.53 | 1.78 | 0.31 | 1.63 | 0.34 | 0.91 | 0.17 | 0.95 | 0.13 |
| 1-20-H6 | Red coarse sandstone | 624.95 | 21.00 | 38.90 | 4.71 | 16.50 | 2.89 | 0.65 | 2.14 | 0.37 | 1.98 | 0.41 | 1.12 | 0.20 | 1.16 | 0.16 |
| 2-U5 | Red fine sandstone | 329.12 | 21.10 | 39.20 | 4.54 | 15.40 | 2.74 | 0.56 | 1.95 | 0.36 | 1.93 | 0.42 | 1.16 | 0.21 | 1.25 | 0.17 |
| 1-H1 | Red fine sandstone | 552.21 | 23.00 | 44.90 | 5.38 | 18.80 | 3.52 | 0.82 | 2.78 | 0.42 | 1.97 | 0.44 | 1.12 | 0.20 | 1.16 | 0.20 |
| 1-9-H3 | Red coarse sandstone | 615.55 | 16.30 | 32.50 | 3.64 | 13.10 | 2.37 | 0.54 | 1.69 | 0.29 | 1.54 | 0.30 | 0.84 | 0.14 | 0.81 | 0.12 |
| 1-11-H2 | Red coarse sandstone | 639.45 | 21.90 | 43.10 | 4.91 | 17.40 | 3.00 | 0.57 | 2.27 | 0.37 | 2.01 | 0.40 | 1.10 | 0.18 | 1.13 | 0.16 |
| 1-12-H2 | Red coarse sandstone | 635.25 | 31.10 | 59.20 | 6.95 | 24.60 | 4.35 | 0.69 | 3.17 | 0.55 | 2.83 | 0.58 | 1.72 | 0.27 | 1.76 | 0.25 |
| MEAN | 23.23 | 42.10 | 5.00 | 17.51 | 3.14 | 0.62 | 2.34 | 0.40 | 2.09 | 0.43 | 1.19 | 0.20 | 1.21 | 0.17 | ||
| 3-1-U1 | Yellow coarse sandstone | 712.39 | 44.20 | 83.50 | 9.24 | 32.50 | 5.28 | 0.83 | 3.50 | 0.55 | 2.76 | 0.54 | 1.54 | 0.24 | 1.56 | 0.24 |
| 3-H2 | Yellow coarse sandstone | 654.15 | 23.00 | 45.60 | 5.45 | 18.90 | 3.71 | 0.80 | 2.99 | 0.46 | 2.44 | 0.56 | 1.50 | 0.29 | 1.66 | 0.28 |
| 4-H3 | Yellow coarse sandstone | 588.34 | 34.70 | 63.50 | 7.39 | 26.60 | 4.96 | 0.91 | 4.17 | 0.65 | 3.60 | 0.74 | 2.11 | 0.37 | 2.34 | 0.37 |
| 1-4-H3 | Yellow fine sandstone | 609.95 | 21.50 | 42.40 | 4.90 | 17.40 | 3.24 | 0.59 | 2.36 | 0.42 | 2.30 | 0.47 | 1.31 | 0.23 | 1.33 | 0.18 |
| 1-4-H6 | Yellow coarse sandstone | 623.95 | 17.90 | 34.20 | 4.16 | 14.80 | 2.63 | 0.53 | 1.92 | 0.35 | 1.85 | 0.38 | 1.09 | 0.19 | 1.12 | 0.16 |
| 1-20-H5 | Yellow coarse sandstone | 599.15 | 21.40 | 43.30 | 5.02 | 17.90 | 3.40 | 0.71 | 2.72 | 0.48 | 2.52 | 0.50 | 1.35 | 0.23 | 1.29 | 0.18 |
| 1-1-U12 | Yellow coarse sandstone | 617.45 | 18.09 | 35.00 | 4.27 | 15.46 | 2.94 | 0.66 | 2.65 | 0.46 | 2.45 | 0.54 | 1.39 | 0.24 | 1.46 | 0.23 |
| 3-2-H8 | Yellow coarse sandstone | 754.95 | 18.50 | 35.60 | 4.23 | 14.70 | 2.67 | 0.56 | 1.90 | 0.33 | 1.81 | 0.38 | 1.04 | 0.20 | 1.14 | 0.17 |
| 1-2-U2 | Yellow fine sandstone | 606.80 | 21.60 | 41.80 | 4.80 | 16.30 | 2.68 | 0.48 | 1.68 | 0.28 | 1.44 | 0.30 | 0.82 | 0.16 | 0.92 | 0.13 |
| 1-9-H4 | Yellow coarse sandstone | 625.05 | 21.80 | 43.80 | 5.03 | 18.00 | 3.15 | 0.62 | 2.36 | 0.39 | 2.12 | 0.43 | 1.20 | 0.19 | 1.24 | 0.19 |
| MEAN | 24.27 | 46.87 | 5.45 | 19.26 | 3.47 | 0.67 | 2.63 | 0.44 | 2.33 | 0.48 | 1.33 | 0.23 | 1.41 | 0.21 | ||
| 1-2-U6 | Uranium ore body | 609.05 | 19.30 | 37.40 | 4.25 | 14.60 | 2.59 | 0.51 | 1.89 | 0.31 | 1.53 | 0.32 | 0.85 | 0.16 | 0.87 | 0.12 |
| 1-2-U11 | Uranium ore body | 612.95 | 14.90 | 37.30 | 4.74 | 16.10 | 2.46 | 0.50 | 1.71 | 0.28 | 1.46 | 0.31 | 0.85 | 0.16 | 0.88 | 0.12 |
| 1-2-U18 | Uranium ore body | 624.15 | 43.80 | 82.20 | 10.10 | 35.80 | 6.40 | 1.08 | 4.74 | 0.86 | 4.67 | 0.98 | 2.78 | 0.47 | 2.93 | 0.42 |
| 1-4-U14 | Uranium ore body | 633.30 | 19.80 | 39.30 | 5.33 | 21.00 | 4.74 | 1.02 | 4.65 | 0.88 | 5.04 | 1.07 | 2.86 | 0.40 | 2.22 | 0.32 |
| 1-13-U5 | Uranium ore body | 601.30 | 10.40 | 27.00 | 4.65 | 18.90 | 2.44 | 0.52 | 1.71 | 0.31 | 1.75 | 0.35 | 0.98 | 0.18 | 1.00 | 0.13 |
| 1-13-U8 | Uranium ore body | 603.15 | 24.10 | 44.60 | 5.14 | 17.60 | 2.98 | 0.57 | 2.03 | 0.37 | 2.00 | 0.42 | 1.23 | 0.22 | 1.32 | 0.19 |
| 1-13-U15 | Uranium ore body | 607.50 | 23.20 | 46.20 | 5.63 | 19.10 | 3.45 | 0.64 | 2.44 | 0.49 | 2.85 | 0.59 | 1.64 | 0.28 | 1.69 | 0.23 |
| 1-20-U2 | Uranium ore body | 606.70 | 24.90 | 49.60 | 5.76 | 19.90 | 3.64 | 0.52 | 2.50 | 0.44 | 2.40 | 0.48 | 1.35 | 0.23 | 1.36 | 0.18 |
| 1-20-U4 | Uranium ore body | 607.55 | 33.80 | 62.50 | 7.35 | 25.00 | 4.43 | 0.64 | 2.87 | 0.49 | 2.59 | 0.52 | 1.46 | 0.25 | 1.51 | 0.21 |
| 1-20-U6 | Uranium ore body | 609.05 | 24.30 | 47.00 | 5.41 | 19.00 | 3.22 | 0.52 | 2.08 | 0.34 | 1.80 | 0.35 | 0.97 | 0.18 | 1.04 | 0.14 |
| MEAN | 23.85 | 47.31 | 5.84 | 20.70 | 3.64 | 0.65 | 2.66 | 0.48 | 2.61 | 0.54 | 1.50 | 0.25 | 1.48 | 0.21 | ||
Disclaimer/Publisher’s Note: The statements, opinions and data contained in all publications are solely those of the individual author(s) and contributor(s) and not of MDPI and/or the editor(s). MDPI and/or the editor(s) disclaim responsibility for any injury to people or property resulting from any ideas, methods, instructions or products referred to in the content. |
© 2025 by the authors. Licensee MDPI, Basel, Switzerland. This article is an open access article distributed under the terms and conditions of the Creative Commons Attribution (CC BY) license (https://creativecommons.org/licenses/by/4.0/).
Share and Cite
Liu, Y.; Peng, H.; Luo, N.; Yu, X.; Li, M.; Ji, B. The Key Controlling Factors and Mechanisms for the Formation of Sandstone-Type Uranium Deposits in the Central Part of the Ulanqab Depression, Erlian Basin. Minerals 2025, 15, 688. https://doi.org/10.3390/min15070688
Liu Y, Peng H, Luo N, Yu X, Li M, Ji B. The Key Controlling Factors and Mechanisms for the Formation of Sandstone-Type Uranium Deposits in the Central Part of the Ulanqab Depression, Erlian Basin. Minerals. 2025; 15(7):688. https://doi.org/10.3390/min15070688
Chicago/Turabian StyleLiu, Yang, Hu Peng, Ning Luo, Xiaolin Yu, Ming Li, and Bo Ji. 2025. "The Key Controlling Factors and Mechanisms for the Formation of Sandstone-Type Uranium Deposits in the Central Part of the Ulanqab Depression, Erlian Basin" Minerals 15, no. 7: 688. https://doi.org/10.3390/min15070688
APA StyleLiu, Y., Peng, H., Luo, N., Yu, X., Li, M., & Ji, B. (2025). The Key Controlling Factors and Mechanisms for the Formation of Sandstone-Type Uranium Deposits in the Central Part of the Ulanqab Depression, Erlian Basin. Minerals, 15(7), 688. https://doi.org/10.3390/min15070688