Article

Lithology and Macroscopic Coal Lithotype Identification of Coal-Bearing Measures Based on Elemental Mud Logging: A Case Study of the Eastern Ordos Basin Coal Seam

1
School of Geosciences, China University of Petroleum (East China), Qingdao 266580, China
2
No.2 Mud Logging Company, CNPC Bohai Drilling Engineering Company Limited, Renqiu 062550, China
3
Chongqing Key Laboratory of Complex Oilfield Exploration and Development, Chongqing University of Science and Technology, Chongqing 401331, China
4
Sinopec Petroleum Exploration and Production Research Institute, Beijing 102206, China
*
Authors to whom correspondence should be addressed.
Minerals 2025, 15(6), 616; https://doi.org/10.3390/min15060616
Submission received: 12 April 2025 / Revised: 28 May 2025 / Accepted: 3 June 2025 / Published: 9 June 2025

Abstract

China is rich in coalbed methane (CBM) resources, and the key to realizing the scale and efficiency of CBM development is to build “engineering tools” for exploration and development continuously. Accurate calculation of rock components and precise identification of lithology and macroscopic coal lithotypes of coal-bearing measures are the basis for the evaluation of CBM geological engineering. This paper proposes a method to identify the lithology and macroscopic coal lithotypes of coal-bearing measures based on elemental mud logging. Firstly, a coal seam demarcation line is constructed based on the elemental mud logging to divide the coal and non-coal seams. Secondly, the content of each component in the coal and non-coal seams is calculated. Finally, based on the results of the calculations, a method for recognizing the lithology of non-coal seams and macroscopic coal lithotypes of coal seams is constructed based on the combination of the S (sulfur) element innovatively. The calculation error of mineral and proximate analysis components is less than 10%, and the average accuracy of lithology and macroscopic coal lithotype identification is as high as 87%. The results can provide important technical guidance for the geological evaluation of coal-bearing measures and the selection of target seams.

1. Introduction

China has very rich coalbed methane (CBM) resources. The global proven reserves of CBM resources are about 270 × 1012 m3, mainly distributed in Russia, Canada, China, and the United States [1,2]. China’s CBM reserves are about 70 × 1012 m3, accounting for about 26% of the global total [3,4]. At present, China’s CBM exploration and development are relatively concentrated, mainly in the Ordos Basin [5,6]. Continuously building “high efficiency and high precision engineering tools” for exploration and development is the key to realizing the large-scale and efficient development of CBM [7]. Compared with shale oil and gas and tight gas [8,9,10], the industrial scale of CBM is still in its infancy, and constructing demonstration zones and large-scale cost-effective exploration and development still faces significant technical challenges [11,12,13]. Therefore, adaptive technologies are urgently needed. Among them, accurate calculation of rock components of coal-bearing stratum, lithology identification, and macroscopic coal lithotypes delineation and identification are the essential bases for the evaluation of CBM geological engineering [14,15,16].
The coal-bearing measures include both coal and non-coal seams, and the accuracy of lithology identification directly impacts the precision of reservoir predictions [17]. Based on the average luster of the coal seam and the combination and proportion of macroscopic coal seam components, the macroscopic coal lithotypes can be classified into four types: bright coal, semi-bright coal, semi-dark coal, and dark coal. These four macroscopic coal lithotypes exhibit significant variations in gas content and reservoir brittleness. Consequently, the effective and accurate identification of the macroscopic coal lithotypes greatly influences the economic benefits of coalbed methane (CBM) exploration and development [18,19,20]. The most direct means to identify the formation lithology and macroscopic coal lithotypes are generally coring and cuttings logging, which can visually identify the lithology and conduct petrophysical experiments [21]; cuttings logging data can also visually observe the lithology of the corresponding stratigraphic depths by observing the rock chips extracted from the land during drilling [22], which is also of great significance for the identification of the lithology, but cuttings logging usually leads to misclassification and depth bias. The accuracy of lithology identification is generally lower than that of coring, and it is difficult to observe the macroscopic coal lithotypes through the powder, so the lithology or macroscopic coal lithotypes determined by coring are typically used as the leading comparison labels.
However, due to the economics of development, not all wells are cored or cuttings logged due to the economics of development. The lithology labeling points obtained by coring are usually only discrete. The lithology determined by coring or cuttings logging greatly depends on the experience of the field engineer. Continuous data, such as conventional or elemental, is required to obtain constant and more accurate lithology data. Conventional logging curves include three lithology curves: natural gamma (GR), spontaneous-potential (SP), and caliper (CAL); three resistivity curves: deep (RLLD), medium (RLLM), and shallow (RLLS); and three porosity curves: compensated neutron (CNL), lithological density (DEN), and compensated acoustic wave (AC). Elemental logging includes elemental well logging and elemental mud logging. Both measure the content of elements, but the principles of the two techniques and the types of elements they measure are different. Usually, the identification of lithology and macroscopic coal lithotypes is based on conventional logging curves [23,24,25,26], but when the traditional logging curves cannot effectively distinguish the lithology or macroscopic coal lithotypes, it is necessary to explore other effective methods. When elemental logging data are available, lithology identified by elemental logging is generally considered more reliable, because the element is a direct reflection of the proportion of each component of the rock itself. The lithology can be determined from the essence of the rock component. Many studies have been conducted to identify lithology using elemental logging [27,28]. However, there is little research on building a macroscopic coal lithotypes identification method based on elemental logging.
The present paper proposes a method to identify the lithology of coal-bearing measures and macroscopic coal lithotypes based on elemental mud logging. Firstly, the elemental demarcation line between non-coal seams and coal seams is constructed on the basis of elemental mud logging data and experimental analysis data, and to divide the lithology of the coal-bearing measures into coal seams and non-coal seams. Secondly, a calculation method for the content of mineral components for non-coal seams is constructed. Thirdly, a calculation method is constructed for coal seams’ proximate analysis component content based on the mineral component content calculation, combined with the experimental analysis data of proximate analysis components. Finally, based on the accurate calculation of the contents of mineral and proximate analysis components, and innovatively combining the variation characteristics of the S (sulfur) element, the precise identification of lithology in non-coal seams and macroscopic coal lithotypes in coal seams was achieved. To a certain extent, it effectively compensates for the significant identification error of conventional curves, which can provide critical technical references for the geological evaluation of coal-bearing measures and the selection of target coal seams.

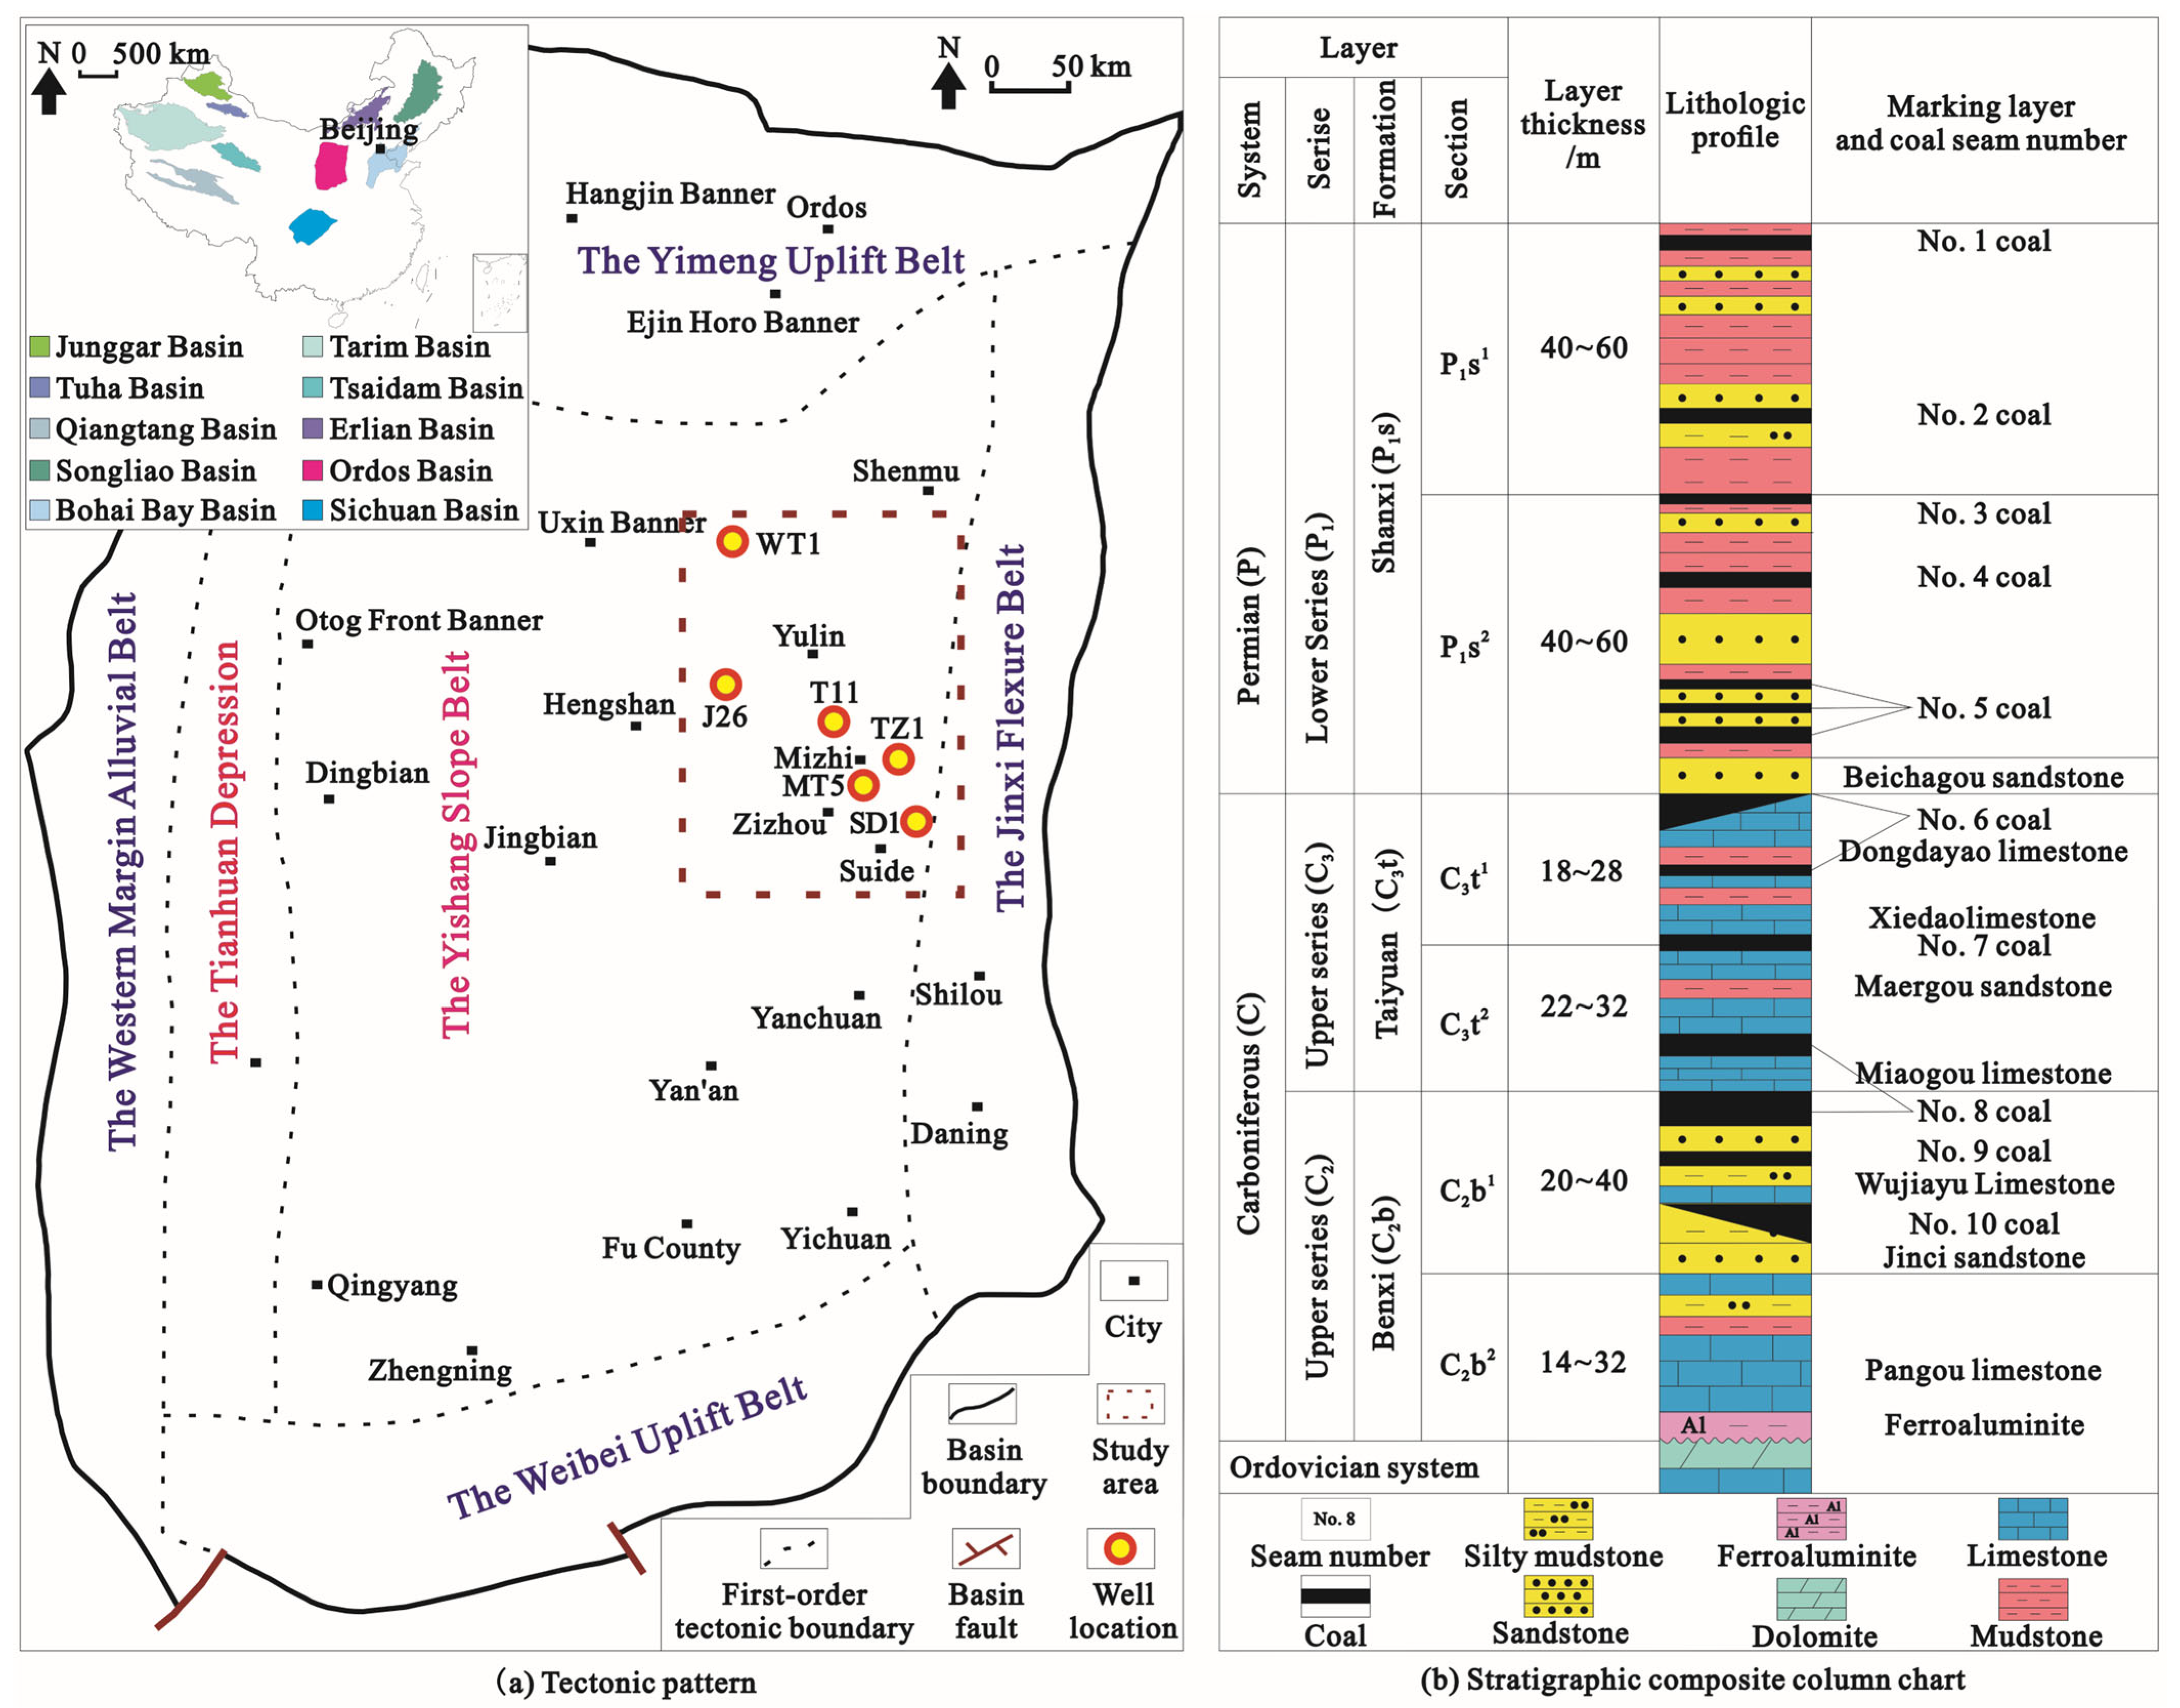
2. Geological Setting

The study area is located in the eastern central part of the Ordos Basin. The Ordos Basin spans five provinces of Nei Mongol, Shaanxi, Gansu, Ningxia, and Shanxi, with a total area of about 37 × 104 km2, and has experienced multiple phases of tectonic evolution, which is a typical multi-rotation, composite basin [29]. The Late Carboniferous–Permian formed an extensive marine–continental interaction type of coal-bearing measures. At the end of the Early Triassic, the Ordos Massif rose in the east and fell in the west, after which Triassic and Jurassic terrestrial coal-bearing measures were deposited. As a result, the basin is endowed with widely distributed Carboniferous–Permian marine–continental interbedded coal strata and Triassic and Jurassic continental coal strata. The Ordos Basin can be divided into six tectonic units: the Western Margin Alluvial Belt, the Tianhuan Depression, the Weibei Uplift Belt, the Yishang Slope Belt, the Yimeng Uplift Belt, and the Jinxi Flexure Belt (Figure 1a) [30]. The coal seams are mainly distributed in the Yishang slope and the Tianhuan Depression in the west.
During the Upper Paleozoic period in the basin, the coal seams of the Upper Carboniferous Benxi Formation (C2b), the Upper Carboniferous Taiyuan Formation (C3t), and the Lower Permian Shanxi Formation (P1s) developed from bottom to top. The sedimentary environment changed from sea–land interaction to continental facies [31]. The P1s include the 1~5 coal seams interbedded with sandstones and mudstones. The C3t consists of the 6, 7, and 8 coal seams, which are distributed between the Beichagou sandstone at the bottom of the P1s and the Dongdayao limestone, Xidao limestone, Maolgou limestone, and Miaogou limestone of the C3t. The C2b includes the 8, 9, and 10 coal seams. The 8 and 9 are often combined into a single unit, commonly referred to collectively as the 8 coal seam, which is located above the Wujiayu limestone of the C2b and below the Miaogou limestone of the C3t [30,31,32] (Figure 1b). The thickness of the 8 coal seam at the top of the Benxi Formation C2b is generally 2~15 m, but reaches 25 m. It has the most stable distribution in the whole basin, has the most significant potential for coalbed methane exploration, and is also the target stratum of this study.

3. Data and Methodology

This study selected 6 wells (TZ1, WT1, T11, J26, SD1, MT5) for investigation using conventional well logging data, mud logging data, and experimental data. The locations of the wells are shown in Figure 1a. The traditional logging carves data include acoustic logging (AC), neutron logging (CNL), gamma logging (GR), caliper logging (CAL), density logging (DEN), spontaneous-potential logging (SP), deep resistivity logging (RLLD), and shallow resistivity logging (RLLS). The mud logging data consists mainly of elemental mud logging data, cuttings logging (lithology), and gas mud logging. The experimental data consists primarily of sample coring and slice observations. The primary data processing methods are the oxide closure model and regression analysis. The implementation steps of the process will be described in detail in the course of the discussion.

4. Results and Discussion

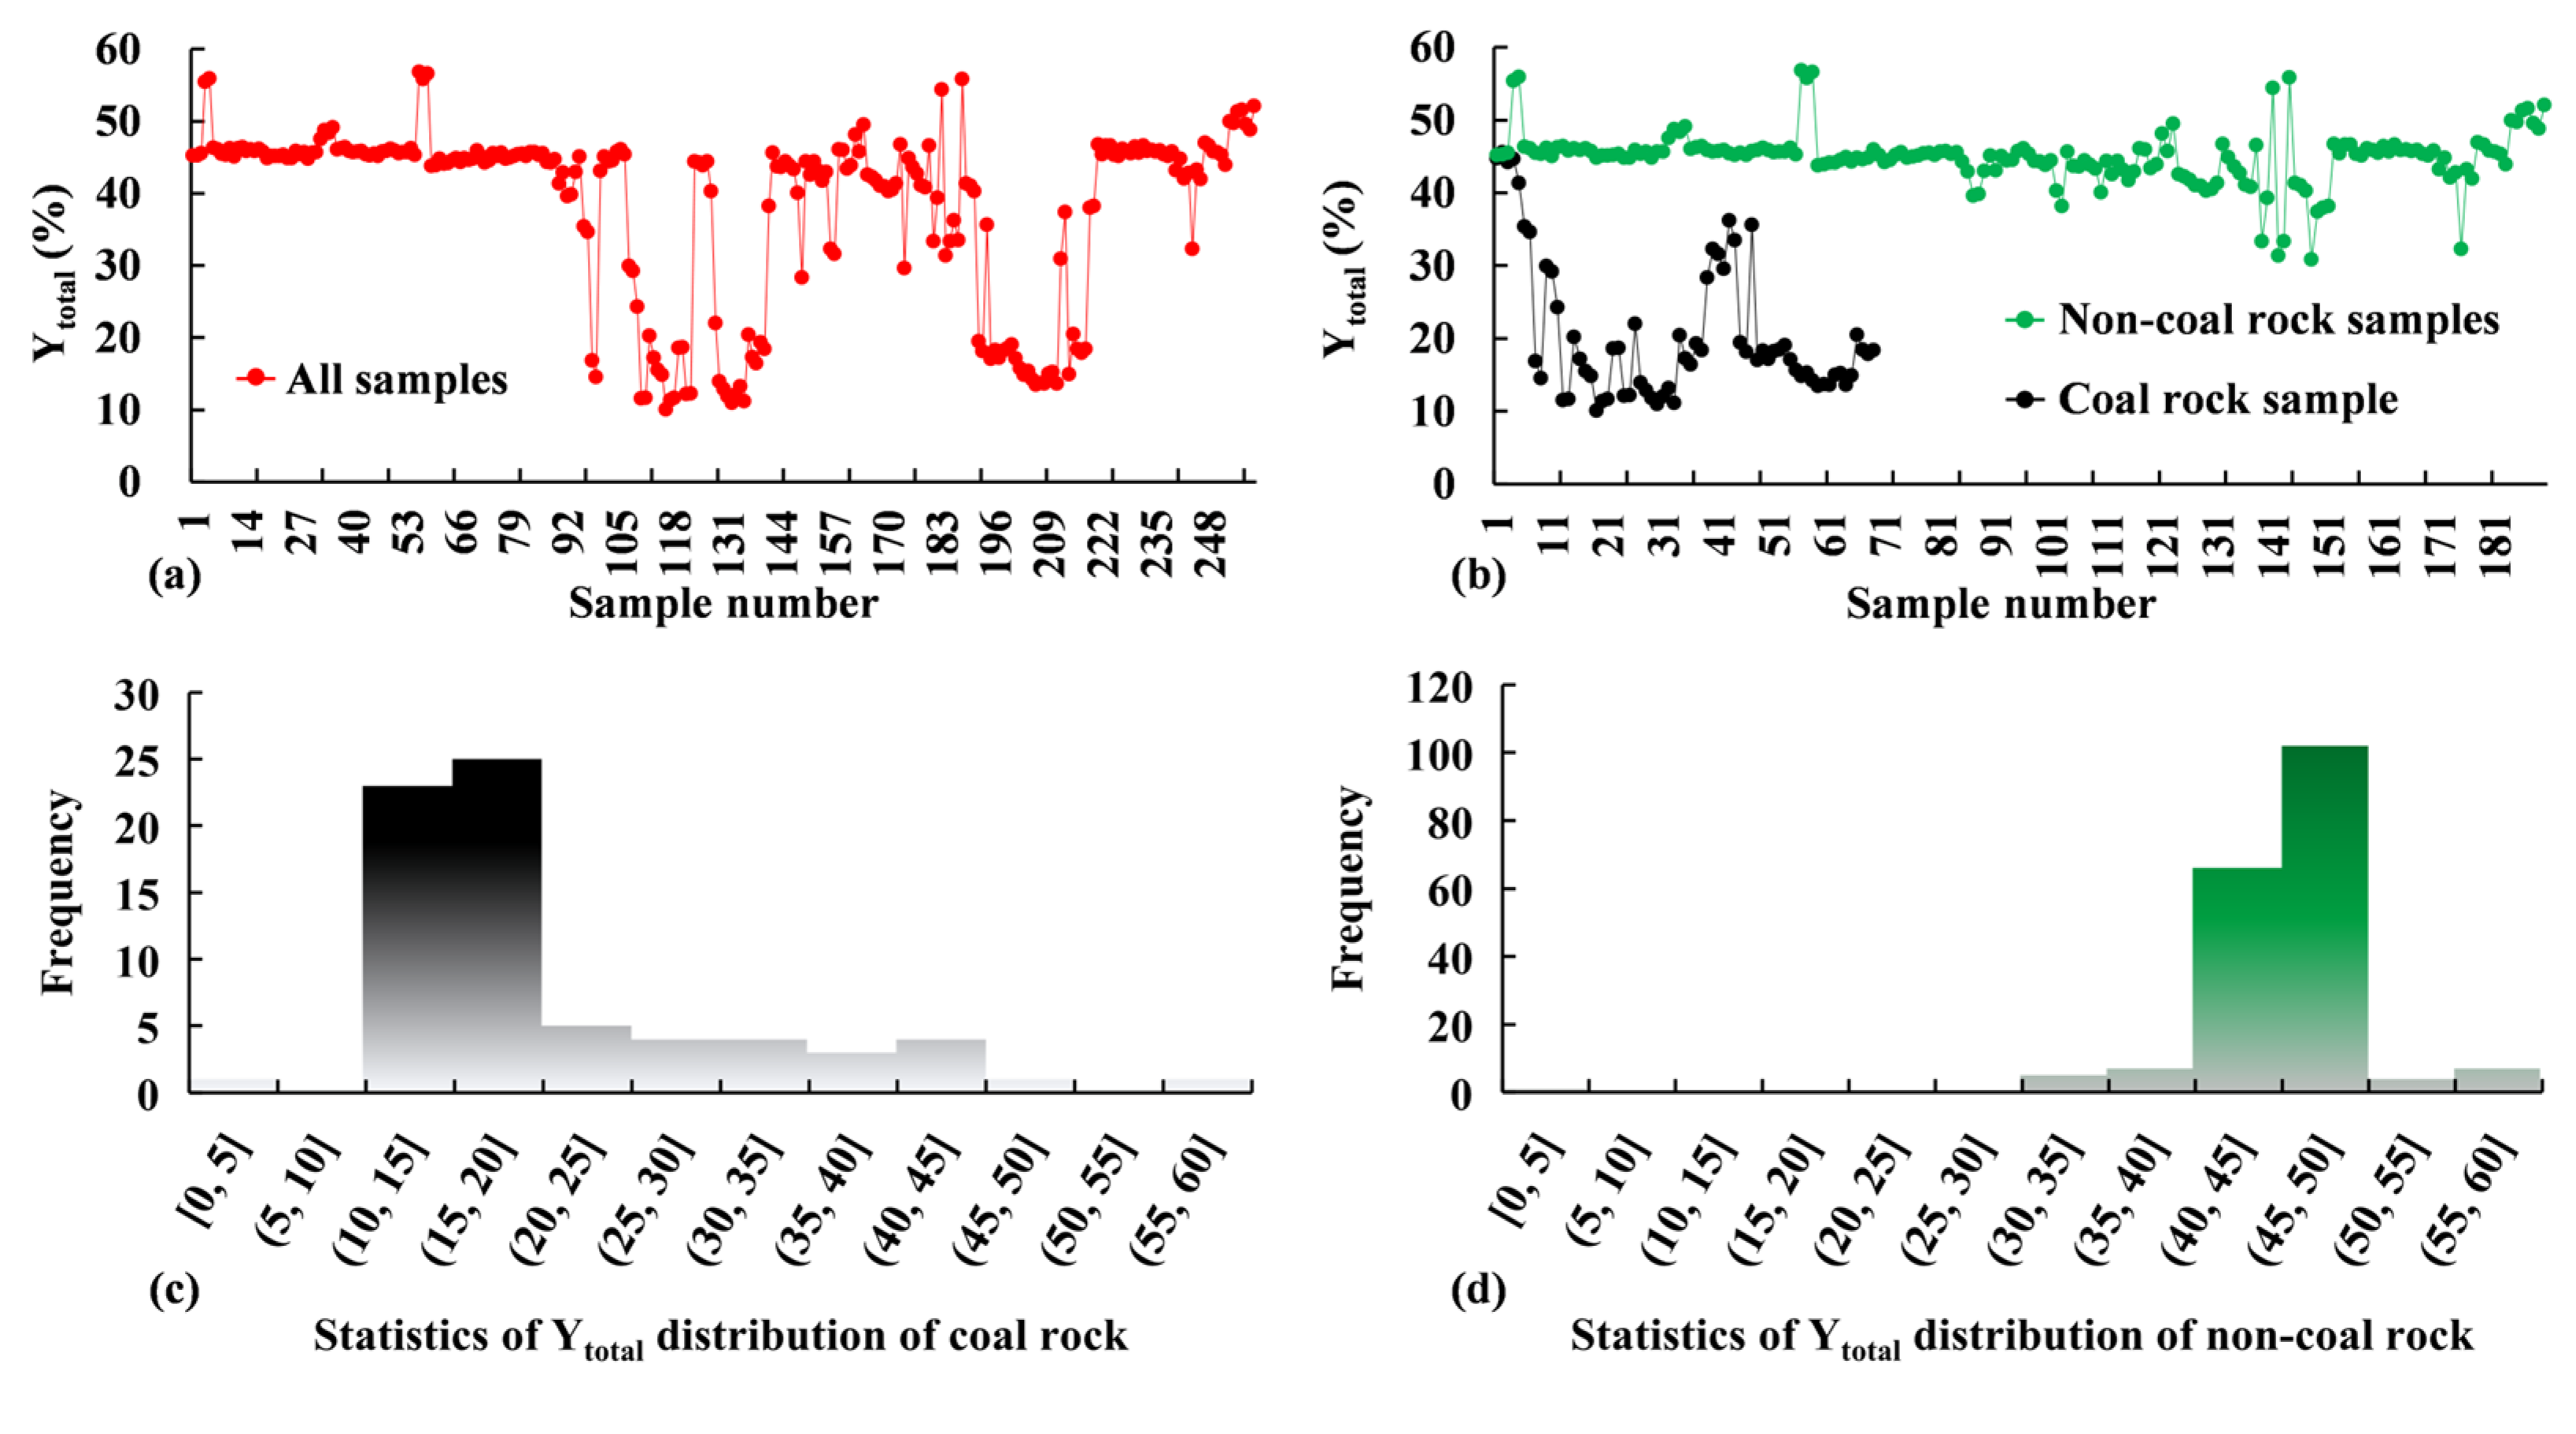
4.1. Coal and Non-Coal Seam Division

Coal-bearing measures develop coal seams and non-coal seams; the lithology of coal seams is coal, but non-coal seams contain various lithologies. For non-coal seams, the content of mineral components can be calculated based on the element content of elemental mud logging. However, for coal seams, there is no method for direct conversion to various proximate analysis components in coal seams based on elemental content. Different methods are needed to calculate the content of each component in non-coal and coal seams. To facilitate the selection of the subsequent calculation methods, it is necessary to distinguish between coal and non-coal seams in the target stratum. Through the experimental analysis of core samples and cuttings logging in the study area, the primary lithologies developed in the target section are classified into coal and non-coal seams, and the non-coal seams include sandstone, limestone, mudstone, and carbonaceous mudstone (Figure 2a).
Non-coal seams are dominated by quartz and clay minerals (Figure 2b). In contrast, coal seams are dominated by fixed carbon (75.41% fixed carbon, 14.43% ash, 9.56% volatile matter, and 0.61% moisture, on average) (Figure 2c). The minerals are mainly kaolinite, montmorillonite, illite, quartz, calcite, dolomite, pyrite, siderite, and anhydrite, and the minerals correspond to the central characteristic elements are Al (aluminum), K (potassium), S (sulfur), Si (silicon), Ca (calcium), Mg (magnesium), Fe (ferrum), accounting for about 98% of the total elements measured by elemental mud logging (the effective measurement range of elemental mud logging is usually from Na (natrium) to U (uranium) in the Periodic Table of Elements, excluding C (Carbon)). Based on experimental data analysis, this paper constructs a petrophysical volume model of the coal-bearing strata in the study area (Figure 3). The volume model provides a clear indication of the relationship between the proximate analysis components in the coal seam. The proximate analysis components of the coal seam include ash (Aad), fixed carbon (FCad), volatile matter (Vad) and moisture (Mad); ash is the amount of residue left after the coal is completely burned, and the ash comes from the minerals of coal, so the ash is mainly the various types of mineral components contained in the coal. It is possible to interpret the non-coal seam as the rock containing only ash, laying the foundation for later establishing the conversion relationship between the non-coal seam and the coal seam.
After obtaining the element content based on elemental mud logging, it is necessary to construct a relationship between the elemental content and the coal or non-coal seam. By comparing the lithological labels determined by investigating multiple drill-cores (the core samples were taken from wells TZ1, WT1, and SD1, and a total of 258 samples were collected, including 70 coal seams and 188 non-coal seams) with the sum of the weight percent contents of major elements ( Y t o t a l , primary elements are Al, K, S, Si, Ca, Mg, and Fe) (Figure 3) and through statistical analysis, the study found that the primary distribution of Y t o t a l corresponding to non-coal seam is greater than 40, while coal seam is less than 40. Hence, this study qualitatively determined Y t o t a l = 40% as the demarcation line between coal and coal seam (Equation (1)). When Y t o t a l ≥ 40%, the lithology is non-coal seam (including sandstone, limestone, mudstone, and carbonaceous mudstone). The lithology is coal seam when the Y t o t a l < 40% (Figure 4) (Equation (2)).
Y S i + Y A l + Y C a + Y K + Y F e + Y S + Y M g = Y t o t a l ,
N o n c o a l : Y t o t a l 40 Coal :       Y t o t a l < 40 ,
where, Y A l , Y K , Y S , Y S i , Y C a , Y M g , and Y F e are the weight percentage content of Al, K, S, Si, Ca, Mg, and Fe elements, respectively, also known as element dry weight (%).

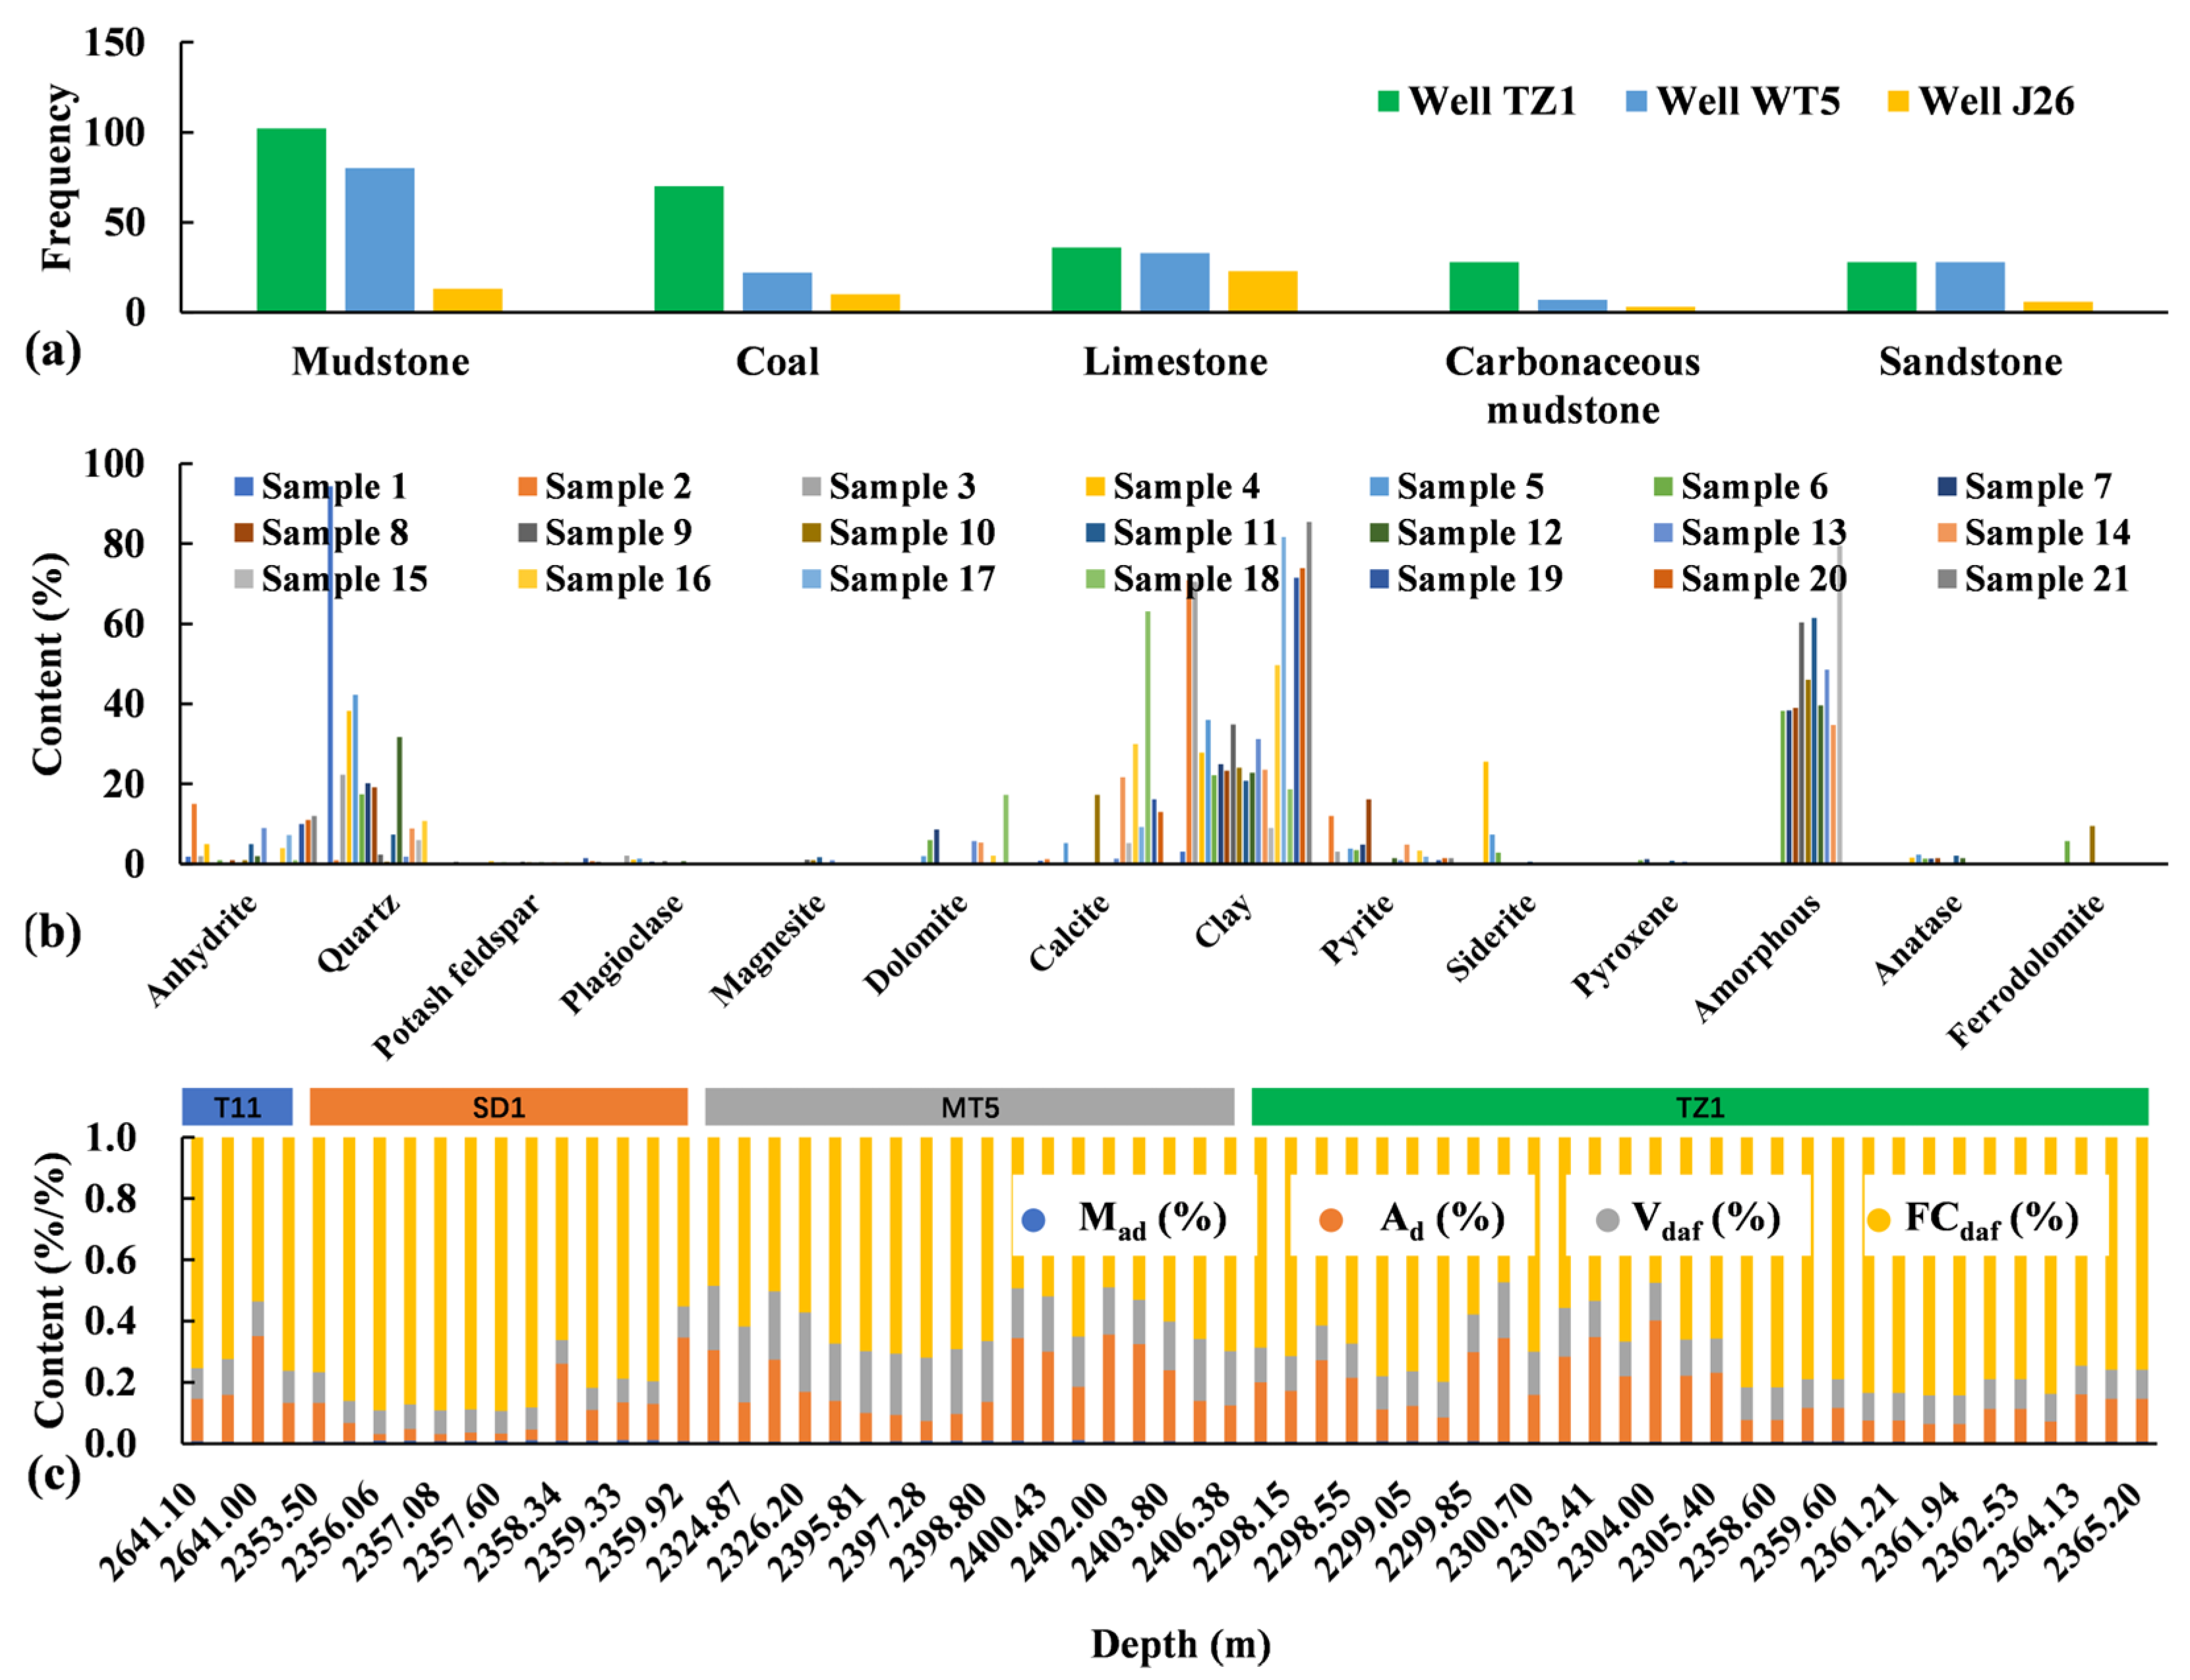
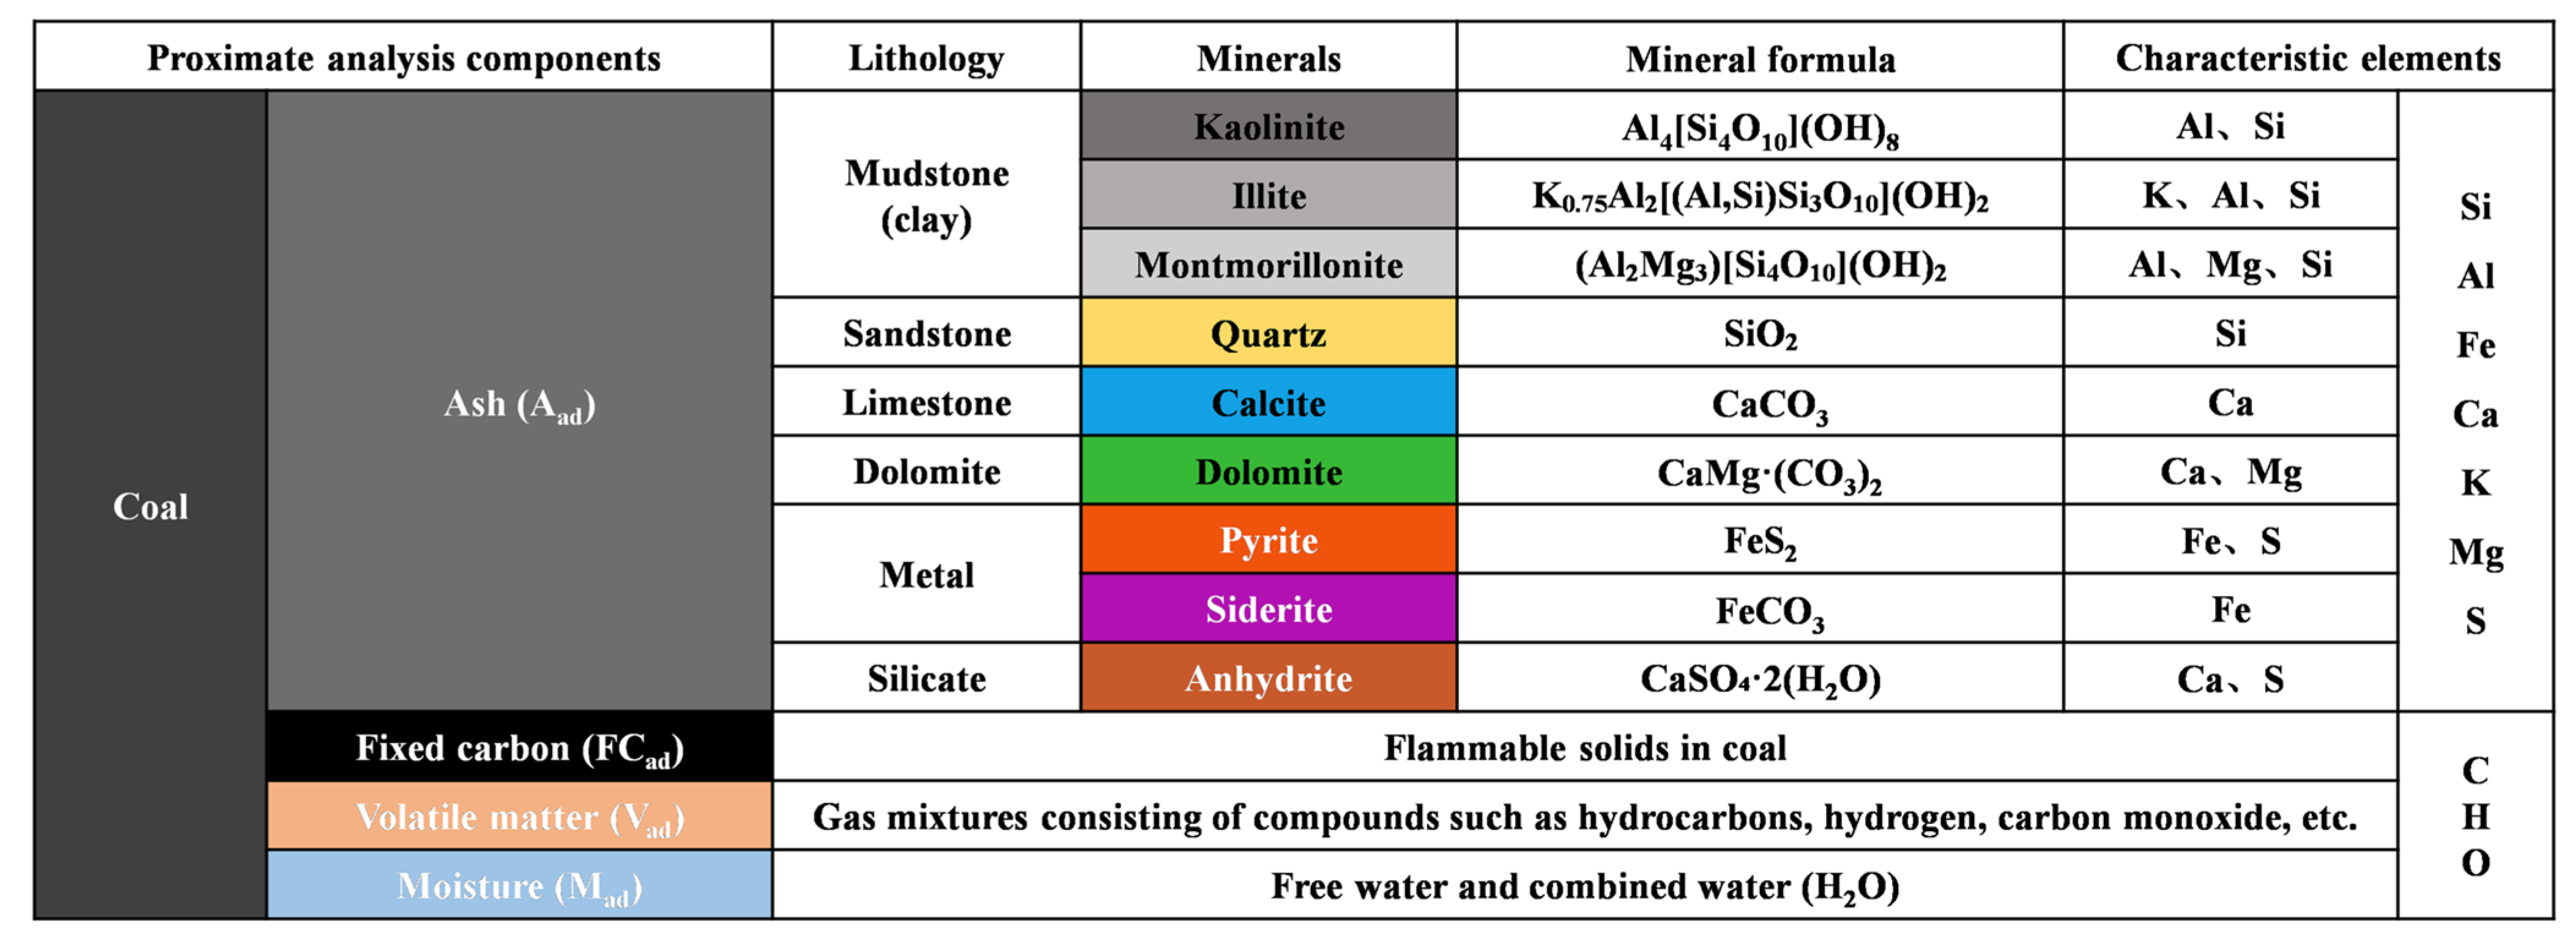
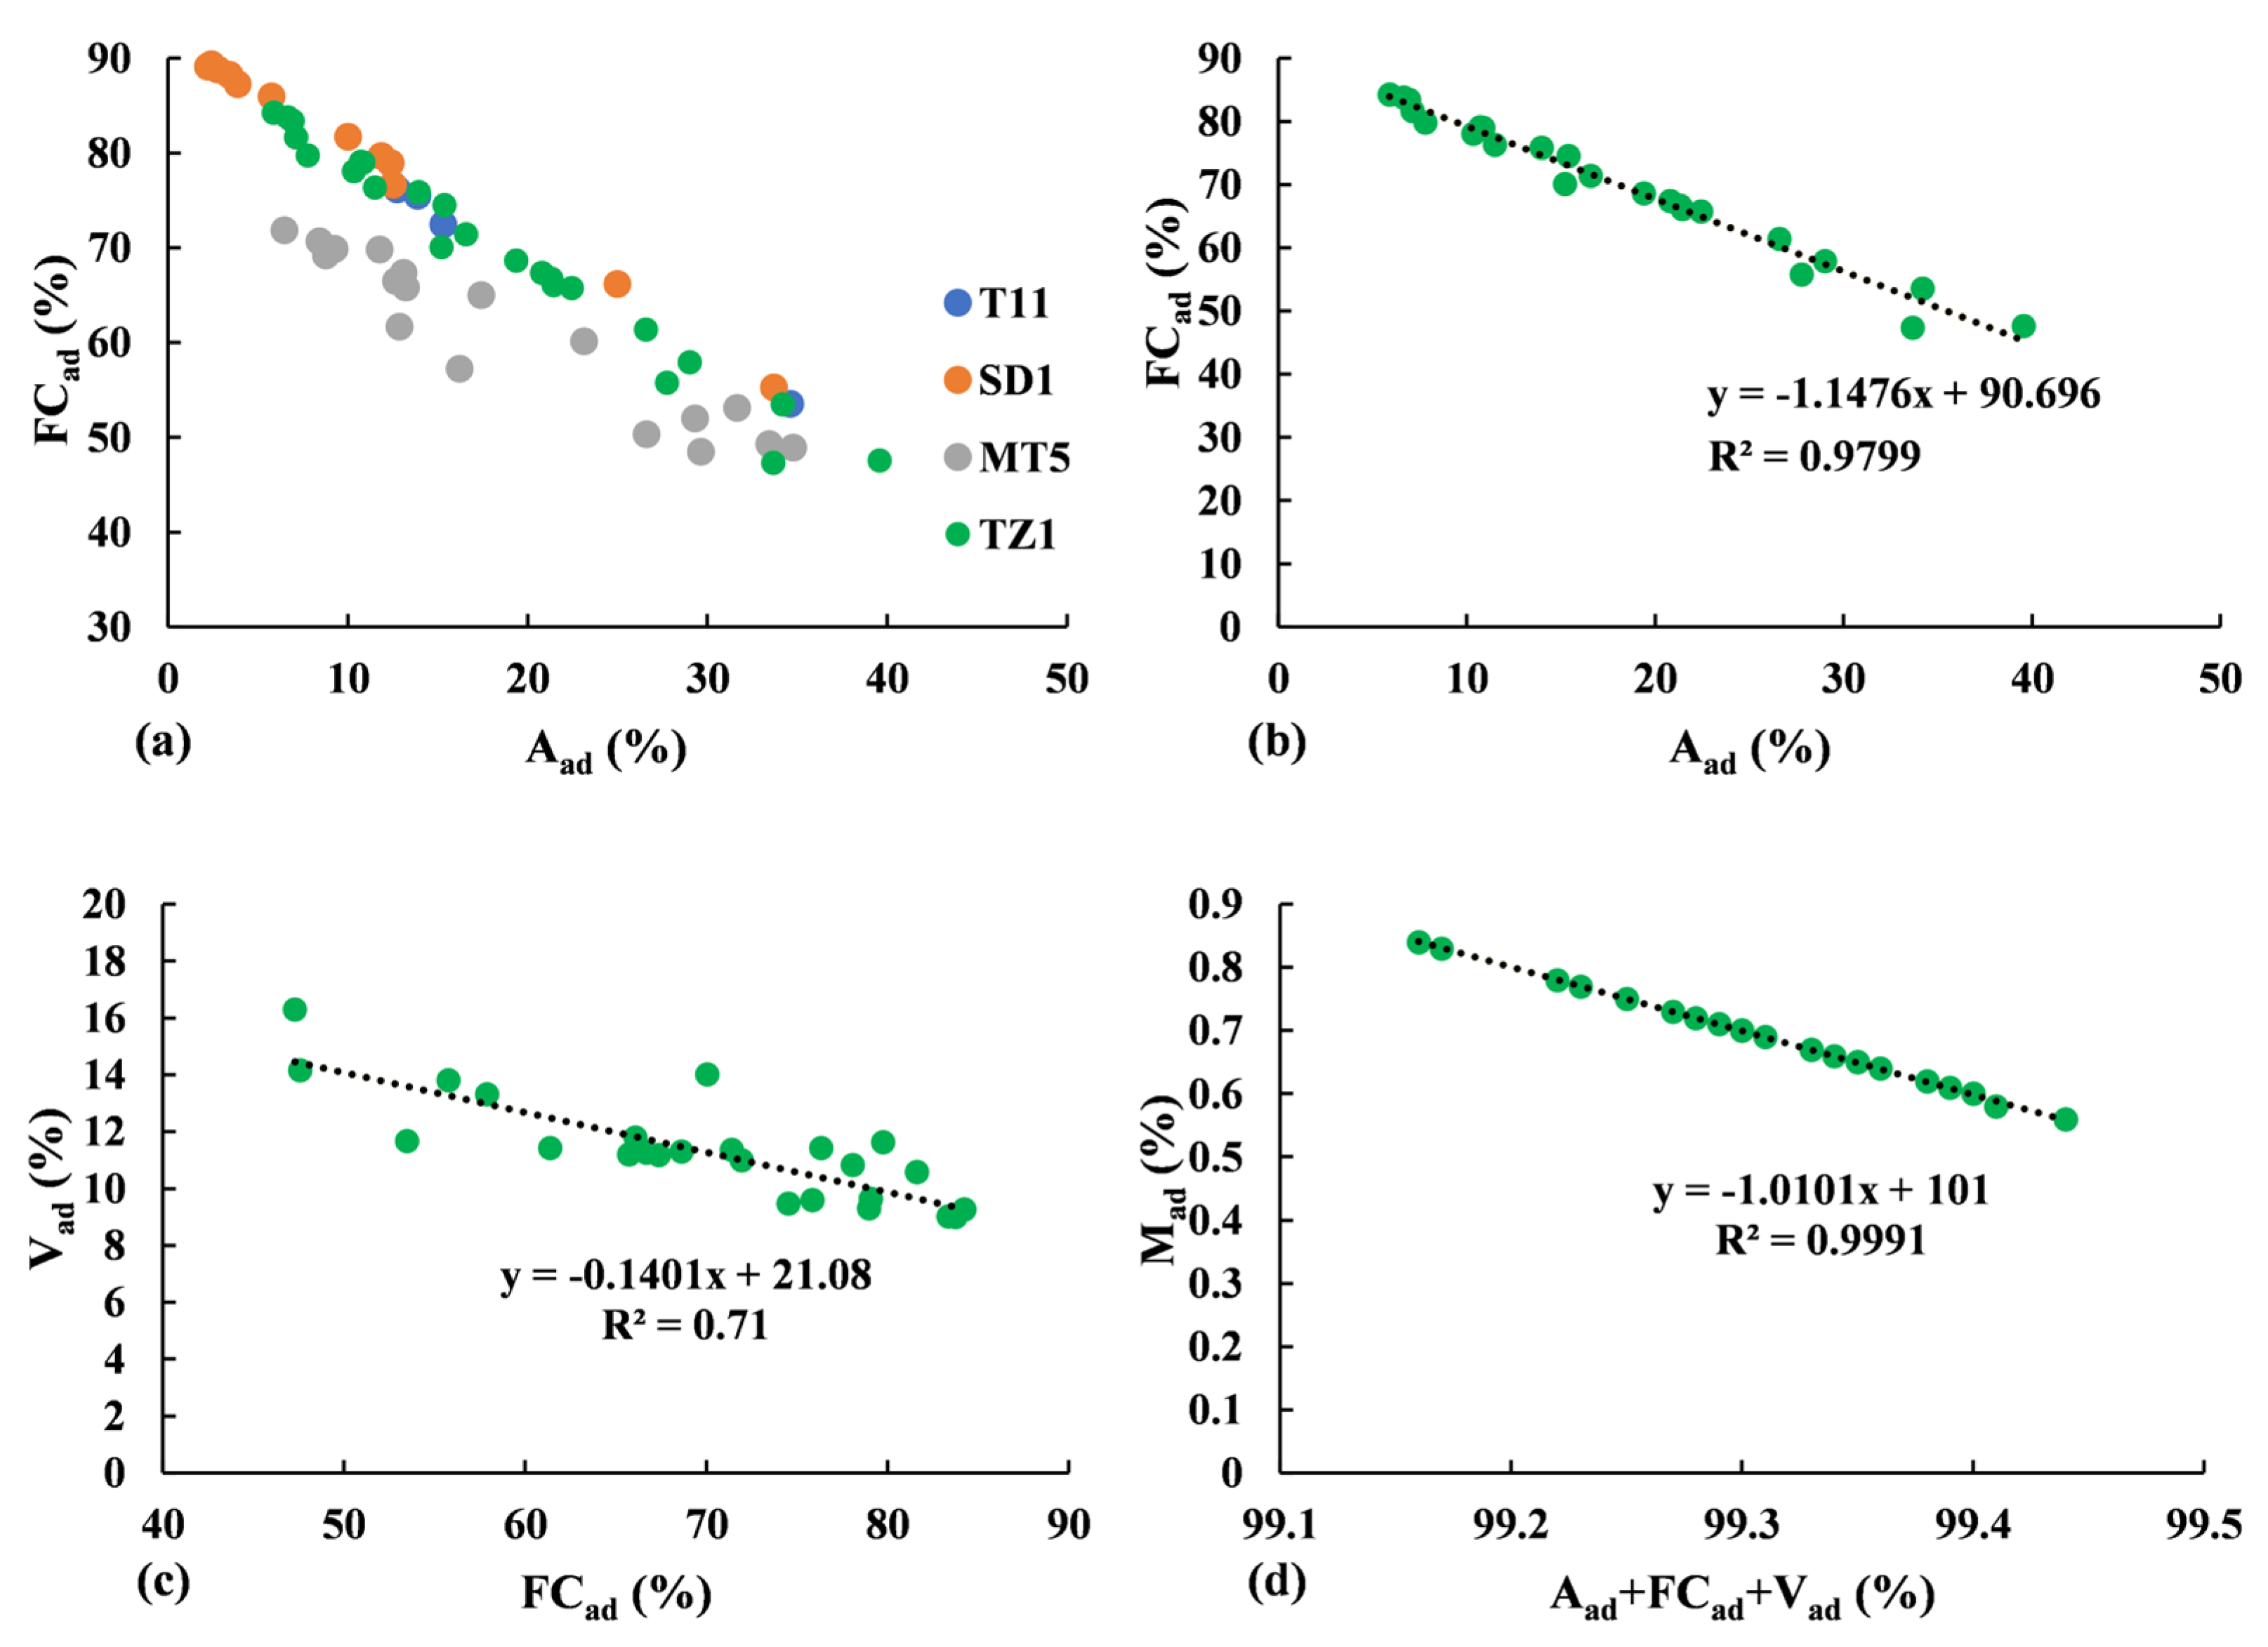
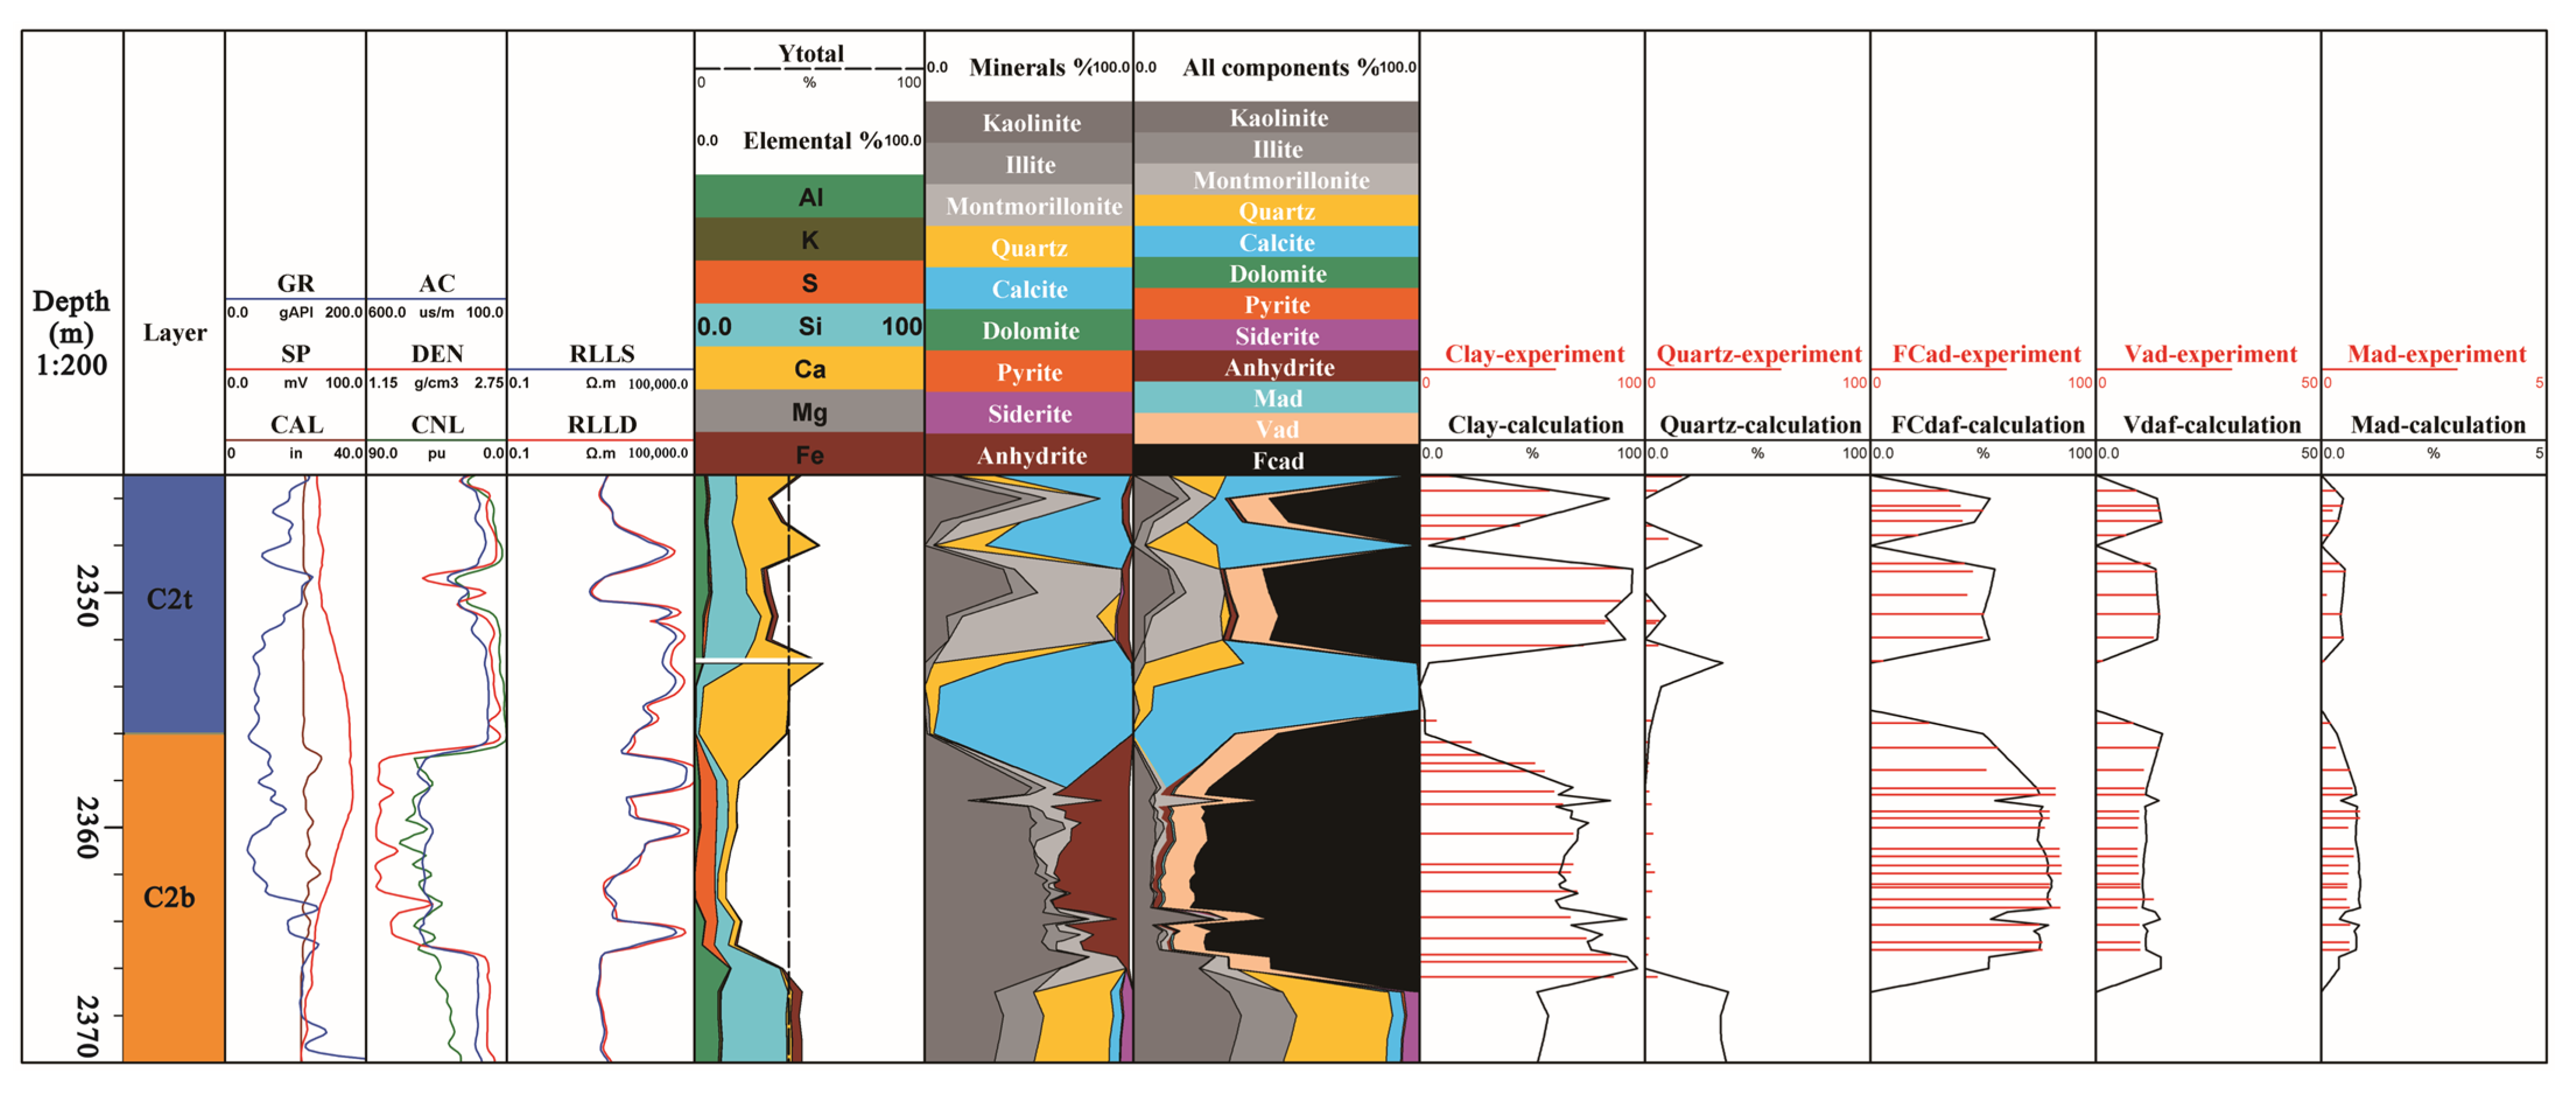
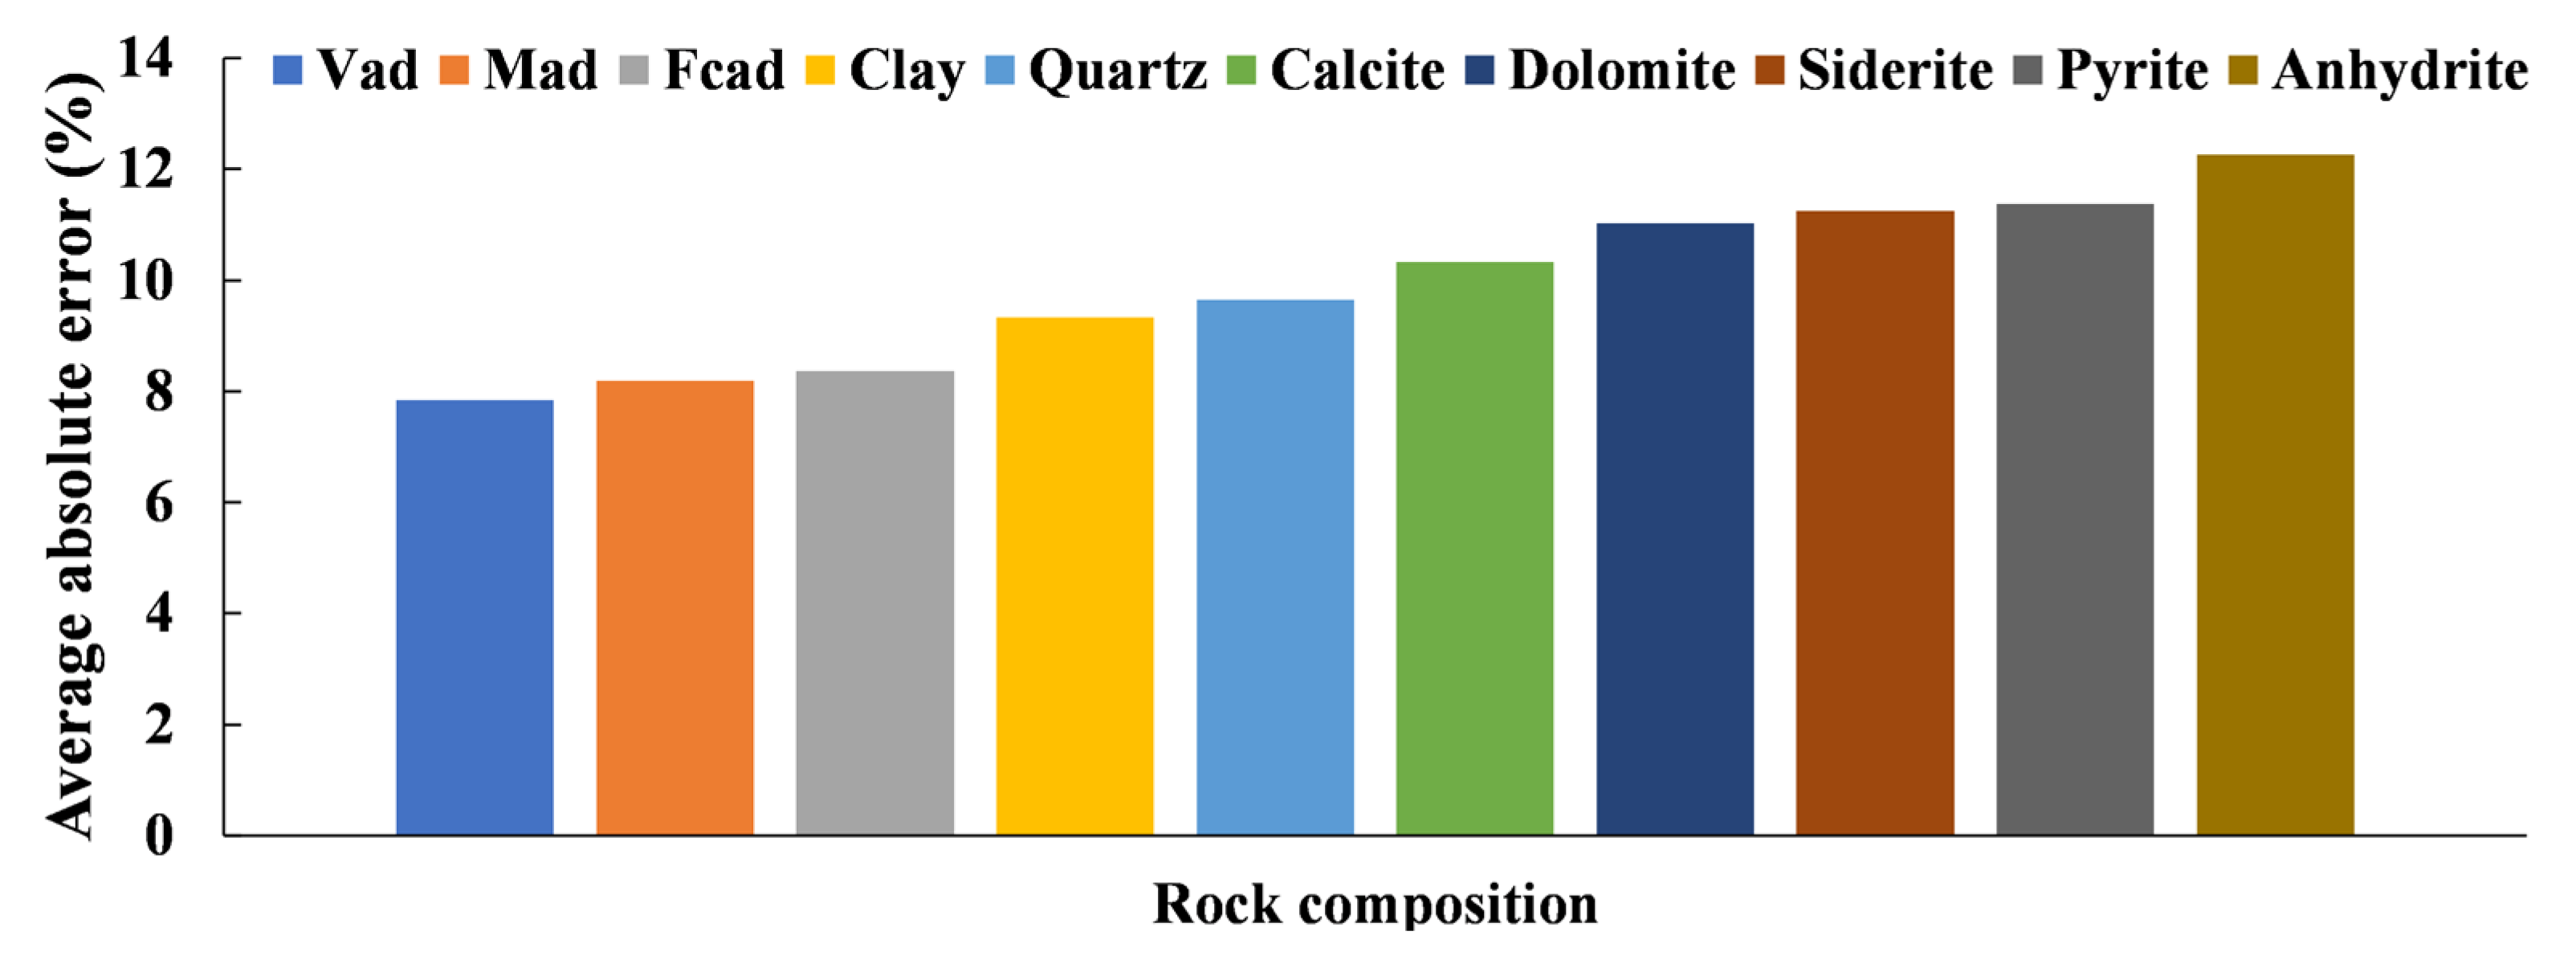
4.2. Calculation of Rock Components

After classifying coal and non-coal seams, traditional algorithms can be used to calculate the mineral content (percentage of ash in coal) of the non-coal seams. Based on the elemental content to calculate the mineral matter content, the most commonly used method is the oxide closure model [33]. The basic principle of the oxide closure model is to set the sum of the weight percentages of the oxides of all elements per unit volume of the stratum as 100%. Through the oxide closure model, the weight percentage of each element can be determined (Equations (3)–(5)), and then the content of each mineral can be calculated by solving the Herron matrix (Equation (6)) [34].
i = 1 n W O i = 100 ,
W O i = F × X i × Y i S i ,
W i = F × Y i S i ,
where W O i denotes the percent oxide content (dry weight of the oxide) corresponding to the ith element; F denotes the normalization factor (this factor is a function of depth); X i denotes the oxide index (the reciprocal of the conversion factor of the oxide) of the ith element; Y i denotes the weight percent content of the ith element obtained from the decomposition of the spectra; S i denotes the sensitivity factor of the ith element (also known as the sensitivity factor); and W i denotes the actual content of the element in the formation, i.e., the weight percent of the element (dry weight of the element).
Herron (1990) [35] proposed a quantitative relationship between elemental and mineral content after neutron activation and X-ray diffraction analysis of many core samples. The correlation between elemental content and mineral content was determined by multiple regression analysis and can be expressed in the form of a matrix as:
[ E ] = [ C ] [ M ] ,
where [ E ] is a matrix consisting of weight percent content of elements; [ M ] is a matrix composed of weight percent content of minerals, for the study herein including Mkaolinite, Mmontmorillonite, Millite, Mquartz, Mcalcite, Mdolomite, Mpyrite, Msiderite, and Manhydrite, unit %, Mkaolinite + Mmontmorillonite + Millite + Mquartz + Mcalcite + Mdolomite + Mpyrite + Msiderite + Manhydrite ≈ 100%; and [ C ] is a conversion coefficient, where the coefficient Cij indicates the content of the ith element in the jth mineral. The conversion coefficients of this embodiment are shown in Table 1.
For coal seam, the main elements in the rock are Al, K, S, Si, Ca, Mg, Fe, and C, but the element logging cannot measure the C element. This study considered that the sum of the weight percentage ( Y t o t a l ) of Al, K, S, Si, Ca, Mg, and Fe elements can be regarded as the proportion of ash content (Ad) in coal seam (Equation (7)). In contrast, the content of C element is approximately the proportion of non-ash components in coal. The experimental data of proximate analysis components (FCad, Aad, Vad, and Mad) from several wells (T11, SD1, MT5, and TZ1) in the study area show that there is a good linear relationship between the different proximate analysis components (Figure 5a), in which the correlation coefficient (R2) between Aad and FCad is as high as 0.979 (Figure 5b). Based on the experimental data of proximate analysis components in TZ1 well, regression models between Aad and FCad, FCad and Vad, and Aad + FCad + Vad and Mad were constructed as Equations (8), (9), and (10), respectively:
Y t o t a l = V A a d ,
V F C a d = 1.1476     V A a d + 90.70 ,
V V a d = 0.1401     V F C a d + 21.08 = 0.1608     V A a d + 8.83 ,
V M a d = 1.0101     ( V A a d + V F C a d + V V a d ) + 101 = 0.0133     V A a d + 0.47 ,
The sum of the weight percent content of the proximate analysis components per unit volume should be 100% (Equation (11)). Still, due to the bias of the calculation of the constructed model, the calculated sum of the proximate analysis components will have a little deviation around 100%. For comparison purposes, the proximate analysis components need to be normalized to 100% (Equations (12)–(15)). The ash content V A a d * in coal after normalization is assigned according to the ratio between Mkaolinite, Mmontmorillonite, Millite, Mquartz, Mcalcite, Mdolomite, Mpyrite, Mrhodochrosite, and Manhydrite calculated by Equation (6), and the content of each type of mineral component in the ash is synchronized to the unified scale of the proximate analysis component after normalization (Equation (16)).
V A a d * + V F C a d * + V V a d * + V M a d * = 100 ,
V A a d * = V A a d V A a d + V F C a d + V V a d + V M a d     100 = V A a d 0.0001     V A a d + 99.99     100 ,
V F C a d * = V F C d a f V A a d + V F C a d + V V a d + V M a d     100 = 1.1476     V A a d + 90.70 0.0001     V A a d + 99.99     100 ,
V V a d * = V V a d V A a d + V F C a d + V V a d + V M a d     100 = 0.1608     V A a d + 8.83 0.0001     V A a d + 99.99     100 ,
V M a d * = V M a d V A a d + V F C a d + V V a d + V M a d     100 = 0.0133     V A a d + 0.47 0.0001     V A a d + 99.99     100 ,
V n * = M n 100     V A a d *
where V A a d and V A a d * are the ash content before and after normalization (%); V F C a d and V F C a d * are the fixed carbon content before and after normalization (%); V V a d and V V a d * are the volatile matter content before and after normalization (%); V M a d and V M a d * are the moisture content before and after normalization (%); V n * is the content of each mineral component in coal seam (%), where n = 1, 2, 3, 4, 5, 6, 7, 8, 9 represent kaolinite, montmorillonite, illite, quartz, calcite, dolomite, pyrite, siderite and anhydrite, respectively; and M n is the mineral content calculated by Formula (6) (%).
Figure 6 shows the calculation results of the mineral components and proximate analysis components of well TZ1. From left to right, the first column is depth, the second column is stratification, the third to fifth columns are conventional logging curves, the sixth column is the original content of elements, the seventh column is the calculation result of mineral content based on elemental mud logging, the eighth column is the calculation result integrating mineral components and industrial components, and the nineth to thirteenth columns are the comparison between the calculation results and the experimental results. The average value of the average absolute error between the calculation results and the experimental results is less than 10% (Figure 7), and the calculation results are relatively accurate, laying a good foundation for the precise identification of lithology in the later stage.

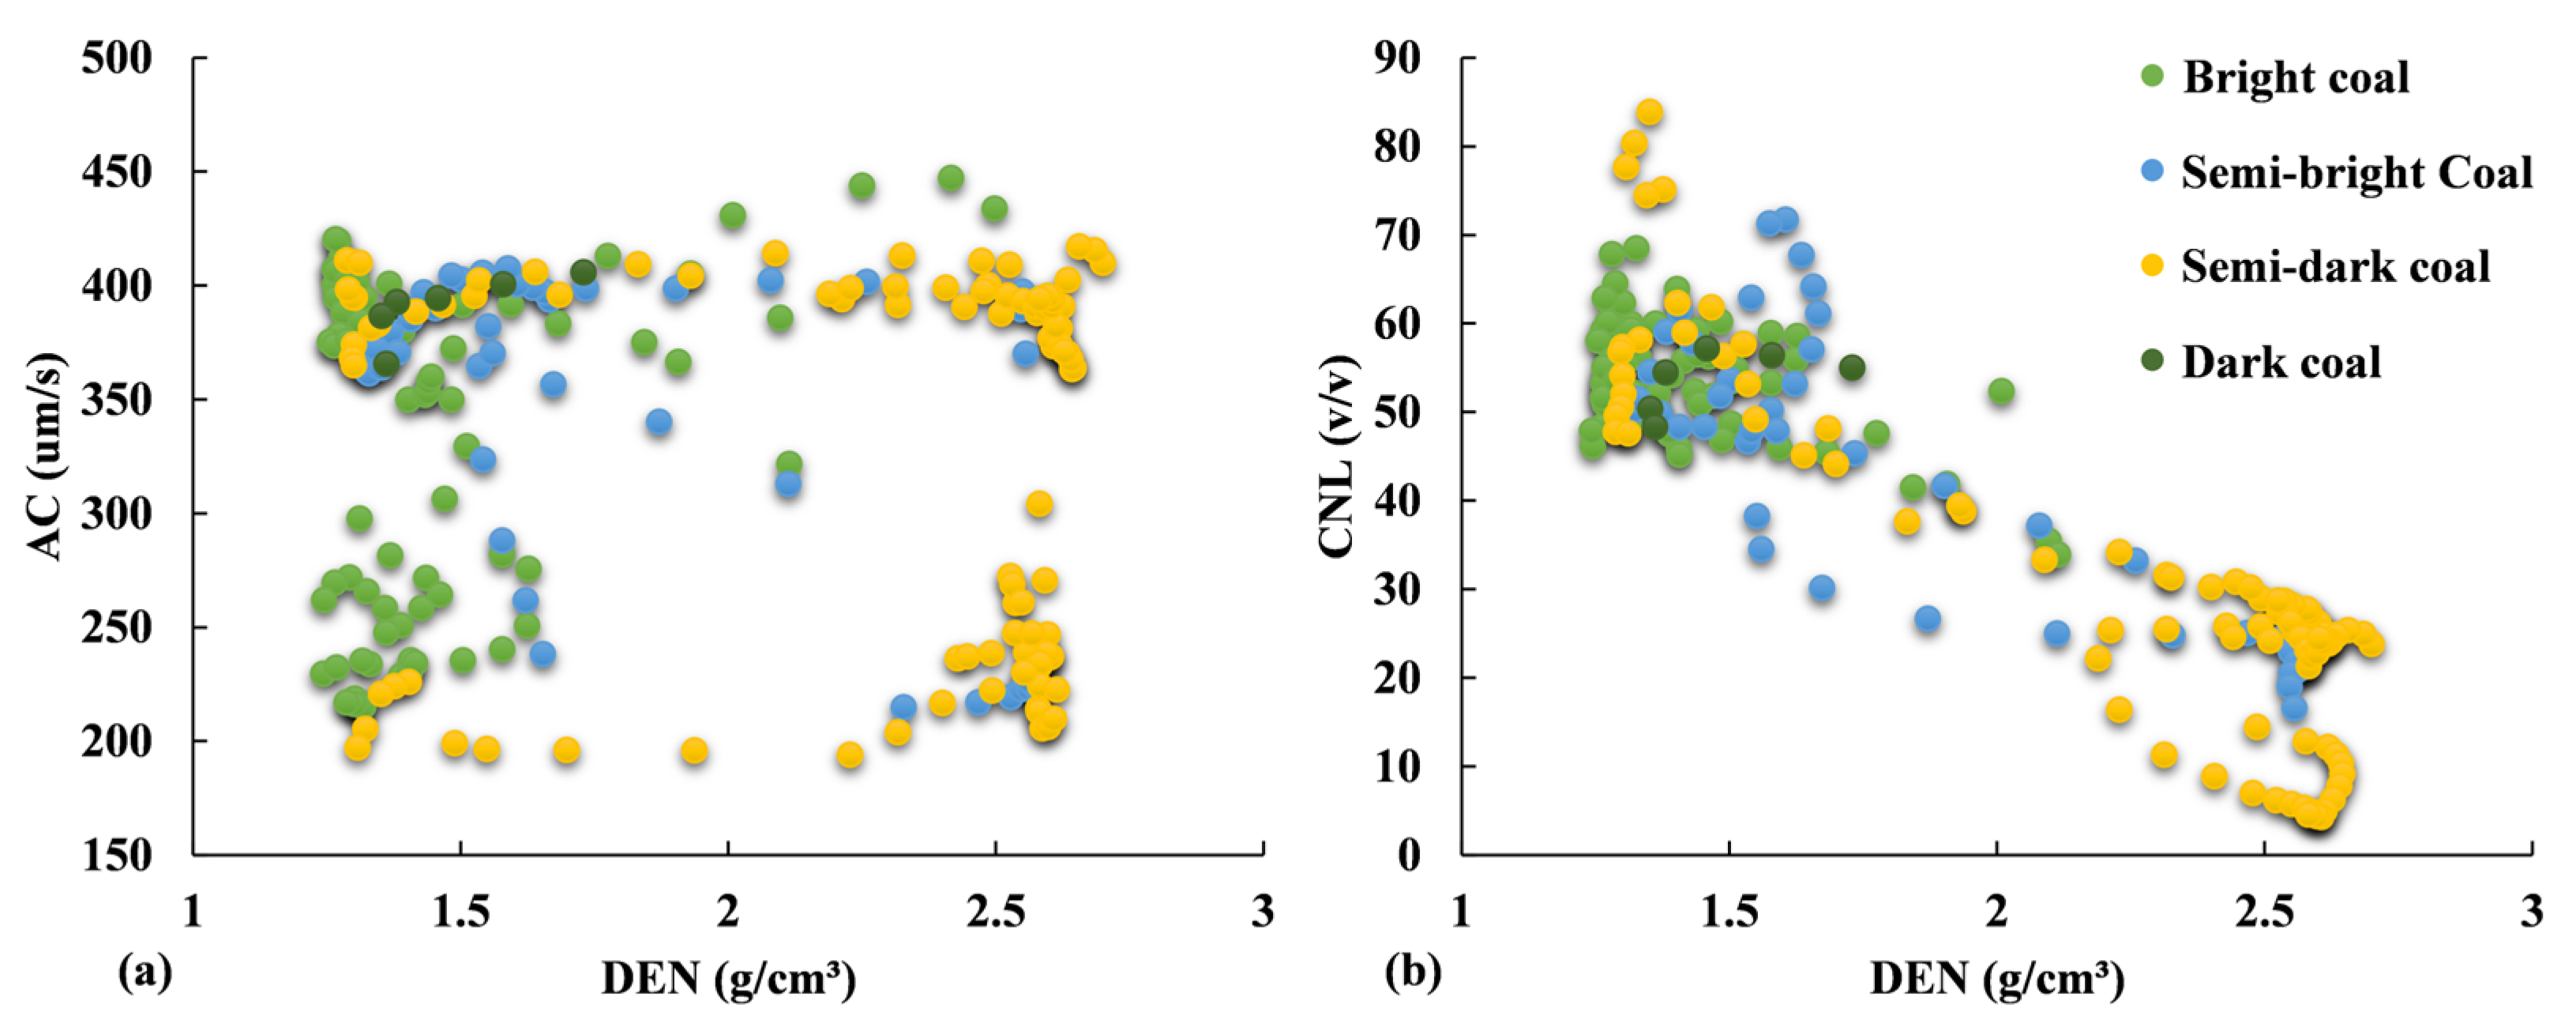
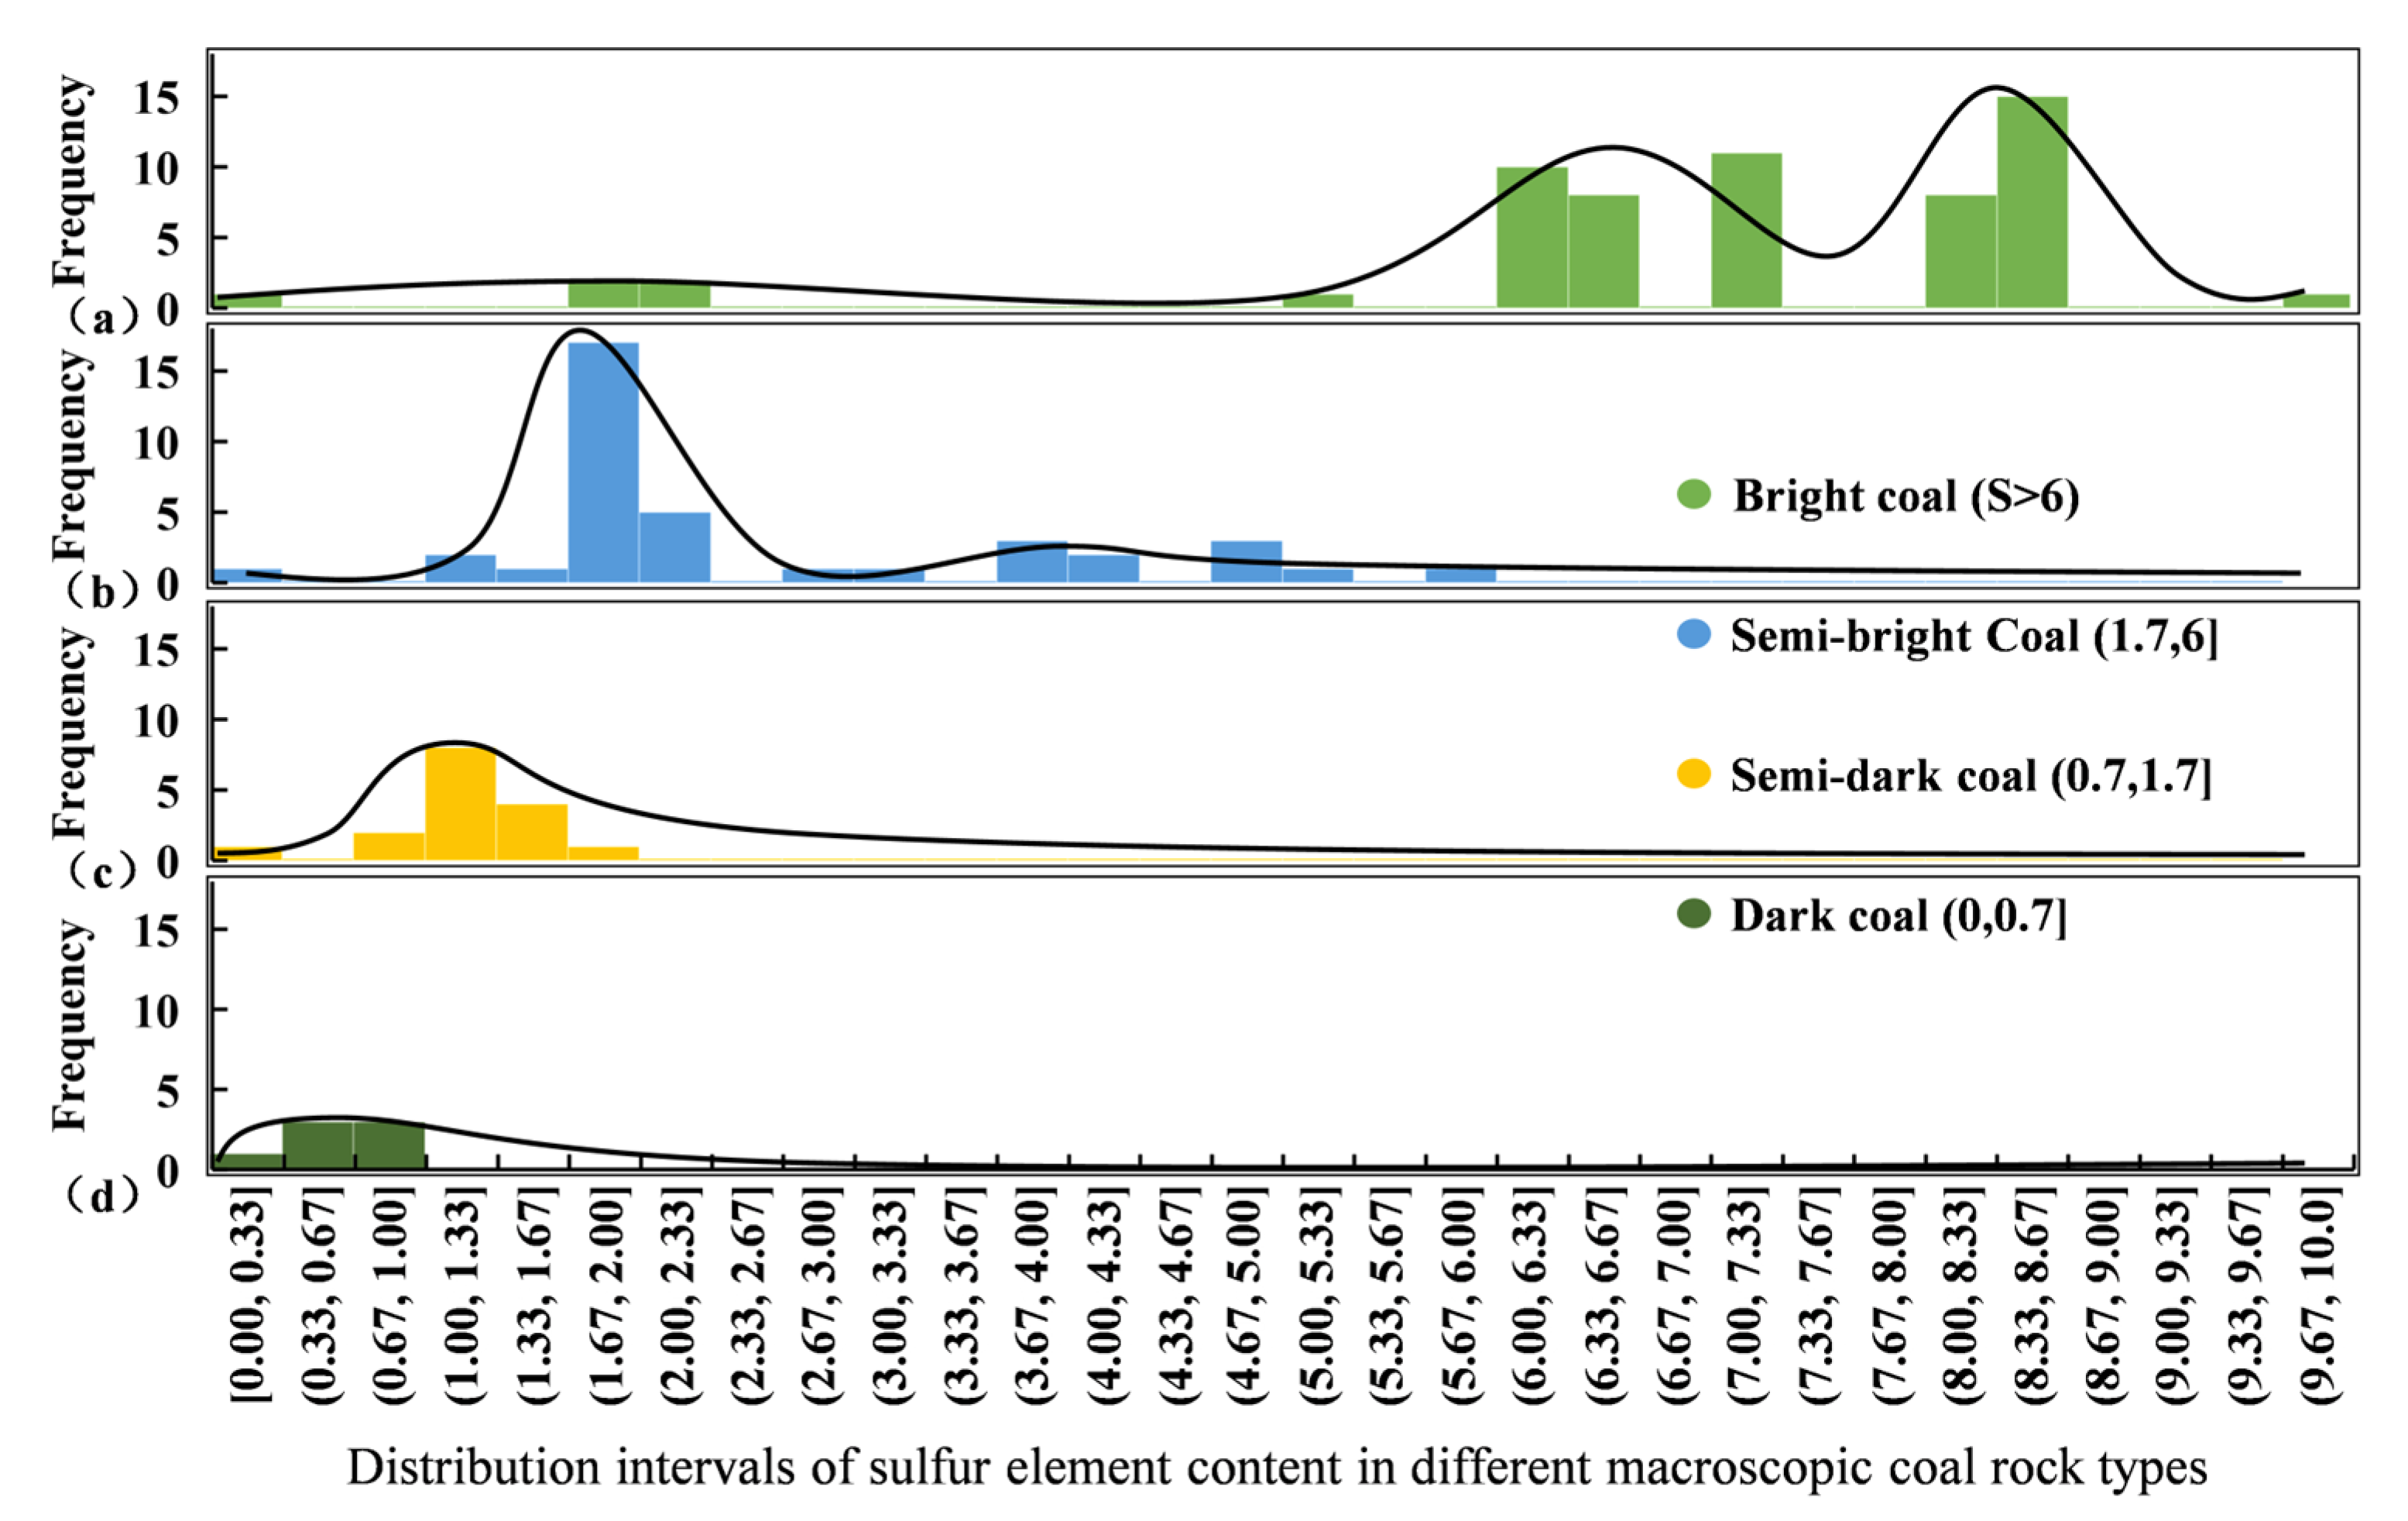
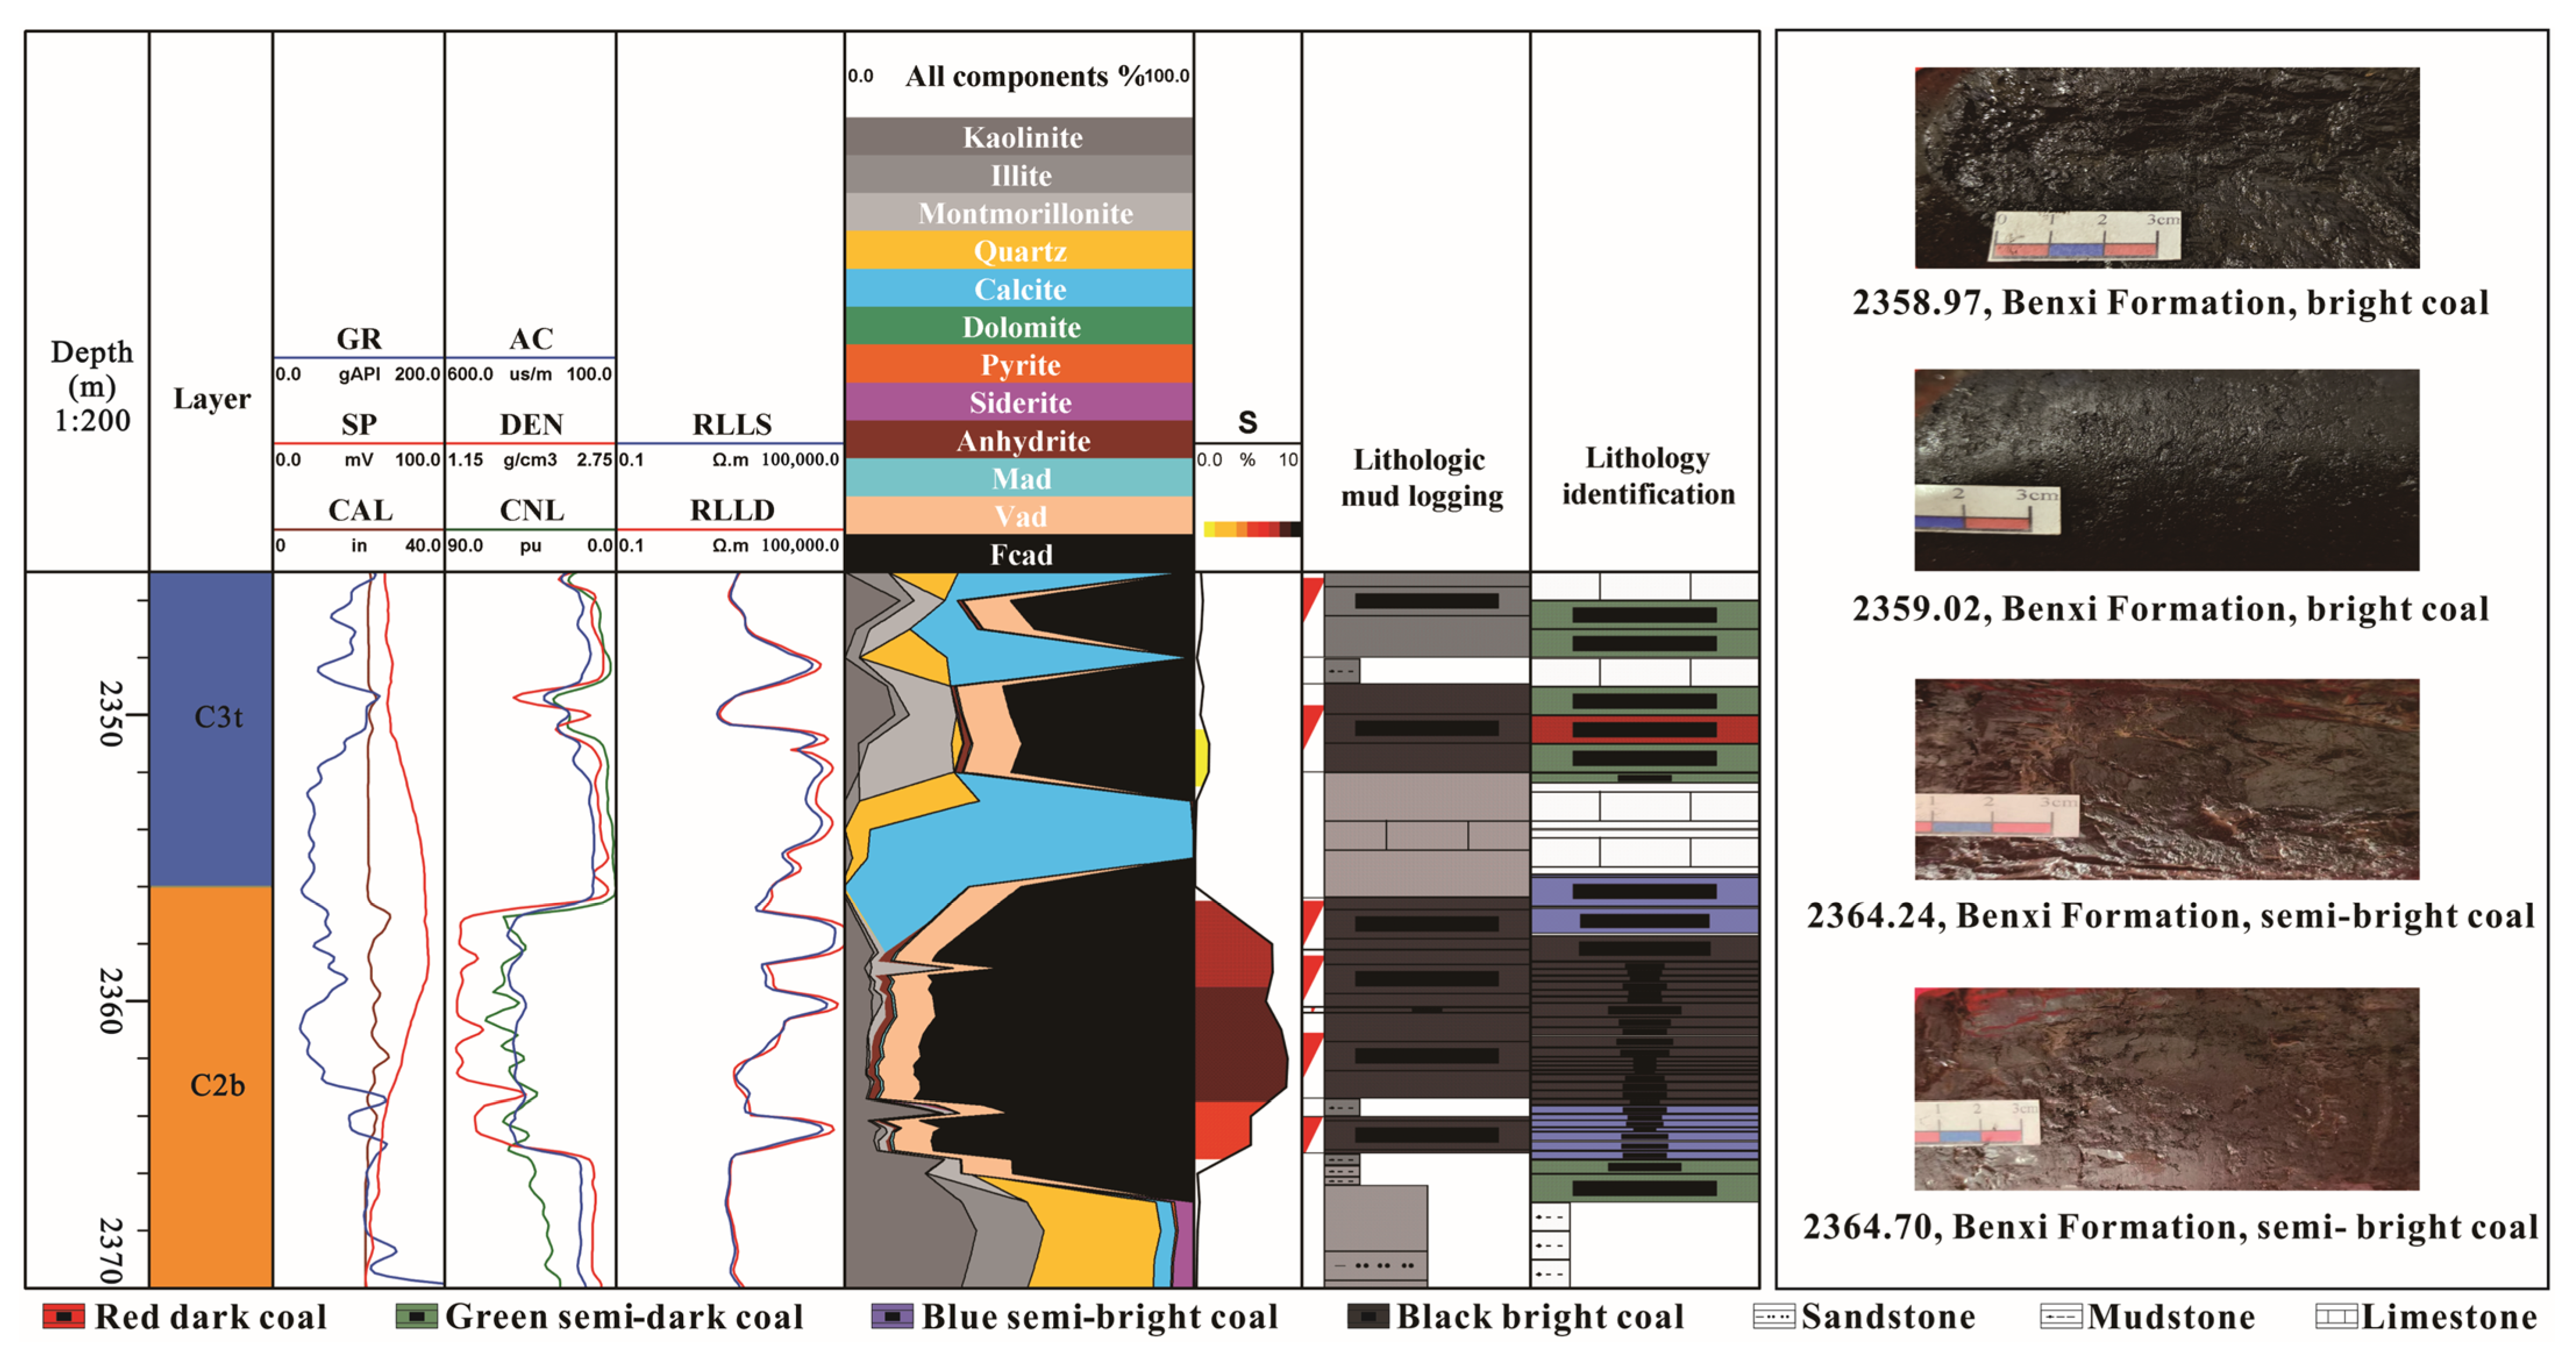
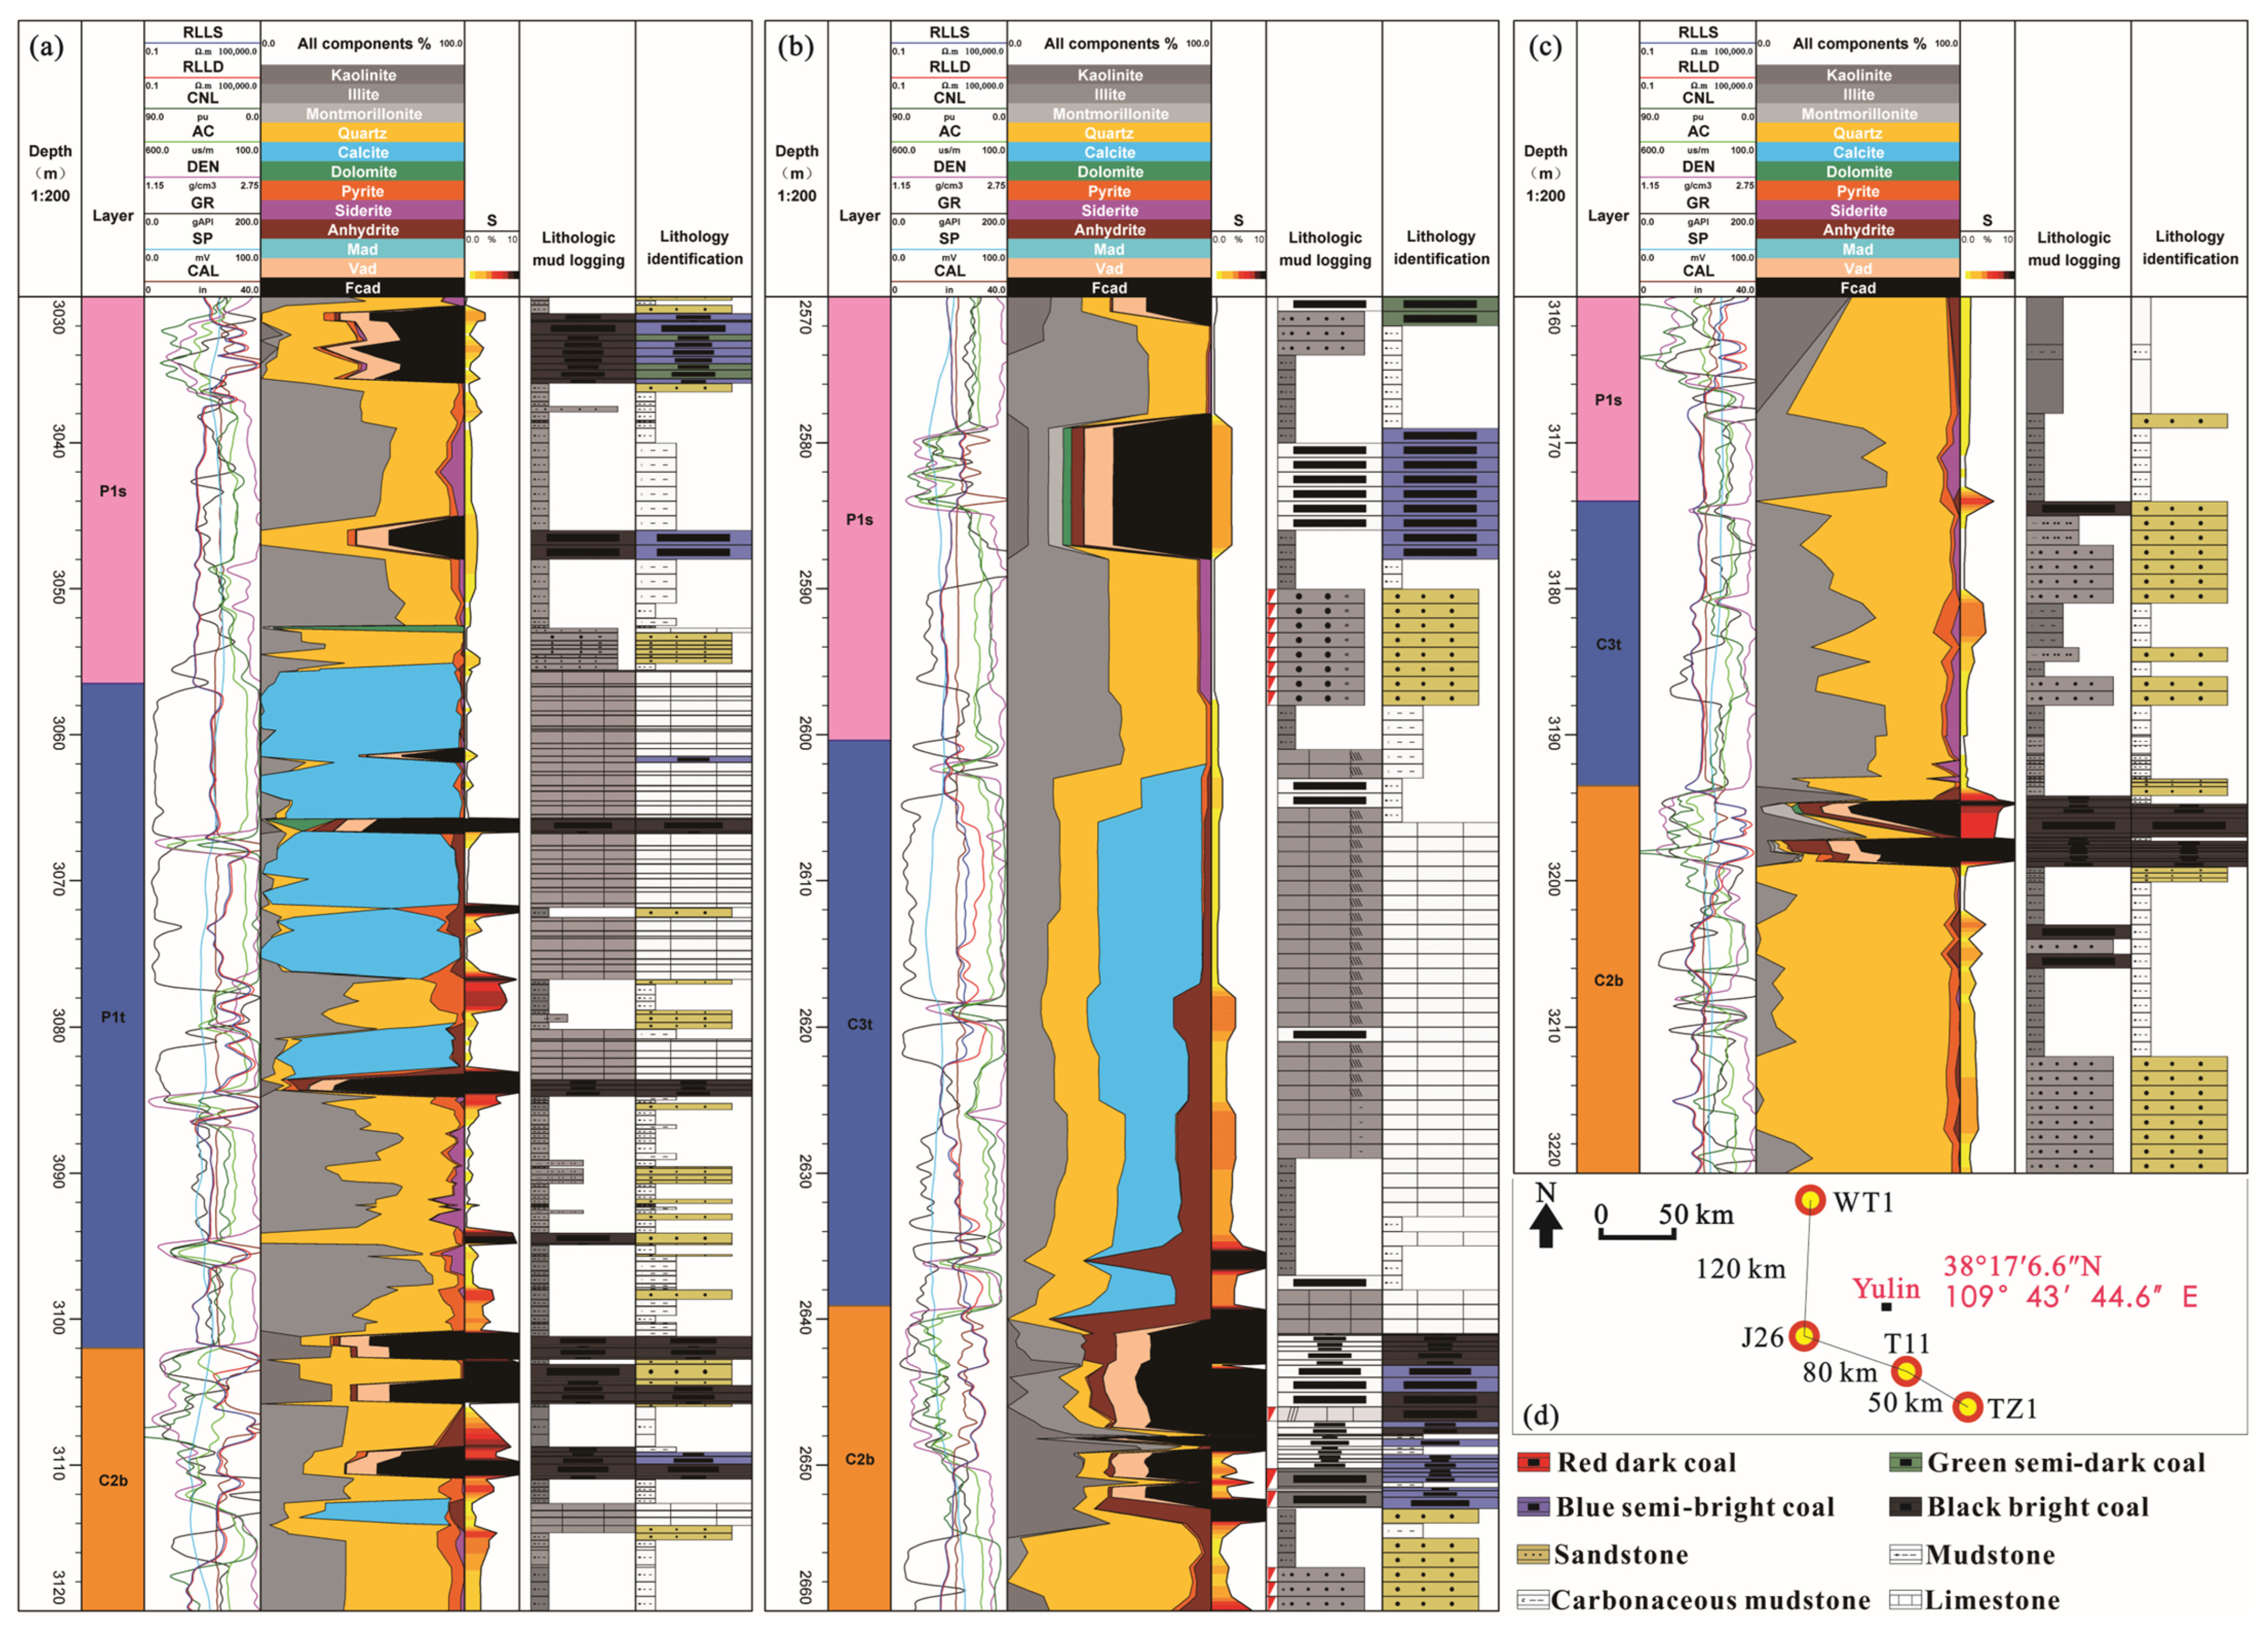
4.3. Lithologic Identification and Classification of Macroscopic Coal Lithotypes

The previous section divided the rock into non-coal and coal seams based on the coal-rock demarcation line and used different calculation methods for non-coal seams and coal seams to quantify the mineral content V n * and the content of proximate analysis components, V A a d * , V F C a d * , V V a d * , and V M a d * . Different identification methods will also be used for other input parameters for non-coal and coal seams. First, for non-coal seams, sandstone, mudstone, and limestone can be classified based on the calculated mineral content V n * and the triangular diagram of clastic rock classification (Figure 8a) [36]. For the lithological identification of non-coal seams, the minerals are integrated into clay minerals (Wcla) (Equation (17)), siliceous minerals (Wqfm) (Equation (18)), and carbonate minerals (Wcar) (Equation (19)), and to be able to cast points in the triangular diagram, it is necessary to normalize the three main classes of minerals to 100% (Equation (20)), WCLA (Equation (21)), WQFM (Equation (22)), and WCAR (Equation (23)).
The triangular diagram of the clastic rock method can only distinguish mudstone. Still, mudstone also includes carbonaceous mudstone, which mainly refers to the lithology between ordinary mudstone and coal seam in the coal-bearing measures. According to China’s evaluation standard for coal hydrocarbon source rock, those with TOC less than 6% are usually considered as mudstone, those with TOC between 6% and 40% are carbonaceous mudstone, and those with TOC more than 40% are coal seams (SY/T 5735-2019) [37]. However, because TOC data are scarce and unavailable for every well, there are significant limitations in classifying carbonaceous mudstone based on TOC. This study found that the S (sulfur) element strongly correlates with TOC (Figure 8b,c), so it is possible to further classify ordinary mudstone and carbonaceous mudstone based on S content. Based on the lithological statistics and the distribution interval of S element content, the S element content of carbonaceous mudstones is mainly greater than 1% (Figure 8d). In comparison, mudstones are less than 1% (Figure 8e), so mudstones with S element greater than or equal to 1 in mudstones in the study area are classified as carbonaceous mudstones in this paper (Equation (24)).
W c l a = V 1 * + V 2 * + V 3 * ,
W q f m = V 4 * ,
W c a r = V 5 * + V 6 * + V 9 * ,
W C A R + W Q F M + W C A R = 100 ,
W C L A = V 1 * + V 2 * + V 3 * V 1 * + V 2 * + V 3 * + V 4 * + V 5 * + V 6 * + V 9 *     100
W Q F M = V 4 * V 1 * + V 2 * + V 3 * + V 4 * + V 5 * + V 6 * + V 9 *     100
C A R = V 5 * + V 6 * + V 9 * V 1 * + V 2 * + V 3 * + V 4 * + V 5 * + V 6 * + V 9 *     100
N o n c o a l Sandstone : W Q F M 100 3 , W C L A < 50 , W C L A < 50 Limestone : W C A R 100 3 , W C L A < 2     100 3 , W Q F M < 50 Mudstone : W C L A 100 3 , W C L A < 50 , W C L A < 100 3 Carbonaceous   mudstone : W C L A 100 3 , W C L A < 50 , W C L A < 100 3 , S 1 ,
Coals must be classified into four macroscopic coal lithotypes: bright coal, semi-bright coal, semi-dark coal, and dark coal. Macroscopic coal types are categorized based on the brightness of the coal and its vitrinite content (GB/T 18023-2000) [38]. In bright coal, the bright component content (vitrain and clarain) is greater than 80%, and the vitrinite content is more than 80%. The bright component of semi-bright coal is 50%~80%, and the vitrinite content is 60%~80%. The bright component of semi-dark coal is 20%~50%, and the vitrinite content is 35%~60%. The bright component of dark coal is less than 20%, and the vitrinite content is less than 35% [39]. The traditional methods for classifying macroscopic coal lithotypes are usually based on three conventional logging curves: AC, DEN, and CNL. However, through statistical analysis, it is found that there are complex overlapping relationships between these three curves and macroscopic coal lithotypes. Therefore, it is rather challenging to identify macroscopic coal lithotypes based on conventional curves, and it is impossible to achieve this (Figure 9).
Similar to the classification methods of mudstone and carbonaceous mudstone, by analyzing the relationship between S element distribution intervals and macroscopic coal lithotypes, it was found that S element can also better distinguish macroscopic coal lithotypes, so this study carried out macroscopic coal lithotypes identification based on the S element content; the S element content interval (0, 0.7] was designated as dark coal, interval (0.7, 1.7) was defined as semi-dark coal, interval (1.7, 6] was selected as semi-bright coal, and interval >6 was designated as bright coal (Figure 10) (Equation (25)).
C o a l :   Y t o t a l < d e m a r c a t i o n   l i n e Bright   coal : S > 6 Semi bright   coal : S 1.7 , 6 Semi dark   coal : S 0.7 , 1.7 Dark   coal : S 0 , 0.7 .

4.4. Method Utilization and Impact Analysis

Based on the abovementioned method, lithology and macroscopic coal lithotype were identified on the TZ1 well (Figure 11). In the figure, “Lithology identification” is the lithology identification result of the method proposed in this study, and “Lithologic mud logging” is the lithology label for cuttings logging identification. The identification results are in good agreement with the cutting logging results. The identification of macroscopic coal lithotypes is also consistent with the results observed in the coring photos, with an accuracy of 84.56% (accuracy = the thickness of the same lithology/formation thickness; it also represents the number of layers with the same lithology in the total number of layers). To test if the described procedure can be generalized, Wells T11 (Figure 12a), J26 (Figure 12b), and WT1 (Figure 12c), which are far away from well TZ1, were processed. Among them, WT1 is farthest away from TZ1, about 210 km. The processing results show that the identified lithology corresponds well with the lithology of cuttings logging, and the accuracy reaches 87.23%, 86.54%, and 88.67%, respectively, with an average accuracy of 87.48%. The method constructed can provide technical guidance for the lithology identification of coal-bearing measures and the selection of target seams, and it can further promote the economic and efficient development of coalbed methane.

5. Conclusions

(1)
This study constructed the coal seam demarcation line and realized the division of non-coal seams and coal seams. It also established the transformation model between mineral components and proximate analysis components, and realized an accurate calculation with an average error of less than 10%.
(2)
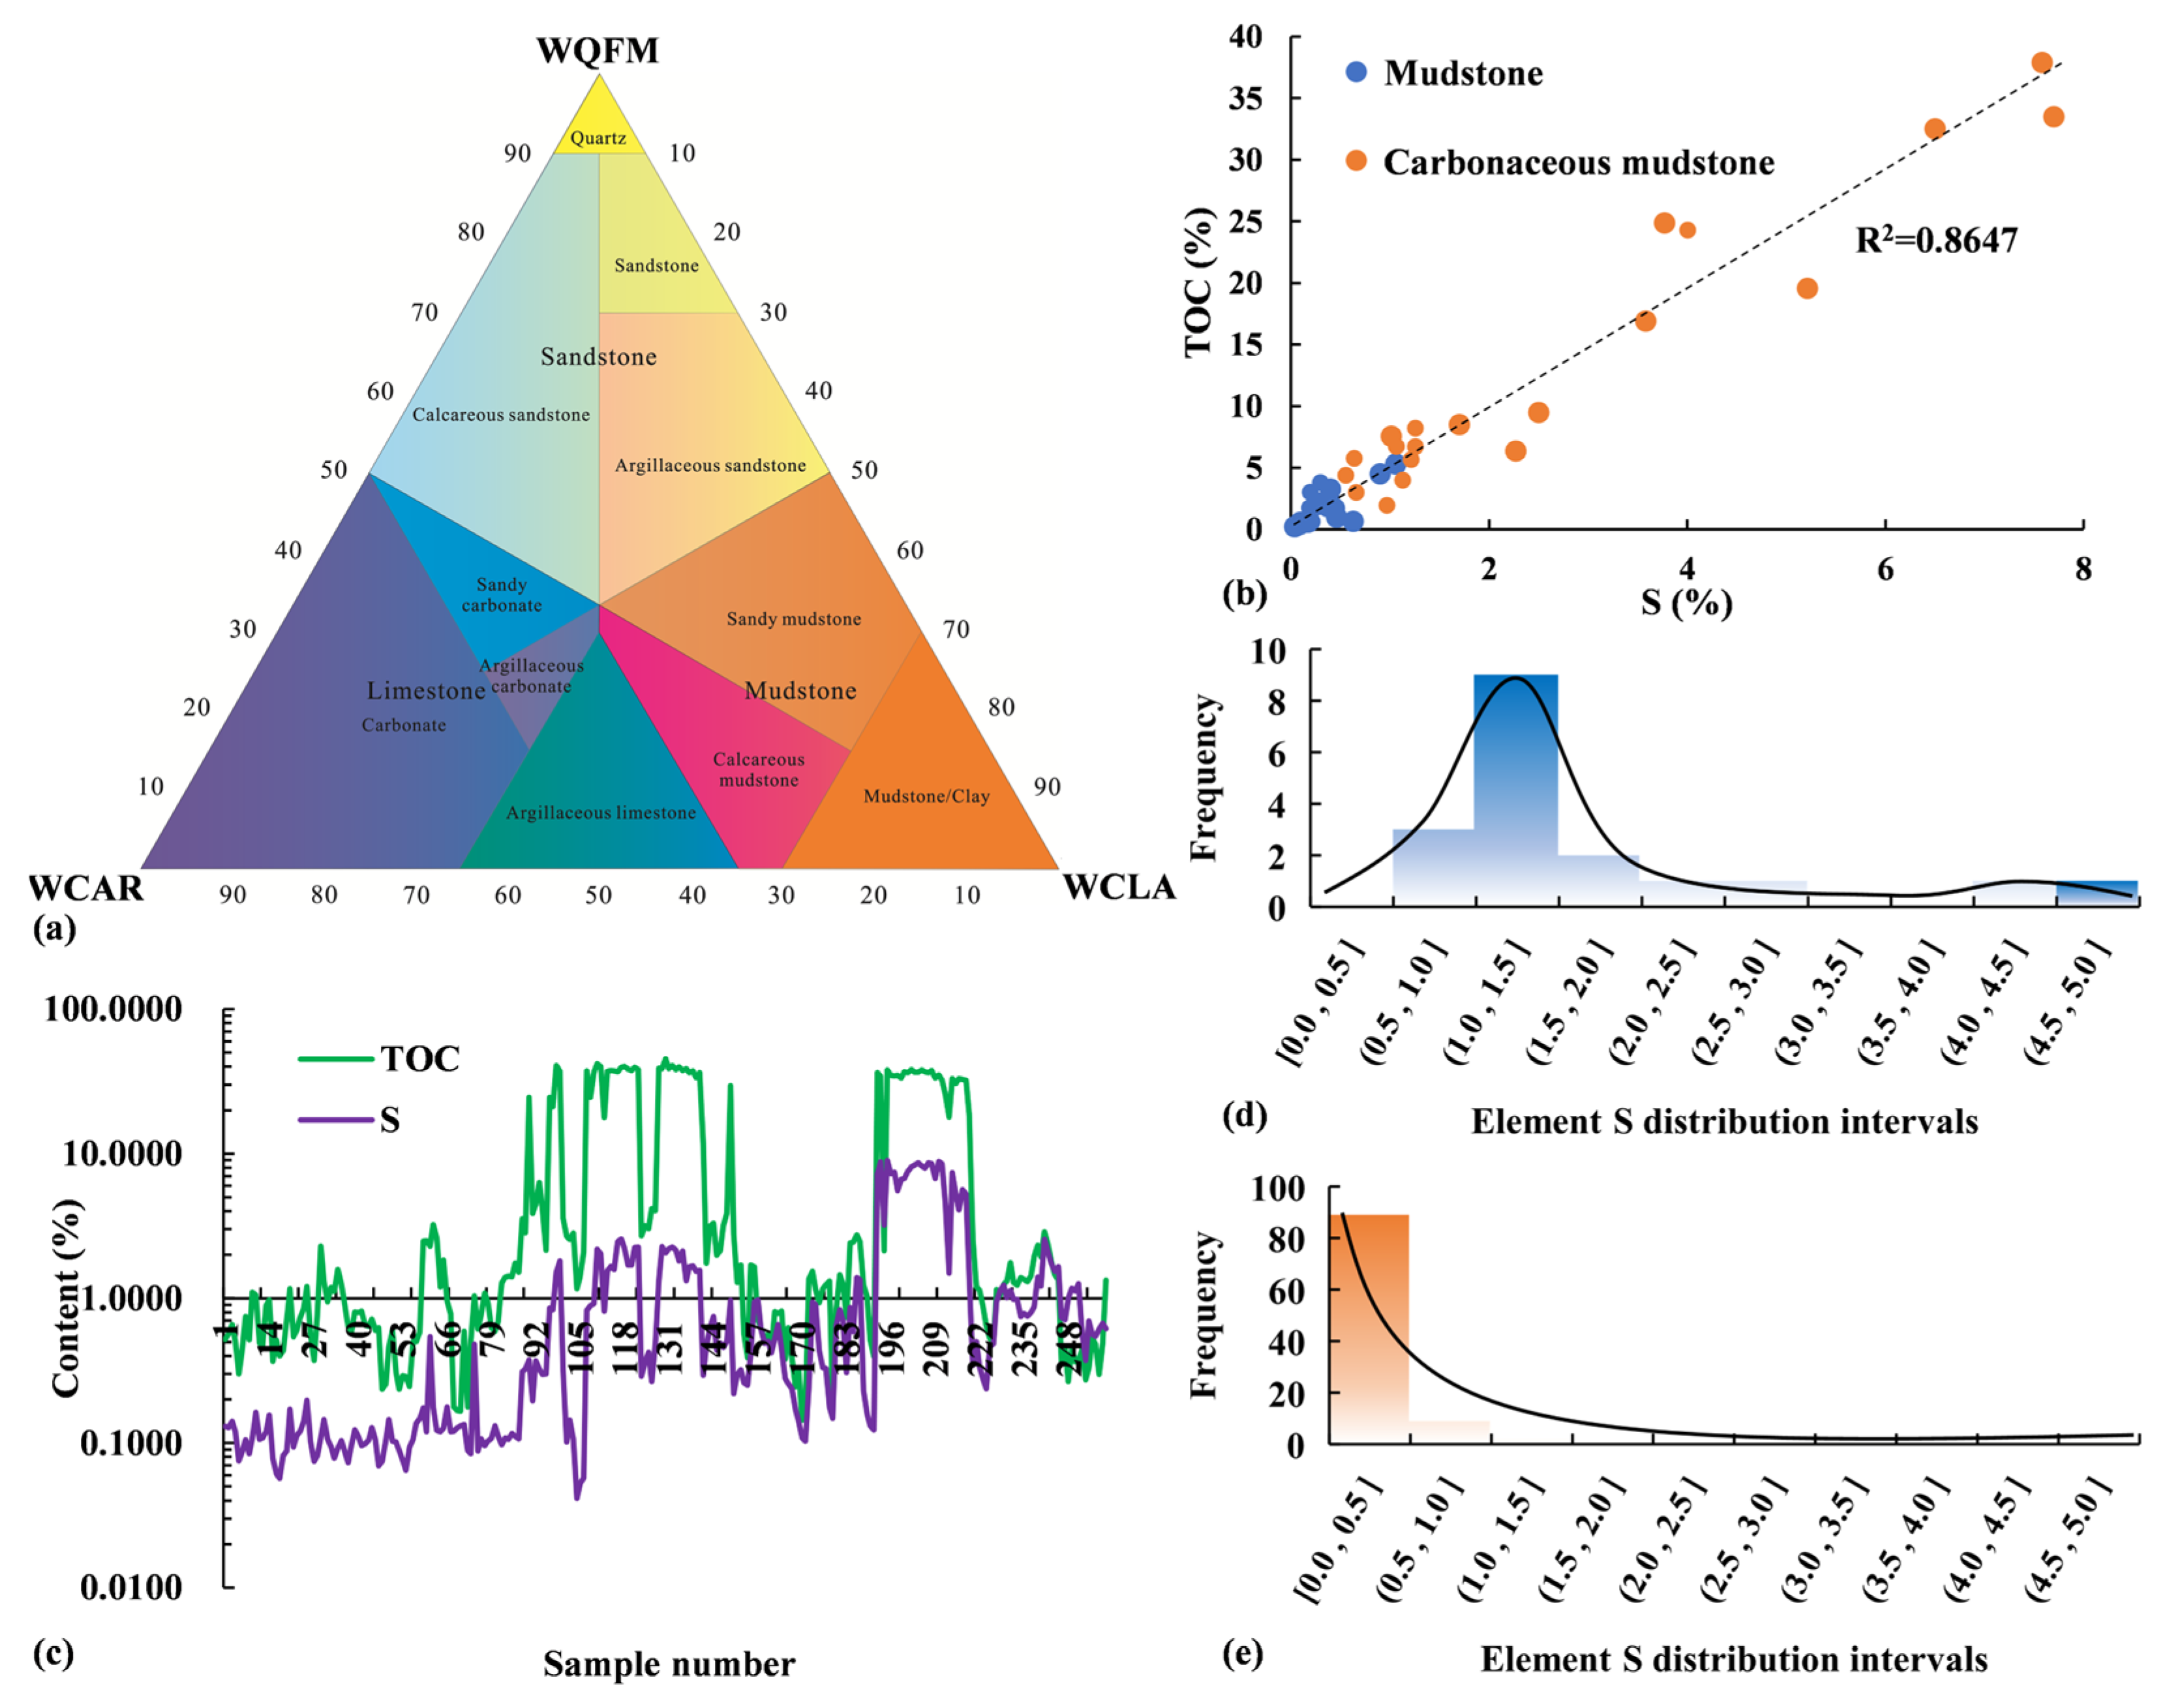
Conventional logging curve identification methods do not apply to the identification of non-coal seams lithology and macroscopic coal lithotypes in coal seams in the study area. In this study, based on analyzing the distribution characteristics of S elements, the classification and identification criteria were effectively established.
(3)
This paper provides a lithology and macroscopic coal lithotypes identification method based on element mud logging data, with an average identification accuracy of 87.48%, which has important guiding significance in the selection of coal seams in coal-bearing measures, development plan design, and improving the economic benefits of coalbed methane.

Author Contributions

Conceptualization, Y.L. and W.Z.; Methodology, W.Z. and F.L.; Software, M.Z. and H.S.; Formal analysis, Y.L., Z.Z., and J.S.; Data curation, S.Z.; Writing—original draft, Y.L.; Writing—review and editing, F.L. and J.S.; Supervision, Y.L., J.S. and R.W.; Funding acquisition, J.S. All authors have read and agreed to the published version of the manuscript.

Funding

This research was jointly supported by the National Natural Science Foundation of China (42474156) and the Science and Technology Service Project of Second Logging Branch, CNPC Bohai Drilling Engineering Company Limited (BHZT-LJ2-2024-JS-325).

Data Availability Statement

The original contributions presented in this study are included in the article. Further inquiries can be directed to the corresponding authors.

Conflicts of Interest

Authors Wenya Zhang, Mingyang Zhang, Honghua Sun and Zongsheng Zhou were employed by the CNPC Bohai Drilling Engineering Company Limited. Author Ruyue Wang was employed by the Sinopec Petroleum Exploration and Production Research Institute. The remaining authors declare that the research was conducted in the absence of any commercial or financial relationships that could be construed as a potential conflict of interest.

References

  1. Amobi, O.J.; Ekpo, M.I.; Emedo, O.C.; Udo, G.I.; Ogbodo, K.U. Coal chemistry, utilization potential, and coalbed methane (CBM) assessment of some coal deposits in Central Benue Trough, north-central Nigeria. Discov. Geosci. 2024, 2, 54. [Google Scholar] [CrossRef]
  2. Flores, M.R.; Moore, T. Coalbed gas: A review of research directions from the past to the future as facilitated by bibliomet-rics. Int. J. Coal Geol. 2025, 298, 104683. [Google Scholar] [CrossRef]
  3. Xu, F.; Hou, W.; Xiong, X.; Xu, B.; Wu, P.; Wang, H.; Feng, K.; Yun, J.; Li, S.; Zhang, L.; et al. The status and development strategy of the coalbed methane industry in China. Petro-Leum Explor. Dev. 2023, 50, 765–783. [Google Scholar] [CrossRef]
  4. Qu, P.R. Broad prospect of scale benefit development of deep coalbed methane in China. China Energy News, 4 November 2024; p. 8. [Google Scholar]
  5. Yao, P.; Zhang, J.; Lv, D.; Vandeginste, V.; Chang, X.; Zhang, X.; Wang, D.; Han, S.; Liu, Y. Effect of water occurrence in coal reservoirs on the production capacity of coalbed me-thane by using NMR simulation technology and production capacity simulation. Geoenergy Sci. Eng. 2024, 243, 213353. [Google Scholar] [CrossRef]
  6. Niu, X.; Fan, L.; Yan, X.; Zhou, G.; Zhang, H.; Jing, X.; Zhang, M. Enrichment conditions and resource potential of coal-rock gas in Ordos Basin, NW China. Pet. Explor. Dev. 2024, 51, 972–985. [Google Scholar] [CrossRef]
  7. Ma, L.; Ji, J.X. Sinopec accelerates research on deep coalbed methane. China Petrochemical News, 26 August 2024; p. 5. [Google Scholar]
  8. Liu, Y.J.; Lai, F.Q.; Zhang, H.J.; Tan, Z.; Wang, Y.; Zhao, X.; Tan, X. A novel mineral composition inversion method of deep shale gas reservoir in Western Chongqing. J. Pet. Sci. Eng. 2021, 202, 108528. [Google Scholar]
  9. Lai, F.Q.; Liu, Y.J.; Zhang, H.J.; Wang, H.T.; Mao, H.Y.; Zhang, G.T. Fracturing properties model of deep shale gas reservoir based on digital core simulation. J. China Univ. Pet. Ed. Nat. Sci. 2022, 46, 1–11. [Google Scholar]
  10. Liu, Y.; Lai, F.; Wang, R.; Wu, Z.; Zhang, X.; Xu, H.; Li, J. Influencing Factors of the Brittleness of Continental Shales Containing Shell Limestone Interlayer. Minerals 2023, 13, 460. [Google Scholar] [CrossRef]
  11. Bicca, M.; Kalkreuth, W.; Silva, T.; Guerra-Sommer, M.; Degani-Schmidt, I.; Felix, C.; Boardman, D.; Souza, P. Multiproxy-based evidence of wildfire occurrence in the Lower Permian coal-bearing Rio Bonito Formation, Paraná Basin, Brazil. Int. J. Coal Geol. 2025, 306, 104810. [Google Scholar] [CrossRef]
  12. Wang, D.H.; Liu, J.; Liu, Y.C.; Duan, Y.C.; Li, L.; Li, J.C.; Feng, B. Surface engineering of deep coal-rock gas development: Challenges and solutions. Nat-Ural Gas Ind. 2024, 44, 209–217. [Google Scholar]
  13. Wei, Q.; Chen, S.; Yi, W.; Gui, H.; Jiang, W.; Li, F.; Li, S. Gas content, geochemical characteristics and implications of coalbed methane from the Deep Area of Qi’Nan Coalmine in Huaibei Coalfield. Sci. Rep. 2024, 14, 28334. [Google Scholar] [CrossRef] [PubMed]
  14. Šoster, A.; Erlandsson, B.V.; Ajuaba, S.; Šmuc, N.R. Selective trace element uptake in iron sulfides during burial metamorphism of coal: Insights from the coal-bearing Socka Beds, Northeastern Slovenia. Int. J. Coal Geol. 2025, 306, 104805. [Google Scholar] [CrossRef]
  15. Li, B.; Guo, Y.; Hu, X.; Wang, T.; Wang, R.; Chen, X.; Fan, W.; Deng, Z. Pore Structure and Heterogeneity Characteristics of Deep Coal Reservoirs: A Case Study of the Daning–Jixian Block on the Southeastern Margin of the Ordos Basin. Minerals 2025, 15, 116. [Google Scholar] [CrossRef]
  16. Ghosh, S.; Chatterjee, R.; Shanker, P. Estimation of ash, moisture content and detection of coal lithofacies from well logs using regression and artificial neural network modelling. Fuel 2016, 177, 279–287. [Google Scholar] [CrossRef]
  17. Chen, B.; Li, S.; Tang, D.; Pu, Y.; Zhong, G. Evaluation of recoverable potential of deep coalbed methane in the Linxing Block, Eastern Margin of the Ordos Basin. Sci. Rep. 2024, 14, 9192. [Google Scholar] [CrossRef]
  18. Banerjee, A.; Mukherjee, B.; Sain, K. Machine learning assisted model based petrographic classification: A case study from Bokaro coal field. Acta Geod. Geophys. 2024, 59, 463–490. [Google Scholar] [CrossRef]
  19. Li, C.; Yang, Z.; Yan, X.; Zhou, G.; Wang, G.; Gao, W.; Liu, C.; Lu, B.; Liang, Y. Distribution Law of Occurrence State and Content Prediction of Deep CBM: A Case Study in the Ordos Basin, China. Nat. Resour. Res. 2024, 33, 1843–1869. [Google Scholar] [CrossRef]
  20. Maxwell, K.; Rajabi, M.; Esterle, J.; Tivane, M.; Travassos, D. Spatial modelling and classification of altered coal using random forest-based methods at Moatize Basin, Mozambique. J. Afr. Earth Sci. 2024, 215, 105279. [Google Scholar] [CrossRef]
  21. Yan, T.; Xu, R.; Sun, S.-H.; Hou, Z.-K.; Feng, J.-Y. A real-time intelligent lithology identification method based on a dynamic felling strategy weighted random forest algorithm. Pet. Sci. 2024, 21, 1135–1148. [Google Scholar] [CrossRef]
  22. Huo, F.; Li, A.; Zhao, X.; Ren, W.; Dong, H.; Yang, J. Novel lithology identification method for drilling cuttings under PDC bit condition. J. Pet. Sci. Eng. 2021, 205, 108898. [Google Scholar] [CrossRef]
  23. Mu, X.; Zhu, Y.; Dou, K.; Shi, Y.; Huang, M. Logging response prediction of high-lithium coal seam based on K-means clustering algorithm. Front. Earth Sci. 2024, 12, 1443458. [Google Scholar] [CrossRef]
  24. Ren, P.F.; Xu, H.; Tang, D.Z.; Li, Y.; Sun, C.; Tao, S.; Li, S.; Xin, F.; Cao, L. The identification of coal texture in different rank coal reservoirs by using geophysical logging data in northwest Guizhou, China: Investigation by principal component analysis. Fuel 2018, 230, 258–265. [Google Scholar] [CrossRef]
  25. Wu, Y.; Tao, S.; Bi, C.; Tang, S.; Men, X. Pore-fracture and permeability heterogeneity of different marcolithotypes of medium-rank coals in Jixi Basin, China. Geoenergy Sci. Eng. 2023, 231, 212395. [Google Scholar] [CrossRef]
  26. Chang, X.; Han, R.; Zhang, J.; Vandeginste, V.; Zhang, X.; Liu, Y.; Han, S. Prediction of Coal Body Structure of Deep Coal Reservoirs Using Logging Curves: Principal Component Analysis and Evaluation of Factors Influencing Coal Body Structure Distribution. Nat. Resour. Res. 2024, 34, 1023–1044. [Google Scholar] [CrossRef]
  27. Hussein, S.H.; Ondřej, B.; Howri, M.; Salahadin, S. Outcrop-to-subsurface correlation and sequence stratigraphy of a mixed carbonate–siliciclastic ramp using element geochemistry and well logging; Upper Cretaceous Kometan Formation, Zagros Foreland, NE Iraq. Sediment. Geol. 2024, 459, 106547. [Google Scholar] [CrossRef]
  28. Xia, W.; Tang, Y.; Li, G.; Yue, C.; Han, Y.; Wu, X.; Fan, S. Wellbore stability prediction method based on intelligent analysis model of drilling cut-tings logging images. Geoenergy Sci. Eng. 2025, 252, 213961. [Google Scholar] [CrossRef]
  29. Gan, Y.Y.; Zhang, K.L.; Yao, H.P. Discussion on potential joint mining of coal measures gases resources in Ordos area, Inner Mongolia. J. China Coal Soc. 2018, 43, 1661–1668. [Google Scholar]
  30. Zhao, Z.; Xu, W.; Zhao, Z.; Yi, S.; Yang, W.; Zhang, Y.; Sun, W.; Shi, Y.; Zhang, C.; Gao, J. Geological characteristics and exploration breakthroughs of coal rock gas in Carbonif-erous Benxi Formation, Ordos Basin, NW China. Pet. Explor. Dev. 2024, 51, 262–278. [Google Scholar] [CrossRef]
  31. Xu, F.Y.; Nie, Z.H.; Sun, W.; Xiong, X.Y.; Xu, B.Y.; Zhang, L.; Shi, X.S.; Liu, Y.; Liu, S.U.; Zhao, Z.P.; et al. Theoretical and technological system for Highly efficient development of deep coalbed methane in the Eastern edge of Erdos Basin. J. China Coal Soc. 2024, 49, 528–544. [Google Scholar]
  32. Li, Y.; Xu, F.Y.; Tang, S.H.; Wang, Y.B.; Meng, S.Z.; Xu, Q. Progress and development direction of coalbed methane (coal-rock gas) exploration and development in the Ordos Basin. Nat. Gas Ind. 2024, 44, 63–79. [Google Scholar]
  33. Grau, J.A.; Schweitzer, J.S. Elemental concentration from thermal neutron capture gamma ray spectra in geological for-mation. Nucl. Geophys. 1989, 2, 1–9. [Google Scholar]
  34. Huang, Q.J. Research on Inversion Mineral Method and Application by XRF. Master’s Thesis, China University of Petroleum (East China), Qingdao, China, 2020. [Google Scholar]
  35. Herron, M.M.; Herron, L.S. Geological applications of geochemical well logging. Geol. Soc. 1990, 48, 165–175. [Google Scholar] [CrossRef]
  36. Shan, Y.P.; Wang, H.J.; Zhang, L.J.; Bai, Z.H.; Sy, P.H.; He, Y.X.; Meng, W.K.; Liu, H.Y.; Cheng, M.W. The Principle and Fast Drawing of Ternary Plots and Their Application in Sandstone Classification. Acta Sedimentol. Sin. 2022, 40, 1095–1108. [Google Scholar]
  37. SY/T 5735-2019; Geochemical Method for Source Rock Evaluation. National Energy Administratio: Beijing, China, 2019.
  38. GB/T 18023-2000; Classification of Macrolithotype for Bituminous Coal. The State Bureau of Quality and Technical Supervision: Beijing, China, 2000.
  39. Li, C.; Yang, Z.; Tian, W.; Peng, L.; Liu, L.; Liu, C.; Lu, B.; Liang, Y.; Gu, J. Accurate Prediction of the Macrolithotype of a High-Rank Coal Reservoir by Logging Interpretation: A Case Study of the Junlian Block, Sichuan Province. Chin. Nat. Resour. Res. 2023, 32, 2289–2311. [Google Scholar] [CrossRef]
Figure 1. Ordos Basin tectonic pattern and comprehensive column diagram of strata (make revisions based on Reference [30]).
Minerals 15 00616 g001
Figure 2. Experimental analysis of lithology, mineral, and proximate analysis components. (a) Lithology statistics (b) Mineral types and contents; (c) Proximate analysis components analysis.
Minerals 15 00616 g002
Figure 3. Petrophysical volume model of coal seam in the study area.
Minerals 15 00616 g003
Figure 4. Schematic diagram of demarcation line between coal and non-coal seams. (a) The Y t o t a l distribution of all samples; (b) The Y t o t a l distribution of coal-rock and non-coal rock respectively; (c) Y t o t a l distribution statistics of coal rock (d) Y t o t a l distribution statistics of non-coal rocks.
Minerals 15 00616 g004
Figure 5. Regression calculation model between proximate analysis components. (a) The correlation between Aad and FCad; (b) The regression model between Aad and FCad; (c) The regression model between FCad and Vad; (d) The regression model between Aad + FCad + Vad and Mad.
Minerals 15 00616 g005
Figure 6. Calculation results of proximate analysis components in TZ1 well.
Minerals 15 00616 g006
Figure 7. Average absolute errors of calculated and experimental results.
Minerals 15 00616 g007
Figure 8. Lithology identification method of non-coal seam. (a) Lithology identification plate; (b) The correlation between S and TOC (c) The changing trends of S and TOC; (d) Distribution of S element in carbonaceous mudstone (e) Distribution of S element in mudstone.
Minerals 15 00616 g008
Figure 9. Identification of macroscopic coal lithotypes based on conventional curves. (a) Cross plot of DEN and AC; (b) Cross plot of DEN and CNL.
Minerals 15 00616 g009
Figure 10. Macroscopic coal lithotypes identification method. (a) The distribution of S element in bright coal (b) Distribution of S element in semi-bright coal (c) Distribution of S element in semi-dark coal (d) The distribution of S element in dark coal.
Minerals 15 00616 g010
Figure 11. Lithology identification results of TZ1 well.
Minerals 15 00616 g011
Figure 12. Lithology identification results. (a) Lithology identification results of WT1 well, (b) Lithology identification results T11 well. (c) Lithology identification results of J26 well. (d) Wells location map.
Minerals 15 00616 g012
Table 1. Table of mineral conversion coefficients in the study area.
MineralSiAlCaMgKFeS
Quartz0.4670.0000.0000.0000.0000.0000.000
Calcite0.0000.0000.3950.0040.0000.0000.000
Dolomite0.0000.0000.2130.1290.0000.0000.000
Siderite0.0000.0000.0000.0000.0000.4820.000
Kaolinite0.2100.2040.0010.0010.0010.0080.000
Illite0.2490.1050.0120.0120.0450.0480.000
Montmorillonite0.2640.0910.0130.0200.0060.0200.000
Pyrite0.0000.0000.0000.0000.0000.4660.535
Anhydrite0.0000.0000.2940.0000.0000.0000.240
Disclaimer/Publisher’s Note: The statements, opinions and data contained in all publications are solely those of the individual author(s) and contributor(s) and not of MDPI and/or the editor(s). MDPI and/or the editor(s) disclaim responsibility for any injury to people or property resulting from any ideas, methods, instructions or products referred to in the content.

