Article

Fluid Inclusion Evidence of Deep-Sourced Volatiles and Hydrocarbons Hosted in the F–Ba-Rich MVT Deposit Along the Zaghouan Fault (NE Tunisia)

1
Université Tunis El Manar, Faculté des Sciences de Tunis, El Manar Tunis 2092, Tunisia
2
Institut National de Recherche et d’Analyse Physico-Chimique (INRAP), Laboratoire des Matériaux Utiles, Technopole of Sidi Thabet, Tunis 2026, Tunisia
3
Dipartimento di Scienze Chimiche e Geologiche, Università degli Studi di Cagliari, Cittadella Universitariadi Monserrato, 09042 Monserrato, Italy
4
Instituto de Ciências da Terra (ICT), Departamento de Geociências, Ambiente e Ordenamento do Território (DGAOT), Faculdade de Cincias, Universidade do Porto, Rua do Campo Alegre, s/n, 4169007 Porto, Portugal
*
Author to whom correspondence should be addressed.
Minerals 2025, 15(5), 489; https://doi.org/10.3390/min15050489
Submission received: 21 January 2025 / Revised: 28 April 2025 / Accepted: 30 April 2025 / Published: 6 May 2025

Abstract

:
The Hammam–Zriba F–Ba (Zn–Pb) stratabound deposit is located within the Zaghouan Fluorite Province (ZFP), which is the most important mineral sub-province in NE Tunisia, with several CaF2 deposits occurring mainly along the Zaghouan Fault and corresponding to an F-rich MVT mineral system developed along the unconformity surface between the uppermost Jurassic limestones and the late Cretaceous layers. Petrographic analysis, microthermometry, and Raman spectroscopy applied to fluid inclusions in fluorite revealed various types of inclusions containing brines, oil, CO2, and CH4 along with solid phases such as evenkite, graphite, kerogen and bitumen. Microthermometric data indicate homogenization temperatures ranging from 85 °C to 145 ± 5 °C and salinities of 13–22 wt.% NaCl equivalent. This study supports a model of heterogeneous trapping, where saline basinal brines, oil, and gases were simultaneously trapped within fluorite, which indicates fluid immiscibility. The Raman analysis identified previously undetected organic compounds, including the first documented occurrence of evenkite, a mineral hydrocarbon, co-genetically trapped with graphite. The identification of evenkite and graphite in fluid inclusions offers new insights into the composition of hydrocarbon-bearing fluids within the MVT deposits in Tunisia, contributing to an understanding of the mineralogical characteristics of these deposits. The identified hydrocarbons correspond to three oil families. Family I (aliphatic compounds) is attributed to the lower-Eocene Bou-Dabbous Formation, family II (aromatic compounds) is attributed to the Albian Fahdene Formation and the Cenomanian–Turonian Bahloul Formation, and family III is considered as a mixture of aliphatic and aromatic compounds generated by the three sources. The presence of graphite in fluid inclusions could suggest the involvement of a thermal effect from deep-seated sources through the reservoir to the site of fluorite precipitation. These findings suggest that the fluorite mineral system might have been linked with the interaction of multi-reservoir fluids, potentially linked to the neighboring petroleum system in northeastern Tunisia during the Miocene. This study aims to investigate the composition of fluid inclusions in fluorite from the Hammam–Zriba F–Ba (Zn–Pb) deposit, with a particular focus on the plausible sources of hydrocarbons and their implications for the genetic relationship between the mineralizing system and petroleum reservoirs.

Graphical Abstract

1. Introduction

Sediment–hosted Pb–Zn–Ba–Sr–F deposits in northern Tunisia, located within the Mediterranean region, have been extensively studied due to their historical significance and the impact of the mining activities [1,2,3]. Among these deposits, the Zaghouan Fluorite Province (ZFP) in the northeastern Tunisian Atlas hosts a fluorite-rich Mississippi Valley-Type (MVT) deposit [2,3,4,5,6]. These deposits share many similarities with multiple MVT fluorite-bearing deposits worldwide, such as those in the USA [7], Great Britain [8], Mexico [9], and Western Europe [10]. The Hammam–Zriba deposit is considered one of the major fluorite sources in North Africa, with estimated reserves of 15 Mt containing 30%–70% fluorite, and less than 5% Pb and Zn. These deposits were exploited for fifteen years, starting in 1981, by the SOTEMI and FLUOBAR companies [1].
The Tethyan region is known as a major petroleum province where tectonic evolution and paleogeography have directly controlled ore deposition and the formation of important elements in Mesozoic petroleum systems. However, there is limited information regarding the specific characteristics of HCFIs in the Tunisian MVT deposits.
In recent years, the study of HCFIs has developed as a powerful method for deciphering the properties of organic-rich phases and carbonaceous substances. This method has been successfully applied in various geological settings, including sedimentary basins, e.g., [11], and MVT deposits, e.g., [9,12,13,14,15]. HCFIs are important in deciphering fluid evolution in MVT systems, as they record interactions between basinal brines (connate waters) and hydrocarbons. Studies have demonstrated that HCFIs play a role in hydrothermal fluid evolution, hydrocarbon maturation, and the link between mineralization and petroleum systems e.g., [16,17,18,19,20]. Understanding their composition is essential for reconstructing fluid migration pathways.
Oil occurrences associated with fluorite mineralization in northern Tunisia have been documented since 1967, e.g., [1,4,21,22,23]. Various types of aqueous, carbon-rich and HCFIs have been described in several MVT fluorite deposits, including those at the F–(Ba–Pb–Zn) deposit in Jebel Kohol [24], the Jebel Stah F deposit [2], and the Jebel Oust and Sidi Taya F–Ba–(Zn–Pb) deposits [3,25] (Figure 1).
Fluid inclusion analyses, including microthermometry and crush–leach bulk chemistry, performed on minerals from different deposits in the Zaghouan district e.g., [2,4], identified hydrothermal fluids that are highly saline (12–34 wt.% NaCl equivalent) and rich in Na- and Ca-chlorides, with moderate to hot temperatures ranging from 100 to 250 °C. The average homogenization temperatures (Th) and salinities (S) of fluid inclusions in fluorites from ore deposits in northeastern Tunisia are presented in Table 1. Geothermometric data suggest an average reservoir temperature of approximately 275 ± 25 °C [4].
Table 1. Mean homogenization temperatures (Th) and salinities (S) of the fluid inclusions in fluorites from ore deposits in northeastern Tunisia.
LocalityFluorite GenerationMean Th ± 5 (°C)Mean Salinity ± 1 (wt.% eq. NaCl)Reference
Jebel Stah113019.5[2,4]
217510
Hammam–Zriba112513[1]
213515
317017
Sidi Taya-13019.5[26]
Jebel Mecella-13818.75[27]
Jebel Oust-20232[4]
Oued M’tak-120–14014–17[27]
However, comprehensive chemical analyses of HCFIs in Hammam–Zriba and the entire ZFP remain limited [28,29,30,31,32]. These investigations [28,29,30,31] using microthermometry combined with GC–MS, FT–IR, and micro-spectrometry mapping revealed that CH4 is the predominant component in the vapor phase, while aliphatic compounds and CO2 dominate the liquid phase in HCFIs. Light oils containing aliphatic compounds ranging from C8 to C35 were detected, with C14 being the most abundant, whereas n-alkanes with carbon chains longer than C20 were absent. Additionally, a large amount of H2O is present as an immiscible phase, whereas CO2, CH4, and hydrocarbons are absent in aqueous-rich FIs. Notably, aromatic compounds were not detected. A recent study by Han et al. [32] revealed that certain compound classes, specifically hydrocarbons, and several subclasses (O1, O2, S1) of nitrogen (N), sulfur (S), and oxygen (O)-containing compounds (NSOs) are typically dominant in the oil-bearing fluid inclusions. Carbon atoms ranged from 15 to 41 or 45 with a maximum at C29.
This paper reviews and confirms the data previously published on the petrography and microthermometry of aqueous and hydrocarbon inclusions in the Hammam–Zriba fluorites. To further investigate the compositions of these FIs, we applied Raman Micro–Spectroscopy (RMS) to characterize co-genetic aqueous-rich FIs and HCFIs in fluorite from the Hammam–Zriba deposit. Accurate analysis revealed previously undetected organic compounds, including a mineral hydrocarbon, which was co-genetically trapped.
The presence of hydrocarbons in fluorite may be an indication of fluid migration during oil production and migration pathways. This suggests a relationship between the hydrocarbons identified in fluorite and the regional petroleum systems in northeastern Tunisia during the Miocene. Instead, the consistent oil–fluorite association observed in the ZFP serves as evidence for a late Miocene age of these deposits. This coincides with the main phase of oil migration in the Tunisian petroleum basins [33]. It has been suggested that the coeval migration of oil- and fluorite-prone fluids occurred in the ZFP e.g., [1,24], implying that all Tunisian fluorite deposits share the same formation age. In this context, several studies have shown that fluorite, especially in MVT deposits, is often associated with petroleum systems through hydrothermal fluid circulation, e.g., [34]. Fluid inclusion studies have further confirmed the presence of hydrocarbons in fluorite from various MVT deposits, suggesting a temporal and spatial relationship between oil migration and mineralization events, e.g., [9].
This contribution reports the presence of abundant HCFIs in fluorite from the ZFP, a feature that has received limited attention in previous studies. This paper aims to establish a correlation between the occurrence of HCFIs in fluorites from the ZFP and the potential sources and processes of these components. Additionally, their relationship with the regional petroleum system have been explored. Moreover, the identification of hydrocarbon minerals in these inclusions represents a novel finding, as it has not been previously documented in MVT fluorite-rich deposits. The co-genetic trapping of organic minerals alongside hydrocarbon fluids suggests mineral formation and hydrocarbon migration occurred simultaneously. This finding implies that organic fluids were present during fluorite formation. Then, the original organic matter (OM) in sedimentary environments may be associated with the hydrocarbon-rich fluids associated with MVT mineralization. Additionally, the trapped organic minerals reflect the complexity of fluid evolution, including multi-phase interactions between different reservoirs. This perspective indicates how basinal brines (connate waters) and hydrocarbons could interact, contributing to the trapping of these fluids within fluorite. These connate waters may have acted as conduits for hydrocarbon migration, by promoting the flow of organic-rich fluids through the underlying rock layers.

2. Geological Setting

2.1. Regional Geology and Tectonic Events

Northern Tunisia is composed of two main geological regions: the allochthonous Tellian and autochthonous Atlas foreland. These sectors form the eastern border of the Maghreb fold-thrust belt (Figure 2A). This belt consists of Triassic and Mio–Pliocene series. Northern Tunisia belongs to the Maghrebian Alpine belt, which is oriented E–W for more than 2000 km, from Morocco to eastern Algeria. It extends farther northeast from Tunisia to Sicily. This belt, as part of the Alpine chain, resulted from the Paleogene–Neogene collision between North Africa and the Meso-Mediterranean plate, forming the Tunisian Atlas domain [35]. This domain features a complex fold belt [35] dominated by a transpressive component, including large NE–SW sinistral–reverse strike–slip structures, such as the Zaghouan Fault (ZF), the Cap Serrat–Gardimaou fFaults, and the El Alia–Teboursouk fFaults (Figure 2B) [36]. Other major faults are oriented E–W, N–S [35], and NW–SE [36,37]. NW–SE plate convergence is continuing at present [38]. For a comprehensive overview of the geological history of Tunisia, including Tethyan rifting, tectonic compression, and extensional events, readers are referred to the previous works, e.g., [25,36,39,40,41,42,43,44,45,46,47].
The Pb–Zn–Ba–Sr–F ore deposits in the ZFP are associated with a NE striking tectonic feature known as the ZF (Figure 2B). This fault has an estimated vertical offset of 4000 to 5000 m [48], and an important lateral component, extending over 80 km from Jebel Bou–Kornine at the northern edge to Jebel–Bargou at the southern edge. This fault is associated with detached Jurassic limestone massifs (e.g., Jebel–Ressas and Jebel–Zaghouan) and with injected Triassic salt diapirs (Figure 2B). The ZF is linked to deep geological structures within the basin [41] and is considered one of the major features related to regional basin diapirism. Triassic rocks consist of 3000 m thick evaporite deposits, including gypsum, anhydrite, halite, clays, black dolostone, and subordinate basalts. These deposits unconformably cover a thick Paleozoic substratum of organic-rich shales and carbonates [49]. The ZF has been active since the early Jurassic and has controlled the formation of NE–SW-striking structures. Early Mesozoic compression stage caused the formation of marine sub-basins that existed throughout the Mesozoic and Cenozoic. This tectonic activity led to variations in sediment thickness and changes in sedimentary facies across these basins [41].
The lithostratigraphic section (Figure 3) consists mainly of carbonates, shales, and siliciclastic rocks of Triassic to Miocene age. The ZFP is bordered eastward by a complex aquifer system dated from the Miocene to the present. This aquifer is controlled by a major graben, and is connected to a collapsed basin that formed during the Miocene [50]. The deep structure of the Zaghouan collapse basin reveals fault-propagation folds that formed during compressive events in the late Miocene and Plio–Quaternary periods [51]. These folds, which are associated with the foreland of the Zaghouan Thrust Belt [44,52], have been identified in petroleum wells and a seismic profile [51,53].
Figure 2. (A) Geological and geodynamic setting of the study area at the southern margin of the Mediterranean Sea [54]. (B) Simplified tectonic and metallogenic map of central and northern Tunisia [46,55,56].
Minerals 15 00489 g002
Figure 3. Synthetic lithostratigraphic column of the Hammam–Zriba deposit (modified from [56]; adapted from [43]).
Minerals 15 00489 g003

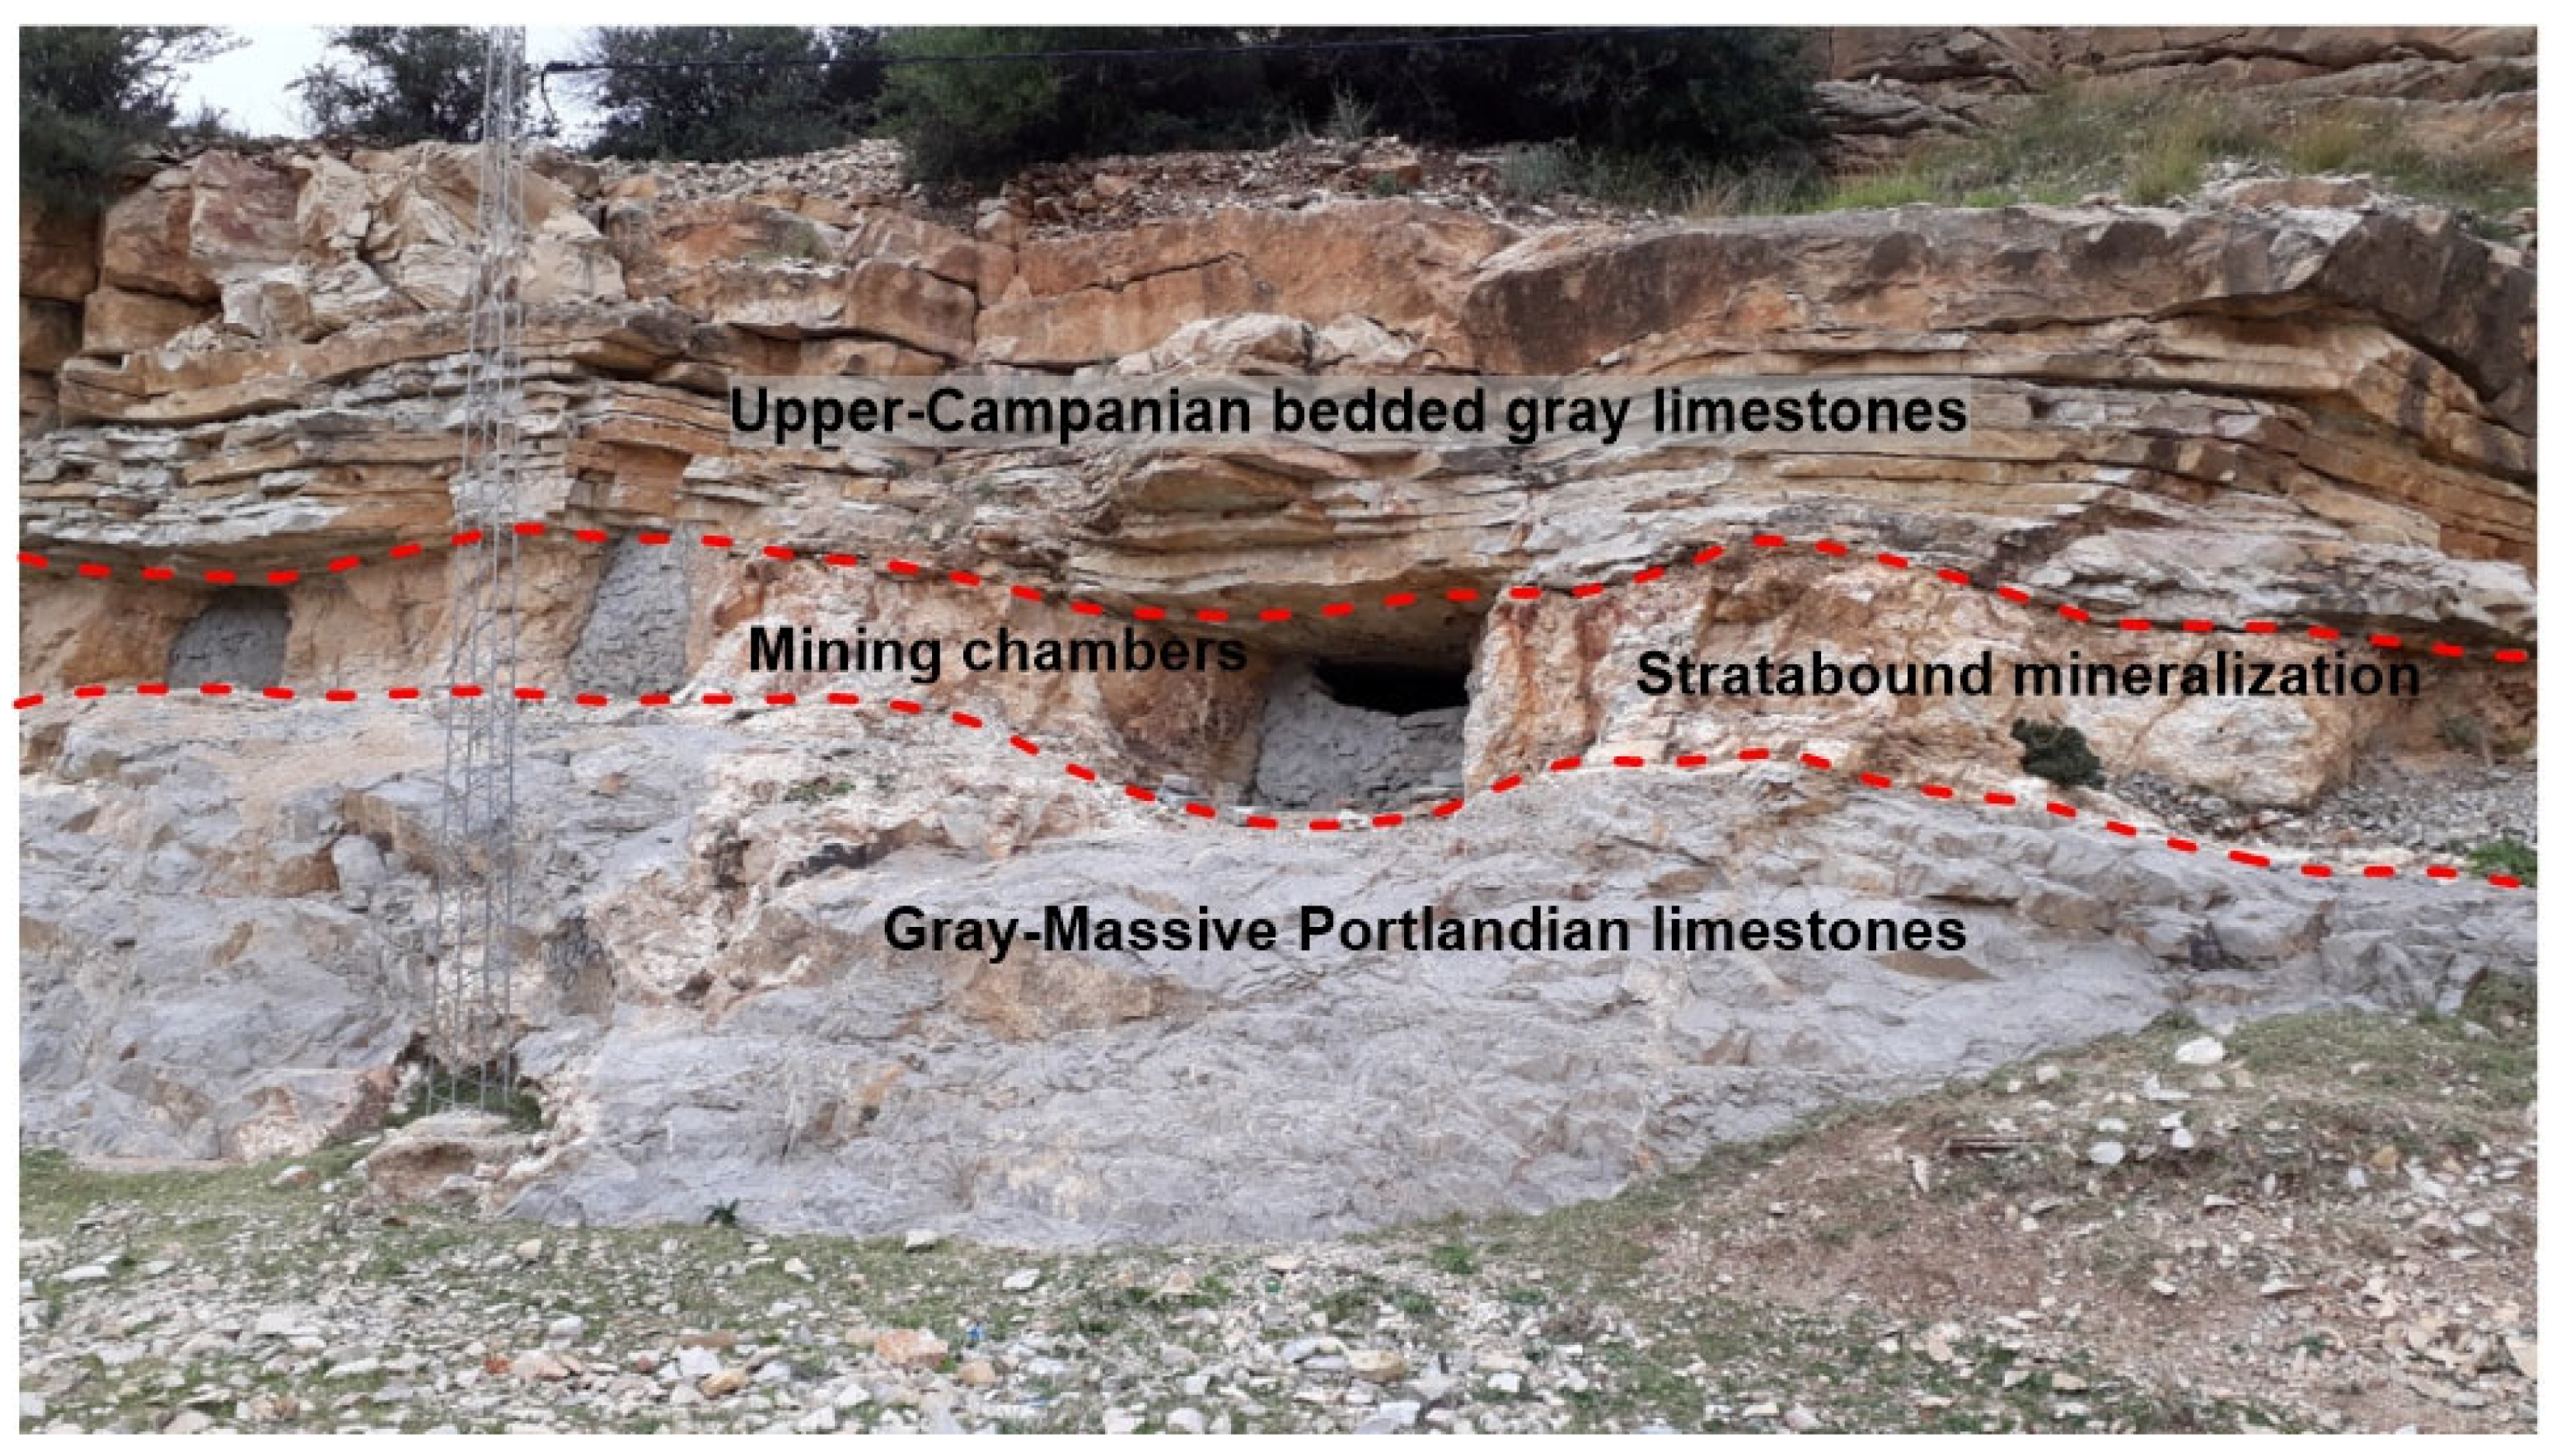
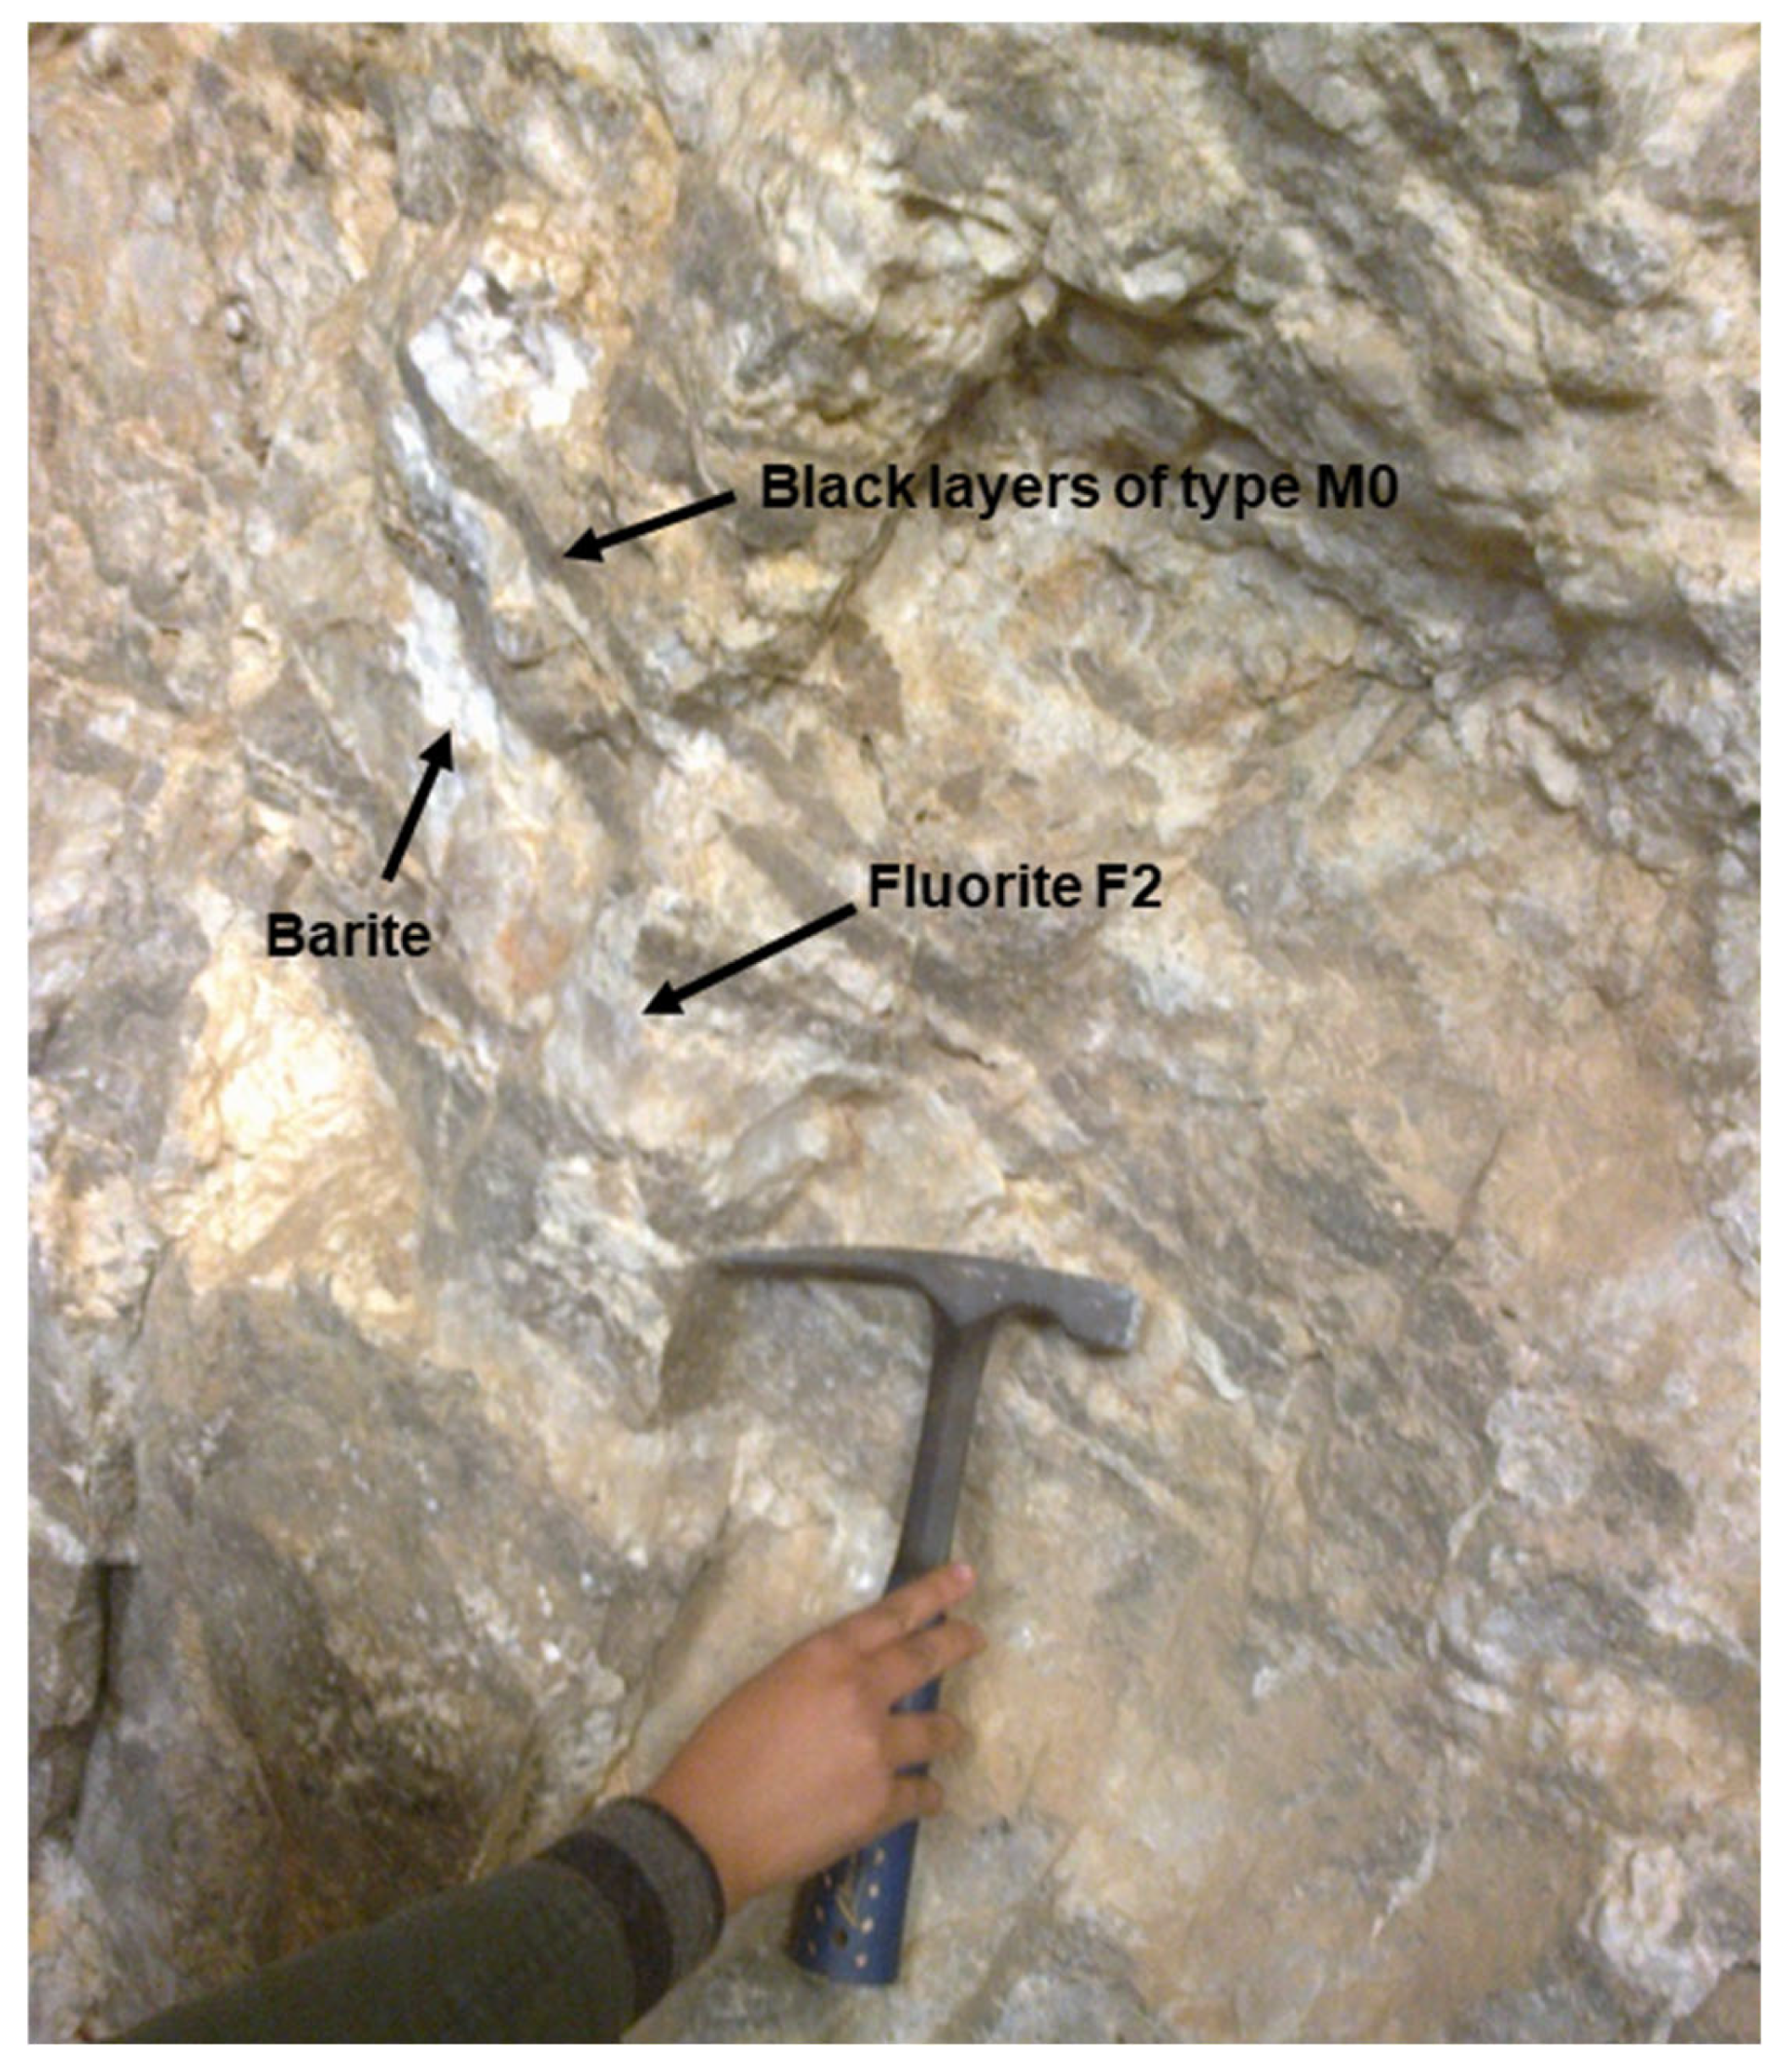
2.2. Study Area: Geology and Ore Deposits

The local geology of the study area is marked by a NNW–SSE-striking horst, bounded by two major fault systems. The first fault, oriented N135°E to N145°E, dips between 50° and 70° to the NE, while the second fault, oriented N130°E to N150°E, dips between 50° and 70° to the SW [57]. The stratigraphy consists of sedimentary rock sequences dated between the Tithonian and the late Eocene. A significant stratigraphic gap exists between the Berriasian and the middle Campanian, which is attributed to an emersion period [58,59].
The F–Ba– (Zn–Pb) mineralization occurs along the unconformity between the limestones of the Ressas Formation (Kimmeridgian–Tithonian–Berriasian) and the limestones of the Abiod Formation (upper–Campanian). It is hosted either within the Campanian silico–phosphatic matrix as a banded–stratiform orebody (Figure 3 and Figure 4) or as veins cutting through the Ressas Formation. The Ressas Formation consists of gray massive oolitic and bioclastic limestones with benthic foraminifera, algae, rudist debris, and silex fragments.
The mineral deposit in this area has a distinctive composition, with over 85% fluorite and celestobarite (Sr,Ba)SO4. The mineralization is composed of the following minerals in order of abundance: up to 40%–45% celestobarite, 15%–35% fluorite, 10%–40% quartz, 5%–15% sphalerite, galena, and pyrite, and only 2%–10% calcite [1,60]. SEM–EDS analysis [61] highlighted the presence of accessory sulfides (galena and sphalerite) and sulfate minerals such as anglesite and zincosite. Additionally, secondary minerals, such as smithsonite, fluorapatite, hemimorphite, willemite, and benauite were detected. Calcite and quartz are the main gangue minerals.
Previous studies by [1,59,60,62] identified two stages of mineralization: a syngenetic ore (M0) stage and an epigenetic stage for fluorite deposition. The epigenetic stage includes three main types of fluorites (F1, F2 and F3). Type M0 mineralization is early and does not contain fluorite. It occurs as concordant clusters under two facies, respectively siliceous and barytic. This stage is made of quartz and barite accompanied by sulfides, with sphalerite being the dominant sulfide mineral, followed by galena.
The first facies consists of finely bedded dark gray to black sediments with 70 to 90% quartz, 5 to 10% barite, 1 to 3% blend, galena, and pyrite. It also holds debris of green marls associated with phosphate residues. Under the microscope, the black quartz crystals appear to be associated with organic matter and carbonates and sometimes alternate with barite-rich beds. The second facies is made up of a compact association of fibro-radiated spherulitic barite (2–6 mm). The openings and micro-cracks within this facies are filled by residues of black clays, phosphates, and sulfides (blend and galena).
The main ore is associated with the banded stratabound orebody (Figure 5 and Figure 6), which consists of epigenetic barite and fluorite (F1). These minerals replace the early diagenetic dark matrix (M0). Subsequent mineralization stages occur as coarse fluorite within veins and karsts (F2) and as geodes (F3). This contribution focuses exclusively on FIs hosted in colorless to smoky and black banded (fluorite–barite) stratiform ores (F1) and massive white vein fluorite (F2) (Figure 5).

3. Sampling and Analytical Methods

Pure massive fluorite samples were collected from banded stratiform orebodies (sample HZMR18) and veins (sample HZF2b) of the Hammam–Zriba deposit. Double–polished thick sections (Figure 7) were prepared for microthermometric and Raman micro-spectroscopic analysis. Sample preparation was performed at both the University of Tunis El Manar (Tunis, Tunisia) and the University of Porto (Porto, Portugal). Before microthermometric analysis, the petrographic examination of FIs was carried out by an Olympus BX51 petrographic microscope (Olympus Corporation, Tokyo, Japan) at the University of Porto (Porto, Portugal) using the criteria by [63,64,65,66].
The samples analyzed in this study were carefully selected from key mineralized zones within the deposit, where fluorite is most abundant and best preserves fluid inclusion characteristics. While this study primarily focuses on these specific areas, previous research indicates that the ZFP has relatively consistent mineralogical and geochemical features across different locations e.g., [1,2,3].

3.1. Microthermometry

A Chaixmeca stage (Chaixmeca, Nancy, France) was used for cryometry and a Linkam TH600 stage (Linkam Scientific Instruments Ltd., Tadworth, UK) was used for heating at the Microthermometric Laboratory (Instituto das Ciências da Terra–Polo Porto, University of Porto, Portugal). These stages were calibrated using SynFlinc synthetic FIs in quartz. The accuracy of the measurements was ±0.2 °C for freezing runs and ±1 °C for heating.

3.2. Raman Micro-Spectroscopy

The analysis was carried out on one double-polished section at the Institute für Geowissenschaften of the University of Potsdam, Germany. The Raman micro-spectroscopic analyses were performed using a HORIBA Jobin Yvon Confocal LabRAM HR 800 instrument (HORIBA Jobin Yvon, Villeneuve-d’Ascq, France), operated with a Peltier-cooled multichannel CCD detector and an Olympus B×412 petrographic microscope (Olympus Corporation, Tokyo, Japan). The procedure followed the detailed methodology of Bakker [67,68]. The excitation was procured at 100× and 50× magnifications with an air-cooled Nd:YAG laser (λ = 532 nm, laser power on the sample was 2–3 mW; Coherent Inc., Santa Clara, CA, USA). The confocal hole was adjusted to 200 μm, and the slit width was adjusted to 100 μm. All the spectra were recorded with a 300-line/mm grating, using the multiwindow option in the wavenumber range from 100 cm−1 to 4000 cm−1. Each measurement involved three repeats of 100 s with a spectral resolution of 10 cm−1. The measurement duration was 30 s and sometimes 40 s, with three accumulations. Most separate measurements focused on liquid and vapor fluid inclusions, depending on the inclusion size. Raman spectral data were processed using LabSpec 5.45.09 software (HORIBA Scientific, Villeneuve d’Ascq, France).
In this study, RMS analysis focused exclusively on HCFIs hosted in fluorite vein type. This restriction was based on the observed compositional similarity between FIs hosted in stratabound bodies and veins.
Seventy-four FIs (32 primary and 42 secondary) hosted in vein fluorite were analyzed by RMS. Based on the primary description of the examined FIs with two-phase inclusions (L + V), the analysis revealed the presence of various gas and solid species. The gas species were H2O, CO2, CH4, and N2, while the solid species were covellite, brookite, graphite, and hydrocarbon compounds such as evenkite.
Our focus involves the analysis of polycyclic aromatic hydrocarbons (PAHs) using RMS fluorescence emission spectra. This technique is widely used for identifying PAH compounds in HCFIs, e.g., [69]. The RMS fluorescence spectra were recorded using different excitation lasers applied to different types of PAH-bearing inclusions.

4. Results

4.1. Petrography and Microthermometry of Fluid Inclusions

Four primary types of FIs were identified in the fluorites:
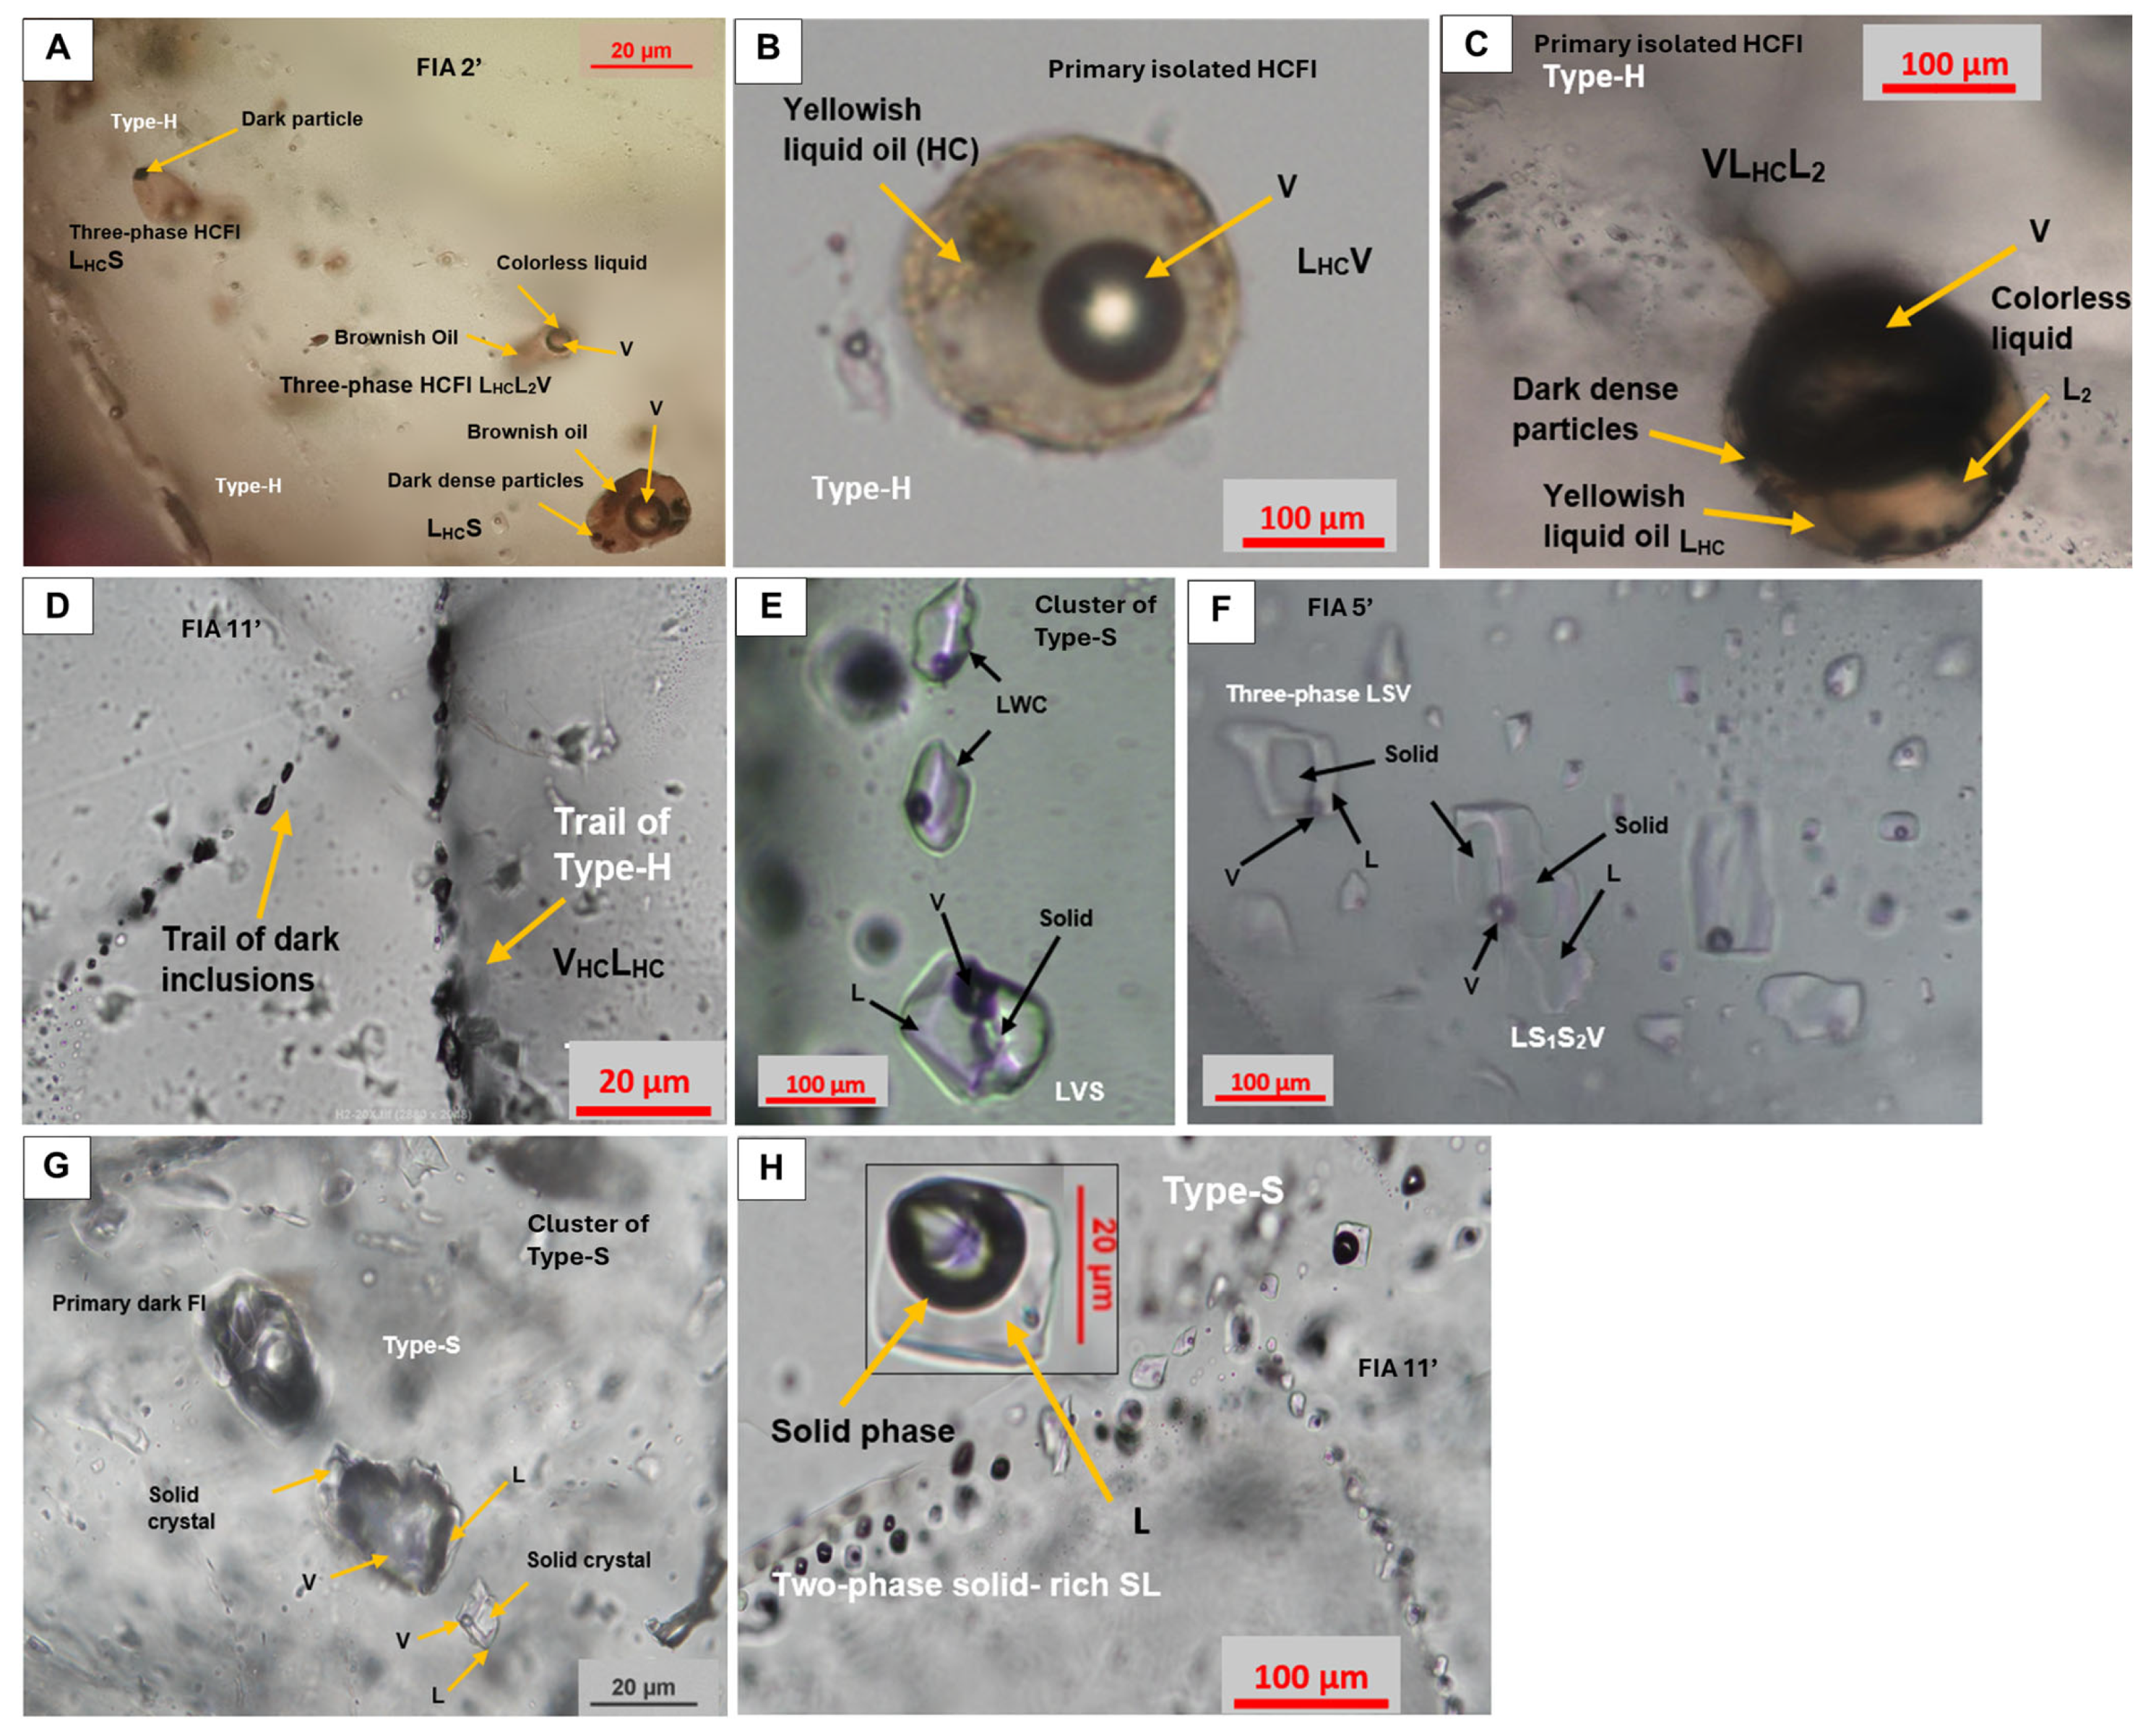
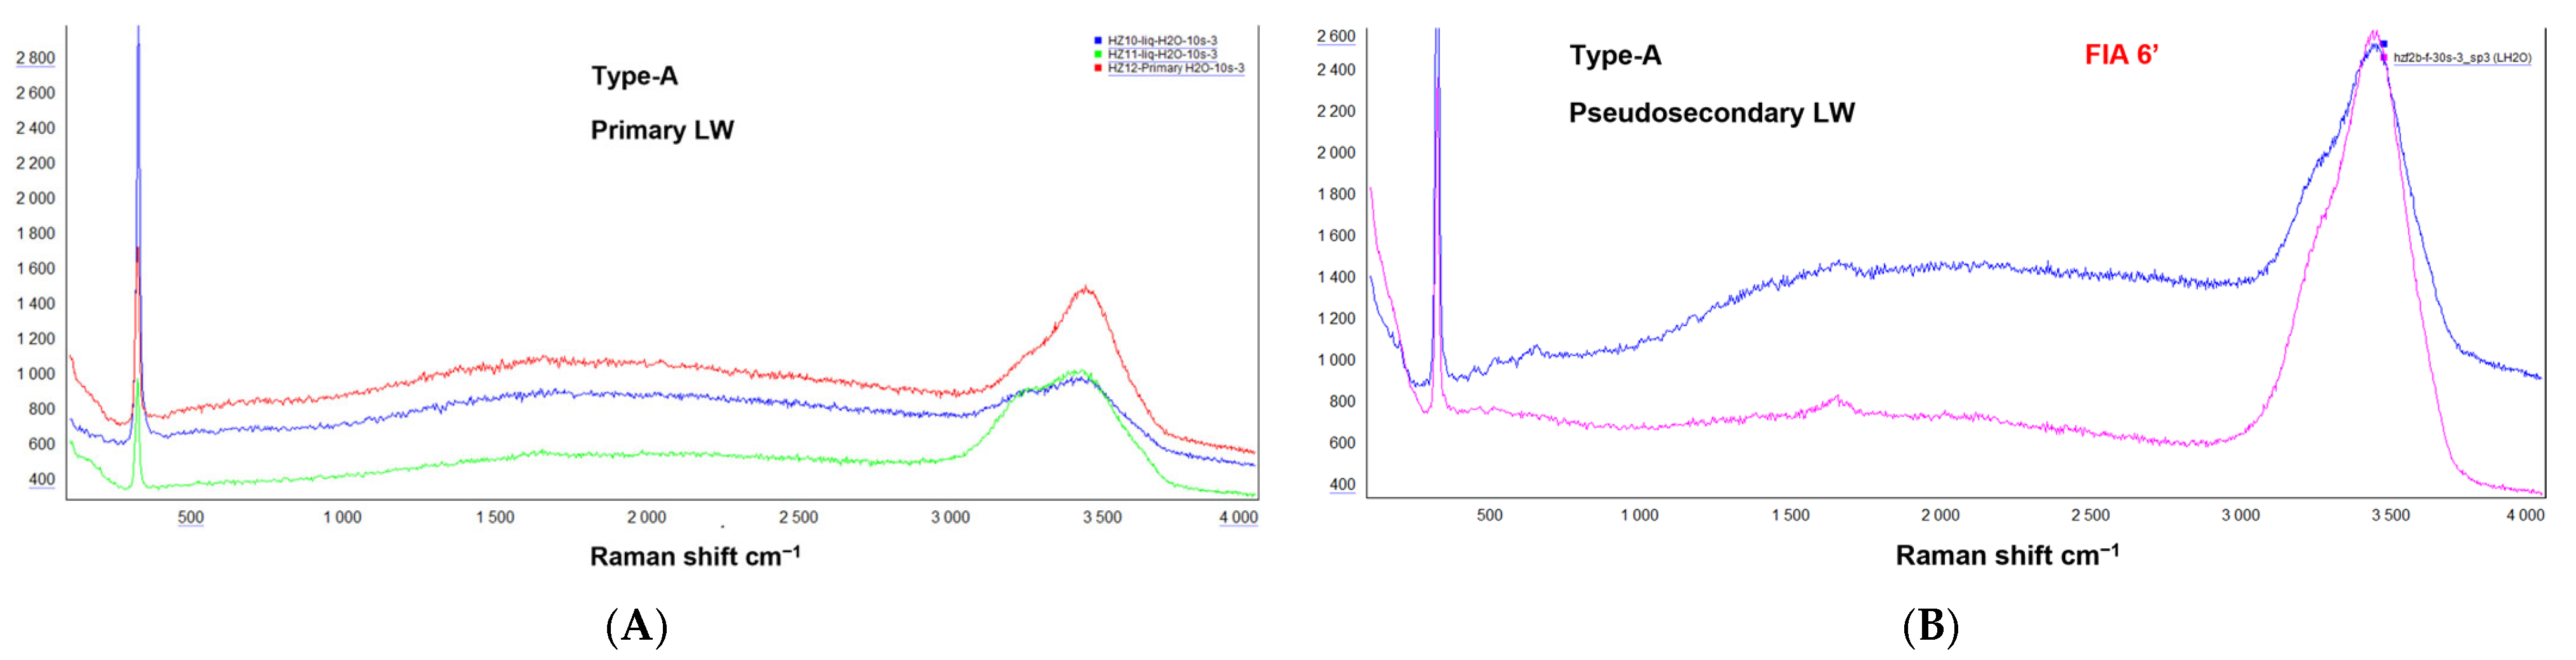
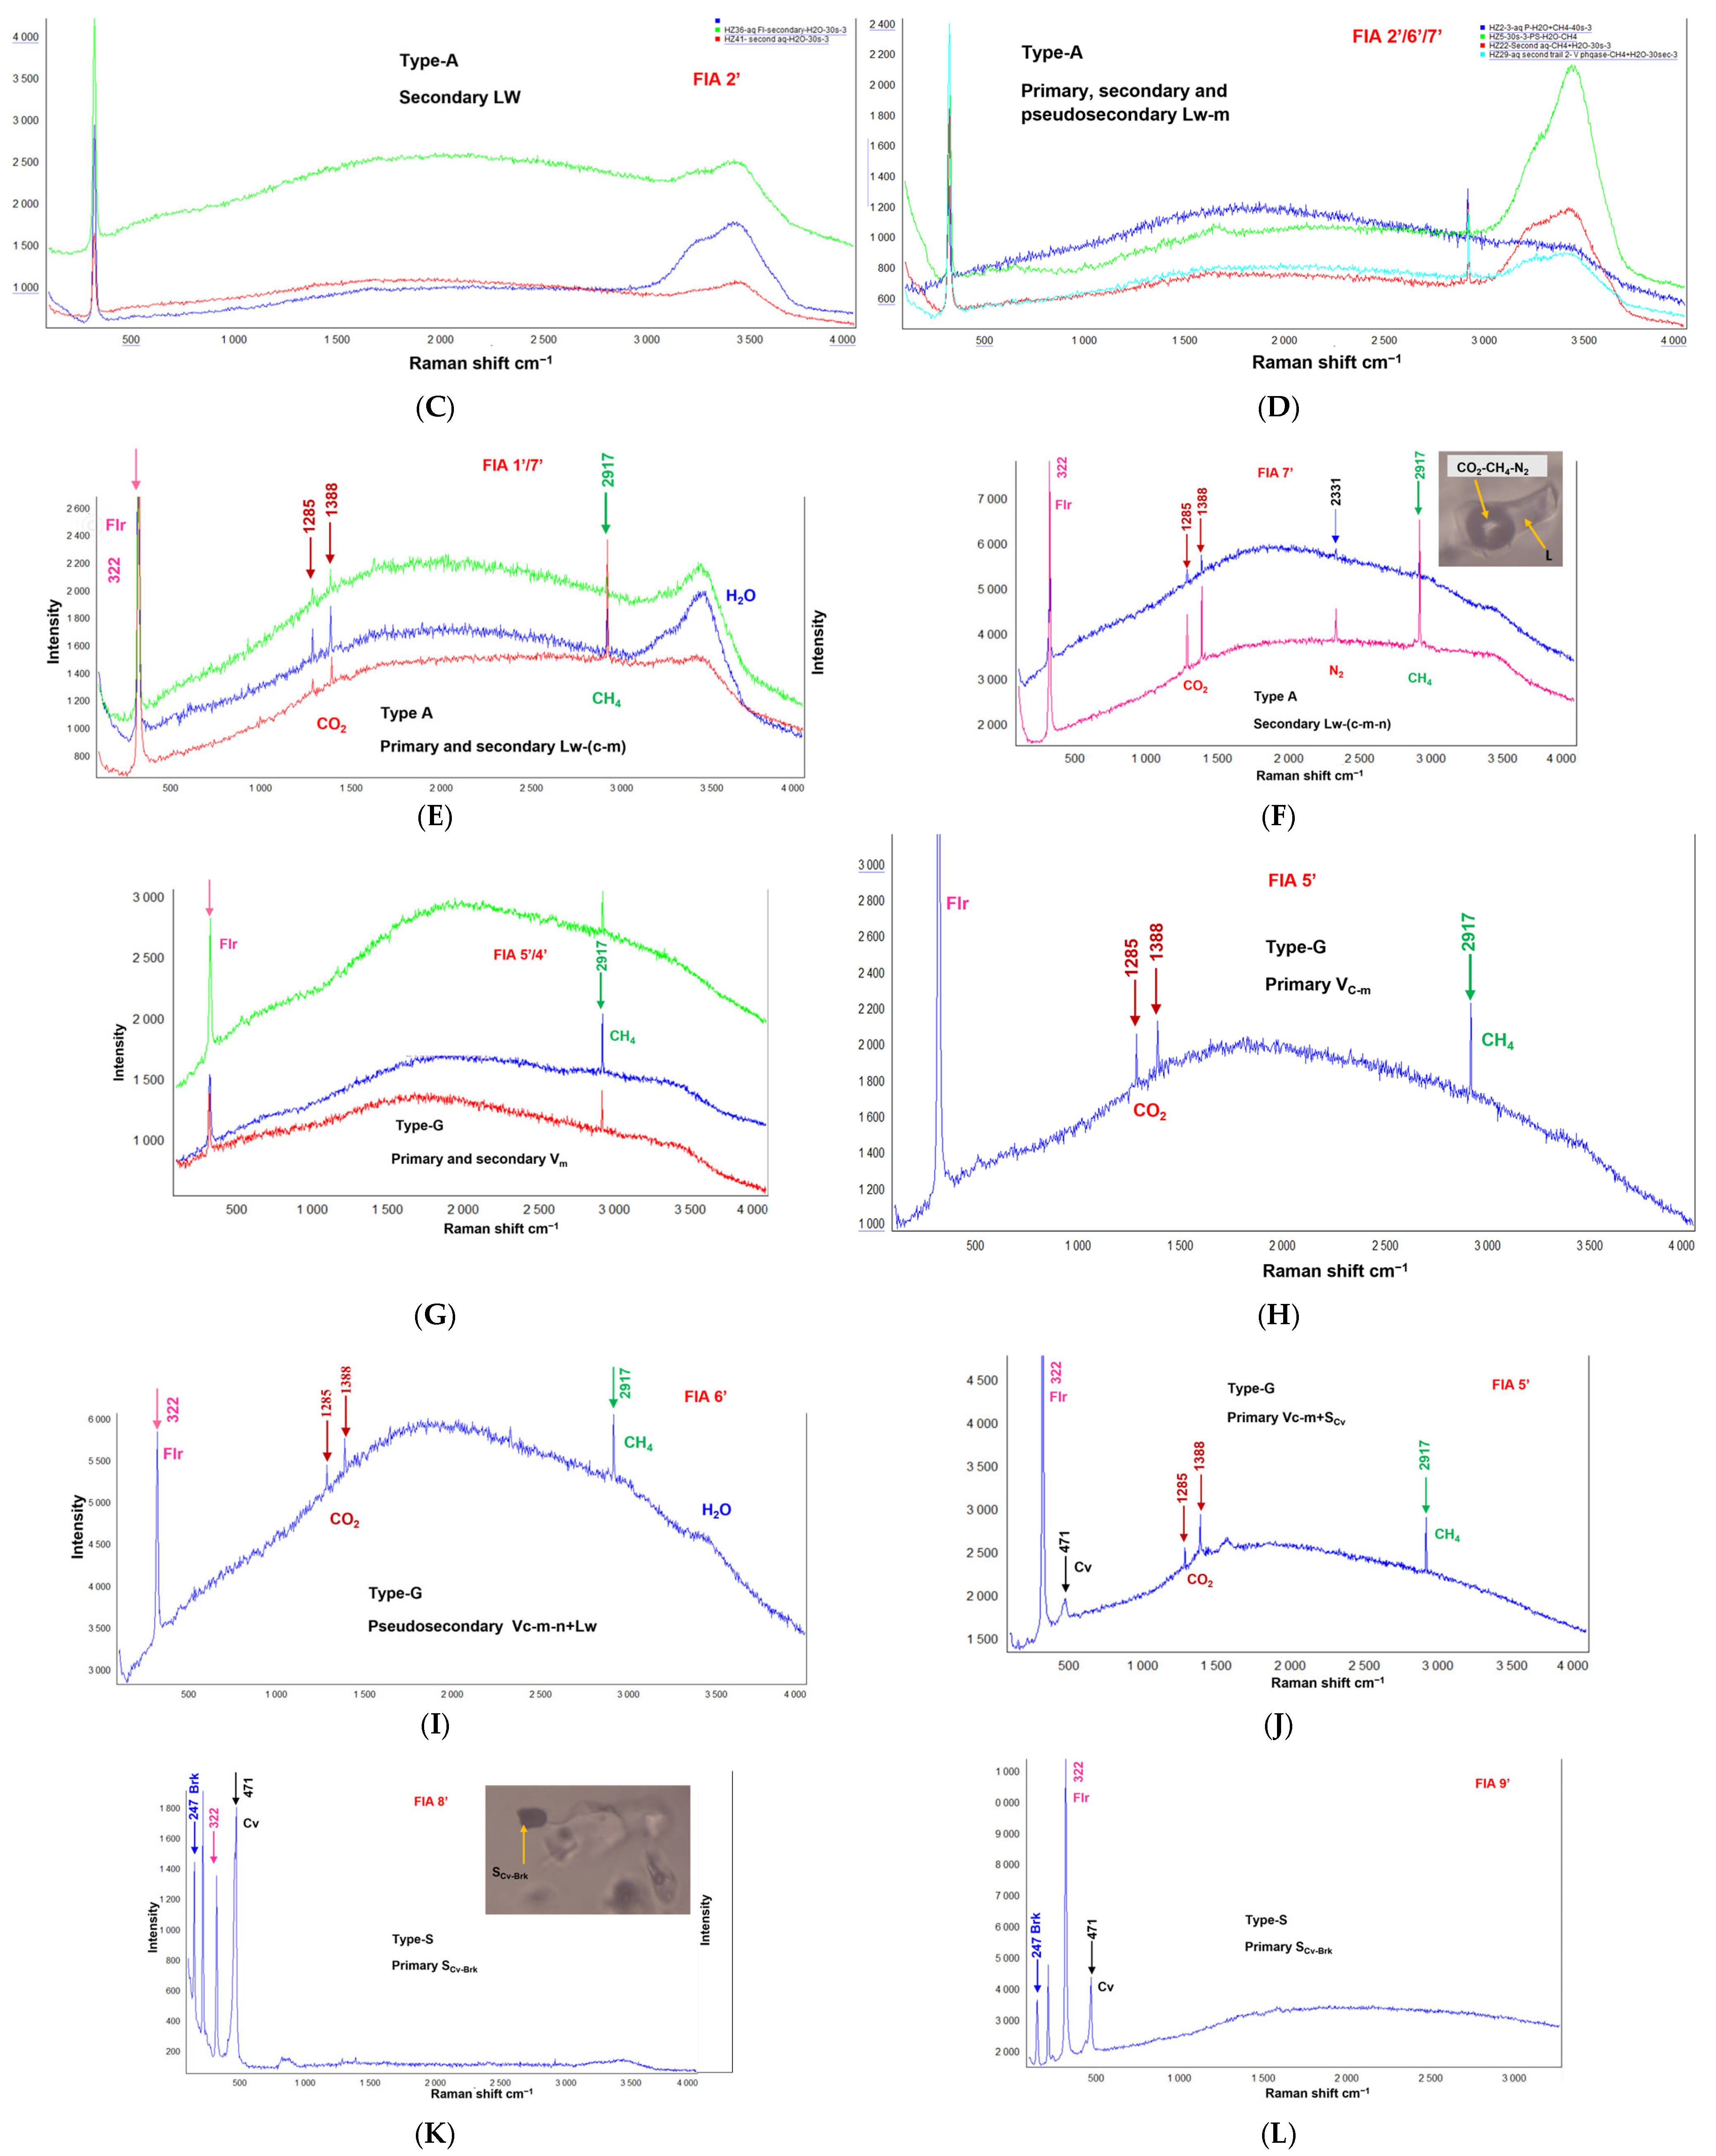
  • Aqueous inclusions (Type-A): Primary two-phase LWC where liquid water is the dominant phase with a minor vapor CO2-rich phase (L: liquid; W: water; C: carbon-rich phase dominated by CO2) and two-phase LW inclusions with liquid water as the dominant phase, containing a water vapor phase. These inclusions are the most abundant (Figure 8A–D) in fluorite. They have distinctively large sizes (200–500 µm in diameter) and dominant negative crystal shapes. Secondary and pseudosecondary FIs are very abundant (Figure 8C–E). They are arranged along planar arrays in healed microcracks or scattered along cleavage planes. These inclusions are approximately 10 to 100 μm in diameter and are usually ellipsoidal and sometimes flat with irregular shapes. These FIs are typically LW and LWC (Figure 8D,E). Three-phase liquid-rich FIs LCW (Figure 8F) containing liquid water, liquid CO2, and vapor CO2. Monophasic liquid inclusions (Figure 8G) are also present.
  • Gaseous inclusions (Type-G): Primary, secondary, and pseudosecondary two-phase vapor–carbon-rich inclusions VCW (Figure 8H). Secondary and pseudosecondary monophasic vapor inclusions VC are dominated by a single vapor phase, which typically contains CO2 (Figure 8I).
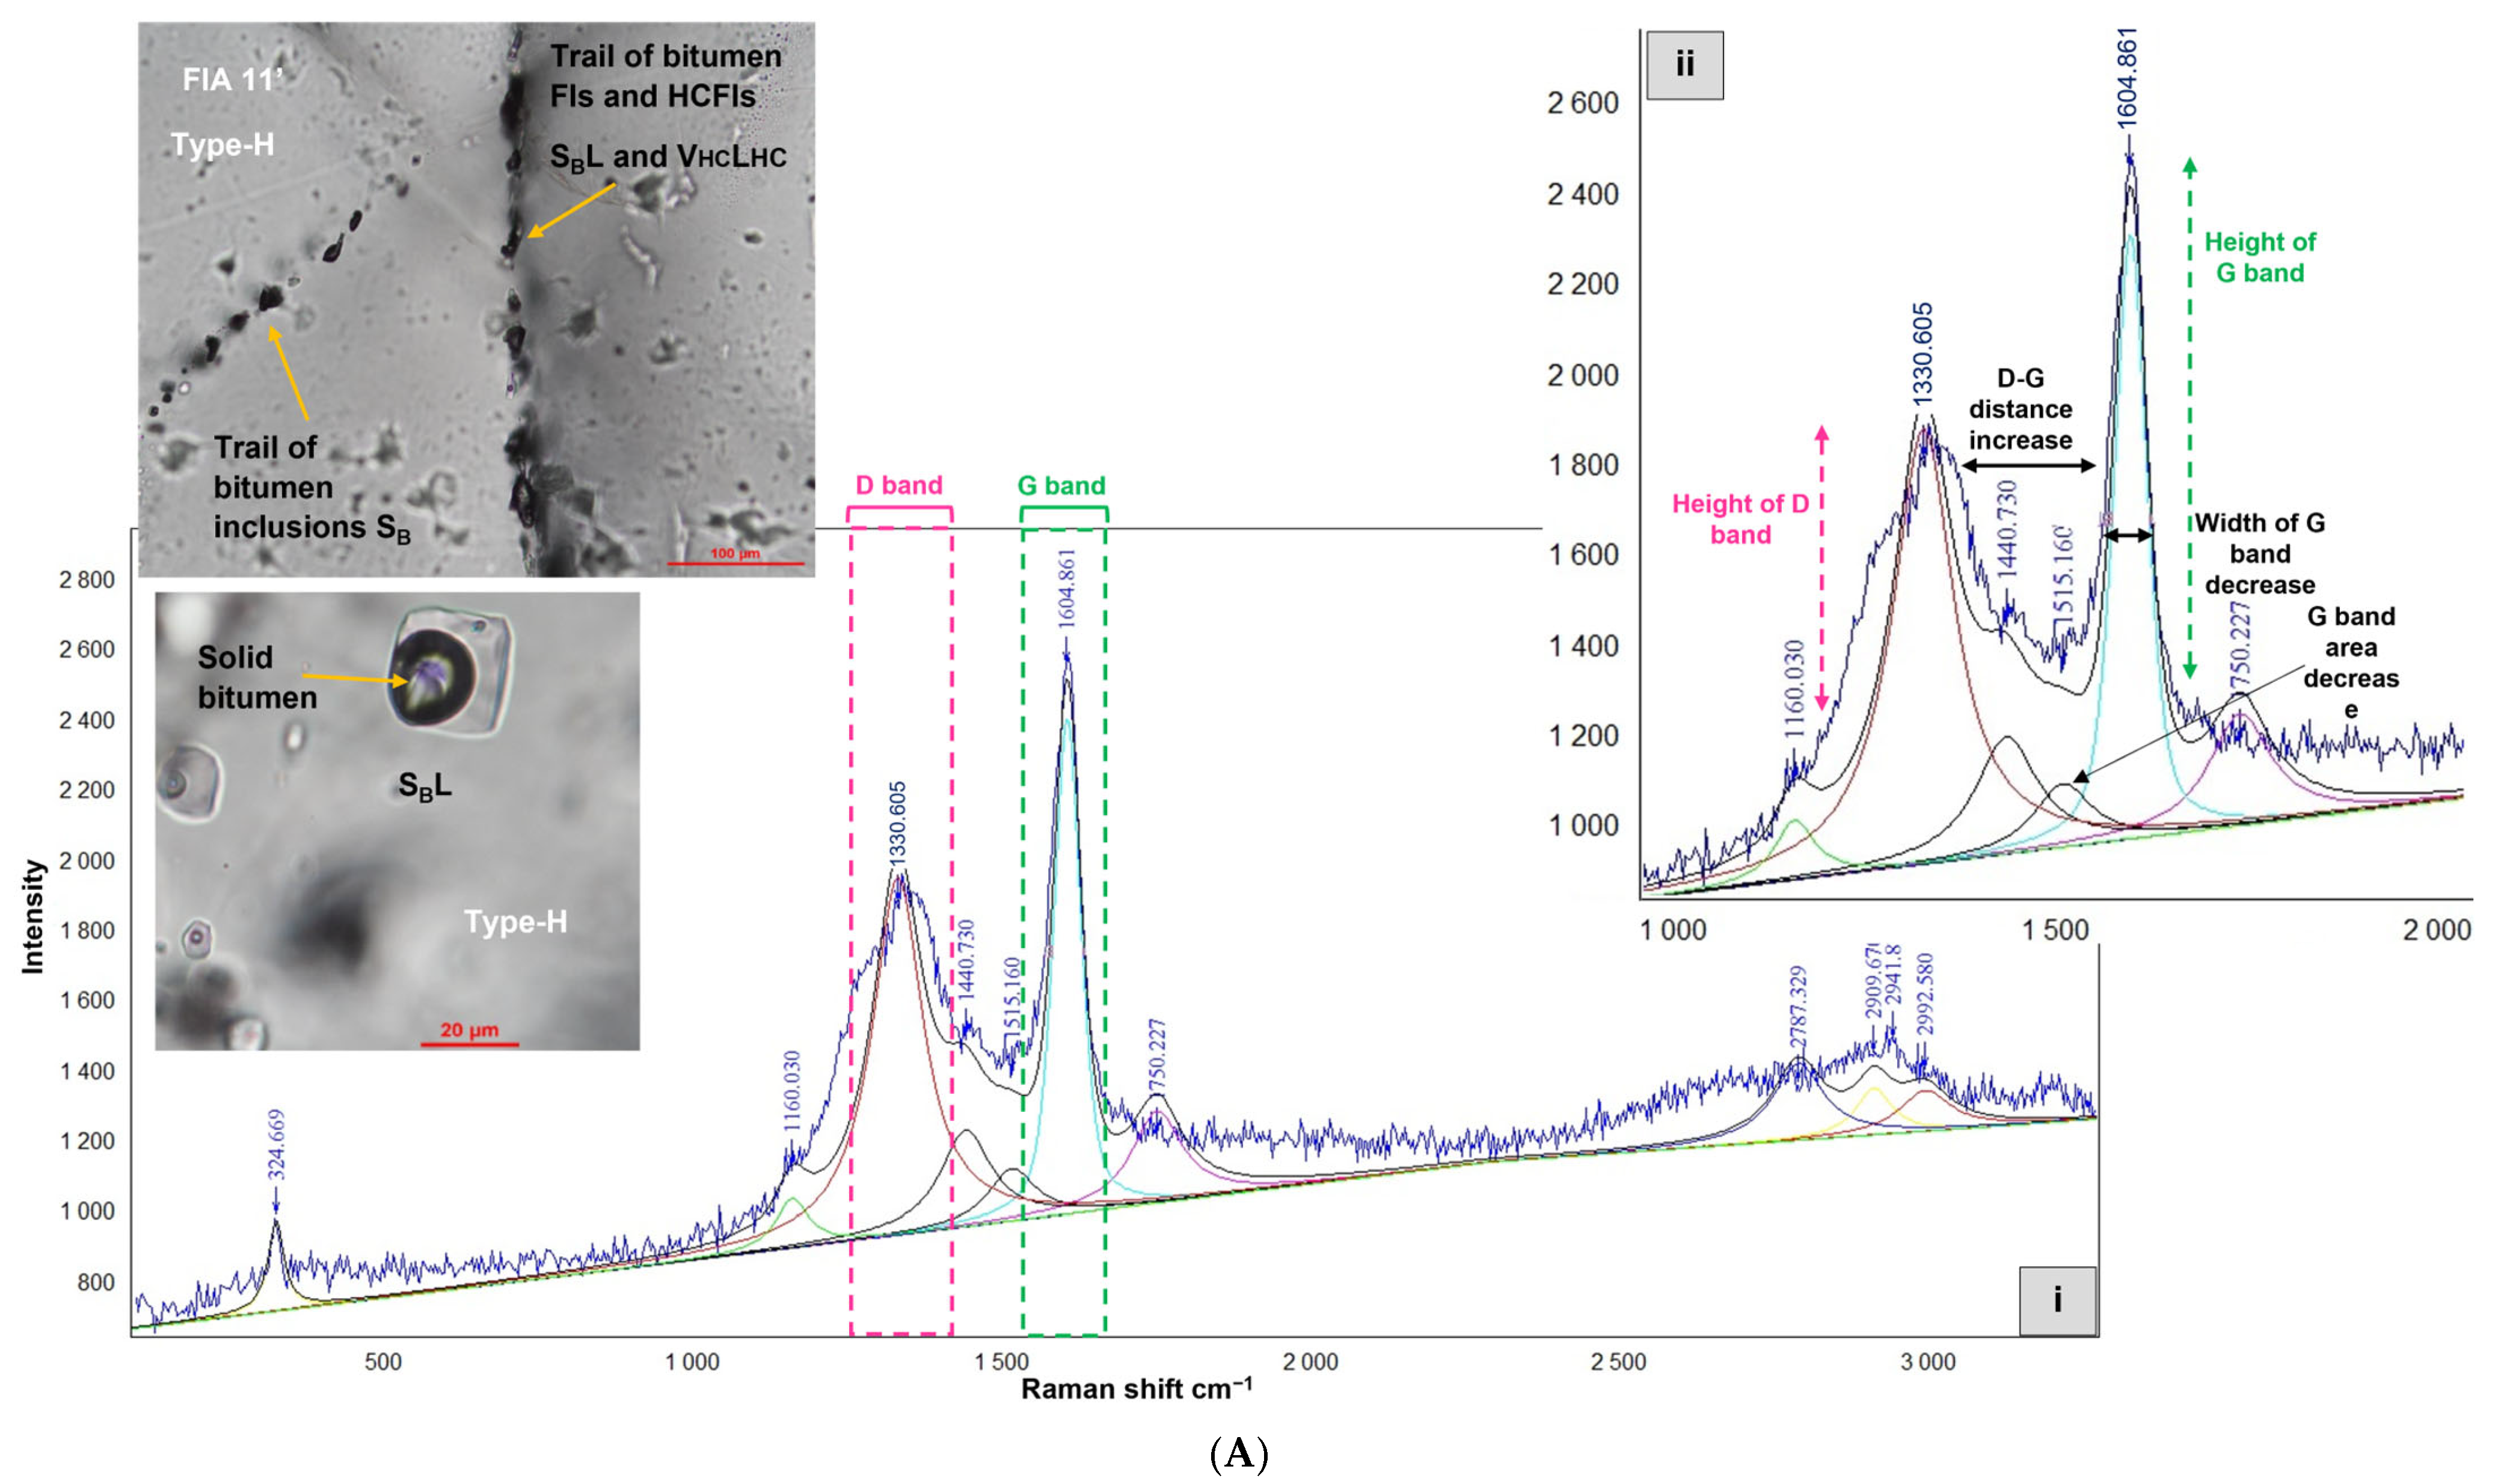
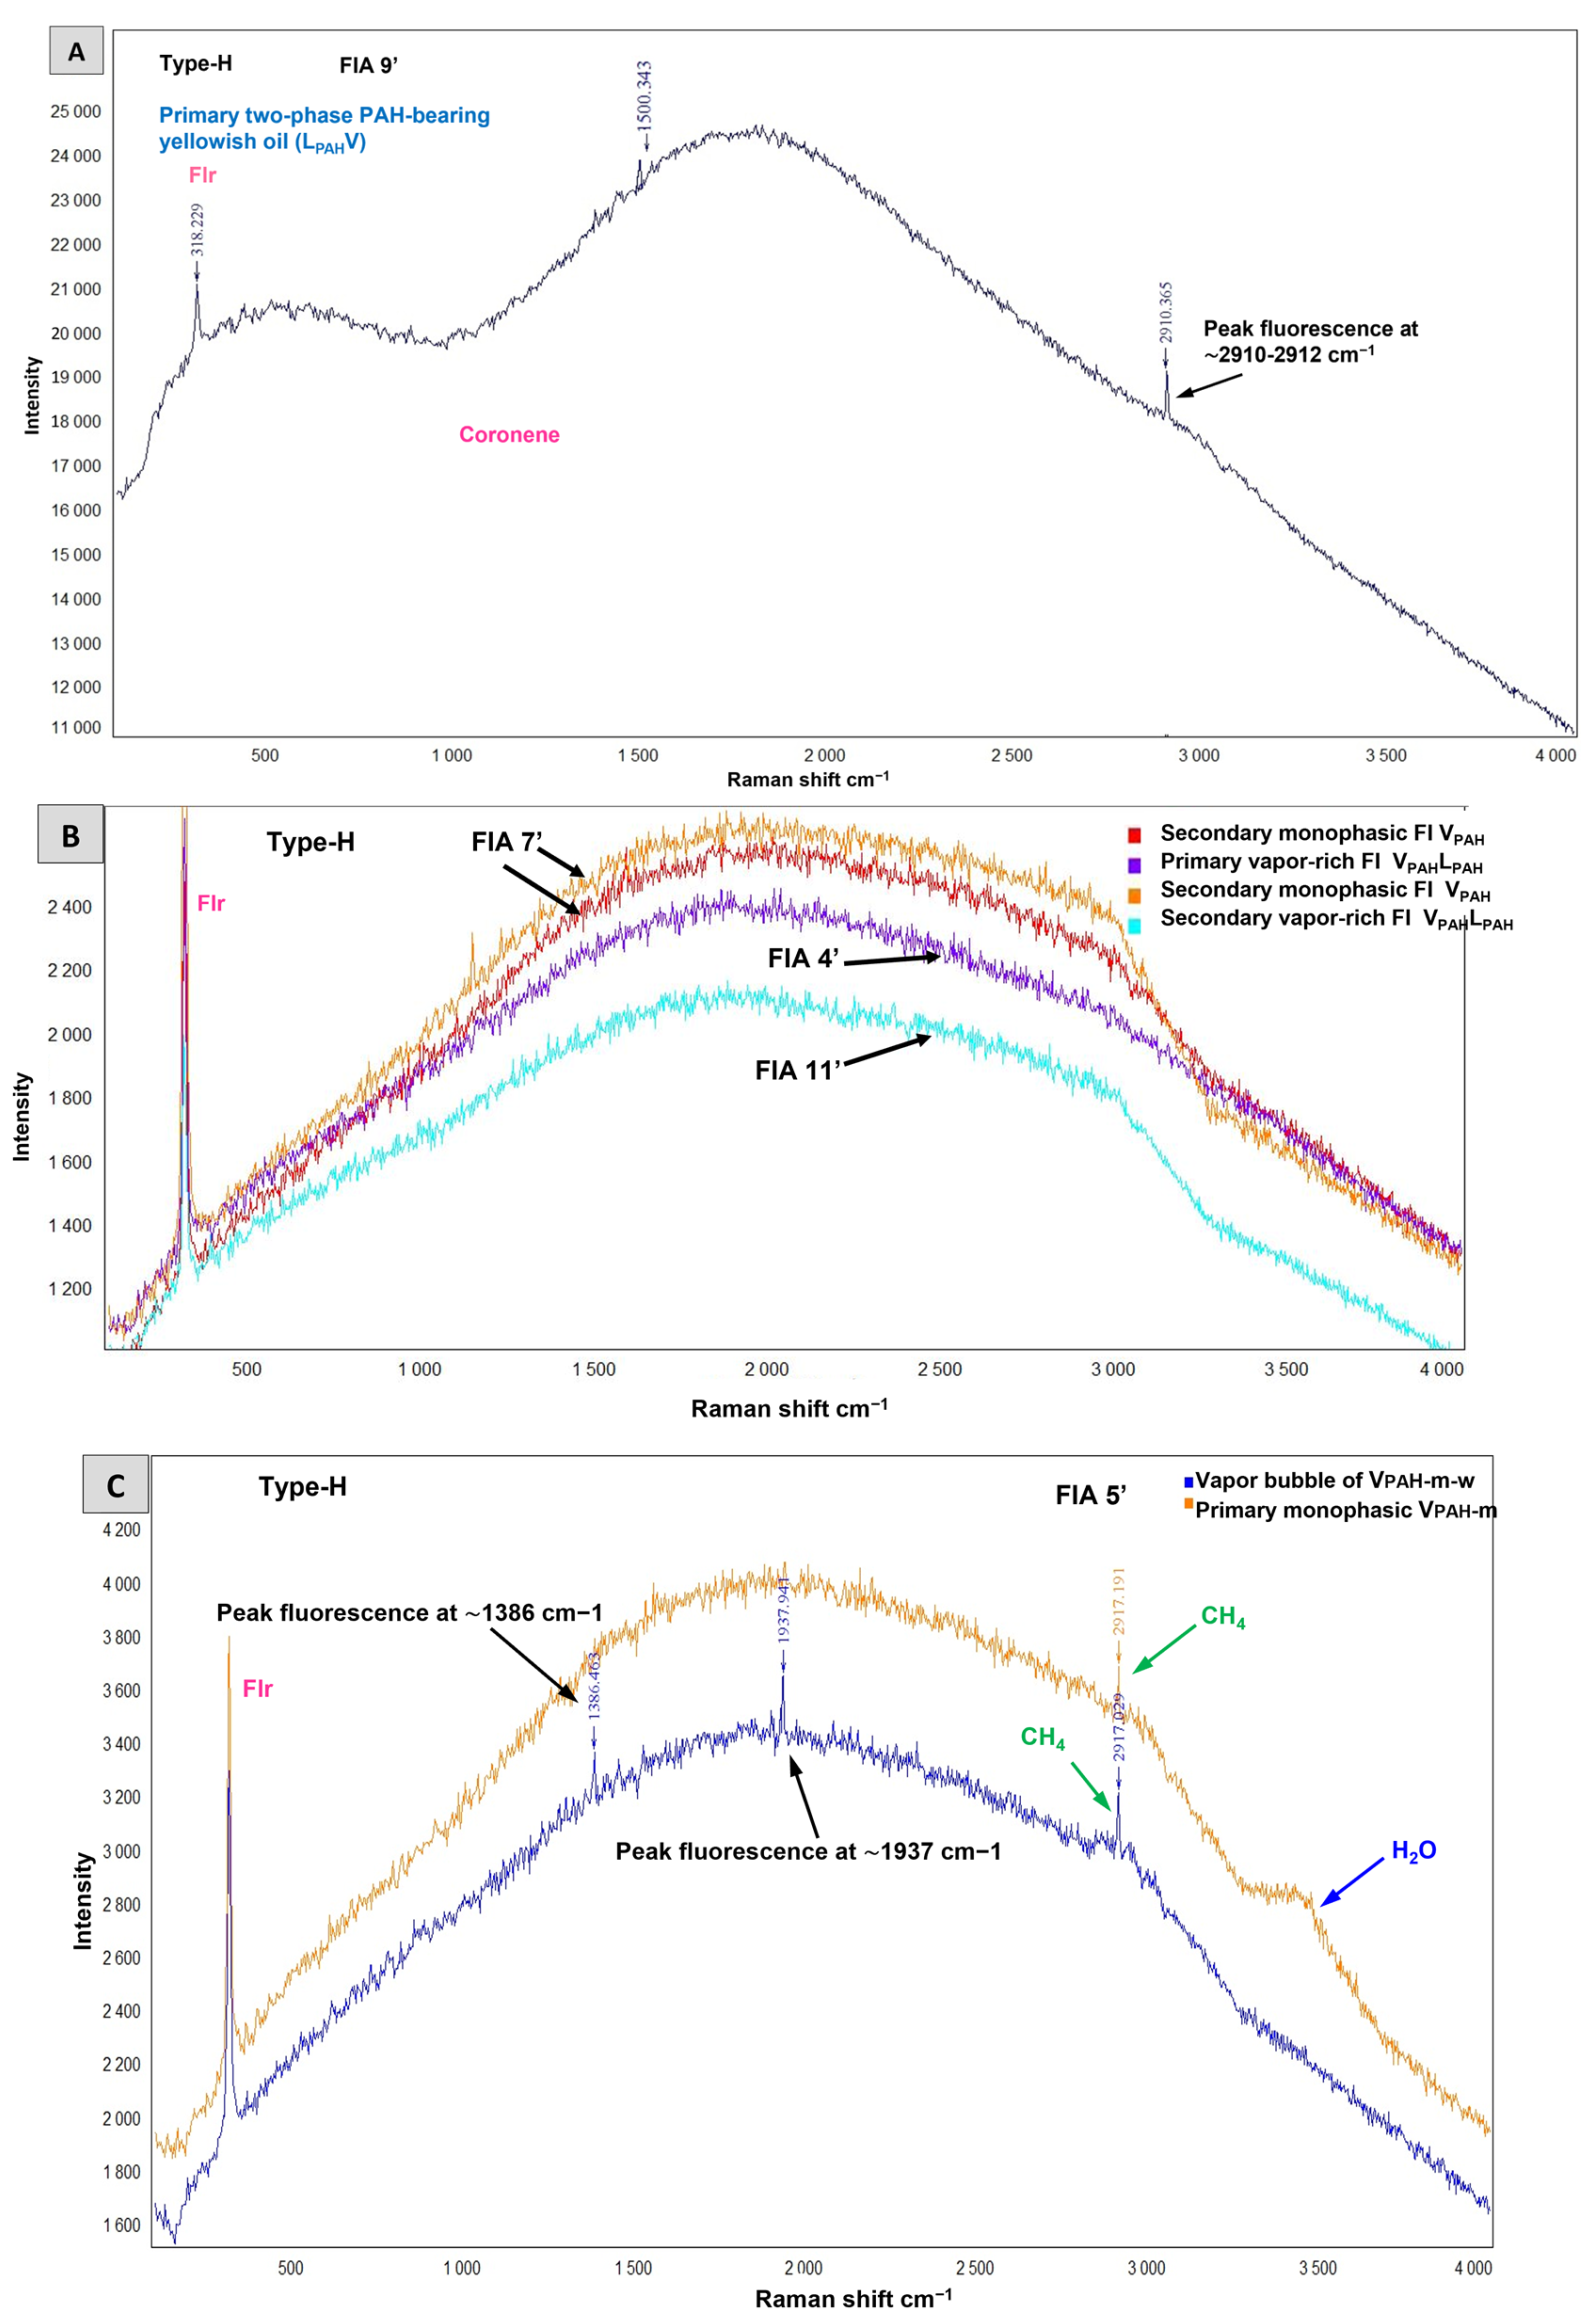
  • Hydrocarbon-bearing inclusions (Type-H): Primary and pseudosecondary three-phase liquid hydrocarbon-dominated FIs (LHCLV = two immiscible liquids + vapor) (Figure 8A and Figure 9A) usually have ellipsoidal or spherical shapes. Under the microscope, the hydrocarbon fluid looks yellowish and immiscible with another colorless liquid (either water or a supermature colorless hydrocarbon). Two-phase liquid–hydrocarbon-dominated fluid inclusions LHCV (LHC liquid hydrocarbon and VHC vapor hydrocarbon) are also present (Figure 9B). VLHCL2 inclusions are also present (Figure 8D and Figure 9). These FIs are three-phase vapor-dominated HCFIs containing two immiscible liquids (LHC and L2) in a vapor bubble. VHCLHC (Figure 9D) are also observed. These inclusions are vapor-dominated and composed of two phases. Three-phase LHCLS inclusions (Figure 9A) are composed of a dominant liquid hydrocarbon phase (LHC) and a second immiscible liquid phase (L), and contain several dark particles (S), possibly trapped OM. In this type of FI, the abbreviation ‘HC’ is used in a general sense to refer to all types of hydrocarbons and oils present in the fluid inclusions, including those that will be further identified and characterized, such as PAHs and evenkite, through Raman analysis in Section 4.2.
  • Solid-bearing inclusions (Type-S): Primary three-phase inclusions: LWSHl (Figure 8A and Figure 9E) and poly-phase FIs: LS1S2V (Figure 9F,G). The secondary and pseudosecondary two-phase SL FIs are dominated by a dark solid phase and a colorless liquid phase (Figure 9H). Secondary and pseudosecondary monophasic solid inclusions (Figure 8D) have been also observed. Further characterization of the solid phases present in these inclusions is provided in Section 4.2 through Raman spectroscopic analysis.
All the microthermometric data are summarized in Table 2. The microthermometric characteristics in F1 and F2 are similar. In all two-phase aqueous FIs and HCFIs, the eutectic temperatures range between −50 and −52 °C. This is compatible with a CaCl2–NaCl–H2O system [70]. In all generations of FIs (P, PS and S), Tmice ranges from −24.2 °C to −9.5 °C (Figure 10A). Clathrates melted between −3.9 and −1.1 °C (Table 2).
In primary aqueous inclusions, Th ranges from 95 °C to 150 °C (Figure 10B). In secondary and pseudosecondary aqueous inclusions, Th ranges from 90 °C to 137 °C, with the most representative values between 100 °C and 130 °C (Figure 10B). Th in all HCFIs range from 85 °C to 145 °C.
Primary, secondary, and pseudosecondary aqueous inclusions have salinities ranging between 13 and 22 wt.% eq. NaCl (Table 2; Figure 10E,F). The mean homogenization temperatures and salinities are presented in a Th vs. salinity plot (Figure 11).

4.2. Raman Micro-Spectroscopy (RMS)

RMS analyses were carried out on the four types of fluid inclusions defined in Section 4.1 (Type-A, Type-G, Type-S, and Type-H). This technique enabled the identification and quantification of phases within the inclusions and revealed the distinct petrographic subcategories.

4.2.1. Aqueous-Rich Fluid Inclusions Type-A

Aqueous liquid-dominated Type-A FIs: (i) Primary, secondary, and pseudosecondary two-phase aqueous LW FIs show Raman spectra of pure water (Figure 12A–C). (ii) Primary, secondary, and pseudosecondary Lw-m FIs (Figure 12D) are composed of an aqueous phase and a gas phase with 100 molar % CH4. (iii) Primary and secondary Lw-(c-m) FIs contain H2O with a volatile phase with 63 molar % CO2 and 37 molar % CH4 (Figure 12E). (iv) Secondary Lw-(c-m-n) FIs contain H2O with a volatile phase with 60 molar % CO2, 20 molar % CH4 and 20 molar % N2 (Figure 12F).

4.2.2. Gas–Rich Fluid Inclusions Type-G

Gas-rich Type-G Fis: (i) Primary and secondary gas- and carbon-rich Vm (Figure 12G) and Vc-m FIs (Figure 12H). (ii) Pseudosecondary vapor-rich inclusions Vc-m-n + Lw containing a minor aqueous phase and a gas phase with 65 molar % CO2, 15 molar % CH4, and 20 molar % N2 (Figure 12I). (iii) Primary Vc-m + SCv FIs contain CH4 and subordinate CO2 with the occasional presence of CuS (Figure 12J).

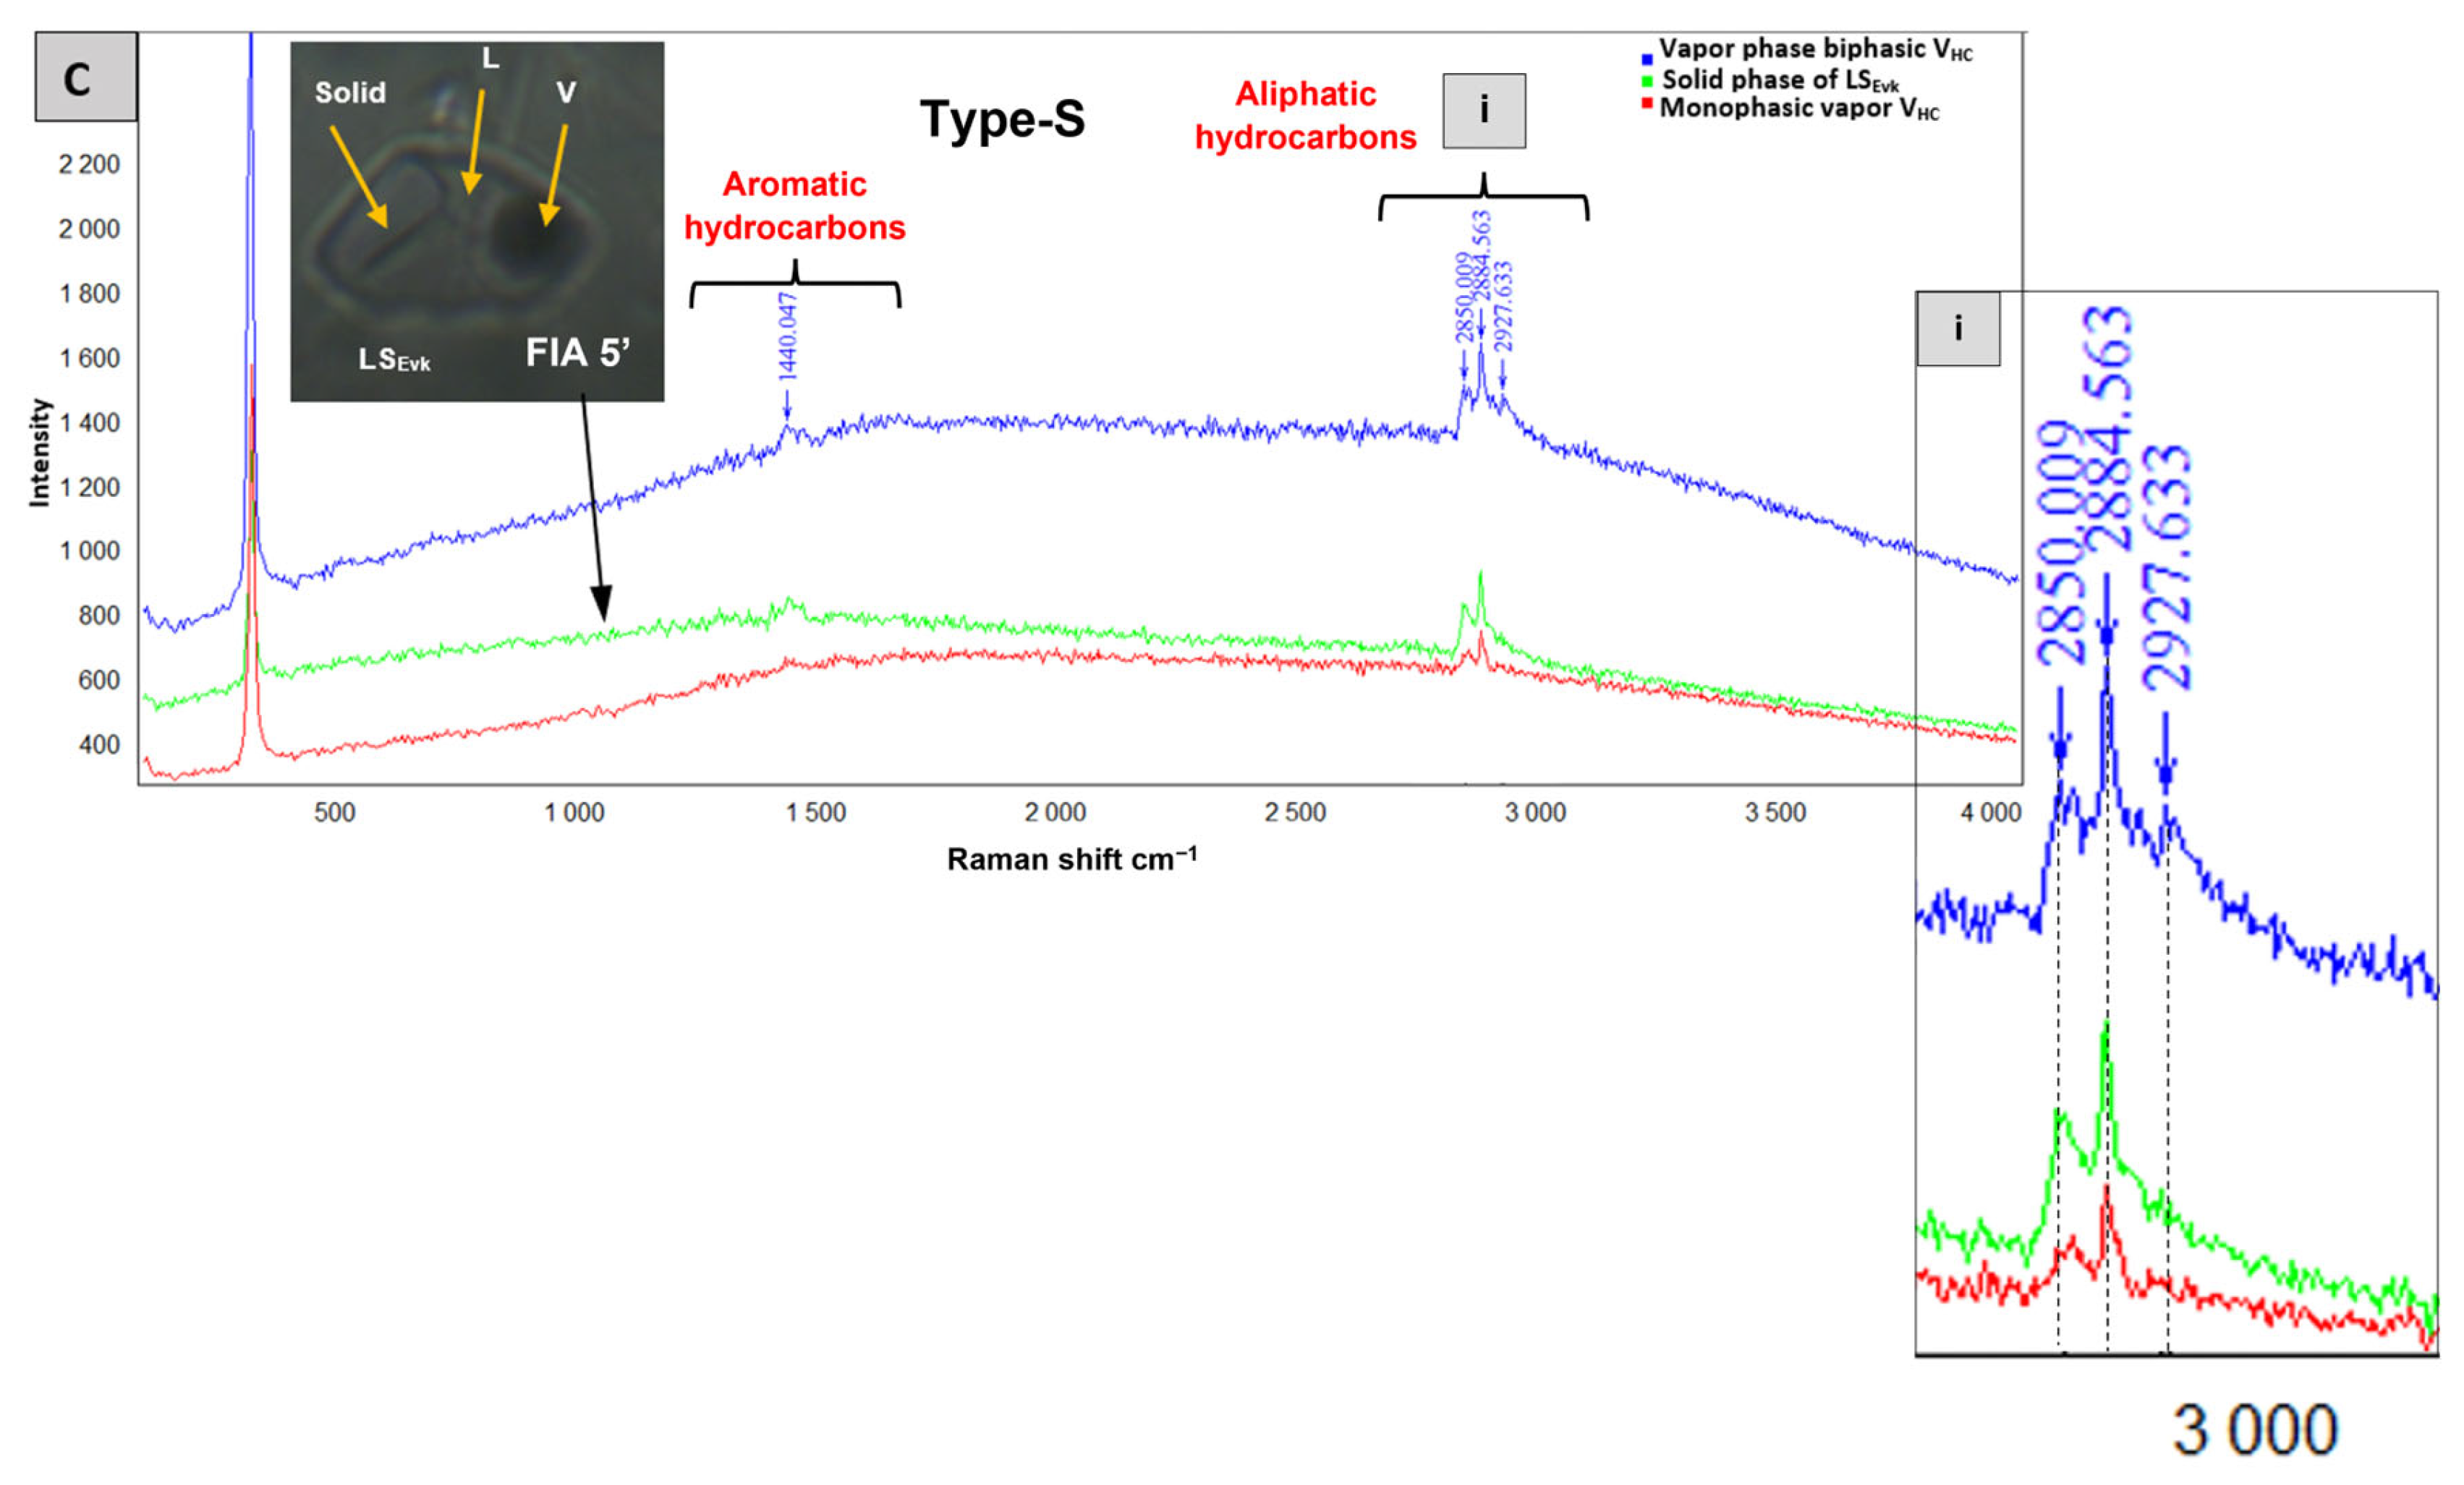
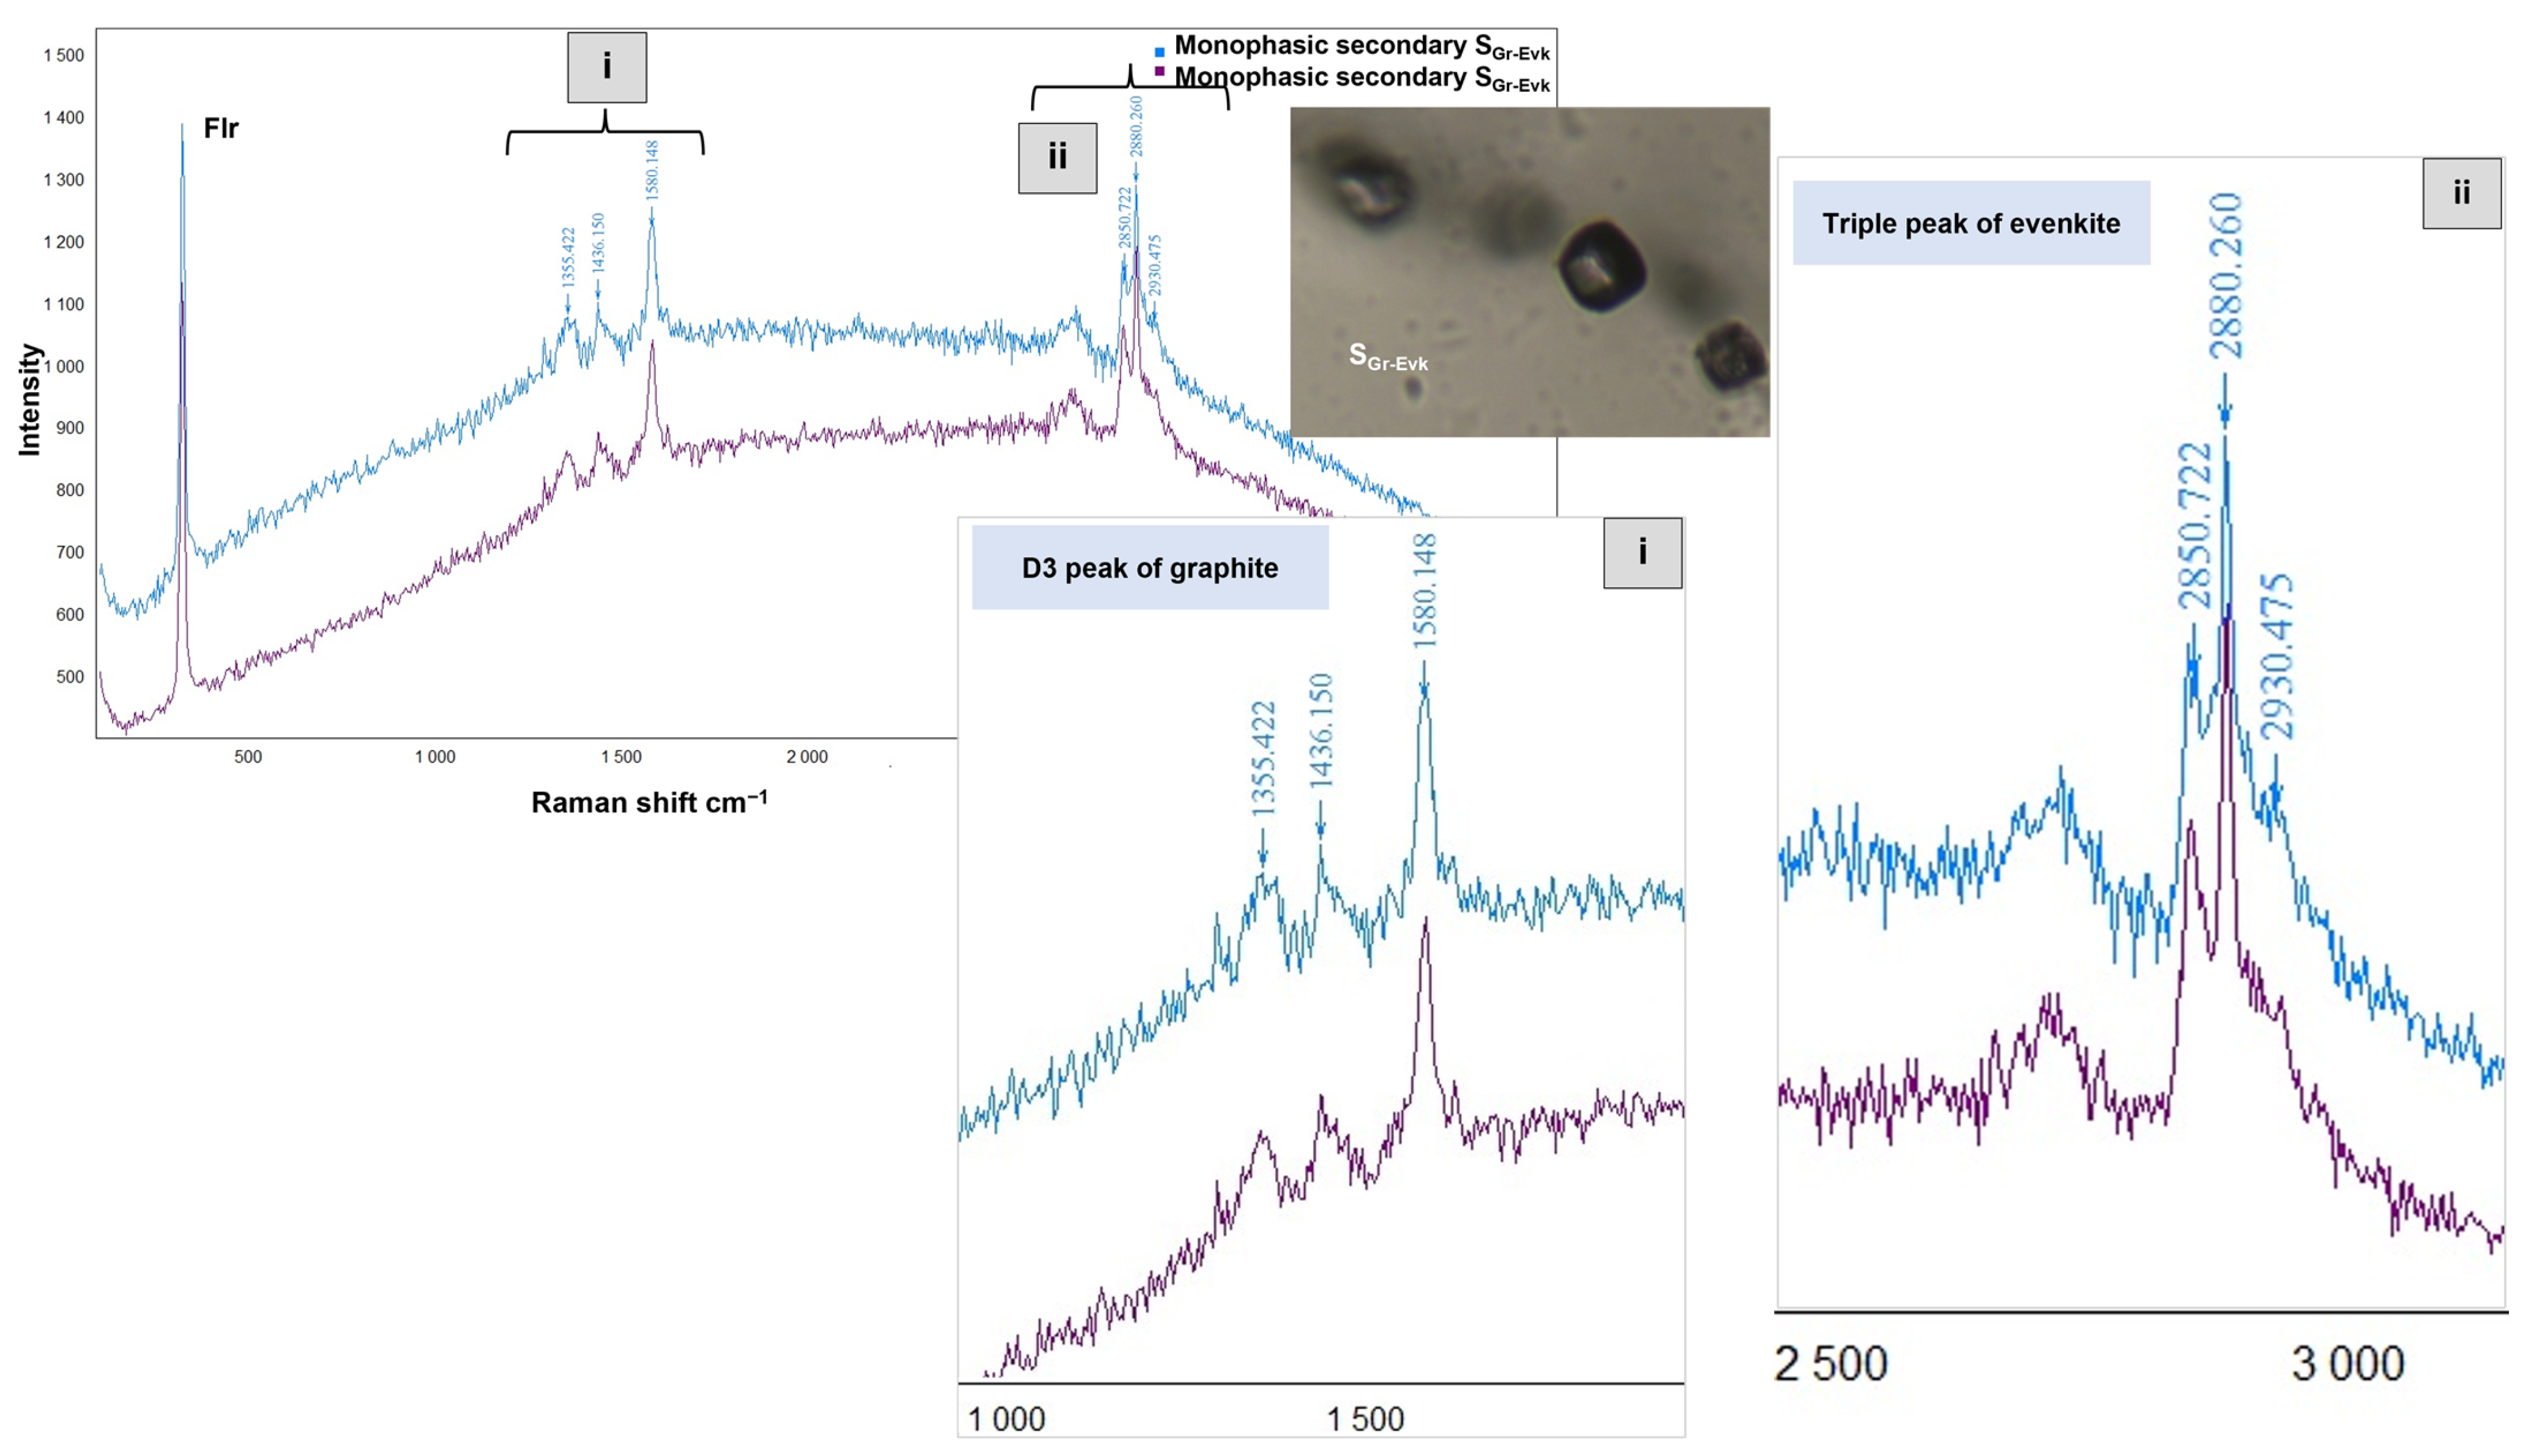
4.2.3. Solid-Rich Fluid Inclusions Type-S

The occurrence of covellite with likely brookite is indicated by the presence of primary monophasic solid inclusions SCv-Brk (Figure 12K,L). Graphite occurred trapped cogenetically with evenkite mineral (further details will be discussed in Section 5.4).

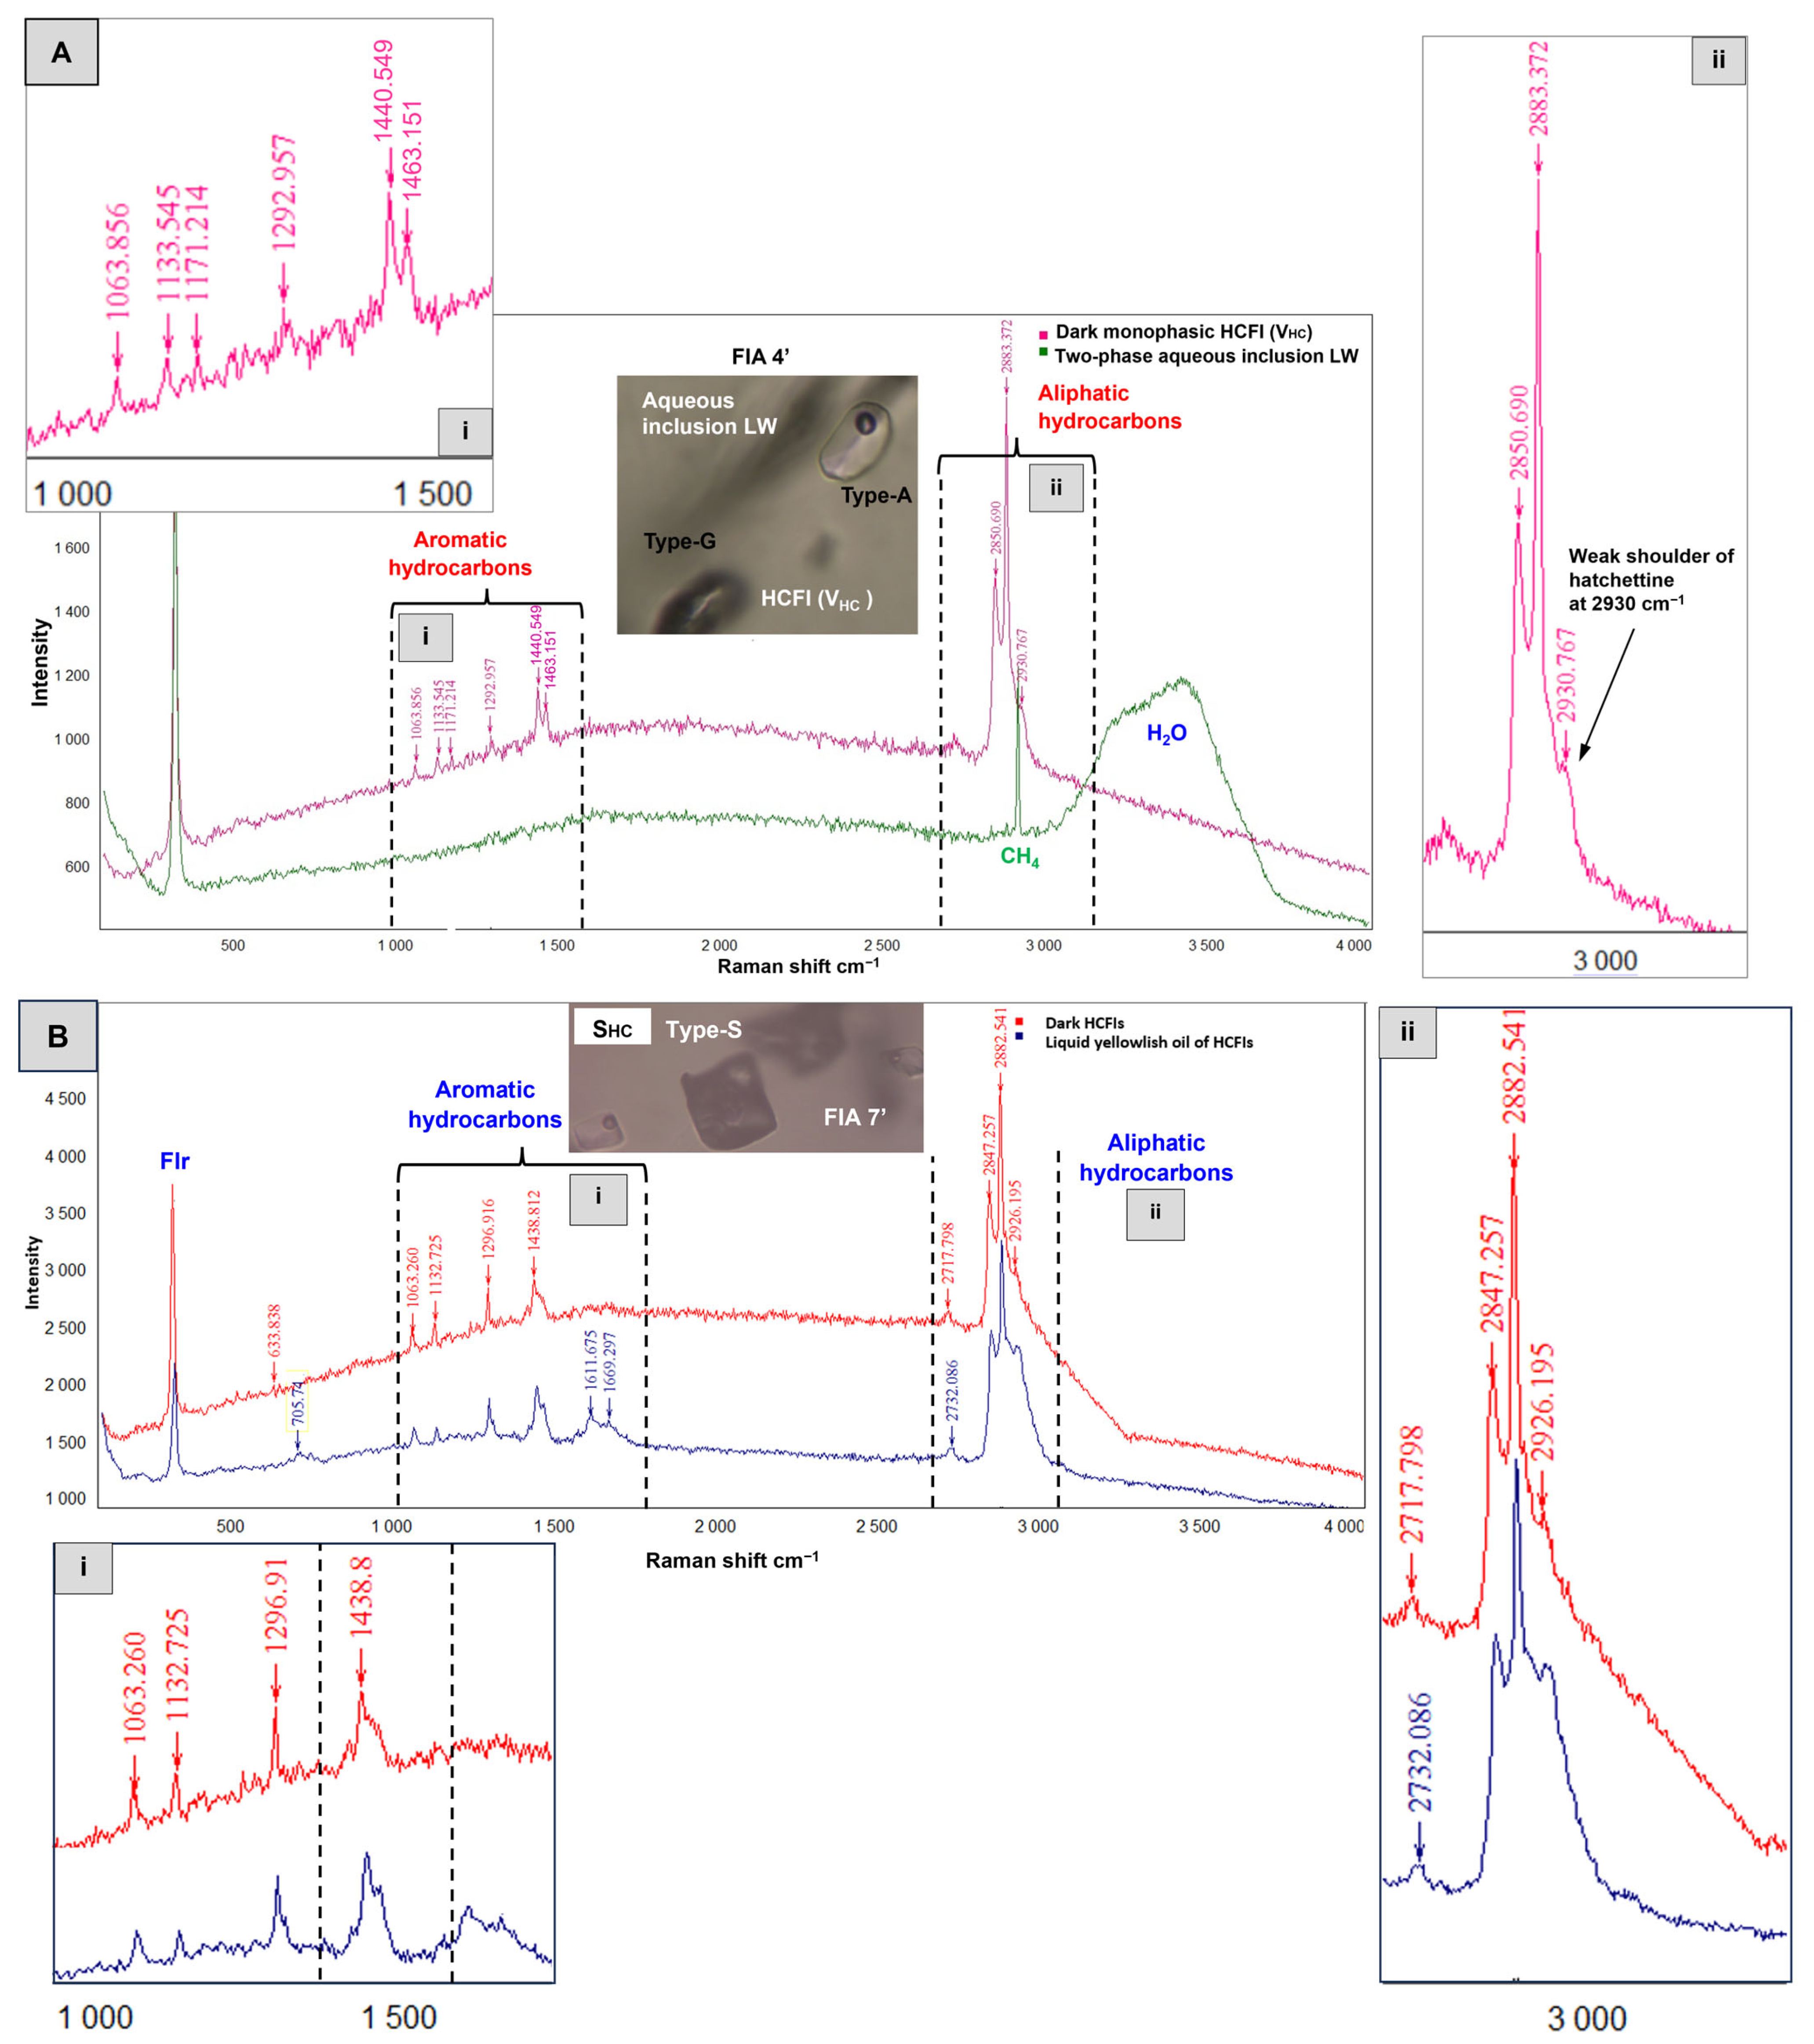
4.2.4. Hydrocarbon-Bearing Fluid Inclusions Type-H

RMS analyses allowed the identification of three distinct groups of Type-H: (1) mixtures of aliphatic and aromatic compounds, including kerogen and bitumen; (2) polycyclic aromatic hydrocarbons (PAHs); and (3) purely aliphatic compounds, which are the mineral hydrocarbon evenkite.
The D and G band positions in Raman spectra varied from one inclusion to another. These bands shifted from 1327 to 1345 cm−1 (D bands) and 1560 to 1608 cm−1 (G bands). Additionally, the Raman spectra of the bitumen and kerogen inclusions varied broadly in peak height (Figure 13A,B). The characteristics of Raman spectra of PAHs are presented in Figure 14. The characteristics of Raman spectra of evenkite, n-tetracosane, and hatchettine are presented in Figure 15 and Figure 16. Raman bands are particularly common in the wavenumber ranges of 3100–2600, 1700–1300, and 1300–890 cm−1.

5. Discussion

5.1. Immiscible Fluid Mixture of Brines, Oil, and Volatiles

It is essential to first identify the specific process responsible for FI formation associated with fluorite mineralization at the ZFP. Immiscibility is generally used to characterize the coexistence of two or more fluid phases in equilibrium [63,76,77,78]. The mixing of two distinct fluids would generate FI populations characterized by a variable range of total homogenization temperatures and salinities [79].
The evidence presented in this study suggests that fluid immiscibility occurred in the Hammam–Zriba fluorites. The presence of the four types of FIs (A, G, H, S: Section 4.1), all primary (co-genetic) with variable phase ratios, provides clear evidence of heterogeneous trapping. In this context, when considering LW-, LWC-, VW- and VWC-type Fls (Figure 17), they commonly coexist within the same fluorite growth zones, indicating their simultaneous trapping. Second, the slightly higher salinity of type LW aqueous inclusions compared to the water in type LWC inclusions (Figure 10E,F) aligns with the characteristics of fluid immiscibility [80]. In this context, Wilkinson [81] explained that during the transition from lithostatic to hydrostatic conditions, a single-phase fluid underwent immiscibility separated out low-salinity LWC-type FIs and relatively high-salinity LW-type FIs (Figure 17; Table 2).
Third, all of these FIs contained CO2 and H2O at various ratios and exhibited homogenization temperatures in near ranges, at around 110–140 °C, 112–119 °C, 90–133 °C, 95–137 °C, and 100–130 °C (Table 2; Figure 10C,D). Fourth, the total homogenization temperatures of H2O–CO2 inclusions are slightly higher than those of aqueous inclusions, which is further consistent with fluid immiscibility [63]. Fifth, Type-A FIs, particularly WC, and Type-G Fis, displayed different CO2, CH4, and N2 contents between different fluid-end members. These characteristic behaviors point to fluid immiscibility [63,82]. Additionally, heterogeneous trapping (Figure 17), which results in liquid-dominated and vapor-dominated inclusions with variable homogenization temperatures, serves as strong evidence for fluid immiscibility [64,82,83,84,85]. However, within such FIAs, only inclusions that can be confirmed to have trapped either the end-member liquid or end-member vapor provides meaningful homogenization temperatures [64,83,84,85].
If fluid immiscibility occurred during fluorite mineralization at the Hammam–Zriba deposit, the homogenization temperature would represent the trapping temperature [82,86]. In this regard, primary co-genetic aqueous and hydrocarbon inclusions provide information about the temperature and pressure conditions at the time of fluid entrapment in minerals, representing the temperature of mineral deposition [63,64]. The homogenization temperature of co-genetic aqueous FIs is generally considered as the minimum formation temperature of the host mineral [63,64]. In hydrocarbon systems, it may also represent the true trapping temperature of both fluid types [87,88,89]. Consequently, the homogenization temperatures of 85 to 145 ± 5 °C for FIs within mineralized fluorite veins and cavity fillings reflect the fluid entrapment conditions.
Furthermore, to assess the reliability of microthermometric data from FIs, we applied the concept of “Fluid Inclusion Assemblage” (FIA), which is defined as “the most finely discriminated, petrographically associated group of inclusions” (Figure 17). Traditionally, the FIs trapped within healed fractures and growth zones of host minerals are petrographically classified as FIAs. However, in the Hammam–Zriba fluorites, FIs trails within healed microfractures often crosscut fluorite crystal boundaries, which indicates their secondary origin. In contrast, FIs along the primary growth zones of fluorite are rare due to the absence of well-defined cubic and hexaoctaedrical growth zones (Figure 7). Most primary FIs at the Hammam–Zriba fluorites occur as isolated (Figure 9B,C), scattered groups (Figure 8B,C), or clusters (Figure 8A and Figure 9A,E–G). According to [84], if these Fls occur in the same groups and display similar homogenization temperatures, their microthermometric data can be considered reliable.
In summary, the salinity values of the analyzed FIs range between 13–22 wt.% eq NaCl (Table 2; Figure 10C,D). The primary FIs were trapped simultaneously within clusters and groups, indicating a common trapping event. Their immiscibility is evidenced by the presence of distinct fluid phases, such as oil–water or vapor–liquid hydrocarbons, observed microscopically. Microthermometric data further confirms immiscibility, as different fluid types display similar homogenization temperatures and phase behaviors, rather than gradual mixing. RMS data supports these findings by revealing compositional differences between coexisting fluids (see Section 4.2). Additionally, thermodynamic constraints at the recorded temperature limit the solubility of hydrocarbons in aqueous fluids, further supporting the immiscibility of these phases in the F-rich MVT mineralizing system.
The fluorite mineralization at Hammam–Zriba resulted from hydrothermal fluids (85 to 145 ± 5 °C in this study and 110 to 185 °C according to [1]). These fluids consist of H2O–NaCl–CaCl2 basinal brines (13 to 22 wt.% NaCl equiv), with petroleum and CO2–CH4–N2 mixtures. High-salinity brines was generated from the interaction of basinal brines with Triassic evaporites. As discussed by Yardley [90], salinity increases in basinal fluids can also result from broader fluid–rock interactions, including ion exchange and leaching processes involving siliciclastic rocks and deeper basement lithologies. These interactions may occur under varying pressure–temperature regimes during fluid circulation. When surface-derived fluids infiltrate to a certain depth into the basement, metals like Pb and Zn can offer valuable information about fluid–rock interactions [91]. These metals are generally transported as chloride complexes. This means that fluids with medium to high salinity (chlorinity) and elevated temperatures typically exhibit high concentrations of metals [90]. Therefore, while interactions with evaporites likely contributed to the brine salinity, a more comprehensive model should also consider multi-stage fluid–rock interaction pathways within both sedimentary and basement reservoirs. This broader perspective aligns with the geochemical complexity observed in the fluid inclusions from the ZFP.
On the other hand, these investigations [90] argue that regions with repeated metal mineralization often correlate with historical evaporitic environments. Even after the dissolution of primary evaporite bodies, residual chloride can increase the metal-enrichment potential of fluids. This implies a geochemical legacy whereby the initial composition of sediments continues to impact mineralization processes long after the evaporites have dissolved.
In this study, it is assumed that fluorite deposition increased due to slight decreases in the pressure and temperature of the hydrothermal brines, along with the increase in Ca2+ activity resulting from the dissolution of Jurassic carbonate rocks [4,92]. Geothermometry suggests a reservoir origin at approximately 275 ± 25 °C [4,5]. The higher-than-usual heat flow in northern Tunisia (80 and 83 mW m−2) [30,93] suggests fast vertical fluid circulation along cracks linked to the ZF during extensional regimes. These fluids originated from the deep Paleozoic basin, crossing the Triassic evaporites and the Jurassic series [3,6]. These basinal brines (connate waters) may have also acted as conduits for hydrocarbon migration, promoting the movement of organic-rich fluids through the underlying formations. Hence, the presence of trapped hydrocarbons further suggests a deep source for these fluids.

5.2. Processes for the Formation of Multi-Volatile Systems in Vapor Phases

The ore fluids in the studied deposit belong to the CO2–CH4–N2–Hc and H2O–NaCl–CaCl2 systems. Additionally, aqueous carbon-rich fluids of the (H2O–NaCl–CaCl2)–CO2–CH4–N2–Hc systems are present.
The volatiles and their occurrence in the FIs (Figure 12) could be explained by the following hypotheses. These hypotheses are based on the available data and interpretations of sources and processes in similar geological systems:
  • CO2 and CH4 were likely produced from over-mature petroleum-bearing source rocks. These fluids are the most abundant gases found in the three upper-Cretaceous units, which are part of the regional petroleum system in central and northern Tunisia: the chalky Abiod Formation (Campanian–Maastrichtian), the shaly and calcareous Aleg Formation (Turonian–Santonian), and the shaly and calcareous Fahdene Formation (Albian–Cenomanian). The greatest concentrations of these gases were recorded in several wells within the Fahdene Formation, with CH4 (15%) and CO2 (89%) [94]. These fluids may be generated through hydrous thermal alteration of petroleum and by organic materials in the surrounding rocks. The sporadic presence of oil indicators in the regional setting suggests an organic origin for the dense volatile phases (CO2, CH4, and N2) [95]. In this sense, [51,96,97] documented petroleum wells were drilled in the Zaghouan area.
On the other hand, the Ypresian Bou Dabbous Formation is part of the regional petroleum system in northern Tunisia. It is recognized as a significant hydrocarbon source rock, particularly for oil, due to its high total organic carbon (TOC) content and favorable kerogen type. However, its potential for natural gas generation is comparatively limited. Studies indicate that the TOC values range from 0.4% to 4%. OM is predominantly composed of Type I and II kerogen, which is more prone to oil generation than gas generation [33]. Although the Bou Dabbous Formation has been identified as a good source rock with petroleum potential, its capacity for significant gas generation is limited compared with its oil-generating potential [98].
Additionally, CO2 is the predominant volatile byproduct of kerogen and bitumen in pyrolysis experiments across a wide range of thermal maturities. Its proportion increases with temperature and persists after the peak of hydrocarbon generation [99]. CO2 accounts for 65 to 95 mol% of the gas phase released during typical hydrous pyrolysis investigations in the range of 250 to 325 °C [100]. This suggests that the CO2 in the studied basin resulted from high-temperature geological events. As shown by Rddad et al. [101], the organic-rich formations (the Fahdene and Bahloul shales) within the Tunisian diapiric zone underwent progressive maturation linked to basin subsidence during the Alpine tectonic compression phase. This leads to the generation of hydrocarbons and associated metals, along with the expulsion of basinal brines. Thermal maturity indicators, including Tmax values (424–453 °C) and vitrinite reflectance (up to 0.87%), confirm catagenetic conditions resulting from burial heating [101]. These basin-related processes provided the thermal regime necessary for petroleum generation and the subsequent migration of hydrocarbons toward structural highs, where they could interact with mineralizing fluids [101]. This model of OM maturation aligns with the broader tectono-sedimentary evolution of the region and provides a more accurate genetic framework for understanding the origin of hydrocarbons in fluid inclusions.
The resulting petroleum can migrate with fluids and become trapped as petroleum FIs or in microcracks as bitumen FIs (SBL and SB: Figure 13A). Bilkiewicz and Kowalski [102] revealed a positive correlation between N2 and CH4, indicating that N2 in a Ca2+ reservoir is generated primarily by hydrocarbons during the thermal transformation of dispersed OM. Such an association argues for thermogenic CH4, CO2, and N2 genesis from organic-rich sediments subjected to high thermal gradients. Lewan [99] proved through experiments with hydrous pyrolysis that hot aqueous solutions may produce considerable amounts of fresh hydrocarbons from post-mature kerogen. This suggests that a similar process might have occurred in the studied system. The presence of voluminous CO2 phases in the studied FIs (Figure 12) further supports this origin, as it could explain the reaction residue: 2C + 2H2O → CH4 + CO2. Additionally, several studies have documented the associations of CO2 and CH4 with hydrothermal (100–200 °C) F–Ba–Pb–Zn–Sr mineralizing fluids in northern Tunisia such as Jebel–Stah and Sidi–Taya in the ZFP [2,3,4,25] and Jebel–Doghra in the Diapir Zone of NW Tunisia [103].
The Bahloul and Fahdene Formations span a considerable area in the northern Tunisian Atlas and extend into the Zaghouane structural domain, which includes the ZFP. This finding supports the plausibility of this hypothesis; however, further detailed geological, geochemical, and geophysical studies are necessary to validate these hypotheses.
2.
Trapped oil with brines in PAH-bearing fluid inclusions VPAH-m + Lw (Figure 14C) may undergo oxidation over time, leading to molecular fractionation [104]. Independent of temperature, CO2 can result from the chemical oxidation of hydrocarbons by water within inclusions or cracks [105]. Depending on the oil–water interaction, hydrolytic disproportionation occurs at 150 °C. This process enables the exchange of oxygen or hydrogen between hydrocarbons, water, and OM [106]. The CH4 trapped in FIs (Vm, Lw-(c-m-n), Lw-m, Lw-(c-m): Figure 12; VPAH-m: Figure 14C) could follow this mechanism. These conditions align with those proposed by [107], suggesting that CH4 is produced from the thermal decomposition of organic materials in the presence of chemical catalysts. This process follows an oxidation–hydration reaction sequence, as CH4 remains highly stable under hydrothermal conditions.

5.3. Sources of Hydrocarbon Fluids

This study identifies a range of organic compounds in FIs, including aliphatic hydrocarbons (evenkite and hatchettine), PAHs, and mixtures of aliphatic and aromatic compounds (kerogen). Low molecular weight hydrocarbons (methane) and brines-bearing PAHs were also identified. The identified fluids reflect varying maturity levels and could be linked to the three major oil-prone units in northern Tunisia.
Firstly, the Albian Lower Fahdene Formation [33,108,109,110] is located in the Tunisian Sillon. This Formation is rich in limestones alternating with dark pelagic marls, in which kerogen predominates with a high degree of maturity [111]. Secondly, the Cenomanian–Turonian Bahloul Formation [108,109,110,112] is characterized by dark laminated limestone with a bituminous smell when crushed [113]. Thirdly, the Ypresian Bou Dabbous Formation [44,109,114,115] extends from northern Tunisia to offshore Libya [115]. Deep basins also host the pelagic Bou Dabbous Formation within the Tunisian Atlas [44,114,115]. All three formations are largely widespread across the ZFP.
The presence of PAHs in the analyzed samples provides further insights into the history of the hydrocarbon fluids trapped in fluorites. Most of the PAHs-bearing FIs examined in this study lacked distinct Raman peaks. This is due to the presence of intense fluorescence bands, which are caused mainly by aromatic compounds [11]. The abundance of fluorescence signals in HCFIs suggests a greater presence of aromatic compounds (Figure 14) than of aliphatic compounds (Figure 15 and Figure 16). Previous works [116] detected thirty-seven aromatic hydrocarbon compounds from the Fahdene Formation. PAH compounds are reliable and authentic indicators of ancient hydrocarbons, as they are not subject to post-depositional alteration or contamination [117,118]. PAHs are widely recognized for their high stability [119], particularly coronene (Figure 14A) [120], which can be transported by hydrothermal fluids without thermal degradation. These findings suggest the presence of a potential mechanism for the migration of hydrocarbons across deep-seated faults where hydrothermal activity is prevalent.
In addition to PAHs, solid bitumen and kerogen have been identified in primary and secondary inclusions. The RMS spectra of these compounds illustrate the transformation of OM. Bitumen was found as primary, pseudosecondary, and secondary inclusions (SB and SB + L: Figure 13A). Two first-order characteristic bands have been defined in the Raman spectra of bitumen (SB and SBL) and kerogen (SKLHC) FIs, namely, the D and G bands [121,122]. The Raman spectra can be compared to those of solid bitumen from Zbecno and Klecany in the volcano–sedimentary complex in the Czech Republic [72] (Figure 13A). They can also be compared to the solid bitumen in the Sichuan Basin, from the Sinian carbonate reservoirs in China [123]. An increase in G–D band separation and a decrease in band intensity suggest OM maturation [124]. The G band has been attributed to carbon atom vibrations in aromatic ring structures [125,126]. It serves as an aromatic indicator with a high aromatic content, which indicates a reduced potential for hydrocarbon generation. As maturity increases simultaneously with aromaticity, the G band shifts slightly upward [124].
Kerogen, found as primary inclusions (SKLHC: Figure 13B), is defined as an insoluble fraction of OM that forms a crosslinked polymer network capable of extracting and trapping soluble bitumen [72,127]. This network has aromatic structures connected by heteroatomic and aliphatic moieties [124]. The Raman spectra of kerogen HCFIs are quite similar to those reported by [73] (see Figure 13B), [13,15]. The increase in height and intensity of the D band has been defined as the main feature of the over-maturity stage of kerogen and bitumen [12,128]. As maturity increases, the D band shifts toward lower wavenumbers (1370–1330 cm−1) [18,129]. The investigated HCFIs could be combinations of kerogen residues and migrated bitumen at varying maturity levels, with highly mature hydrocarbon fluids showing significant D and G peaks.
In this context, the wavenumber positions, G–D, width at half maximum (FWHM), and other parameters in the Raman spectra of carbonaceous materials change systematically as a result of thermal maturity [130]. The evolution of the molecular structure of kerogen, as evidenced by RMS, is correlated with the maturity stage. This evolution involves the formation of aromatic clusters as aliphatic carbon bonds break during hydrocarbon production [131,132]. The potential of kerogen for hydrocarbon production primarily lies in its aliphatic content [13,133]. This reflects the transformation of OM from a disordered state to an organized state, with increased interactions in aromatic rings [13,133]. Han et al. [32] reported the presence of various types of hydrocarbons in HCFI from the ZFP. This work shows indications of increased maturity as evidenced by a higher degree of molecular complexity (e.g., increasing carbon numbers and double bond equivalents). For example, it mentions changes in carbon number distributions and the presence of various compound classes indicative of thermal maturity. This thermal transformation would also account for the occurrence of graphite FIs (SGr-Evk: Figure 18).

5.4. Critical Insights into the Origin of Graphite

The thermal transformation reported previously (Section 5.3) could also be marked by changes in the RMS peaks of graphite (Figure 18). These changes have been attributed to an increase in the size of the graphitic domains [124]. Within this context, the RMS triplet bands in the range of 3000–2700 cm−1 appear to be related to the RMS peaks at 1355–1580 cm−1, both of which are attributed to graphite peaks (Figure 18). As OM undergoes transformations under heating mechanisms, it gradually organizes carbon atoms into graphite particles [138,139].
The peak frequency gradually decreases from around 1595–1608 cm−1 for low-organized kerogens to 1575–1580 cm−1 for graphite, as does the peak width of the RMS band. These changes are observed in the RMS spectra of gradually trapped kerogen [128]. However, in this work, the Raman spectra of graphite (Figure 18) differ significantly from those of kerogen and bitumen (Figure 13A,B). Notably, they exhibit a D3 peak, which strongly suggests a disordered state of OM. Previous studies noted three peak profiles in the graphite Raman spectra [134,135], which are attributed to a multilayer graphene structure [136]. This structure indicates the non-purity of graphite. The additional layers and defects in the graphene structure contribute to the spectral variations. An increase in carbon aromaticity was also detected during natural maturation by igneous intrusions [140] or by an increase in burial depth [141]. While both processes are plausible, the conversion of OM in the Cretaceous and lower-Eocene source rocks to graphite could be attributed to the heat influx from Miocene magmatism associated with margin extensional activity. However, the possibility of increased burial depth driving this transformation cannot be ruled out. Further evidence is required to differentiate between these two mechanisms.

5.5. Insights into the Origins of Evenkite and Hatchettine

The Raman spectra of the aliphatic compounds (Figure 15 and Figure 16) in HCFIs share many similarities with three components derived from volcanic and sedimentary rocks: (i) evenkite, a rare hydrocarbon mineral consisting of n-alkanes in the C20–C30 range, with predominant moieties in the C23–C25 range [142]; (ii) n-tetracosane (C24H50), a paraffin hydrocarbon; and (iii) hatchettine, an amorphous hydrocarbon mixture. Differences in the thermal history, depositional settings, and diagenetic processes within the sedimentary environments where these compounds formed could account for the small dissimilarities with our results. These differences may include shifts in peak intensities or slight variations in molecular composition. For example, variations in temperature, pressure, or the presence of certain minerals during deposition and burial could influence the chemical behavior of hydrocarbons. These factors could contribute to these observed dissimilarities.
A comparison between these geo-paraffins and our HCFIs confirms that the studied fluids are saturated hydrocarbons with aliphatic features. They are classified as highly complex mixtures of n-alkanes and ramified hydrocarbons [74].
The evident gap in organic mineralogy is particularly obvious for hydrocarbons, the most dominant natural organic substances. Evenkite has been found in a few settings around the world, including the Evenkia region of Siberia [143], the French Alps [142], and the Hyblean Plateau in Sicily [144]. Evenkite “can exist in three rotary–crystalline states: low, medium, and high temperature” [145]. The association of evenkite with n-alkanes makes this mineral useful for studying less understood phase states [146]. During heating experiments, the state behavior of homologs (e.g., oil paraffines) is identical to that of synthesized n-alkane solid solutions [146]. As a result, evenkite is considered a homogeneous orthorhombic crystalline solid solution [145]. Otherwise, the transition of n-paraffins to a crystalline structure is linked to variations in thermal kinematics [147,148]. The hydrocarbon influx at Hammam–Zriba may have experienced similar thermal conditions while migrating from deep reservoirs to the site of paleofluid trapping within fluorite. These varying degrees of heating likely resulted in the varying states of evenkite hydrocarbons observed in the inclusions.
According to previous studies e.g., [74,142,146], evenkite and hatchettine are considered equivalent hydrocarbon minerals, despite differences in their composition and structure. Both minerals have rarely been documented in epigenetic deposits in sedimentary–diagenetic environments. These minerals occur within carbonate concretions and are associated with fractures and fissures in carbonate and clastic sediments [149,150,151]. Hatchettine is found in association with petroleum filling cavities within concretions [149,150], often containing brines [152]. Both minerals were discovered in association with bituminous masses within fractures in sandstones and clastic sediments [151].
Evenkite is a hydrocarbon mineral that contains long-chain alkanes, but the exact processes and sources of these hydrocarbons are still not completely clear. The results of our studies of evenkite-bearing fluid inclusions suggest the following plausible sources and processes:
  • Evenkite is often found in association with magmatic rocks or hydrothermal materials, e.g., [142,143,153]. Although most hydrocarbons are believed to be of biogenic origin, some studies suggest that hydrocarbon alkanes may also originate from mantle-derived rocks, e.g., [154,155]. The absence of evidence for magmatic activity during ore formation is one of the most notable characteristics of this extensive F-rich hydrothermal activity in the ZFP. However, the presence of deep-sourced CO2 and CH4 gases may point to a hidden undiscovered magmatic activity that occurred during fluorite precipitation.
  • Long-chain n-alkanes can be produced from terrestrial and/or marine biogenic sources. Evenkite forms by the thermal cracking of OM, i.e., living organisms and marine flora in sedimentary rocks [142]. The carbon preference index (CPI) values obtained from the n-alkanes of the Fahdene and Bahloul Cretaceous source rocks [116] indicated natural rather than anthropogenic input [156,157]. Typically, photosynthetic-producing bacteria and aquatic algal phytoplankton are dominated by short-chain n-alkanes (SHC) < C23. Whereas terrestrial plants are dominated by long-chain n-alkanes (LHC) > C23 [157,158], suggesting a predominant terrestrial contribution to the studied n-alkanes and a more proximal environment. During the late Jurassic, the ZFP was dominated by a reef complex known as the Ressas Formation [159]. The Jurassic–Cretaceous boundary at Hammam–Zriba marks a transition from a relatively shallow carbonate platform to a more restricted environment [160]. In warm climates, vegetation produces longer chain n-alkanes than those found in cooler climates [161]. Since the abundance of n-alkanes in algae reflects the origin of OM [161,162], the referential biodegradation of high molecular weight (HMW) n-alkanes from terrestrial plants by bacterioplankton [163] could explain the occurrence of n-alkane evenkite in the paleofluids of MVT fluorite deposits.

5.6. Genetic Model of the Epigenetic Fluorite Deposit

The presence of hydrocarbon-rich fluid inclusions (HCFIs) alongside saline basinal brines within the same optical planes strongly suggests a synchronous trapping of both fluid types. These findings suggest that hydrocarbons were active participants during mineralization. In this context, the involvement of hydrocarbons in fluorite mineralization is recognized as a significant factor influencing ore-forming processes in sedimentary and hydrothermal systems, e.g., [164,165]. These hydrocarbon-bearing fluids may have influenced mineralization through several mechanisms. Firstly, hydrocarbons often act as reducing agents; when introduced into oxidized basinal brines, they can induce redox reactions that promote the deposition of fluorite and associated minerals, as observed in the Paris Basin, where reduced fluids migrating from organic-rich layers interact with sulfate-rich brines to precipitate barite and fluorite [166]. The reduction of sulfate to sulfide is often facilitated by bacterial and thermochemical activities [167]. The resulting sulfides can react with metals to form sulfide minerals, altering the geochemical environment and potentially promoting the precipitation of fluorite [168]. Secondly, the presence of petroleum can lead to the generation of organic acids during maturation, increasing porosity and permeability [169]. These organic acids can increase the solubility of various elements, including calcium and fluorine, by forming complexes [170]. Studies have demonstrated that at temperatures below 200 °C, organic acids, including carboxylate and organosulfur ligands, can effectively form stable aqueous complexes with metals such as Ba, Pb, and rare earth elements (REEs) [171,172]. This process facilitates their transport in basinal brines and hydrothermal systems [171]. The increased solubility can facilitate the transport of these ions through the sedimentary strata, ultimately leading to their precipitation as fluorite when conditions become suitable. Additionally, the mixing of immiscible hydrocarbon-rich fluids with oxidized, saline mineralizing fluids can trigger abrupt changes in pressure and chemical composition [173]. This destabilizes previously dissolved complexes and leads to rapid precipitation of minerals such as fluorite, as demonstrated in the La Purísima deposit in Mexico [173]. Finally, petroleum migration pathways can act as conduits for fluorine-rich fluids from deeper, hotter regions to shallower, cooler sedimentary layers [174]. The cooling of these fluorine-rich fluids, combined with changes in pH or mixing with other fluids, can trigger the precipitation of fluorite within the sedimentary rocks, a process described in the context of hydrothermal ore deposits [81].
Based on the current results of the chemical composition of the fluids and previous studies [1], two stages were identified for the F mineralization process: (i) a pre-ore stage without fluorite and (ii) a late hydrothermal ore stage where stratiform and vein fluorite formed after the Cretaceous period. Considering that oil production in northern Tunisia occurred from the middle Paleogene to the upper-late Neogene [110,175], the post-Cretaceous age of epigenetic fluorite is plausible. Determining the timing of these events may also provide insights into the synchronization between oil migration and mineralization.
The structural framework of Hammam–Zriba controlled mineralization. The fluorite occurrence seems to be connected to the intersection of deep SW–NE basin faults and NW-trending faults that formed during compressional events in the middle-Eocene and middle–Miocene. These events were caused by the subduction and collision between the African and European plates. The overlapping fault zones provided vertical pathways for rising brines and hydrocarbons, leading to fluorite formation in veins and banded stratiform orebodies. This process likely began in the late Miocene onward through cracks from N140–160-trending horsts and grabens. When reaching the top of the paleorelief, fluorine-bearing fluids in the form of CaF+ and NaF complexes were subsequently trapped within Jurassic marly seals during different periods. Eventually, these fluids spread horizontally into porous Portlandian limestone reservoirs.
The hydrocarbon fluids within the Hammam–Zriba fluorite system are closely linked to the thermal maturity of their source rocks. In this context, Han et al. [32] reported that the oil trapped in the HCFIs’ Hammam–Zriba fluorites originated from a source rock with an estimated thermal maturity of approximately 0.93% Rc (critical vitrinite reflectance). According to the American Association of Petroleum Geologists (AAPG), the typical oil generation window occurs between 0.6% and 1.3% Ro (vitrinite reflectance). Therefore, 0.93% Rc is considered moderately high maturity, and oil generation is actively occurring or near its peak [118]. The Fahdene and Bahloul Cretaceous source rocks have a high maturity level, with oil and gas generation beginning in the late Cretaceous. Peak oil migration occurred in the early Miocene during the Alpine orogenic episode. The expulsion started in the lower-Eocene (Ypresian) and lasted until the Miocene–Pliocene [110,175]. CO2 dissolved in hydrocarbons is expelled from various kerogen types in these source rocks [30,110,111], resulting in abundant aliphatic hydrocarbons (family I). The composition of kerogen changes during sedimentary evolution, and its oxygen and hydrogen concentrations decrease due to extensive alteration. At high maturity levels, vapor fluids, mainly CH4, become prominent. Aliphatic linkages are cleaved to CH4, while aromatic components increase through condensation [72]. This leads to an increase in the aromaticity of HCFIs at Hammam–Zriba (family II).
The accumulation of HCFIs in the ZFP challenges the notion that oil transforms into methane and bitumen by the end of the early catagenesis stage. The kerogen structure is strongly correlated with the maturity level, which leads to the accumulation of hydrocarbons and bitumen during migration in sedimentary host rocks and during the hydrothermal mineralizing process. Aromatics in kerogen are bonded by aliphatics and heteroatoms [124], potentially trapping solid viscous bitumen [127]. This phase comprises a mixture of aliphatic and aromatic hydrocarbons (family III). Carbon aromaticity increases with maturation, whether through processes of magmatic intrusions [140] or increased burial depth [141]. Significant explosive magmatism and major vertical faults, attributed to Pyrenean and Alpine collisions, affected both the basin and sedimentary basins during the Cretaceous and Cenozoic [46]. However, there is no direct evidence of magmatic activity influencing the ZFP. Instead, the maturation of OM is more accurately attributed to high geothermal gradients associated with prolonged sedimentary basin subsidence. Therefore, OM maturation in this context reflects a purely sedimentary–tectonic control rather than magmatic input.
The structural evolution of the Hammam–Zriba area reflects a complex interplay between compressional and extensional tectonics occurring at different geological stages. During the late Eocene to early Miocene, the region experienced compressional deformation associated with the Alpine Orogeny. This led to the formation of fault-inversion folds and the development of a foreland basin on the external margin of the Zaghouan–Ressas Structural Belt (ZRSB) [44,176]. This compressive regime induced significant tectonic loading, promoting the upward flow of Triassic evaporites into the fold cores. Subsequently, in the post-Miocene period, a shift to an extensional regime occurred, reactivating earlier syn-rift normal faults. These NE–SW-trending faults propagated through the post-rift sequence and were kinematically linked to NW–SE-trending graben structures that crosscut the ZRSB [44]. This transition from compression to post-orogenic extension explains the co-occurrence of contractional folding and extensional faulting in the same structural domain. The topographic gradients generated during the compressional phase also facilitated the circulation of deep basinal brines (i.e., hydrothermal fluids), which is consistent with the fluid inclusion homogenization temperatures observed in fluorite (85–145 ± 5 °C).
The Hammam–Zriba deposit, classified as an MVT deposit [56], is connected to hydrothermal circulation [1,177] along faults from NE–SW compressional events. The genetic model involves mineralizing fluids derived from basinal reservoirs and subsequent fluid interactions. This process is commonly recognized as a key mechanism in MVT deposits. It has been investigated for several economic, stratabound, epigenetic, carbonate–hosted fluorite deposits worldwide, e.g., [178,179].

6. Conclusions

This study provides new data on the fluid inclusions hosted in fluorites within the Hammam–Zriba F–Ba(Zn–Pb) deposit. Key findings include the following:
  • The fluid inclusions were analyzed using a combination of Raman spectroscopy, petrography, and microthermometry. These techniques revealed the heterogenous trapping of immiscible fluids, with four essential types of inclusions identified: liquid-, vapor-, and solid-dominated fluid inclusions, and hydrocarbon-bearing inclusions.
  • Raman spectroscopy identified previously undetected organic compounds, including aliphatic hydrocarbons (evenkite C24H50 and/or hatchettine C38H78), polycyclic aromatic hydrocarbons (PAHs) (coronene C24H12), mixtures of aliphatic and aromatic compounds (bitumen: CnH2n+2 where n typically ranges between 20 and 40), and kerogen (the chemical formula of kerogen is not a specific and fixed formula due to its varied and complex composition), as well as water-containing low-molecular-weight (LMW) hydrocarbons (CH4) and PAH-containing water.
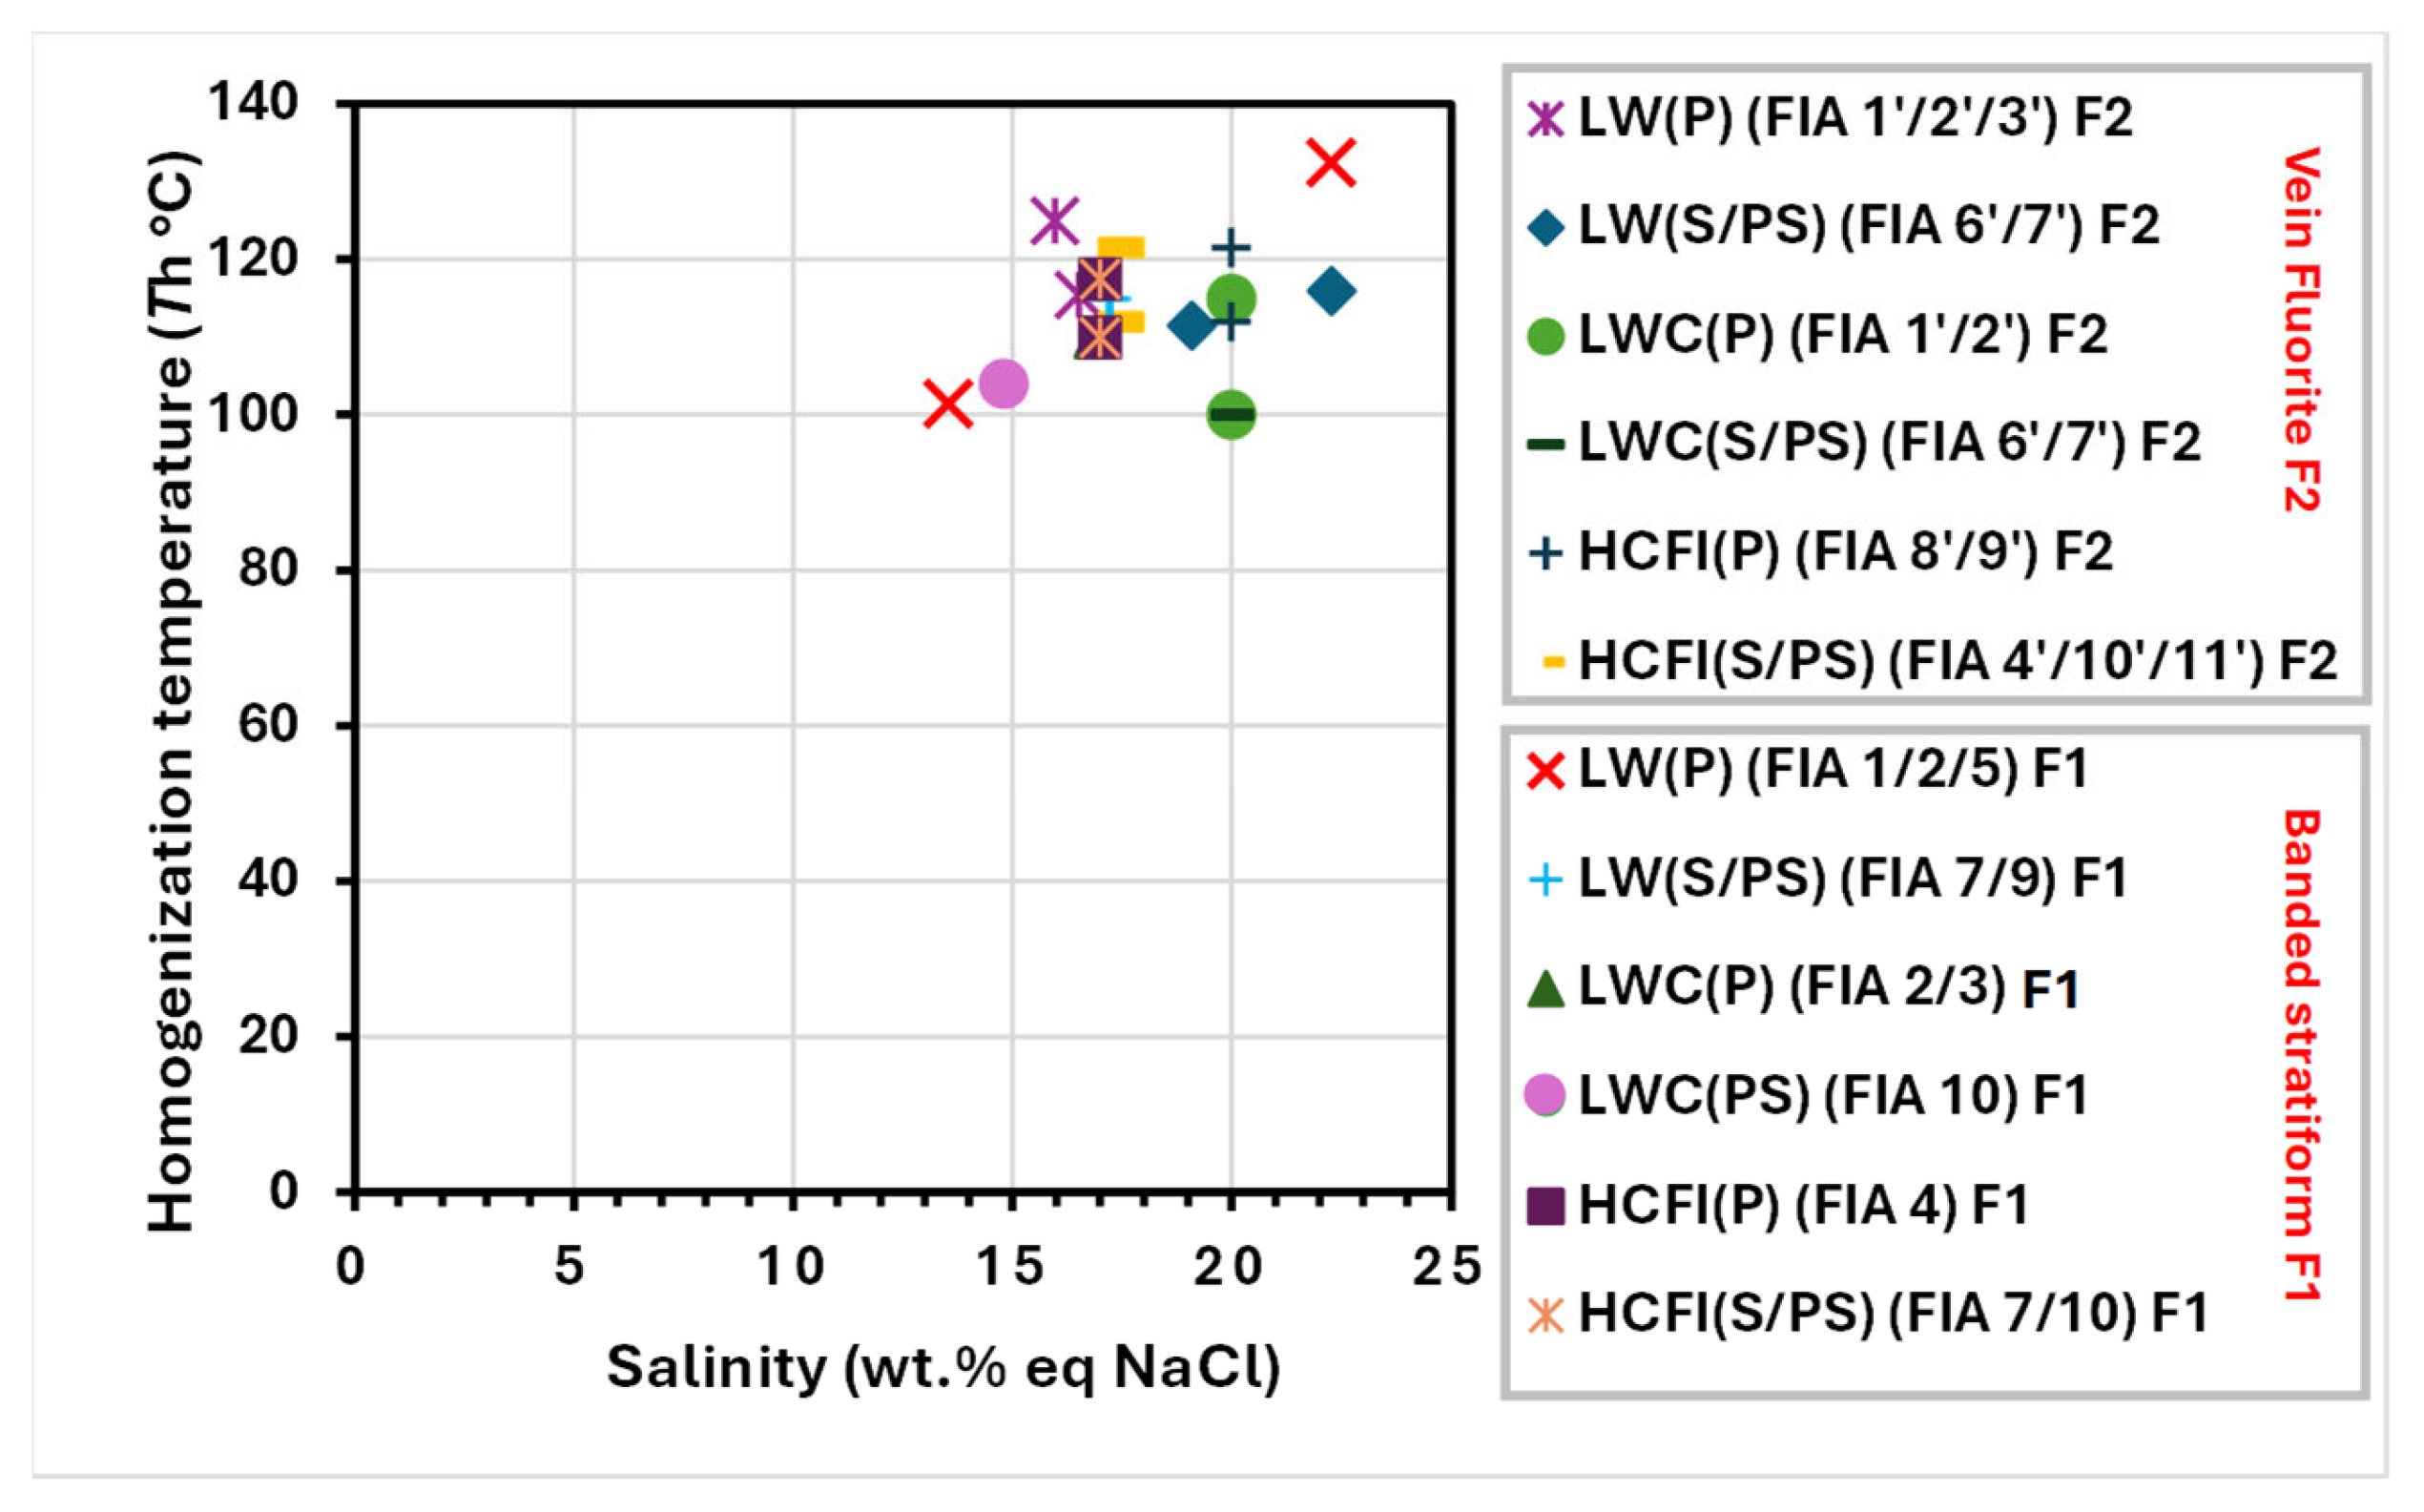
  • Several hydrothermal stages of fluid circulation are recognized, involving the interaction of different fluid-end members: (i) The first major episode involves the H2O–NaCl–CaCl2 fluid system of hot (85 to 145 ± 5 °C) basinal brines (~13–22 wt.% eq. NaCl) derived from interactions with Triassic salts. (ii) Next is an episode of oil-bearing fluids associated with the expulsion of deep CO2–CH4–N2-rich fluids during Miocene compressional events. (iii) In later unmixing processes, paleofluids were linked to the accumulation of evenkite, bitumen, and graphite within the inclusions.
  • The presence of the hydrocarbon mineral evenkite is a very rare case of hydrocarbon accumulation worldwide. Evenkite-bearing fluid inclusions are reported for the first time in Tunisian MVT deposits, which suggests the presence of deep-sourced long-chain n-alkanes. Some evidence suggests that evenkite may have formed from the same type of organic matter that produced oil at the Hammam–Zriba F–Ba(Zn–Pb) deposit.
  • The presence of bitumen, kerogen, and graphite in coeval inclusions indicates that the oil and organic matter experienced varying stages of modification. The entrapped fluids preserved different generations of hydrocarbons, depending on their maturity. These hydrocarbons were most likely released at different stages of burial in the source rock. The Raman spectra allowed the identification of three oil families (I, II and III). Family I (aliphatic) is attributed to the lower-Eocene Bou Dabbous Formation and family II (aromatic) is attributed to the Albian Fahdene or Cenomanian–Turonian Bahloul source rocks, respectively. While family III is believed to be a mixture of both aliphatic and aromatic compounds produced by all three sources.

Author Contributions

C.S.: Writing—original draft, Conceptualization, Methodology, Visualization, Investigation. F.S.: Supervision, Validation, Resources, Writing—review & editing. G.D.G.: Resources, Funding acquisition. A.G.: Software, Writing—review & editing, Data curation, Resources. S.F.: Writing—review & editing, Resources. All authors have read and agreed to the published version of the manuscript.

Funding

This study was funded by the grants “Bourse d’Alternance” provided by the Tunisian Ministry of Higher Education and Scientific Research. The authors gratefully acknowledge the partial financial support from the Università degli Studi di Cagliari, Dipartimento di Scienze Chimiche e Geologiche, Italy.

Data Availability Statement

The original contributions presented in this study are included in the article. Further inquiries can be directed to the corresponding author.

Acknowledgments

We would like to express our deepest gratitude to Alessia Borghini and Christoph Möller for providing access to the Raman Laboratory at the Institute für Geowissenschaften, Germany. The authors are grateful to the University of Aveiro (Portugal) for providing access to their laboratories. We also appreciate the Guest Editors and Editor-in-Chief for the handling of this manuscript.

Conflicts of Interest

The authors declare no conflicts of interest.

References

  1. Bouhlel, S.; Fortuné, J.P.; Guilhaumou, N.; Touray, J.C. Les Minéralisations Stratiformes à F-Ba de Hammam Zriba, Jebel Guébli (Tunisie Nord Orientale): L’apport Des Études d’inclusions Fluides à La Modélisation Génétique. Miner. Depos. 1988, 23, 166–173. [Google Scholar] [CrossRef]
  2. Souissi, F.; Fortune, J.-P.; Sassi, R. La Minéralisation Fluorée de Type Mississippi Valley Du Jebel Stah (Tunisie Nord-Orientale). Bull. Soc. Géol. Fr. 1998, 169, 163–175. [Google Scholar]
  3. Souissi, F.; Souissi, R.; Dandurand, J.-L. The Genesis of the Mississippi Valley-Type Fluorite Ore at Jebel Stah (Zaghouan District, North-Eastern Tunisia) Constrained by Thermal and Chemical Properties of Fluids and REE and Sr Isotope Geochemistry; Geochemistry—Earth’s System Process; IntechOpen: London, UK, 2012. [Google Scholar] [CrossRef]
  4. Souissi, F.; Dandurand, J.L.; Fortuné, J.P. Thermal and Chemical Evolution of Fluids during Fluorite Deposition in the Zaghouan Province, North-Eastern Tunisia. Miner. Depos. 1997, 32, 257–270. [Google Scholar] [CrossRef]
  5. Souissi, F.; Souissi, R.; Dandurand, J.L. The Mississippi Valley-Type Fluorite Ore at Jebel Stah (Zaghouan District, North-Eastern Tunisia): Contribution of REE and Sr Isotope Geochemistries to the Genetic Model. Ore Geol. Rev. 2010, 37, 15–30. [Google Scholar] [CrossRef]
  6. Souissi, F.; Jemmali, N.; Souissi, R.; Dandurand, J.L. REE and Isotope (Sr, S, and Pb) Geochemistry to Constrain the Genesis and Timing of the F-(Ba-Pb-Zn) Ores of the Zaghouan District (NE Tunisia). Ore Geol. Rev. 2013, 55, 1–12. [Google Scholar] [CrossRef]
  7. Kenderes, S.M.; Appold, M.S. Fluorine Concentrations of Ore Fluids in the Illinois-Kentucky District: Evidence from SEM-EDS Analysis of Fluid Inclusion Decrepitates. Geochim. Cosmochim. Acta 2017, 210, 132–151. [Google Scholar] [CrossRef]
  8. Bau, M.; Romer, R.L.; Lüders, V.; Dulski, P. Tracing Element Sources of Hydrothermal Mineral Deposits: REE and Y Distribution and Sr-Nd-Pb Isotopes in Fluorite from MVT Deposits in the Pennine Orefield, England. Miner. Depos. 2003, 38, 992–1008. [Google Scholar] [CrossRef]
  9. González-Partida, E.; Carrillo-Chávez, A.; Grimmer, J.O.W.; Pironon, J.; Mutterer, J.; Levresse, G. Fluorite Deposits at Encantada-Buenavista, Mexico: Products of Mississippi Valley Type Processes. Ore Geol. Rev. 2003, 23, 107–124. [Google Scholar] [CrossRef]
  10. Kraemer, D.; Viehmann, S.; Banks, D.; Sumoondur, A.D.; Koeberl, C.; Bau, M. Regional Variations in Fluid Formation and Metal Sources in MVT Mineralization in the Pennine Orefield, UK: Implications from Rare Earth Element and Yttrium Distribution, Sr-Nd Isotopes and Fluid Inclusion Compositions of Hydrothermal Vein Fluorites. Ore Geol. Rev. 2019, 107, 960–972. [Google Scholar] [CrossRef]
  11. Bourdet, J.; Burruss, R.C.; Bodnar, R.J.; Eadington, P.J. Assessment of UV-Raman for Analysis of Petroleum Inclusions. In Proceedings of the European Current Research on Fluid Inclusions (ECROFI–XXI), Montanuniversität Leoben, Leoben, Austria, 9–11 August 2011; pp. 50–51. [Google Scholar]
  12. Liu, D.H.; Xiao, X.M.; Tian, H.; Min, Y.S.; Zhou, Q.; Cheng, P.; Shen, J.G. Sample Maturation Calculated Using Raman Spectroscopic Parameters for Solid Organics: Methodology and Geological Applications. Chin. Sci. Bull. 2013, 58, 1285–1298. [Google Scholar] [CrossRef]
  13. Gao, Y.; Zou, Y.R.; Liang, T.; Peng, P. Jump in the Structure of Type I Kerogen Revealed from Pyrolysis and 13C DP MAS NMR. Org. Geochem. 2017, 112, 105–118. [Google Scholar] [CrossRef]
  14. Richardson, C.K.; Rye, R.O.; Wasserman, M.D. The Chemical and Thermal Evolution of the Fluids in the Cave-in-Rock Fluorspar District, Illinois; Stable Isotope Systematics at the Deardorff Mine. Econ. Geol. 1988, 83, 765–783. [Google Scholar] [CrossRef]
  15. Wang, G.; Lei, Q.; Huang, Z.; Liu, G.; Fu, Y.; Li, N.; Liu, J. Genetic Relationship between Mississippi Valley-Type Pb–Zn Mineralization and Hydrocarbon Accumulation in the Wusihe Deposits, Southwestern Margin of the Sichuan Basin, China. Minerals 2022, 12, 1447. [Google Scholar] [CrossRef]
  16. Petrov, D.V. Raman Spectrum of Methane in Nitrogen, Carbon Dioxide, Hydrogen, Ethane, and Propane Environments. Spectrochim. Acta Part A Mol. Biomol. Spectrosc. 2018, 191, 573–578. [Google Scholar] [CrossRef]
  17. Wang, Y.; Qiu, N.; Borjigin, T.; Shen, B.; Xie, X.; Ma, Z.; Lu, C.; Yang, Y.; Yang, L.; Cheng, L.; et al. Integrated Assessment of Thermal Maturity of the Upper Ordovician–Lower Silurian Wufeng–Longmaxi Shale in Sichuan Basin, China. Mar. Pet. Geol. 2019, 100, 447–465. [Google Scholar] [CrossRef]
  18. Schito, A.; Romano, C.; Corrado, S.; Grigo, D.; Poe, B. Diagenetic Thermal Evolution of Organic Matter by Raman Spectroscopy. Org. Geochem. 2017, 106, 57–67. [Google Scholar] [CrossRef]
  19. Schito, A.; Muirhead, D.; Bowden, S.; Parnell, J. Hydrothermal Generation of Hydrocarbons in Basement Rocks, Southern Tuscany. Ital. J. Geosci. 2022, 141, 5–19. [Google Scholar] [CrossRef]
  20. Craddock, P.R.; Sauerer, B. Robust Determination of Kerogen Properties in Organic-Rich Mudrocks via Raman Spectroscopy. Org. Geochem. 2022, 169, 104381. [Google Scholar] [CrossRef]
  21. Touray, J.C.; Yajima, J. Hydrocarbures Liquides Inclus Dans Des Fluorites Tunisiennes. Miner. Depos. 1967, 2, 286–290. [Google Scholar] [CrossRef]
  22. Touray, J.C. Hydrocarbures Liquides et Gazeux En Inclusions Dans Les Minéraux. Bull. Cent. Rech. Pau. SNPA 1969, 3, 429–441. [Google Scholar]
  23. Touray, J.-C. Deep Origin CO_2 Trapped by Healed Cracks in Epigenetic Tunisian Fluorites. Proc. Int. Mineral. Ass. Int. Ass. Genesis Ore Deposits, Gen. Meeting. Tokyo Kyoto Publ. Soc. Min. Geol. 1971, 3, 351–354. [Google Scholar]
  24. Bejaoui, J.; Bouhlel, S.; Cardellach, E.; Canals, À.; Perona, J.; Piqué, À. Mineralization and Fluid Inclusion Studies of the Aptian Carbonate-Hosted PbZnBa Ore Deposits at Jebel Hamra, Central Tunisia. J. Geochem. Explor. 2013, 128, 136–146. [Google Scholar] [CrossRef]
  25. Souissi, F. Etude Gitologique et Conditions de Formation Des Gisements de Fluorine (Pb, Zn, Ba) Du Jebel Zaghouan (jJ. Stah et Sidi Taya) et Du Jebel Oust (Tunisie Nord-Orientale). Ph.D. Thesis, Université Paul Sabatier, Toulouse, France, 1987; 220p. [Google Scholar]
  26. Souissi, F.; Fortuné, J.P.; Sassi, R.; Bouhlel, S. Le Gisement de Fluorine et de Galène de Sidi Taya: Minéralogie et Étude Des Inclusions Fluides. Notes Du. Serv. Géologique Tunis. 1997, 63, 83–102. [Google Scholar]
  27. Bejaoui, J. Géologie, Minéralogie, Éléments En Traces, Inclusions Fluides, Isotopes et Modélisation Génétique Des Gisements à Pb-Zn et/Ou F, Ba de La Tunisie Centroseptentrionale (Fedj Hassène, Hamra, Ajered, Kohol, Mecella, Mokta et M’Tak). Ph.D. Thesis, Université de Tunis El Manar, Tunis, Tunisia, 2012; p. 260. [Google Scholar]
  28. Guilhaumou, N.; Touray, J.-C.; Bouhlel, S. Stretching of Hydrocarbon Fluid Inclusions in Fluorite at 200 and 400 Bars Confining Pressure. Application to Low Pressure Geobarometry. Bull. Mineral. 1988, 111, 421–426. [Google Scholar] [CrossRef]
  29. Guilhaumou, N.; Szydlowskii, N.; Pradier, B. Characterization of Hydrocarbon Fluid Inclusions by Infra-Red and Fluorescence Microspectrometry. Mineral. Mag. 1990, 54, 311–324. [Google Scholar] [CrossRef]
  30. Benchilla, L.; Guilhaumou, N.; Mougin, P.; Jaswal, T.; Roure, F. Reconstruction of Palaeo-Burial History and Pore Fluid Pressure in Foothill Areas: A Sensitivity Test in the Hammam Zriba (Tunisia) and Koh-i-Maran (Pakistan) Ore Deposits. Geofluids 2003, 3, 103–123. [Google Scholar] [CrossRef]
  31. Guilhaumou, N.; Dumas, P. Synchrotron FTIR Hydrocarbon Fluid Inclusion Microanalysis Applied to Diagenetic History and Fluid Flow Reconstruction in Reservoir Appraisal. Oil Gas Sci. Technol. 2005, 60, 763–779. [Google Scholar] [CrossRef]
  32. Han, Y.; Noah, M.; Lüders, V.; Horsfield, B.; Mangelsdorf, K. NSO-Compounds in Oil-Bearing Fluid Inclusions Revealed by FT-ICR-MS in APPI (+) and ESI (−) Modes: A New Method Development. Org. Geochem. 2020, 149, 104113. [Google Scholar] [CrossRef]
  33. Klett, T.R. Total Petroleum Systems of the Pelagian Province, Tunisia, Libya, Italy, and Malta; the Bou Dabbous, Tertiary and Jurassic-Cretaceous Composite; US Department of the Interior, US Geological Survey Bulletin: Reston, VA, USA, 2001; pp. 1–27. [CrossRef]
  34. Camprubí, A.; González-Partida, E.; Richard, A.; Boiron, M.-C.; González-Ruiz, L.E.; Aguilar-Ramírez, C.F.; Fuentes-Guzmán, E.; González-Ruiz, D.; Legouix, C. MVT-Like Fluorite Deposits and Oligocene Magmatic-Hydrothermal Fluorite–Be–U–Mo–P–V Overprints in Northern Coahuila, Mexico. Minerals 2019, 9, 58. [Google Scholar] [CrossRef]
  35. Piqué, A.; Tricart, P.; Guiraud, R.; Laville, E.; Bouaziz, S.; Amrhar, M.; Ait Ouali, R. The Mesozoic–Cenozoic Atlas Belt (North Africa): An Overview. Geodin. Acta 2002, 15, 185–208. [Google Scholar] [CrossRef]
  36. Melki, F.; Zouaghi, T.; Ben Chelbi, M.; Bédir, M.; Zargouni, F. Role of the NE-SW Hercynian Master Fault Systems and Associated Lineaments on the Structuring and Evolution of the Mesozoic and Cenozoic Basins of the Alpine Margin, Northern Tunisia. In Tectonics—Recent Advances; IntechOpen: London, UK, 2012; pp. 131–168. [Google Scholar]
  37. Zouaghi, T.; Bédir, M.; Melki, F.; Gabtni, H.; Gharsalli, R.; Bessioud, A.; Zargouni, F. Neogene Sediment Deformations and Tectonic Features of Northeastern Tunisia: Evidence for Paleoseismicity. Arab. J. Geosci. 2011, 4, 1301–1314. [Google Scholar] [CrossRef]
  38. Soumaya, A.; Ben Ayed, N.; Delvaux, D.; Ghanmi, M. Spatial Variation of Present-day Stress Field and Tectonic Regime in Tunisia and Surroundings from Formal Inversion of Focal Mechanisms: Geodynamic Implications for Central Mediterranean. Tectonics 2015, 34, 1154–1180. [Google Scholar] [CrossRef]
  39. Roure, F.; Casero, P.; Addoum, B. Alpine Inversion of the North African Margin and Delamination of Its Continental Lithosphere. Tectonics 2012, 31, 1–28. [Google Scholar] [CrossRef]
  40. Ben Ayed, N. Evolution Tectonique de l’avant-Pays de La Chaîne Alpine de Tunisie Du Début Du Mésozoïque à l’Actuel. Ph.D. Thesis, Université Paris Sud-Paris XI, Paris, France, 1986; 328p. [Google Scholar]
  41. Turki, M.M.; Delteil, J.; Truillet, R.; Yaich, C. Les Inversions Tectoniques de La Tunisie Centro-Septentrionale. Bull. Soc. Géol. Fr. 1988, 4, 399–406. [Google Scholar] [CrossRef]
  42. Coward, M.; Dietrich, D. Alpine Tectonics—An Overview. Geol. Soc. Lond. Spec. Publ. 1989, 45, 1–29. [Google Scholar] [CrossRef]
  43. Melki, F.; Zargouni, F. Tectonique Cassante Post-Jurassique de la Mine de Hammam Zriba. Bull. Soc. Geol. Fr. 1991, 162, 851–858. [Google Scholar]
  44. Morgan, M.A.; Grocott, J.; Moody, R.T.J. The Structural Evolution of the Zaghouan-Ressas Structural Belt, Northern Tunisia. Geol. Soc. Lond. Spec. Publ. 1998, 132, 405–422. [Google Scholar] [CrossRef]
  45. Frizon de Lamotte, D.; Mercier, E.; Outtani, F.; Addoum, B.; Ghandriche, H.; Ouali, J. Structural Inheritance and Kinematics of Folding and Thrusting along the Front of the Eastern Atlas Mountains (Algeria and Tunisia). In Stratigraphy and Evolution of the Peri-Tethyan Platforms, Peri-Tethys Mem. 3; Crasquin-Soleau, S., Barrier, E., Eds.; Muséum National d’Histoire Naturelle: Paris, France, 1998; Volume 177, pp. 237–252. [Google Scholar]
  46. Bouaziz, S.; Barrier, E.; Soussi, M.; Turki, M.M.; Zouari, H. Tectonic Evolution of the Northern African Margin in Tunisia from Paleostress Data and Sedimentary Record. Tectonophysics 2002, 357, 227–253. [Google Scholar] [CrossRef]
  47. Jolivet, L.; Faccenna, C.; Piromallo, C. From Mantle to Crust: Stretching the Mediterranean. Earth Planet. Sci. Lett. 2009, 285, 198–209. [Google Scholar] [CrossRef]
  48. Castany, G. Le Haut-Bassin Siculo-Tunisien:Étude de Morphologie et de Géologie Sous-Marines. Bull. Stn. Océanogr. Salammbô 1955, 2, 3–12. Available online: http://hdl.handle.net/1834/9018 (accessed on 9 January 2022).
  49. Mejri, F.; Burollet, P.F.; Ferjani, A.B. Petroleum Geology of Tunisia: A Renewed Synthesis. Enterp. Tunis. Act. Pet. 2006, 22, 233. [Google Scholar] [CrossRef]
  50. Chihi, L. Les Fossés Néogènes et Quaternaires de La Tunisie et de La Mer Pélagienne. Etude Structurale et Leur Signification Dans Le Cadre de La Géodynamique de La Méditerrané. Ph.D. Thesis, Faculty of Sciences of Tunis, University of Tunis, Tunis, Tunisia, 1995; 324p. [Google Scholar]
  51. Ouhibi, R.; Mzali, H.; Ghanmi, M.; Zargouni, F. Determining of a Complex Structure Consisting of Detachment, Fault-Bend and Fault Propagation Folds in the Collapse Structure of Zaghouan-Bouficha (Bouficha Region, North Eastern Tunisia). Model. Earth Syst. Environ. 2018, 4, 241–250. [Google Scholar] [CrossRef]
  52. Morgan, M.; Grocott, J.; Moody, R.T.J. The Structural Setting and Evolution of the Zaghouan-Ressas Structural Belt in the Zaghouan Area. Tunisian Atlas, Northern Tunisia; Memoir No. 5; Entreprise Tunisienne d’Activités Pétrolières (ETAP): Tunis, Tunisia, 1992; pp. 193–209. [Google Scholar]
  53. Mzali, H.; Harbi, A.; Alyahyaoui, S. Geometry Characterization and Depth Determination of Deep Water Reservoirs: The Case of the Jebel Sidi Abd Er Rahmane Region (Cap Bon, Northeastern Tunisia). Arab. J. Geosci. 2016, 9, 295. [Google Scholar] [CrossRef]
  54. Zouaghi, T.; Ferhi, I.; Bédir, M.; Youssef, M.B.; Gasmi, M.; Inoubli, M.H. Analysis of Cretaceous (Aptian) Strata in Central Tunisia, Using 2D Seismic Data and Well Logs. J. Afr. Earth Sci. 2011, 61, 38–61. [Google Scholar] [CrossRef]
  55. Decrée, S.; Marignac, C.; Abidi, R.; Jemmali, N.; Deloule, E.; Souissi, F. Tectonomagmatic Context of Sedex Pb–Zn and Polymetallic Ore Deposits of the Nappe Zone Northern Tunisia, and Comparisons with MVT Deposits in the Region. In Mineral Deposits of North Africa; Carranza, E.J.M., Sadeghi, M., Eds.; Springer: Cham, Switzerland, 2016; pp. 497–525. [Google Scholar] [CrossRef]
  56. Jemmali, N.; Carranza, E.J.M.; Zemmel, B. Isotope Geochemistry of Mississippi Valley Type Stratabound F-Ba-(Pb-Zn) Ores of Hammam Zriba (Province of Zaghouan, NE Tunisia). Chem. Erde 2017, 77, 477–486. [Google Scholar] [CrossRef]
  57. Gharbi, M.; Ben Yed, N.; Ben Said, E. Essai d’interprétation Tectonique Du Champ Filonien de Bou-Jabeur (Atlas Tunisien Central). In Proceedings of the 1st National Congress of Earth Sciences, Tunis, Tunisia, 15–22 September 1985; Office National des Mines: Tunis, Tunisia, 1985; pp. 393–403. [Google Scholar]
  58. Thibieroz, J. Reconstitution Chronologique du Rôle des Surfaces d’Émersion dans l’Histoire du Gisement de Fluorine de Ham-998 mam Zriba (Région de Zaghouan, Tunisie). Mém. H. Série Soc. Géol. Fr. 1976, 7, 33–37. [Google Scholar]
  59. Touhami, A. Contribution à l’étude Géologique et Métallogénique de La Province Fluorée Tunisienne; Rôle de l’altération Superficielle Dans La Formation Des Concentrations Fluorées. Ph.D. Thesis, University of Tunis, Tunis, Tunisia, 1979; p. 321. [Google Scholar]
  60. Bouhlel, S. Composition Chimique, Fréquence et Distribution Des Minéraux de La Série Barytine-Célestite Dans Les Gisements de Fluorine de Hammam Jédidi et Hammam Zriba-Jébel Guébli (Tunisie Nord-Orientale). Bull. Mineral. 1985, 108, 403–420. [Google Scholar] [CrossRef]
  61. Somrani, C.; Souissi, F.; Souissi, R.; De Giudici, G.; Ferreira da Silva, E.; Fancello, D.; Podda, F.; Santos, J.F.; Abu-Alam, T.; Ribeiro, S.; et al. The Geochemical Characteristics of Ore-Forming Fluids in the Jebel Stah Fluorite Deposit in Northeast Tunisia: Insights from LA-ICP-MS and Sr Isotope Analyses. Minerals 2025, 15, 331. [Google Scholar] [CrossRef]
  62. Thibieroz, J. Hammam Jedidi et Hammam Zriba: Etude Géologique et Minière de Deux Gisements Stratiformes Dans Le Cadre de La Province Fluorée Tunisienne; L’association Des Concentrations Fluorées Aux Surfaces D’émersion; Université Paris VI: Paris, France, 1974; 432p. [Google Scholar]
  63. Roedder, E. Volume 12: Fluid Inclusions. Rev. Miner. 1984, 12, 644. [Google Scholar]
  64. Goldstein, R.H.; Reynolds, T.J. Systematics of Fluid Inclusions in Diagenetic Minerals; SEPM Society for Sedimentary Geology: Tulsa, OK, USA, 1994; Volume 31, p. 199. [Google Scholar] [CrossRef]
  65. Goldstein, R.H. Petrographic Analysis of Fluid Inclusions. Fluid. Incl. Anal. Interpret. 2003, 32, 9–54. [Google Scholar]
  66. Van Den Kerkhof, A.M.; Hein, U.F. Fluid Inclusion Petrography. Lithos 2001, 55, 27–47. [Google Scholar] [CrossRef]
  67. Bakker, R.J. Raman Spectra of Fluid and Crystal Mixtures in the Systems H2O, H2O–NaCl and H2O–MgCl2 at Low Temperatures: Applications to Fluid-Inclusion Research. Can. Mineral. 2004, 42, 1283–1314. [Google Scholar] [CrossRef]
  68. Bakker, R.J. The Perfection of Raman Spectroscopic Gas Densimeters. J. Raman Spectrosc. 2021, 52, 1923–1948. [Google Scholar] [CrossRef]
  69. Cloutis, E.; Szymanski, P.; Applin, D.; Goltz, D. Identification and Discrimination of Polycyclic Aromatic Hydrocarbons Using Raman Spectroscopy. Icarus 2016, 274, 211–230. [Google Scholar] [CrossRef]
  70. Crawford, M.L. Phase Equilibria in Aqueous Fluid Inclusions. In Fluid Inclusions: Applications to Petrology; Hollister, L.S., Crawford, M.L., Eds.; Short Course Series; Mineralogical Association of Canada: Ottawa, Canada, 1981; Volume 6, pp. 75–100. [Google Scholar]
  71. Frezzotti, M.L.; Tecce, F.; Casagli, A. Raman Spectroscopy for Fluid Inclusion Analysis. J. Geochem. Explor. 2012, 112, 1–20. [Google Scholar] [CrossRef]
  72. Jehlička, J.; Urban, O.; Pokorný, J. Raman Spectroscopy of Carbon and Solid Bitumens in Sedimentary and Metamorphic Rocks. Spectrochim. Acta Part A Mol. Biomol. Spectrosc. 2003, 59, 2341–2352. [Google Scholar] [CrossRef]
  73. Xiao, X.; Zhou, Q.; Cheng, P.; Sun, J.; Liu, D.; Tian, H. Thermal Maturation as Revealed by Micro-Raman Spectroscopy of Mineral-Organic Aggregation (MOA) in Marine Shales with High and over Maturities. Sci. China Earth Sci. 2020, 63, 1540–1552. [Google Scholar] [CrossRef]
  74. Jehlička, J.; Edwards, H.G.M.; Villar, S.E.J. Raman Spectroscopy of Natural Accumulated Paraffins from Rocks: Evenkite, Ozokerite and Hatchetine. Spectrochim. Acta Part A Mol. Biomol. Spectrosc. 2007, 68, 1143–1148. [Google Scholar] [CrossRef]
  75. Jehlička, J.; Edwards, H.G.M.; Vítek, P. Assessment of Raman Spectroscopy as a Tool for the Non-Destructive Identification of Organic Minerals and Biomolecules for Mars Studies. Planet. Space Sci. 2009, 57, 606–613. [Google Scholar] [CrossRef]
  76. Bodnar, R.J.; Burnham, C.W.; Sterner, S.M. Synthetic Fluid Inclusions in Natural Quartz. III. Determination of Phase Equilibrium Properties in the System H2O-NaCl to 1000 °C and 1500 Bars. Geochim. Cosmochim. Acta 1985, 49, 1861–1873. [Google Scholar] [CrossRef]
  77. Diamond, L.W. Introduction to Gas-Bearing, Aqueous Fluid Inclusions. Fluid. Incl. Anal. Interpret. 2003, 32, 363–372. [Google Scholar]
  78. Pichavant, M.; Ramboz, C.; Weisbrod, A. Fluid Immiscibility in Natural Processes: Use and Misuse of Fluid Inclusion Data: I. Phase equilibria analysis—a theoretical and geometrical approach. Chem. Geol. 1982, 37, 1–27. [Google Scholar] [CrossRef]
  79. Xavier, R.P.; Foster, R.P. Fluid Evolution and Chemical Controls in the Fazenda Maria Preta (FMP) Gold Deposit, Rio Itapicuru Greenstone Belt, Bahia, Brazil. Chem. Geol. 1999, 154, 133–154. [Google Scholar] [CrossRef]
  80. Coulibaly, Y.; Boiron, M.C.; Cathelineau, M.; Kouamelan, A.N. Fluid Immiscibility and Gold Deposition in the Birimian Quartz Veins of the Angovia Deposit (Yaouré, Ivory Coast). J. Afr. Earth Sci. 2008, 50, 234–254. [Google Scholar] [CrossRef]
  81. Wilkinson, J.J. Fluid Inclusions in Hydrothermal Ore Deposits. Lithos 2001, 55, 229–272. [Google Scholar] [CrossRef]
  82. Ramboz, C.; Pichavant, M.; Weisbrod, A. Fluid Immiscibility in Natural Processes: Use and Misuse of Fluid Inclusion Data: II. Interpretation of fluid inclusion data in terms of immiscibility. Chem. Geol. 1982, 37, 29–48. [Google Scholar] [CrossRef]
  83. Goldstein, R.H. Fluid Inclusions in Sedimentary and Diagenetic Systems. Lithos 2001, 55, 159–193. [Google Scholar] [CrossRef]
  84. Chi, G.X.; Lu, H.Z. Validation and Representation of Fluid Inclusion Microthermometric Data Using the Fluid Inclusion Assemblage (FIA) Concept. Acta Petrol. Sin. 2008, 24, 1945–1953. [Google Scholar]
  85. Chi, G.; Diamond, L.W.; Lu, H.; Lai, J.; Chu, H. Common Problems and Pitfalls in Fluid Inclusion Study: A Review and Discussion. Minerals 2021, 11, 7. [Google Scholar] [CrossRef]
  86. Brown, P.E. Fluid Inclusion Modeling for Hydrothermal Systems. Rev. Econ. Geol. 1998, 10, 151–171. [Google Scholar]
  87. Nedkvitne, T.; Karlsen, D.A.; Bjørlykke, K.; Larter, S.R. Relationship between Reservoir Diagenetic Evolution and Petroleum Emplacement in the Ula Field, North Sea. Mar. Pet. Geol. 1993, 10, 255–270. [Google Scholar] [CrossRef]
  88. Wilkinson, J.J.; Lonergan, L.; Fairs, T.; Herrington, R.J. Fluid Inclusion Constraints on Conditions and Timing of Hydrocarbon Migration and Quartz Cementation in Brent Group Reservoir Sandstones, Columba Terrace, Northern North Sea. Geol. Soc. Spec. Publ. 1998, 144, 69–89. [Google Scholar] [CrossRef]
  89. Aplin, A.C.; Larter, S.R.; Bigge, M.A.; Macleod, G.; Swarbrick, R.E.; Grunberger, D. Confocal Microscopy of Fluid Inclusions Reveals Fluid-Pressure Histories of Sediments and an Unexpected Origin of Gas Condensate. Geology 2000, 28, 1047–1050. [Google Scholar] [CrossRef]
  90. Yardley, B.W.D. 100th Anniversary Special Paper: Metal Concentrations in Crustal Fluids and Their Relationship to Ore Formation. Econ. Geol. 2005, 100, 613–632. [Google Scholar] [CrossRef]
  91. González-Esvertit, E.; Fusswinkel, T.; Canals, À.; Casas, J.M.; Neilson, J.; Wagner, T.; Gomez-Rivas, E. Fluid Evolution and Halogen Fractionation in Orogenic Belts: A Comparative Fluid Inclusion Appraisal in the Eastern Pyrenees. Chem. Geol. 2025, 674, 122578. [Google Scholar] [CrossRef]
  92. Richardson, C.K.; Holland, H.D. Fluorite Deposition in Hydrothermal Systems. Geochim. Cosmochim. Acta 1979, 43, 1327–1335. [Google Scholar] [CrossRef]
  93. Dhia, H.B. The Geothermal Gradient Map of Central Tunisia: Comparison with Structural, Gravimetric and Petroleum Data. Tectonophysics 1987, 142, 99–109. [Google Scholar] [CrossRef]
  94. Kort, H.M.; El Asmi, A.M.; Ouazaa, N.L.; Gasquet, D.; Saidi, M. Hydrothermal History in the Eastern Margin of Tunisia: Inferred Magmatic Rocks Alterations, New Paragenesis and Associated Gas Occurrences. Arab. J. Geosci. 2015, 8, 8927–8942. [Google Scholar] [CrossRef]
  95. Perthuisot, V.; Guilhaumou, N.; Touray, J.C. Les Inclusions Fluides Hypersalines et Gazeuses Des Quartz et Dolomites Du Trias Evaporitique Nord-Tunisien; Essai d’interpretation Geodynamique. Bull. Soc. Géol. Fr. 1978, S7-XX, 145–155. [Google Scholar] [CrossRef]
  96. Mzali, H.; Zouari, H. Structural Cutting of a Region Showing Various Compound Tectonic Deformations (Example of Bouficha-Grombalia Region). Arab. J. Geosci. 2012, 5, 1399–1409. [Google Scholar] [CrossRef]
  97. Soltani, H.; Mabrouk El Asmi, A.; Asmi, E.; Haj, B.; Saidi, M.B.B. Evaluation of the Zaghouan Region Oil Potential: Inferred Thermal Maturity Through 1D Modeling; ResearchGate. 2018. Available online: https://www.researchgate.net/publication/329000536_Evaluation_of_the_Zaghouan_re-1080gion_oil_potential_Inferred_thermal_maturity_through_1D_modeling (accessed on 13 February 2025).
  98. Fourati, L.; Hamouda, F.; El Mahersi, C.; Saıdi, M. Ypresian Bou Dabbous Formation: An Active Petroleum System within the Thrust Belt Zone in Northern Tunisia-North Africa. In Proceedings of the 8th Tunisian Petroleum Exploration & Production Conference, Tunis, Tunisia, 2–4 March 2002; American Association of Petroleum Geologists: Denver, CO, USA, 2002; Available online: https://www.searchanddiscovery.com/abstracts/html/2001/annual/abstracts/0250.htm (accessed on 7 February 2023).
  99. Lewan, M.D. Experiments on the Role of Water in Petroleum Formation. Geochim. Cosmochim. Acta 1997, 61, 3691–3723. [Google Scholar] [CrossRef]
  100. Behar, F.; Beaumont, V.; Penteado, H.L.D.B. Rock-Eval 6 Technology: Performances and Developments. Oil Gas Sci. Technol. 2001, 56, 111–134. [Google Scholar] [CrossRef]
  101. Rddad, L.; Jemmali, N.; Jaballah, S. The Role of Organic Matter and Hydrocarbons in the Genesis of the Pb-Zn-Fe (Ba-Sr) Ore Deposits in the Diapirs Zone, Northern Tunisia. Minerals 2024, 14, 932. [Google Scholar] [CrossRef]
  102. Bilkiewicz, E.; Kowalski, T. Origin of Hydrocarbon and Non-Hydrocarbon (H2S, CO2 and N2) Components of Natural Gas Accumulated in the Zechstein Main Dolomite (Ca2) Strata in SW Part of the Polish Permian Basin: Stable Isotope and Hydrous Pyrolysis Studies. J. Pet. Sci. Eng. 2020, 192, 107296. [Google Scholar] [CrossRef]
  103. Souissi, F.; Sassi, R.; Dandurand, J.L.; Bouhlel, S.; Ben Hamda, S. Fluid Inclusion Microthermometry and Rare Earth Element Distribution in the Celestites of the Jebel Doghra Ore Deposit (Dome Zone, Northern Tunisia): Towards a New Genetic Model. Bull. La. Soc. Geol. Fr. 2007, 178, 459–471. [Google Scholar] [CrossRef]
  104. George, S.C.; Ruble, T.E.; Dutkiewicz, A.; Eadington, P.J. Assessing the Maturity of Oil Trapped in Fluid Inclusions Using Molecular Geochemistry Data and Visually-Determined Fluorescence Colours. Appl. Geochem. 2001, 16, 451–473. [Google Scholar] [CrossRef]
  105. Pokrovskii, V.A. The Oxidative Solubility of Petroleum in Formation Waters: Implications for Hydrothermal Transport, Diagenesis, and Development of Secondary Porosity in Reservoir Rocks. In Proceedings of the Geoscience for the Community 13th Australian Geological Convention, Canberra, Australia, 19–23 February 1996; Geological Society of Australia: Sydney, Australia, 1996; pp. 41–347. [Google Scholar]
  106. Helgeson, H.C.; Knox, A.M.; Owens, C.E.; Shock, E.L. Petroleum, Oil Field Waters, and Authigenic Mineral Assemblages Are They in Metastable Equilibrium in Hydrocarbon Reservoirs. Geochim. Cosmochim. Acta 1993, 57, 3295–3339. [Google Scholar] [CrossRef]
  107. Mango, F.D.; Hightower, J.W.; James, A.T. Role of Transition-Metal Catalysis in the Formation of Natural Gas. Nature 1994, 368, 536–538. [Google Scholar] [CrossRef]
  108. Burollet, P.F. Contribution à l’étude Stratigraphique de La Tunisie Centrale. Ann. Mines Géol. 1956, 18, 350. [Google Scholar]
  109. Mohamed, A.B.; Saidi, M.; Jrad, M.B.; Soussi, M.; Riahi, S.; Bouazizi, I.; Saadani, B. The Organic Geochemistry of Source Rocks, Bitumens, Asphalts and Oil Stains from Northern Tunisia. In Proceedings of the 77th EAGE Conference and Exhibition 2015, Madrid, Spain, 1–4 June 2015; European Association of Geoscientists & Engineers: Houten, The Netherlands, 2015; Volume 2015, pp. 1–5. Available online: https://www.earthdoc.org/content/papers/10.3997/2214-4609.201413144 (accessed on 2 May 2024).
  110. Bédir, M.; Soltani, A.; Mohamed, A.B.; Arbi, A.; Saidi, M. Cretaceous Petroleum System Modeling of Kairouan Basin in Eastern Tunisia. Arab. J. Geosci. 2020, 13, 683. [Google Scholar] [CrossRef]
  111. Rddad, L.; Belayouni, H. Characterization of Organic Matter and Metal Contents Preserved within the Albian-Vraconian and Cenomanian-Turonian Black Shales in North-Central Tunisia. In Proceedings of the Geo. Soc. Am. Northeastern Section 49th Annual Meeting, Lancaster, PA, USA, 23 March 2014. [Google Scholar]
  112. Razgallah, S.; Philip, J.; Thomel, G.; Zaghbib-Turki, D.; Chaabani, F.; Ben Haj Ali, N.; M’Rabet, A.; Ali, N.B.H.; M’rabet, A. La Limite Cénomanien-Turonien En Tunisie Centrale et Méridionale: Biostratigraphie et Paléoenvironnements. Cretac. Res. 1994, 15, 507–533. [Google Scholar] [CrossRef]
  113. Robaszynski, F.; Caron, M.; Dupuis, C.; Amédro, F.; González Donoso, J.-M.; Linares, D. A Tentative Integrated Stratigraphy in the Turonian of Central Tunisia: Formations, Zones and Sequential Stratigraphy in the Kalaat Senan Area. Bull. Des. Cent. Rech. Explor. Elf Aquitaine 1990, 4, 213–384. [Google Scholar]
  114. Zaïer, A.; Beji-Sassi, A.; Sassi, S.; Moody, R.T.J. Basin Evolution and Deposition during the Early Paleogene in Tunisia. Geol. Soc. Lond. Spec. Publ. 1998, 132, 375–393. [Google Scholar] [CrossRef]
  115. Affouri, H.; Montacer, M. Organic Matter Appraisal of the Lower Eocene (Ypresian) Bou Dabbous Formation in Tunisia. Arab. J. Geosci. 2014, 7, 5509–5542. [Google Scholar] [CrossRef]
  116. Hallek, T.; Akrout, D.; Ahmadi, R.; Montacer, M. Assessment of Sedimentary Environment from PAHs and Aliphatic Biomarkers: The Case Study of Fahdene Black Shales in Northern Tunisia. J. Afr. Earth Sci. 2020, 161, 103676. [Google Scholar] [CrossRef]
  117. Peters, K.E.; Moldowan, J.M. The Biomarker Guide: Interpreting Molecular Fossils in Petroleum and Ancient Sediments; Prentice Hall: Englewood Cliffs, NJ, USA, 1993; 363p. [Google Scholar]
  118. Peters, K.E.; Walters, C.C.; Moldowan, J.M. The Biomarker Guide; Cambridge University Press: Cambridge, UK, 2005; Volume 1. [Google Scholar]
  119. Stein, S. On the High Temperature Chemical Equilibria of Polycyclic Aromatic Hydrocarbons. J. Phys. Chem. 1978, 82, 566–571. [Google Scholar] [CrossRef]
  120. Stein, S.E.; Fahr, A. High-Temperature Stabilities of Hydrocarbons. J. Phys. Chem. 1985, 89, 3714–3725. [Google Scholar] [CrossRef]
  121. Quirico, E.; Rouzaud, J.N.; Bonal, L.; Montagnac, G. Maturation Grade of Coals as Revealed by Raman Spectroscopy: Progress and Problems. Spectrochim. Acta Part A Mol. Biomol. Spectrosc. 2005, 61, 2368–2377. [Google Scholar] [CrossRef]
  122. Huang, E.P.; Huang, E.; Yu, S.C.; Chen, Y.H.; Lee, J.S.; Fang, J.N. In Situ Raman Spectroscopy on Kerogen at High Temperatures and High Pressures. Phys. Chem. Miner. 2010, 37, 593–600. [Google Scholar] [CrossRef]
  123. Chen, Y.; Chou, I.M. Quantitative Raman Spectroscopic Determination of the Composition, Pressure, and Density of CO2-CH4Gas Mixtures. J. Spectrosc. 2022, 2022, 7238044. [Google Scholar] [CrossRef]
  124. Kelemen, S.R.; Fang, H.L. Maturity Trends in Raman Spectra from Kerogen and Coal. Energy Fuels 2001, 15, 653–658. [Google Scholar] [CrossRef]
  125. Beyssac, O.; Goffé, B.; Chopin, C.; Rouzaud, J.N. Raman Spectra of Carbonaceous Material in Metasediments: A New Geothermometer. J. Metamorph. Geol. 2002, 20, 859–871. [Google Scholar] [CrossRef]
  126. Sauerer, B.; Craddock, P.R.; AlJohani, M.D.; Alsamadony, K.L.; Abdallah, W. Fast and Accurate Shale Maturity Determination by Raman Spectroscopy Measurement with Minimal Sample Preparation. Int. J. Coal Geol. 2017, 173, 150–157. [Google Scholar] [CrossRef]
  127. Wopenka, B.; Pasteris, J.D. Structural Characterization of Kerogens to Granulite-Facies Graphite: Applicability of Raman Microprobe Spectroscopy. Am. Mineral. 1993, 78, 533–557. [Google Scholar]
  128. Wang, J.; Liu, Y.; Yang, C.; Jiang, W.; Li, Y.; Xiong, Y.; Peng, P. Evolution of Mechanical Properties of Kerogen with Thermal Maturity. Mar. Pet. Geol. 2022, 145, 105906. [Google Scholar] [CrossRef]
  129. Ferrari, A.C.; Robertson, J. Interpretation of Raman Spectra of Disordered and Amorphous Carbon. Phys. Rev. B 2000, 61, 14095. [Google Scholar] [CrossRef]
  130. Guedes, A.; Valentim, B.; Prieto, A.C.; Rodrigues, S.; Noronha, F. Micro-Raman Spectroscopy of Collotelinite, Fusinite and Macrinite. Int. J. Coal Geol. 2010, 83, 415–422. [Google Scholar] [CrossRef]
  131. Khatibi, S.; Ostadhassan, M.; Tuschel, D.; Gentzis, T.; Carvajal-Ortiz, H. Evaluating Molecular Evolution of Kerogen by Raman Spectroscopy: Correlation with Optical Microscopy and Rock-Eval Pyrolysis. Energies 2018, 11, 1406. [Google Scholar] [CrossRef]
  132. Agrawal, V.; Sharma, S. Molecular Characterization of Kerogen and Its Implications for Determining Hydrocarbon Potential, Organic Matter Sources and Thermal Maturity in Marcellus Shale. Fuel 2018, 228, 429–437. [Google Scholar] [CrossRef]
  133. Witte, E.G.; Schenk, H.J.; Müller, P.J.; Schwochau, K. Structural Modifications of Kerogen during Natural Evolution as Derived from 13C CP/MAS NMR, IR Spectroscopy and Rock-Eval Pyrolysis of Toarcian Shales. Org. Geochem. 1988, 13, 1039–1044. [Google Scholar] [CrossRef]
  134. Takai, K.; Oga, M.; Sato, H.; Enoki, T.; Ohki, Y.; Taomoto, A.; Suenaga, K.; Iijima, S. Structure and Electronic Properties of a Nongraphitic Disordered Carbon System and Its Heat-Treatment Effects. Phys. Rev. B 2003, 67, 214202. [Google Scholar] [CrossRef]
  135. Cançado, L.G.; Takai, K.; Enoki, T.; Endo, M.; Kim, Y.A.; Mizusaki, H.; Speziali, N.L.; Jorio, A.; Pimenta, M.A. Measuring the Degree of Stacking Order in Graphite by Raman Spectroscopy. Carbon N. Y. 2008, 46, 272–275. [Google Scholar] [CrossRef]
  136. Graf, D.; Molitor, F.; Ensslin, K.; Stampfer, C.; Jungen, A.; Hierold, C.; Wirtz, L. Spatially Resolved Raman Spectroscopy of Single- and Few-Layer Graphene. Nano Lett. 2007, 7, 238–242. [Google Scholar] [CrossRef]
  137. Toboła, T.; Botor, D. Raman Spectroscopy of Organic Matter and Rare Minerals in the Kłodawa Salt Dome (Central Poland) Cap-Rock and Triassic Cover—Indicators of Hydrothermal Solution Migration. Spectrochim. Acta Part A Mol. Biomol. Spectrosc. 2020, 231, 118121. [Google Scholar] [CrossRef]
  138. Beyssac, O.; Rouzaud, J.-N.N.; Goffé, B.; Brunet, F.; Chopin, C. Graphitization in a High-Pressure, Low-Temperature Metamorphic Gradient: A Raman Microspectroscopy and HRTEM Study. Contrib. Mineral. Petrol. 2002, 143, 19–31. [Google Scholar] [CrossRef]
  139. Kouketsu, Y.; Mizukami, T.; Mori, H.; Endo, S.; Aoya, M.; Hara, H.; Nakamura, D.; Wallis, S. A New Approach to Develop the Raman Carbonaceous Material Geothermometer for Low-Grade Metamorphism Using Peak Width. Isl. Arc 2014, 23, 33–50. [Google Scholar] [CrossRef]
  140. Clough, A.; Sigle, J.L.; Jacobi, D.; Sheremata, J.; White, J.L. Characterization of Kerogen and Source Rock Maturation Using Solid-State NMR Spectroscopy. Energy Fuels 2015, 29, 6370–6382. [Google Scholar] [CrossRef]
  141. Solli, H.; Van Graas, G.; Leplat, P.; Krane, J. Analysis of Kerogens of Miocene Shales in a Homogenous Sedimentary Column. A Study of Maturation Using Flash Pyrolysis Techniques and Carbon-13 CP-MAS NMR. Org. Geochem. 1984, 6, 351–358. [Google Scholar] [CrossRef]
  142. Spangenberg, J.E. Geochemistry of the Organic Mineral Evenkite in Septarian Concretions in the Oxfordian Marls of the French Alps. Mineral. Mag. 1998, 62A, 1436–1437. [Google Scholar] [CrossRef]
  143. Skropyshev, A.V. A Paraffin from a Polymetallic Vein. Dokl. Acad. Nauk. SSSR 1953, 88, 717–719. [Google Scholar]
  144. Manuella, F.C. Serpentinization and Abiogenic Production of Hydrocarbons in the Ultramafic Basement of Hyblean Plateau: Mineralogical and Petrological Inferences from Xenoliths. Plinius 2010, 36, 1–6. [Google Scholar]
  145. Kotel’nikova, E.N.; Filatov, S.K. Crystal Chemistry of Paraffins: Research Methods, Results, and Behavior in Nature; Neva Publishing House: Saint Petersburg, Russia, 2002; 352p. [Google Scholar]
  146. Chazhengina, S.Y.; Kotelnikova, E.N.; Filippova, I.V.; Filatov, S.K. Phase Transitions of N-Alkanes as Rotator Crystals. J. Mol. Struct. 2003, 647, 243–257. [Google Scholar] [CrossRef]
  147. Platonova, N.V.; Kotel’nikova, E.N. Synthesis of the Organic Mineral Evenkite. Geol. Ore Depos. 2007, 49, 638–640. [Google Scholar] [CrossRef]
  148. Kotel’nikova, E.N.; Platonova, N.V.; Filatov, S.K. Identification of Biogenic Paraffins and Their Thermal Phase Transitions. Geol. Ore Depos. 2007, 49, 697–709. [Google Scholar] [CrossRef]
  149. Kruťa, T. O Nerostech z Ostravsko-Karvinského Revíru. Přirodověd. Sborn. Ostrav. Kraj. 1951, 12, 451–486. (In Czech) [Google Scholar]
  150. Houzar, S.; Hršelová, P.; Gilíková, H.; Buriánek, D.; Nehyba, S. Přehled Historie Výzkumů Permokarbonských Sedimentů Jižní 1204 Části Boskovické Brázdy (Část 2. Geologie a Petrografie). Acta Musei Morav. Sci. Geol. 2017, 102, 3–65. (In Czech) [Google Scholar]
  151. Welser, P.; Slobodník, M.; Malek, O.; Osovský, M.; Jirásek, J.; Matýsek, D. Epigenetic Minerals From the Czech Part of the Upper Silesian Basin. Acta Musei Morav. Sci. Geol. 2021, 106, 81–123. [Google Scholar]
  152. Houzar, S.; Hršelová, P. Přehled Historie Výzkumů Permokarbonských Sedimentů Jižní Části Boskovické Brázdy (Část 1. 1208 Historie Dolování a Mineralogie). Acta Musei Morav. Sci. Geol. 2016, 101, 3–32. (In Czech) [Google Scholar]
  153. Konnerup-Madsen, J.; Kreulen, R.; Rose-Hansen, J. Stable Isotope Characteristics of Hydrocarbon Gases in the Alkaline Ilímaussaq Complex, South Greenland. Bull. Mineral. 1988, 111, 567–576. [Google Scholar] [CrossRef]
  154. Kutcherov, V.G.; Krayushkin, V.A. Deep-Seated Abiogenic Origin of Petroleum: From Geological Assessment to Physical Theory. Rev. Geophys. 2010, 48, 1–30. [Google Scholar] [CrossRef]
  155. Kutcherov, V.G. Abiogenic Deep Origin of Hydrocarbons and Oil and Gas Deposits Formation; Kutcherov, V., Kolesnikov, A., Eds.; IntechOpen: Rijeka, Croatia, 2013; Chapter 1. [Google Scholar] [CrossRef]
  156. Colombo, J.C.; Pelletier, E.; Brochu, C.; Khalil, M.; Catoggio, J.A. Determination of Hydrocarbon Sources Using N-Alkane and Polyaromatic Hydrocarbon Distribution Indexes. Case Study: Rio de La Plata Estuary, Argentina. Environ. Sci. Technol. 1989, 23, 888–894. [Google Scholar] [CrossRef]
  157. Sakari, M.; Zakaria, M.P.; Lajis, N.H.; Mohamed, C.A.R.; Abdullah, M.H. Reconstruction of Aliphatic Hydrocarbons History and Sources from Sedimentary Record of the Johor Strait, Malaysia. Coast. Mar. Sci. 2012, 35, 142–152. [Google Scholar]
  158. Eglinton, G.; Gonzalez, A.G.; Hamilton, R.J.; Raphael, R.A. Hydrocarbon Constituents of the Wax Coatings of Plant Leaves: A Taxonomic Survey. Phytochemistry 1962, 1, 89–102. [Google Scholar] [CrossRef]
  159. Peybernès, B. The Jurassic of Tunisia: An Attempt at Reconstruction of the South Neotethyan Margin during and after the Rifting Phase. In The Geology of Libya; Salem, M.J., Busrewil, M.T., Ben Ashour, A.M., Eds.; Elsevier: Amsterdam, The Netherlands, 1991; Volume 4, pp. 1681–1709. [Google Scholar]
  160. Abdesselam-mahdaoui, S.B.E.N.; Benzaggagh, M.; Bouhlel, S. Nouvelles Données Biostratigraphiques Sur Les Niveaux de Passage Jurassique- Crétacéet Les Calcaires Du Campanien Dans Le Secteur de Hammam Zriba-Jebel Guebli (Tunisie Septentrionale). Geo-Eco-Trop 2010, 34, 113–126. [Google Scholar]
  161. El Nemr, A.; Moneer, A.A.; Ragab, S.; El Sikaily, A. Distribution and Sources of N-Alkanes and Polycyclic Aromatic Hydrocarbons in Shellfish of the Egyptian Red Sea Coast. Egypt. J. Aquat. Res. 2016, 42, 121–131. [Google Scholar] [CrossRef]
  162. Choudhary, P.; Routh, J.; Chakrapani, G.J. Organic Geochemical Record of Increased Productivity in Lake Naukuchiyatal, Kumaun Himalayas, India. Environ. Earth Sci. 2010, 60, 837–843. [Google Scholar] [CrossRef]
  163. Zakaria, M.P.; Bong, C.-W.; Vaezzadeh, V. Chapter 16—Fingerprinting of Petroleum Hydrocarbons in Malaysia Using Environmental Forensic Techniques: A 20-Year Field Data Review; Stout, S.A., Wang, Z., Eds.; Butterworth-Heinemann: Oxford, UK, 2018; pp. 345–372. [Google Scholar] [CrossRef]
  164. Geddes, C.D.; Lakowicz, J.R.; Blamey, N.J.F.; Ryder, A.G. Hydrocarbon Fluid Inclusion Fluorescence: A Review. Rev. Fluoresc. 2007, 2009, 299–334. [Google Scholar]
  165. Moser, M.R.; Rankin, A.H.; Milledge, H.J. Hydrocarbon-Bearing Fluid Inclusions in Fluorite Associated with the Windy Knoll Bitumen Deposit, UK. Geochim. Cosmochim. Acta 1992, 56, 155–168. [Google Scholar] [CrossRef]
  166. Lenoir, L.; Blaise, T.; Chourio-Camacho, D.; Richard, A.; Tarantola, A.; Agrinier, P.; Rigaudier, T.; Monvoisin, G.; Bardoux, G.; Brigaud, B.; et al. The Origin of Fluorite-Barite Mineralization at the Interface between the Paris Basin and Its Variscan Basement: Insights from Fluid Inclusion Chemistry and Isotopic (O, H, Cl) Composition. Miner. Depos. 2024, 59, 397–417. [Google Scholar] [CrossRef]
  167. Machel, H.G. Bacterial and Thermochemical Sulfate Reduction in Diagenetic Settings—Old and New Insights. Sediment. Geol. 2001, 140, 143–175. [Google Scholar] [CrossRef]
  168. Sverjensky, D.A. Oil Field Brines as Ore-Forming Solutions. Econ. Geol. 1984, 79, 23–37. [Google Scholar] [CrossRef]
  169. Surdam, R.C.; Crossey, L.J. Organic-Inorganic Reactions during Progressive Burial: Key to Porosity and Permeability Enhancement and Preservation. Philos. Trans. R. Soc. Lond. Ser. A Math. Phys. Sci. 1985, 315, 135–156. [Google Scholar]
  170. Smith, J.T.; Ehrenberg, S.N. Correlation of Carbon Dioxide Abundance with Temperature in Clastic Hydrocarbon Reservoirs: Relationship to Inorganic Chemical Equilibrium. Mar. Pet. Geol. 1989, 6, 129–135. [Google Scholar] [CrossRef]
  171. Giordano, T.H. Metal Transport in Ore Fluids by Organic Ligand Complexation BT—Organic Acids in Geological Processes; Pittman, E.D., Lewan, M.D., Eds.; Springer: Berlin/Heidelberg, Germany, 1994; pp. 319–354. [Google Scholar] [CrossRef]
  172. Di, J.; Ding, X. Complexation of REE in Hydrothermal Fluids and Its Significance on REE Mineralization. Minerals 2024, 14, 531. [Google Scholar] [CrossRef]
  173. González-Partida, E.; Carrillo-Chávez, A.; Grimmer, J.O.W.; Pironon, J. Petroleum-Rich Fluid Inclusions in Fluorite, Purisima Mine, Coahuila, Mexico. Int. Geol. Rev. 2002, 44, 755–764. [Google Scholar] [CrossRef]
  174. Bouabdellah, M.; Castorina, F.; Bodnar, R.J.; Banks, D.; Jébrak, M.; Prochaska, W.; Lowry, D.; Klügel, A.; Hoernle, K. Petroleum Migration, Fluid Mixing, and Halokinesis as the Main Ore-Forming Processes at the Peridiapiric Jbel Tirremi Fluorite-Barite Hydrothermal Deposit, Northeastern Morocco. Econ. Geol. 2014, 109, 1223–1256. [Google Scholar] [CrossRef]
  175. Belayouni, H. Oil Seeps and Associated Phenomena in Northern Tunisia. In Proceedings of the IIIème Journées de Géologie Tunisienne Appliquées à la Recherche des Hydrocarbures ETAP, Tunis, Tunisia, 8–9 May 1992; p. 18. [Google Scholar]
  176. Frizon de Lamotte, D.; Saint Bezar, B.; Bracène, R.; Mercier, E. The Two Main Steps of the Atlas Building and Geodynamics of the Western Mediterranean. Tectonics 2000, 19, 740–761. [Google Scholar] [CrossRef]
  177. Bouhlel, S. Gitologie, Mineralogie et Essai de Modélisation des Minéralisations à F-Ba-Sr-Pb-Zn-(S) Associées aux Carbonates (Jurassiques et Crétacées) et aux Diapirs Triassiques: Gisements de Stah-Kohol, Zriba-Guebli, Bou Jaber et Fedj-el-Adoum (Tunisie Septentrionale). Ph.D. Thesis, Faculty of Sciences of Tunis (FST), University of Tunis, Tunis, Tunisia, 1993; p. 303. Available online: https://www.researchgate.net/publication/277300260 (accessed on 27 September 2021).
  178. Paradis, S.; Hannigan, P.; Dewing, K. Mississippi Valley-Type Lead-Zinc Deposits. Miner. Depos. Canada A Synth. Major Depos. Dist. Metallog. Evol. Geol. Prov. Explor. Methods Geol. Assoc. Canada Miner. Depos. Div. Spec. Publ. 2007, 5, 185–203. [Google Scholar]
  179. De Graaf, S.; Lüders, V.; Banks, D.A.; Sośnicka, M.; Reijmer, J.J.G.; Kaden, H.; Vonhof, H.B. Fluid Evolution and Ore Deposition in the Harz Mountains Revisited: Isotope and Crush-Leach Analyses of Fluid Inclusions. Miner. Depos. 2020, 55, 47–62. [Google Scholar] [CrossRef]
Figure 1. Stratigraphic position and type of mineralizations of the north-eastern Tunisian ore deposits (after [4,6]). 1 Gypsum and clays, 2 reef limestones, 3 phosphatic limestones or limestones, 4 limestone–marl alternation, 5 conglomeratic limestone, 6 limestone–marl alternation, 7 reef limestones or limestone–marl alternation, 8 limestone–marl alternation with interbedded limestone layers, 9 limestones, 10 limestone–marl alternation, 11 limestones, 12 marls, 13 limestones, 14 sandstones, 15 clays, sandstones and sandy limestones, and 16 conglomerate–sand unit. The background lithostratigraphic colors follow the International Chronostratigraphic Chart (International Commission on Stratigraphy, 2023 edition) for global correlation consistency.
Minerals 15 00489 g001
Figure 4. The banded–stratiform ore (type–F1) of the Hammam–Zriba deposit occurs between the massive–gray Portlandian limestones (wall rock) and the upper Campanian bedded–gray limestones (roof rocks). The entrances to the mining chambers, dug in the banded–stratiform ore, are sealed with concrete.
Minerals 15 00489 g004
Figure 5. The banded–stratiform ore (type–F1) of the Hammam–Zriba deposit consists of alternating white (barite) to colorless (fluorite) layers of type–F2 and black layers of type M0 (quartz > barite > sphalerite > galena). “>” signifies the most dominant mineral until the least dominant mineral.
Minerals 15 00489 g005
Figure 6. Sample of banded–stratiform ore (type–F1) from the Hammam–Zriba deposit, showing the alternation of white (barite) to colorless (fluorite) and dark (fluorite, sphalerite > galena) layers.
Minerals 15 00489 g006
Figure 7. Photomicrographs showing the location of the fluid inclusion assemblages (FIAs) taken with a 20× objective of selected segments from the double polished thick sections of the studied fluorite samples. (A) FIA of the banded stratiform orebodies in the sample HZMR18. (B,C) FIA of the vein fluorites in the sample HZF2b.
Minerals 15 00489 g007
Figure 8. Photomicrographs with transmitted light of FIs hosted in fluorite type-F1 (banded–stratiform) from the Hammam–Zriba deposit. (A) FIA 7′ showing a primary two-phase aqueous FI LWC associated with three-phase primary inclusions containing an accidentally trapped solid (halite) LWSHl and a primary three-phase HCFI composed of two immiscible liquids and a vapor phase (LHCL2V). (B) Group of primary two-phase aqueous FIs (LW) in FIA 1′; typical two-phase pseudosecondary aqueous type-A FIs along a growth zone. (C) Primary two-phase aqueous FIs (LWC and LW). (D) A trail of dark pseudosecondary monophasic solid FIs with three-phase HCFI (VLHCL2), and a trail of small two-phase aqueous FIs (LW) in FIA 3′. (E) Typical two-phase pseudosecondary aqueous type-A FIs along a growth zone in FIA 6′. (F) Trails of vapor-rich pseudosecondary FIs (VC) and, two-phase aqueous FIs (LWC) and three-phase carbon-rich FI LCW in FIA 5′. (G) Monophasic pseudosecondary liquid inclusions in FIA 4′. (H) Primary VCW FIs occurring with two-phase aqueous LW FIs in FIA 4′. (I) Vapor-rich primary FIs VC and two-phase aqueous FIs LWC in FIA 5′. Abbreviations are as follows: V: vapor; L: liquid; S: solid; HC: liquid hydrocarbons; Hl: halite crystal; C: carbon-rich phase dominated by CO2; W: water; LW: liquid water; LWC: two-phase aqueous FIs with a minor vapor–carbon-rich phase: VCW: FI dominated by vapor CO2 with a thin rim of liquid water; LVS: three-phase aqueous FI holding solid phases.
Minerals 15 00489 g008
Figure 9. Photomicrographs with transmitted light of FIs hosted in fluorite veins (type-F2) from the Hammam–Zriba deposit. (A) A group of primary three-phase brown HCFIs (LHCS and LHCL2V) with OM particles within FIA 2′. (B) Primary isolated LHCV filled with yellowish liquid hydrocarbons, showing the presence of solids and brown to black organic material. (C) Detail of a primary isolated three-phase vapor-dominated HCFI (VLHCL2) containing two immiscible liquids in a vapor bubble. (D) Trails of pseudosecondary dark inclusions with a tiny liquid meniscus in FIA 10′. (E) Clusters of three-phase primary inclusions holding a solid phase (LVS) and associated with two-phase aqueous FI (LWC). (F) Primary three-phase inclusion containing a solid phase (LSV) and poly-phase inclusion LS1S2V. (G) Cluster of primary dark carbon-rich FIs containing numerous solids. (H) Two-phase SL FI (in FIA 11′) dominated by a dark solid phase and a liquid phase probably a supermature colorless hydrocarbon.
Minerals 15 00489 g009
Figure 10. Distribution histograms of ice-melting temperature (Tmice), homogenization temperature (Th °C), and salinity (wt.% eq NaCl) of FIs in both fluorites from the banded stratiform orebody type-F1 (sample HZMR18) and vein type-F2 (sample HZF2b) from the Hammam–Zriba deposit. (A,B) Variations in the Tmice of primary, pseudosecondary, and secondary aqueous FIs and HCFIs type-F1 and type-F2 fluorites. (C,D) Variations in Th (°C) of primary, pseudosecondary, and secondary aqueous FIs and HCFIs in type-F1 and type-F2 fluorites. (E,F) Variations in salinities of primary, pseudosecondary, and secondary inclusions in type-F1 and type-F2 fluorites. Note that these data are associated with the fluid inclusion assemblages (FIAs) presented in Table 2.
Minerals 15 00489 g010
Figure 11. Homogenization temperature versus salinity (mean values are considered) within fluid inclusion assemblages (FIAs) in both fluorites from the banded stratiform orebody type-F1 (sample HZMR18) and vein type-F2 (sample HZF2b) from the Hammam–Zriba deposit (Note that some symbols are not individually visible on the diagram due to overlapping data points on the diagram).
Minerals 15 00489 g011
Figure 12. Raman spectra of FIs hosted in fluorite vein type-F2 (sample HZF2b). (A) Primary LW; (B) pseudosecondary LW; (C) secondary LW; (D) primary, secondary, and pseudosecondary Lw-m; (E) primary and secondary Lw-(c-m); (F) secondary Lw-(c-m-n); (G) primary and secondary Vm; (H) primary Vc-m; (I) pseudosecondary Vc-m-n + Lw; (J) primary Vc-m + SCv; (K,L) primary SCv-Brk. The identification of each fluid phase is based on Raman peak data from [71].
Minerals 15 00489 g012aMinerals 15 00489 g012b
Figure 13. Raman spectra of kerogen and bitumen HCFIs hosted within the fluorite vein of Hammam–Zriba (sample HZF2b). (A) (i) Two-phase primary HCFI (in FIA 11′) containing solid bitumen (SBL) and monophasic pseudosecondary HCFI holding solid bitumen (SB). These inclusions occur as black elliptical or elongated bodies with a viscous aspect and range in size from 10 to 100 μm. (ii) Zoomed-in view of the D and G bands in the bitumen Raman spectra. The heights of both bands are largely variable. Usually, the height of the G band reigns over that of the D-band, with a slight shift to higher values. These Raman spectra are quite similar to those of solid bitumen from Zbečno and Klecany in the volcano–sedimentary complex in the Czech Republic [72]. (B) (i) Two-phase primary HCFIs (in FIA 8′) holding kerogen with yellowish oil (SkLHC), which occurred as large brownish FIs and sometimes had an irregular shape. (ii) Zoomed-in view of the D and G bands in the kerogen Raman spectra. The directional trends in the Raman spectra of SkLHC are almost identical to those of the bituminous SBL FIs. However, in the Raman spectra of SkLHC, the height of the D-band is slightly greater than that of the G band in SBL (Figure 13A). The D-band position indicated increased variability and was shifted upward in the SkLHC FI. Its wavenumber trend toward a low Raman shifted and varied between 1387 cm−1 and 1309.64 cm−1. The Raman spectra of kerogen HCFIs are quite similar to those reported by [73].
Minerals 15 00489 g013aMinerals 15 00489 g013b
Figure 14. Raman spectra (500–4000 cm−1) of fluorescent signals obtained from PAH-bearing FIs within fluorite vein type-F2 (sample HZF2b). (A) Primary two-phase FI (LPAHV) (in FIA 9′) containing a yellowish oil is defined as coronene. It shows highly fluorescent spectra and weak Raman fluorescence peaks. (B) Primary and secondary dark vapor-rich FIs containing PAHs (VPAH in FIA 7′ and VPAHLPAH in FIA 11′ and FIA 4′), which could be anthracene–carbonitrile. These FIs show slightly different shapes in their fluorescence spectra, as indicated by the weak to non-existent fluorescence peaks. (C) Raman spectra of primary dark vapor FIs (VPAH-m-w and VPAH-m) (in FIA 5′) containing phenoxazine. These Raman spectra show some unidentified fluorescence peaks associated with H2O (Vw) and CH4. All these Raman spectra of phenoxazine are compared to those documented by [69]. The results differ in terms of their fluorescence signals and the positions of their fluorescence peaks.
Minerals 15 00489 g014
Figure 15. Raman spectra of evenkite HCFIs hosted within fluorite vein type-F2 (sample HZF2b). The hydrocarbon phases in HCFIs L1 + L2 + L3 + V1 + V2 + S, LSEvk, and VHC clearly show sharp Raman bands occurring mainly between 3100 and 2600 cm−1. This region is dominated by a triplet band, which is consistent with the general aspects of the ν(CH2) bands. These bands occur between 2883 and 2850/47 cm−1. The common feature in the 1500–1300 cm−1 range is the ν(CH2) band at approximately 1463, 1441, 1382, and 1371 cm−1. The bands between 1295 and 1265 cm−1 are attributed to CH2 in-phase characteristics. (A) Long-chain n-alkanes of HCFIs in FIA 10′. The photomicrograph shows a “necking down” of large, elongated HCFIs containing multiple fluid phases (L1 + L2 + L3 + V1 + V2 + S). These phases include two vapor bubbles within three immiscible liquids (yellowish, brownish, and colorless), and a brownish to black solid phase. Comparison with Raman studies of n-tetracosane (3200–2400 cm−1) and evenkite (3600–2200 cm−1) from [74] supports the identification of the presumed fluid phases. Otherwise, the bands at 1124 and 1102 cm−1 are absent in the Raman spectra of the studied inclusions. Subfigures (i) and (ii) are zoomed-in parts of the Raman spectra. (B) Pseudosecondary two-phase HCFIs in FIA 4′ (SHCLHC) occur as solid–rich materials with thin rims of greenish oil. (i,ii) Bands of agreement are defined as the ν(CC) bands at 1171/73, 1133/36, and 1063/65 cm−1 and the ν(COC) band at 890 cm−1 in SHCLHC. These Raman spectra are compared to those from Evenki in the wavenumber range of 1800–800 cm−1 from the studies of [75]. (C) Raman spectra of a solid phase (Evk) hosted in a three-phase HCFI (LSEvk) in FIA 5′. These inclusions contain a colorless liquid and a vapor bubble, and are associated with the monophasic and biphasic vapor-dominated HCFIs (VHC). (i) Zoomed image of the triple peak. These spectra are compared to those of n-tetracosane in the wavenumber range of 3200–2400 cm−1 from those reported by Jehlicka et al. [74]. “HC” refers to evenkite, hatchettine and/or n-tetracosane.
Minerals 15 00489 g015aMinerals 15 00489 g015b
Figure 16. Raman spectra of evenkite HCFIs hosted within fluorite vein type-F2 (sample HZF2b). (A) Secondary monophasic gaseous VHC and two-phase aqueous LW inclusions in FIA 4′. SHCLHC, as described in Figure 15B and VHC, showed distinct Raman bands in the wavenumber ranges of 3100–2700 cm−1 and 1440 cm−1, respectively. (i) Clear bands are observed in the 1500–1000 cm−1 range. These include bands at 1460, 1440, 1418, and 1297 cm−1, which are related to the δ(CH2) mode. The hatchettine hydrocarbon has a ν(CC) band at 1171 cm−1. For both hydrocarbon types, a ν(CC) stretching band at 1132/1133 cm−1 and a ν(CO) band at 1062/3 cm−1 were assigned. (ii) The presence of both hydrocarbons (evenkite and hatchettine) results in similar spectra, particularly in the 3100–2600 cm−1 range. They have the same sharp triplet band at 2883 cm−1 and at 2850/47 cm−1, corresponding to ν(CH2) asymmetric and symmetric stretching, respectively. A weak shoulder occurs at 2930 cm−1, which corresponds to the weak shoulder of hatchettine at 2906 cm−1. The ν(CH3–C) stretching peak is attributed to the band at 2724/26 cm−1. Compared with hatchettine features recorded in the wavenumber range of 1800–1200 cm−1 by [74] and the Raman of evenkite in the wavenumber range of 1800–800 cm−1 by [75], the assumed aliphatic fluids are correct. (B) Secondary dark monophasic SHC and the yellowish oil of two-phase LHCV inclusions in FIA 7′. (i,ii) The LHCV and SHC HCFIs show sharp Raman bands occurring mainly between 3100 and 2600 cm−1 and are characterized by triplet bands. Comparison with the Raman results of n-tetracosane in the 3200–2400 cm−1 range, and evenkite in the 1520–1320 cm−1 range [74], suggests that the analyzed fluid phases are aliphatic compounds, more precisely, evenkite hydrocarbons. (C) Pseudosecondary two-phase solid-rich SHCLHC inclusion (FIA 6′) containing greenish oil. Subfigures (i) and (ii) are zoomed-in parts of the Raman spectra.
Minerals 15 00489 g016aMinerals 15 00489 g016b
Figure 17. Photomicrographs of primary inclusions within the Fluid Inclusion Assemblages (FIAs) in the fluorites F1 and F2 consisting of three types of FIs (Type-A, -G, and -H), and suggesting water–oil–gas immiscibility. (AC) Primary liquid- and vapor-dominated inclusions trapped along healed microfracture of fluorite, representing trapping of the vapor and liquid-end members respectively. (D,E) The inclusions with variable vapor/liquid ratios resulted from heterogeneous trapping of both liquid (oil and water) and gas phases.
Minerals 15 00489 g017
Figure 18. Raman spectra (1355–1580 cm−1) of carbon-rich FIs (FIA 10′) in fluorite vein type-F2 (sample HZF2b) show monophasic secondary dark solid FIs holding both minerals, evenkite and graphite (SGr-Evk). (i) Graphite typically exhibits D and G peaks, which could be associated with disordered modes. These modes are known to show multiple peaks and the presence of three peaks (D3) has been observed in the Raman spectra of various materials worldwide, e.g., [71,72,134,135,136,137]. The Raman spectra of graphite are comparable to those documented by [137]. (ii) Triple peak of evenkite (see details in Figure 15).
Minerals 15 00489 g018
Table 2. Results of the microthermometric study conducted on fluid inclusions from the banded-stratiform (type-F1) and vein (type-F2) orebodies from the Hammam–Zriba deposit, showing the phase composition. The locations of the studied FIAs are presented in Figure 7.
Orebody
(Sample Reference)
N° of
Studied FIAs
N° of
FIs Studied Within FIAs
FIs TypeOccurrenceTe (°C)TmCO2 (°C)Tmice (°C)TmClathr (°C)wt.% eq NaClTh ModeThCO2 (°C)Thtotal (°C)
Vein F2
(sample HZF2b)
FIA 1′22LWP−50 to −52−12 15.95L110–140
FIA 3′11LWP50 to −52−12.1 16.5L112–119
FIA 6′20LWPS50 to −52−15.6 19.1L90–133
FIA 2′/7′/6′15LWP/S/PS50 to −52−19.9 22.3L95–137
FIA 1′15LWCP50 to −52−70/−60.5−13.9−3.920L100–130
FIA 2′13LWCP50 to −52−70/−60.5−9.7 to−9.5−3.920L100
FIA 6′/7′12LWCS/PS50 to −52−70/−60.5−3.920L
FIA 2′/4′10VCP/PS/S−70/−60.5 V25 to 29
FIA 5′11VCP−70/−60.5−1.2V24 to 28
FIA 10′7LHCL2VPS/S50 to −52−24.2−1.217L98–145
FIA 11′/4′8LHCVPS/S50 to −52−22.5−1.117L87–137
FIA 8′17LHCL2VP50 to −52 −24.2−3.920L98–145
FIA 9′15LHCVP50 to −52 −22.5−3.920L87–137
Banded stratiform F1 (sample HZMR18)FIA 1/243LWP50 to −52−9.7 to −9.5−2.413.6/13.4L90–113
FIA 7/912LWS/PS50 to −52−13.2 to−13.3−2.417.1/17.2L110–120
FIA 9 6LWPS50 to −52−13.4−2.417.25L115
FIA 73LWS50 to −52−2.43.3L
FIA 1021LWCPS50 to −52−70/−60.5−10.8−2.414.8L95–113
FIA 3/243LWCP50 to −52−70/−60.5−13−2.416.9L110
FIA 552LWP50 to −52−19.9−2.422.3L115–150
FIA 8/9 11VCS/PS−70/−60.5−1.2 V22.8 to 28.5
FIA 1/29VCP−70/−60.5 V22.8 to 28.5
FIA 48LHCL2VP50 to −52−24.2−1.217L90–145
FIA 47LHCV P50 to −52−22.5−1.117L85–135
FIA 10/78LHCL2VPS/S50 to −52−24.2−1.217L90–145
FIA 10/77LHCVPS/S50 to −52−22.5−1.217L85–135
FI generations are designated P: primary, PS: pseudosecondary, and S: secondary.
Disclaimer/Publisher’s Note: The statements, opinions and data contained in all publications are solely those of the individual author(s) and contributor(s) and not of MDPI and/or the editor(s). MDPI and/or the editor(s) disclaim responsibility for any injury to people or property resulting from any ideas, methods, instructions or products referred to in the content.

