Article

Terahertz Investigation of Cultural Heritage Synthetic Materials: A Case Study of Copper Silicate Pigments

by
Candida Moffa
1,*,
Anna Candida Felici
1,2 and
Massimo Petrarca
1,*
1
Department of Basic and Applied Sciences for Engineering (SBAI), Sapienza University of Rome, Via Antonio Scarpa, 16, 00161 Rome, Italy
2
Research Center for Applied Sciences to the Safeguard of Environment and Cultural Heritage (CIABC), Sapienza University of Rome, Piazzale Aldo Moro 5, 00185 Rome, Italy
*
Authors to whom correspondence should be addressed.
Minerals 2025, 15(5), 490; https://doi.org/10.3390/min15050490
Submission received: 4 April 2025 / Revised: 1 May 2025 / Accepted: 3 May 2025 / Published: 6 May 2025
(This article belongs to the Special Issue Spectral Behavior of Mineral Pigments, Volume II)

Abstract

:
The present study explores a multi-analytical non-invasive approach based on the application of terahertz continuous wave (THz-CW) spectroscopy for the non-invasive characterization of historically produced synthetic copper silicate pigments. For the first time, Han Blue, Han Purple and Egyptian Blue were examined within the THz spectral region using a compact and portable THz-CW spectrometer. The three pigments exhibit distinct absorption features, which facilitate the differentiation of molecular structures within the same chemical and mineralogical category. Moreover, the same compound was analyzed using Energy Dispersive X-Ray Fluorescence (ED-XRF) to determine its elemental composition, alongside Fiber Optics Reflectance Spectroscopy (FORS) in the range 350–2500 nm, providing crucial insights into its optical properties and molecular structure. To the best of the authors’ knowledge, the present study presents the first spectra for these copper silicates at these wavelengths, thereby expanding the shortwave infrared spectral database of Cultural Heritage materials. This synergistic approach enables a comprehensive characterization, offering a deeper understanding of the compounds’ chemical nature and paving the way for potential applications in the Cultural Heritage domain. Furthermore, the findings underscore the potential of THz-CW spectroscopy as an innovative and effective tool for Cultural Heritage research, providing a non-destructive method to investigate artistic materials.

1. Introduction

Terahertz (THz) radiation has garnered increasing interest across a variety of technological and research domains due to its unique properties, such as deep penetration into dielectric materials, coherence, broad spectral range, and non-ionizing nature, resulting from the low photon energies (4.2 meV at 1 THz). Recent advancements in THz technology have led to the development of compact, high-resolution, and portable systems, further enhancing its applicability. THz technologies have found widespread use in several applications devoted to non-destructive testing, including biomedical imaging, environmental monitoring, and agricultural and food inspections [1,2,3,4,5,6,7,8,9]. In addition to these applications, the THz spectral region has shown promising potential in the field of Cultural Heritage science, offering new avenues for the non-invasive analysis and preservation of valuable artifacts (i.e., retrieving text in historical documents, provide insightful information on surfaces altered by ageing processes, and underlying structure in paintings) [10,11,12,13,14,15,16,17,18,19,20,21,22,23,24].
Both the frequency domain and time domain techniques have been successfully exploited in the characterization of synthetic and natural pigments [10,11,12,13,15,16,21,22,23,24,25]. In particular, the compactness and portability of THz-CW systems and their high-frequency resolution (in the order of 10 MHz) could represent a complementary approach for in-situ pigment identification on Cultural Heritage-related materials in a non-invasive way.
Moreover, by employing THz coherent spectroscopy, both the absorption coefficient and the refractive index of a sample can be simultaneously and directly determined from the amplitude and phase of the electric field, eliminating the need for the complex Kramers–Kronig relations. This approach provides a more straightforward and accurate characterization, enabling precise material analysis within the terahertz frequency range. In this study, we present the experimental THz absorption features of three synthetic copper silicate pigments: Egyptian Blue (EB), Han Blue (HB), and Han Purple (HP). These materials were historically produced and used in Egypt during the Fourth Dynasty and in ancient China [26,27,28,29]. This work reports the first report of THz-CW transmission spectra of Egyptian Blue and two iconic Chinese traditional pigments, unveiling a new frontier in the analysis of ancient materials. The results, benchmarked by material identification from ED-XRF and FORS, highlight the potential of THz-CW spectroscopy as a powerful approach that opens up exciting possibilities for the non-invasive, high-resolution characterization of historical pigments, offering new insights into their unique spectral properties and distinguishing features.
Historically, blue pigments emerged alongside the development of mining, such as the Badakhshan mines in modern-day Afghanistan, where lapis lazuli was sourced and used. However, blue pigment availability remained rare due to its scarcity. This rarity was one of the key factors driving the development of synthetic blue pigments. The first known synthetic blue pigment, Egyptian Blue, dates back to the pre-dynastic Egyptian period (around 3600 BC) [26]. It was produced by combining silica, a copper source, calcium compounds, and alkali flux at high temperatures (830–1000 °C), marking a significant achievement in ancient pigment production.
Similarly, in ancient China, two distinctive pigments, collectively known as the Han colors, were produced from the late Western Zhou period (1207–771 BC) through to the end of the Han dynasty (220–207 BC and 206 BC–220 AD) [27,28,29].
Egyptian Blue (EB) is renowned for its exceptional stability and has been discovered and documented on a wide array of artefacts across diverse regions and historic periods [30,31,32,33,34]. Its versatility allowed for applications not only in painting but also in the production of vitreous materials, such as glasses and Egyptian faience [33,35], as well as in the crafting of compact body objects [34], further demonstrating its significance in ancient civilizations.
Han Blue (HB) and Han Purple (HP) were equally prominent, frequently used in a variety of artefacts, including glazed decorative items [27,36], pottery [36,37,38,39], metal decorations [36,40], and wall paintings [29,40]. Additionally, they were incorporated as compact materials in the creation of octagonal sticks, particularly during the Han dynasty, underscoring their cultural importance [28,29,40,41].
Han Blue was first identified by FitzHugh and Zycherman [36] who also named the compound. At room temperature, its crystal structure belongs to the gillespite group [28] and corresponds to the rare mineral effenbergite, whose presence was first detected in the Kalahari manganese field in South Africa [42,43]. Its scarce presence in nature ruled out the hypothesis of its application as a natural Chinese pigment.
Han Purple represents the first synthetic pigment containing a metallic bond [44]. Its natural analog compound has been found in the Wessels mine, Kalahari Manganese Field (South Africa) as the natural mineral colinowensite [45] but also in this case it is unlikely that the mineral was used as pigment since it is quite rare in nature. The interest in this compound is not only related to its artistic use. In fact, the rare arrangement of the Cu ions and being a quasi-2D material displaying anomalous critical properties [46,47] has attracted the interest of the physics community.
All three pigments’ colors derive from the square-planar C u O 4 6 chromophore. Moreover, HB and EB share the same structure (tetragonal space group P4/ncc) [28].

2. Materials and Methods

2.1. Terahertz Continuous Wave Spectroscopy (THz-CW)

Terahertz spectra were recorded using a terahertz continuous wave (THz-CW) spectroscopic system. THz radiation is generated by heterodyning two tunable distributed feedback lasers (DFB, #LD-1550-0040-DFB) operating in the infrared region (1533, 1538, and 1550 nm). Two lasers are coupled and recombined via an optical fiber beam splitter, creating an interferometric setup in which the heterodyne downconversion takes place, generating a signal at THz frequencies. The resulting signal is then split into two equally modulated branches: one directed to the transmitting photoconductive antenna and the other to the receiving PCA.
The wave directed to the transmitting PCA induces the generation of photocarriers within the photomixer (low-temperature grown InGaAs), which is biased with an applied DC current. The acceleration of photocarriers in the presence of the DC field produces a photocurrent, which is subsequently converted into electromagnetic radiation. By configuring the laser sources in different arrangements, continuous-wave terahertz radiation can be generated across three distinct spectral ranges: 50–1220 GHz, 920–2310 GHz, and 1480–2840 GHz.
The resulting THz radiation is collimated and focused using four off-axis parabolic mirrors (PMs). The THz signal is detected through the photocurrent generated by photo-carriers excited by the beat signal from the second laser. This photocurrent is amplified using a lock-in amplifier. The transmitter is modulated at an AC frequency of approximately 39.67 kHz with a bias voltage of 0.9 V.
The samples (pressed pellets of pure pigment) were analyzed in the transmission configuration, placing them at the focal point of the THz radiation (as reported in [22,23]). All the experiments were performed at room temperature (293 K). The absorption by water vapor was reduced by closing the experimental set-up inside an acrylic box with a homemade dehumidification/ventilation system. In this way, the relative humidity was monitored and kept constant between the measurement of the sample and the reference background.
THz spectra were collected in the spectral range between 100 and 2800 GHz with a frequency resolution of 100 MHz and an integration time of 30 ms. Raw data were processed and analyzed using algorithms written by the authors in MATLAB (ver. 2024b, MathWorks Inc., Natick, MA, USA) based on the Hilbert transform method [48].
The transmittance through the sample was obtained as follows:
T ( ν ) = ( I s a m p l e ( ν ) ) 2 / ( I r e f e r e n c e ( ν ) ) 2
where I s a m p l e ( ν ) and I r e f e r e n c e ( ν ) are the amplitudes of the photocurrents of the sample and of the reference. The reference measurements were performed by collecting the spectra for ambient air and they were carried out each time before the analysis of the samples of interest. The experimental absorbance was then calculated as follows:
A b s o r b a n c e ( ν ) = l o g I s a m p l e ( ν ) I r e f e r e n c e ( ν )
Afterwards, the optical properties were obtained. In particular, the absorption coefficient ( α ( ν ) ) was converted starting from the transmittance through the following:
α ( ν ) = 1 d l o g ( T ( ν ) )
where d is the optical path and T ( ν ) is the transmittance.
The refractive index n ( ν ) is given by the following:
n ( ν ) = 1 + ( Φ sample Φ reference ) · c 2 π ν d
In this equation, Φ sample and Φ reference represent the phases of the sample and the reference in radians, respectively; c is the speed of light in vacuum ( 3 × 10 8 m / s ), ν are the frequencies (measured in Hz, or cycles per second), and d is the thickness of the sample (measured in meters m).

2.2. Energy Dispersive X-Ray Fluorescence (ED-XRF)

The spectrometer consists of an X-ray tube (Amptek Mini-X, Amptek Inc., Bedford, UK) with an anode target of rhodium and a beryllium window of thickness 127 μ m and was powered with an accelerating potential difference of 38 kV and an electronic current of 80 μ A. The detector is a Peltier-cooled silicon drift with amplifier and integrated multichannel analyser (Amptek 123-SDD), providing for any detected X-ray photon a current pulse with amplitude proportional to the energy of the photon. The detector has a surface area of 25 mm2, a thickness of 500 μ m, and a beryllium window of thickness 12.5 μ m. The distance of the sample is 3.5 cm from the sensitive area of the detector and 3 cm from the generator anode. The measured area is about 14 mm2. The energy resolution is 140 eV, full width half maximum (FWHM) of the manganese K α line at 5.9 keV. The X-ray beam collimation was 1 mm, and the acquisition time was 300 s. The spectra were analysed with Pymca 5.5.5.

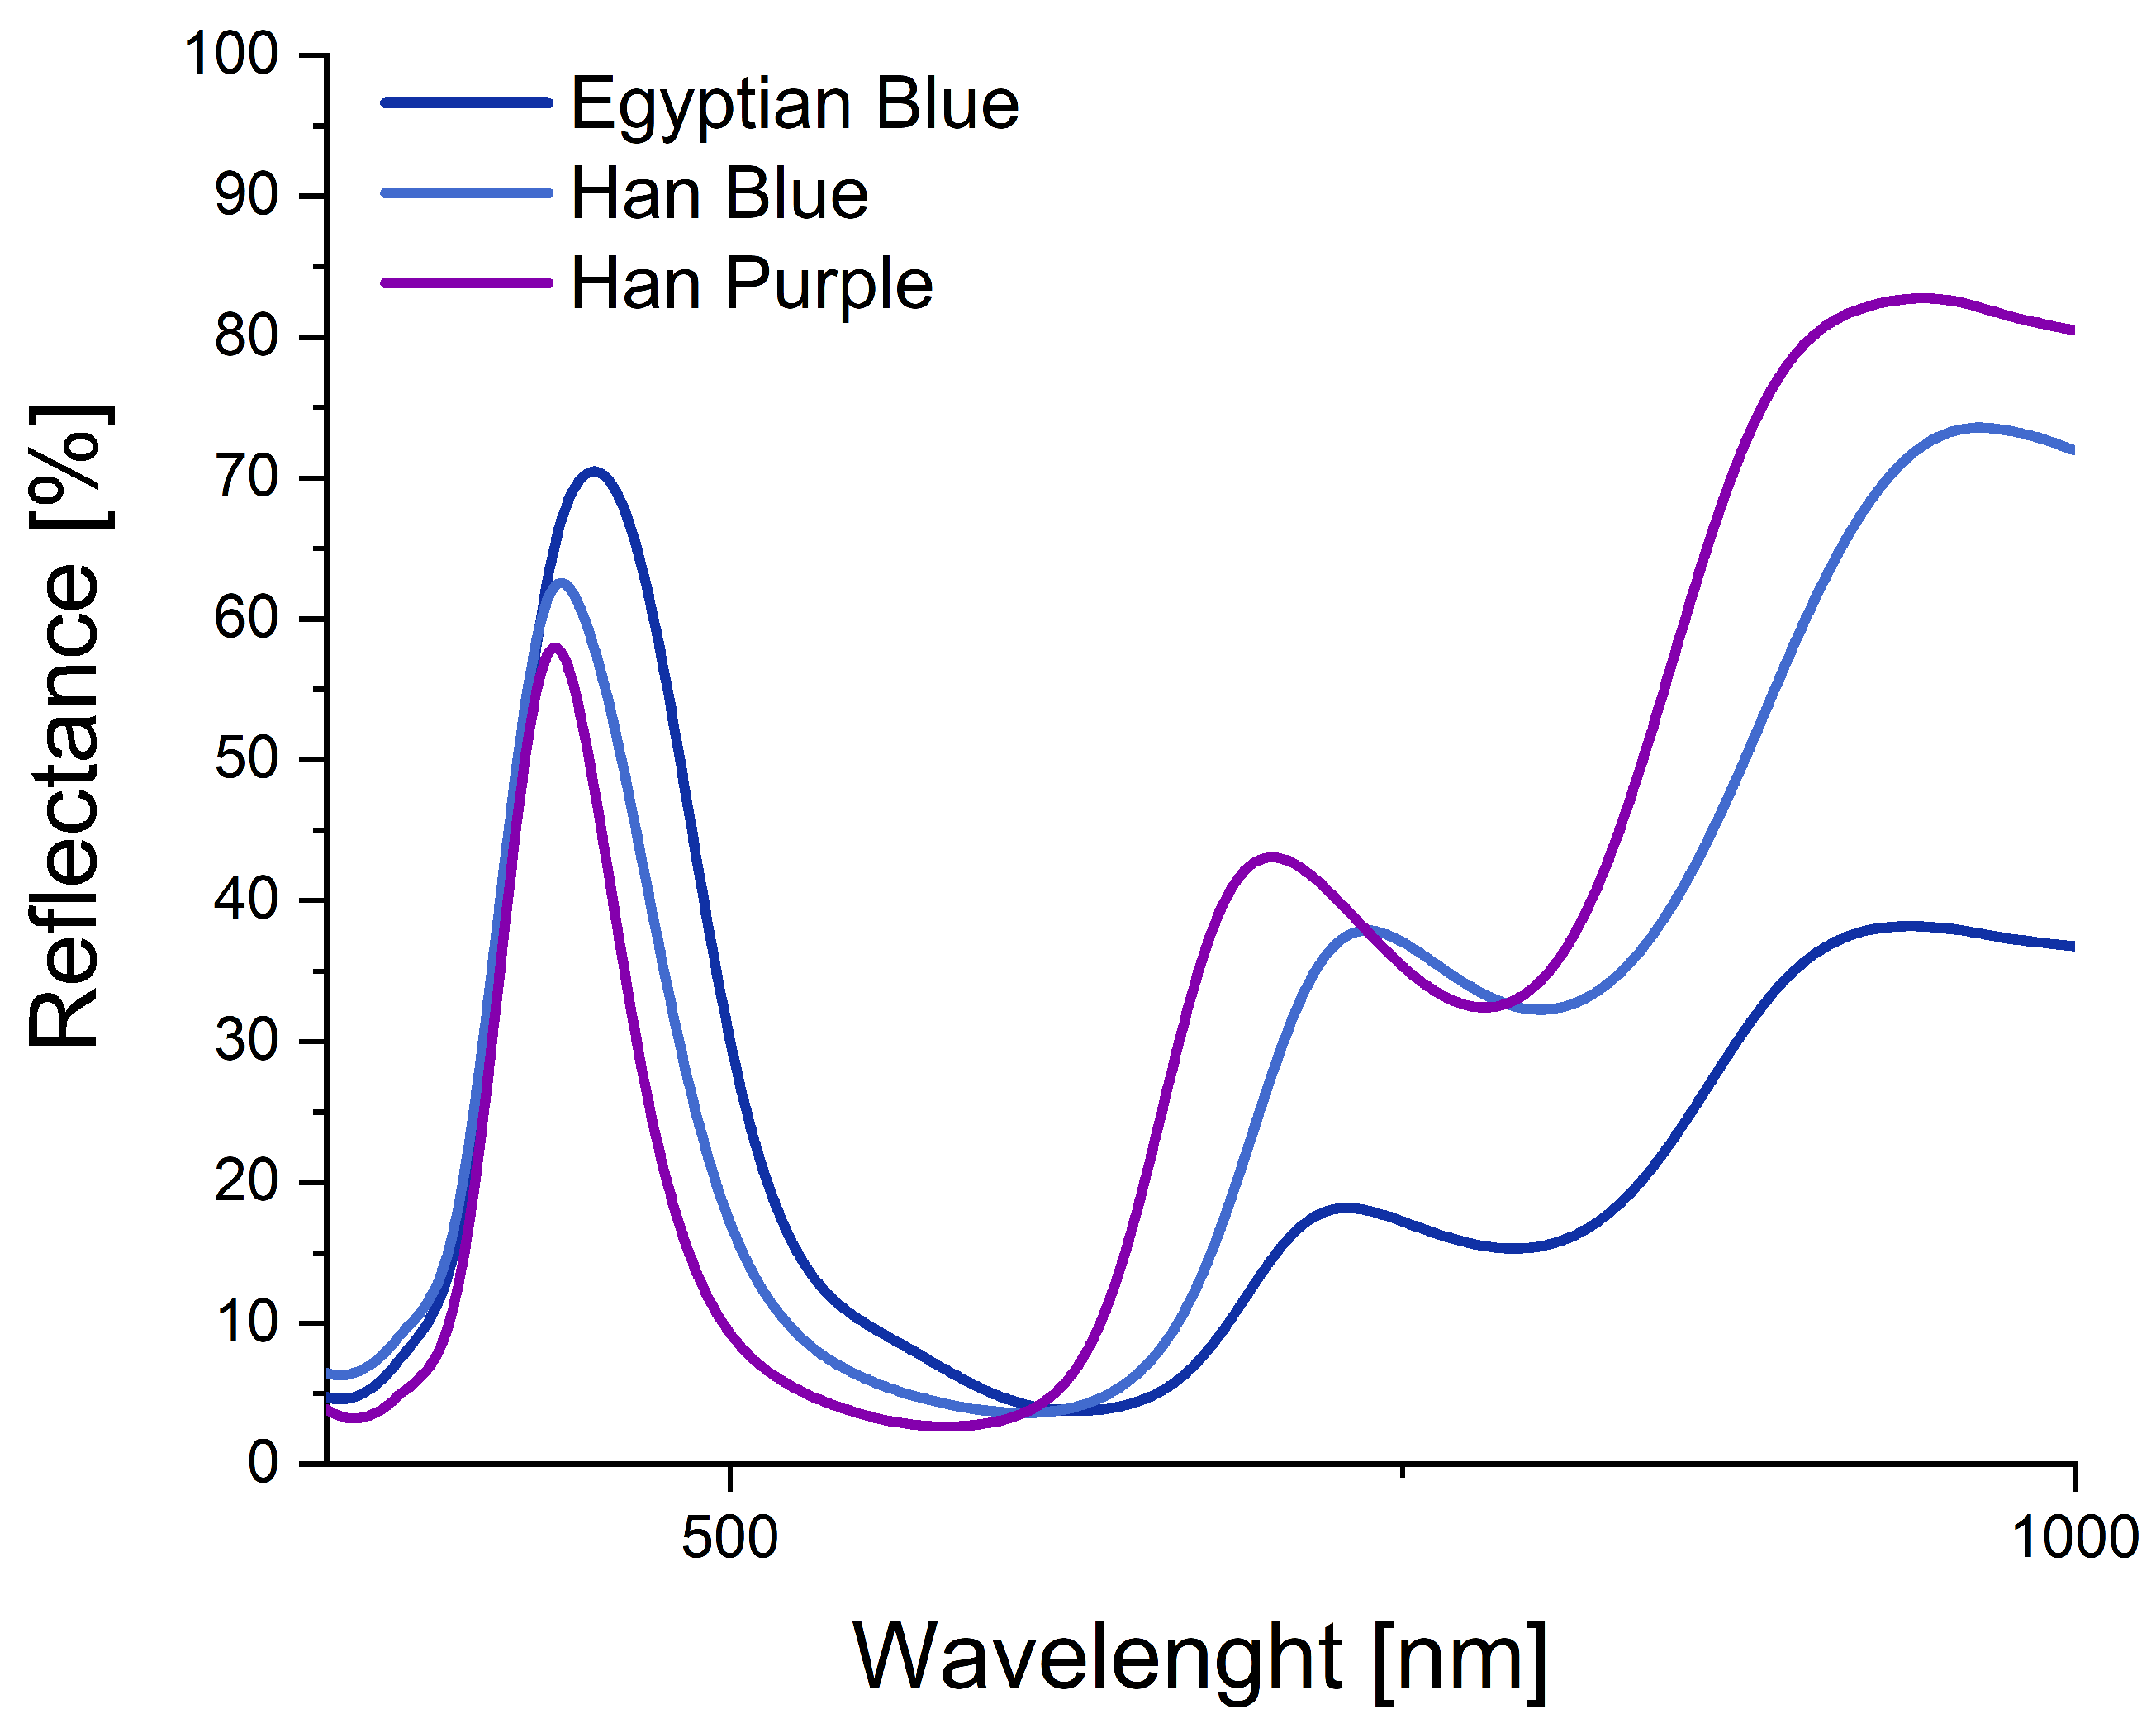
2.3. Fiber Optics Reflectance Spectroscopy (FORS)

Fiber Optics Reflectance spectroscopy was performed with a broadband spectroradiometer ASD FS-4 (ASD Inc., Boulder, CO, USA) in the spectral range from 350 to 2500 nm. The spectrometer is configured to have three separate holographic diffraction gratings with three separate detectors: a 512-element silicon photo-diode array for the region from 350 to 1000 nm; an InGaAs photo-diode for the spectral region 1001 nm to 1800 nm and a second InGaAs photo-diode for the spectral region 1801 nm to 2500 nm. The spectral resolution is 3 nm and 10 nm for the VIS and the SWIR regions, respectively. To obtain relative reflectance spectra, pigment spectra were normalized against a white reference using a reflectance standard that is 99% reflective in the range 250–2500 nm (Spectralon SRS99, Labsphere, North Sutton, NH, USA). To ensure accurate calibration, a dark current signal was recorded with the fiber optic shutter closed, representing the internal signal contribution from the equipment. This signal was subsequently subtracted from all measurements. Since the experiment was conducted under controlled laboratory conditions, white and dark reference data were acquired before the first measurement and subsequently after every 10 measurements. The reflectance spectra were post-processed and converted to apparent absorbance through the following equation:
P A = l o g ( 1 R )
Smoothing with the Savitzky–Golay procedure with a second-degree polynomial order and 55-point window was applied to all spectra.

2.4. Pigments Samples

Egyptian Blue (#10060), Han Blue (#10071) and Han Purple (#10074) were purchased from Kremer Pigments Inc. (Munich, Germany).
For THz-CW measurement, pressed pellets were directly prepared from the pure powders and secured within a metallic containment bolt (average inner diameter of 8.35 mm) without additional grinding or purification procedures. A custom manual press operating via a screw-driven mechanism to apply uniaxial pressure enables the compaction of powdered samples. To evaluate data repeatability, multiple replicates were produced for each sample. Prior to measurement, each pellet underwent thorough inspection to verify its structural integrity. The sample thickness was determined using a digital caliper with a resolution of ±0.01 mm. The same pigments in their powder form were mixed with a binder (gum Arabic, Winsor & Newton) and applied to paper to produce painting mock-ups for analysis using FORS spectroscopy. To prepare the mock-up samples, gum Arabic was dissolved in a small amount of water (approximately 5% by volume relative to the binder). Pigment powder was then added in a roughly 2:1 ratio until the desired consistency and opacity were achieved.

3. Results

3.1. Egyptian Blue

Egyptian Blue, the first synthetic pigment, was created as early as the late pre-dynastic period [26]. Its molecular structure, C a C u S i 4 O 10 , mirrors that of cuprorivaite, a rare mineral within the gillespite group.
Despite its mineralogical significance, the natural form of cuprorivaite was not commonly used as a coloring material, highlighting the innovative leap made by ancient civilizations in developing this synthetic counterpart for artistic and cultural applications.
The elemental composition of the synthetic pigment (Table 1), analyzed using ED-XRF, confirms the presence of key elements characteristic of Egyptian Blue (EB), including silicon (Si), calcium (Ca), and copper (Cu). In ancient pigment production, these elements originated from the raw materials employed: silica, sand containing calcium carbonate C a C O 3 as part of the flux, and metallic copper. Additionally, the detection of nickel (Ni), iron (Fe), lead (Pb), and zinc (Zn) is likely associated with the copper source, such as copper alloys. In pigments from historical contexts, these elements may have been deliberately introduced, potentially serving a functional role as fluxing agents [26].
EB investigated through reflectance spectroscopy (Figure 1) has characteristic triple absorptions at 560, 630, and 790 nm in the visible range [49,50,51]. This result is also confirmed from the pseudo-absorbance spectrum, which shows a maximum at 630 nm, which is related to the d-d transitions of C u 2 + in the silicate crystal field [28,52,53,54,55].
The spectral response of EB, investigated in the THz range (spectral range 100–2500 GHz), presents an increasing absorption with a peak centered at 2.07 THz [56] with a bandwidth of 124 GHz obtained from the fitting procedure performed with a Voigt function (Figure 2). The refractive index of EB, obtained from the experimental data, has an average value of 2.39 in the range 0.5–2.5 THz.

3.2. Han Blue

Han Blue is a synthetic barium copper silicate pigment ( B a C u S i 4 O 10 ) produced and used in many Chinese artefacts until the Han dynasty.
Han blue is isostructural with EB, containing barium instead of calcium as the earth alkali element, and the C u O distances are almost identical in the two compounds [43], thus, the internal potential in both lattices is fundamentally identical [28]. The two corresponding natural forms of the pigments, namely effenbergite and cuprorivaite, also belong to the same group that includes tetragonal sheet silicates with alkaline earth and copper cations [27,41,42].
ED-XRF analysis of the synthetic pigment (Table 2) reveals a composition rich in silicon (Si), copper (Cu), and barium (Ba) according to the chemical composition of the material. Additional elements identified include zinc (Zn) and strontium (Sr), along with the presence of lead (Pb). Their identification is in good agreement with the elemental composition of ancient pigments, where these components could have been intentionally incorporated, likely playing a crucial role as fluxing agents in the material’s production [57]. For example, lead oxide (PbO) can be used as a fluxing agent and as a catalyst for the decomposition of the raw B a S O 4 . The significant Zn content probably originates from zinc-bearing minerals or impurities in the copper source. The high Sr concentration suggests the use of strontium-rich raw materials, possibly as a flux or structural modifier within the pigment matrix. The detection of Pb could be attributed to the incorporation of lead-based fluxes, unintentional contamination from metallurgical processes [57].
Reflectance spectroscopy analysis of HB reveals its characteristic pseudo-absorbance maximum at 608 nm within the visible range, attributed to the electronic transitions within the copper (Cu) ions embedded in the barium copper silicate matrix. Additionally, a gradual increase in reflectance is observed in the near-infrared (NIR) region, with an absorption feature detected around 804 nm (Figure 3).
The FORS features of HB are linked to the d-d transitions of C u 2 + with square-planar geometry, which are responsible for its distinct absorption features and blue coloration [51,54,55].
The pigment investigated using THz radiation in the spectral range between 0.1 and 2.5 THz (Figure 4) exhibits a broad absorption band centered at 1.79 THz with a full-width at half-maximum (FWHM) of 176 GHz, as determined by Voigt peak shape analysis. The refractive index of the material has been determined from the experimental measurements and it has an average value of 2.15 in the spectral range considered. Despite the subtle differences in structure and chemical composition compared to Egyptian Blue (EB), the two pigments can be clearly distinguished using THz spectroscopy, showcasing the sensitivity and precision of this technique for material characterization.

3.3. Han Purple

Han Purple is a synthetic copper silicate ( B a C u S i 2 O 6 ) produced with a highly complex process where barium (in carbonates or sulfates) was used in preparation with lead compounds and quartz [39]. The presence of lead fluxes was fundamental in order to lower the temperatures involved and stabilize the final product [39].
The low chemical stability that the pigment may present is related to the presence in its chemical structure of a copper–copper bond, which is a very uncommon feature [27].
The ED-XRF spectra of Han Purple reveal a chemical structure primarily composed of barium (Ba), calcium (Ca), and silicon (Si), which are key elements contributing to its distinctive composition. Minor elements such as titanium (Ti), lead (Pb), iron (Fe), copper (Cu) and zinc (Zn) were detected (Table 3). In historically produced Han Purple, lead (Pb) derives from lead oxide (PbO), thought to fulfil a dual function: promoting glass formation and acting as a synthetic agent, promoting the extraction of barium from the mineral matrix [57,58].
The reflectance spectrum exhibits a pronounced absorption band in the visible region, typically around 580 nm, corresponding to electronic transitions within the barium copper silicate matrix (Figure 5). This absorption feature contributes to the pigment’s distinct purple hue. Moreover, a second absorption band is present at 784 nm [51]. To facilitate comparison, the three reflectance spectra were superimposed to highlight differences within the wavelength region of interest (Figure 6).
The THz-CW spectral response of Han Purple (Figure 7) was characterized by an increasing absorption above 1 THz, characterized by a broad absorption band centered around 1.53 THz and a second broad feature at 2.26 THz. The FWHM of the peaks is retrieved from a fitting procedure employing a Voigt function around 487 GHz and approximately 920 GHz, respectively. Among all the synthetic copper silicates analyzed in this study, this material exhibits the highest refractive index in the THz range, yielding an average value of 2.77.

4. Conclusions

The potential for non-invasive identification using a portable experimental set-up positions THz-CW spectroscopy as a compelling analytical tool in the Cultural Heritage field. The present study represents a pioneering investigation into the two Han pigments within the terahertz spectral range and introduces the first characterization of Egyptian Blue using a compact, portable THz-CW system, marking an important advancement in the application of THz spectroscopy to ancient and synthetic chemically related pigments. The distinct absorption features observed enable discrimination based on subtle structural and compositional differences, demonstrating the technique’s sensitivity. A comprehensive preliminary characterization of the compounds was achieved by integrating complementary techniques such as X-ray fluorescence (XRF) and fiber optic reflectance spectroscopy (FORS), providing essential elemental and optical data. This multi-method, non-destructive approach enhances the understanding of the pigments’ composition and spectral behavior while preserving the integrity of cultural artifacts, highlighting the significance of advanced spectroscopic techniques in the analysis and conservation of historical materials. The distinct spectral signatures observed in the THz-CW spectra lay the foundation for future research into copper silicate pigments, offering deeper insight into their properties and broadening the scope of terahertz spectroscopy in heritage science.

Author Contributions

Conceptualization, C.M. and M.P.; methodology, C.M. and M.P.; software, C.M. and M.P.; validation, C.M., A.C.F. and M.P.; formal analysis, C.M.; investigation, C.M.; resources, C.M., A.C.F. and M.P.; data curation, C.M., A.C.F. and M.P.; writing—original draft preparation, C.M.; writing—review and editing, C.M., A.C.F. and M.P.; visualization, C.M.; supervision, A.C.F. and M.P.; project administration, A.C.F. and M.P.; funding acquisition, C.M., A.C.F. and M.P. All authors have read and agreed to the published version of the manuscript.

Funding

This work was carried out thanks to Sapienza Large Projects Research Call 2023 titled “TforCH: R&D on the potentiality of THz radiation for Cultural Heritage”. This work was conducted in the framework of “PRIN 2022: TREX a prototype of a portable and remotely controlled platform based on THz technology to measure the one health vision: environment, food, plant health, security, human and animal health” funded by the European Union-Next Generation EU (CUP B53D23013610006-Project Code 2022B3MLXB PNRR M4.C2.1.1). This work was supported by Sapienza competitive grants: Grandi Attrezzature Scientifiche (2018) titled “SapienzaTerahertz: THz spectroscopic image system for basic and applied sciences”. This research was also supported by “STORM-Sensori su sistemi mobili e remoti al Terahertz PNRM a2017.153 STORM” funded by Ministero della Difesa and “R-SET: Remote sensing for the environment by THz radiation” Large Research Projects of Sapienza, University of Rome.

Data Availability Statement

The original contributions presented in this study are included in the article. Further inquiries can be directed to the corresponding authors.

Conflicts of Interest

The authors declare no conflicts of interest.

Abbreviations

The following abbreviations are used in this manuscript:
THz-CWTerahertz continuous wave
ED-XRFEnergy Dispersive X-Ray Fluorescence
FORSFiber Optics Reflectance Spectroscopy
EBEgyptian blue
HBHan Blue
HPHan Purple
DFBDistributed Feedback Lasers
PCAPhotoconductive antenna
PMsParabolic mirrors
VisVisible
SWIRShort Wave Infrared
NIRNear-infrared
FWHMFull Width Half Maximum

References

  1. Nikitkina, A.; Bikmulina, P.; Gafarova, E.; Kosheleva, N.; Efremov, Y.; Bezrukov, E.; Butnaru, D.; Dolganova, I.; Chernomyrdin, N.; Cherkasova, O.; et al. Terahertz radiation and the skin: A review. J. Biomed. Opt. 2021, 26, 043005. [Google Scholar] [CrossRef] [PubMed]
  2. Peng, Y.; Shi, C.; Wu, X.; Zhu, Y.; Zhuang, S. Terahertz Imaging and Spectroscopy in Cancer Diagnostics: A Technical Review. BME Front. 2021, 26, 2547609. [Google Scholar] [CrossRef] [PubMed]
  3. Gong, A.; Qiu, Y.; Chen, X.; Zhao, Z.; Xia, L.; Shao, Y. Biomedical applications of terahertz technology. Appl. Spectrosc. Rev. 2020, 55, 418–438. [Google Scholar] [CrossRef]
  4. Yu, L.; Hao, L.; Meiqiong, M.T.; Jiaoqi, H.; Wei, L.; Jinying, D.; Xueping, C.; Weiling, F.; Yang, Z. The medical application of terahertz technology in non-invasive detection of cells and tissues: Opportunities and challenges. RSC Adv. 2019, 9, 9354–9363. [Google Scholar] [CrossRef] [PubMed]
  5. Bawuah, P.; Zeitler, J.A. Advances in terahertz time-domain spectroscopy of pharmaceutical solids: A review. TrAC Trends Anal. Chem. 2021, 139, 116272. [Google Scholar] [CrossRef]
  6. Afsah-Hejri, L.; Akbari, E.; Toudeshki, A.; Homayouni, T.; Alizadeh, A.; Ehsani, R. Terahertz spectroscopy and imaging: A review on agricultural applications. Comput. Electron. Agric. 2020, 177, 105628. [Google Scholar] [CrossRef]
  7. Zhong, S. Progress in terahertz nondestructive testing: A review. Front. Mech. Eng. 2019, 14, 273–281. [Google Scholar] [CrossRef]
  8. Tao, Y.H.; Fitzgerald, A.J.; Wallace, V.P. Non-Contact, Non-Destructive Testing in Various Industrial Sectors with Terahertz Technology. Sensors 2020, 20, 712. [Google Scholar] [CrossRef]
  9. D’Arco, A.; Rocco, D.; Magboo, P.F.J.; Moffa, C.; Ventura, G.D.; Marcelli, A.; Palumbo, L.; Mattiello, L.; Lupi, S.; Petrarca, M. Terahertz continuous wave spectroscopy: A portable advanced method for atmospheric gas sensing. Opt. Express 2022, 30, 19005–19016. [Google Scholar] [CrossRef]
  10. Fukunaga, K. THz Technology Applied to Cultural Heritage in Practice; Springer: Tokyo, Japan, 2016. [Google Scholar]
  11. Squires, A.D.; Kelly, M.; Lewis, R.A. Terahertz Analysis of Quinacridone Pigments. J. Infrared Millim. Terahertz Waves 2016, 38, 314–324. [Google Scholar] [CrossRef]
  12. Kleist, E.M.; Dandolo, C.L.K.; Guillet, J.; Mounaix, P.; Korter, T.M. Terahertz Spectroscopy and Quantum Mechanical Simulations of Crystalline Historical Pigments. J. Phys. Chem. A 2019, 123, 1225–1232. [Google Scholar] [CrossRef] [PubMed]
  13. Lee, J.E.; Lee, H.; Kim, J.; Jung, T.S.; Kim, J.H.; Kim, J.; Baek, N.Y.; Song, Y.N.; Lee, H.H.; Kim, J.H. Terahertz Spectroscopic Analysis of the Vermilion Pigment in Free Standing and Polyethylene-Mixed Form. ACS Omega 2021, 6, 13802–13806. [Google Scholar] [CrossRef] [PubMed]
  14. Fukunaga, K.; Picollo, M. Terahertz spectroscopy applied to the analysis of artists’ materials. Appl. Phys. A 2010, 100, 591–597. [Google Scholar] [CrossRef]
  15. Hong, T.; Choi, K.; Ha, T.; Park, B.C.; Sim, K.I.; Kim, J.H.; Kim, J.H. Terahertz Time-domain and Fourier-transform Infrared Spectroscopy of Traditional Korean Pigments. Korean Phys. Soc. 2014, 64, 727–731. [Google Scholar] [CrossRef]
  16. Ha, T.; Lee, H.; Sim, K.I.; Kim, J.; Jo, Y.C.; Kim, J.H. Optimal Methodologies for Terahertz Time-Domain Spectroscopic Analysis of Traditional Pigments in Powder Form. Korean Phys. Soc. 2017, 70, 866–887. [Google Scholar] [CrossRef]
  17. Yang, Y.; Zhai, D.; Zhang, Z.; Zhang, C. THz Spectra of Seven Red Mineral Pigments used in Ancient Chinese Artworks. J. Infrared Millim. Terahertz Waves 2017, 38, 1232–1240. [Google Scholar] [CrossRef]
  18. Squires, A.D.; Lewis, R.A. Terahertz Analysis of Phthalocyanine Pigments. Int. J. Infrared Millim. Waves 2019, 40, 738–751. [Google Scholar] [CrossRef]
  19. Bardon, T.; May, R.K.; Taday, P.F.; Strlič, M. Systematic study of terahertz time-domain spectra of historically informed black inks. Analyst 2013, 138, 4859–4869. [Google Scholar] [CrossRef]
  20. Taschin, A.; Bartolini, P.; Tasseva, J.; Striova, J.; Fontana, R.; Riminesi, C.; Torre, R. Drawing materials studied by THz spectroscopy. arXiv 2017, arXiv:1703.01770. [Google Scholar] [CrossRef]
  21. Kleist, E.M.; Korter, T.M. Quantitative Analysis of Minium and Vermilion Mixtures Using Low-Frequency Vibrational Spectroscopy. Anal. Chem. 2020, 92, 1211–1218. [Google Scholar] [CrossRef]
  22. Moffa, C.; Merola, C.; Magboo, F.P., Jr.; Chiadroni, E.; Giuliano, L.; Curcio, A.; Palumbo, L.; Felici, A.C.; Petrarca, M. Pigments, minerals, and copper-corrosion products: Terahertz continuous wave (THz-CW) spectroscopic characterization of antlerite and atacamite. J. Cult. Herit. 2024, 66, 483–490. [Google Scholar] [CrossRef]
  23. Moffa, C.; Curcio, A.; Merola, C.; Migliorati, M.; Palumbo, L.; Felici, A.C.; Petrarca, M. Discrimination of natural and synthetic forms of azurite: An innovative approach based on high-resolution terahertz continuous wave (THz-CW) spectroscopy for Cultural Heritage. Dye. Pigment. 2024, 229, 112287. [Google Scholar] [CrossRef]
  24. Moffa, C.; Urso, V.; Migliorati, M.; Palumbo, L.; Felici, A.; Zollo, G.; Petrarca, M. Terahertz time-domain investigation of atacamite: Spectral analysis and theoretical insights for cultural heritage applications. Appl. Phys. Lett. 2024, 125, 204102. [Google Scholar] [CrossRef]
  25. Manceau, J.M.; Nevin, A.; Fotakis, C.; Tzortzakis, S. Terahertz time domain spectroscopy for the analysis of cultural heritage related materials. Appl. Phys. B 2008, 90, 365–368. [Google Scholar] [CrossRef]
  26. Nicola, M.; Gobetto, R.; Masic, A. Egyptian blue, Chinese blue, and related two-dimensional silicates: From antiquity to future technologies. Part A: General properties and historical uses. Rend. Lincei. Sci. Fis. Nat. 2023, 34, 369–413. [Google Scholar] [CrossRef]
  27. Berke, H. The invention of blue and purple pigments in ancient times. Chem. Soc. Rev. 2007, 36, 15–30. [Google Scholar] [CrossRef]
  28. García-Fernandez, P.; Moreno, M.; Aramburu, J.A. Origin of the Anomalous Color of Egyptian and Han Blue Historical Pigments: Going beyond the Complex Approximation in Ligand Field Theory. J. Chem. Educ. 2016, 93, 111–117. [Google Scholar] [CrossRef]
  29. Zangh, Z.; Ma, Q.; Berke, H. Man-made blue and purple barium copper silicate pigments and the pabstite (BaSnSi3O9) mystery of ancient Chinese wall paintings from Luoyang. Herit. Sci. 2019, 7, 97. [Google Scholar]
  30. Kostomitsopoulou Marketou, A.; Giannici, F.; Handberg, S.; De Nolf, W.; Cotte, M.; Caruso, F. Synchrotron radiation-based micro-XANES and micro-XRF study of unsuccessfully produced Egyptian blue from the late hellenistic production site of Kos (Dodecanese, Greece). Anal. Chem. 2021, 93, 11557–11567. [Google Scholar] [CrossRef]
  31. Santos, H.C.; Caliri, C.; Pappalardo, L.; Rizzo, F.; Romano, F.P. MA-XRF and XRD analysis revealing a polychrome Centuripe vase. J. Archaeol. Sci. Rep. 2021, 35, 102760. [Google Scholar] [CrossRef]
  32. Dariz, P.; Schmid, T. Trace compounds in Early Medieval Egyptian blue carry information on provenance, manufacture, application, and ageing. Sci. Rep. 2021, 11, 11296. [Google Scholar] [CrossRef] [PubMed]
  33. Falcone, F.; Aquilino, M.; Stoppa, F. Exploring the composition of Egyptian faience. Minerals 2024, 14, 586. [Google Scholar] [CrossRef]
  34. Degenhart, G.; Heinemann, J.; Tropper, P.; Rodler-Rørbo, A.; Zerobin, B.; Auer, M.; Goldenberg, G. Mineralogical and Micro-Computer Tomographic (μCT) Texture Investigations of Egyptian Blue Spheres (Aguntum, East Tyrol; Retznei and Wagna, Flavia Solva, South Styria). Minerals 2025, 15, 302. [Google Scholar] [CrossRef]
  35. Xu, Y.; Basafa, H.; Wu, X.; Davari, M.S.; Wang, R. Faience and Egyptian blue frit from Khorasan: Scientific analysis on beads unearthed from Se Tepe site, northeast Iran. J. Archaeol. Sci. Rep. 2024, 55, 104496. [Google Scholar] [CrossRef]
  36. FitzHugh, E.W.; Zycherman, L.A. An early man-made blue pigment from China—Barium copper silicate. Stud. Conserv. 1983, 28, 15–23. [Google Scholar]
  37. Herm, C.; Thieme, C.; Emmerling, E.; Wu, Y.; Zhou, T.; Zhang, Z. Analysis of painting materials of the polychrome terracotta army of the first emperor Qin Shi Huang. In Proceedings of the International Symposium on The Ceramics Cultural Heritage of the 8th CIMTEC-World Ceramics Congress and Forum on New Materials, Florence, Italy, 28 June–2 July 1994; pp. 591–601. [Google Scholar]
  38. Cheng, X.; Xia, Y.; Ma, Y.; Lei, Y. Three fabricated pigments (Han purple, indigo and emerald green) in ancient Chinese artifacts studied by Raman microscopy, energy-dispersive X-ray spectrometry and polarized light microscopy. J. Raman Spectrosc. 2007, 38, 1274–1279. [Google Scholar] [CrossRef]
  39. Liu, Z.; Mehta, A.; Tamura, N.; Pickard, D.; Rong, B.; Zhou, T.; Pianetta, P. Influence of Taoism on the invention of the purple pigment used on the Qin terracotta warriors. J. Archaeol. Sci. 2007, 34, 1878–1883. [Google Scholar] [CrossRef]
  40. Xia, Y.; Ma, Q.; Zhang, Z.; Liu, Z.; Feng, J.; Shao, A.; Wang, W.; Fu, Q. Development of Chinese barium copper silicate pigments during the Qin Empire based on Raman and polarized light microscopy studies. J. Archaeol. Sci. 2014, 49, 500–509. [Google Scholar] [CrossRef]
  41. Ma, Q.; Portmann, A.; Wild, F.; Berke, H. Raman and SEM Studies of Man-Made Barium Copper Silicate Pigments in Ancient Chinese Artifacts. Stud. Conserv. 2006, 51, 81–98. [Google Scholar] [CrossRef]
  42. Masunaga, S.H.; Rebello, A.; Schye, A.T.; Prasai, N.; Neumeier, J.J.; Cohn, J.L. Heat capacity, thermal expansion and heat transport in the Han Blue (BaCuSi4O10): Observation of structural phase transitions. J. Phys. Chem. Solids 2015, 85, 69–74. [Google Scholar] [CrossRef]
  43. Pozza, G.; Ajò, D.; Chiari, G.; Zuane, F.D.; Favaro, M. Photoluminescence of the inorganic pigments Egyptian blue, Han blue and Han purple. J. Cult. Herit. 2000, 1, 393–398. [Google Scholar] [CrossRef]
  44. Jaime, M.; Correa, V.F.; Harrison, N.; Batista, C.D.; Kawashima, N.; Kazuma, Y.; Jorge, G.A.; Stern, R.; Heinmaa, I.; Zvyagin, S.A.; et al. Magnetic-Field-Induced Condensation of Triplons in Han Purple Pigment BaCuSi2O6. Phys. Rev. Lett. 2004, 93, 087203. [Google Scholar] [CrossRef]
  45. Rieck, B.; Pristacz, H.; Giester, G. Colinowensite, BaCuSi2O6, a new mineral from the Kalahari Manganese Field, South Africa and new data on wesselsite SrCuSi4O10. Mineral. Mag. 2015, 79, 1769–1778. [Google Scholar] [CrossRef]
  46. Puphal, P.; Allenspach, S.; Rüegg, C.; Pomjakushina, E. Floating Zone Growth of Sr Substituted Han Purple: Ba0.9Sr0.1CuSi2O6. Crystals 2019, 9, 273. [Google Scholar] [CrossRef]
  47. Allenspach, S.; Puphal, P.; Link, J.; Heinmaa, I.; Pomjakushina, E.; Krellner, C.; Lass, J.; Tucker, G.S.; Niedermayer, C.; Imajo, S.; et al. Revealing three-dimensional quantum criticality by Sr substitution in Han purple. Phys. Rev. Res. 2021, 3, 023177. [Google Scholar] [CrossRef]
  48. Kong, D.; Wu, X.; Wang, B.; Gao, Y.; Dai, J.; Wang, L.; Ruan, C.; Miao, J. High resolution continuous wave terahertz spectroscopy on solid-state samples with coherent detection. Opt. Express 2018, 26, 17964–17976. [Google Scholar] [CrossRef]
  49. Mirti, P.; Appolonia, L.; Casoli, A.; Ferrari, R.; Laurenti, E.; Canesi, A.A.; Chiari, G. Spectrochemical and structural studies on a Roman sample of Egyptian blue. Spectrochim. Acta A Mol. Biomol. Spectrosc. 1995, 51, 437–446. [Google Scholar] [CrossRef]
  50. Radpour, R.; Delaney, J.K.; Kakoulli, I. Acquisition of high spectral resolution diffuse reflectance image cubes (350–2500 nm) from archaeological wall paintings and other immovable heritage using a field-deployable spatial scanning reflectance spectrometry hyperspectral system. Sensors 2022, 22, 1915. [Google Scholar] [CrossRef]
  51. La Rocca, R.; Pitman, R.; Shahbazi, S.; Lópes, T.; Dallerba, E.; Massi, M.; Smith, G.D.; Lewis, S.W. Preliminary investigations into the use of the ancient pigments Han blue and Han purple as luminescent dusting powders for the detection of latent fingermarks. Forensic Sci. Int. 2024, 362, 112172. [Google Scholar] [CrossRef]
  52. Aceto, M.; Agostino, A.; Fenoglio, G.; Idone, A.; Gulmini, M.; Picollo, M.; Ricciardi, P.; Delaney, J.K. Characterisation of colourants on illuminated manuscripts by portable fibre optic UV-visible-NIR reflectance spectrophotometry. Anal. Methods 2014, 6, 1488–1500. [Google Scholar] [CrossRef]
  53. Siozos, P.; Philippidis, A.; Anglos, D. Portable laser-induced breakdown spectroscopy/diffuse reflectance hybrid spectrometer for analysis of inorganic pigments. Spectrochim. Acta Part B At. Spectrosc. 2017, 137, 93–100. [Google Scholar] [CrossRef]
  54. Subramanian, M.A.; Li, J. YInMn blue-200 Years in the making: New intense inorganic pigments based on chromophores in trigonal bipyramidal coordination. Mater. Today Adv. 2022, 16, 100323. [Google Scholar] [CrossRef]
  55. García-Fernández, P.; Moreno, M.; Aramburu, J.A. Origin of the exotic blue color of copper-containing historical pigments. Inorg. Chem. 2015, 54, 192–199. [Google Scholar] [CrossRef] [PubMed]
  56. Artesani, A.; Lamuraglia, R.; Menegazzo, F.; Bonetti, S.; Traviglia, A. Terahertz time-domain spectroscopy in reflection configuration for inorganic and mineral pigment identification. Appl. Spectrosc. 2023, 77, 74–87. [Google Scholar] [CrossRef] [PubMed]
  57. Wiedemann, H.G.; Berke, H. Chemical and physical investigations of Egyptian and Chinese blue and purple. Monum. Sites 2001, 3, 154–171. [Google Scholar]
  58. Berke, H.; Corbiere, T.; Portmann, A.; Freisinger, E.; Wild, F.; Hutter, J.; Lu, P.; Yin, X.; Qinglin, M.; Zhiguo, Z. Man-made ancient Chinese Blue and Purple pigments. Wenbo 2009, 6, 251–265. [Google Scholar]
Figure 1. (a) Reflectance spectrum and (b) pseudo-absorbance spectrum of Egyptian Blue in the spectral range 350–2500 nm.
Minerals 15 00490 g001
Figure 2. THz–CW spectrum of Egyptian Blue in the range 500–2500 GHz.
Minerals 15 00490 g002
Figure 3. (a) Reflectance spectrum and (b) pseudo-absorbance spectrum of Han Blue in the range 350–2500 nm.
Minerals 15 00490 g003
Figure 4. THz-CW spectrum of Han Blue in the spectral range 500–2500 GHz.
Minerals 15 00490 g004
Figure 5. (a) Reflectance spectrum and (b) pseudo-absorbance spectrum of Han Purple in the range 350–2500 nm.
Minerals 15 00490 g005
Figure 6. Superimposed reflectance spectra of Egyptian Blue, Han Blue, and Han Purple, illustrating spectral variations within the wavelength region of interest between 350 and 1000 nm.
Minerals 15 00490 g006
Figure 7. THz-CW spectrum of Han Purple in the spectral range 500–2500 GHz.
Minerals 15 00490 g007
Table 1. ED-XRF data for Egyptian Blue.
ElementCounts σ
SiK466.824.5
CaK13,525.2155.5
TiK195.026.8
FeK688.737.2
NiK123.827.3
CuK187,378.9435.0
ZnK785.941.6
SrK162.723.5
PbL606.236.8
Table 2. ED-XRF data for Han Blue.
ElementCounts σ
SiK362.122.4
CuK81,089.3287.0
ZnK283.229.9
SrK3972.7194.1
BaK8993.3107.0
BaL34,846.4196.0
PbL390.135.8
Table 3. ED-XRF data for Han Purple.
ElementCounts σ
SiK143.716.3
CaK251.041.6
TiK528.5114.0
FeK87.418.9
NiK131.520.4
CuK54,558.9236.0
ZnK262.625.6
SrK3060.961.2
BaK7119.987.4
BaL21,309.6178.0
PbL490.132.6
Disclaimer/Publisher’s Note: The statements, opinions and data contained in all publications are solely those of the individual author(s) and contributor(s) and not of MDPI and/or the editor(s). MDPI and/or the editor(s) disclaim responsibility for any injury to people or property resulting from any ideas, methods, instructions or products referred to in the content.

