1. Introduction
After the closure of the Sargadelos factories in 1875, the extraction of local kaolin continued in Burela, which was subsequently exported to other locations in the Iberian Peninsula. At the beginning of the 20th century, a foreign industrial bourgeoisie settled in Burela and took over the exploitation of kaolin. Kaolin is an industrially relevant mineral. It has been used for centuries for numerous purposes, such as the manufacture of white ceramics, which gained great fame in the 16th century. The main uses for which it is currently used are paper and ceramic manufacturing, production of refractories, paints and varnishes, generation of polymers and fiberglass, and the manufacture of pesticides, fertilizers, and cosmetics.
The genesis of primary kaolin may be a consequence of different geological processes. The primary environments of kaolinization are (1) vein-type deposits, (2) (sub) volcanic and pyroclastic deposits, (3) skarn to epithermal deposits, (4) granitic rocks and their affiliated rocks (pegmatites and greisen). By contrast, the secondary kaolinization are (1) kaolin and soils, (2) layered residual kaolin deposits (mixed-type residual kaolin-bauxite deposits, exposed residual kaolin, hidden residual kaolin), (3) vein-like kaolin, (4) alluvial-fluvial environments, fluvial meandering streams, (5) prograding fluvial deltas into a marine or lacustrine basin, (6) lakes and ponds (permanent and ephemeral lakes), (7) coal-bearing environments (suspended load deposits in coal swamps, underclays, composite residual and hydrothermal kaolinization in coal swamps, kaolin tonsteins), (8) marine terrigenous shoreline deposits. As tertiary environments of kaolinization, the following can be cited: (1) burial diagenesis, (2) very-low-grade regional dynamo metamorphism and (3) contact metamorphism [
1]. It is also possible to cite a combination of several processes.
In the Variscan belt of Galicia (NW Spain), the kaolinitization of crystalline rocks, metapelites and volcanic rocks are widely spread. Large deposits of kaolin, and also minor occurrences, are hosted by feldspathic rocks, mainly granites and rhyolites. Kaolinitization processes occurred during post-Alpine weathering events that obliterated most of the earlier hydrothermal features [
2,
3,
4,
5,
6]. The area of Burela (NW Spain) has the largest kaolin deposits in Spain.
The aim of this study is to investigate the deposits of Montecastelo (Burela, NW Spain) that are formed by large-scale weathering of Variscan granitoids. The kaolin is formed from two mica leucogranites and alkali feldspars granites belonging to a complex and heterogeneous magmatic body (San Ciprian pluton) that intruded into an early Cambrian quartzite sequence during the latest stages of the Varican orogeny [
5,
7].
2. Geological Setting
In the Variscan belt of Galicia (NW Spain), the kaolinitization of crystalline rocks, metapelites and volcanic rocks are widely spread (
Figure 1). Large deposits of kaolin and also minor occurrences are hosted by feldspathic rocks, mainly granites and rhyolites. Kaolinitization processes occurred during post-Alpine weathering events that obliterated most of the earlier hydrothermal features [
2,
3,
4,
5,
6].
According to [
6], temperature ranges from 15 to 35 °C, with an average of approximately 28 °C, which was calculated on the basis of the isotopic signatures (δ
18O, δD) for the kaolin materials. This scatter suggests that, if continental weathering was involved in the kaolin formation on the lower side of the temperatures, it was not the only process, especially for the kaolin associated with felsites and metapelites. The higher temperatures are indicative of a hydrothermal auto-metamorphic alteration. The area of Burela (NW Spain) has the largest kaolin deposits in Spain. They have been mined intermittently since the 19th century, and they are still being mined today.
These deposits of kaolin are characterized by a white to light beige color which clearly differentiates them from other types of deposits such as those in Georgia (USA) with pink and cream colors [
1] and from the deposits of ball clays in the NE of the Iberian Peninsula, which are characterized by gray colors due to the presence of organic matter [
8].
3. Materials and Methods
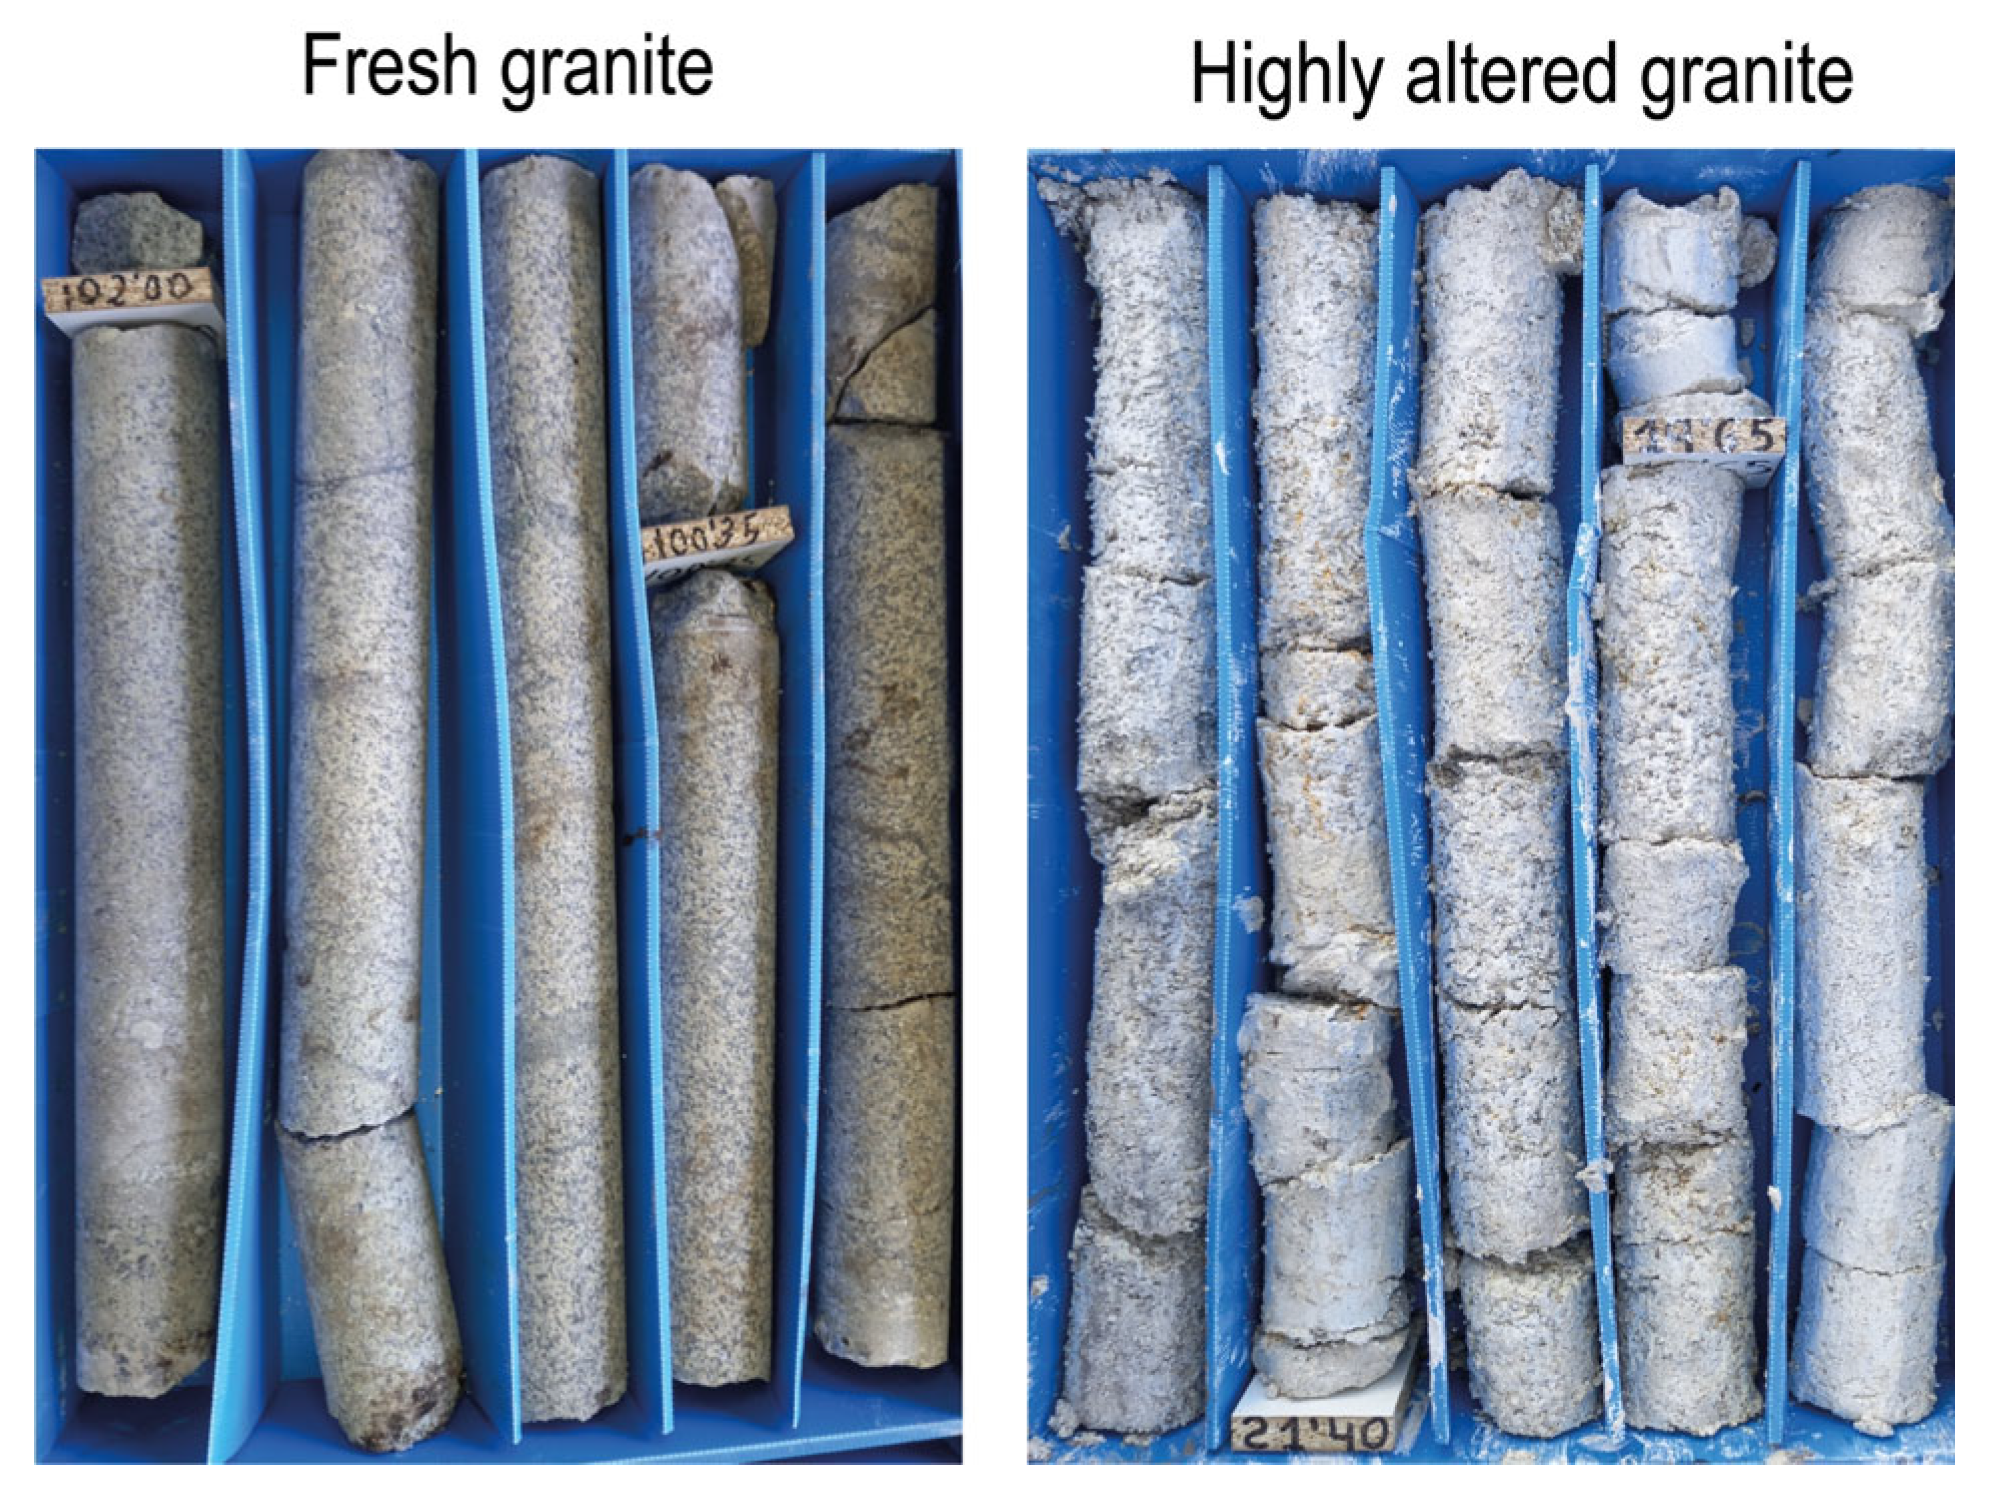
Eight samples were extracted from boreholes that cross granitic facies with different degrees of alteration. Samples BU-G1 and BU-G2 correspond to fresh granite, BU-GA1 and BU-GA2 correspond to altered granites, samples BU-C1 and BU-C2 correspond to highly altered granite and samples BU-Kaol1 and BU-Kaol2 correspond to pure kaolin (
Figure 2).
3.1. X-Ray Diffraction (XRD)
The mineralogy of the samples was analyzed by X-ray diffraction (XRD). To obtain the diffraction patterns, a Philips 1710 diffractometer was used at the University of Zaragoza (Zaragoza, Spain), with 40 kV voltage, 30 mA current, CuKα radiation, an automatic slit, and a graphite monochromator. The XRD patterns were acquired from 3 to 60 ° 2θ for the whole rock samples. The goniometer velocity was 0.1°2θ/s and the integration time was 0.45 s. The recording was made with XPowderX software [
9]. The relative proportions of the minerals were calculated using Reference Intensity Ratio (RIR) values from the literature [
10,
11,
12]. These RIR values were calculated in accordance with [
13]. The X-ray diffraction measurements in capillary were acquired using an X’Pert PRO MPD PANanalytical diffractometer (Eindhoven, The Netherlands) configured in 2theta with molybdenum radiation, Mo K
α1 (λ = 0.70929 Å). The X-ray diffraction patterns were obtained at the Central Research Support Services (SCAI) of the University of Malaga. The experimental conditions used for XRD data collection were step-size 0.02°2θ and a counting time of 1.33 s/step. To achieve high-resolution X-ray diffraction data for distinguishing kaolinite polytypes and calculating crystallinity indices, we employed Mo Kα radiation in a capillary geometry setup. Mo radiation, with its shorter wavelength than Cu radiation, improves angular resolution and reduces sample absorption. The capillary setup allows for a uniform and random orientation of crystallites, minimizing preferred orientation artifacts. This configuration provides strictly monochromatic radiation and enhanced data quality, essential for resolving subtle structural differences among kaolinite polytypes.
Table 1 clarifies the use of Mo and Cu radiation.
Kaolinite crystallinity has been extensively examined through the analysis and modeling of X-ray diffraction patterns, leading to the proposition of various crystallinity indices [
14,
15,
16,
17]. For this study, three commonly used indices in the literature—Hinckley index, AGFI index and Liétard index—were selected for assessing kaolinite crystallinity.
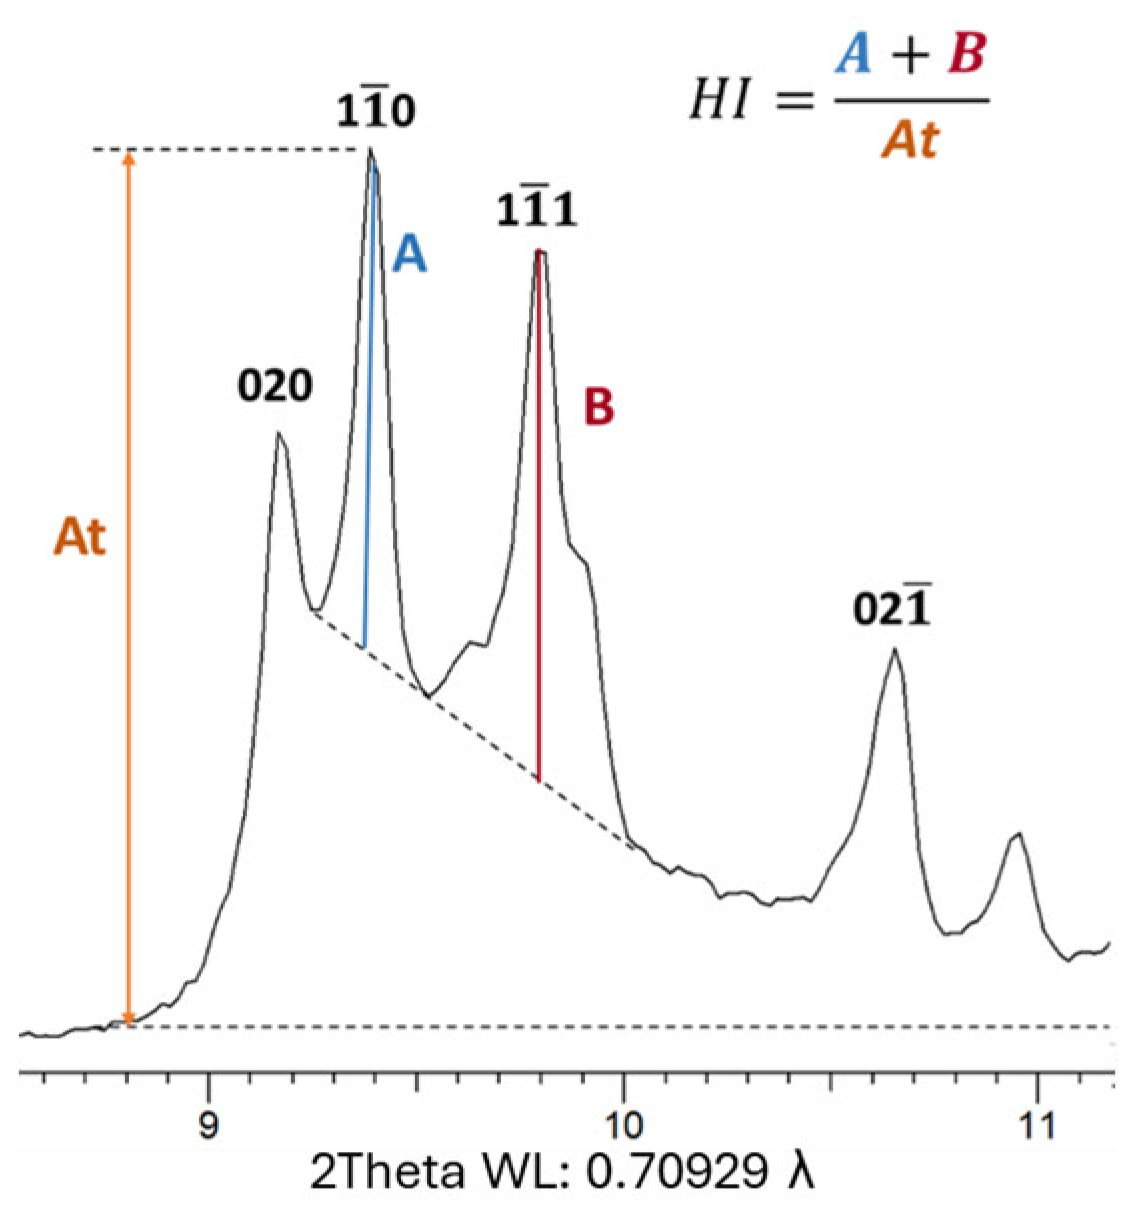
The Hinckley index (HI) is calculated as the ratio of the sum of A and B parameters, corresponding to the intensity of the (1
0) and (1
1) X-ray diffraction peaks, respectively (
Figure 3). These measurements are taken from a background traced between the (020/1
0) inter-peak base and the (110, 1
1)/(111) base-peak. This index is computed when the percentage of kaolinite is sufficiently high to accurately measure the intensities described. As outlined by [
15], the Hinckley index (HI) is sensitive to the proportion of well-ordered versus high-defect kaolinite in a given sample. Higher HI values indicate a greater abundance of well-ordered kaolinite domains. In general, Hinckley index values can vary from <0.5 for poorly ordered kaolinite to 1.5 for well-ordered kaolinite [
18].
The AGFI index ([
17]) is calculated for samples containing more than 10 wt.% of kaolinite. It is determined as the sum of deconvoluted intensities of the 1
0 and 111 reflections of kaolinite, divided by twice the intensity of the 020 reflection. This index, known as the Aparicio–Galán–Ferrell index, is measured on 02l and 11
l reflections after decomposing individual peaks within the complex diffraction band to minimize interferences. The AGFI index exhibits a strong correlation with the percentage of low-defect kaolinite and the Hinckley Index. Notably, it is less susceptible to interference from associated minerals and X-ray amorphous phases compared to other indices. The AGFI index can be effectively utilized for determining the order-disorder nature of kaolinite in a broad range of kaolins and kaolinitic rocks, with the condition that the kaolinite content exceeds 10 wt.% for reproducible results.
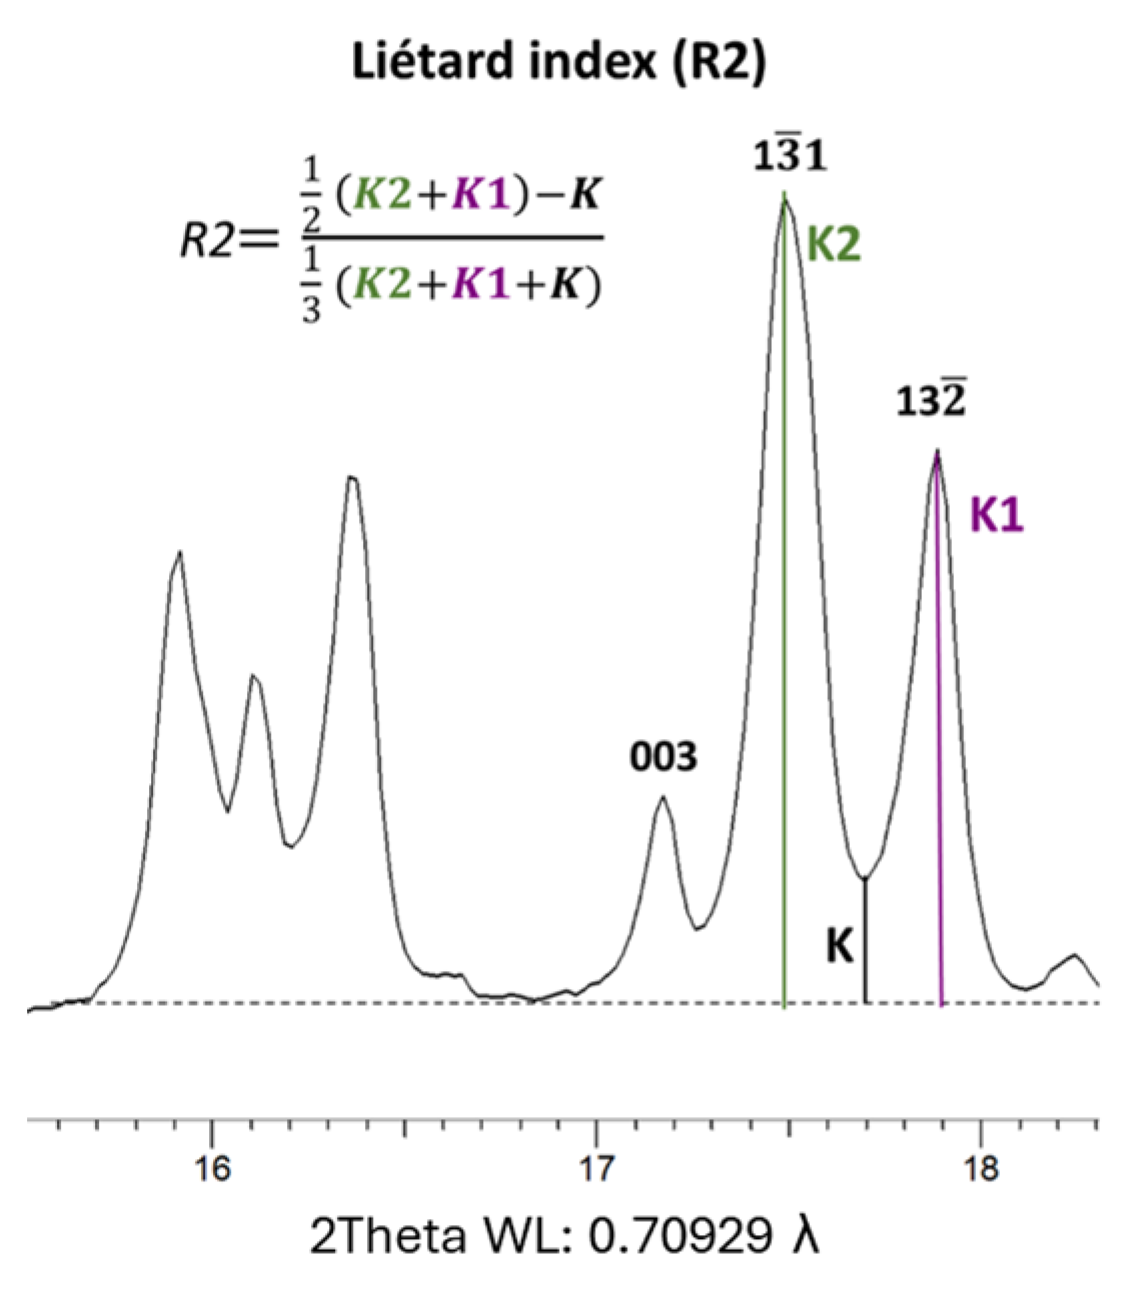
The Liétard index (R2) is computed as the ratio between half of the sum of the K2 and K1 parameters, corresponding to the intensity of the (132, 1
1) and (131) diffraction peaks, respectively. This is subtracted from the intensity of the inter-peak between these two reflections, denoted as the parameter K, over the general XRD background. The denominator consists of a third of the sum of the K, K2 and K1 parameters (refer to
Figure 4). The Liétard index is designed to assess the presence of random defects in the (ab) plane, which have been interpreted as stacking faults, according to [
19]. According to [
18], the Liétard index ranges from <0.4 for high-defect kaolinite to 1.2 for low-defect kaolinite.
The Hinckley and AGFI indices differ in their interaction with impurities in samples. The Hinckley index is influenced by quartz, as its 100 reflection overlaps with the 111 reflection of kaolinite. This presence of quartz and feldspar raises the Hinckley index, while the AGFI index remains stable. Additionally, the AGFI index seems to be not affected by other minerals or amorphous phases. It can be applied in all cases except when the amount of halloysite exceeds 50 wt.%. The AGFI index aligns with other methods for estimating the degree of structural order/disorder in a sample, and its primary advantage lies in its applicability to complex samples, allowing the study of kaolinite crystallinity without the need for sample purification.
3.2. Field Emission Electron Microscopy (FESEM)
Twelve thin sections of the granite samples with variable degrees of alteration were studied using a Carl Zeiss Merlin field emission scanning electron microscope (FESEM) equipped with an Oxford energy-dispersive X-ray (EDS) detector at the University of Zaragoza (Zaragoza, Spain). For this, the thin sections were previously carbon-coated. Compositional images of the samples were obtained using two types of backscattered electron detectors: angular selective (AsB). The accelerating voltage used for the former and for the EDS was 15 kV with a beam current of 400 pA. In addition, morphological images were obtained from fragments of the rocks using a secondary electron (SE) detector (Inlens). In this case, the accelerating voltage was 5 kV with a beam current of 800 pA. Semi-quantitative analyses were carried out using the EDS detector, which has a detection limit of 0.1%. From these analyses, the mica formula was calculated on the basis of O10(OH)2.
3.3. Transmission Electron Microscopy (TEM)
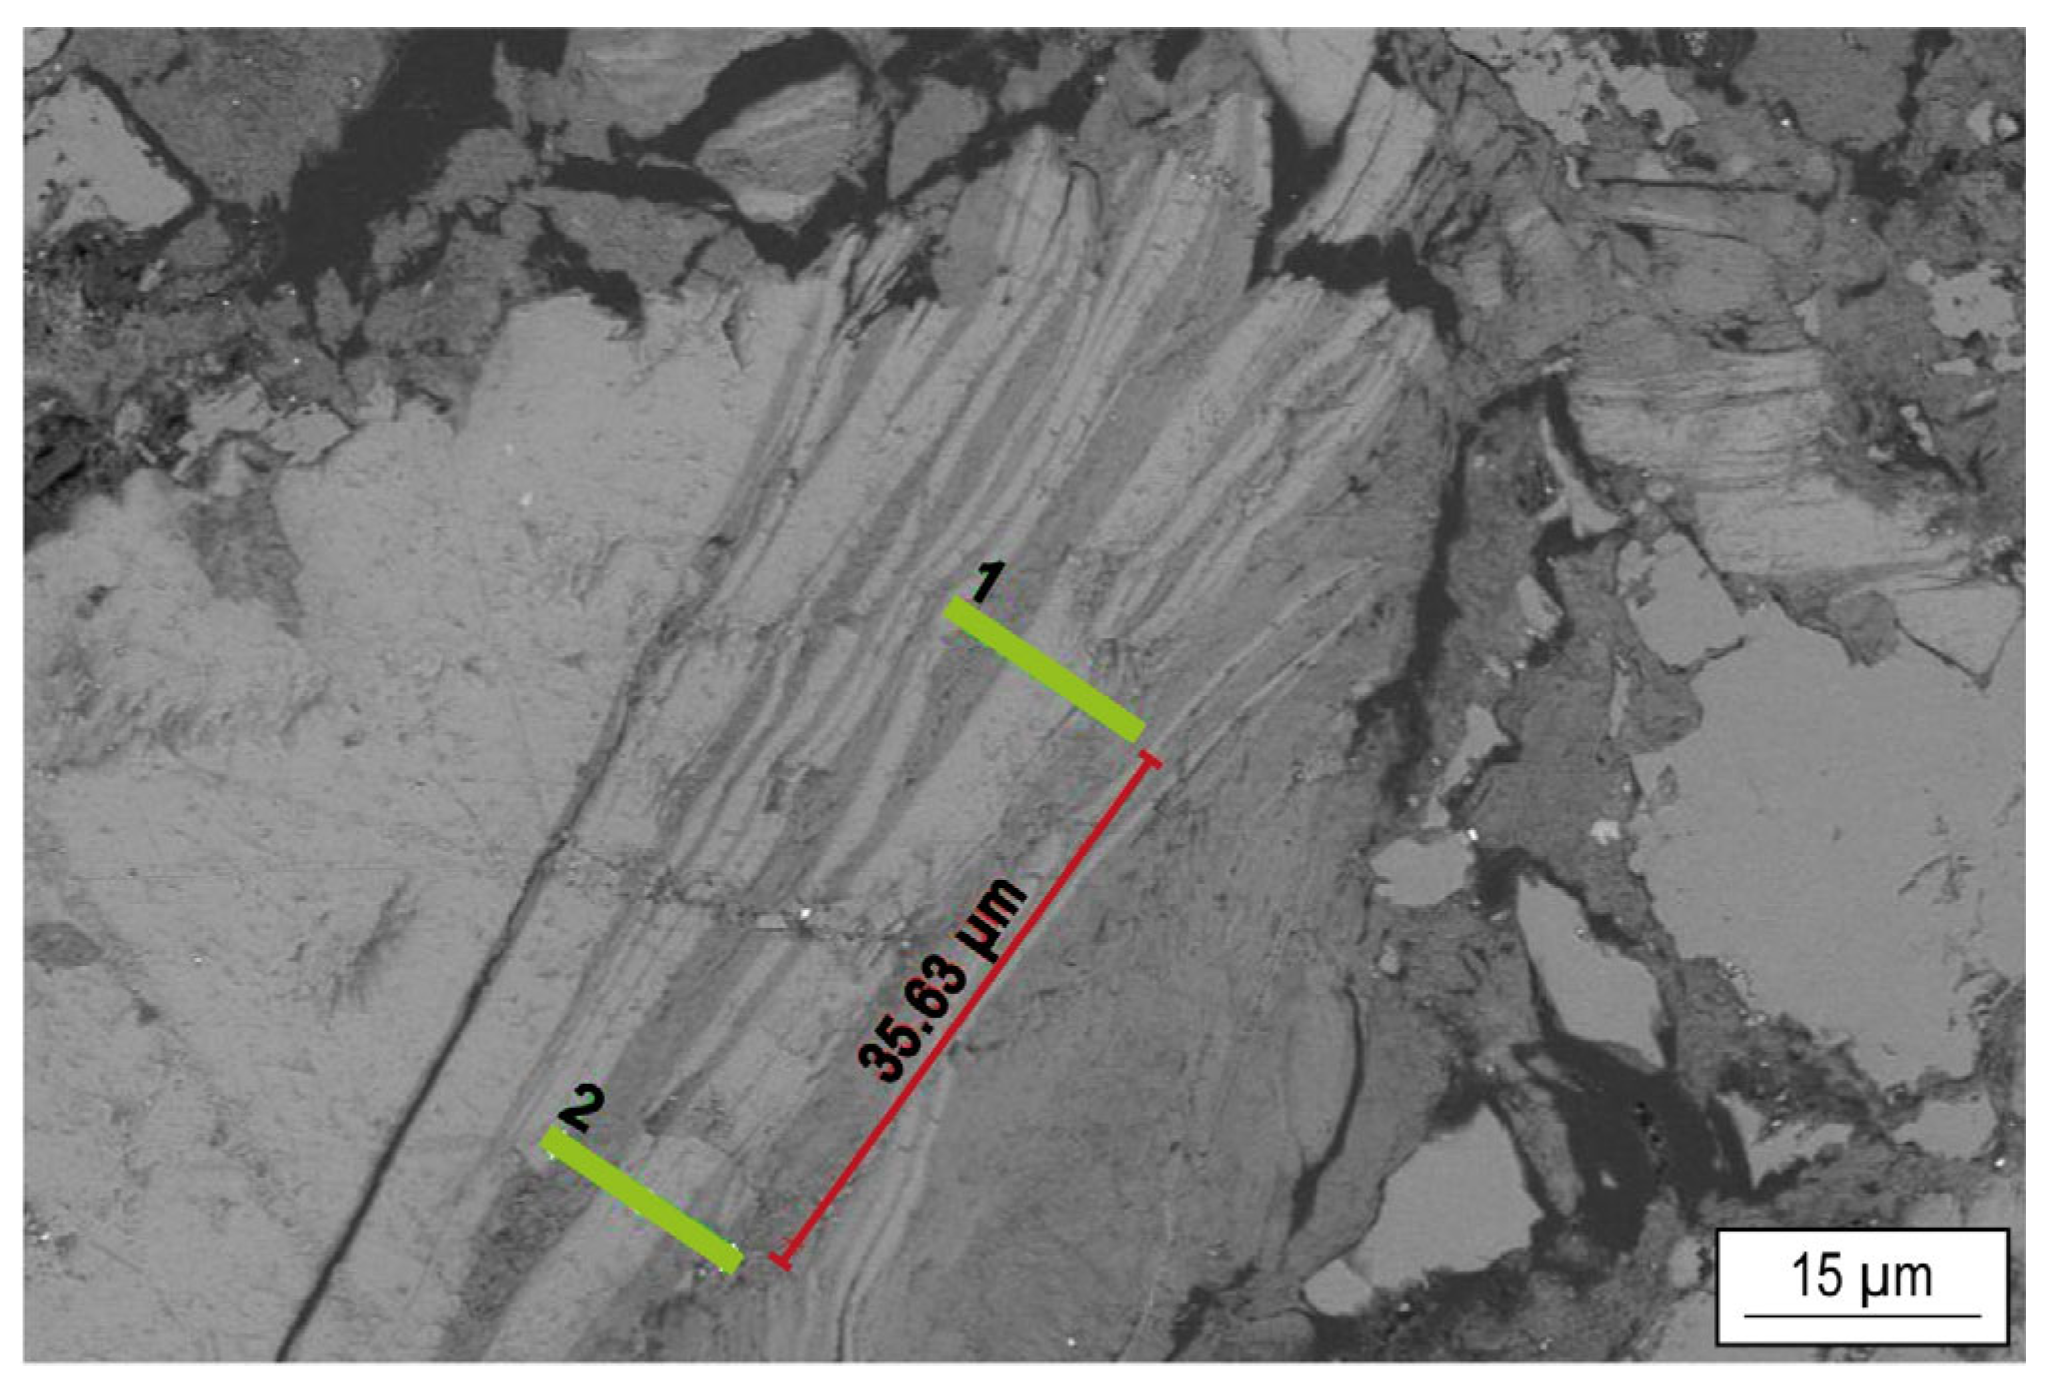
For Transmission Electron Microscopy (TEM) study, two lamellas were extracted perpendicularly to two thin carbon-coated thin sections using a Dual Beam equipment and working with backscattered electron images (
Figure 5). Specifically, they were extracted from muscovite–kaolinite intergrowths, with the aim of determining the textural and compositional relationships between these two phases. One of the lamellas was analyzed to achieve high-resolution transmission electron images (HRTEM) using a Tecnai F30 TEM (Eindhoven, The Netherlands), with a HADDF detector and equipped with an energy-dispersive spectroscopy (EDS) system in the Advanced Microscopy Laboratory of the University of Zaragoza, Spain. The accelerating voltage was 300 kV with a beam current of 92 µA. The second lamella was analyzed using a HRTEM working in Scanning TEM mode at 300 Kv;this equipment is equipped with a high-brightness XFEG field emission gun, a monochromator and a 2 k × 2 k Gatan camera for high-resolution image acquisition.
3.4. Methodology of Chemical Analysis
Chemical analyses of major and trace elements in bulk samples were performed at Actlabs Laboratories (Canada). Major elements and some trace elements (V, Sr, Ba, Sc, Be) were determined by inductively coupled plasma optical emission spectroscopy (ICP-OES). Fused samples (lithium metaborate/tetraborate fusion) were rapidly digested in a weak nitric acid and run on a combination of simultaneous/sequential Thermo Jarrell-Ash ENVIRO II ICP or a Varian Vista 735 ICP. Calibration was performed using seven prepared USGS- and CANMET-certified reference materials. One of the seven standards was used during the analysis for every group of ten samples. The detection limit for the major elements was 0.01% (except for MnO and TiO2 with detection limits of 0.001%). The rest of the trace elements were analyzed by inductively coupled plasma mass spectrometry (ICP-MS). Fused samples were diluted and analyzed by a Perkin Elmer Sciex ELAN 6000, 6100, or 9000 ICP-MS. Three blanks and five controls were analyzed per group of samples. Duplicates were fused and analyzed every 15 samples. The detection limit for each trace element is indicated in brackets: Cr and Ni (20 ppm), Co, Rb, and Zr (1 ppm), Y (0.5 ppm), Nb (0.2 ppm), Cs and Hf (0.1 ppm), Th, La, Ce, and Nd (0.05 ppm), U, Pr, Sm, Gd, Tb, Dy, Ho, Er, and Yb (0.01 ppm), Lu (0.002 ppm), and Eu and Tm (0.005 ppm).
5. Discussion
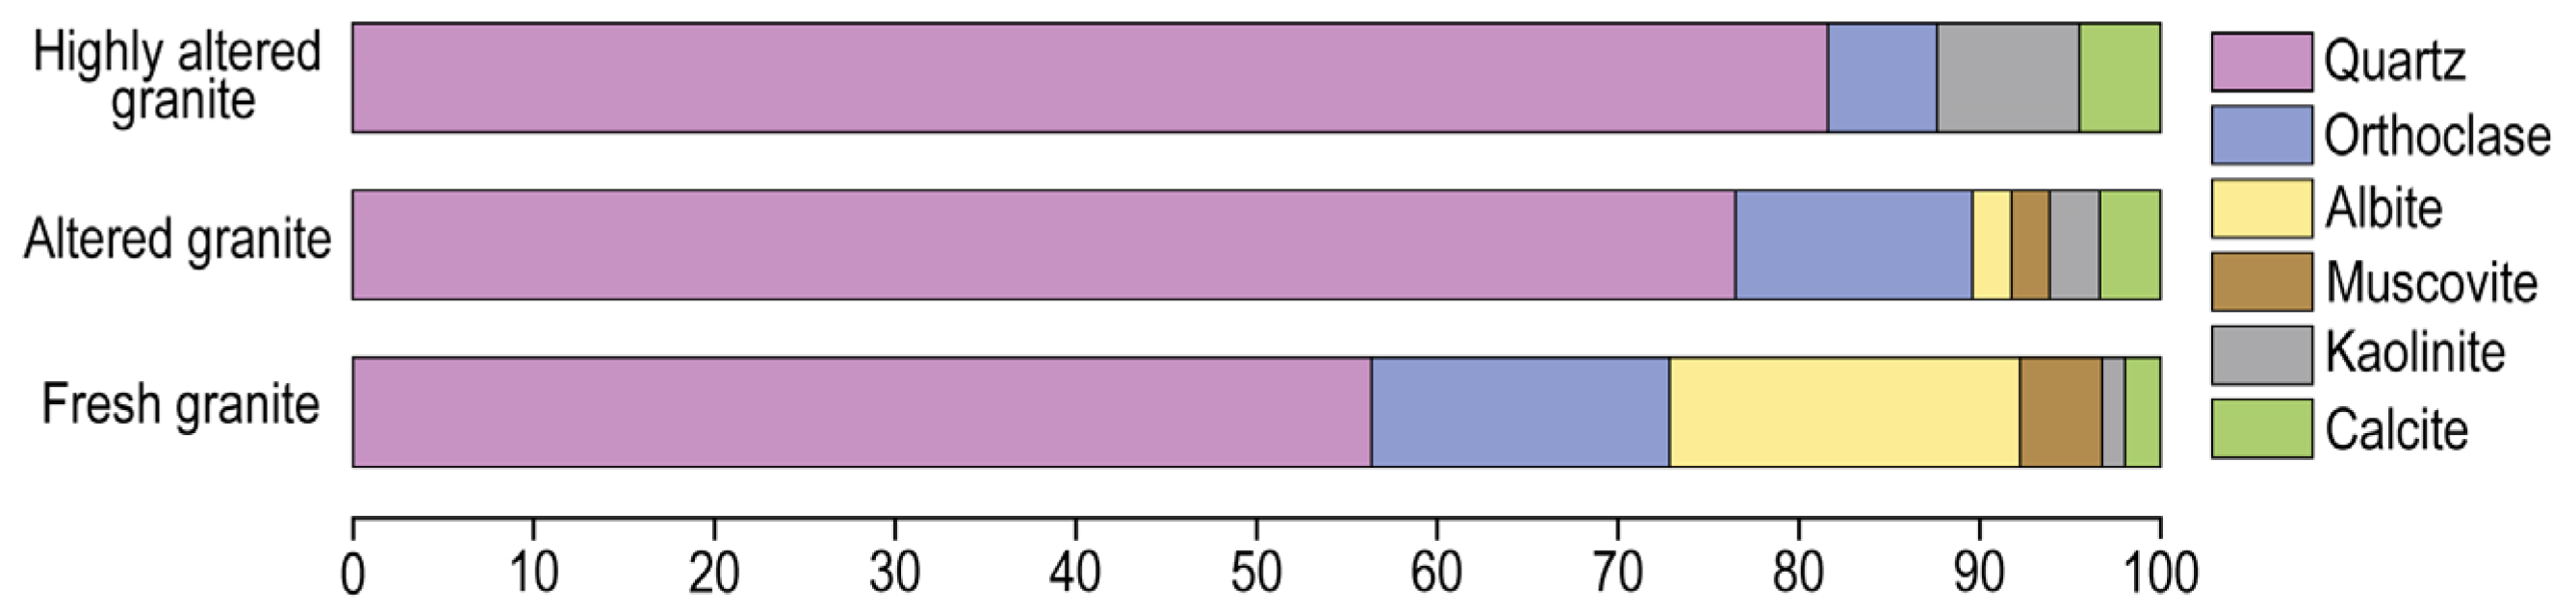
Fresh and altered granites show similar mineralogy. They consist of high amounts of quartz, K feldspar, albite, micas and a very low proportion of kaolinite and calcite. The replacement of alkali and plagioclase feldspars by albite is a prevalent phenomenon in the Earth’s upper crust [
20]. The process is known as albitisation and takes place in a wide variety of rock types and tectonic settings, e.g., during the hydrothermal alteration of granites [
21]. In the studied fresh granite, the presence of minor calcite could be related to a previous hydrothermal event, since the Ca
2+ liberated during the transition from oligoclase to albite, could have been fixed by secondary calcite [
22] and such as [
6] suggest. In comparison with fresh granites, in weathered granites, the content in micas and K feldspar decreases, but the most significant difference between the fresh and the weathered granites is the significant decrease in albite (from 13 to 6%) and the relative increase in quartz. Highly altered granites are mainly formed by quartz (more than 80%) and low proportions of K feldspar and muscovite have been destabilized, and kaolinite increases up to 8%. Changes in the proportions of the minerals with weathering indicate that albite is the aluminosilicate that is more easily altered, followed by K feldespar and K micas.
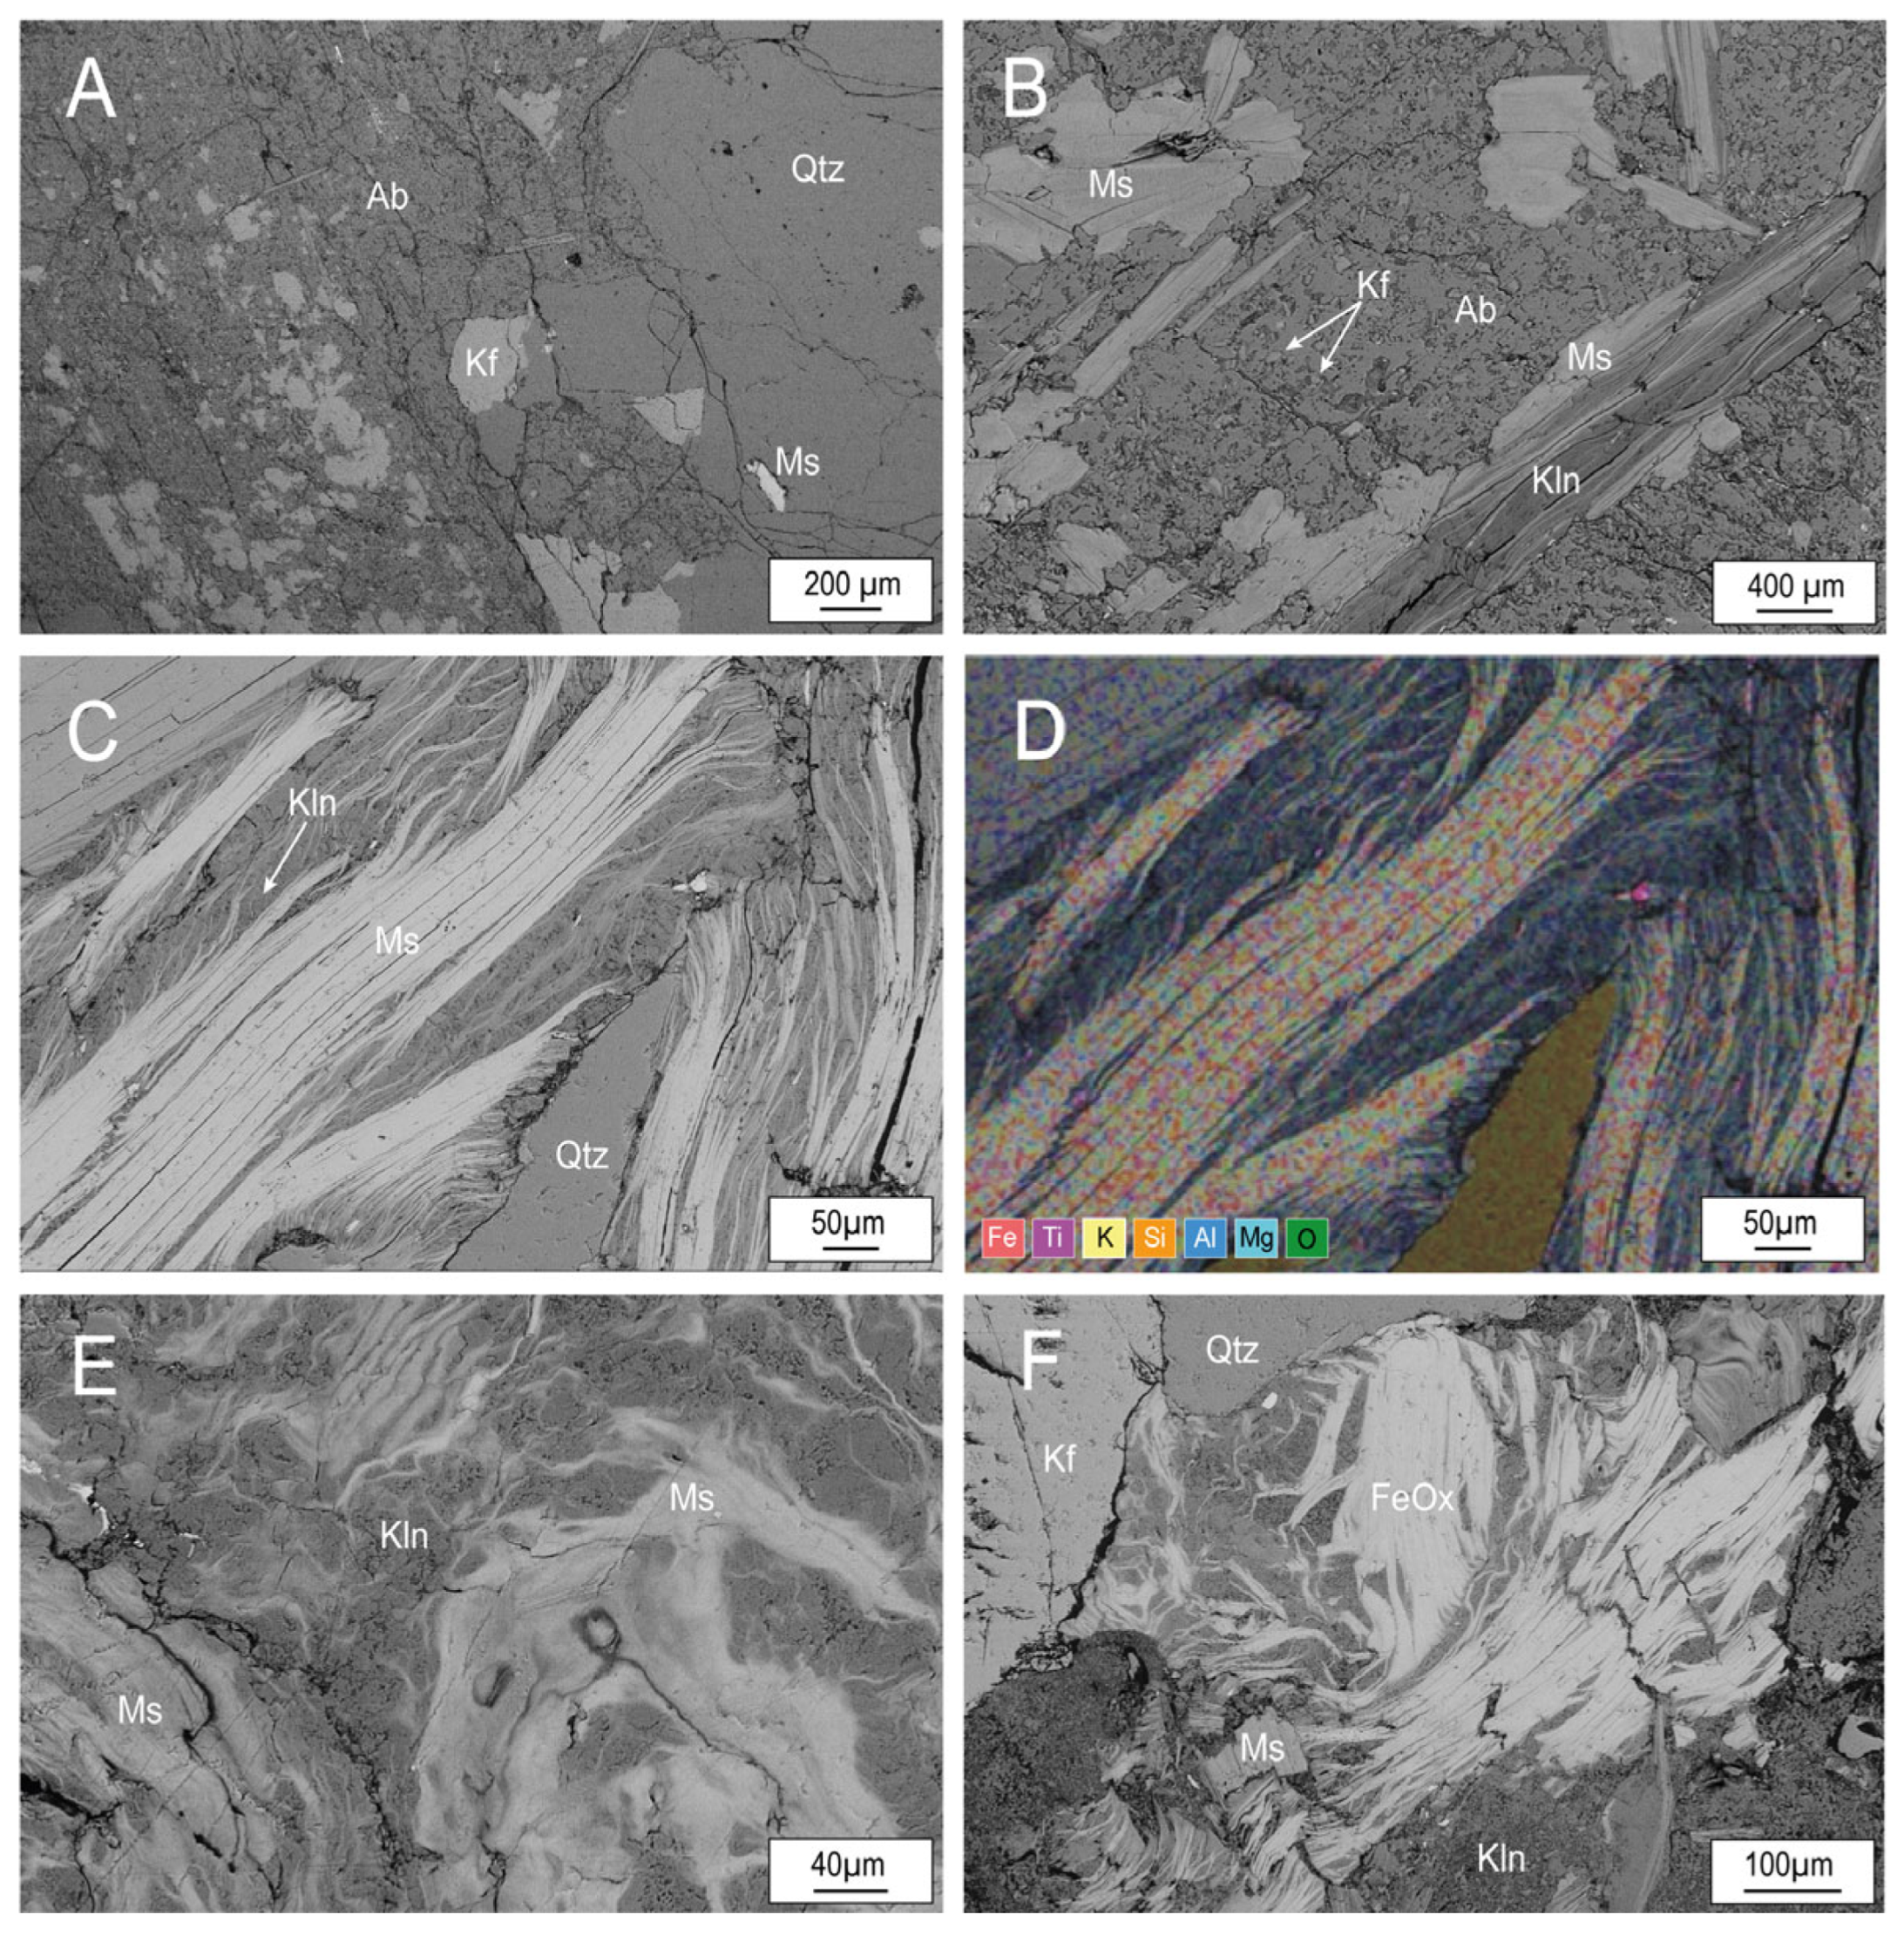
Fresh and altered granites show the typical phaneritic texture of plutonic rocks (
Figure 7A,B) and scarce evidence of alteration. However, the images suggest that, in these rocks begins the growth of kaolinite between the exfoliation planes (001) of micas (
Figure 7B). In weathered rocks, micas show signs of deterioration: they are frayed and immersed in a kaolinite matrix which is formed simultaneously with the destabilization of aluminosilicates (
Figure 7C). The matrix is formed by micron-sized booklets of kaolinite and crystallyzed as a consequence of the alteration process (
Figure 7C). In highly weathered rocks, micas show a higher degree of deterioration, with fuzzy edges, irregular outlines and cleavage that is not distinguished, suggesting the deterioration of the structure (
Figure 7E). The replacement of micas by Fe oxides suggests the complete destabilization of the micas (
Figure 7F).
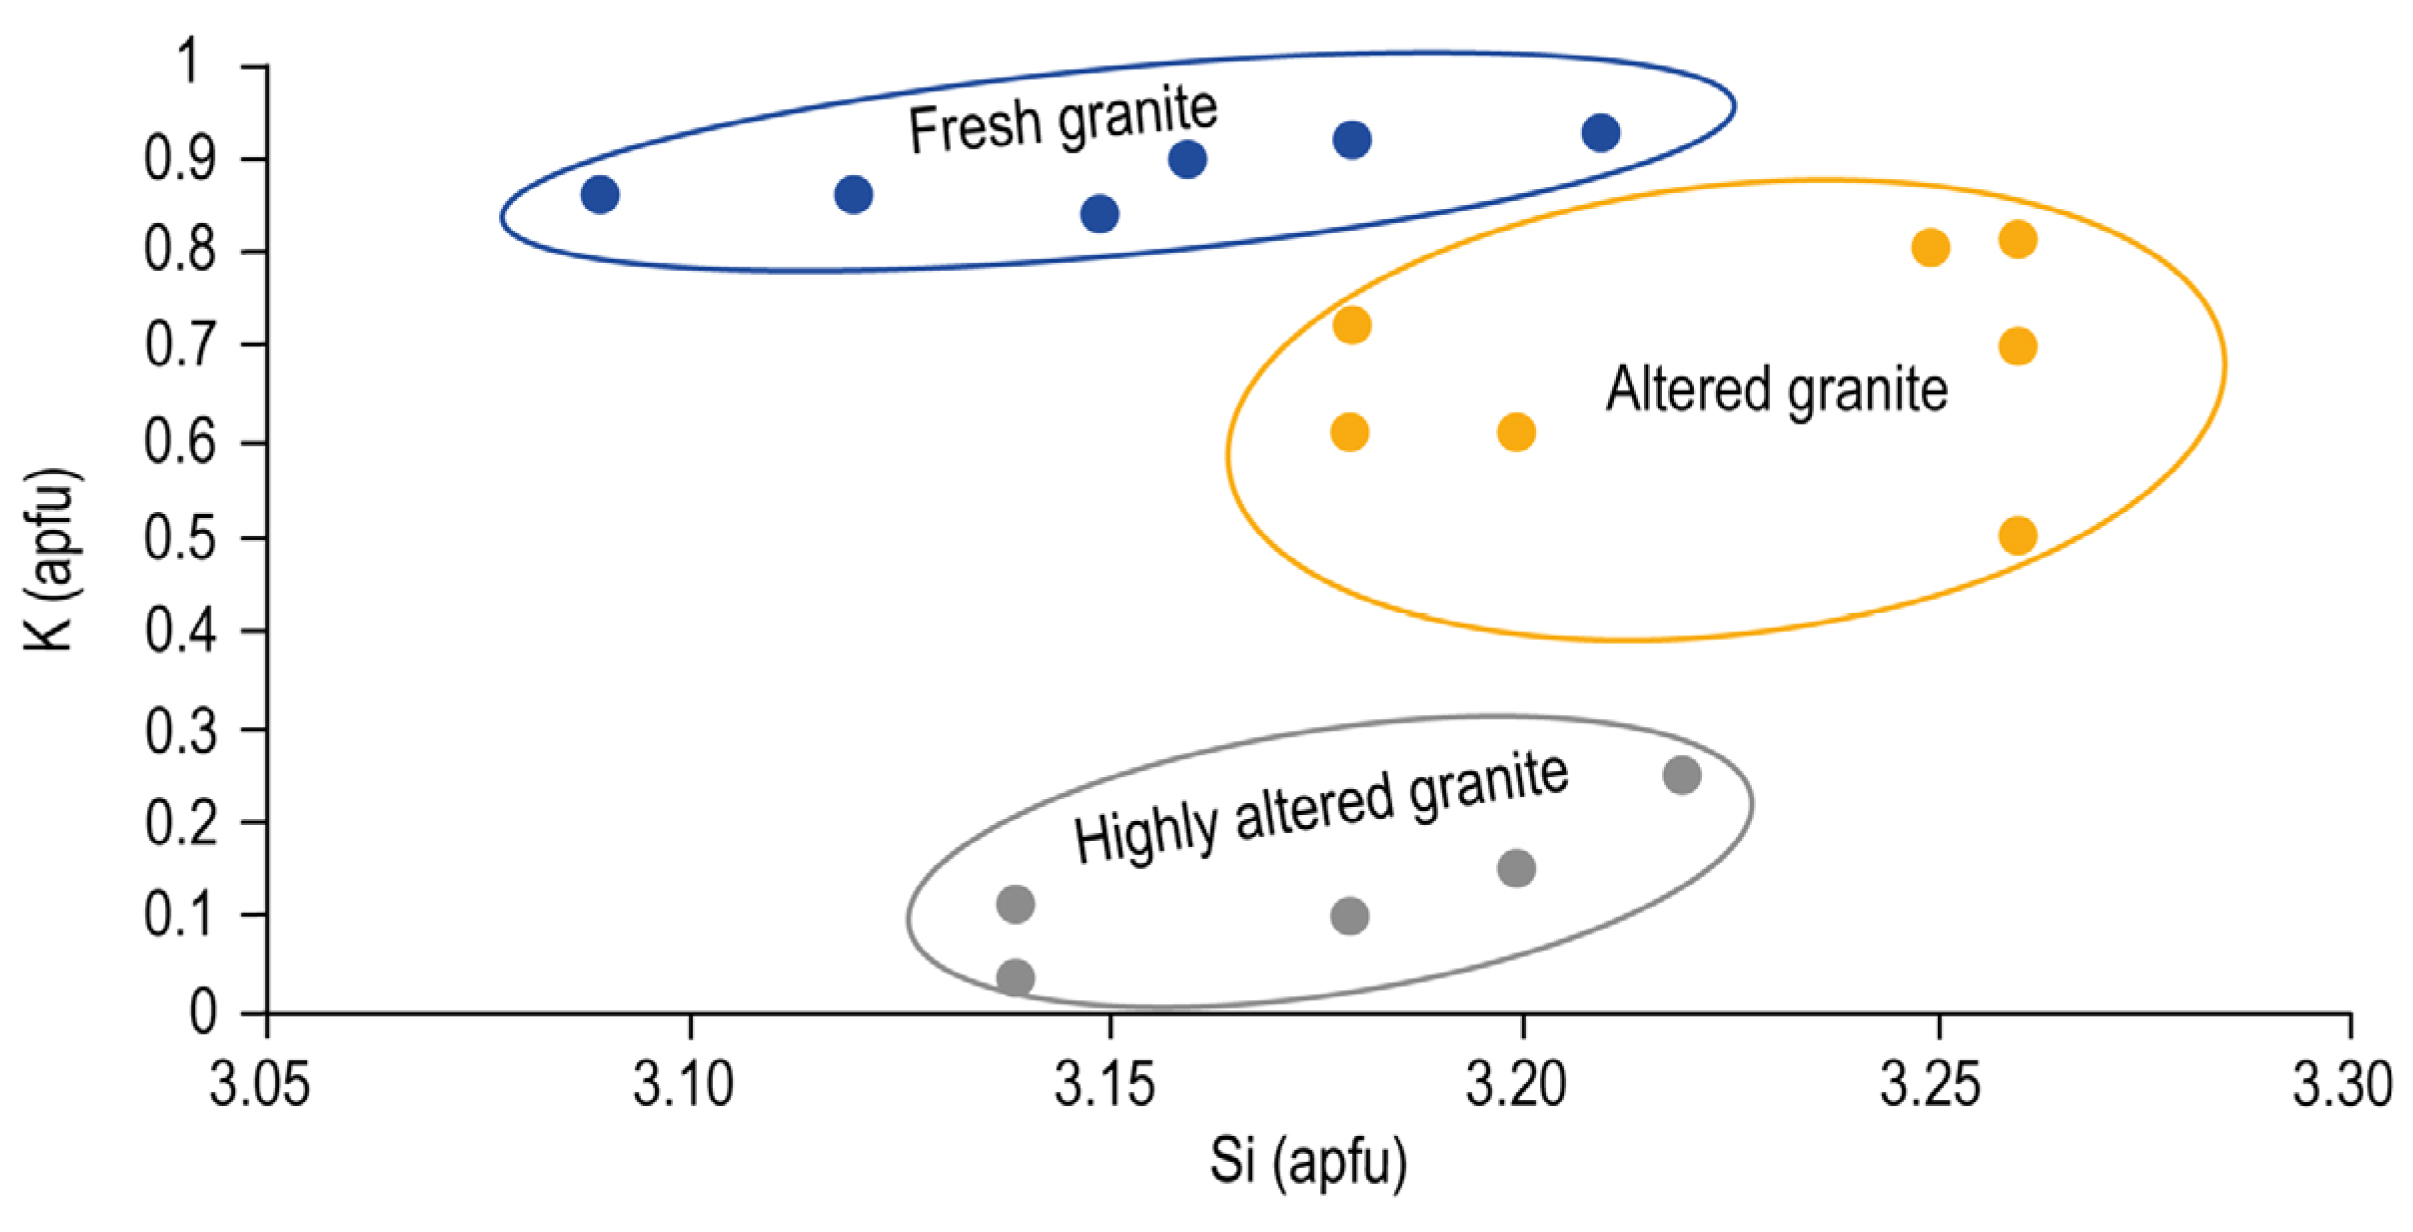
The progressive alteration of the micas has a direct relation, with the K contents of these minerals in the interlayer site (
Figure 8). In fresh granites, micas have high K contents in the interlayer (0.84–0.93K apfu), whereas, in weathered granites, their K content ranges between 0.50 and 0.80 K apfu, suggesting large compositional variability from mica to illite. Finally, in highly altered granites, the K content is very low (0.25–0.03 apfu), and micas have compositions similar to smectite. The data show that, as weathering progresses, micas lose K from the interlayer.
The AGFI index applied to characterize kaolinite aligns with other methods for estimating the degree of structural order/disorder in a sample, and its primary advantage lies in its applicability to complex samples, allowing the study of kaolinite crystallinity without the need for sample purification.
TEM images and EDS mapping at nanoscale from muscovite–kaolinite intergrows (
Figure 10) show that these phases are parallel to each other. Phase boundaries between both minerals show bidimensional crystallographic continuity, and no intermediate phases have been identified. Therefore, kaolinite and muscovite occur as thick packets free of interlayering. The images suggest that muscovite only provides suitable substrate for the epitactic crystallization of kaolinite. Additionally, kaolinite growth continues as long as Al is available in the environment due to the destabilization of aluminiumsilicates (K feldspars, albite and micas). The absence of intermediate interstratifications is most likely a consequence of the high water/rock ratio. In closed systems, interstratifications between these phases have been described [
8]. Other authors [
23] observed similar nanotextures in mica–kaolinite intergrowths in the sandstones of diagenetic environments and indicate that kaolinitization begins at grain edges, forming fanned-out textures, and propagates toward the interior along the cleavages of muscovite. In this study, we do not have evidence to support this process, probably because, in weathering environments, the water/rock ratio is higher than in diagenetic environments. The higher water/rock ratio promotes faster mineral reactions.
Chemical composition of weathered and highly weathered rocks and kaolinite support the alteration processes described, based on mineralogy. K and Na content decrease significantly, suggesting a high mobility of these elements under weathering conditions; in contrast, MnO and TiO
2 are relatively immobile in this environment. Higher LOI is a consequence of the formation of hydrated phases such as clays. Pure kaolinite is enriched in Al
2O
3 and TiO
2, reflecting the low mobility of these elements (
Figure 10). Weathered and highly altered granites are depleted in Y + REE, and only kaolin shows slight enrichment in these elements. Therefore, REE + Y are mobile under weathering conditions and Hf, Ta, U and W are relatively immobile, probably because they are hosted by resistant heavy minerals (
Figure 10), such as monazite, apatite and zircon, or also adsorbed on the surface of Fe oxides.
6. Conclusions
The clear colors of the kaolin investigated in this study indicate an effective fluid circulation altering the rocks and leaching various components of the original igneous rock. A previous hydrothermal event most likely took place, and subsequently, weathering produced the kaolin deposits from the igneous rocks.
Weathering produces significant changes in the mineralogical composition of granites. Albite and K feldspars destabilized most rapidly, followed by K micas. The availability of aluminum and its relatively immobile behavior in this environment favors the formation of kaolinite.
Kaolinite grows forming booklets generating a fine-grained matrix and also along the cleavages of muscovite generating muscovite–kaolinite intergrowths. The intergrowths show bidimensional crystallographic continuity, and no intermediate phases have been identified, suggesting that muscovite only provides the suitable substrate for the epitactic crystallization of kaolinite. Kaolinite shows high crystallinity but the presence of quartz impurities interferes with the ‘optimal’ reflections for the calculation of the Hinckley index. In these cases, the use of AGFI index almost eliminates the effect that the relative intensities of the quartz and feldspar impurities may have on those of kaolinite.
With weathering, there is a progressive decrease in the contents of most chemical elements, except for Al, TiO2, HREEs, Ta, Hf, Th, U, V, Cr, S, Zr, Mo and Sn.


