Article

Uranium Mineral Particles Produced by Weathering in Sierra Peña Blanca, Chihuahua, Mexico: A Synchrotron-Based Study

by
Cristina Hernández-Herrera
1,
Jesús G. Canché-Tello
1,*,
Yair Rodríguez-Guerra
1,
Fabián G. Faudoa-Gómez
1,
Diane M. Eichert
2,
Konstantin Ignatyev
3,
Rocío M. Cabral-Lares
1,
Victoria Pérez-Reyes
1,
Hilda E. Esparza-Ponce
1 and
María-Elena Montero-Cabrera
1,*
1
Centro de Investigación en Materiales Avanzados, Miguel de Cervantes 120, Complejo Industrial Chihuahua, Chihuahua 31136, México
2
ELETTRA-Sincrotrone Trieste, S.S. 14 Km 163.5 in Area Science Park, Basovizza, 34149 Trieste, Italy
3
Diamond Light Source, Harwell Science and Innovation Campus, Didcot OX11 0QX, UK
*
Authors to whom correspondence should be addressed.
Minerals 2025, 15(4), 333; https://doi.org/10.3390/min15040333
Submission received: 11 February 2025 / Revised: 19 March 2025 / Accepted: 20 March 2025 / Published: 22 March 2025

Abstract

Some of the largest Mexican uranium (U) deposits are located in Chihuahua. The most important is in Sierra Peña Blanca, northwest of the capital, which was explored and partially exploited in the 1980s. After the closure of activities, the mining projects were left exposed to weathering. To characterize the spread of U minerals towards the neighboring Laguna del Cuervo, sediment samples were collected in the main streams of the drainage pattern of the largest deposits. The U mineral fragments from the fine sand portion were extracted using fluorescence light at 365 nm. The morphology and elemental composition of these particles were analyzed by focused ion beam microscopy (FIB) and scanning transmission electron microscopy (STEM). The particle density in samples close to the U sources was quantified using gamma spectrometry. The highest density was 2500 part./g, and the lowest was 124 part./g. X-ray absorption spectroscopy (XAS) allowed us to establish via XANES the speciation of U in the U particles, confirming the U(VI) oxidation state, while the exploitation of the EXAFS spectrum put in evidence of the presence of uranophane. Finally, the Fe, Sr, and U distributions in the particle and its matrix were obtained via X-ray fluorescence microtomography (XRF-µCT). It was concluded that the particle is composed of uranophane, imbricated with quartz and other oxides.

Graphical Abstract

1. Introduction

The state of Chihuahua, Mexico, is rich in important U deposits. Among them, the Sierra Peña Blanca (SPB) site, located approximately 50 km northeast of the state capital (Figure 1) [1], contains about 40% of the country’s U and therefore stands out for its economic importance. Important U exploration campaigns and mining activities were undertaken there, and the main deposits were exploited until the early 1980s, when mining activities in the region were closed. The extracted and unprocessed U ore, confined in a repository, and the ore in open-pit mines were left exposed to the area’s climatic conditions, with subsequent weathering, erosion, and deposition phenomena.
SPB is located in the Basin and Range physiographic province [2]. The province was formed during the folding of Mesozoic marine sequences, developed on a Paleozoic and Precambrian basement, and the filling of tectonic trenches with continental sediments and igneous spills. The SPB topography is characterized by internally drained basins surrounded by steep mountain ranges that rise 500 to 1000 m above the plains and 2000 to 3000 m above sea level [3]. Hydrologically, the province is part of the Northern Closed Basins sub-region and the Laguna del Cuervo (Laguna de Hormigas) sub-basin [4]. Tectonically, SPB belongs to a larger fragmented block, the Sierra del Nido [5]. In the southern part of the Sierra, the oldest rocks are Paleozoic sedimentary outcrops, while in the north, the rocks consist mainly of reef limestone from the El Abra formation outcrop. Different geological units stand out in the area; however, the main ones hosting U mineralization are those of the Escuadra and Nopal formations [6].
The SPB mining district contains three main U deposits: Nopal I, Margaritas, and Puerto 3, which are composed of volcanic rocks of felsic composition, such as rhyolitic tuffs [7]. There, the most representative uraniferous minerals are uranophane, which is predominant, and carnotite-margaritasite, weeksite, and schoepite, with minor amounts of primary uraninite [8]. Faudoa, in a recent study [9], identified and characterized the following minerals in the Nopal 1 mine: uranophane [Ca(UO2)2(SiO3OH)2·5H2O], accompanied by parauranophane (previously named β-uranophane) and weeksite in veins, as well as quartz, feldspars, and iron oxides, such as hematite. The parauranophane crystals were extracted from what was described as “cavities in the rock” in a hematite–goethite matrix. The uranyl sulfates natrozippeite and uranopilite were also reported [9].
The origin of U mineralization in the SPB deposits has been the subject of many publications. Reyes-Cortés [6] reported that the U-Mo deposits in the SPB are distributed at 55–100 m depth in rocks of the Escuadra geological formation. Goodell [5] explained that U had migrated there following the weathering and erosion processes of peralkaline rocks with U content that outcrops in the Sierra del Nido. This was accompanied by hydrological transport (underground–surface) of the sediments containing U and some interaction with hot solutions. Then, the geological gradient and the structures with a southeast tendency allowed these solutions to flow toward the Peña Blanca block. Finally, the geochemistry of the formations in Peña Blanca and the faults and fractures present enabled the formation of a reducing environment where U could be deposited in the mineralized zones. George-Aniel et al. [10] established that mineralization occurred mainly in the lower units of a Cenozoic volcanic package (the rhyolites of the Escuadra and Nopal formations) under three genetic types. First, a hydrothermal type, where the primary mineralization and the associated kaolinization of the rock are the results of the circulation of hydrothermal fluids in the breccia and fault systems; the uranyl minerals being produced there at later stages under oxidizing conditions. Second, a mixed-exhalative genetic type, common in geothermal environments or in sedimentary basins with active hot springs, in which the U-Mo minerals precipitated due to the mixing of oxidizing U-rich groundwater with reduced H2S-rich fluids in a tectonic valley. Third, a supergene type, in which the uranophane mineralization is taking place in between two impermeable layers. The precipitation of this uranyl silicate, together with kaolinite and quartz, is due to an enrichment of SiO2 in low-temperature solutions.
The area of SPB is located in the Chihuahuan Desert, where the average annual temperature and precipitation are about 18 °C and 235 mm, respectively [11]. The weather is characterized by periods of torrential rain followed by long periods of drought [12]. When the geological formations are physically weathered, their rocks begin their sedimentary cycle. The decomposition and fragmentation of the rock-forming minerals allow for their subsequent erosion and displacement [13]. The last phenomena can be further enhanced by the very same natural agents (water, wind, and mass flows) that induced the sedimentary cycle in the first place. Being an endorheic basin, the area’s hydrology favors the mechanical transport of the material exposed in the mines through the main streams—Peña Blanca, Boca la Colorada, and El Tigre—to Laguna del Cuervo. Evaluating the potential contaminations from acid drainages generated by mining processes is important both for health and environmental purposes. In the case of the Peña Blanca mining activities, the presence of toxic or potentially toxic elements such as As, Cd, Co, Cr, Cu, Mo, Ni, Pb, Sb, V, and Zn was reported in granulometric fractions with d < 2 mm sampled from the streams of the area, but U was not [14].
Schindler et al. [15] studied amorphous silica glazes at the Nopal 1 mine in SPB. They determined the concentrations of U and Ca in green and yellow opals. These are 0.08%–0.15% in the opal and are in a 1:1 ratio. They observed silica coatings in fractures and/or cracks on U minerals, mainly uranophane, weeksite, and becquerelite (filling small fissures), and concluded that microparticles of weeksite and uraninite had been incorporated into the glazes during the gelation and hardening of silicic acid to form opal. A more recent study by Schindler et al. [16] suggests that U can be retained in these quartz–opal microcrystals for millions of years under standard pressure and temperature conditions and low fluid activities.
In nature, three isotopes of U are found: 234U, 235U, and 238U. The last two isotopes are parents of two radioactive decay series. The radioactive decay series of 238U generates alpha, beta, and gamma radiation with daughter radionuclides [17]. U is a lithophile element that may present the oxidation states +3, +4, +5, and +6. The valence +6 sometimes indicates that U is present as the uranyl ion UO2+2, which is highly soluble [18] and relates to U’s exposure to physical and chemical weathering processes. Hence, its characterization may provide information about the transport mechanism(s) to which it was subjected. In geological environments, the radioactive activities of the isotope members of the U series are usually all equal in “radioactive equilibrium”. It is affected by the solubility of 234U due to the α-recoil phenomenon, which extracts the U+4 ion from the crystalline bond. More recently, however, Bosia et al. [19] suggested that the high concentration of refractory minerals in the sediment composition modifies the dissolution of U and Th. They proposed that isotope activity concentrations in surface waters are mainly controlled by variations in the sediment mineralogical and grain-size compositions rather than by variations in their degree of weathering during transport.
The exploration of U isotopes in rocks by radioactive methods has been reported since the 1950s [20,21,22,23]. In the 1960s, the characterization of U and/or Th minerals by such methods was well established, as described by J.L. Mero [24]. In Chihuahua, the first application of gamma spectrometry was performed in 1984 during the investigation and mitigation activities following the “Radiation accident of 60Co contamination” in 1983 [25]. This event referred to the dismantlement of a radiotherapy unit, which led to the deposition of 16.65 GBq of cobalt-60 in a junkyard, from where it dispersed in the environment [25]. Gamma spectrometry was used to determine the background levels of U activity in soils sampled from the principal localities of the state [26].
Rodríguez-Guerra [27] and Hernández-Hernández [28] studied the transport of U-series isotopes from Peña Blanca to Laguna del Cuervo through the El Tigre and Boca la Colorada streams, respectively. They characterized sediments sampled from the area and found the following mineral phases: quartz, calcite, clays, potassium feldspars, and iron oxides. The verification of the activity concentrations of 238U decay progenies in the different sedimentary granulometries provided evidence that the U ore from the Nopal I mine moves in a particulate manner in sands that are in secular equilibrium. Pérez-Reyes et al. [29] studied the activity ratio of the isotopes 234U/238U and the sediment–water distribution coefficient of these isotopes. Activity concentrations of the isotopes up to 35 times higher than those determined for other samples in the same study were found. This was attributed to a U transfer from the water to the sediment via U precipitation in a zone of specific redox conditions due to U affinity as a ligand to organic matter. Pérez-Reyes et al. [30] simulated the transport of U minerals by surface water through columns with sediments that reproduced granulometrically the channel and alluvial fan of the Boca la Colorada stream, Sierra Peña Blanca. The experiments confirmed the difficulty of dissolving uranophane and the uranyl’s adsorption capacity by the area’s clays. These results suggested that the natural mechanism of U transport by surface water in SPB is through fragmented U mineral particles.
According to IAEA-TECDOC-1663 in 2011, radioactive particles are “localized aggregation of radioactive atoms with an inhomogeneous distribution of radionuclides significantly different from that of the matrix background.” Particles are considered grains of aerosols, soils, or sediments with diameters (d) ranging from 0.45 µm < d < 2 mm and fragments with d > 2 mm [31]. The characterization of radioactive particles is mandatory to assess their environmental impact. Dedicated analytical strategies were specifically established for that purpose [31], and include employing advanced non-destructive techniques such as Scanning or Transmission Electron Microscopy with Energy Dispersive X-ray spectroscopy (SEM—EDX, TEM/STEM—EDX, respectively) or synchrotron-based techniques such as nano- or µ-XRF, XAS, X-ray Diffraction (XRD), or spatially resolved techniques from 2D or 4D, as scanning transmission X-ray microscopy (STXM) or XRF micro-computed tomography (XRF-µCT).
Indeed, X-ray beams provided by synchrotron facilities are ideal for measuring samples with low elemental concentrations and are widely used to study geological and environmental materials. Spectrometric techniques such as X-ray fluorescence (XRF) or X-ray absorption spectroscopy (XAS) provide information about the elemental composition and distribution, as well as the oxidation state of the element of interest in the sample [32,33]. XRF -µCT expands that information by allowing access to spatially resolved composition and structure of geological materials [34]. The transport, solubility, adsorption, and precipitation mechanisms of uranyl ions and uraniferous compounds by surface and underground waters, sediments, etc., with X-ray-Absorption Near-Edge Structure (XANES) and extended X-ray Absorption Fine Structure (EXAFS) spectroscopies application has been investigated many times since the 1990s [35,36,37]. Hernández-Herrera et al. and Pérez-Reyes et al. [12,30], using XAS, confirmed the presence of U(VI) in fine sediments (d ≤ 0.037 mm) from SPB.
This work investigates the transport of U by surface water through the three main streams from the deposits in SPB to Laguna del Cuervo. The activity concentration of the 238U series of the different granulometries of the sediments extracted from the three streams was determined and/or compiled from previous works [12,27,28]. The U particles were extracted by optical fluorescence from the fine sand fraction of samples from the area. The particles’ morphology and elemental composition were analyzed using Focused Ion Beam (FIB) electron microscopy and Scanning Transmission Electron Microscopy (STEM). The particle density in samples close to the U sources was quantified by gamma spectrometry. Finally, the mineral phases present in the fluorescent particles were characterized by XAS, and the volume distribution of U and its matrix in the particle were acquired using XRF-µCT.

2. Materials and Methods

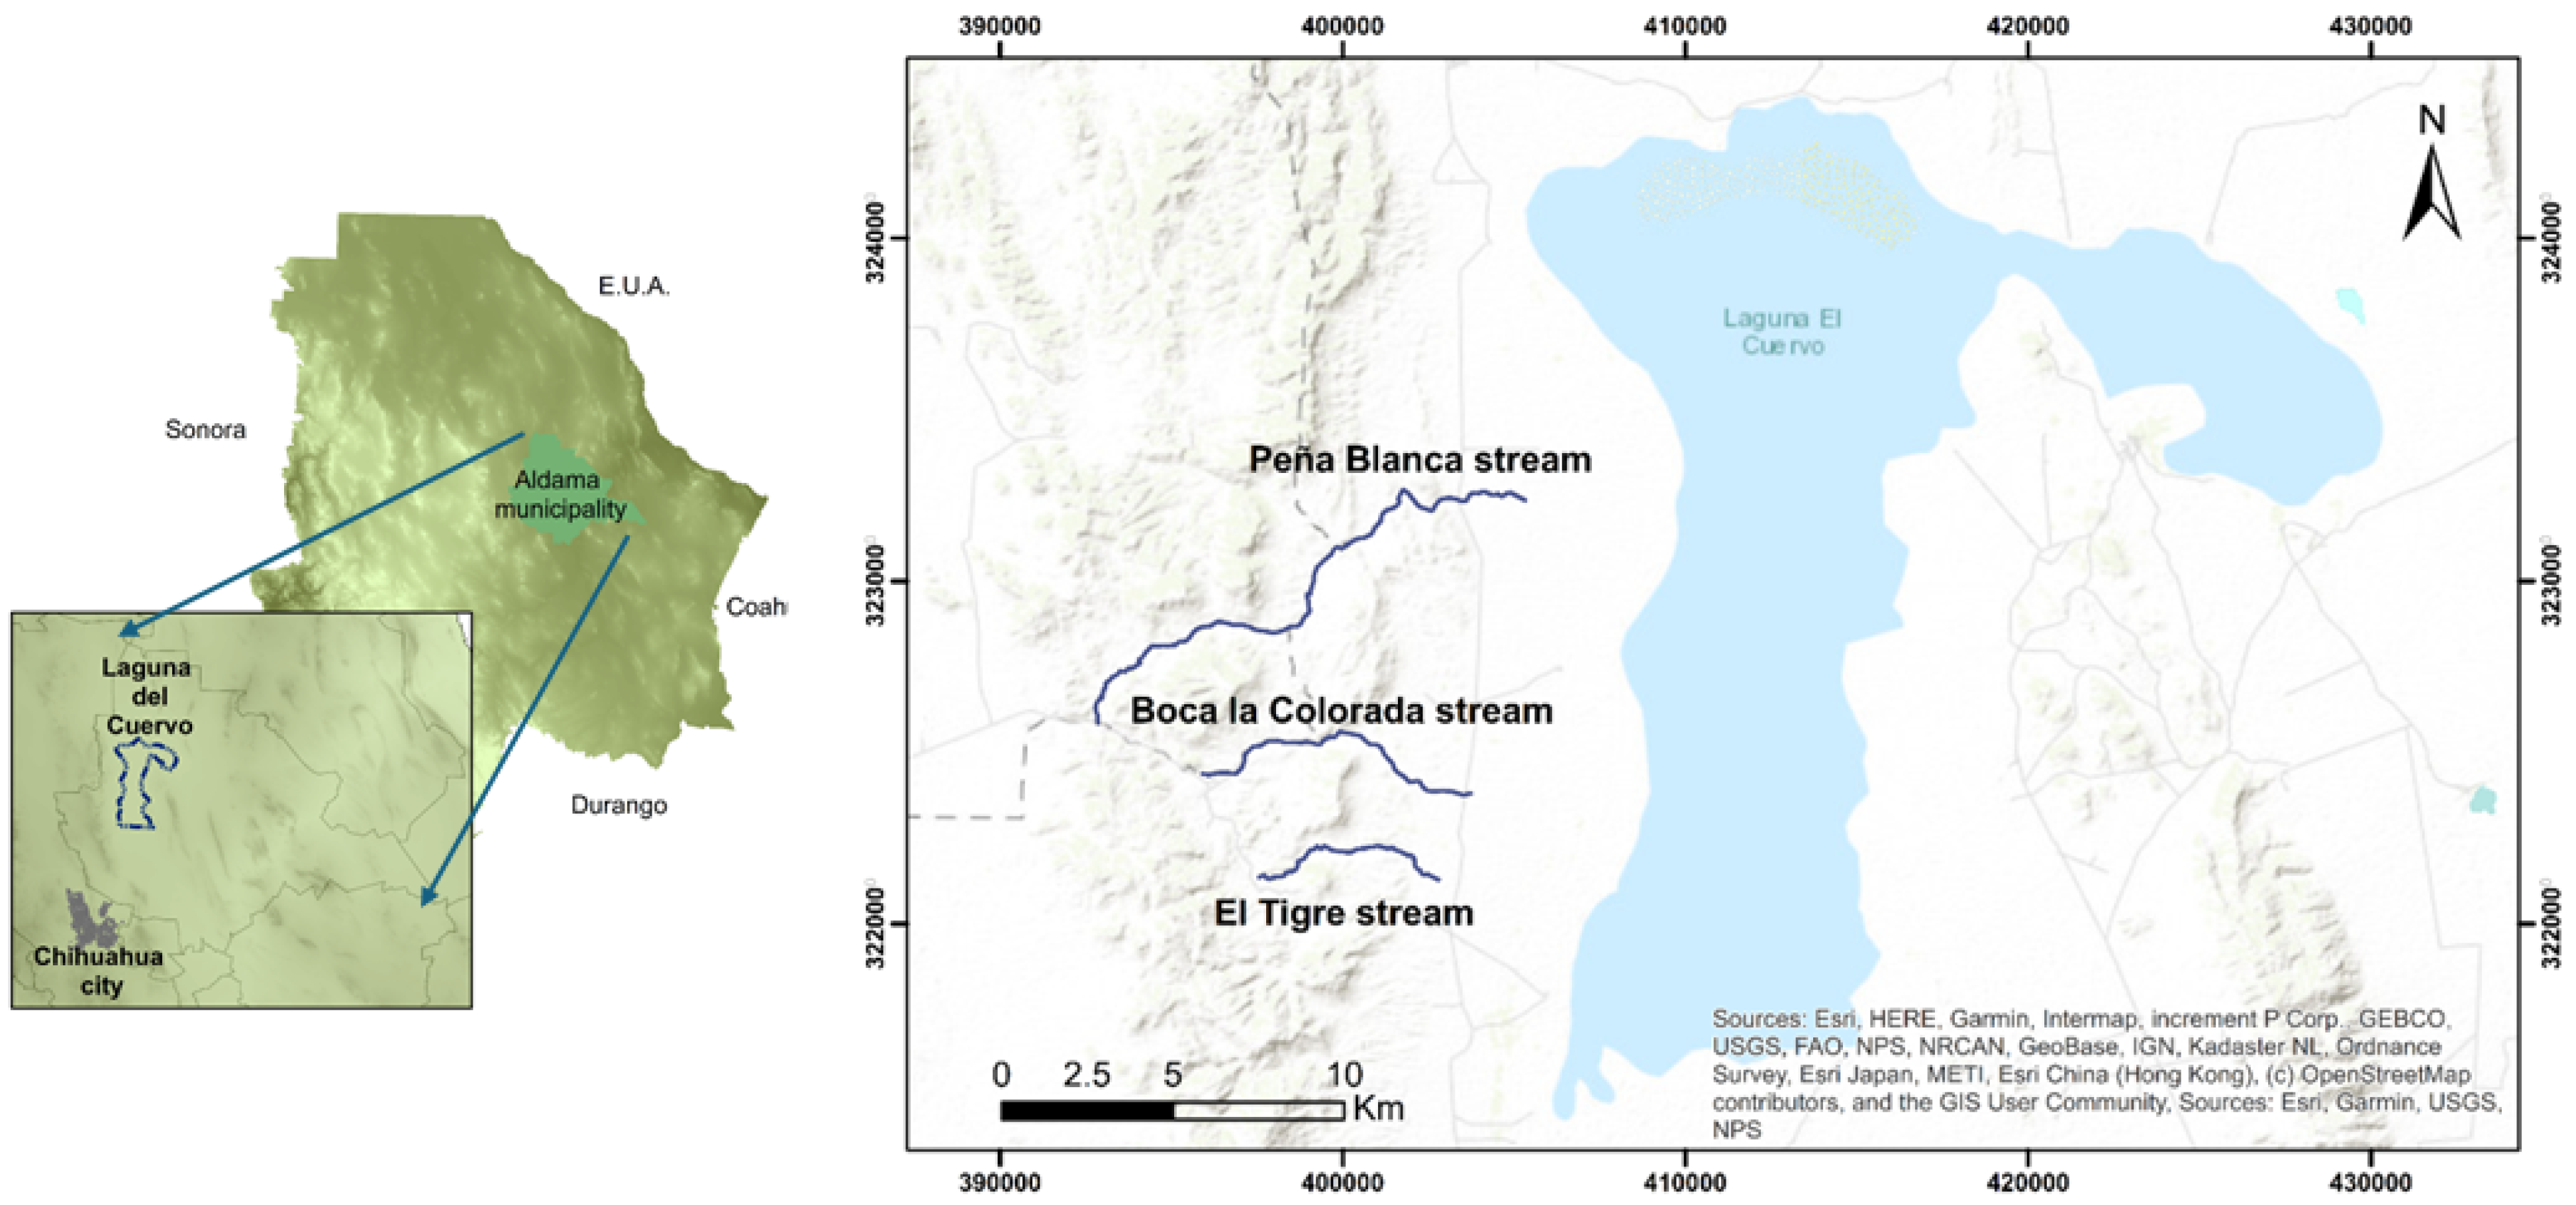
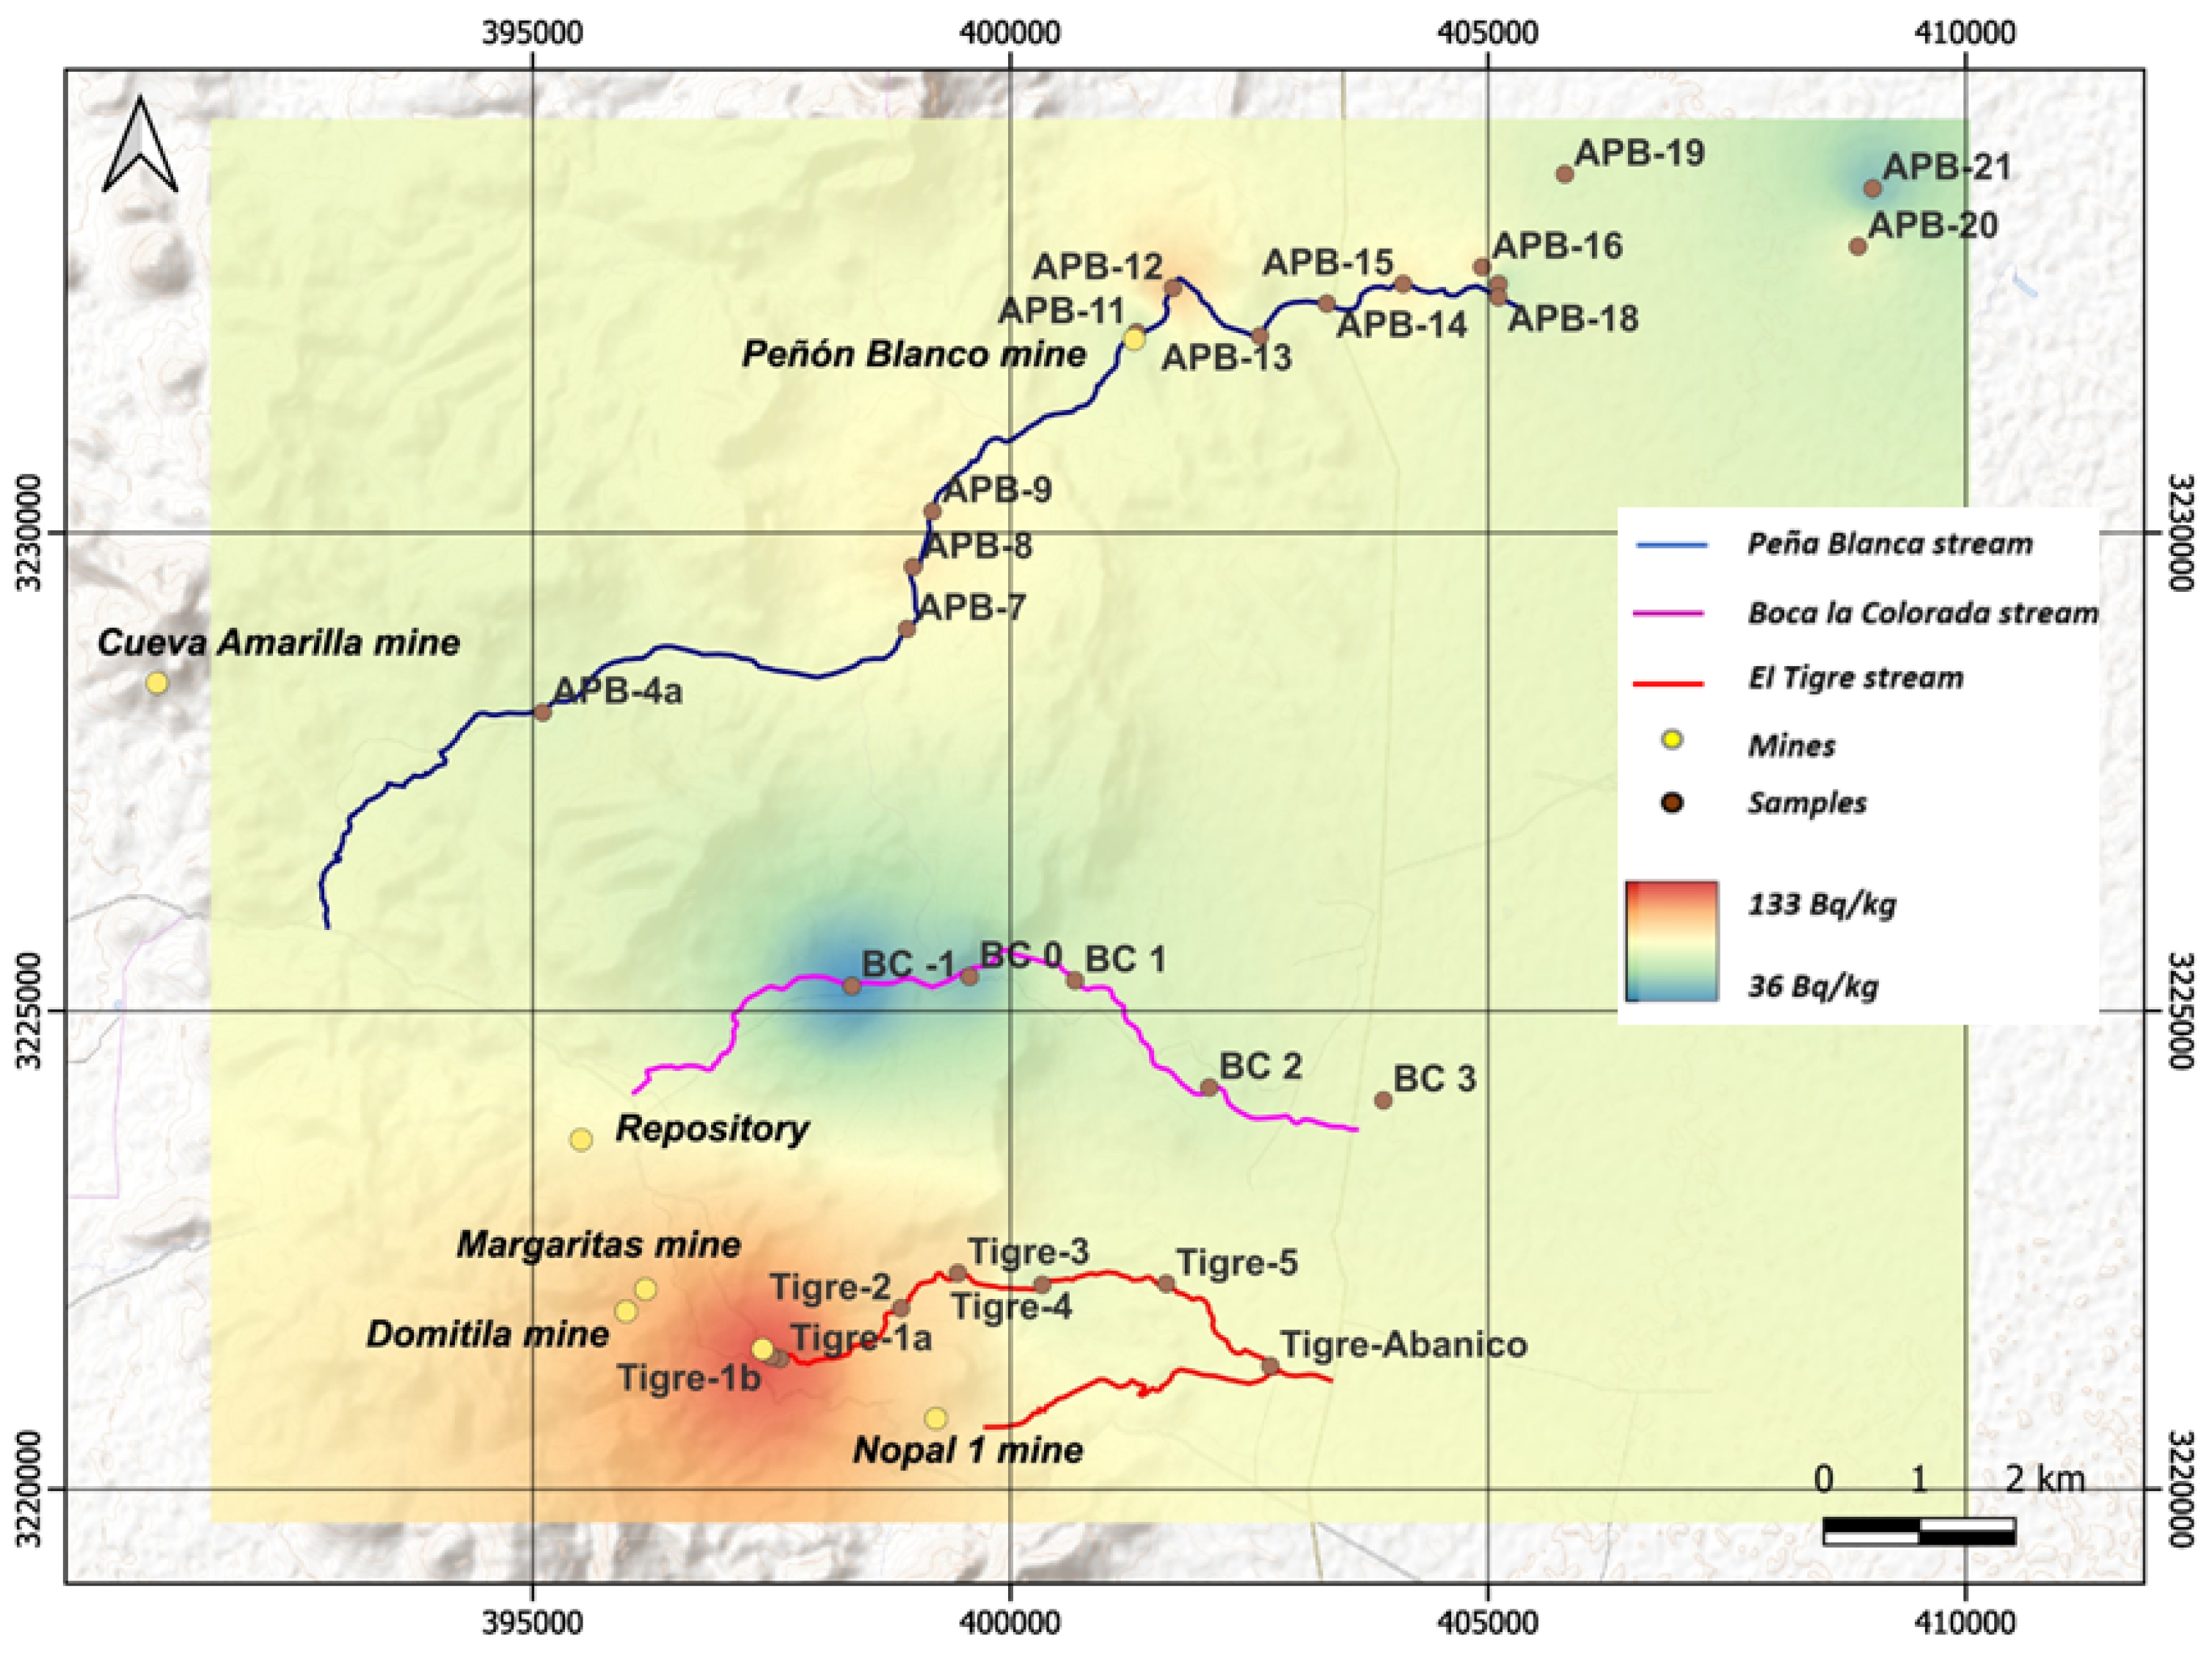
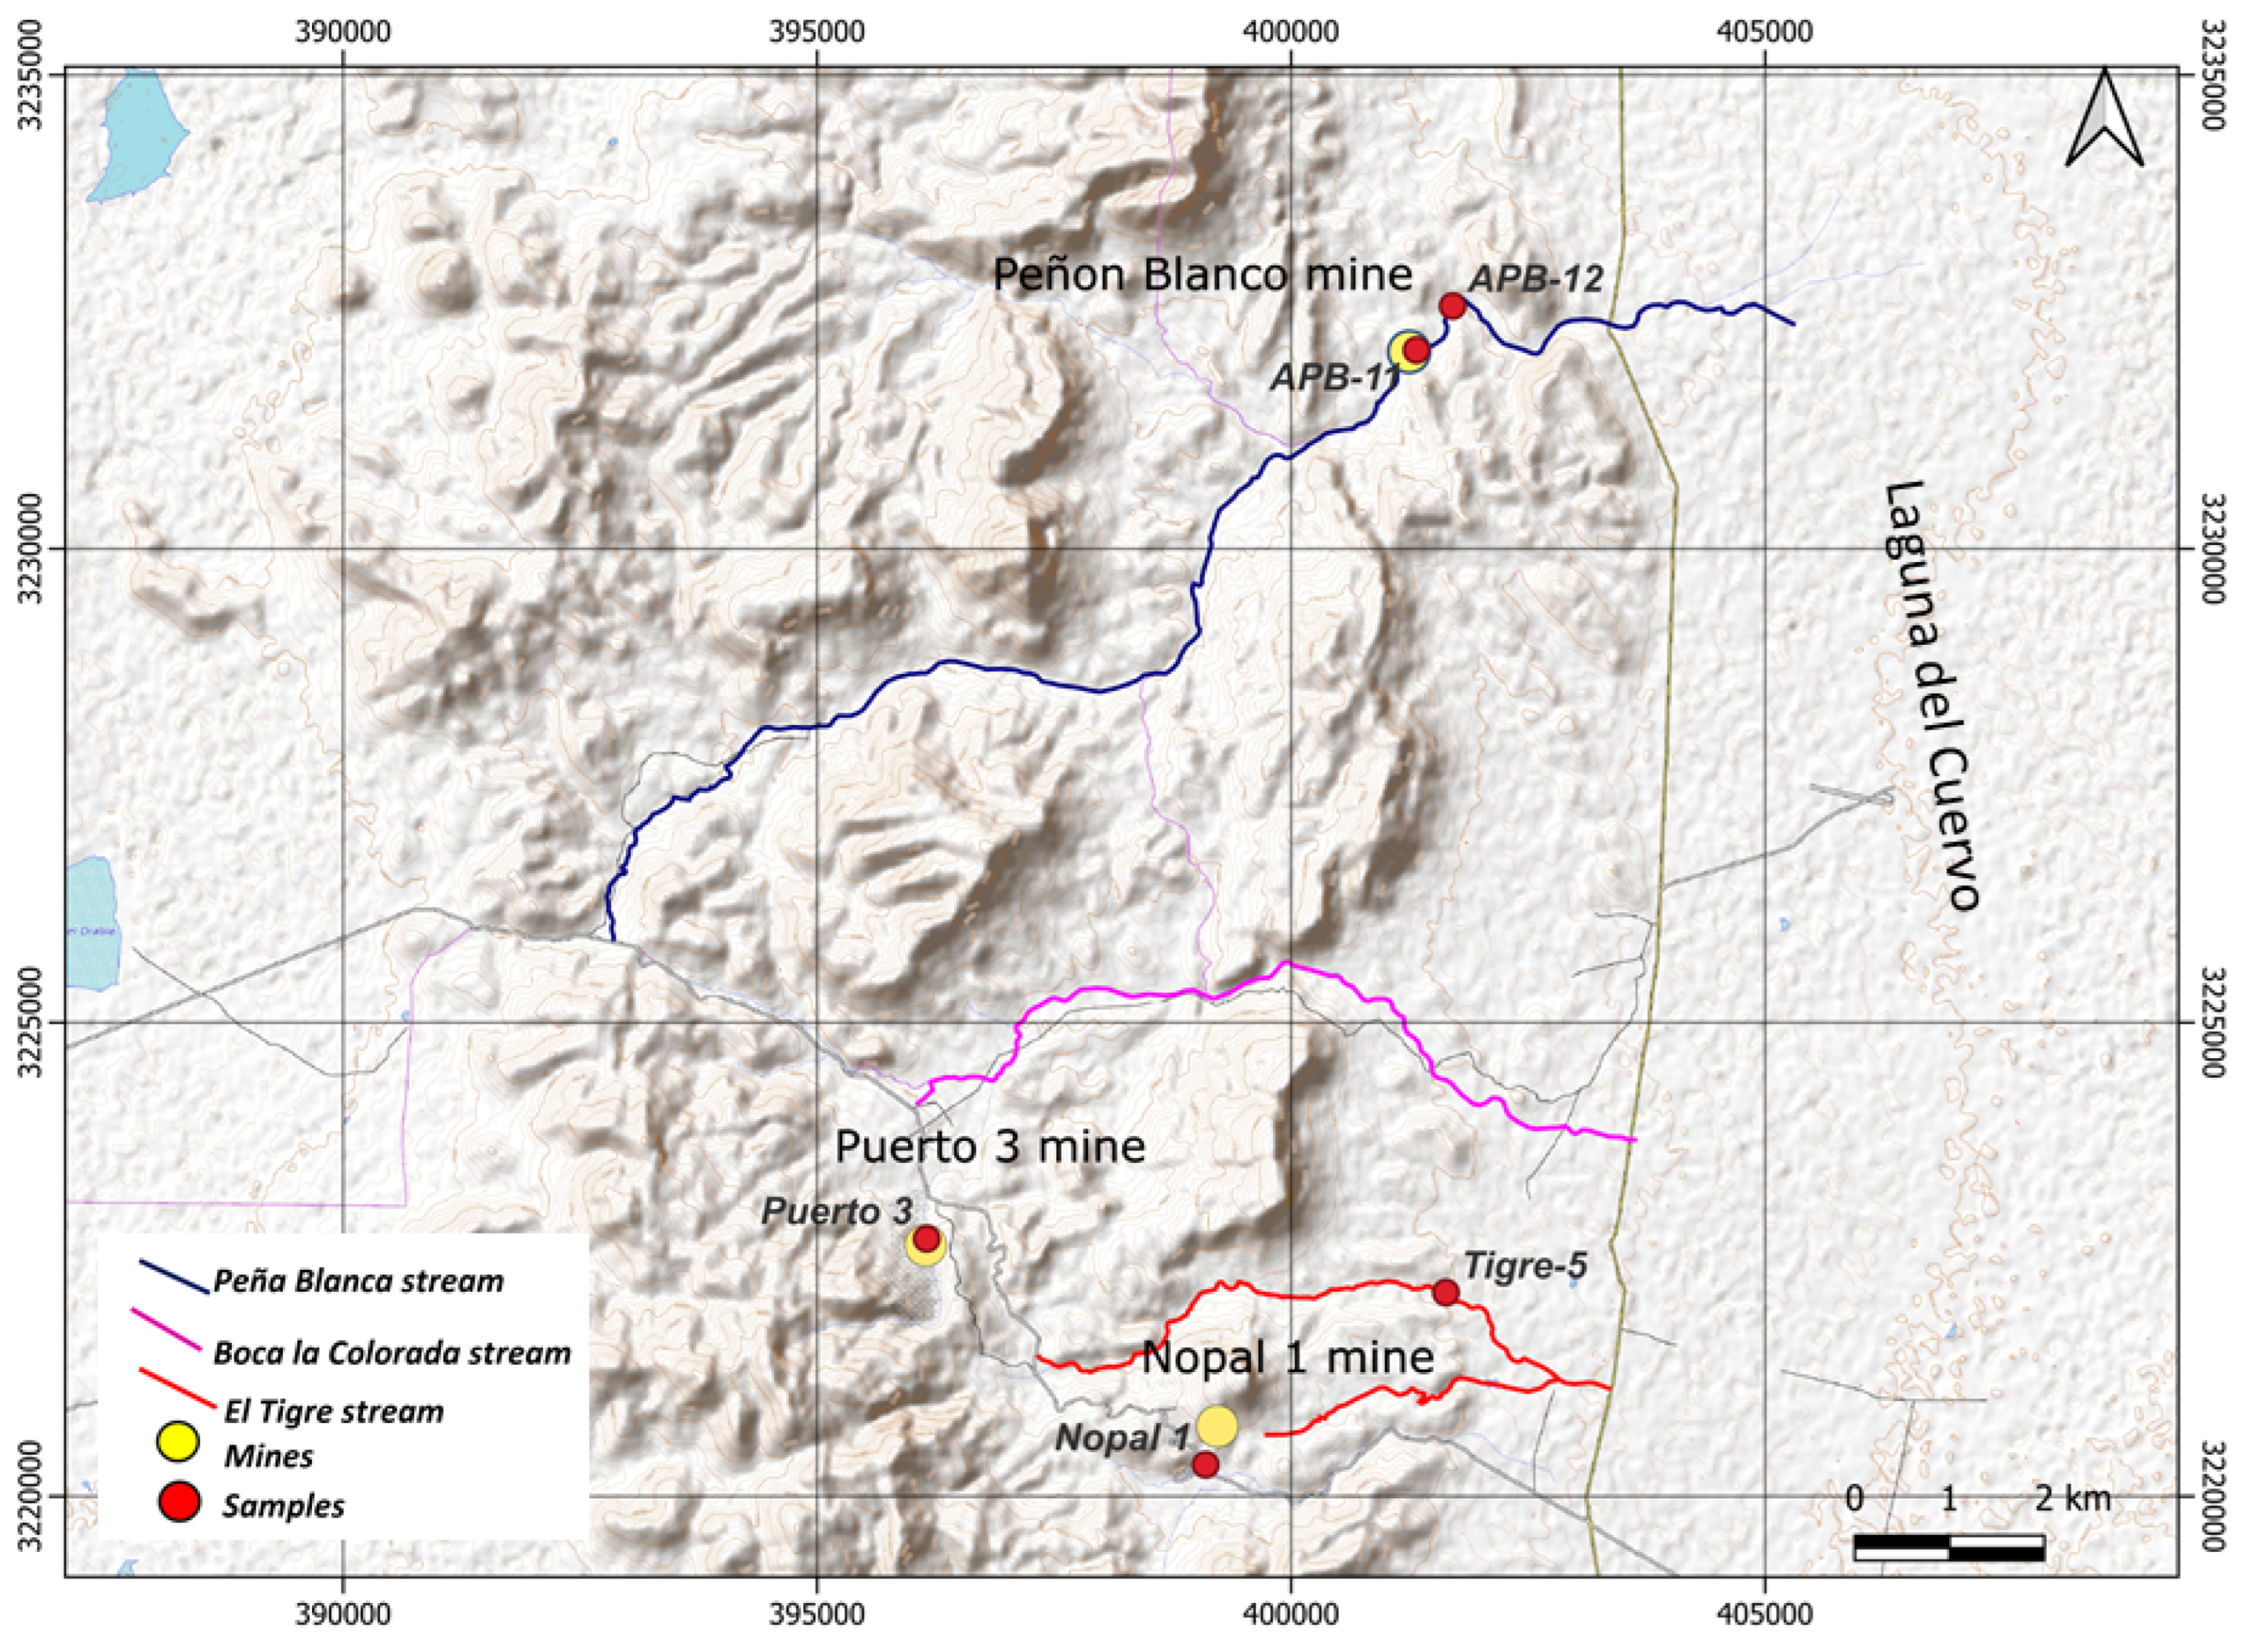
2.1. Sampling and Conditioning of Sediments

Forty-eight sediment samples were collected from the tributaries and alluvial fans of the main streams as identified in the study area (Figure 2) and from the drainage pattern of the mining projects. Among those, 27 were sampled from the Peña Blanca stream, the longest stream on the site, which originates from the upper area of SPB and is part of the drainage pattern of the Peñón Blanco mine. Further, 9 samples were taken from the El Tigre stream, which directly drains the Nopal 3 mine. Another 9 samples were selected from the Boca la Colorada stream, originating near the repository. Finally, two samples were issued from the drainage of the Nopal 1 mine and the last one from the drainage of the Puerto 3 mine.
Sampling was conducted using the guidelines as reported in the ISO standard 18400-102: 2017 [38] for taking samples so that these can subsequently be examined to provide information on soil quality. A picture of a sampling site in the Chihuahuan Desert is shown in Appendix A.1, where the intermittent stream features can be seen together with, in the background, the Nopal 1 mine open pit. The sampling frame was 50 cm square, large stones were avoided, and about 5 kg per sample were collected and placed in labeled polypropylene bags. Figure 2 shows the location of the samples in the area of study.
The sediments were classified by their grain sizes, using the subdivision based on the Udden–Wentworth scale [39,40,41], which differentiates four major classes of sediments: coarse sand (CS), fine sand (FSD), coarse silt (CSC), and fine silt + clay (FSC). Vibrational meshing was used at 15 min intervals, with mesh sizes of 16 (1.19 mm), 50 (0.279 mm), 100 (0.149 mm), 200 (0.074 mm), and 400 (0.037 mm), respectively.

2.2. Characterization of Sediment Samples

2.2.1. X-Ray Diffraction (XRD)

The mineralogical phases of the sediments were determined by X-ray diffraction employing a PANalytical® X’Pert-Pro diffractometer, Almelo, The Netherlands, at a current of 40 mA and voltage of 40 kV, and using a Cu Kα radiation (λ = 1.540560 Å). The 2θ interval was set to 4.9–90° with Δ2θ = 0.013°. The obtained patterns were analyzed using the Data Collector® software version 7.2b. For the quantification of the mineral phases, the Rietveld method, as available in the Fullprof suite, version April 2023 software [42], was applied.

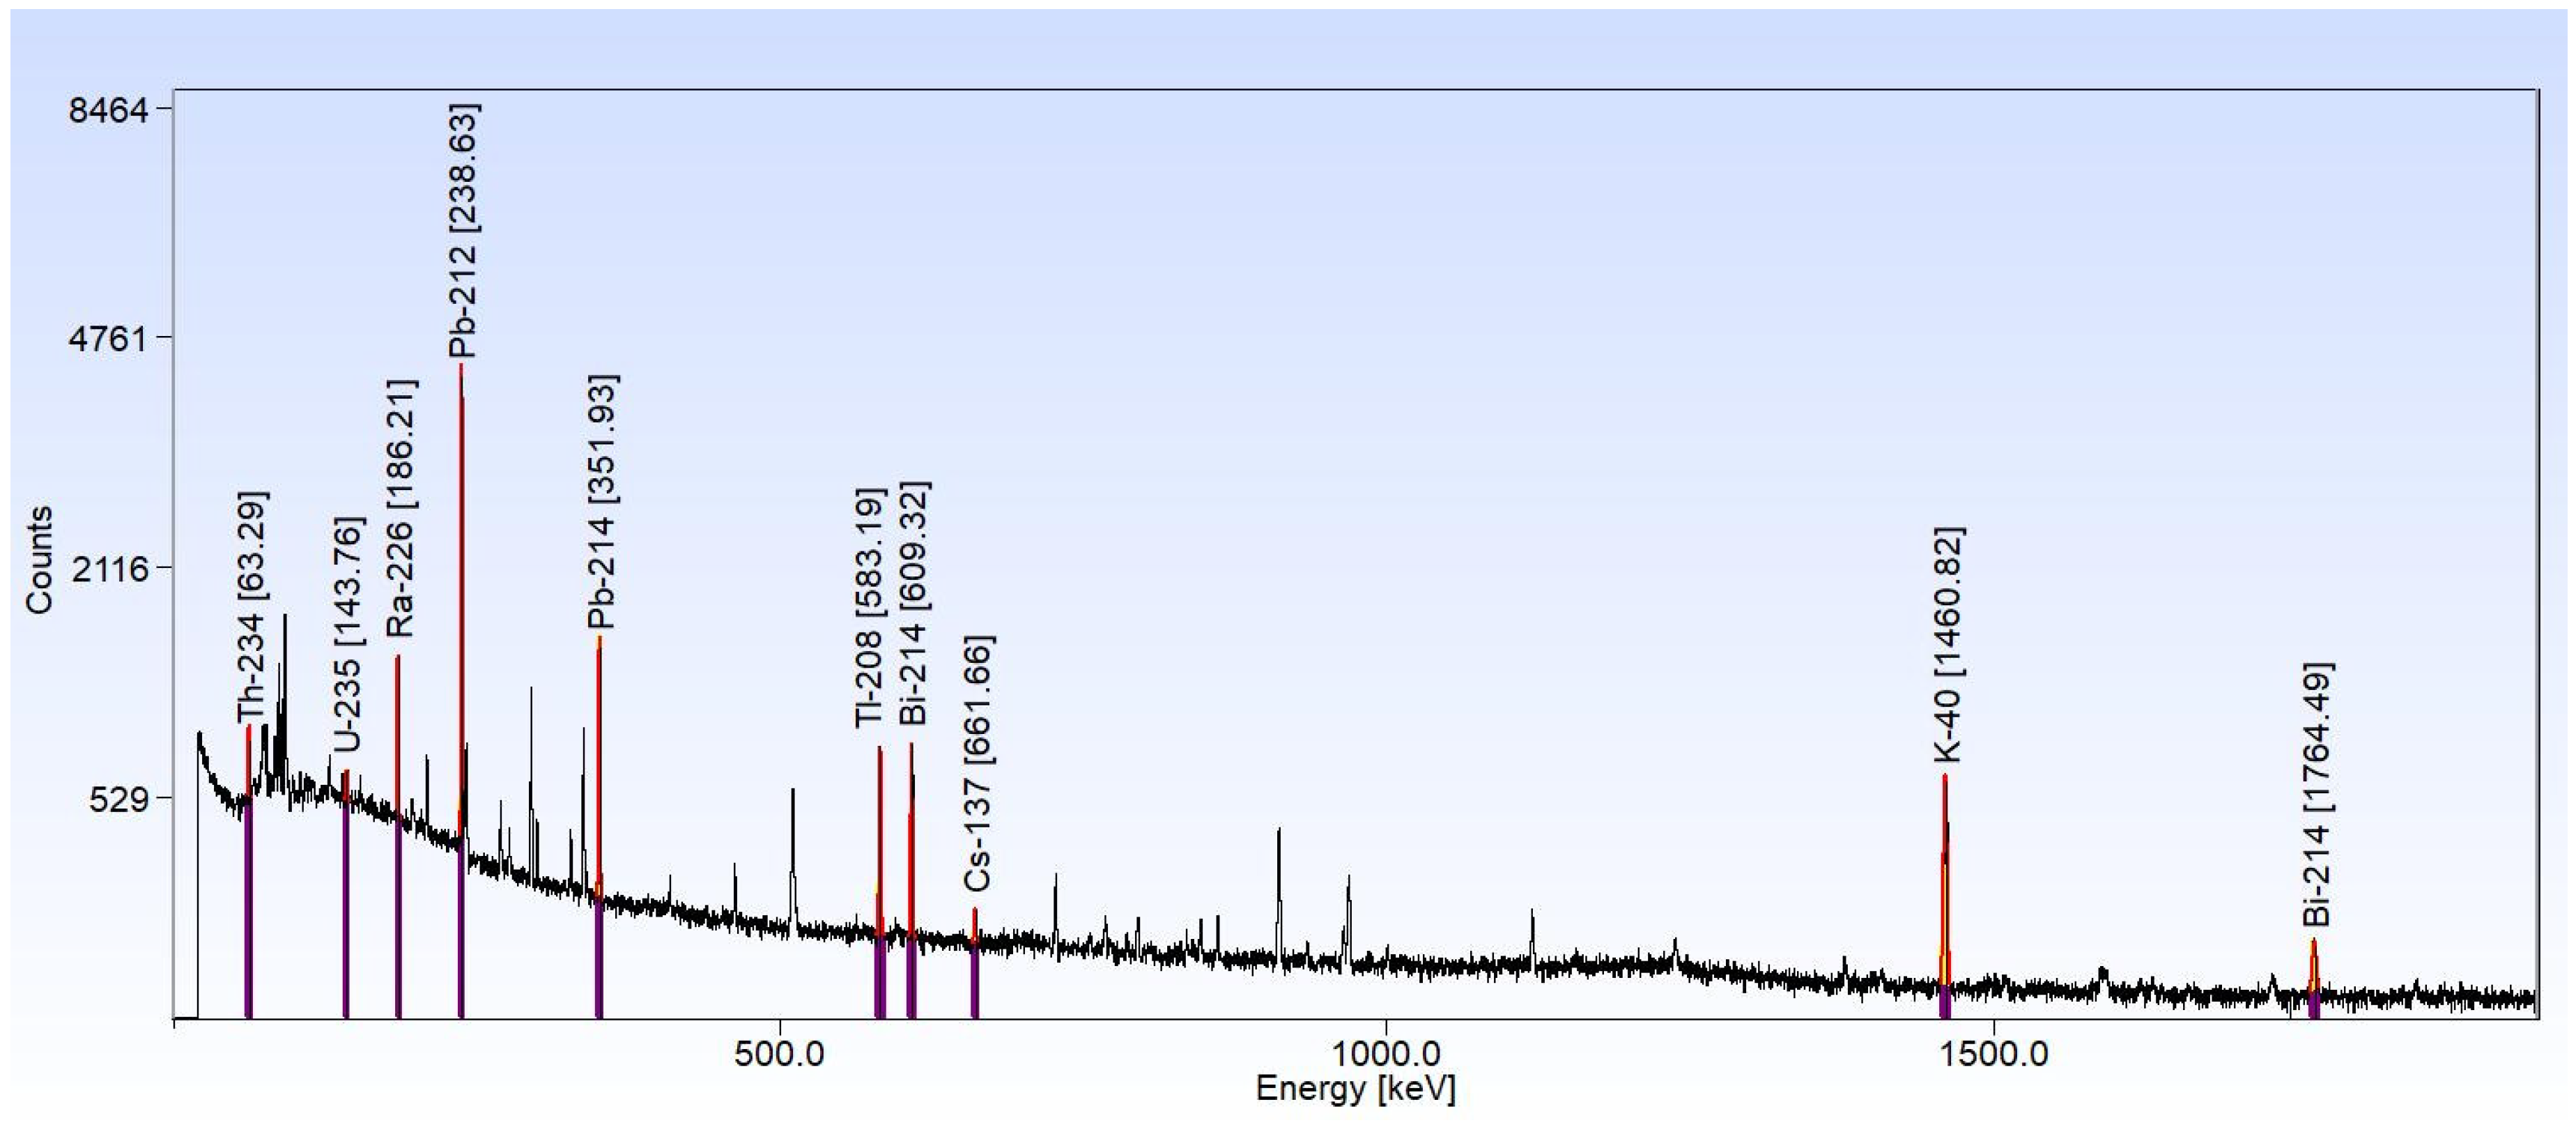
2.2.2. High-Resolution Gamma Spectrometry on Granulometric Fractions of Sediments

Scintillation and solid-state detectors in gamma spectrometry are used to study environmental radioactivity and radioactive materials in general. The major advantages of gamma spectroscopy are the following: high intrinsic efficiency, non-destructive testing, multi-isotopic analysis, no chemical process for samples, and allowing for the analysis of various types of samples [43].
In the high-resolution spectra of the present work, the following radioisotopes were identified: 238U, 226Ra, 214Pb, 214Bi, and 234Th series in equilibrium with 238U. Figure 3 shows the details of a typical spectrum for a sediment sample. The activity of 226Ra in equilibrium with its daughters was determined to estimate the activity of 238U via the relative method. Teflon vials (d = 7 cm) sealed with parafilm were used. To ensure secular equilibrium, the vials were left still for 30 days before undergoing measurement. The spectrum measurement time was set to a minimum of 7 days. To secure an efficient signal collection for the samples and the reference materials, 1 cm of sedimentary material was systematically filled into each vial for each sample.
The following certified reference materials (CRMs) were employed: IAEA-RGU-1 and a mixture of IAEA-RGU-1, IAEA-RGTh-1, and IAEA-RGK-1 in known proportions. The matrix of the CRMs is silicon oxide, and their contents in U, Th, and K are certified. The details of the calculation procedure for determining the isotopes’ concentrations using the relative method are presented in Appendix A.2.
High-resolution gamma spectrometry measurements were performed with coaxial germanium detectors HPGe Canberra GC2020 and XtRa Canberra GX1020, Meriden, Conecticut, with a carbon window. The measurements were carried out using a Canberra Multiport II analyzer and the Genie 2000 software version 3.2.1 to record the spectra. Gamma spectra analysis was performed using bGamma software, version 1.6.2, 2024, BrightSpec N.C., Niel, Belgium.

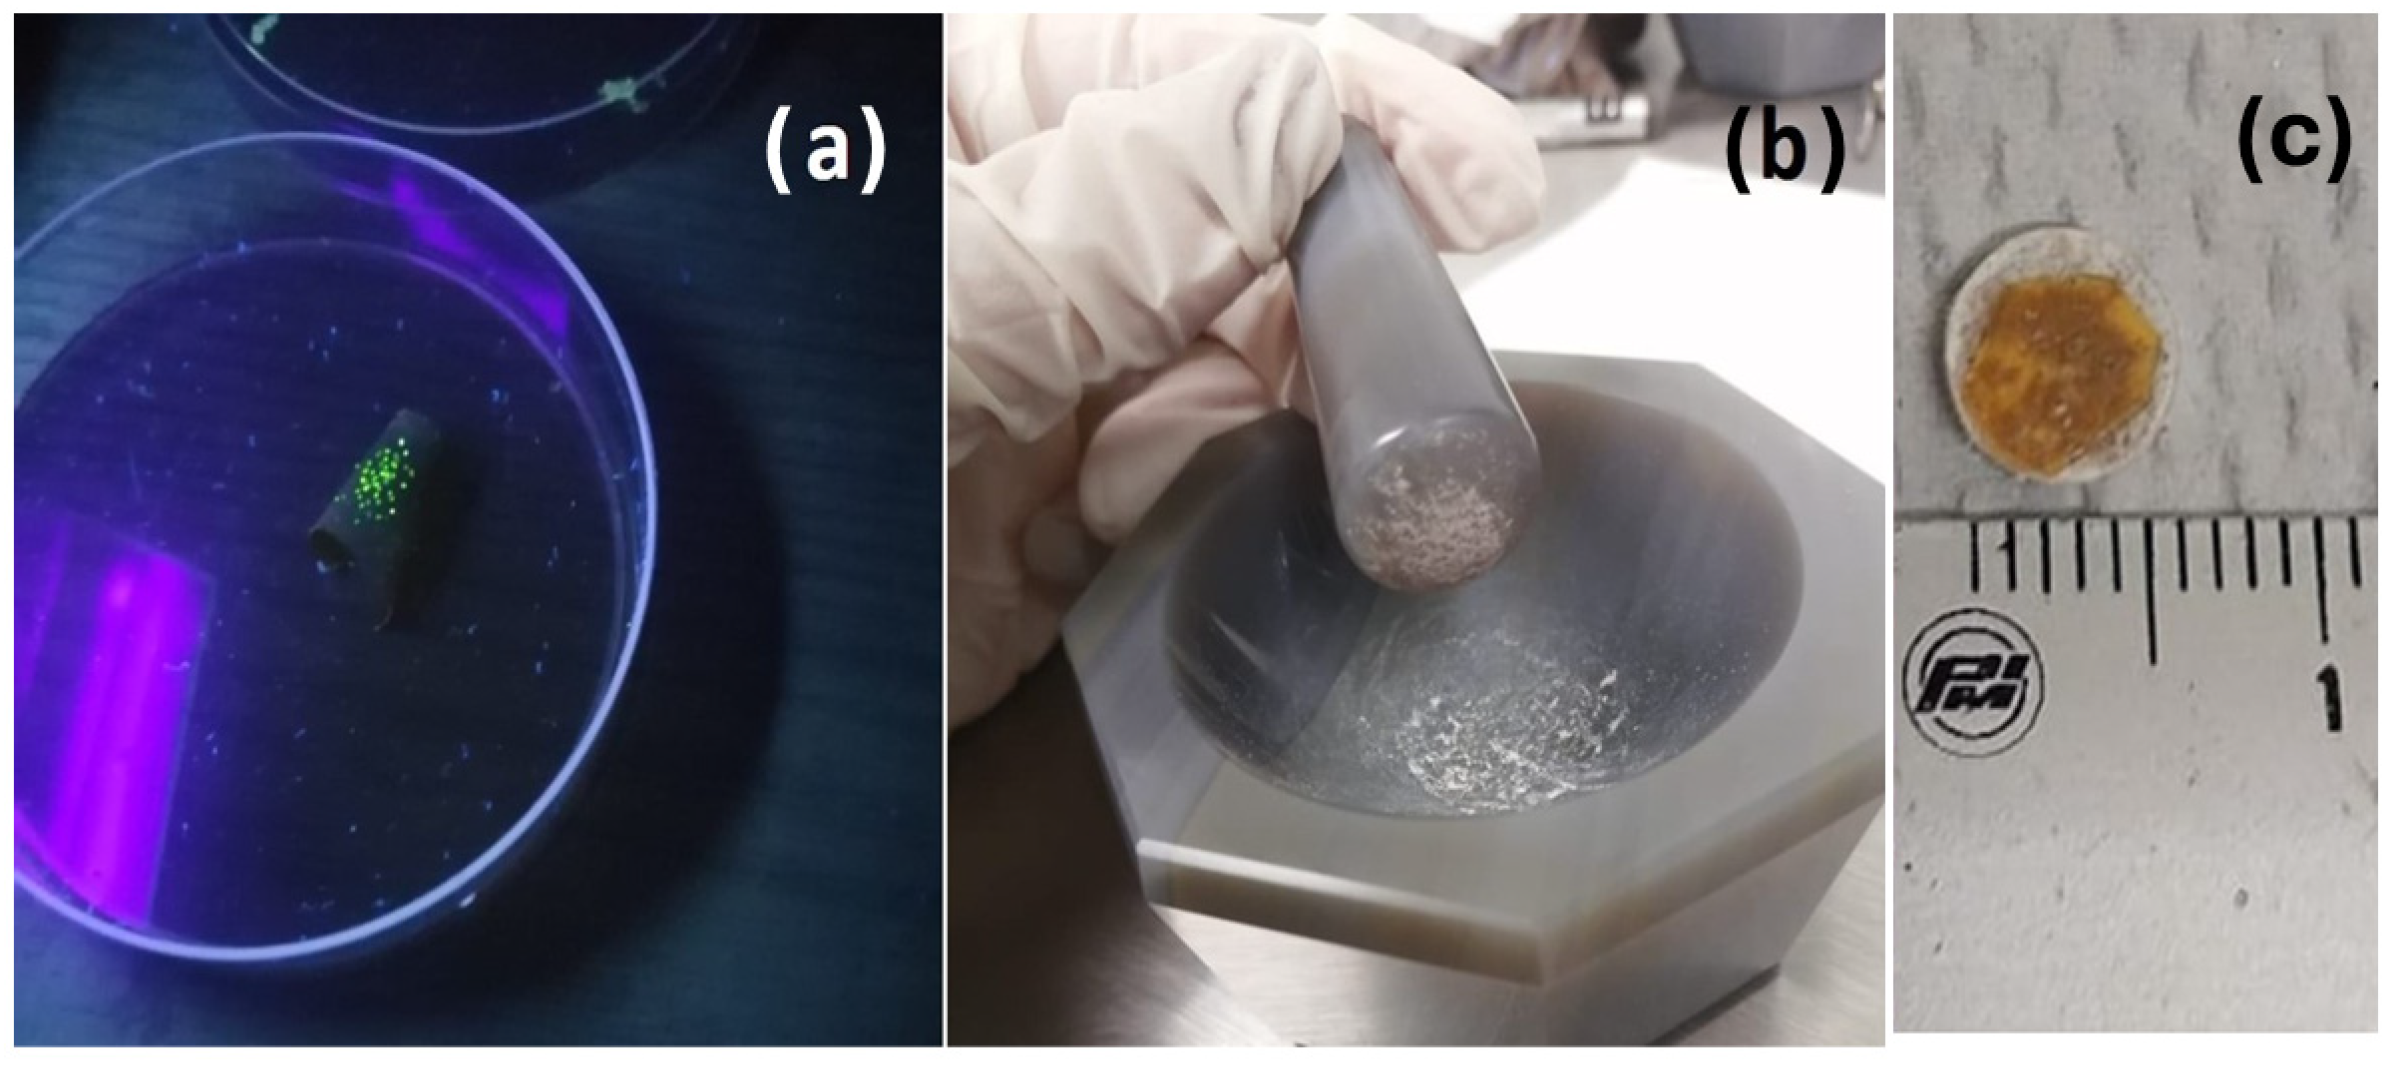
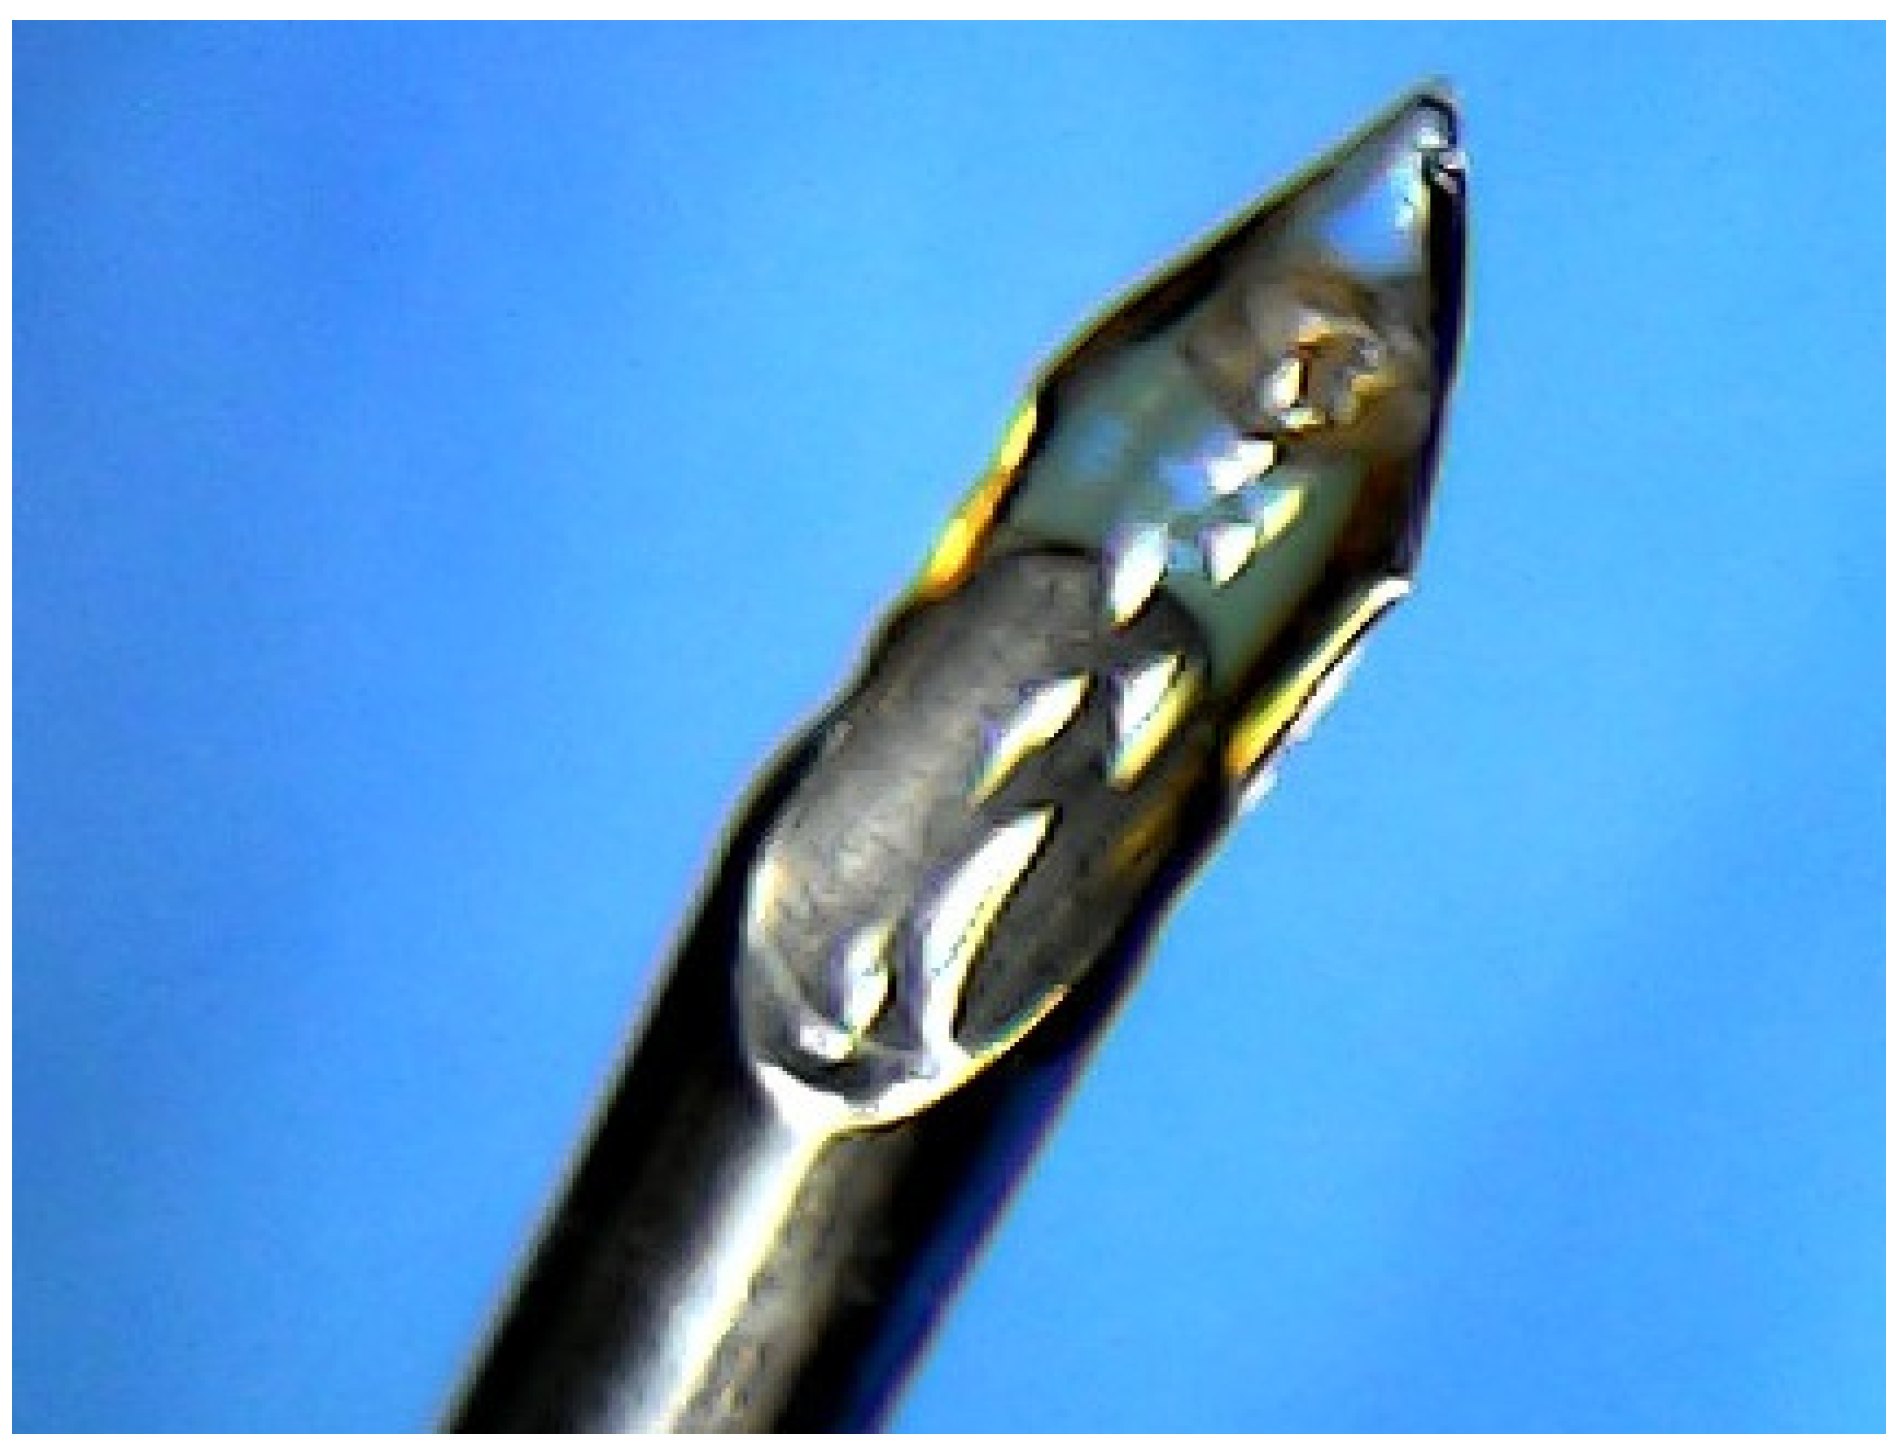
2.3. Selection of U Mineral Particles

In the Nopal 1 U deposit, uranophane and weeksite minerals are generally coated with a layer of silica (SiO2) [9], which fluoresce green under ultraviolet light, as shown in Figure A2 of Appendix A.3. This characteristic enabled, as explained in [9], the identification, with UV light, of U particles in the fine sand sedimentary fractions of samples from the three streams at SPB. The granulometric fraction of 0.149 mm < d < 0.279 mm was examined under 365 nm ultraviolet light to identify the U particles in the samples collected (Figure 4), which were extracted from the sediment with tweezers.

2.4. Quantification of U Particle Density in Fine Sand by Gamma Spectrometry

NaI(Tl) scintillation detectors for gamma spectrometry, with lower resolution than HPGe detectors but greater portability and high intrinsic efficiency, are used for measurements where isotopes are present in important quantities in the samples.
The density of U particles was calculated from the activity concentration of the isotope 214Bi (238U series) obtained with a NaI(Tl) detector and using the relative method described in Appendix A.4. The activity concentration attributable to the mineral particles of the sample under study was compared with a known U particle density in a reference sample acquired under the same geometry of the setup. A characteristic spectrum of the samples is presented in Figure 5. A blank and two samples of reference were prepared as follows:
  • A fine sand sample was selected from a remote position outside the mine drainage pattern, which displayed the lowest U activity concentration in the study area obtained separately by γ-ray spectrometry. This sample is a sediment “matrix blank” with the inherent U content of igneous rocks, of activity concentration (1.79 ± 0.02) Bq/g.
  • From the fraction with grain size 0.279 mm < d < 1.19 mm of sample APB-11, 3336 particles were identified and extracted according to the procedure mentioned in Section 2.3. The extracted particles, whose total mass was 0.3764 ± 0.0001 g, were added to an aliquot of the matrix blank. The mixture was homogenized, placed in a vial, and measured in the same geometry. The added activity due to the particles was 0.26 ± 0.02 Bq. The estimated mass per particle was 0.112 ± 0.001 mg, and the assessed 238U activity per particle was Acteach particle = (0.77 ± 0.06) × 10−4 Bq/part.
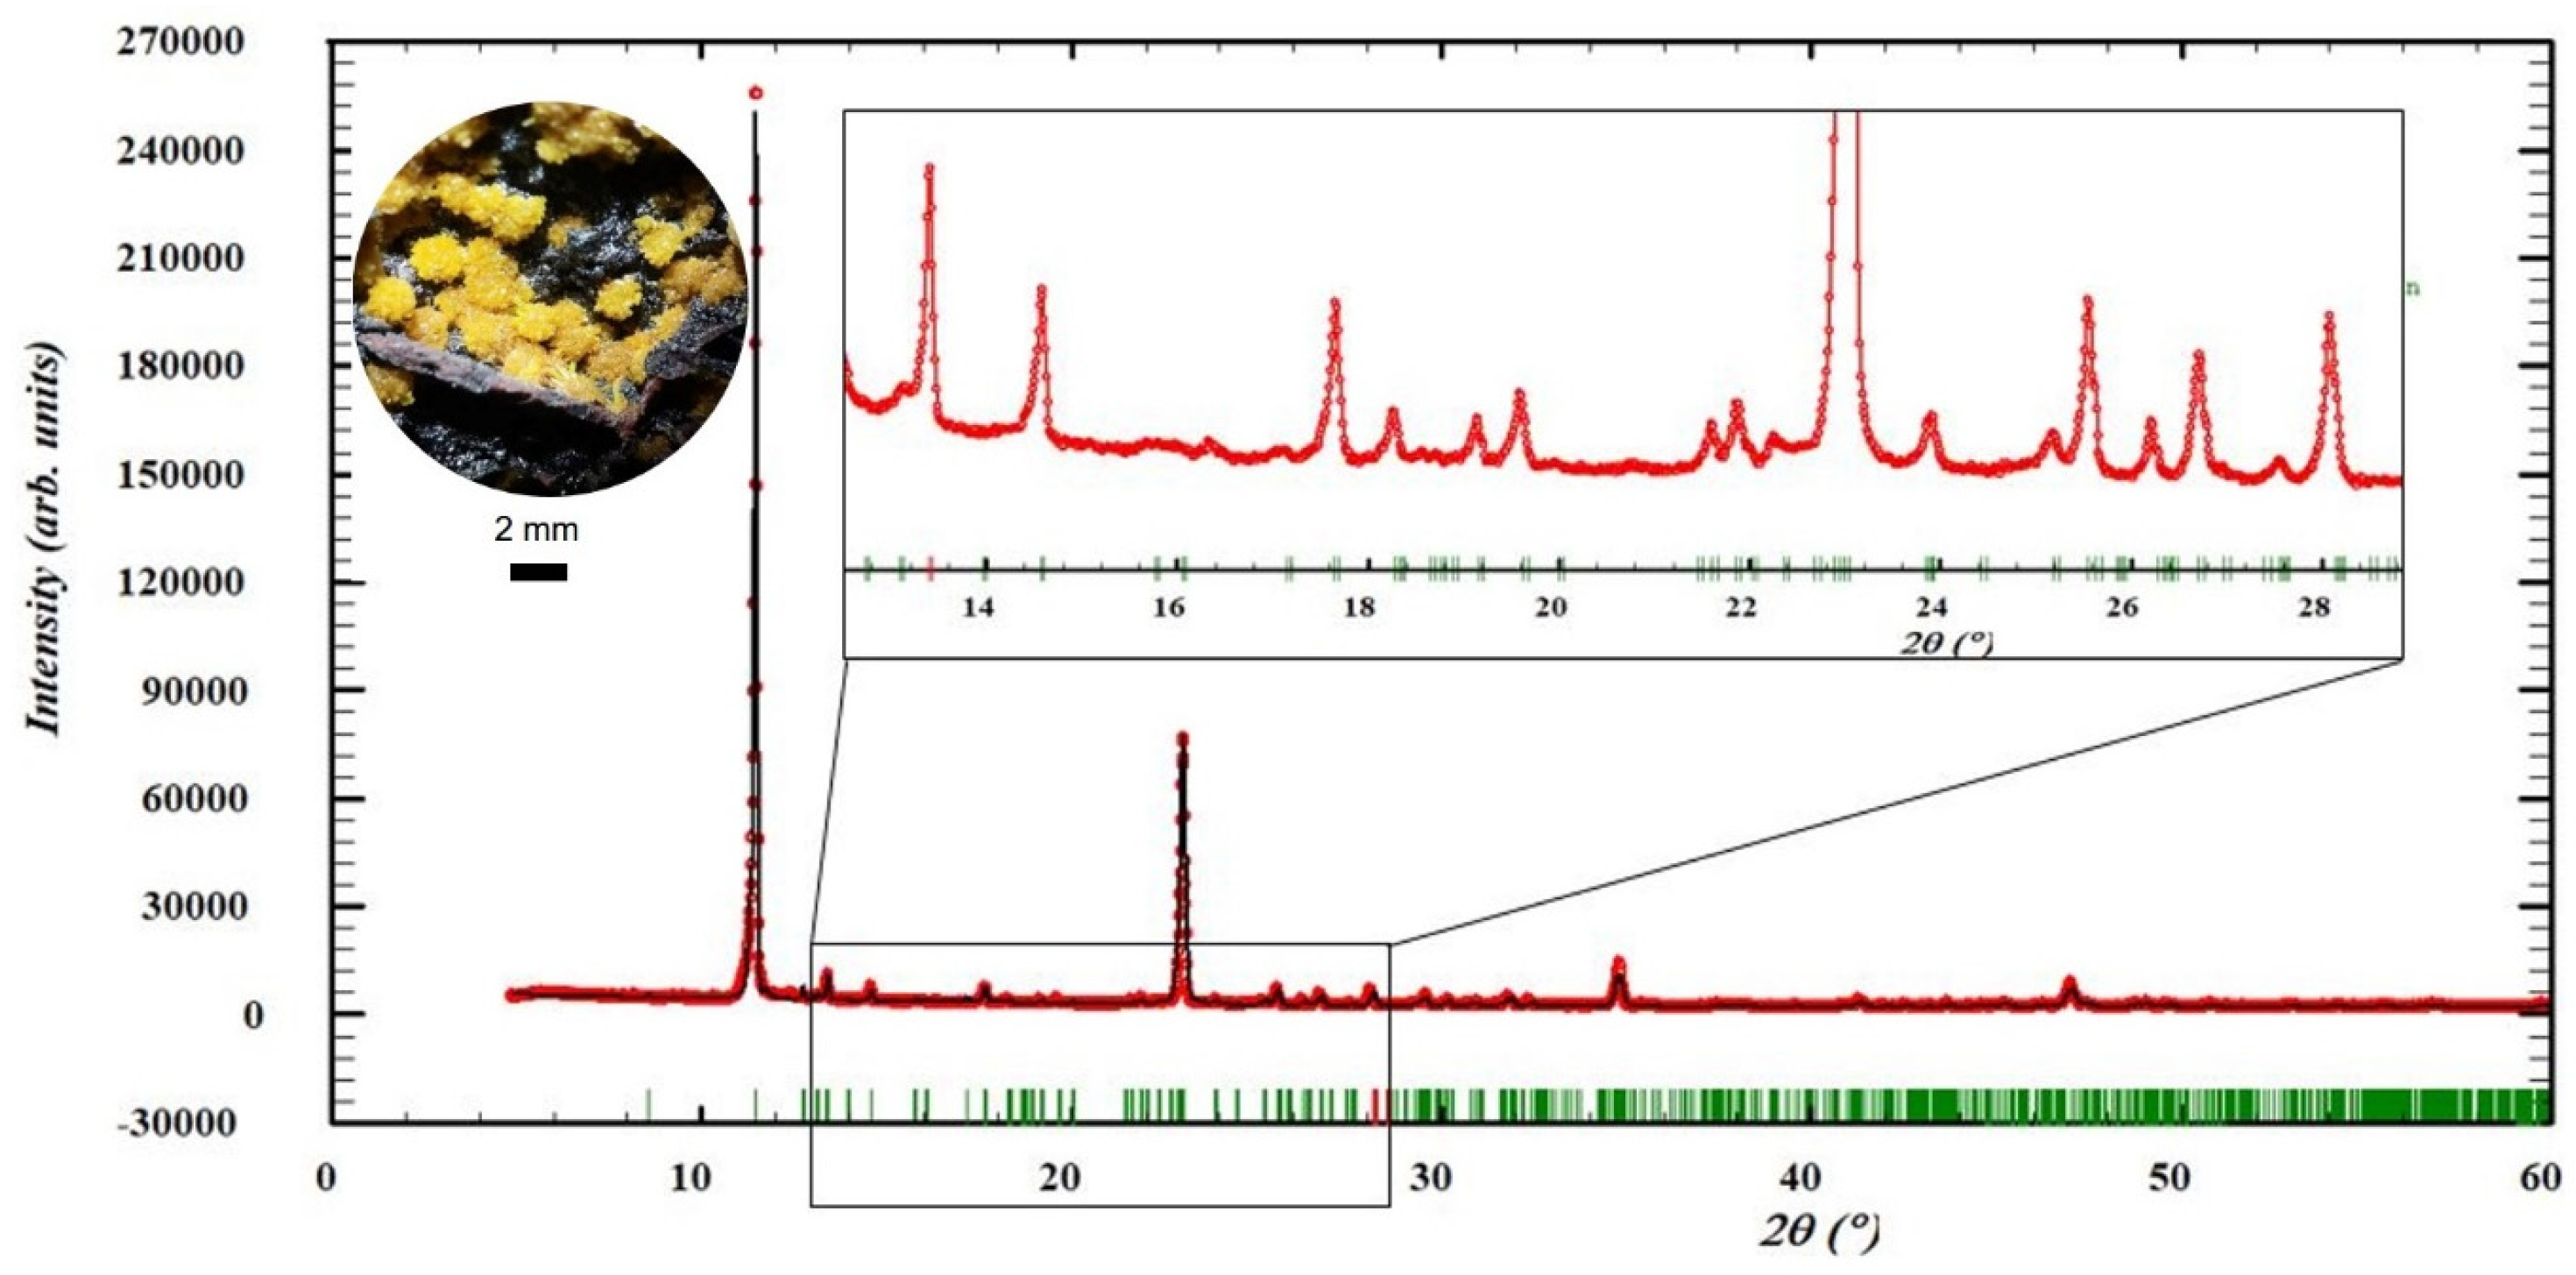
  • An activity concentration reference sample was prepared with the same matrix blank described in paragraph 1 of this section. In this case, a mass of 0.9554 ± 0.0001 g of pure parauranophane crystals extracted from Peña Blanca was added to the blank, and its purity was determined by XRD. The diffraction pattern of parauranophane (URP) reference material analyzed by the Rietveld method is presented in Appendix A.5, Figure A3. With the resulting concentration of pure parauranophane, the activity of added 238U was ActURP = 6565 ± 65 Bq.
The reference and blank samples were encapsulated and sealed in polypropylene vials, ensuring a height of 1 cm of material. The particle densities were determined in Tigre 5, APB-11, APB 12, Puerto 3, and Nopal 1-d samples. The sediment samples were also hermetically sealed in vials and measured under the same geometry used to investigate the reference materials. The masses of each sample and the reference materials were documented. To ensure secular equilibrium, the vials were left still for 30 days before undergoing measurement with a Bicron 3M3/3 NaI(Tl) Gamma Detector and a 6 cm of (Pb + inner Cu) shield. The spectra were acquired using an Accuspec Canberra card and the Canberra Genie 2000 basic software model S502C. Gamma spectral analysis was performed using the bGamma software, version 1.6.2, 2024, BrightSpec N.C., Niel, Belgium.
The count rate of all measurements presented a relative standard deviation of less than 0.5%.

2.5. Morphology and Composition of Individual Particles

2.5.1. Focused Ion Beam and Scanning-Transmission Electron Microscopes

The analysis approximately followed the procedure reported by Cook et al. [44]. Some particles of the APB-11 sand sample (0.279 mm < d < 1.19 mm) were selected following the method presented in Section 2.3. These were placed in Eppendorf vials and encapsulated in a Mbed-812 resin, as shown in Figure A4 of Appendix A.6. The content of the vials was solidified at 60 °C for 24 h. The blocks were cut in a JEOL JEM-9320, Akishima, Tokyo, Japan, Focused Ion Beam microscope to obtain sections of an individual particle. Selected sections were then transferred into a JEOL JEM 2200FS+CS TEM, Akishima, Tokyo, Japan, instrument operated under the scanning-transmission electron microscope (STEM) mode to determine their morphology and elemental content.

2.5.2. X-Ray Absorption Spectroscopy (XAS)

X-ray absorption spectroscopy (XAS) measurements were performed at the I20-scanning beamline of the Diamond Light Source (DLS) UK, employing a Si(111) four-bounce monochromator and a Canberra 64-pixel Monolithic Segmented Hyper-Pure Germanium detector (HPGe64) with Xspress4 digital pulse processor. The beam size on the sample was 400 × 300 μm. Particles from the sediment samples taken at Nopal 1, with d < 100 µm, were extracted from the fine sand fraction according to the procedure reported in Section 2.3. These particles were assumed to be composed of uranophane to calculate the attenuation length (λ = 97 µm) for an energy of 17,166 eV at the U-LIII absorption edge. Consequently, the particles were grounded to a powder of grain size < λ and approximately 50 mg of it was pressed onto a 6 mm diameter pellet with cellulose as a binder. See Appendix A.7 for details. Additionally, an XANES spectrum was acquired on a sample of uraninite extracted from SBP and prepared as previously described to be able to compare the absorption edge of the particle samples to a robust sample with a U(IV) oxidation state. The pellets were placed in a sealed Nalgene® cryovial. At the I20-scanning beamline, it was fixed to a sample holder, and the vial was placed in a cryostat with liquid nitrogen. Three scans per sample were acquired at the U-LIII absorption edge from 16,800 to 17,750 eV in fluorescence mode, with single scans obtained on each of the 64 elements of the Ge detector. A yttrium reference sample was measured independently to calibrate the energy scale.
In addition, an XAFS spectrum of parauranophane was obtained at the beamline B18 of DLS, in the high energy section, using the Si (111) set of crystals of the fixed exit double crystal monochromator, a plane mirror for rejection of the harmonics and 3 ionization chambers mounted in series for measuring incident and transmitted intensities from the sample and transmitted intensity from a reference metal foil. The beam size was 1 × 1 mm. The sample was prepared according to the recommendations of [45] to avoid self-absorption in concentrated samples. The measurement was performed in transmission mode with a Y foil in the reference channel and was conveniently recorded for each of the five scans from 16,800 to 18,100 eV.
In the acquisition of all XAFS spectra, the energy intervals for each point were set for the XANES domain at ∆E = 5 eV for the pre-edge region and 0.3 eV for the edge region, with 1 s integration time per point and with constant k = 0.040 Å and variable time from 1 to 5 s per point for the EXAFS domain. Five scans were averaged to obtain the final spectrum [46]. The normalized absorption signal was obtained using the data reduction analysis available in the IFEFFIT.22 program. XANES and EXAFS spectra were processed using the Demeter toolkit (ATHENA and ARTEMIS) developed by B. Ravel and M. Newville [47]. In addition, the ARTEMIS FEFF6.0 theoretical modeling code was used to calculate the backscattering phases and amplitudes from neighboring atoms, allowing the fitting of the experimental data to the corresponding theoretical curves. The EXAFS signal was obtained by removing the background of the normalized absorption, using a spline fit to the low varying background between 0.0 < k < 12.3 Å−1, with Rbkg = 1. To retrieve the structural parameters, the average U-O nearest neighbor distance, R, and its corresponding Debye–Waller factor, σ2, a fit was performed in the k-space interval 3–9.5 Å−1, on the EXAFS k3 weighted signal.

2.5.3. X-Ray Fluorescence Micro Computed Tomography (XRF µ-CT)

Sample Preparation
A fluorescent particle was separated from the sand of sample APB-11 and placed on the Kapton® tip of a needle-shaped sample holder. The particle was then covered with EMbed-812 resin and kept at 60 °C for 24 h to solidify. See Appendix A.7 for details.
Data Collection at I18 Beamline, Diamond Light Source
The chemical composition of the particle was characterized using XRF micro-computed tomography. The data were collected at the I18 beamline at the Diamond Light Source in Oxfordshire, UK. I18 is an undulator beamline with a Si(111) double crystal monochromator, providing an energy resolution of ΔE/E = 1.4 × 10⁻⁴ at 10 keV. Kirkpatrick–Baez mirrors focused the beam on the sample to a spot size of 2 × 2 µm2. XRF µ-tomography data were collected using a four-element Si-Drift diode (SDD) detector (Vortex, with Cube pre-amplificator) displaying a 130 eV energy resolution at the Mn Kα. XRF µ-tomography was performed at an incident photon energy of 17.5 keV with an incident photon flux on the sample of roughly 2 × 10¹² photons per second. Each CT slice was collected with a 5 µm translation step and a 1° rotation step. After each slice, the sample was translated 5 µm in the vertical direction, and the slice data collection was repeated until most of the particle volume CT dataset was measured. The obtained XRF spectra were processed using PyMca 5.4.1 [48]. The tomography reconstructions were automatically processed using a Jupyter© Notebook Python 3.13 script with the TomoPy plugin 1.11 [49]. The data were further processed with Fiji 2.16 [50] and visualized with the Dawn 2.34 [51] and Avizo 9 software [52].

3. Results

3.1. X-Ray Diffraction (XRD)

The crystalline phases of the samples issued from the fine silt + clay fraction of sediments from the Peña Blanca stream were identified via XRD and are reported in Table 1. These include quartz (SiO2), calcite (CaCO3), magnetite (Fe3O4), potassium feldspars as sanidine ((K,Na)(Si, Al)4O8), albite (NaAlSi3O8) and anorthite (CaAl2Si2O8), and clays such as montmorillonite ((Na,Ca)0,3(Al,Mg)2Si4O10(OH)2·nH2O) and kaolinite (Al2Si2O5(OH)4). The concentration of minerals in the samples varies along the stream. Figure 6 presents a characteristic XRD pattern submitted to a Rietveld refinement using the FullProf software. Appendix B shows the phases present in the sediments of the three streams studied.
The most abundant mineral in the area is quartz, representing more than 20% of the present phases in most cases. Feldspars such as albite, sanidine, and anorthite are also observed. As these feldspars form solid solutions, their composition may vary slightly, complicating their identification and modeling using the Rietveld method.
Those results are consistent with those described by Hernández-Hernández and Pérez-Reyes et al. [28,29] in the Boca la Colorada stream, and Rodríguez-Guerra [27] in the El Tigre stream. The mineral phases identified in the streams’ sediments all agree with those described by Reyes-Cortés and Cárdenas-Flores [6,7].

3.2. High-Resolution Gamma-Ray Spectrometry

The 238U activity concentrations (AConc), assumed in equilibrium with progenies in the decay chain, were determined by gamma spectrometry for the different particle sizes of the sediment samples selected. For illustration, the AConc results obtained from the intensities of the 352 keV 214Pb γ-rays of the FSC particle size fraction are presented in Figure 7. The Aconc obtained by gamma spectrometry used for the interpolation of the map in Figure 7 may be found in Appendix C. The highest and lowest AConc for the Peña Blanca, El Tigre [27], and Boca la Colorada [28] streams are shown in Table 2.
The AConc values obtained show that the concentrations of the isotope 214Pb, in equilibrium with 226Ra, are related to the distance between the sampling point and the mining projects and/or mineralized geological formations. In the Peña Blanca stream, this is most clearly observed in the AConc of fine silt + clay: the highest AConc corresponds to those close to mining projects in their drainage patterns, while the lowest AConc is found in the alluvial fan of the stream, close to Laguna del Cuervo. These results are consistent with what was reported in the other SPB streams [27,28] and as described above, where the AConc is higher at points close to the mines and lower at the end of the alluvial fans.
A close examination of the activity concentration results in the light of their sampling locations with respect to U sources, and the results of Pérez-Reyes et al. [29] and Pérez-Reyes et al. [30], stressed the importance of characterizing the fragmented material produced by the weathering of U ore. Consequently, the study of the density of U mineral particles in the fine sand sedimentary fractions, as well as the morphology, elemental composition, identification, and phase distribution in these particles, are presented in the following sections.

3.3. Quantification of U Particle Density

The density of U particles was assessed for five samples selected from the study area. Figure 8 shows the location of samples relative to the streams and the sources of U minerals. The particle density results are presented in Table 3.
The characteristics of the sampling sites and/or samples are as follows. Sample Puerto 3 is issued from the drainage pattern of the Margaritas mine (open pit) and of the Puerto 3 underground mine. Sample Nopal 1-d was extracted from a tributary of the El Tigre stream, which collects water and sediment from the Nopal 1 deposit. Sample Tigre 5, the one with the lowest particle density, was withdrawn from the El Tigre stream bed and is not directly influenced by any mining project. Samples APB-11 and APB-12 were taken from the Peña Blanca stream, approximately 100 m and 1 km from the Peñón Blanco mining project. In the case of the last three samples, it was observed that the closer the sampling site is from the mining projects, the higher the particle density is.

3.4. Morphology and Composition of Individual Particles

As previously mentioned, the weathered U mineral particles, which were collected at the APB-11 site from the fine sand fraction, were extracted following the procedure described in Section 2.3, and submitted to morphological and elemental analyses. The nature of their matrix was also investigated.

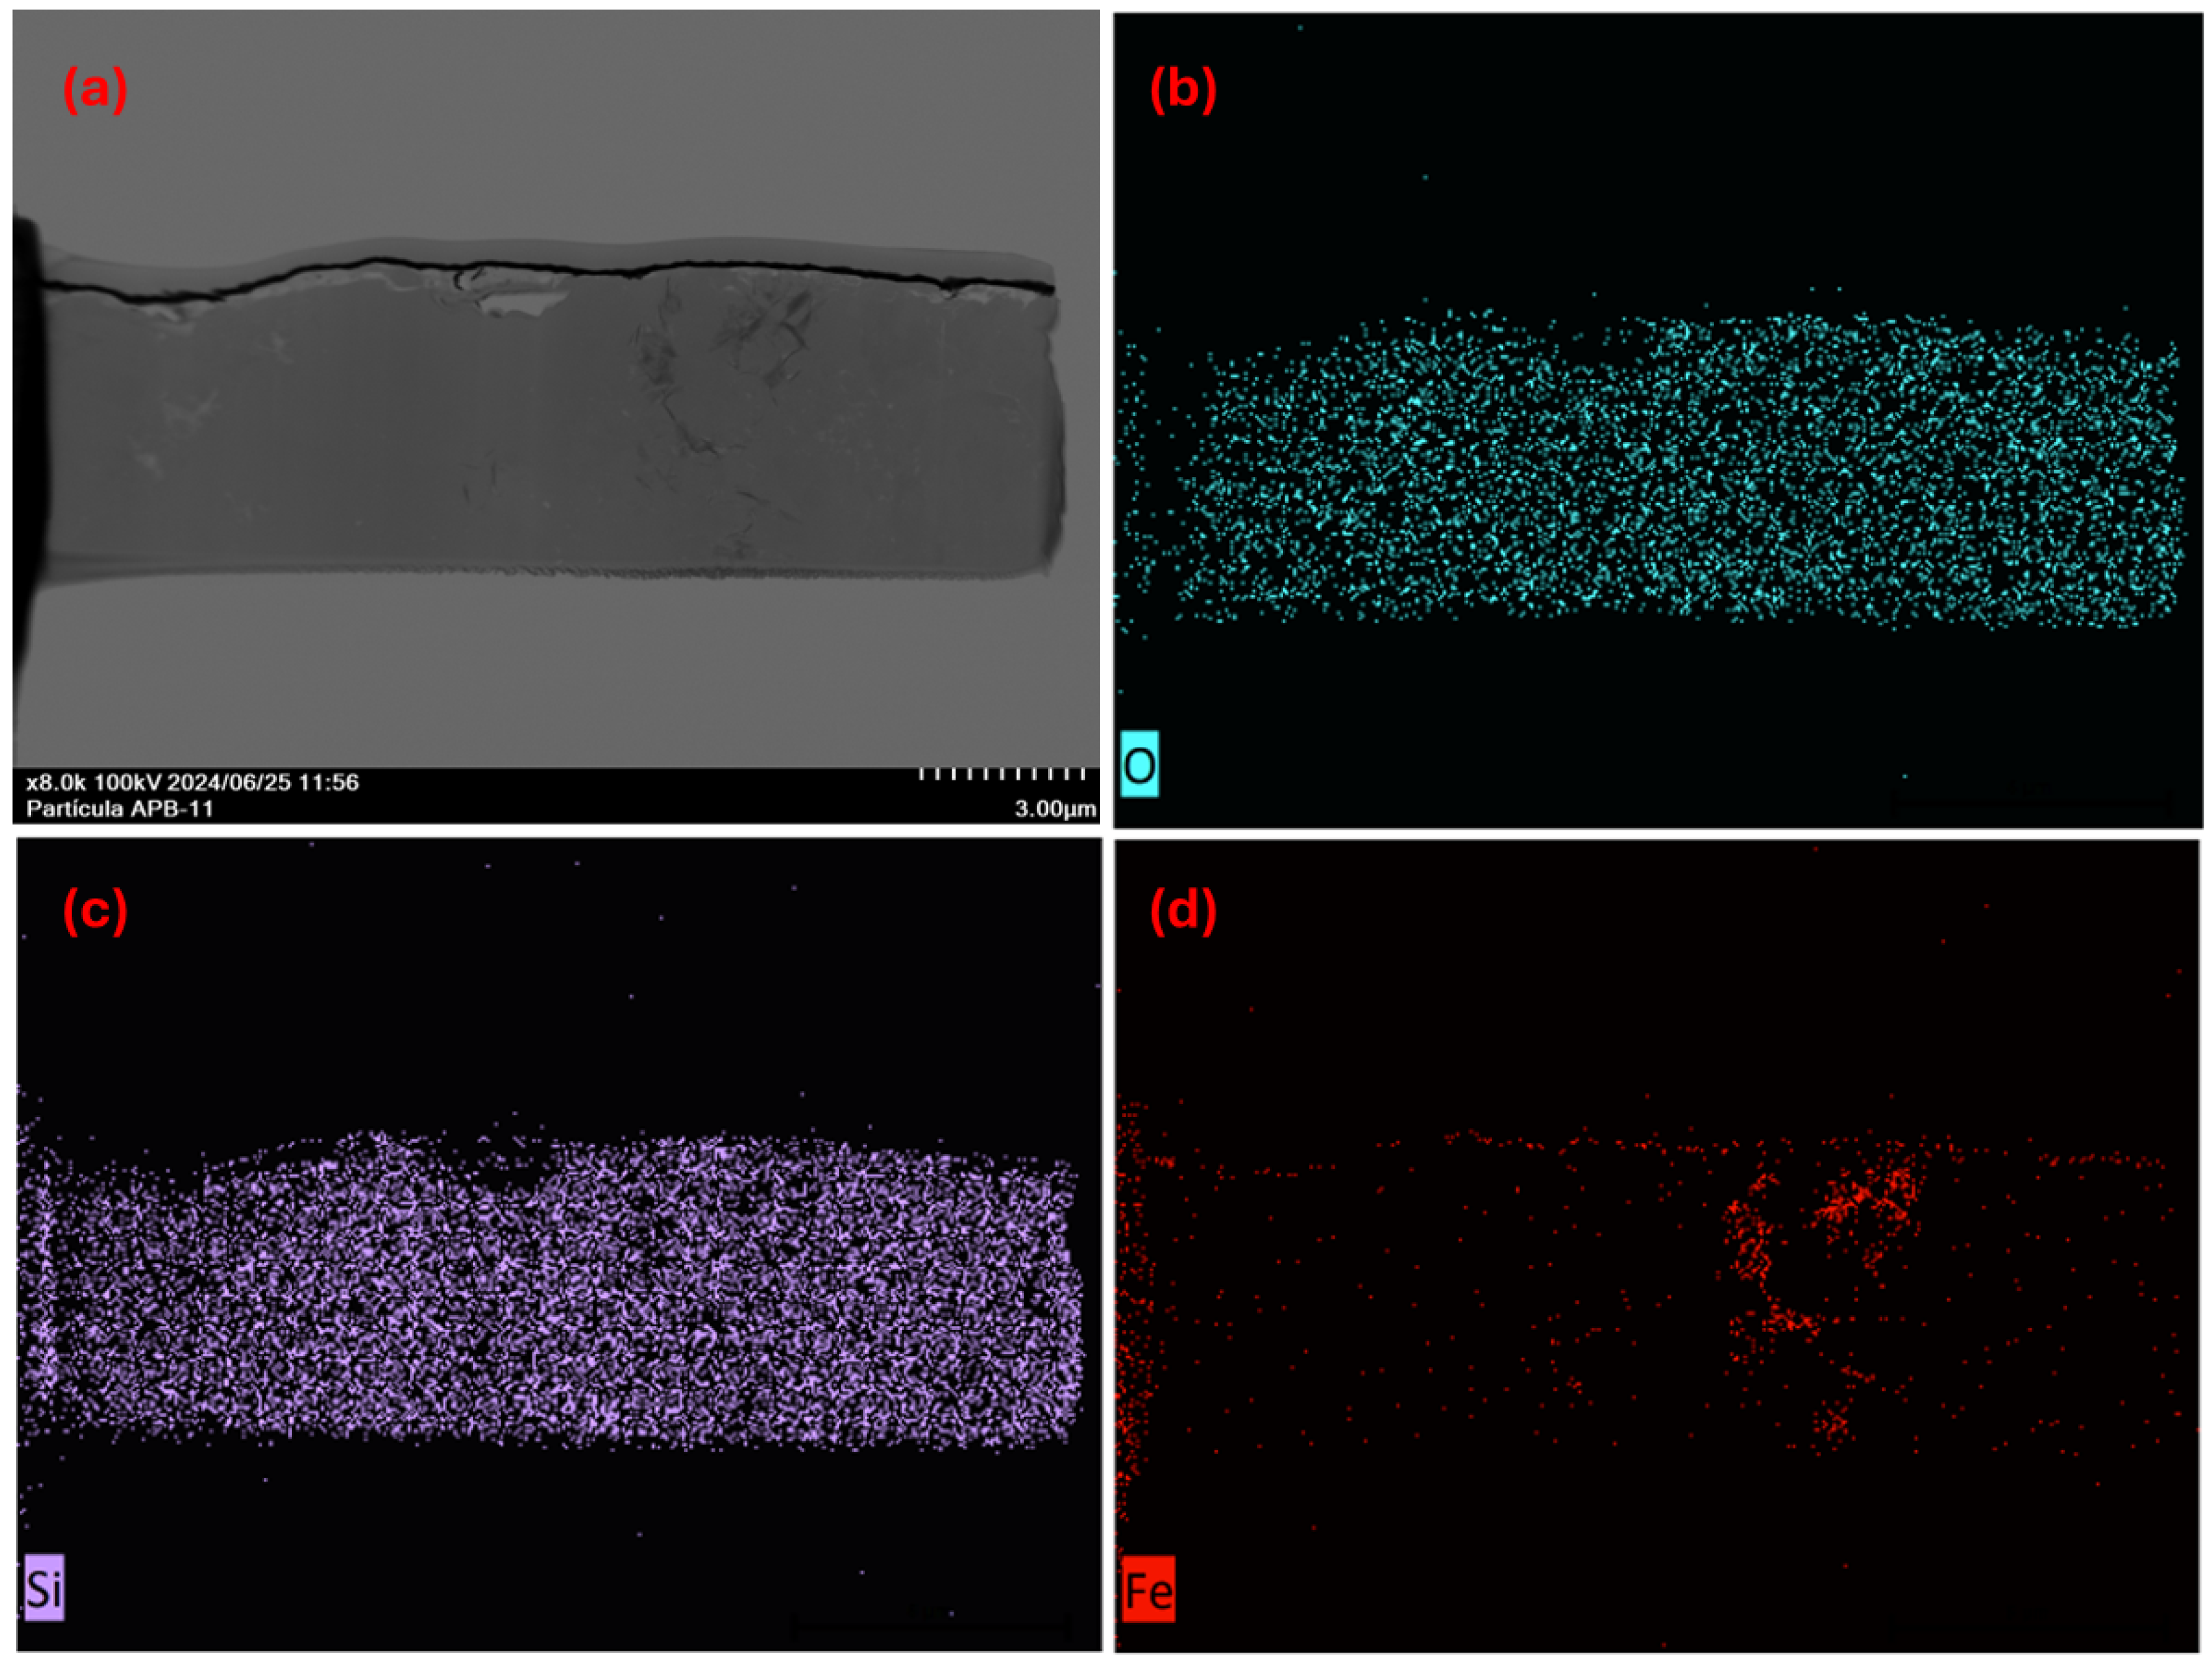
3.4.1. Microscopic Characterization of Fragmented Mineral Particles by FIB-STEM

Figure 9a shows the slice selected from the particle which was cut using the FIB technique. The STEM analyses in Figure 9b–d show the elemental content, which corresponds to the elements of the phases present in the sediments (see Section 3.1). Figure 10 presents the elemental spectrum obtained by STEM-EDX.
The elemental content of the APB-11 fluorescent particle slice revealed the elements O and Si as the major components, as well as Ga, Au, and Fe (Figure 9b–d and Figure 10). The spatial distribution of Ga and Au indicates that they are contaminations produced by the FIB cutting process and are sample preparation artifacts. Iron is concentrated in some regions of the slice and appears to be embedded in the particle, probably as iron oxides (Figure 9d). The concentration of Th and U is below the detection limit (Figure 10). The high concentration and spatial distribution of O and Si suggest that the analyzed slice is part of the silica coating of the particle.
Quartz was previously reported in the sediments of the region by Hernández-Hernández and Pérez-Reyes et al. [28,29] in the Boca la Colorada stream and by Rodríguez-Guerra [27] in the El Tigre stream. Magnetite was found in the Boca la Colorada stream by Pérez-Reyes et al. [29]. Both phases were identified in this study through X-ray diffraction (XRD) (Table 1). The sample section analyzed revealed no U or Th. However, the particle is fluorescent and therefore consists primarily of U mineral and silica. The selected slice is more representative of the coating than of the U mineral in the particle.

3.4.2. X-Ray Absorption Spectroscopy (XAS)

X-ray Absorption Spectroscopy (XAS) measurements were performed at the U-LIII edge to determine the environment and speciation of U in fragmented mineral particles of the Nopal 1 sample. X-ray absorption fine structure spectra were acquired, with the X-ray Absorption Near Edge Structure (XANES) domain employed to distinguish between U(IV) and U(VI) species, and the EXAFS domain used to identify the mineralogical phase. The working hypothesis was that these particles are formed by uranophane minerals (any variants of), which are the most abundant minerals in the Nopal deposit, followed by weeksite [9].
Figure 11 shows the normalized U-L3 XANES spectra of Nopal 1 particles and of the references parauranophane (Ca(UO2)2(SiO3OH)2·5H2O, with U(VI), and U oxide UO2 with U(IV). The position of the absorption edge in the XANES spectrum is an indication for determining the mineral phase forming the particles, or at least for the oxidation state of U in the sample. The XANES spectra of Nopal 1, parauranophane, and U oxide exhibit an absorption edge at 17,179 eV, 17,179 eV, and 17,177 eV, respectively. In addition, the spectra of parauranophane and Nopal 1 show an additional feature at higher energy, around 17,188.7 eV. These are characteristic of the U(VI) oxidation state, as reported in [53,54].
Figure 11b shows the k3-weighted EXAFS spectrum obtained at the U-L3 edge for parauranophane. The main oscillations between 2 and 10 k (Å−1) are similar to those obtained in the measurement of Nopal 1 (Figure 11d, black line).
The uranophane structural model [55] was applied to fit the experimental EXAFS spectrum of the particulate mineral sample. Figure 11c,d present k3-weighted EXAFS spectra, the Fourier transforms, and corresponding fits for the Nopal 1 sediment sample. The peaks at a bond distance around 1.3–1.8 Å are typically attributed to backscattering from the oxygen atoms the closest to U (U_Oax), while the peaks around 1.8–2.3 Å correspond to the five equatorial oxygen atoms (5U-Oeq). A peak at 3.1 Å is assigned to backscattering from the nearest silicon neighbor. The best-fit parameters are summarized in Table 4. They are consistent with the interatomic distances in the uranophane crystal structure [54], and with results of previous work [30] on typical sediments of this region. Figure 11d shows the main undulations in the k-space from 2 to 10 k (Å−1). These features are in agreement with those previously reported [54,56] for uranophane.
These EXAFS results, combined with those obtained on the elemental composition of the particle matrix (Section 3.4.1), are aligned with the chemical environment described for such mineral veins [9] (see Figure A7 in Appendix D) and with the limited dissolution rate properties found for mineral fragments of SPB [30]. Altogether, these confirm that the particles consist of uranophane enclosed by or imbricated within silicate minerals.

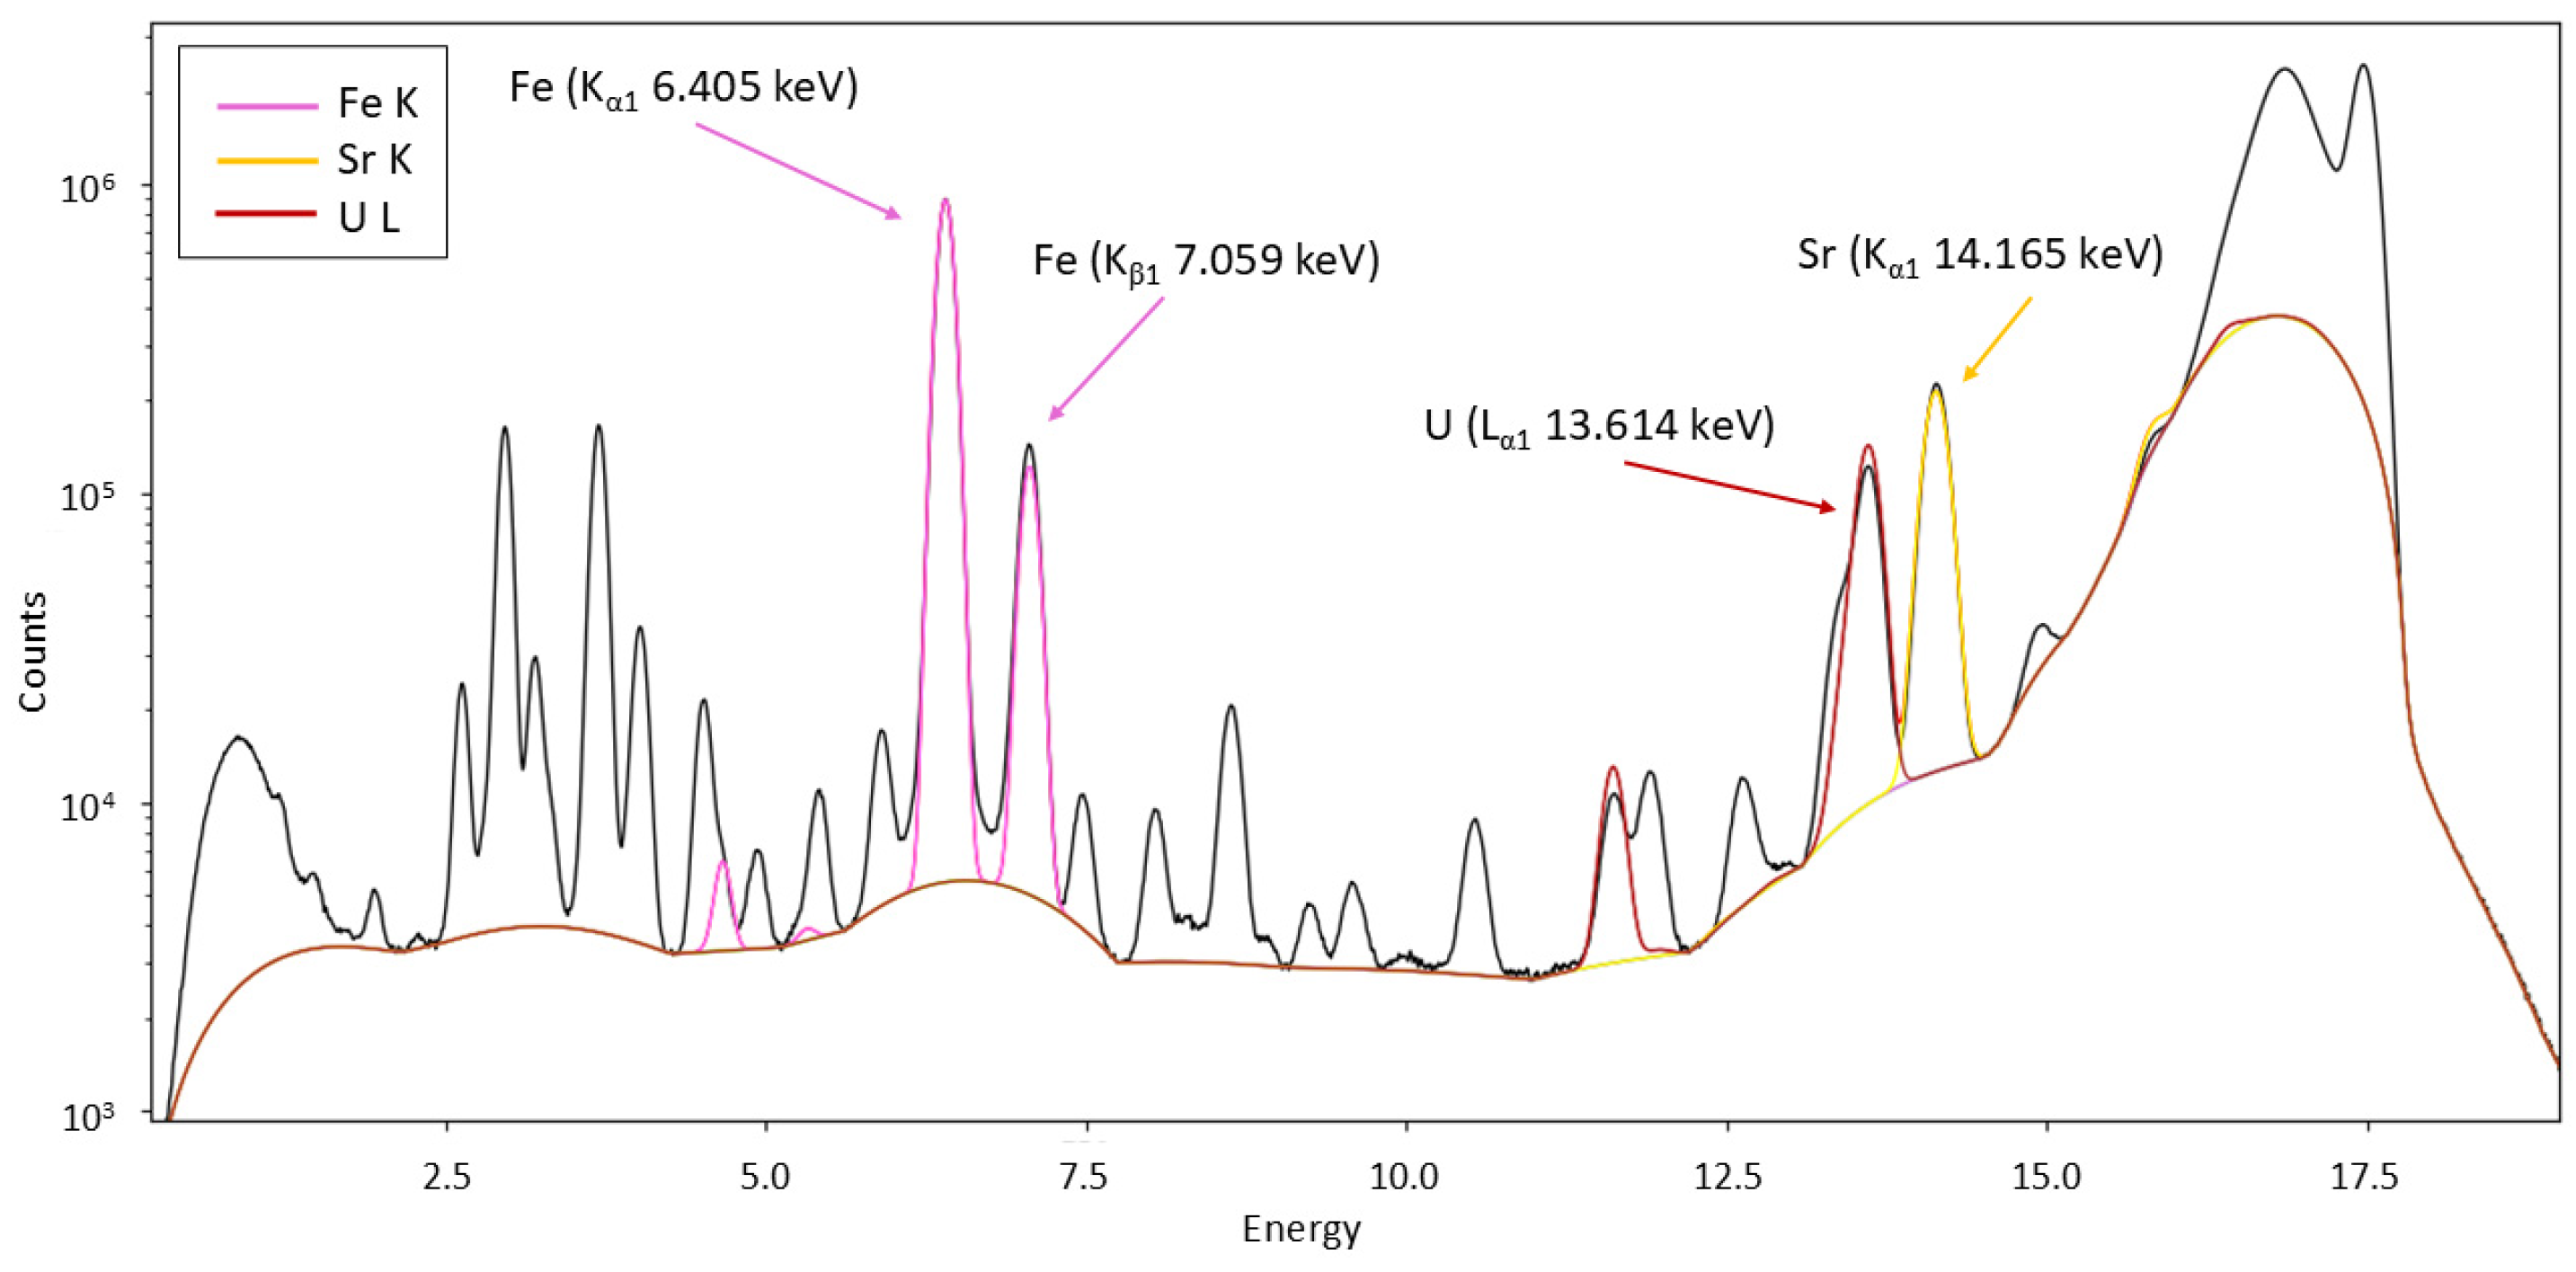
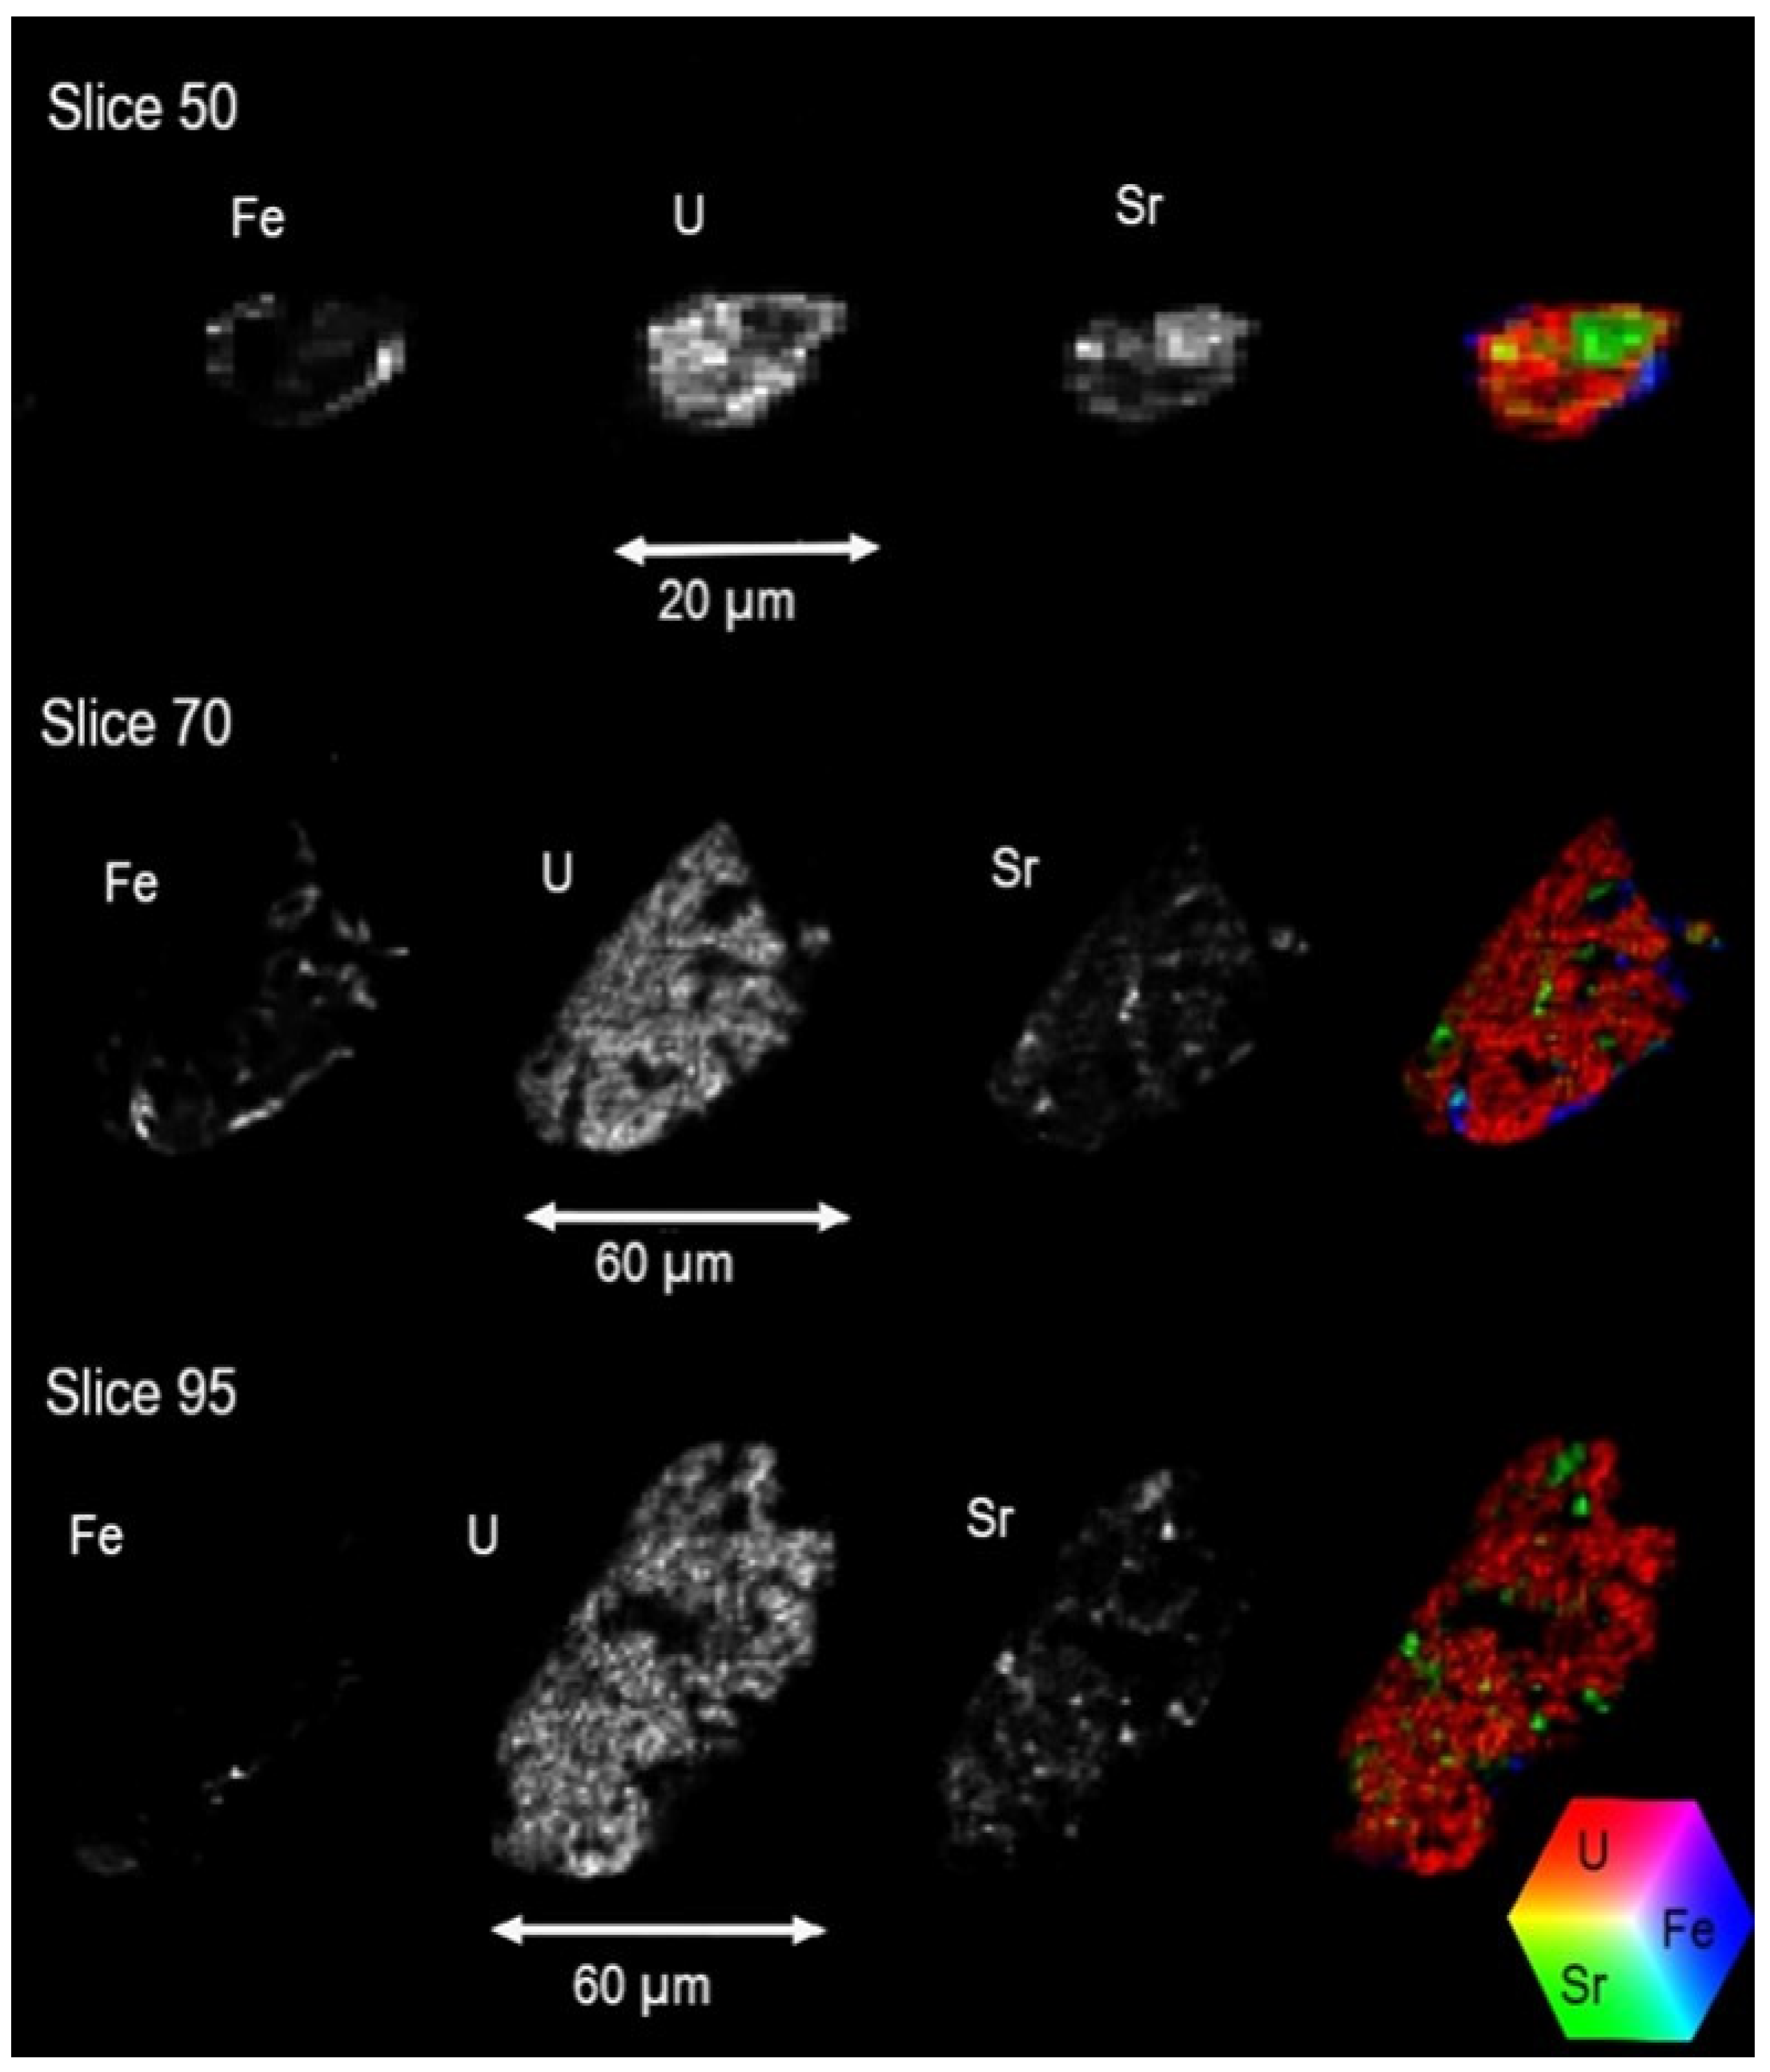
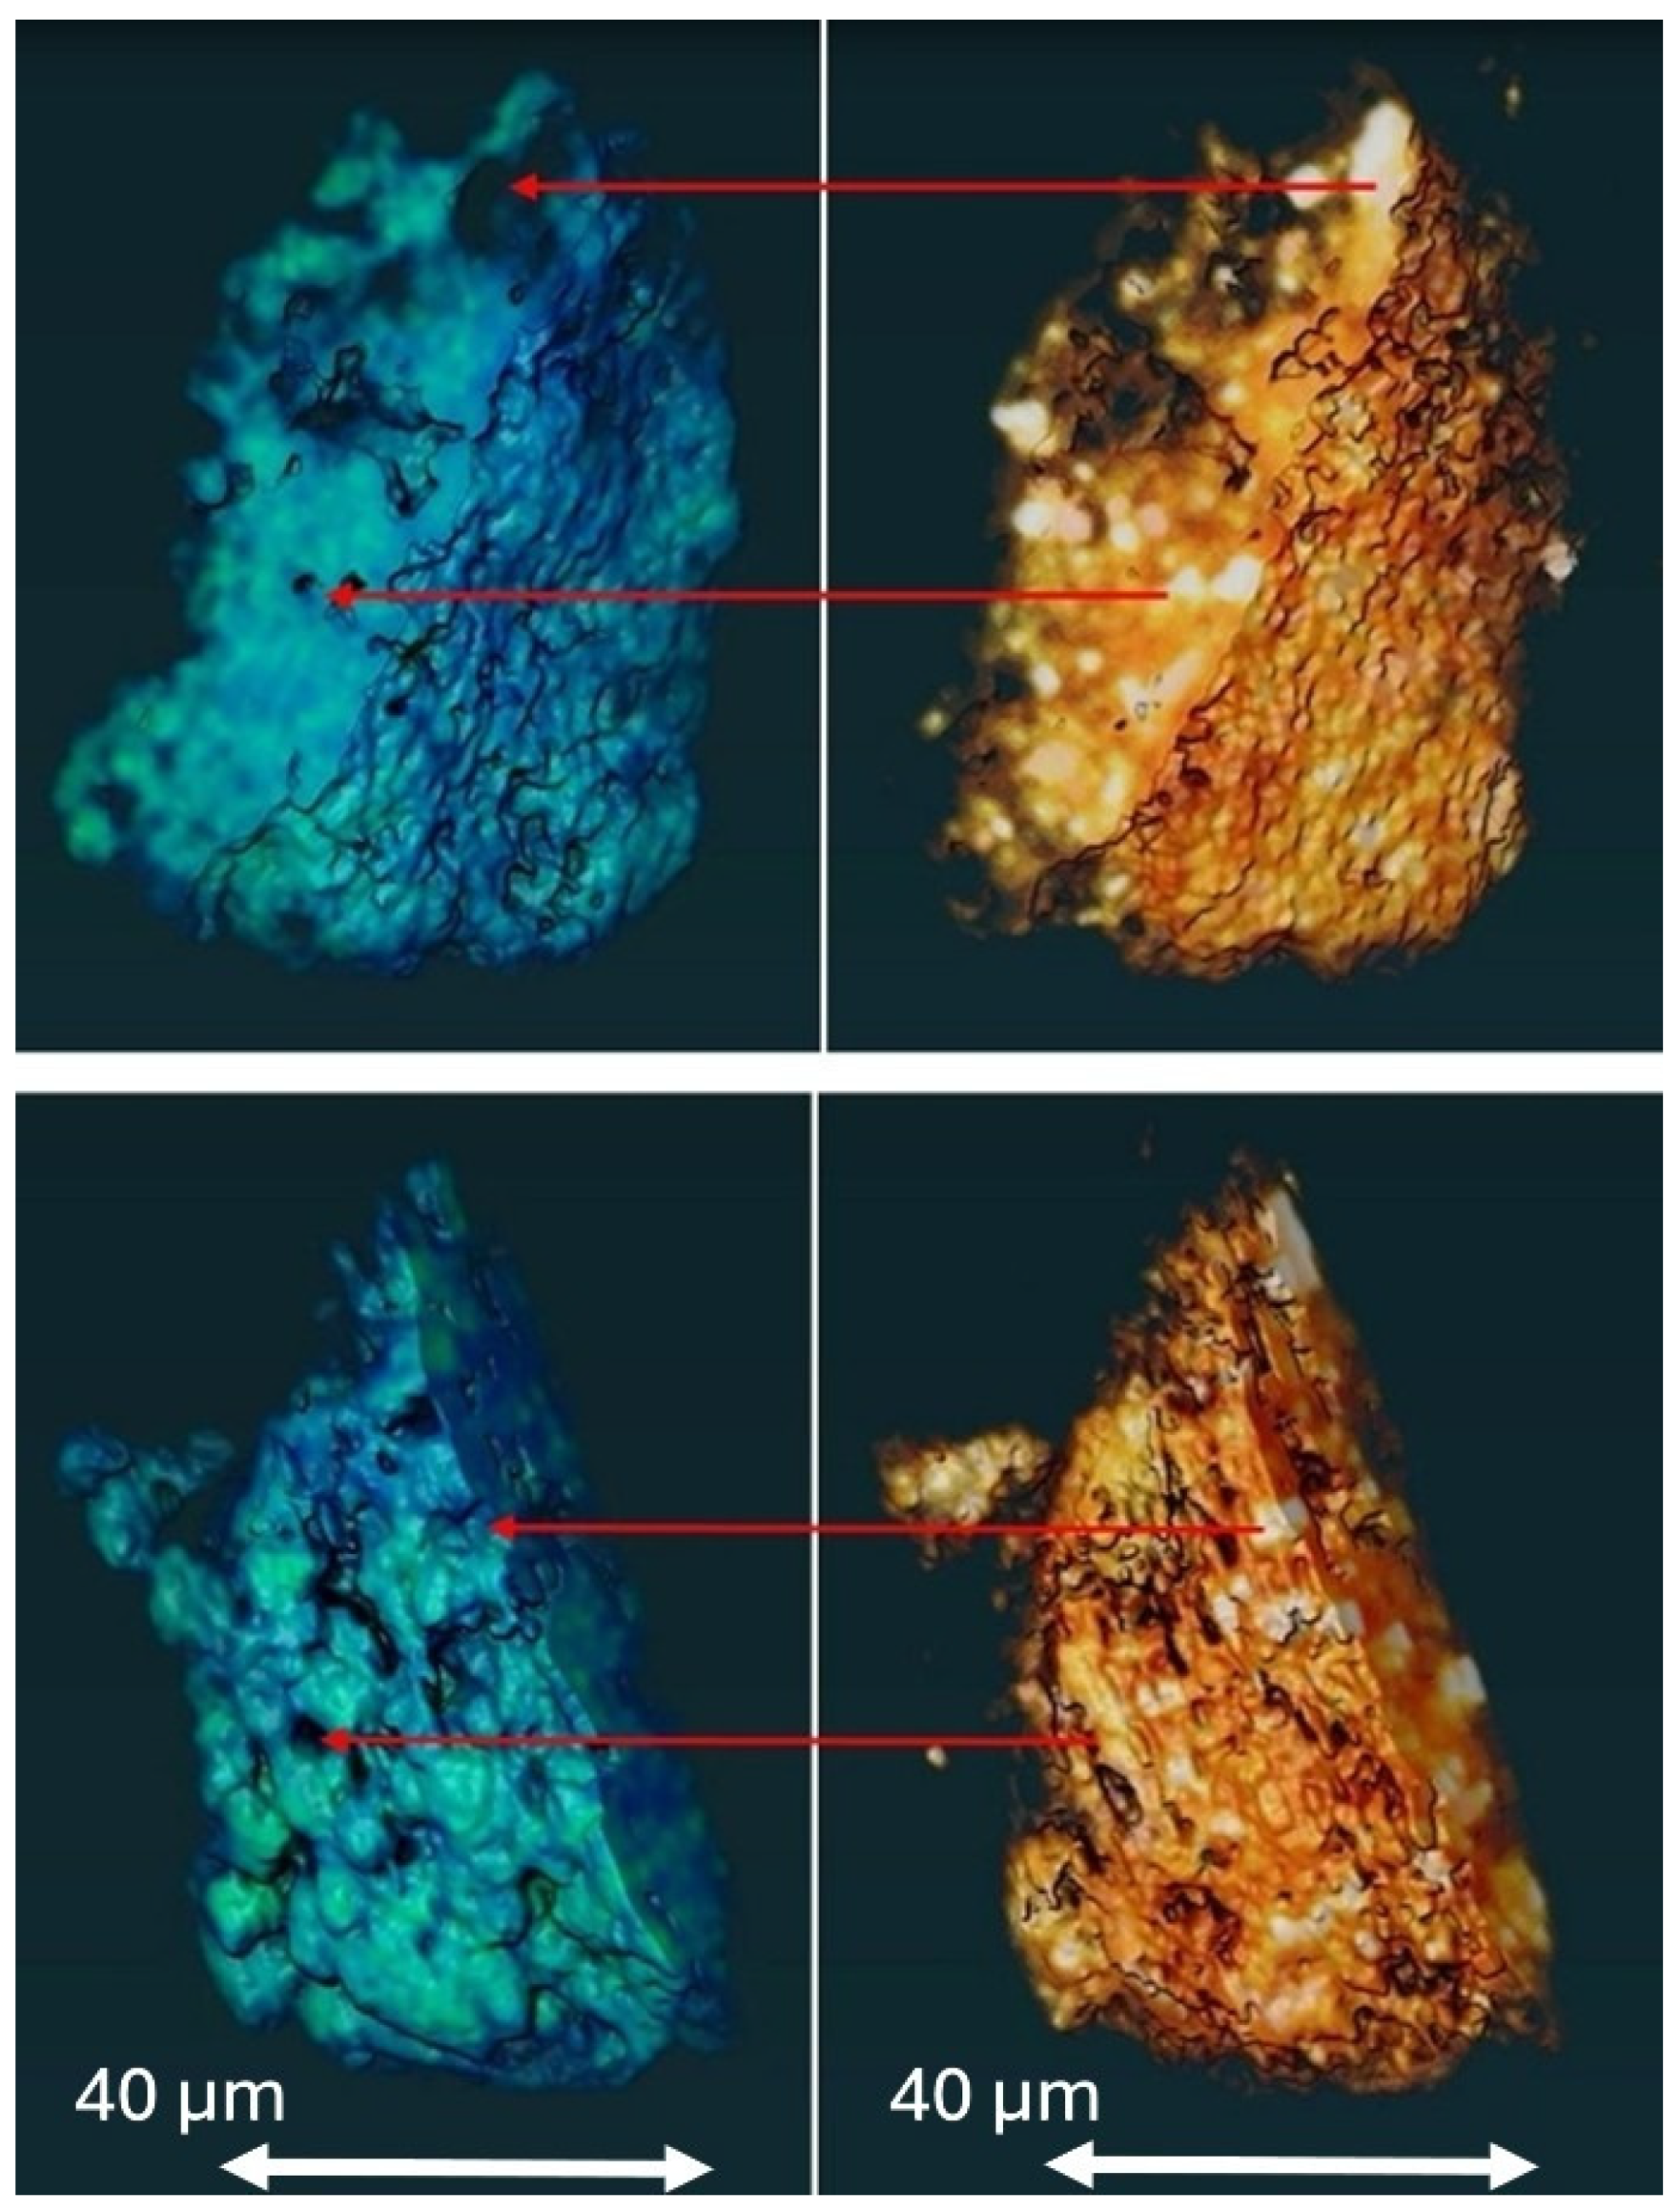
3.4.3. X-Ray Fluorescence MicroTomography (XRF-µCT)

The fluorescent particle separated from sample APB-11 was analyzed by XRF-µCT at beamline I18 (DLS). The fluorescence spectra obtained at each rotation were examined and fitted, allowing for the identification of the sample’s elemental composition as obtained for an excitation energy of 17.5 keV.
The main elements found in the selected particle are Cl, K, Ca, Ti, Cr, Mn, Fe, Co, Cu, Zn, Ga, As, Br, Rb, Sr, Y, Pb, and U. As the analysis was performed under ambient conditions, with Ar third most abundant gas in air, the detection of lower Z elements, such as Si, was impaired as strongly absorbed between the sample and the detector. As previously discussed, Si was expected as a component of the particle matrix, but even though Si lines were detected in the spectrum (cf. defined peak in Figure 12 at 1.74 keV), these are not reliable, the XRF detector itself, an SDD, being made of silicon. Figure 12 shows one of the XRF spectra obtained for an area of the particle containing U. The elements that were of particular geological significance and which presented the most intense X-ray lines in the spectrum, i.e., Fe-Kα, Sr-Kα, and U-Lα were selected, their volume reconstructed, and some representative slices of this volume extracted.
Figure 13 displays different virtual cross-sections extracted from the particle’s reconstructed volume and illustrates the spatial distribution of U within these slices. Fe appears to encapsulate U, suggesting its presence in the particle matrix. This observation is consistent with the STEM results observed in Figure 9d.
The Supplementary Information contains three videos showing the U and Sr localization within the particle volume. The file “U_Sr_slices.mpg” presents each slice sequentially, one by one. The file “U_Sr_particle_slicing.mpg” shows the consecutive superposition of the slices until forming the analyzed volume. The file “U_Sr_particle_rotation.mpg” presents the volume of the particle rotating on a vertical axis. In the last two videos, the blue color corresponds to U, and the orange color represents Sr. Figure 14 compares two rotations of the reconstructed volumes.
The spatial distribution of Sr in the particle is essential in this research. As an alkaline earth element, Sr may replace Ca in natural matrices and thus may indicate the presence of Ca and/or Sr crystalline phases in the samples. As visible in Figure 13 and Figure 14, Sr was, in some areas, detected at the same positions as U but also independently from U. This suggests that Sr is incorporated into uranophane (Ca(UO2)2(SiO3OH)2·5H2O) within the particle, whereas for the areas of greater Sr intensities, which are independent of U signal, Sr would point towards the presence of calcite (CaCO3) in the matrix that surrounds the particle, or is entangled in it.
This APB-11 sample exhibits results consistent with the EXAFS results presented in Section 3.4.2, which were obtained for particles from the Nopal 1 sample, where the primary U-bearing phase was identified as uranophane. Uranophane, together with parauranophane and weeksite, was previously reported [9] in samples issued from the Nopal 1 mine.

4. Discussion

The importance of characterizing the source and the transport of U in the environment is undeniable. U mining-related activities, such as those that took place in the Peña Blanca mining district, have the potential to affect air, surface, and groundwater qualities, soils, fauna, and biota, not to mention the impact on the food chain and on human health. Thorough characterization of minerals sampled from the sites surrounding the mines, their becoming, and transport when exposed to weathering is essential. Here, the study concentrates on the fine sand fraction originating from the main streams near the mining projects of the Peña Blanca mining district.
The XRD analysis of the finest fraction of fine silt + clay (Section 3.1) confirmed that quartz and potassium feldspars are the most abundant mineral phases [27,28,29]. This agrees with the geology of Peña Blanca reported by [6,7]; the area presents mainly volcanic rocks (tuffs) of felsic composition, with minerals such as quartz, feldspars, and iron oxides. Clay minerals such as kaolinite and montmorillonite are also found. These clays are important in a mining context as they present high adsorption capacities in their structure, including for U.
The determination of the particle density per gram in fine sand (1.19 mm < d < 0.279 mm) was performed through the evaluation of the concentration of activity of the 238U–226Ra disintegration chain (Section 3.3). Those values present a direct relationship with the distance between the sampling point in the drainage pattern and the mining projects. The analysis of the activity concentration of 214Pb in the Peña Blanca stream (Section 3.2) for the fine silt + clay particle size fraction and for the fine sand was shown to be consistent. The correlation between the sample and its location relative to the mining projects is observed again. The sample with the highest particle concentration is Puerto 3 (2500 ± 250 part./g), and it was taken from the drainage pattern of the Margaritas (open pit) and Puerto 3 (underground) mines. The results found for both particle sizes agree with the authors’ activity concentrations reported for samples sourced in the El Tigre and Boca la Colorada streams [27,28].
The use and combination of advanced micro-analytical techniques, such as STEM-EDX, or synchrotron radiation-based techniques, such as XAS and XRF- µCT, enable the characterization of small samples and of their heterogeneities on a micrometer scale in 2D and 3D spatial dimensions, even adding a 4D linked to elemental (XRF) or structural (XRD) information. Such a strategy has already been employed for the study of U mineral particles from abandoned U mines and has led to a wealth of information [57]. Similarly, our elemental and morphological study from the particle (Section 3.4.3) provided in-depth information, at the microscale, of the U mineral present in SPB fine particles, as well as their heterogeneous composition and characteristics. Although the synchrotron-based studies were limited in terms of number of samples, with basically one sample investigated only by XAS and XRF-μCT, the results are nonetheless representative of fine particles found in SPB, especially as all other laboratory investigations were performed on a relevant number of samples, as mentioned in Section 2.1. Taken together, the results confirmed that the U mineral is uranophane (Ca(UO2)2(SiO3OH)2·5H2O) and that U is found under oxidation state U(VI). Uranophane is surrounded by a silica-based matrix with elemental impurities such as Sr (Ca) and Fe (and their associated crystalline forms). The selected particle itself, however, presents some heterogeneous mixture of phases even at the microscopic level, as revealed by XRF-μCT. The presence of uranophane in our samples and its silicon matrix explains why there are no high concentrations of U activity in samples far from U sources. Indeed, in this form, U is unavailable or very little available for transport in solution as its matrix does not dissolve easily. Consequently, the access to and release of U would be naturally very limited. Schindler et al. [15,16] also studied uranium and silica samples from SPB and concluded that U can be retained for millions of years within these opal and microcrystalline quartz assemblages.
Although silica phases have very low solubility at acidic and circumneutral pH, being about 100 mg L−1 [58], future studies could consider the potential effects of physical weathering processes, such as storm events, on silica-coated uranophane particles in SPB. However, in groundwater, there could be the possibility of alkaline conditions that favor the dissolution of silica, e.g., [59]. Nevertheless, in the intermittent streams of SPB, the residence time of the surface water is a few days. The mean annual precipitation is 235 mm [11], and the vaporization rate can be up to 2400 mm [60], which is not enough to change its neutral conditions.

5. Conclusions

In this work, U mineral particles were extracted from the fine sand sampled in the drainages of SPB main U deposits. Those particles were quantified, and their morphology, structure, and elemental content, as well as the U speciation, were investigated.
Using gamma spectrometry, the density of particles of that sedimentary fraction was estimated, and it was shown that the concentration of mineral particles is higher in the areas close to the mining projects. Similarly, the concentration of 238U activity decreases as the sampling point moves away from the main streams towards Laguna del Cuervo.
The analysis of the composition and morphology of the U particles by FIB-STEM showed the predominance of Si in the matrix that surrounds or is imbricated with the U. The analysis of the XAFS spectra determined the U oxidation state U(VI) in the form of uranophane. XRF-µCT elemental volumes revealed that Sr is part of the matrix of the sample and of the fragmented U mineral. Its presence, conjointly with the one of U, suggests that Sr may replace Ca in the uranophane structure (Ca(UO2)2(SiO3OH)2·5H2O). The particle is covered by a matrix abundant in Si, Ca, and in other elements such as Fe and Sr. The morphology and composition of the particles are in agreement with SPB geology, as described by various authors, who report uranophane as the most abundant U mineral in the deposit and the presence of many silicates and aluminosilicates composing the sedimentary igneous rocks.
The fragmented uranophane in the particle surrounded by a matrix composed of Si, Ca, Sr, and Fe explains why the concentration of 238U activity in the sediments of the areas near the mines is high and decreases as they approach the floodplain. The matrix is also responsible for the low dissolution of the U mineral. Nonetheless, if the water finds structural barriers and reducing conditions on its way, such as organic matter from the floodplain or stagnant rainwater, U can be adsorbed or eventually precipitated locally. In conclusion, the transport of U minerals through the SPB drainage pattern occurs via fragmentation of particles, and the water does not carry high U activity concentrations.

Supplementary Materials

The following supporting information can be downloaded at https://www.mdpi.com/article/10.3390/min15040333/s1, U mineral particles SPB.rar: Video S1: U_Sr_slices.mpg; Video S2: U_Sr_particle_slicing.mpg; Video S3: U_Sr_particle_rotation.mpg.

Author Contributions

Conceptualization, C.H.-H. and M.-E.M.-C.; methodology, C.H.-H., Y.R.-G., V.P.-R., F.G.F.-G. and R.M.C.-L.; validation, C.H.-H., D.M.E., M.-E.M.-C. and J.G.C.-T.; formal analysis, C.H.-H., Y.R.-G., V.P.-R., F.G.F.-G., D.M.E. and J.G.C.-T.; investigation, C.H.-H., Y.R.-G., V.P.-R., F.G.F.-G., H.E.E.-P., R.M.C.-L. and K.I.; writing—original draft preparation, C.H.-H., F.G.F.-G., D.M.E., J.G.C.-T. and M.-E.M.-C.; writing—review and editing, C.H.-H., K.I., D.M.E., H.E.E.-P., J.G.C.-T. and M.-E.M.-C.; project administration M.-E.M.-C.; funding acquisition, M.-E.M.-C. All authors have read and agreed to the published version of the manuscript.

Funding

This research was funded by the CONAHCYT research project CF/2019 10853.

Data Availability Statement

Data are contained within the article, and the associated materials are in Appendix A, Appendix B, Appendix C and Appendix D and Supplementary Materials.

Acknowledgments

The authors thank CONAHCYT for funding the CF/2019 10853 project. This work was published with the support of the Advanced Materials Research Center. We extend our thanks to Jorge Carrillo Flores, Oscar Omar Solís Canto, César Cutberto Leyva Porras, Marco A. Ruíz Esparza Rodríguez, Roal Torres Sánchez and Andrés Isaak González Jáquez from CIMAV, to Ignacio A. Reyes Cortés from Universidad Autónoma de Chihuahua, as well as to J.F.W. Mosselmans and S. Diaz-Moreno from Diamond Light Source for their technical and scientific support. The authors also thank Rene Emmanuel Parada Barrios, from the Instituto Tecnológico de México I in Chihuahua, for his experimental support in the separation of fluorescent particles. The XAS and XRF-µ-CT measurements were conducted as part of proposals SP31873, SP31884, and SP38007 at beamlines B18, I20-scanning, and I18 of Diamond Light Source, UK. We sincerely appreciate the beamlines staff for their assistance.

Conflicts of Interest

The authors declare that the research was conducted in the absence of any commercial or financial relationships that could be construed as potential conflicts of interest.

Correction Statement

This article has been republished with a minor correction to the Acknowledgments. This change does not affect the scientific content of the article.

Abbreviations

The following abbreviations are used in this manuscript:
SPBSierra Peña Blanca
XRDX-ray diffraction
ICP-OESInductively coupled plasma atomic emission spectroscopy
FIBFocused ion beam microscopy
STEMScanning transmission electron microscopy
XASX-ray absorption spectrometry
XANESX-ray Absorption Near Edge Structure
EXAFSExtended X-ray Absorption Fine Structure
XRF-µCTX-ray fluorescence microtomography
CIMAVCentro de Investigación en Materiales Avanzados
SEMScanning electron microscopy
EDSEnergy dispersive X-ray spectroscopy
RMRietveld method
AbAlbite
AnAnorthite
CalCalcite
HlyHalloysite
KlnKaolinite
MagMagnetite
MntMontmorillonite
MsMuscovite
OrOrthoclase
QzQuartz
SaSanidine
DLDetection Limit

Appendix A. Details of the Materials’ Characterization

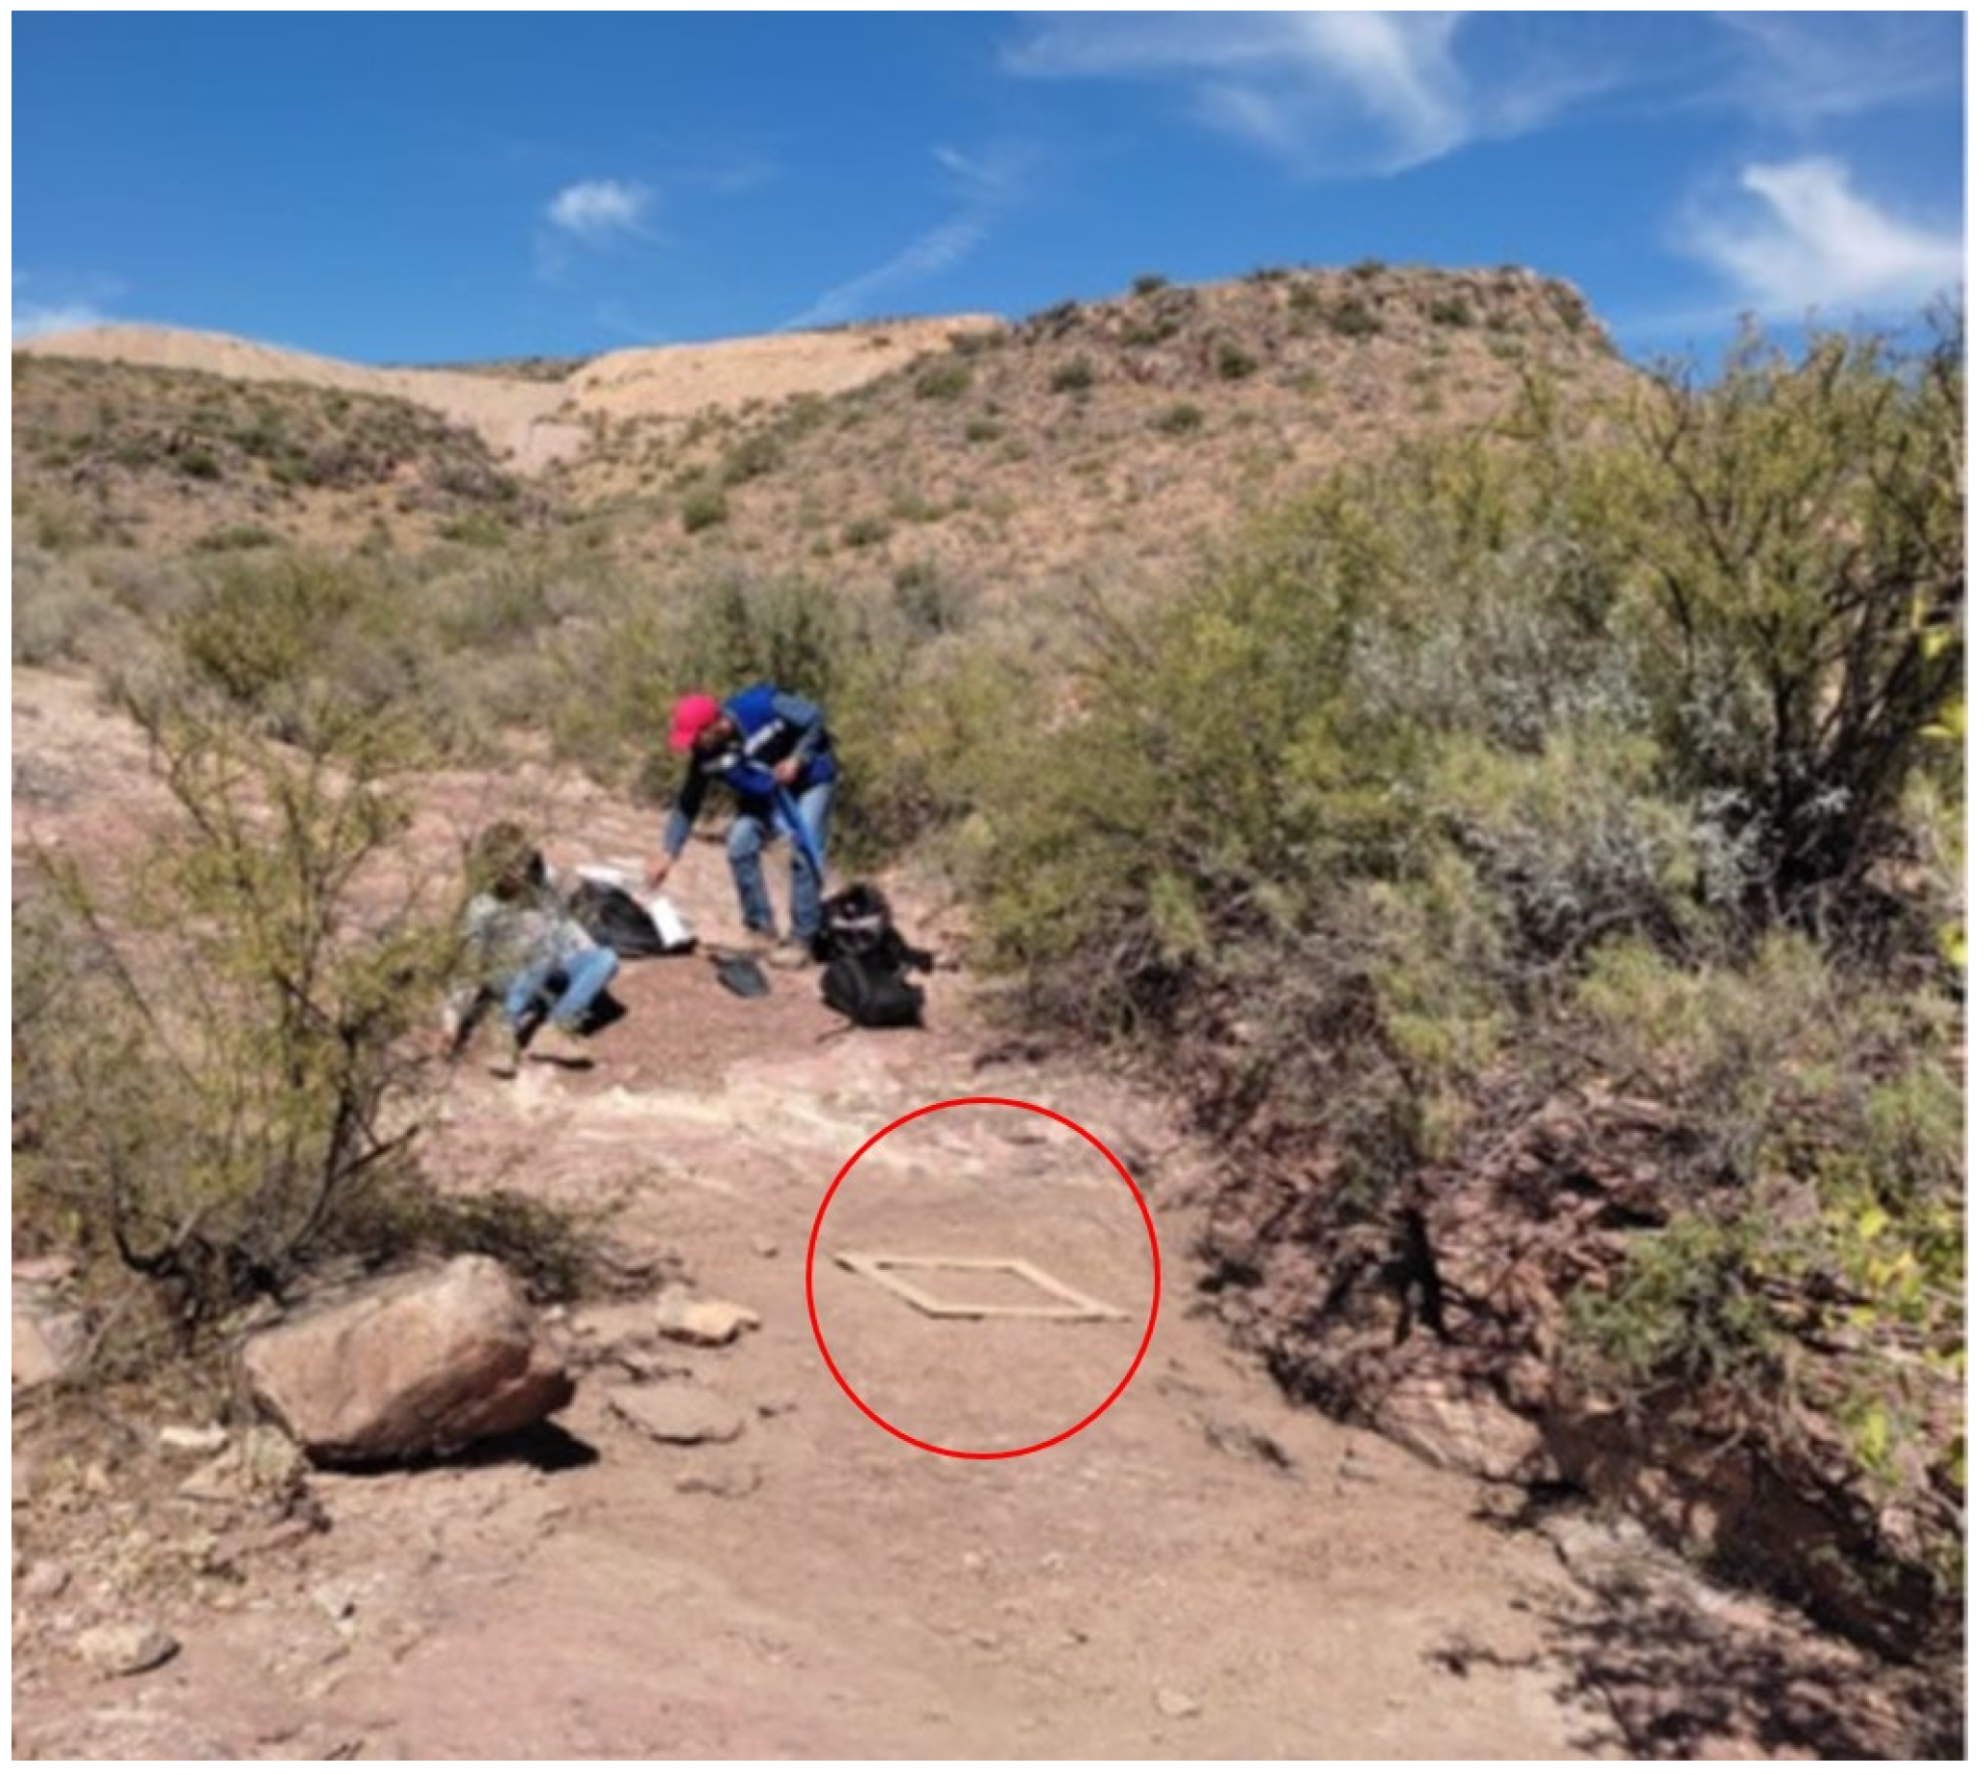
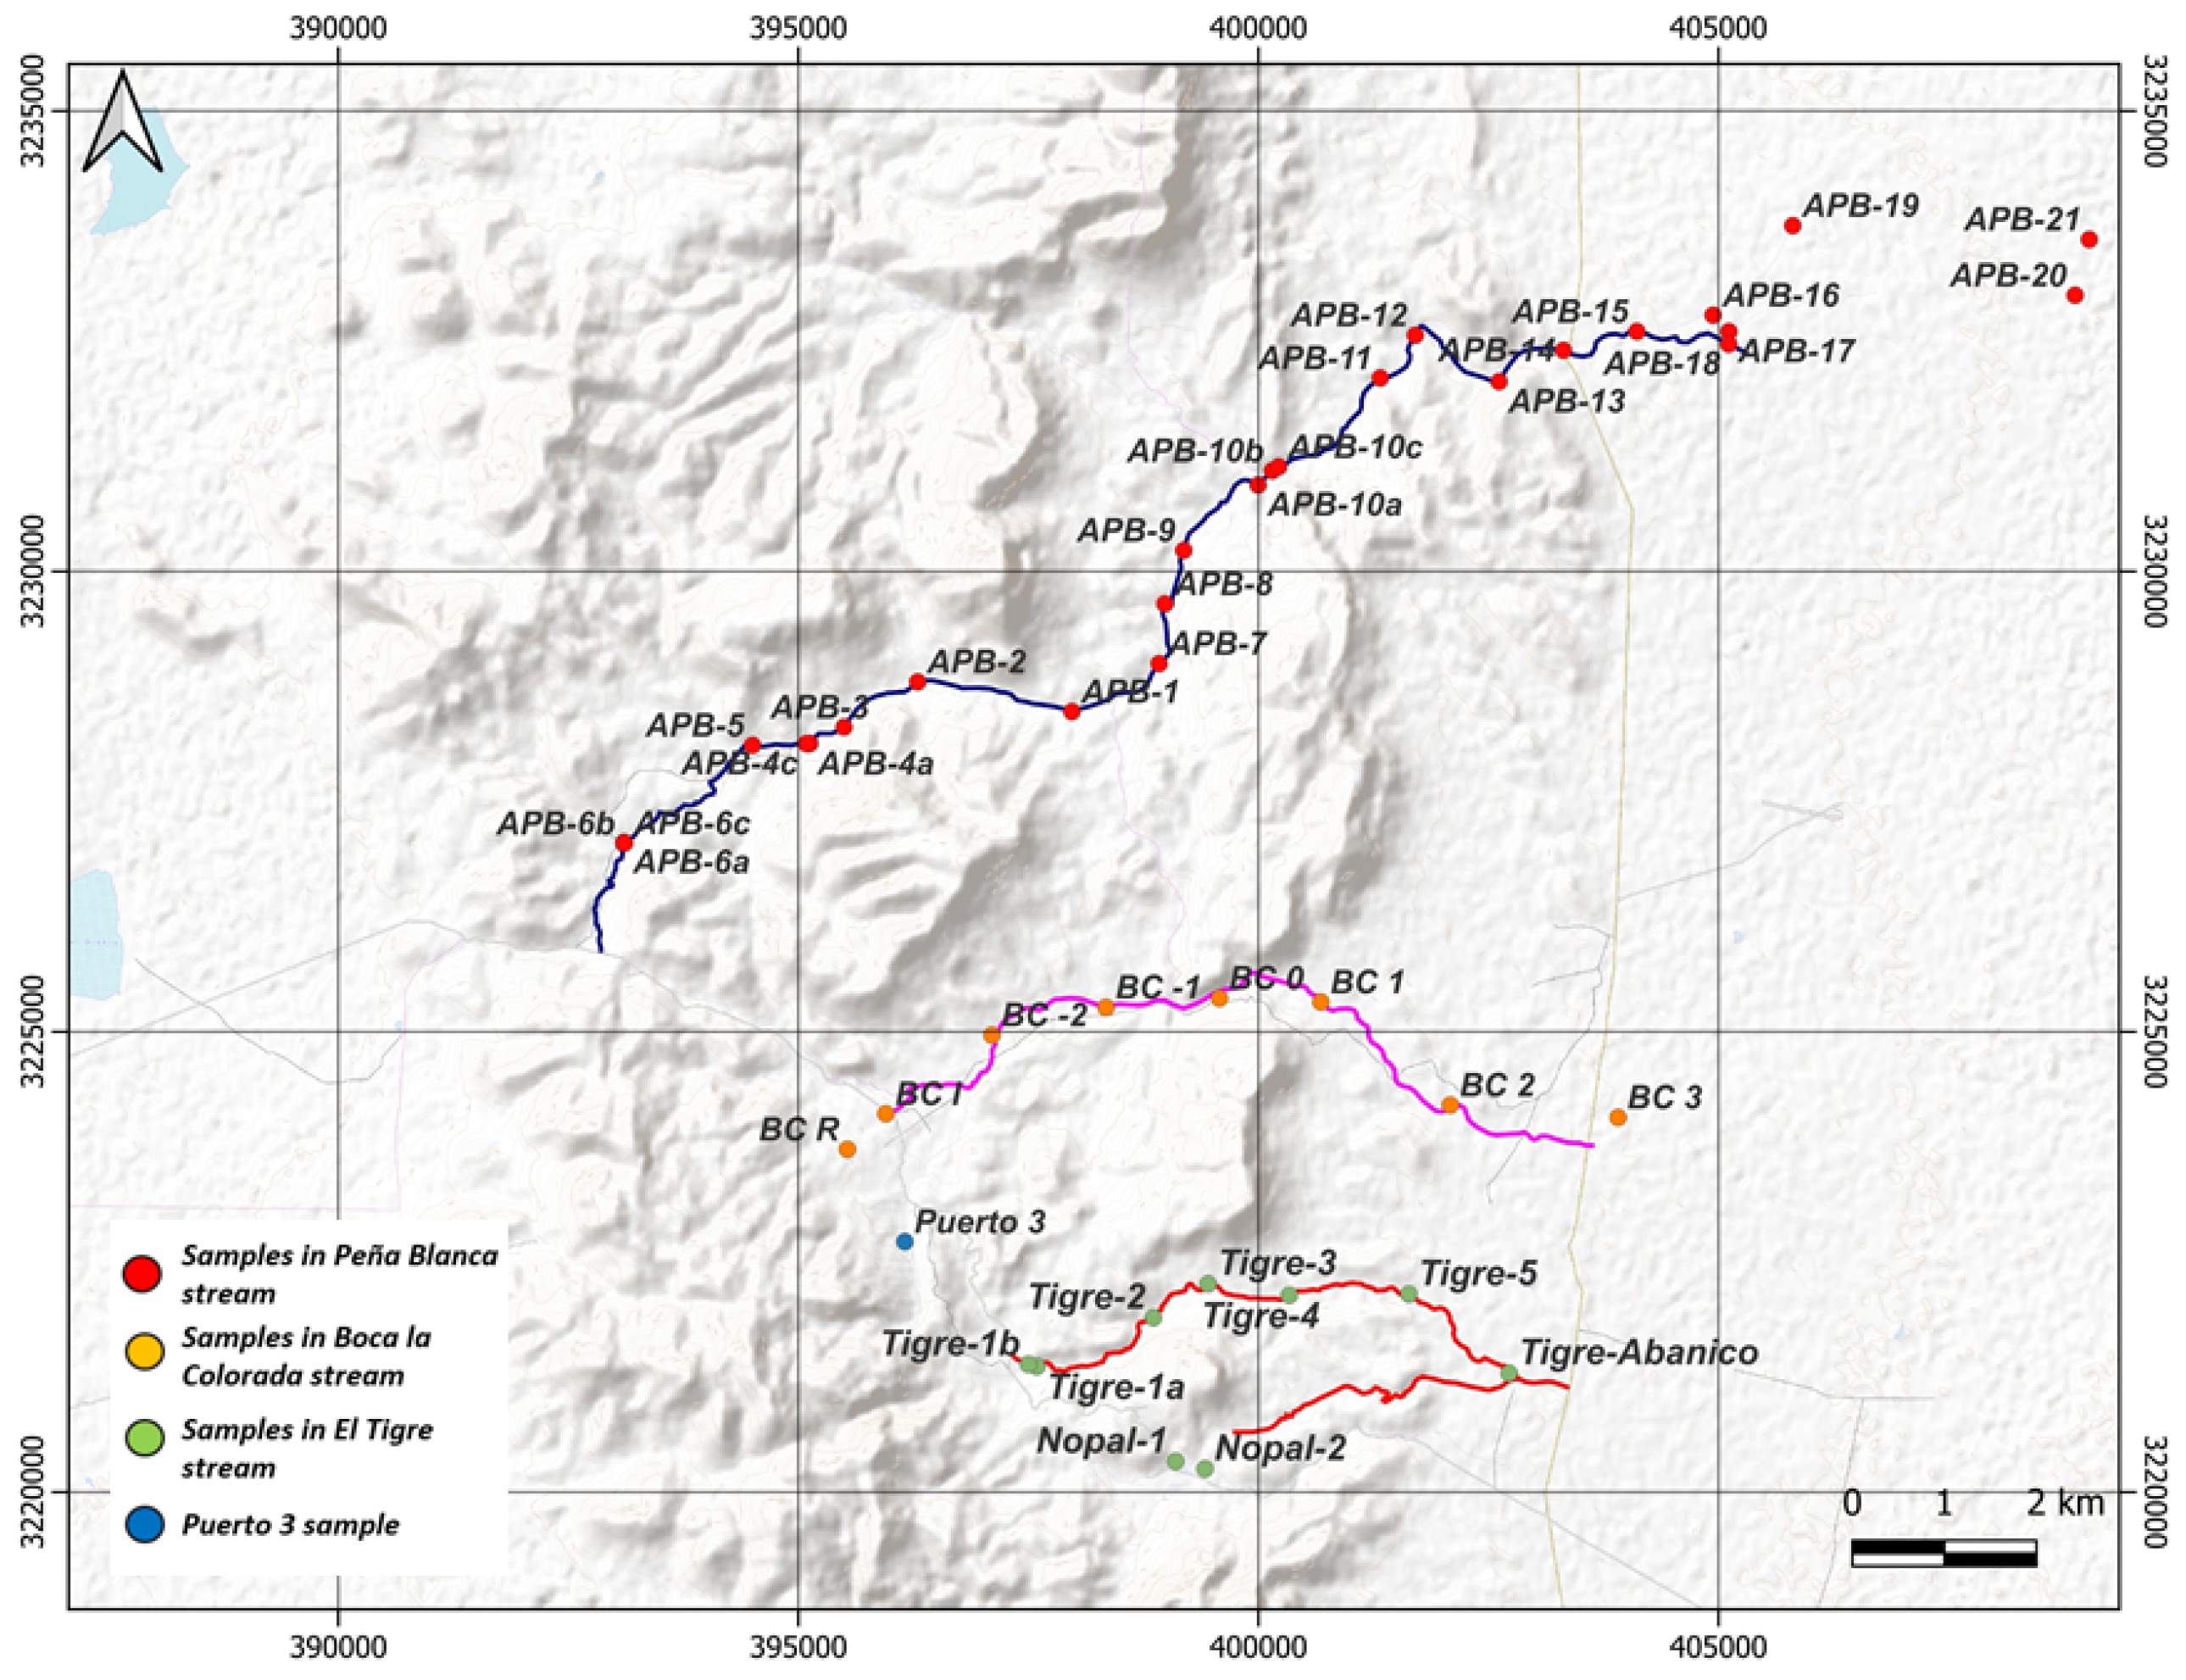
Appendix A.1. Sediment Sampling in Streams

Figure A1. Stream sediment sampling. At the bottom is the Nopal-1 mine (light-colored material cleared of vegetation). The distance between the mine and the stream is approximately 450 m. The material was taken from the stream (sand–silt–clay). The box within the red circle is a sampler that delimits a portion of sediment and allows for the removal of the surface part of it (approx. 5 cm).
Minerals 15 00333 g0a1

Appendix A.2. Calculation of Activities of the Isotopes 214Pb and 214Bi by the Relative Method in the HPGe and XtRa Spectrometers

The lines of 214Pb (351.93 keV) and 214Bi (609.51 and 1764.49 keV) were used. The calculation by the relative method is based on the following expressions [43]:
R 0 = R s o u r c e R B G
Poisson   variance :   σ 2 = σ s o u r c e 2 + σ B G 2
A c t s a m p l e = R 0 s a m p l e   A c t s t d   R 0 s t d  
R0 is the net count rate of a line in the gamma spectrum of the given sample or a reference one. When the laboratory background rate is subtracted, Rsample and RBG are the sample and background rates, respectively.

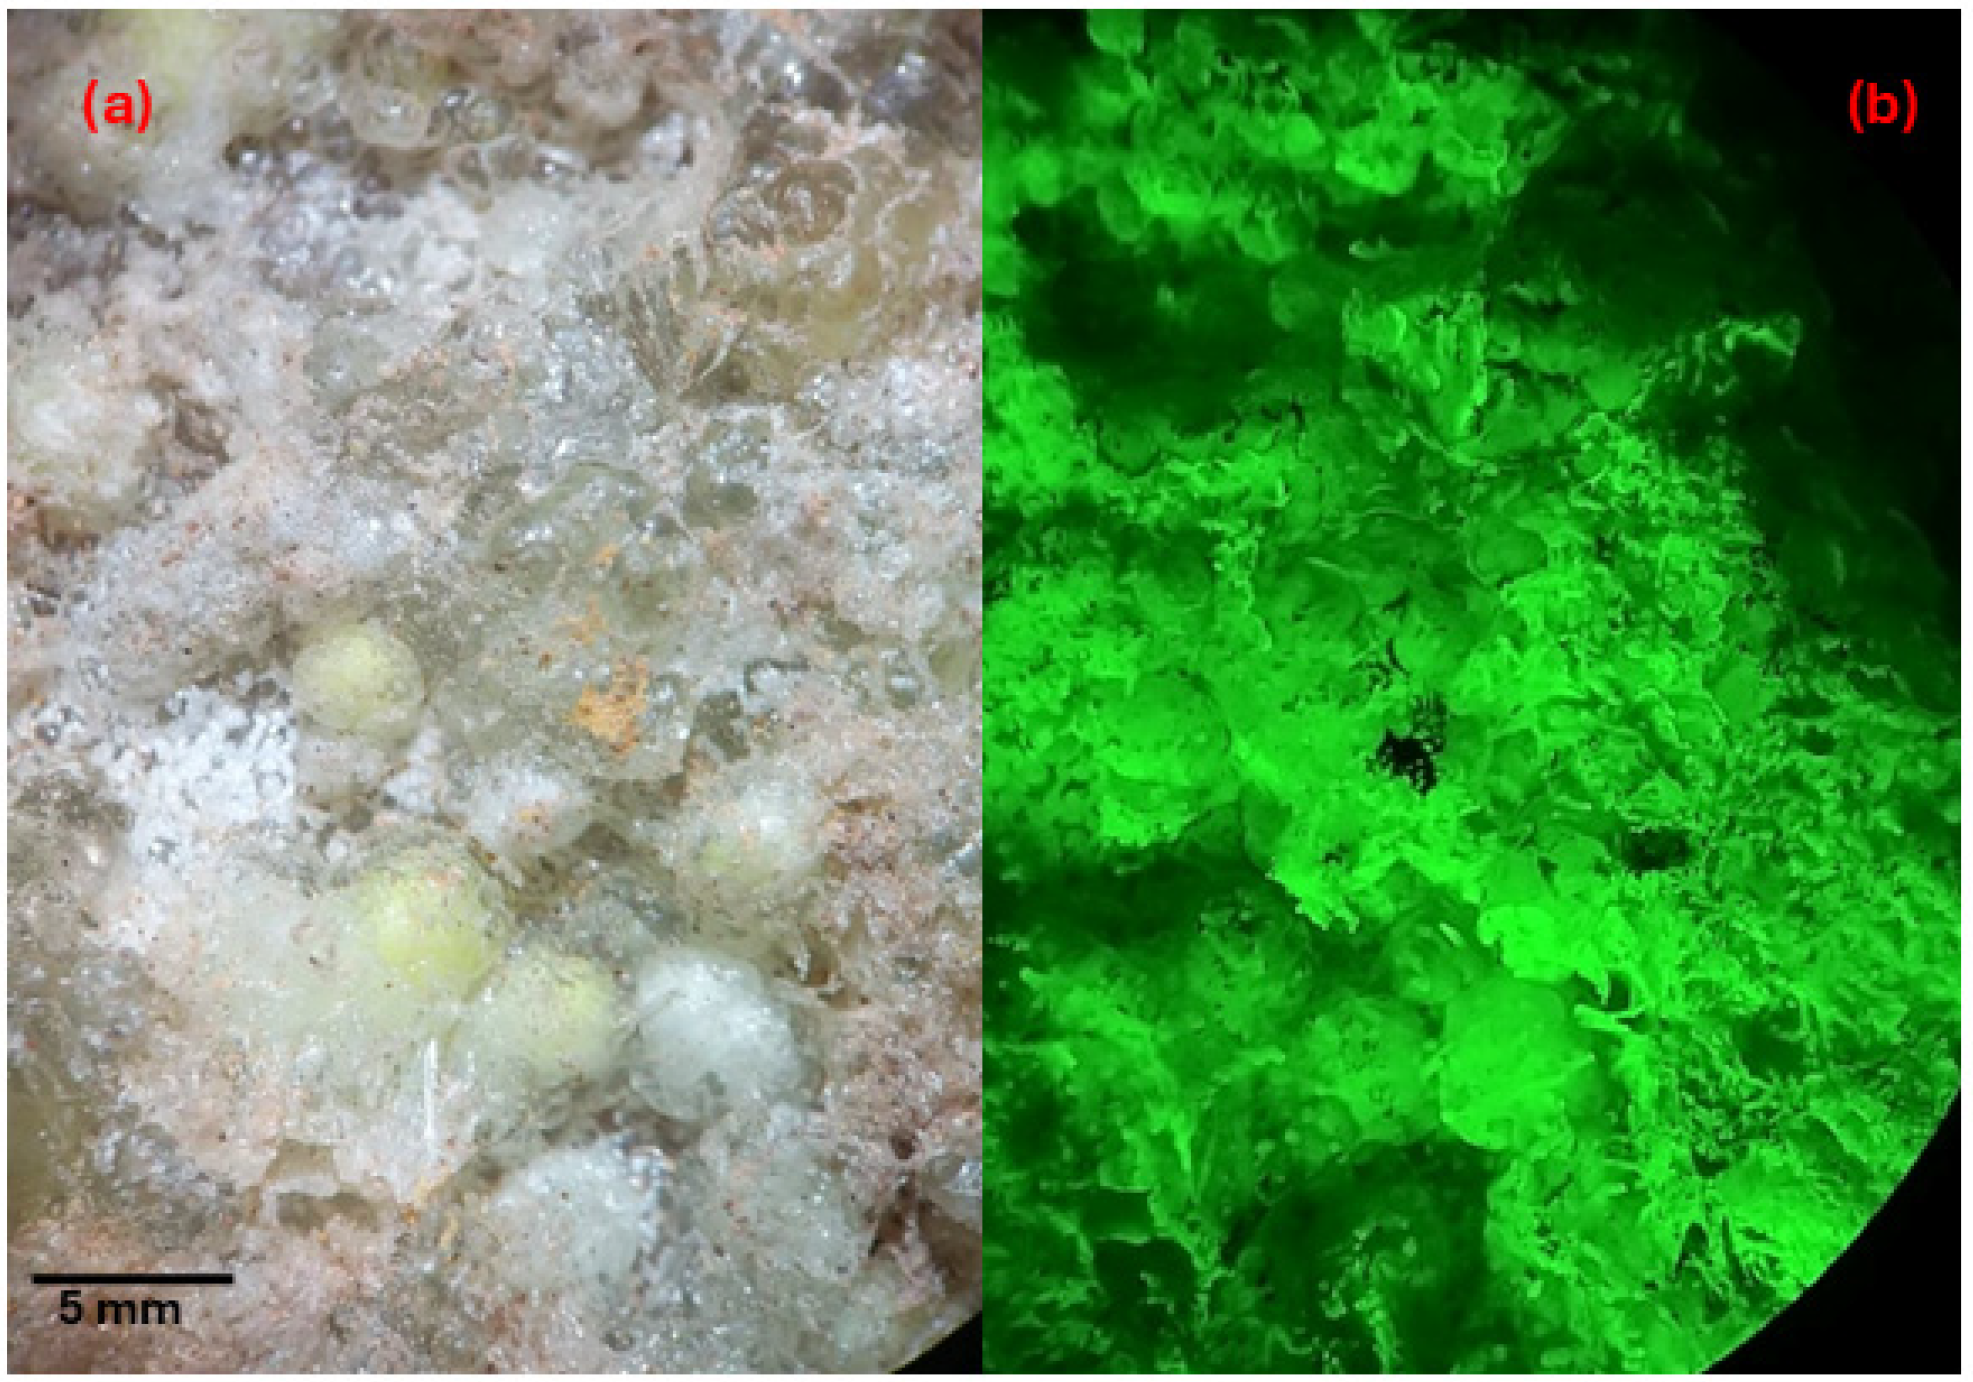
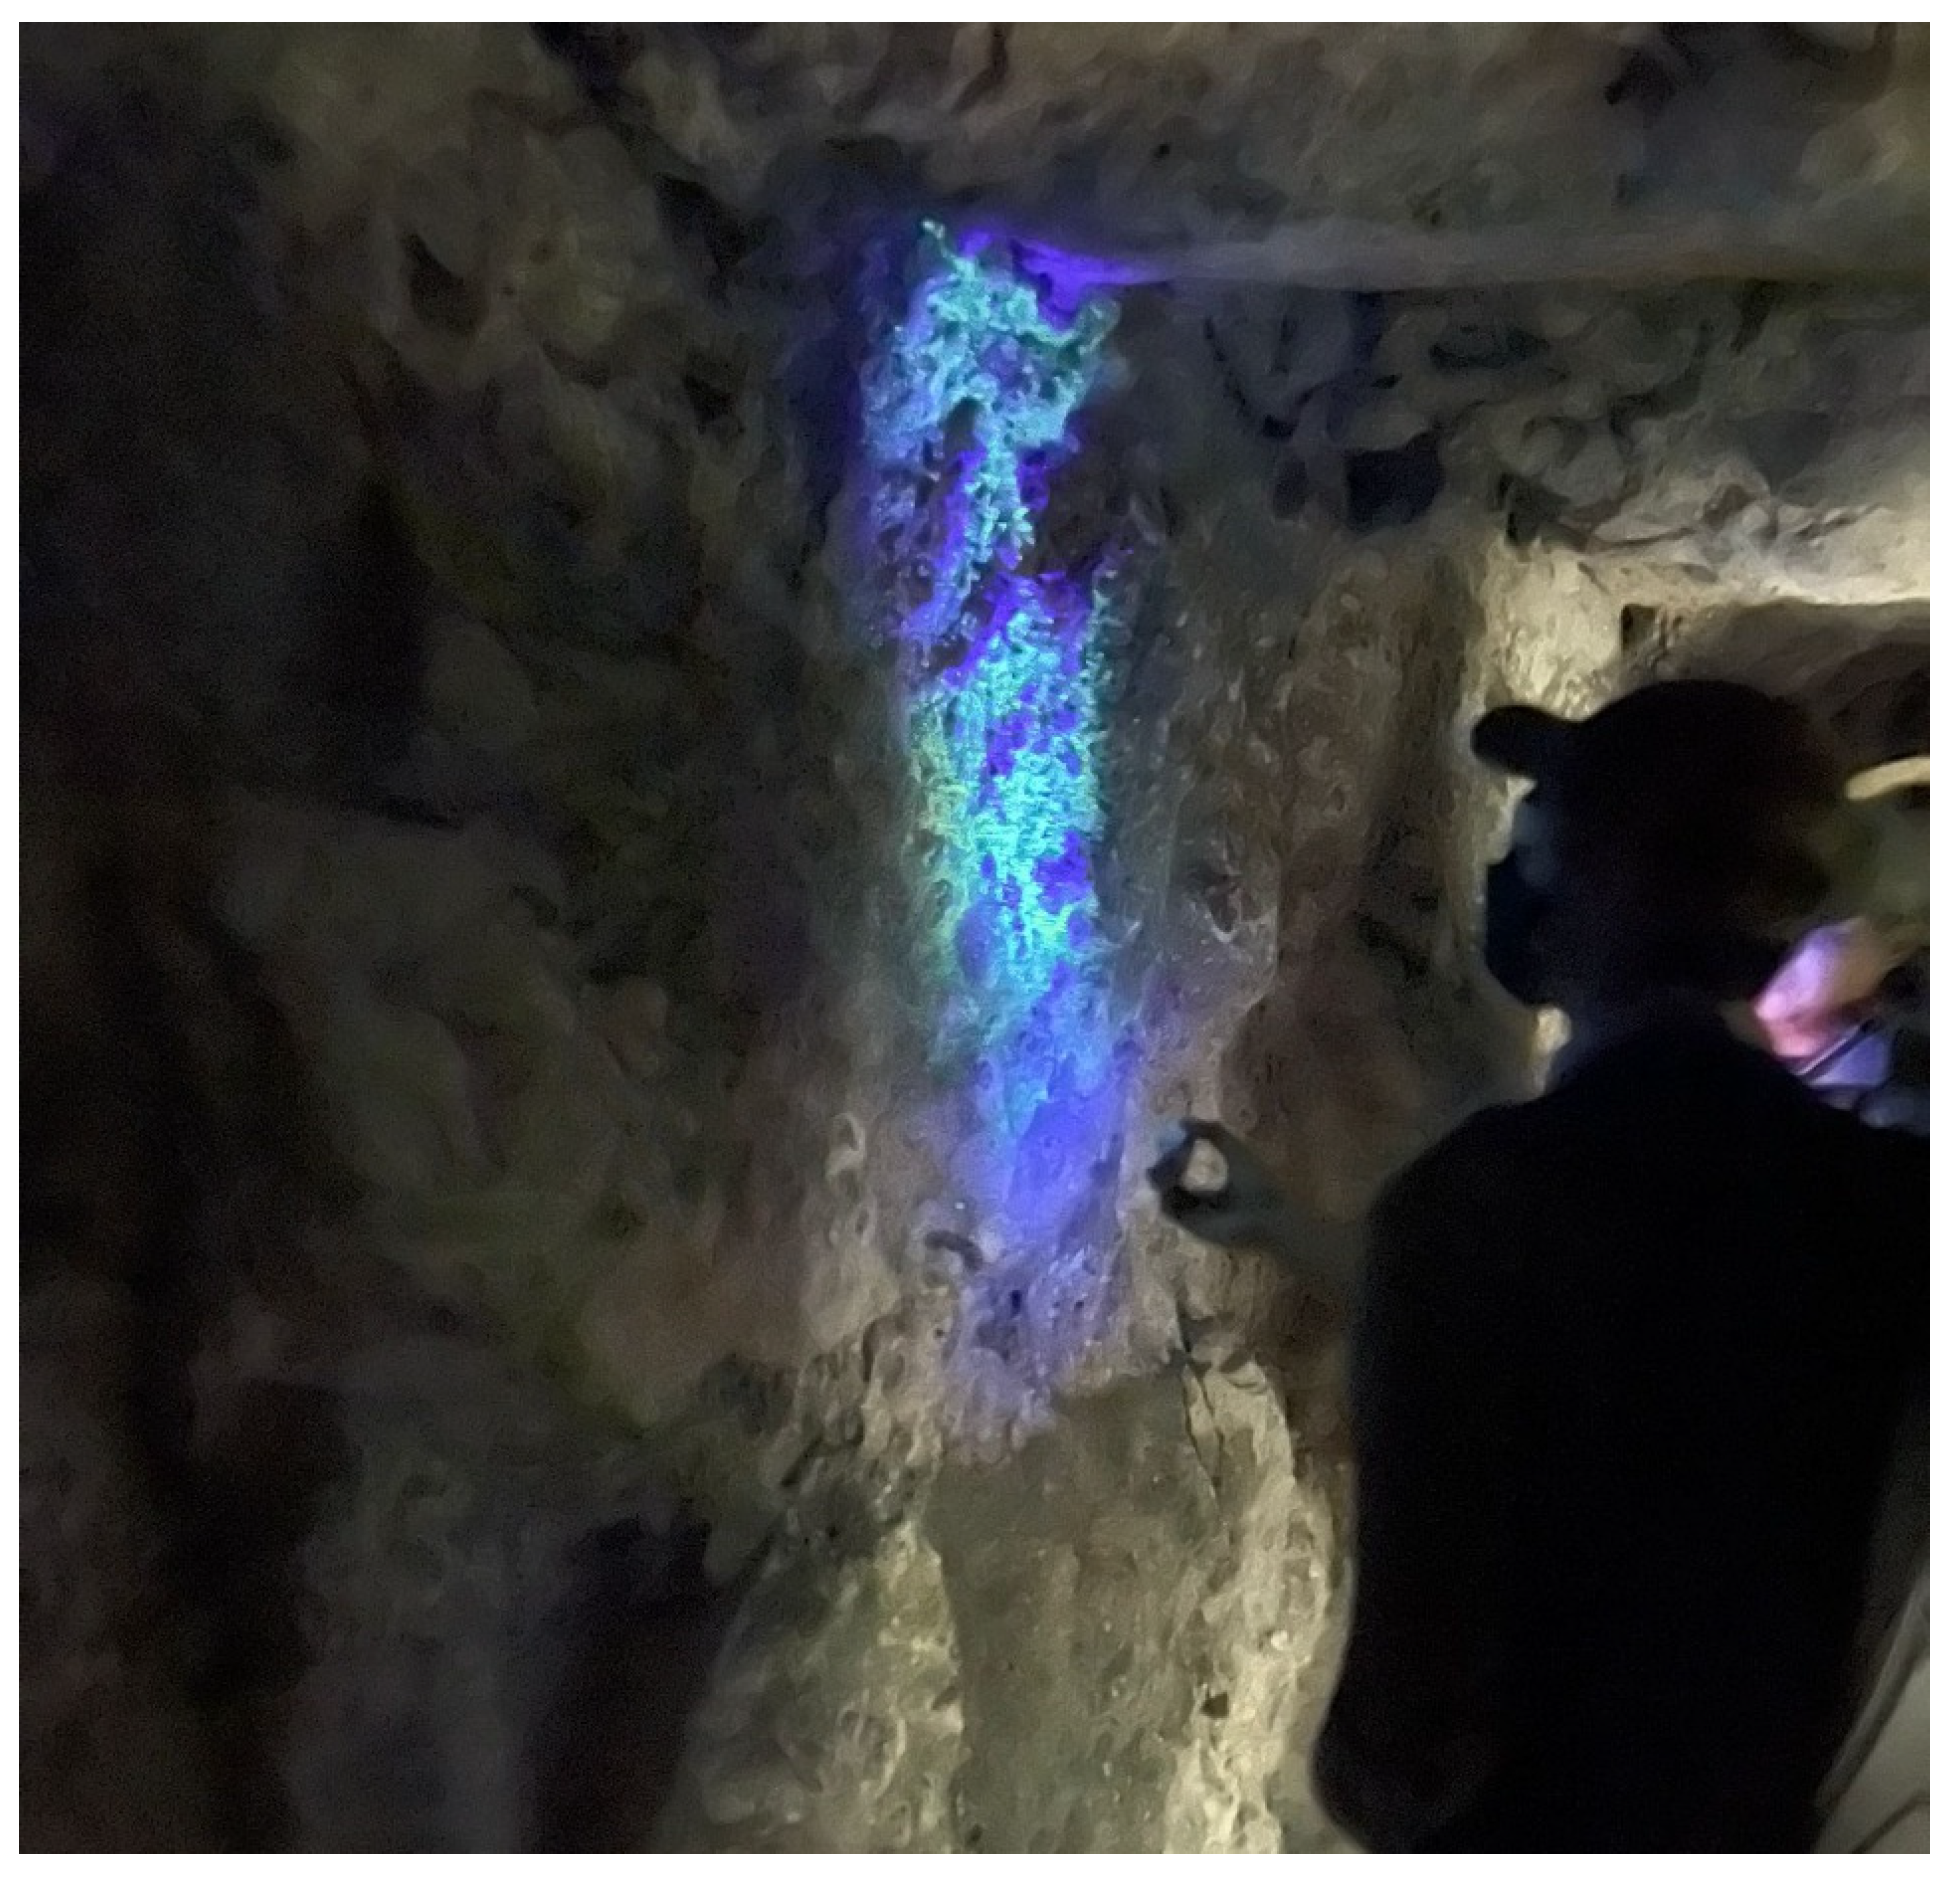
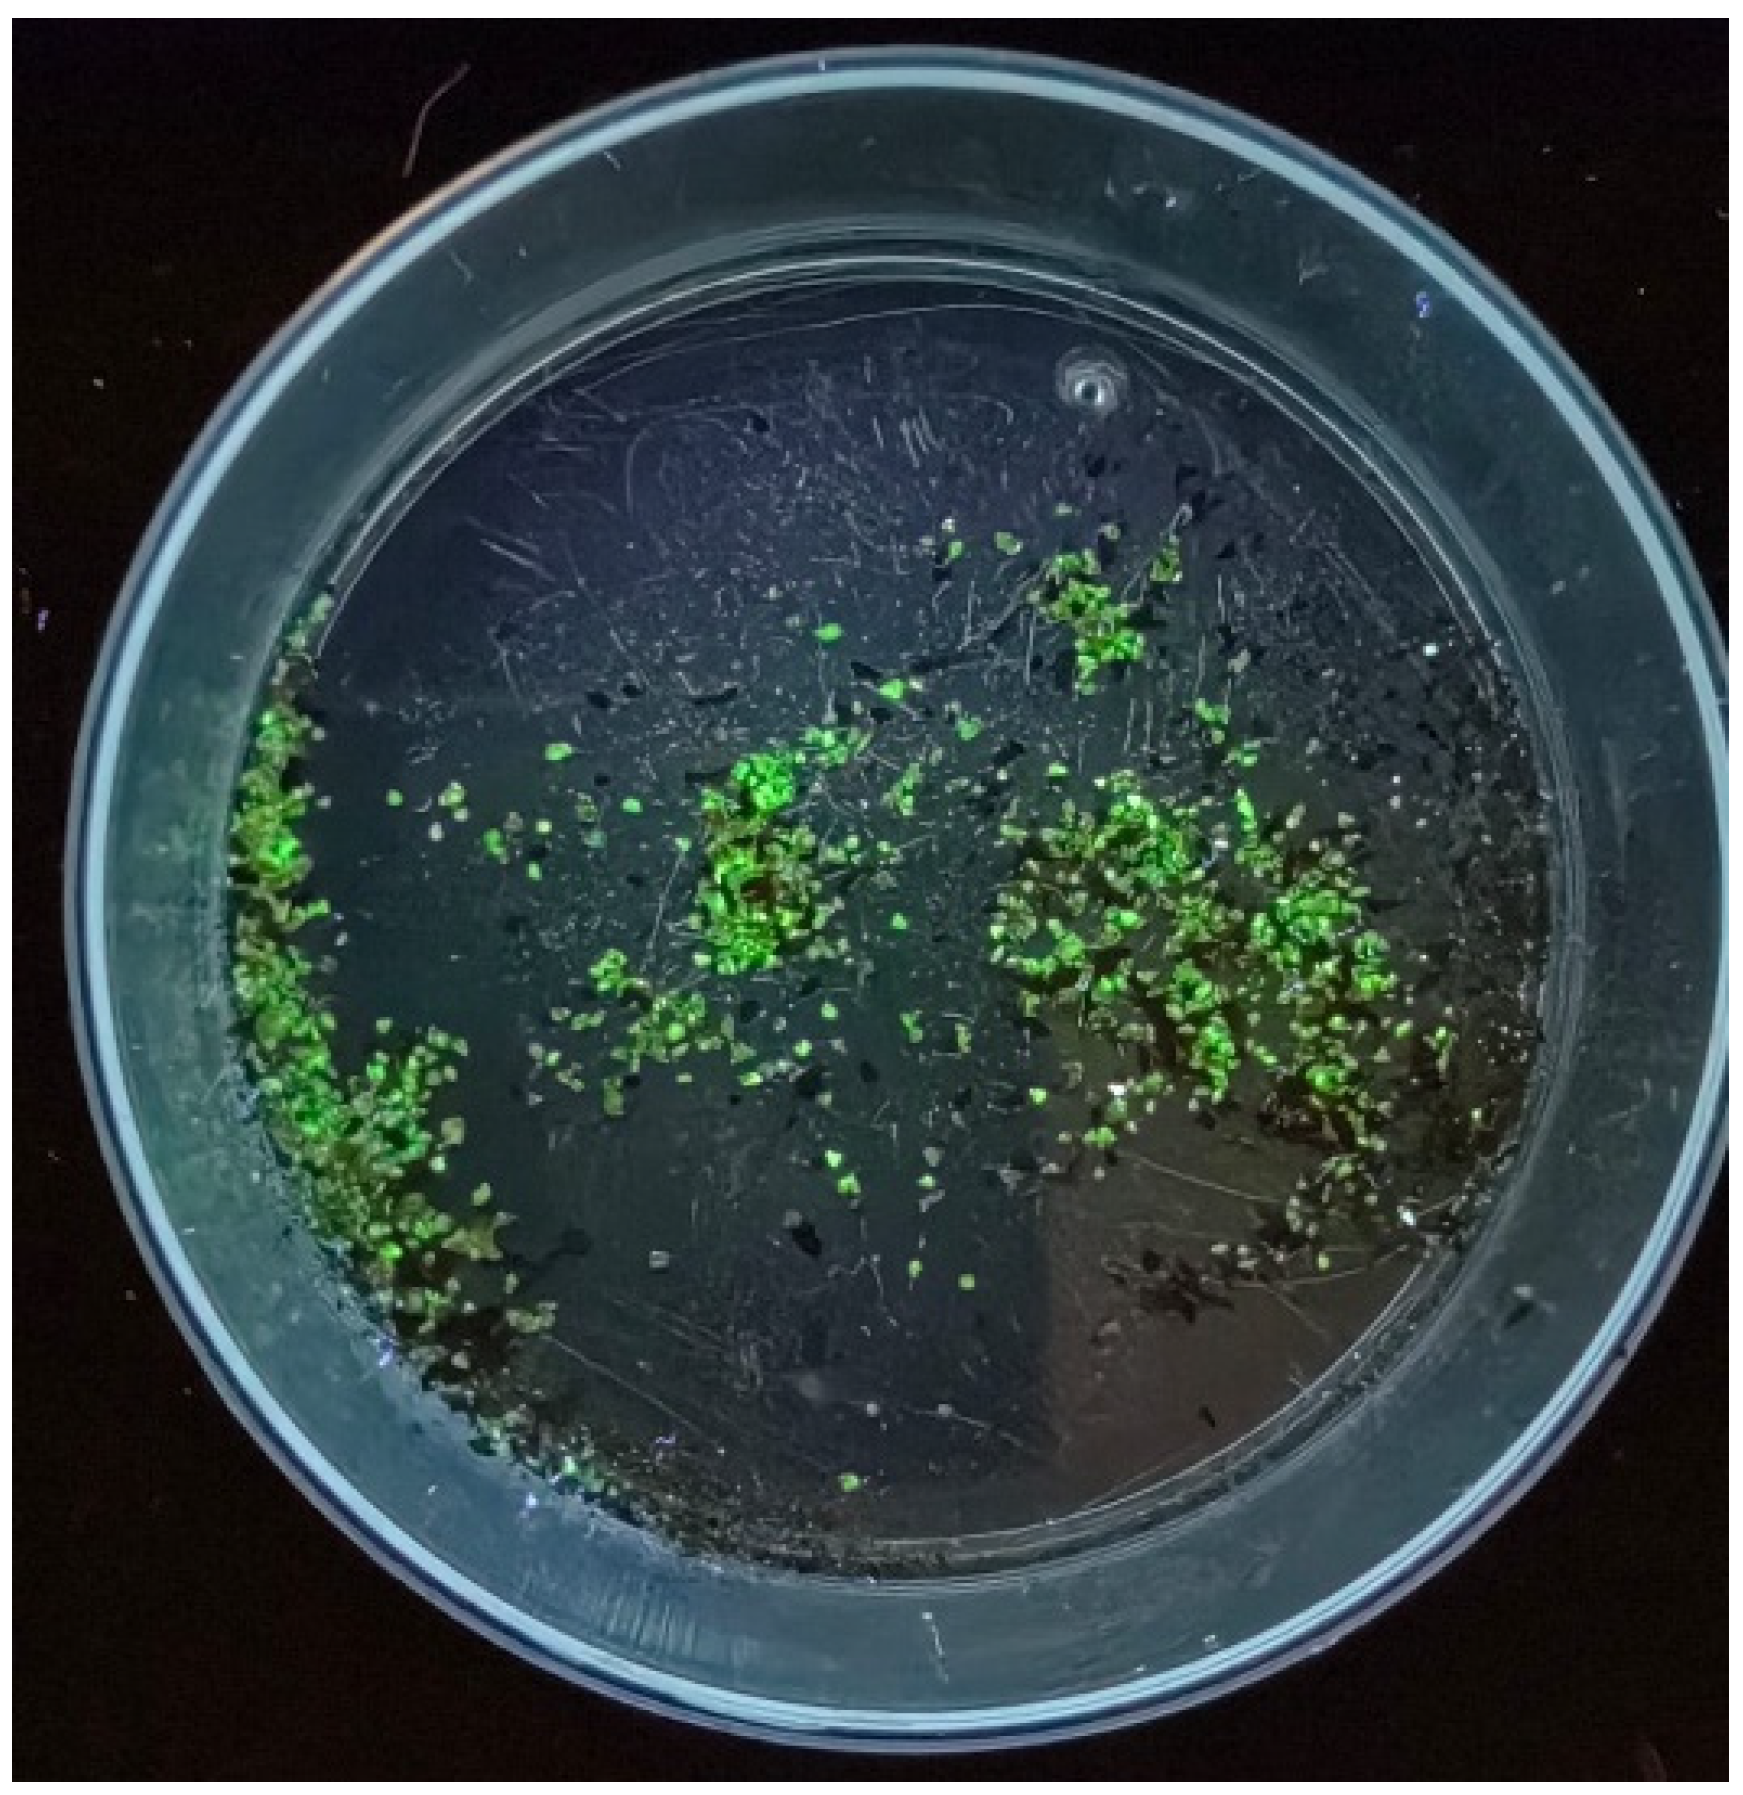
Appendix A.3. Fluorescence of U Minerals Coated with Silica in SPB

Figure A2. Uranophane-weeksite in combination with silica under (a) visible light and (b) UV light at 365 nm. Modified from [9].
Minerals 15 00333 g0a2

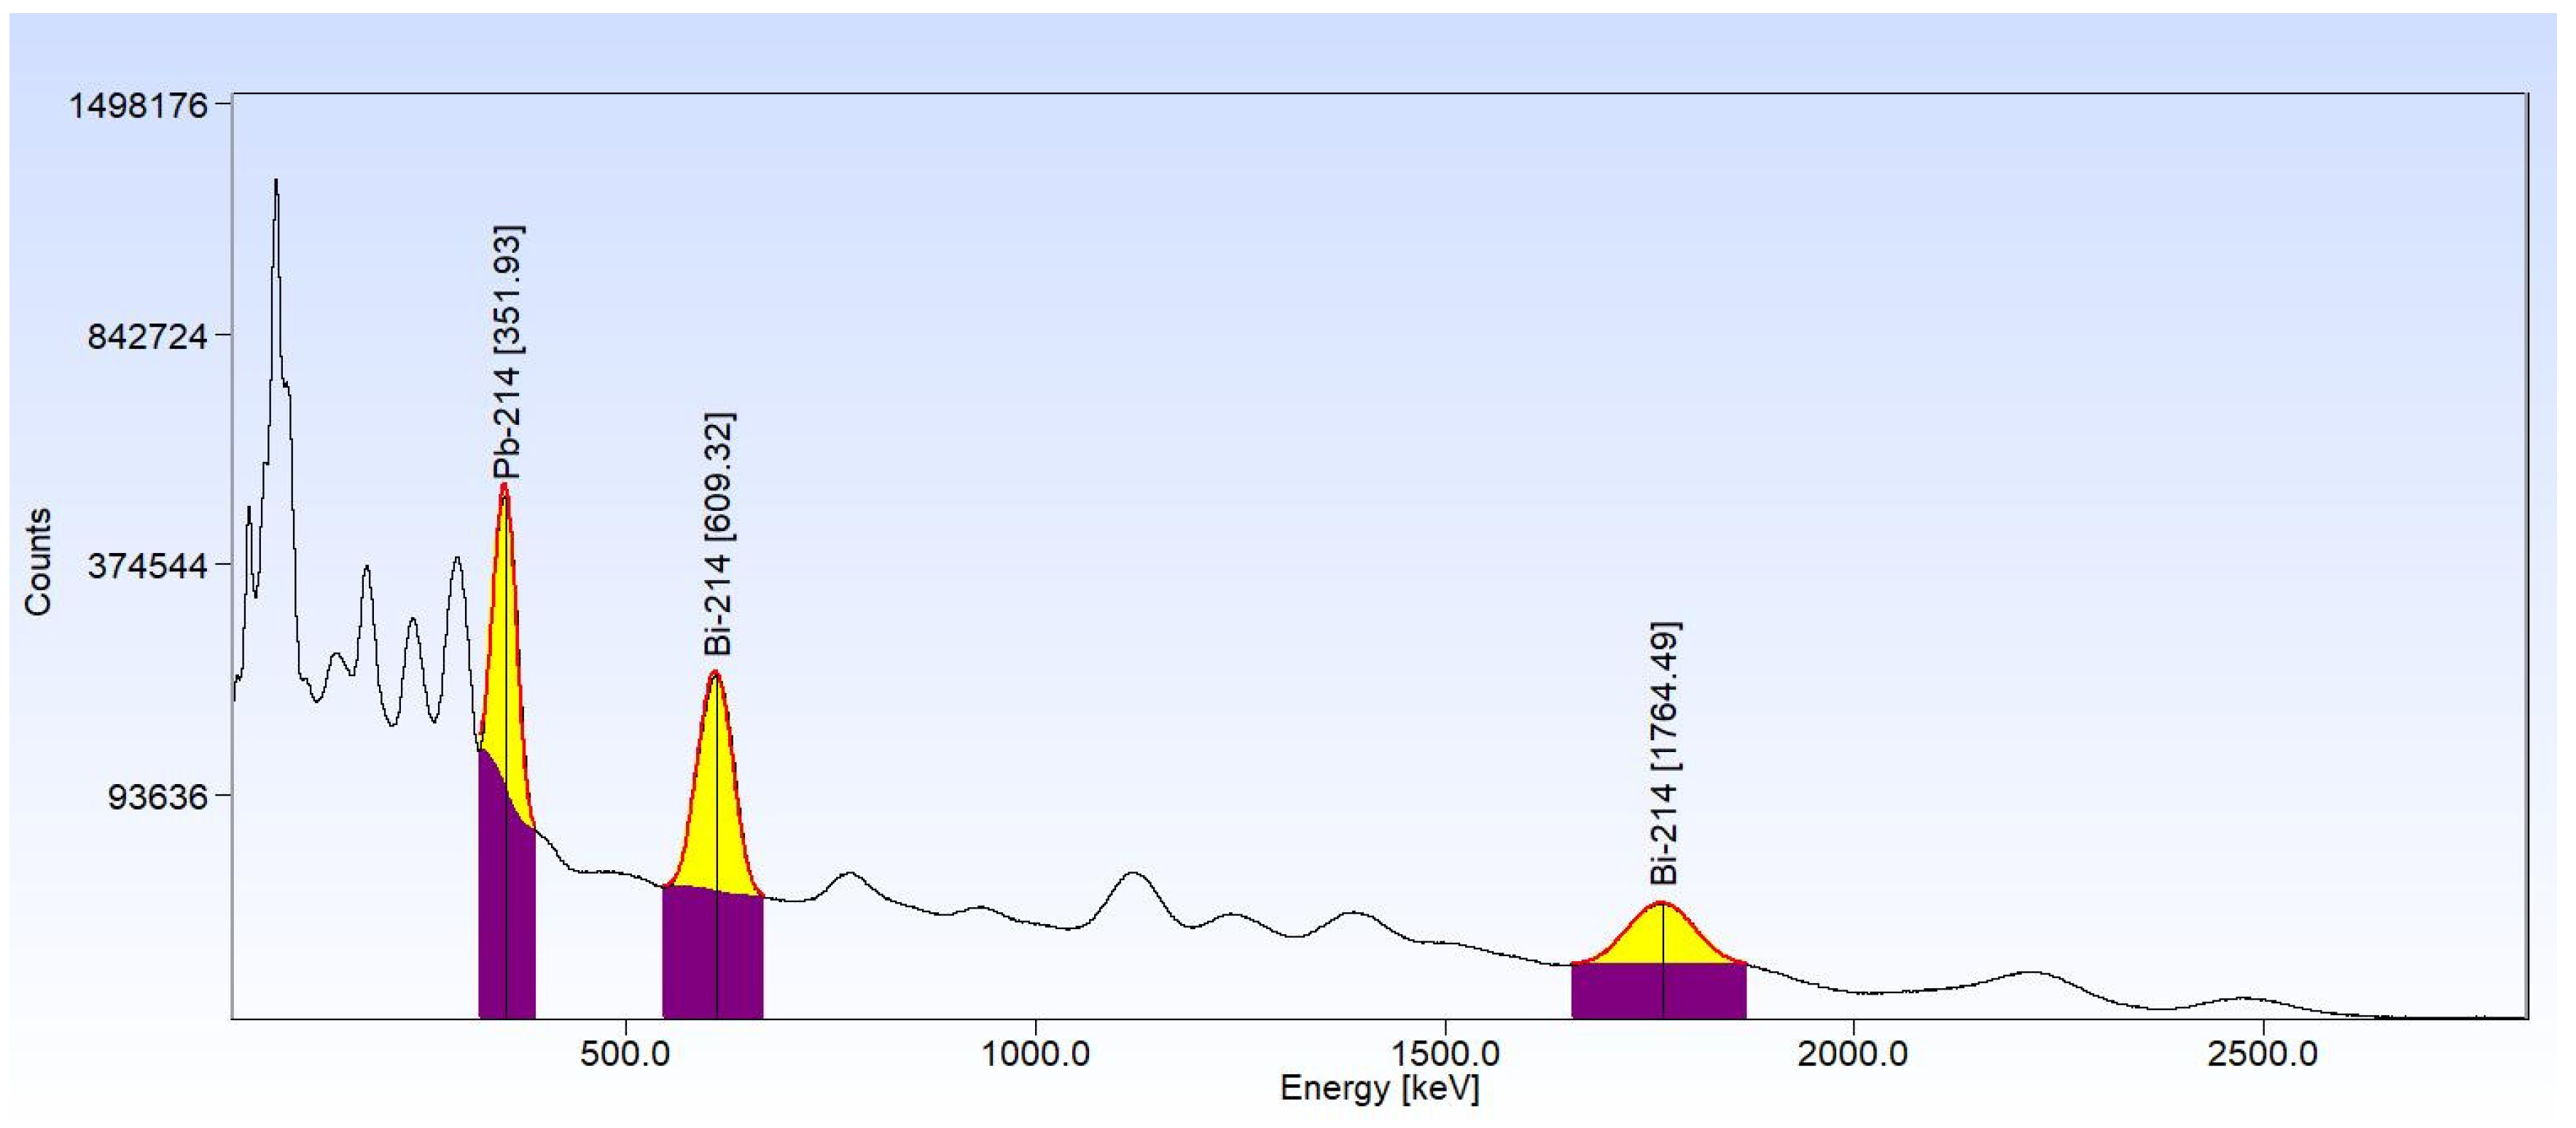
Appendix A.4. Calculation of Particle Concentration in Sediment Samples in the NaI(Tl) Detector

R0 is the net count rate of the line in the gamma spectrum from any given sample. Rsample is the count rate of the sample, and Rblank is the count rate of the igneous matrix. The blank represents the activity of the sediments of igneous origin, which, being part of the sample, must be proportionally subtracted from their contribution to obtain the contribution in each case of the “pure uranophane” (URP, from the reference sample) or of the “pure particles” (unknown). To do this, the blank count rate normalized by the mass of the sample is subtracted.
R n e t , s a m p l e = ( n e t   a r e a   o f   609   k e V   p e a k ,   f o r   e a c h   s a m p l e ) [ ( c o u n t i n g   t i m e ) × ( s a m p l e   m a s s ) ]
R 0 s t d , U R P = R n e t ,   U R P R n e t , b l a n k
R 0 u n k n o w n = R n e t , u n k n o w n R n e t , b l a n k
Poisson variance: σ2 = σsample2 + σblank2
U R P   a c t i v i t y   o f   t h e   u n k n o w n   s a m p l e : A c t u n k n o w n , U R P = R 0 u n k n o w n A c t s t d , U R P R 0 s t d , U R P
N u m b e r   o f   p a r t i c l e s   i n   a n   u n k n o w n   s a m p l e = A c t u n k n o w n , U R P / A c t e a c h   p a r t i c l e

Appendix A.5. XRD Pattern of Parauranophane

Figure A3. Diffraction pattern of pure parauranophane, with a Rietveld method fit. Observe the counting statistics. The high-intensity peaks correspond to the (020), (040), (060), and (080) family planes. The inset stereomicroscopy image shows the druses of parauranophane crystals (Microscope ME Zeiss Stemi DV4). The diffraction inset zooms into the weaker peaks in the magnified range.
Minerals 15 00333 g0a3

Appendix A.6. Sample Preparation for FIB-STEM

Figure A4. Particle selected from the sand fraction of the APB-11 embedded in resin.
Minerals 15 00333 g0a4

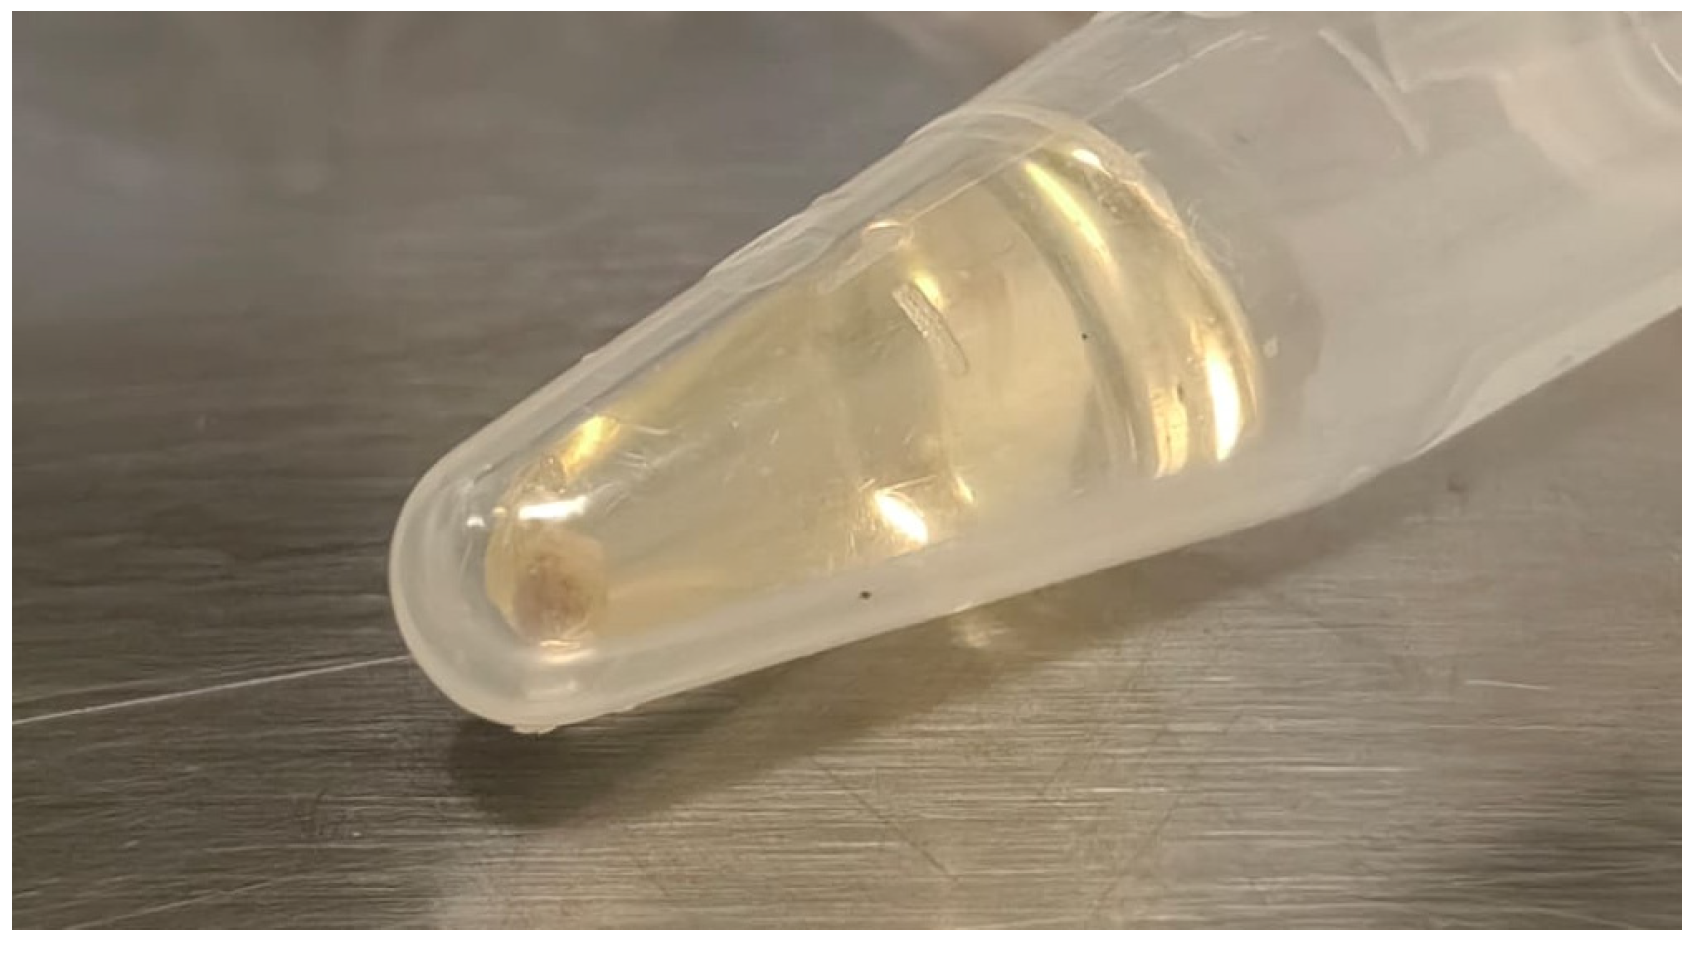
Appendix A.7. Sample Preparation for XAS and XRF-μCT

Figure A5. Sample preparation for XAS analysis at beamline I20 (DLS). (a) Fluorescent particles; (b) grinding of the particles; (c) sample pressed into a cellulose matrix.
Minerals 15 00333 g0a5
Figure A6. Fragment of the U mineral from APB-11 at the tip of the sample holder for analysis at beamline I18 (DLS).
Minerals 15 00333 g0a6

Appendix B. Additional XRD Results

Table A1. Mineral phase concentrations in different fractions of sediments and mud. Generic identification of each stream in the area: Peña Blanca stream (APB), El Tigre stream (AET), and Boca la Colorada stream (ABLC). Generic identification of each granulometry of sediments: fine sand (FSD), coarse silt + clay (CSC), fine silt + clay (FSC). Mineral phase present in the sample (X).
LocationTotal Number of SamplesTypeMineral Phase (%)
QzCalMntMagAbSaKlnAn
APB
This work
19FSCXXXXXXXX
AET
Rodríguez-Guerra [27]
9FSD
CSC
FSCXXXXXXXX
ABLC
Hernández-Hernández [28]
7FSDXX XX X
CSCXX XX X
FSCXXX XX X
ABLC
Pérez-Reyes [29]
4MudXX XXX X

Appendix C. Table of Results for the Activity Concentration

Table A2. 238U Aconc (Bq/kg) of the 214Pb isotope in the fine silt–clay fraction. Generic identification of each stream in the area: Peña Blanca stream (APB), El Tigre stream (AET), and Boca la Colorada stream (ABLC). Relative uncertainty values are below 10%.
LocationSampleAconc of 214Pb (Bq/kg)
APB
This work
APB-4a76
APB-783
APB-890
APB-988
APB-1175
APB-12100
APB-1379
APB-1480
APB-1590
APB-1694
APB-1760
APB-1879
APB-1974
APB-2079
APB-2150
AET
Rodríguez-Guerra [27]
Tigre-1a120
Tigre-1b133
Tigre-298
Tigre-396
Tigre-476
Tigre-582
Tigre-Abanico83
ABLC
Hernández-Hernández [28]
BC −137
BC 050
BC 174
BC 273
BC 379
BC 433

Appendix D. Silica in SPB

Figure A7. Silica (opal) associated with U in a mine in SPB. It shows a green fluorescence using long-wave ultraviolet light (365 nm). This silica is found in different deposits such as Nopal 1, Puerto 3, and Domitila in the form of veins or filling fractures.
Minerals 15 00333 g0a7

References

  1. Angiboust, S.; Fayek, M.; Power, I.M.; Camacho, A.; Calas, G.; Southam, G. Structural and biological control of the Cenozoic epithermal uranium concentrations from the Sierra Peña Blanca, Mexico. Miner. Depos. 2012, 47, 859–874. [Google Scholar] [CrossRef]
  2. Alvarez, M. Provincias fisiograficas de la Republica Mexicana. Bol. Soc. Geol. Mex. 1961, 24, 3–20. [Google Scholar]
  3. INEGI Síntesis de Información Geográfica del Estado de Chihuahua. 2003. Available online: https://www.inegi.org.mx/contenidos/productos/prod_serv/contenidos/espanol/bvinegi/productos/historicos/2104/702825224332/702825224332_5.pdf (accessed on 19 March 2025).
  4. CONAGUA Actualización de la Disponibilidad Media Anual de Agua en el Acuífero Laguna de Hormigas (0824), Estado de Chihuahua. 2020. Available online: https://sigagis.conagua.gob.mx/gas1/Edos_Acuiferos_18/chihuahua/DR_0824.pdf (accessed on 19 March 2025).
  5. Goodell, P.C. Chihuahua City Uranium Province, Chihuahua, Mexico. In Proceedings of the Technical Committee Meeting on Uranium Deposits in Volcanic Rocks, El Paso, TX, USA, 2–5 April 1984; pp. 97–124. [Google Scholar]
  6. Reyes-Cortés, M. Deposito de molibdeno asociado con uranio en Peña Blanca, Mexico. In Proceedings of the Technical Committee Meeting on Uranium Deposits in Volcanic Rocks, El Paso, TX, USA, 2–5 April 1984; IAEA: Vienna, Austria, 1985; pp. 161–174, ISBN 92-0-041085-5. [Google Scholar]
  7. Cárdenas-Flores, D. Volcanic stratigraphy and U-Mo mineralization of the Sierra de Peña Blanca district, Chihuahua, México. In Proceedings of the Technical Committee Meeting on Uranium Deposits in Volcanic Rocks, El Paso, TX, USA, 2–5 April 1984; IAEA: Vienna, Austria, 1985; pp. 125–136, ISBN 92-0-041085-5. [Google Scholar]
  8. Dobson, P.F.; Fayek, M.; Goodell, P.C.; Ghezzehei, T.A.; Melchor, F.; Murrel, M.T.; Oliver, R.; Reyes-Cortés, I.A.; De La Garza, R.; Simmons, A. Stratigraphy of the PB-1 Well, Nopal I Uranium Deposit, Sierra Peña Blanca, Chihuahua, Mexico. Int. Geol. Rev. 2008, 50, 959–974. [Google Scholar]
  9. Faudoa, F.G. Modelo de la Evolución de las Especies Minerales Superficiales de Uranio de la Sierra Peña Blanca, Chihuahua, México. Master´s Thesis, Centro de Investigación en Materiales Avanzados, Chihuahua, México, 2023. [Google Scholar]
  10. George-Aniel, B.; Leroy, J.L.; Poty, B. Volcanogenic uranium mineralizations in the Sierra Pena Blanca District, Chihuahua, Mexico; three genetic models. Econ. Geol. 1991, 86, 233–248. [Google Scholar] [CrossRef]
  11. Schmidt, R.H. A climatic delineation of the ‘real’ Chihuahuan Desert. J. Arid Environ. 1979, 2, 243–250. [Google Scholar] [CrossRef]
  12. Hernandez Herrera, C.; Canche Tello, J.G.; Cabral Lares, R.M.; Rodriguez Guerra, Y.; Perez Reyes, V.; Faudoa Gomez, F.G.; Esparza Ponce, H.E.; Reyes Cortez, I.A.; Hernandez Cruz, D.; Loredo Portales, R.; et al. Interpretation of X-ray Absorption Spectra by synchrotron radiation of the uranium mineral species transported by the main stream “El Tigre”, in Peña Blanca, Chihuahua, Mexico. Supl. Rev. Mex. Física 2024, 5, 1–7. [Google Scholar] [CrossRef]
  13. Nichols, G. Sedimentology and Stratigraphy, 2nd ed.; Wiley-Blackwell: Chichester, UK, 2010; ISBN 978-1-4051-3592-4. [Google Scholar]
  14. Guzmán-Martínez, F.; Arranz-González, J.-C.; Tapia-Téllez, A.; Prazeres, C.; García-Martínez, M.-J.; Jiménez-Oyola, S. Assessment of potential contamination and acid drainage generation in uranium mining zones of Peña Blanca, Chihuahua, Mexico. Environ. Monit. Assess. 2023, 195, 386. [Google Scholar] [CrossRef] [PubMed]
  15. Schindler, M.; Fayek, M.; Hawthorne, F.C. Uranium-rich opal from the Nopal I uranium deposit, Peña Blanca, Mexico: Evidence for the uptake and retardation of radionuclides. Geochim. Cosmochim. Acta 2010, 74, 187–202. [Google Scholar] [CrossRef]
  16. Schindler, M.; Fayek, M.; Courchesne, B.; Kyser, K.; Hawthorne, F.C. Uranium-bearing opals: Products of U-mobilization, diffusion, and transformation processes. Am. Mineral. 2017, 102, 1154–1164. [Google Scholar] [CrossRef]
  17. Dawood, Y. Factors Controlling Uranium and Thorium Isotopic Composition of the Streambed Sediments of the River Nile, Egypt. J. King Abdulaziz Univ.-Earth Sci. 2010, 21, 77–103. [Google Scholar] [CrossRef]
  18. Chabaux, F.; Bourdon, B.; Riotte, J. Chapter 3 U-Series Geochemistry in Weathering Profiles, River Waters and Lakes. In Radioactivity in the Environment; Elsevier: Amsterdam, The Netherlands, 2008; Volume 13, pp. 49–104. ISBN 978-0-08-045012-4. [Google Scholar]
  19. Bosia, C.; Chabaux, F.; Pelt, E.; France-Lanord, C.; Morin, G.; Lavé, J.; Stille, P. U–Th–Ra variations in Himalayan river sediments (Gandak river, India): Weathering fractionation and/or grain-size sorting? Geochim. Cosmochim. Acta 2016, 193, 176–196. [Google Scholar] [CrossRef]
  20. Adams, J.A.S. The uranium geochemistry of latten Volcanic National Park, California. Geochim. Cosmochim. Acta 1955, 8, 74–85. [Google Scholar] [CrossRef]
  21. Hurley, P.M. Direct radiometric measurement by gamma-ray scintillation spectrometer: Part i: Uranium and thorium series in equilibrium. Bull. Geol. Soc. Am. 1956, 67, 395–404. [Google Scholar] [CrossRef]
  22. Hurley, P.M. Direct radiometric measurement by gamma-ray scintillation spectrometer: Part ii: Uranium, thorium, and potassium in common rocks. Bull. Geol. Soc. Am. 1956, 67, 405–412. [Google Scholar] [CrossRef]
  23. Adams, J.A.S.; Richardson, J.E.; Templeton, C.C. Determinations of thorium and uranium in sedimentary rocks by two independent methods. Geochim. Cosmochim. 1958, 13, 270–279. [Google Scholar] [CrossRef]
  24. Mero, J.L. Uses of the gamma-ray spectrometer in mineral exploration. Geophysics 1960, 25, 1054–1076. [Google Scholar] [CrossRef]
  25. United Nations Scientific Committee on the Effects of Atomic Radiation. Sources and Effects of Ionizing Radiation, United Nations Scientific Committee on the Effects of Atomic Radiation (UNSCEAR) 2008 Report; United Nations Scientific Committee on the Effects of Atomic Radiation: Vienna, Austria, 2010; Volume 1, p. 471. [Google Scholar] [CrossRef]
  26. Colmenero, S.L.; Montero, C.M.E.; Villalba, L. Natural Radioactivity in Soils of the Main Cities of the State of Chihuahua. In Proceedings of the Technical Committee Meeting on 14. Annual Congress of the SNM; 21. Annual Meeting of the SMSR, Energia Nuclear y Seguridad Radiologica: Nuevos Retos y Perspectivas, Guadalajara, Mexico, 10–13 September 2003; p. 8. [Google Scholar]
  27. Rodríguez-Guerra, Y. Transporte de Isótopos Radiactivos de la Serie del Uranio Desde Peña Blanca Hasta Laguna del Cuervo a Través del Arroyo El Tigre, Chihuahua. Master´s Thesis, Centro de investigación en Materiales Avanzados, Chihuahua, México, 2023. [Google Scholar]
  28. Hernández-Hernández, D. Transporte y Equilibrio Radioactivo del Uranio Desde el Yacimiento de Peña Blanca Hasta Laguna del Cuervo, Chihuahua. Master´s Thesis, Centro de investigación en Materiales Avanzados, Chihuahua, México, 2019. [Google Scholar]
  29. Pérez-Reyes, V.; Cabral-Lares, R.M.; Méndez-García, C.G.; Caraveo-Castro, C.D.R.; Reyes-Cortés, I.A.; Carrillo-Flores, J.; Montero-Cabrera, M.E. Transport and concentration of uranium isotopes in the Laguna del Cuervo, Chihuahua, México. Supl. Rev. Mex. Física 2022, 3, 010606. [Google Scholar] [CrossRef]
  30. Pérez-Reyes, V.; Cabral-Lares, R.M.; Canche-Tello, J.G.; Rentería-Villalobos, M.; González-Sánchez, G.; Carmona-Lara, B.P.; Hernández-Herrera, C.; Faudoa-Gómez, F.; Rodríguez-Guerra, Y.; Vázquez-Olvera, G.; et al. Uranium Mineral Transport in the Peña Blanca Desert: Dissolution or Fragmentation? Simulation in Sediment Column Systems. Appl. Sci. 2025, 15, 609. [Google Scholar] [CrossRef]
  31. Salbu, B.; Lind, O.C. Analytical techniques for charactering radioactive particles deposited in the environment. J. Environ. Radioact. 2020, 211, 106078. [Google Scholar] [CrossRef]
  32. Brown, G.E.; Calas, G.; Waychunas, G.A.; Petiau, J. X-ray absorption spectroscopy: Applications in mineralogy and geochemistry Reviews. In Mineralogy and Geochemistry; Hawthorne, F.C., Ed.; BookCrafters, Inc.: Chelsea, MI, USA, 1988; Volume 18, pp. 431–512. [Google Scholar]
  33. Manceau, A.; Marcus, M.A.; Tamura, N. Quantitative Speciation of Heavy Metals in Soils and Sediments by Synchrotron X-ray Techniques. Rev. Mineral. Geochem. 2002, 49, 341–428. [Google Scholar] [CrossRef]
  34. Nascimento-Dias, B.L.; Araujo, O.M.O.; Machado, A.S.; Oliveira, D.F.; Anjos, M.J.; Lopes, R.T.; Assis, J.T. Analysis of two meteorite fragments (lunar and martian) using X-Ray microfluorescence and X-Ray computed microtomography techniques. Appl. Radiat. Isot. 2019, 152, 156–161. [Google Scholar] [CrossRef] [PubMed]
  35. Dent, A.J.; Ramsay, J.D.F.; Swanton, S.W. An EXAFS study of uranyl ion in solution and sorbed onto silica and montmorillonite clay colloids. J. Colloid Interface Sci. 1992, 150, 45–60. [Google Scholar] [CrossRef]
  36. Farges, F.; Ponader, C.W.; Calas, G.; Brown, G.E., Jr. Structural environments of incompatible elements in silicate glass/melt systems: II. U(IV), U(V), and U(VI). Geochim. Cosmochim. Acta 1992, 56, 4205–4220. [Google Scholar]
  37. Bertsch, P.M.; Hunter, D.B.; Sutton, S.R.; Bajt, S.; Rivers, M.L. In situ Chemical Speciation of Uranium in Soils and Sediments by Micro X-ray Absorption Spectroscopy. Environ. Sci. Technol. 1994, 28, 980–984. [Google Scholar] [CrossRef]
  38. ISO-18400-102; Soil Quality—Sampling—Part 102: Selection and Application of Sampling Techniques. International Organization for Standardization: Geneva, Switzerland, 2017; p. 71.
  39. Wentworth, C.K. A Scale of Grade and Class Terms for Clastic Sediments. J. Geol. 1922, 30, 377–392. [Google Scholar] [CrossRef]
  40. Folk, R.L. The Distinction between Grain Size and Mineral Composition in Sedimentary-Rock Nomenclature. J. Geol. 1954, 62, 344–359. [Google Scholar] [CrossRef]
  41. Switzer, A.D. 14.19 Measuring and Analyzing Particle Size in a Geomorphic Context. In Treatise on Geomorphology; Elsevier: Amsterdam, The Netherlands, 2013; pp. 224–242. ISBN 978-0-08-088522-3. [Google Scholar]
  42. Rodríguez-Carbajal, J. Recent advances in magnetic structure determination by neutron powder diffraction. Phys. B Condens. Matter 1993, 192, 55–69. [Google Scholar]
  43. Gilmore, G. Practical Gamma-Ray Spectroscopy, 2nd ed.; John Wiley & Sons.: Hoboken, NJ, USA, 2008. [Google Scholar]
  44. Cook, M.; Etschmann, B.; Ram, R.; Ignatyev, K.; Gervinskas, G.; Conradson, S.D.; Cumberland, S.; Wong, V.N.L.; Brugger, J. The nature of Pu-bearing particles from the Maralinga nuclear testing site, Australia. Sci. Rep. 2021, 11, 10698. [Google Scholar] [CrossRef]
  45. Newville, M. Fundamentals of XAFS. Rev. Mineral. Geochem. 2014, 78, 33–74. [Google Scholar] [CrossRef]
  46. Townsend, L.T.; Smith, K.F.; Winstanley, E.H.; Morris, K.; Stagg, O.; Mosselmans, J.F.W.; Livens, F.R.; Abrahamsen-Mills, L.; Blackham, R.; Shaw, S. Neptunium and Uranium Interactions with Environmentally and Industrially Relevant Iron Minerals. Minerals 2022, 12, 165. [Google Scholar] [CrossRef]
  47. Ravel, B.; Newville, M. ATHENA, ARTEMIS, HEPHAESTUS: Data analysis for X-ray absorption spectroscopy using IFEFFIT. J. Synchrotron Radiat. 2005, 12, 537–541. [Google Scholar] [CrossRef] [PubMed]
  48. Solé, V.A.; Papillon, E.; Cotte, M.; Walter, P.; Susini, J. A multiplatform code for the analysis of energy-dispersive X-ray fluorescence spectra. Spectrochim. Acta Part B At. Spectrosc. 2007, 62, 63–68. [Google Scholar] [CrossRef]
  49. Gürsoy, D.; De Carlo, F.; Xiao, X.; Jacobsen, C. TomoPy: A framework for the analysis of synchrotron tomographic data. J. Synchrotron Radiat. 2014, 21, 1188–1193. [Google Scholar] [CrossRef] [PubMed]
  50. Schindelin, J.; Arganda-Carreras, I.; Frise, E.; Kaynig, V.; Longair, M.; Pietzsch, T.; Preibisch, S.; Rueden, C.; Saalfeld, S.; Schmid, B.; et al. Fiji: An open-source platform for biological-image analysis. Nat. Methods 2012, 9, 676–682. [Google Scholar] [CrossRef] [PubMed]
  51. Basham, M.; Filik, J.; Wharmby, M.T.; Chang, P.C.Y.; El Kassaby, B.; Gerring, M.; Aishima, J.; Levik, K.; Pulford, B.C.A.; Sikharulidze, I.; et al. Data Analysis WorkbeNch (DAWN). J. Synchrotron Radiat. 2015, 22, 853–858. [Google Scholar] [CrossRef]
  52. Thermo Scientific Avizo Software, Version 9; Thermo Fisher: Waltham, MA, USA, 2018.
  53. Bès, R.; Rivenet, M.; Solari, P.-L.; Kvashnina, K.O.; Scheinost, A.C.; Martin, P.M. Use of HERFD–XANES at the U L3- and M4-Edges to Determine the Uranium Valence State on [Ni(H2 O)4]3[U(OH,H2O)(UO2)8O12(OH)3]. Inorg. Chem. 2016, 55, 4260–4270. [Google Scholar] [CrossRef]
  54. Catalano, J.G.; Brown, G.E., Jr. Analysis of uranyl-bearing phases by EXAFS spectroscopy: Interferences, multiple scattering, accuracy of structural parameters, and spectral differences. Am. Mineral. 2004, 89, 1004–1021. [Google Scholar] [CrossRef]
  55. Ginderow, D. Structure de l’uranophane alpha, Ca(UO2)2(SiO3OH)2·5H2O. Acta Crystallogr. C 1988, 44, 421–424. [Google Scholar] [CrossRef]
  56. Kelly, S.D. Uranium Chemistry in Soils and Sediments. In Developments in Soil Science; Elsevier: Amsterdam, The Netherlands, 2010; Volume 34, pp. 411–466. ISBN 978-0-444-53261-9. [Google Scholar]
  57. Lind, O.C.; De Nolf, W.; Janssens, K.; Salbu, B. Micro-analytical characterisation of radioactive heterogeneities in samples from Central Asian TENORM sites. J. Environ. Radioact. 2013, 123, 63–70. [Google Scholar] [CrossRef]
  58. Haynes, W.M. (Ed.) CRC Handbook of Chemistry and Physics, 93rd ed.; CRC Press: Boca Raton, FL, USA, 2016; ISBN 978-0-429-11122-8. [Google Scholar]
  59. Mariner, P.E.; Holzmer, F.J.; Jackson, R.E.; Meinardus, H.W.; Wolf, F.G. Effects of High pH on Arsenic Mobility in a Shallow Sandy Aquifer and on Aquifer Permeability along the Adjacent Shoreline, Commencement Bay Superfund Site, Tacoma, Washington. Environ. Sci. Technol. 1996, 30, 1645–1651. [Google Scholar] [CrossRef]
  60. Gómez, V.R.; Núñez López, D.; Gutiérrez, M. Changes in the vegetation cover and quality of aquifers in the drylands of Mexico: Trends in an urbanized complex of three socio-ecological systems within the chihuahuan desert. In Stewardship of Future Drylands and Climate Change in the Global South: Challenges and Opportunities for the Agenda 2030; Springer: Berlin/Heidelberg, Germany, 2019; pp. 57–77. [Google Scholar]
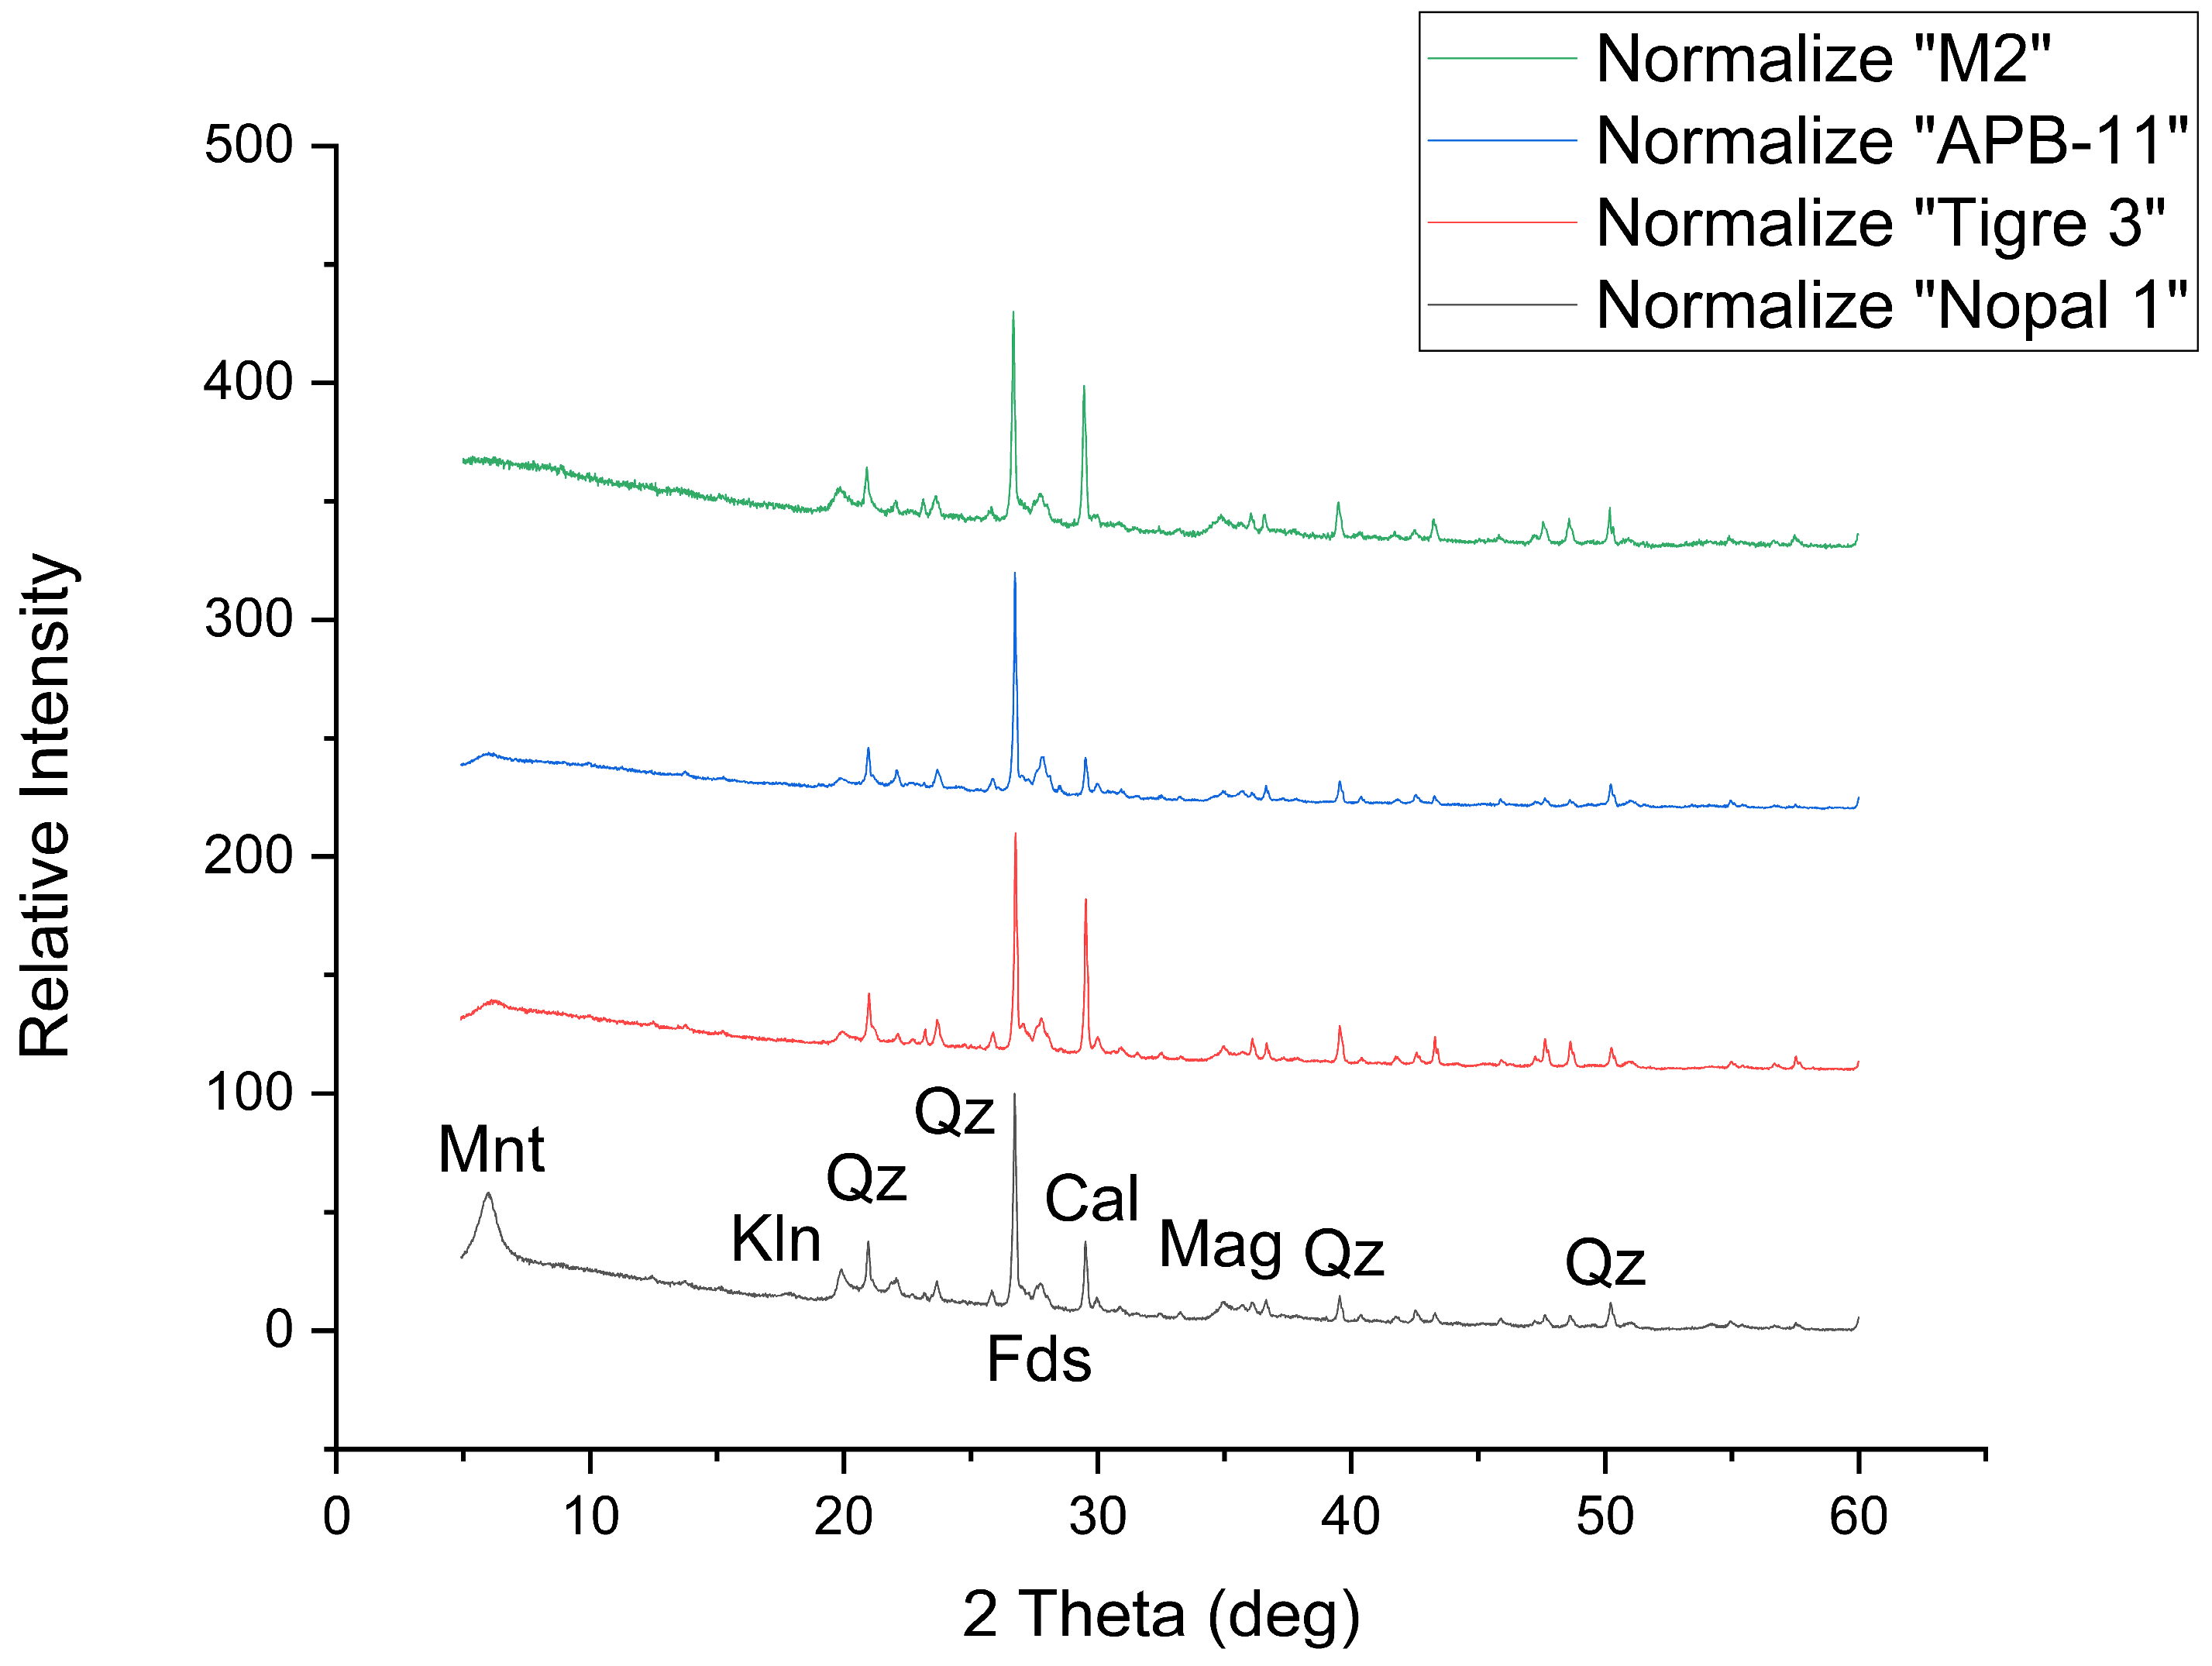
Figure 1. (Left): Location of Sierra Peña Blanca and Laguna del Cuervo, north of Chihuahua City. (Right): Main streams in the study area.
Minerals 15 00333 g001
Figure 2. Location of sampling points along the Peña Blanca (APB), El Tigre (Tigre), and Boca la Colorada (BC) streams. The Puerto 3 sampling point is also shown.
Minerals 15 00333 g002
Figure 3. Characteristic spectrum of sample APB-11, fine sand. The isotope identification corresponding to each gamma-ray energy is shown on the spectrum line. The purple bars below the peaks represent the regions of interest (ROI) for each fit. The red lines represent the Gaussian non-linear least squares fits. The measurement time was 288,000 s with the HPGe detector Canberra GC2020.
Minerals 15 00333 g003
Figure 4. Particles extracted from the sand fraction of the sample APB-11.
Minerals 15 00333 g004
Figure 5. Spectrum of the URP reference sample for determining particle concentration. The isotope identification corresponding to each gamma-ray energy is shown on the spectrum line. The purple bars below the peaks represent the regions of interest (ROI) for each fit. The red lines represent the fits obtained after parameter optimization using an accelerated grid search method. The measurement time was 40,000 s.
Minerals 15 00333 g005
Figure 6. XRD normalized to 100 patterns of the fine silt + clay fraction of the M2, APB-11, Tigre 3, and Nopal 1 samples. The most intense peaks of the detected phases are labeled. Arbitrary units.
Minerals 15 00333 g006
Figure 7. Map of 238U activity concentrations in Bq/kg of the FSC samples from the three SPB streams studied, interpolated by Inverse Distance Weighting (IDW).
Minerals 15 00333 g007
Figure 8. Detailed location of the selected samples, relative to main streams and mining prospects, for which the mineral particle density was determined.
Minerals 15 00333 g008
Figure 9. STEM analyses of a cut performed on a particle from the sand fraction of the APB-11 sample. (a) Micrograph. Space elemental distribution of (b) oxygen, (c) silicon, and (d) iron.
Minerals 15 00333 g009
Figure 10. STEM-EDX spectrum of sample APB-11 and, in insert, a semi-quantitative elemental analysis.
Minerals 15 00333 g010
Figure 11. (a) XANES spectra for Nopal 1 particles (black line), parauranophane (red line), and Uraninite (UO2) (green line); (b) k3-weighted U L3 EXAFS spectrum of parauranophane; experimental (black solid line) and fitted (blue solid line with crossed; (c) k3-weighted U L3 EXAFS spectra; and (d) Fourier transforms in radial distribution function for the Nopal 1 sample (black line) and its fit (blue cross line).
Minerals 15 00333 g011
Figure 12. Representative fitted XRF spectrum for a slice of the particle containing U, Excitation energy: 17.5 keV fitted in the PyMca software [48].
Minerals 15 00333 g012
Figure 13. XRF-µCT slices 50, 70, and 95 of the particle analyzed, showing the distribution of Fe, U, and Sr. The U-Fe-Sr tricolor map presents the potential co-localization areas for each slice.
Minerals 15 00333 g013
Figure 14. Virtual cross sections of U (blue) and Sr (orange). The areas of high Sr intensity (in white) suggest that calcite, one of the main components of the matrix, is also locally embedded in the particle.
Minerals 15 00333 g014
Table 1. Mineral phase concentrations in the fine silt + clay fractions of sediments (APB-11, Tigre 3, and Nopal 1 samples) and bulk (M2 mud sample) obtained using the Rietveld method. Generic identification of each stream in the area: Peña Blanca stream (APB), El Tigre stream (AET), and Boca la Colorada stream (ABLC). With quartz (Qz), calcite (Cal), montmorillonite (Mnt), magnetite (Mag), albite (Ab), sanidine (Sa), kaolinite (Kln), and anorthite (An).
AuthorSampleStreamMineral Phase (%)
QzCalMntMagAbSaKlnAn
This workAPB-11APB26.7 (0.2)8.4 (0.2)4.1 (0.2)2.6 (0.2)32.6 (0.7)15.8 (0.7)3.9 (0.9)5.3 (0.9)
Rodríguez-Guerra [27]Tigre 3AET19.8 (0.4)16.0 (0.9)1.0 (0.2)1.0 (0.5)10.4 (0.1)11.2 (0.4)1.8 (0.5)-
Rodríguez-Guerra [27]Nopal 1AET26.7 (0.3)9.0 (0.7)11.0 (0.9)2.3 (0.7)12.3 (0.1)9.6 (0.1)4.3 (0.9)-
Pérez-Reyes [29]M2ABLC23.5 (0.7)22.8 (0.4)---22.7 (0.9)14.7 (0.2)16 (1)
Table 2. The 238U activity concentrations (AConc) obtained for the 214Pb isotope in Bq/kg. Generic identification of each stream in the area: Peña Blanca stream (APB), El Tigre stream (AET), and Boca la Colorada stream (ABLC). Generic identification of each granulometry of sediments: fine sand (FSD), coarse silt + clay (CSC), and fine silt + clay (FSC).
AuthorStreamGranulometryActivity Concentration (Bq/kg)
Highest AConcLowest AConc
This workAPBFSC100 ± 250 ± 1
CSC77 ± 251 ± 1
FSD51 *51 *
Rodríguez-Guerra [27]AETFSC133 ± 276 ± 2
FSD217 ± 171 ± 1
Hernández-Hernández [28]ABLCFSC79 ± 136 ± 1
CSC71 ± 131 ± 1
* The average AConc in fine sand.
Table 3. Assessed particle density of fine sand samples (particles per gram).
SampleParticle Density (g−1)
Puerto 32500 ± 250
Nopal 1-d828 ± 82
APB-11386 ± 39
APB-12187 ± 18
Tigre-5124 ± 12
Table 4. EXAFS fit parameters for the uranophane structure [55] for particles of sample Nopal 1. Reduced χ2 = 17.99; R-factor = 0.0033.
NameN (*)S02 (*)σ22)E0 (eV) (*)ΔR (Å)Reff (Å)Reff + ΔR (Å)R uncertainty (Å)
U_Oax21.050.0053(6)90.0091.80451.8140.004
U_Oeq111.050.004(1)9−0.042.24112.2010.01
U_Oeq221.050.004(1)9−0.042.29522.2550.01
U_Oeq321.050.009(5)9−0.0562.44982.3940.019
U_Si11.050.012(3)90.033.14443.1740.02
Symbols: (*)—fixed during the fitting; N—coordination number; S02—amplitude reduction factor; σ2—mean square displacement in R; E0—energy shift of the photo electron; ∆R—change in path length of the photo electron; Reff—effective radius.
Disclaimer/Publisher’s Note: The statements, opinions and data contained in all publications are solely those of the individual author(s) and contributor(s) and not of MDPI and/or the editor(s). MDPI and/or the editor(s) disclaim responsibility for any injury to people or property resulting from any ideas, methods, instructions or products referred to in the content.

