Article

Assessment of Potentially Toxic Metals (PTMs) Pollution, Ecological Risks, and Source Apportionment in Urban Soils from University Campuses: Insights from Multivariate and Positive Matrix Factorisation Analyses

1
Department of Geology, Sohag University, Sohag 82524, Egypt
2
Geosciences Department, United Arab Emirates University, Al Ain 15551, United Arab Emirates
3
National Water and Energy Center, United Arab Emirates University, Al Ain 15551, United Arab Emirates
4
Department of Earth Sciences, The University of Haripur, Haripur 22620, Pakistan
*
Author to whom correspondence should be addressed.
Minerals 2025, 15(5), 482; https://doi.org/10.3390/min15050482
Submission received: 20 March 2025 / Revised: 29 April 2025 / Accepted: 1 May 2025 / Published: 4 May 2025

Abstract

:
Understanding pollution levels, ecological health risks, and sources of potentially toxic metals (PTMs) in the soil from university campuses is critical for assessing environmental safety. Soil samples were collected from 12 locations across urban parks and green areas at Sohag University in Egypt. The samples were processed and analysed for heavy metals, including iron (Fe), manganese (Mn), cobalt (Co), nickel (Ni), chromium (Cr), lead (Pb), zinc (Zn), copper (Cu), and cadmium (Cd). Pollution levels were evaluated using indices such as the pollution index (PI), pollution load index (PLI), geo-accumulation index (Igeo), and enrichment factors (EFs). Among the pollution indices, the EFs showed the highest sensitivity in detecting anthropogenic contributions, particularly for Cd, Pb, and Cr. Spatial distribution maps and multivariate statistical analyses, including correlation matrix (CM), principal component analysis (PCA), and cluster analysis (CA), were applied to identify the relationships between PTMs and soil properties, and source apportionment was performed using positive matrix factorisation (PMF). The results indicated that Mn, Ni, and Co were primarily geogenic, whereas Pb, Zn, Cr, and Cd showed higher concentrations, suggesting moderate-to-significant anthropogenic pollution. Pb and Cd pose considerable ecological risks, whereas other metals such as Cr and Cu exhibit moderate ecological threats. The non-carcinogenic and carcinogenic risks to the students were within safe limits, as defined by United States Environmental Protection Agency (USEPA) threshold values. Source apportionment using PMF identified five main sources of PTMs: industrial and anthropogenic activities (30.0%), traffic emissions (25.0%), natural soil processes (20.0%), agricultural practices (15.0%), and mixed industrial traffic sources (10.0%). These findings emphasise the importance of controlling anthropogenic activities to ensure a safer campus environment.

1. Introduction

Heavy metals (HMs) in soil are recognised for their considerable toxicity, and elevated concentrations can severely disrupt plant growth as well as animal and human health [1,2,3]. Human exposure to these elements may result in various health issues, including headaches, dizziness, insomnia, memory impairment, neurological disorders, joint discomfort, and more serious ailments, such as liver, gastric, colorectal, bladder, breast, and prostate cancers [4]. Parks and green areas play a vital role in providing local communities with spaces for relaxation, play, and socialisation, often serving as important venues for family gatherings after work hours [5]. The rapid economic development witnessed in recent decades has highlighted these areas as key indicators of residents’ quality of life and urbanisation levels of surrounding areas [6,7]. The presence of potentially toxic metals (PTMs) in the soils of parks and green areas is a significant environmental issue because of their potentially harmful effects on human health and ecological systems [8,9,10]. Soil contamination from PTMs can be traced to various anthropogenic activities, including the use of pesticides and chemical fertilisers, as well as pollution from transportation and industrial activities [11,12,13,14].
While much of the research has focused on urban soils and contamination in general, specific attention is needed for urban environments where educational institutions, such as university campuses, serve as focal points of social and recreational activity. University campuses represent unique environments where human exposure to heavy metals in soils may differ from that in other urban areas due to specific land uses, traffic patterns, and recreational activities. University campuses worldwide often serve as microcosms of urban environments [15,16], reflecting similar patterns of anthropogenic and natural pollution sources [17,18]. By examining PTM contamination and its sources in campus soil, this study offers insights that can guide environmental monitoring and mitigation strategies in similar contexts worldwide. The methodologies used, including positive matrix factorisation (PMF), pollution indices, and spatial analysis, are adaptable and applicable to other urban environments.
The build-up of PTMs in urban soils increases the risk of exposure through multiple pathways, including ingestion, inhalation, and dermal contact, emphasising the need for consistent monitoring and assessment of soil quality in these recreational spaces to protect public health and ensure the safety of park users [19,20]. Consequently, the evaluation of the health risks posed by PTMs has become a significant concern in environmental science, ecology, and geography. Considering the environmental risks posed by PTMs in urban parks and green spaces, research initiatives have focused on examining PTM concentrations, their distribution patterns, source attribution, and the associated ecological and human health hazards in soils within these areas [21,22,23,24]. This research spans multiple disciplines, including ecology, environmental science, and toxicology, highlighting the complex nature of soil pollution and its impacts. While much of the existing literature has focused primarily on measuring the concentration levels and assessing the ecological risks of PTMs in urban parks [25,26], this study aims to offer a more comprehensive understanding by integrating source apportionment and spatial analysis to identify the primary contributors to contamination.
University campuses are significant functional areas that raise concerns regarding PTM pollution. However, most research has concentrated on kindergarten, primary, and middle schools [27,28,29]. Educational settings, particularly those for younger children, often present unique challenges because these children are more physiologically vulnerable. In contrast, university campuses have different land use patterns and levels of activity, which include factors such as construction, traffic flow, and recreational activities. These differences can lead to varying exposure profiles and types of pollutants. Only a limited number of studies have addressed PTM pollution on university campuses [30,31,32,33]. This limited focus is potentially influenced by the common perception that younger children are more vulnerable to PTM exposure, as they are still in early developmental stages. Although college students are considered adults, their bodies are still developing, exposed to high levels of physical activity, and spend extended periods in outdoor campus environments. These behavioural patterns increase their exposure to soil and dust, particularly through dermal contact, inhalation, and incidental ingestion, making them a relevant population for evaluating environmental health risks. Engaging in intense physical activities related to sports and other campus activities increases their exposure to dust. The PTM pollution found in university campus dust is a significant concern [34], and the potential harm it poses to college students should not be underestimated. University campuses are often densely populated spaces where students, staff, and visitors engage in prolonged activities, increasing the likelihood of exposure to PTMs through ingestion, inhalation, and skin contact [35,36]. Contaminated campus soils pose long-term health risks, including both carcinogenic and non-carcinogenic effects [37], which could significantly impact students’ physical and cognitive health. Additionally, university green areas are frequently used for recreational activities, making them an essential focus of environmental monitoring to ensure a safe and healthy academic environment. The study of PTM contamination in university soils also reflects broader urban environmental challenges [38,39], providing valuable insights into urban pollution patterns and informing mitigation strategies [40]. The findings from this study contribute to the growing body of research on urban and campus environmental quality, enabling cross-regional comparisons and guiding policies aimed at reducing pollution in educational institutions.
Sohag City has a rich history and culture and hosts numerous universities and colleges. With an area of 250 acres, 17 colleges and faculties, 63,000 students in 2024, 2300 staff members, and 6300 administrative employees, Sohag University is the largest university in the Sohag Governorate, located in Upper Egypt, and is one of the major educational institutions in the region, being an ideal region to study soil PTM pollution on university campuses. It is located in a densely populated and rapidly urbanising area of Upper Egypt and presents a unique opportunity to investigate PTM accumulation in campus soils influenced by a mix of urban, agricultural, and institutional activities. This study aims to investigate the concentrations of heavy metals—specifically Fe, Cd, Co, Cr, Cu, Mn, Ni, Pb, and Zn—in the topsoil of green areas at Sohag University. In addition to determining these concentrations, this research will assess pollution levels and the associated ecological and health risks. Furthermore, this study seeks to identify the sources of these metals through the application of PMF and multivariate statistical analyses, allowing for a clear distinction between anthropogenic and natural origins of contamination.

2. Materials and Methods

2.1. Study Area

Sohag is a rural governorate in Upper Egypt, with its capital, Sohag City, located approximately 470 km south of Cairo. Geographically, the governorate spans a narrow strip of land extending over 110 km along both banks of the Nile River (Figure 1a). The Sohag Governorate experiences a typical hot desert climate (i.e., long, hot, dry summers and dry, cold winters). The average temperature during winter is approximately 6 °C, whereas it reaches approximately 38 °C in summer, with a mean annual temperature of 21.8 °C. Precipitation is extremely negligible, and the mean evapotranspiration values reach approximately 1812 mm/year. Sohag University was founded in Sohag City at 26°33′55″ N, 31°42′28″ E (Figure 1b). Apart from the spaces occupied by university buildings, infrastructure, and roads, most campus surfaces are dedicated to green areas and parks. The total area of the Sohag University campus spans approximately 250 acres, providing a substantial landscape for evaluating soil contamination within its green zones. The soil in the Nile Valley, including in the study area, is influenced by fluvial processes. These sediments consist primarily of Holocene fluviatile deposits, mainly composed of silt and clay, originating from the basaltic rocks of the Ethiopian Plateau [41,42]. To enhance the fertility of green areas and parks for planting in urban settings, a thin layer of fertile floodplain sediment is often transported and spread over these surfaces. Owing to the relatively low fertility of urban soils, there is a common reliance on chemical fertilisers and other amendments to improve soil quality.

2.2. Sampling and Analytical Techniques

In this study, soil samples were collected from 12 locations in the urban parks and green areas of Sohag University in April 2014. The campus land use and green space layout have remained largely stable, making the data valuable for baseline assessments and future comparative studies. The sampling locations were selected to ensure comprehensive coverage of the study area, accounting for variations in land use, proximity to potential pollution sources (e.g., roads, parking lots, and recreational areas), and accessibility. Each location was georeferenced using a GPS device to enable reproducibility and spatial analysis. At each location, composite samples were taken by combining 2–3 subsamples from a depth of 0–15 cm. When sampling heterogenous areas (e.g., near roads, parking lots, or agricultural fields), 3 subsamples were taken to ensure adequate representation of soil variability. For more homogeneous areas, 2 subsamples were sufficient. The exact locations for the subsamples within the 10 m radius were determined using an organised random sampling approach. The points were spread across the area to capture local variability, with a random number generator helping to determine the intervals between the selected points. This method ensured that the subsamples were representative of the area’s overall conditions.
After collection, samples were immediately placed in clean, labelled polyethylene bags and transported to the laboratory to avoid cross-contamination and preserve sample integrity.
In the laboratory, the soil samples were air-dried under controlled conditions to prevent the loss of volatile components. Dried samples were passed through a 2 mm sieve to remove larger debris, stones, and pebbles. Subsamples were further sieved through a 0.063 mm mesh to isolate fine particles, as these are more likely to retain heavy metals and represent the bioavailable fraction of the soil.
To ensure consistency, quality control measures were implemented throughout the sampling and preparation process. The hydrogen ion concentration was measured in soil samples using the <2 mm soil fraction (soil/water extract [1:2.5]) with a digital pH meter (Cole Parmer). Inorganic carbonate was estimated using a Collins calorimeter following the USDA (1996) guidelines. For samples with a particle size of <63 µm, the carbonate content was assessed by treating the samples with HCl and measuring the evolved CO2 monometrically. The amount of carbonate present was calculated as calcium carbonate (CaCO3). The oxidisable organic carbon content was measured in the soil (<63 µm). This was determined using the modified Walkley and Black method (USDA, 1996), which employs an acid dichromate system. This method involves back-titrating unused dichromate with standard ferrous ammonium sulphate, using diphenylamine as an indicator. Assessing the total metal content in the soil is crucial for evaluating potential hazards to the ecosystem and comparing the results with quality standards regarding pollution effects and sustainability. Total metal content assessments typically involve digesting soil samples with strong acids, such as HF, HClO4, HNO3, and aqua regia. Although the total metal content does not always correlate well with the bioavailable fraction, it remains a common statutory measure for assessing soil contamination in many countries.
Chemical analyses were performed using hot aqua regia extraction, which effectively dissolved most sulphide minerals, carbonates, and silicates, such as trioctahedral micas, olivine, and clay minerals, as well as primary and secondary salts and hydroxides [43]. The analytical method overestimated the bioavailable PTM concentrations. The aqua regia digestion in this study measures “pseudo-total” metal concentrations rather than bioavailable fractions. No separate analysis of bioavailable fractions was performed. PTMs that are strongly bound to silicate structures are released into the environment at an extremely slow rate, indicating that high total concentrations of potentially harmful elements do not necessarily pose an environmental threat. Aqua regia extraction is widely used for several reasons: it is commonly available in geo-analytical laboratories, has been standardised, and tends to yield more consistent results than many weaker leaching methods. In this study, the concentrations obtained through aqua regia extraction are referred to as “total” concentrations; however, this method represents a strong partial leach, and the actual total concentrations of PTMs may be higher. A comparison of aqua regia-extractable concentrations and actual total concentrations in Finnish soil samples can be found in [44]. The total concentration of the environmentally relevant PTMs (Fe, Mn, Co, Ni, Pb, Zn, Cu, Cr, and Cd) was determined by digesting 1.0 g of air-dried samples (<63 µm) in 25 mL conical flasks using a concentrated aqua regia acid mixture. The total metal content was assessed spectroscopically using the resulting acid extract. A PerkinElmer 2380 flame atomic absorption spectrophotometer (AAS) with hollow cathode lamps was used to measure the total and bioavailable concentrations of the tested metals (Fe, Mn, Co, Ni, Cr, Pb, Zn, Cu, and Cd). All analyses conducted in this study were performed at the Environmental Geochemistry Laboratory of the Geology Department, Faculty of Science, Sohag University, using the aforementioned instruments. The overall sampling and analytical protocol followed established guidelines to ensure accuracy and reproducibility. While the current study used composite samples to address heterogeneity, future research is intended to consider more granular sampling approaches (e.g., grid-based sampling) for finer spatial resolution.

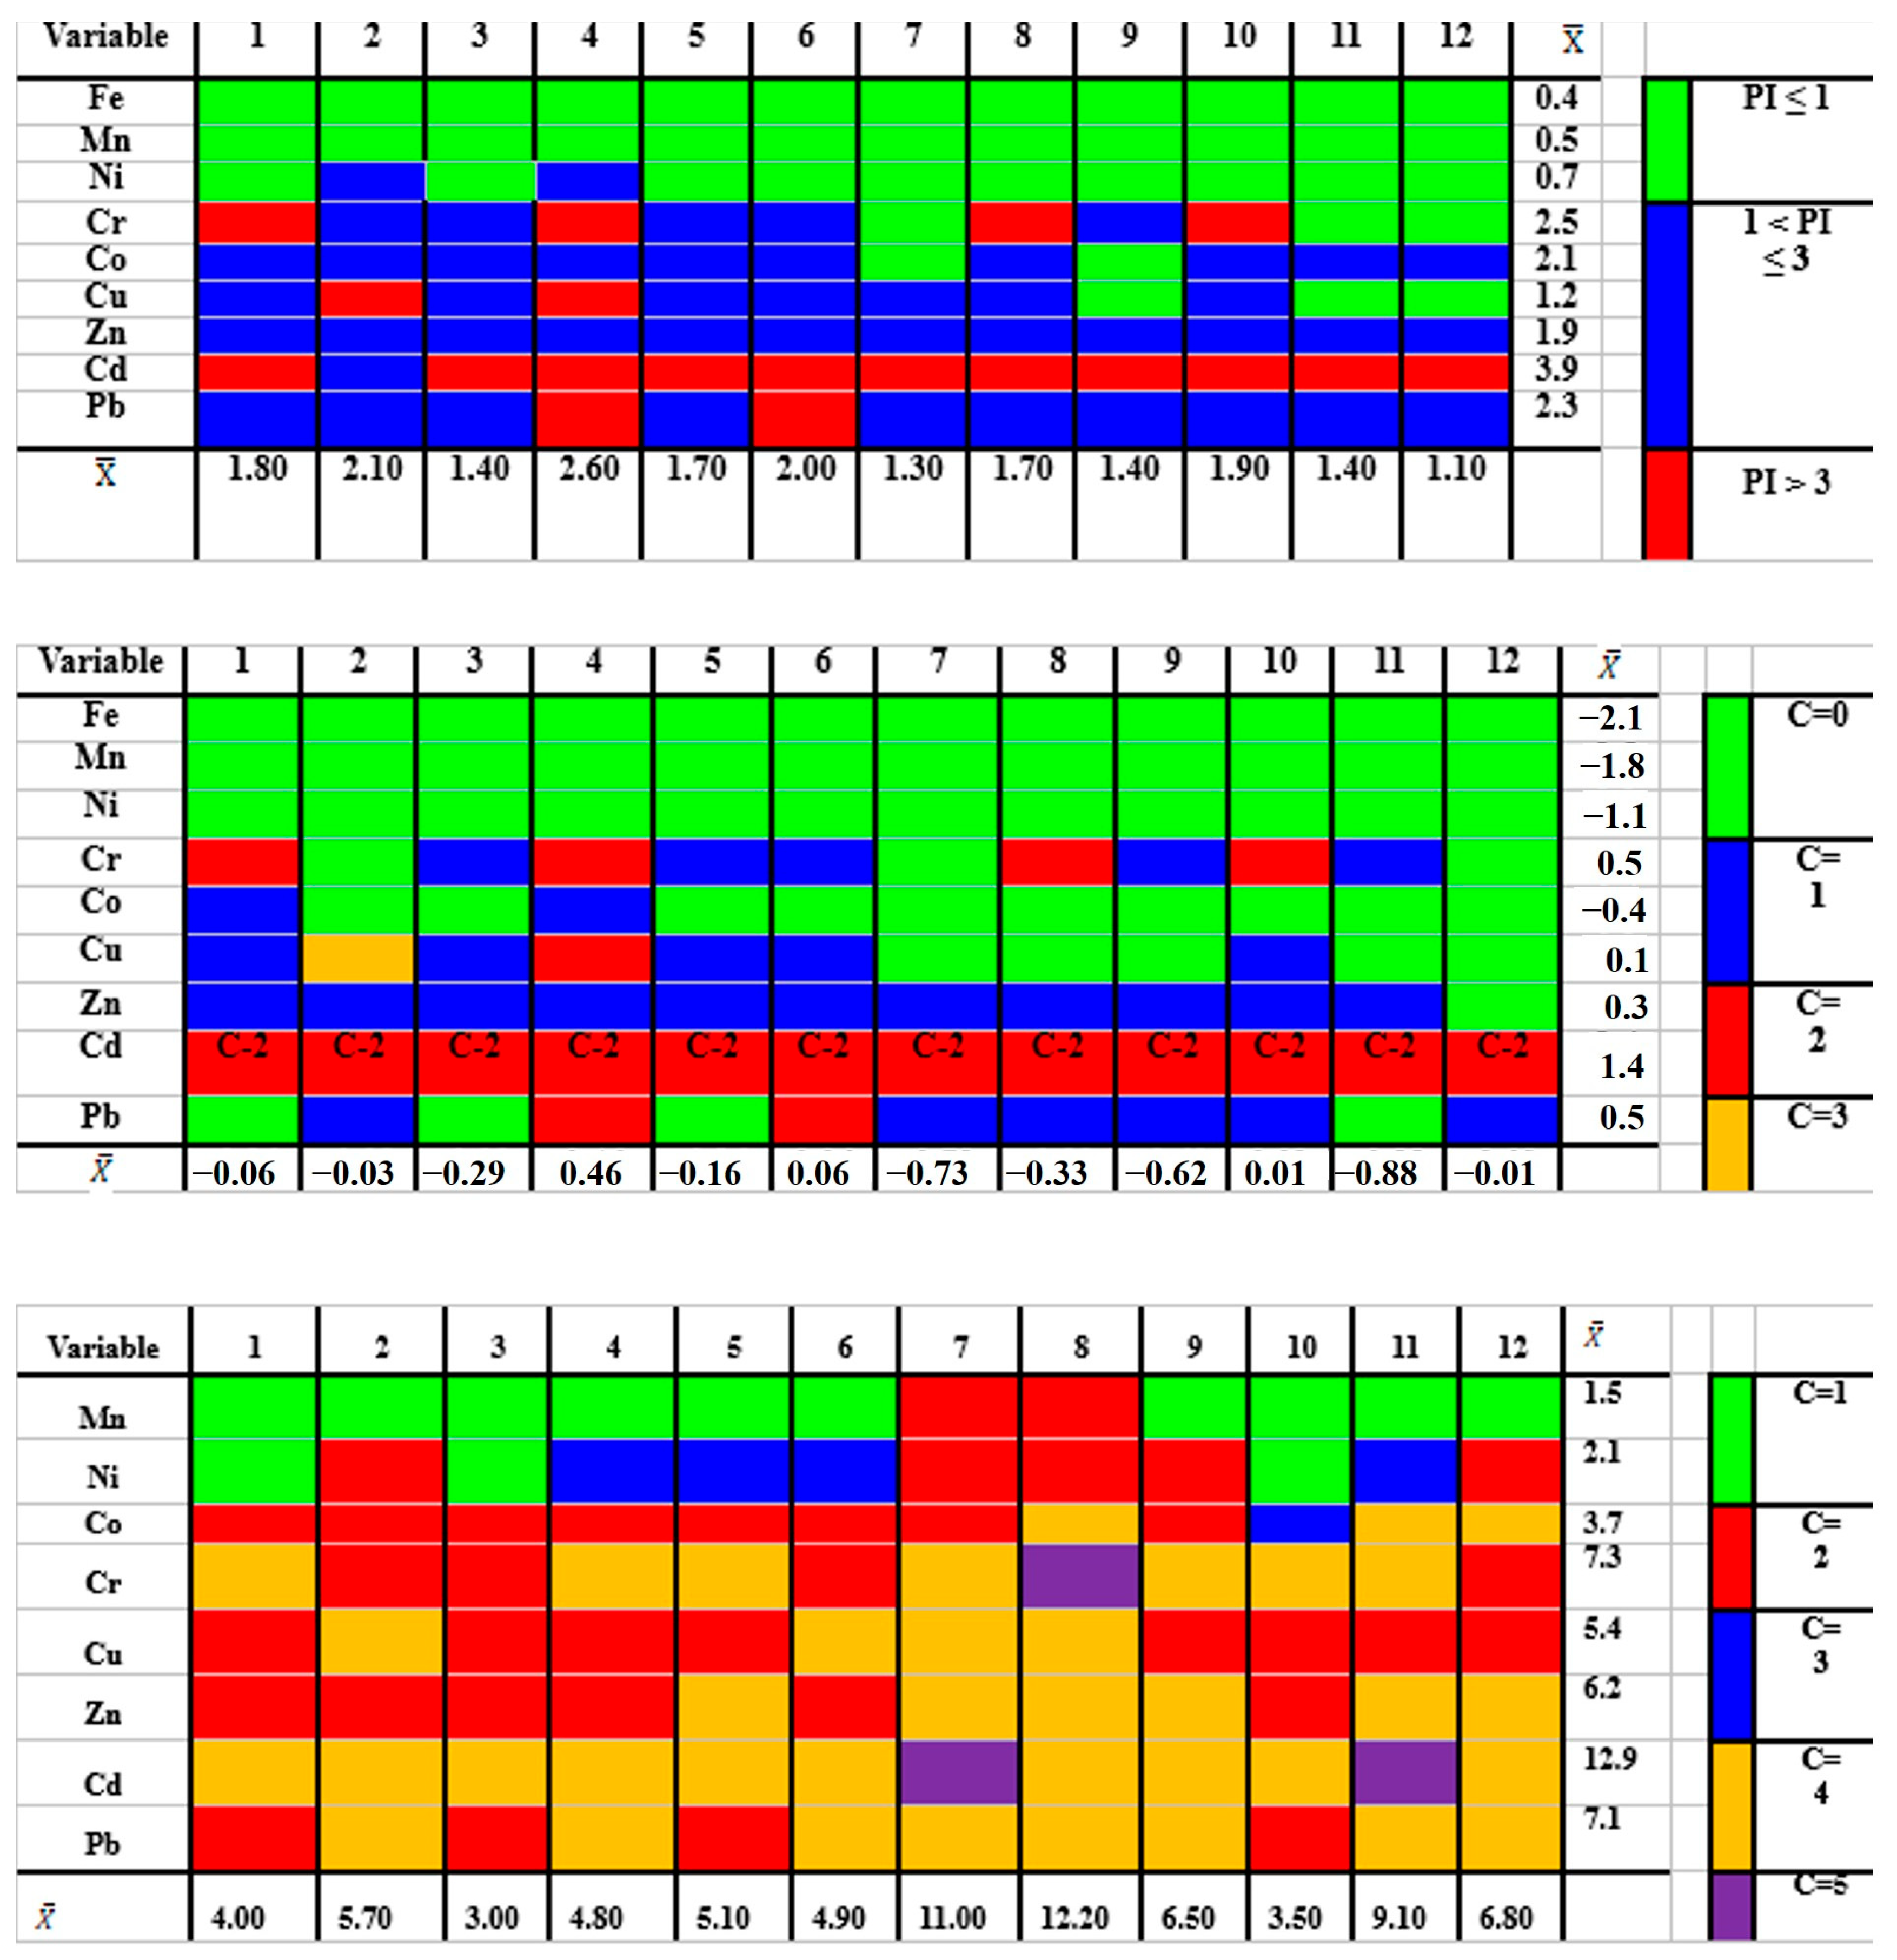
2.3. Assessment of PTM Pollution

To evaluate the level of PTM contamination, different pollution indices are determined. The pollution index (PI) of each metal is defined as the ratio of its concentration to the background value of the corresponding metal, as shown in Equation (1):
PI = C/S
where PI is the pollution index of each sample, C (mg/kg) is the measured concentration of each PTM, and S (mg/kg) is the background value. The metal content values from [45] are considered the natural baseline level (background). The use of continental crust values as a reference for background concentrations is a well-established practice in environmental studies [46,47], offering a standardised basis for comparison across different regions. However, it is important to acknowledge that these values may not be fully representative of local conditions, as background concentrations can vary depending on the specific geochemical characteristics of the region being studied. This limitation should be considered, particularly in areas where local background data are available or when more region-specific reference values could provide a more accurate basis for comparison. While Wedepohl’s values are widely used as reference baseline concentrations, their application in this study should be regarded as an approximation for the region’s natural background levels. This approach is acceptable in the absence of specific regional data, but it is important to recognise that the applicability of these values may be limited in certain contexts. The PI for each metal is categorised as follows: low contamination (PI ≤ 1), moderate contamination (1 < PI ≤ 3), or high contamination (PI > 3).
The (PLI) of the samples is determined using PTM data, with metal concentrations from the mean global crust serving as background values [48]. The PLI of the soil can be computed by taking the nth root of the product of the contamination factors (CFs) for all metals, where n represents the number of metals analysed, as in Equation (2):
P L I = C F 1 × C F 2 × C F 3 × × C F n n
where CF = Cmetal/Cbackground, and the values vary from unpolluted to slightly polluted (0–2) to extremely polluted (8–10).
Ref. [49] first proposed a geo-accumulation index (Igeo) to assess and characterise metal pollution in sediments by contrasting the present concentrations with pre-industrial levels, as shown in Equation (3).
Igeo = log2[Ci/(1.5Cri)]
where Ci is the calculated concentration of studied metal in the sediment, and Cri is the reference value or geochemical background concentration of metal i. Owing to extremely slight anthropogenic influences and potential differences in background values for a particular metal, a factor of 1.5 was utilised. Igeo is categorised into seven classes to assess metal contamination levels: Class 0 (Igeo ≤ 0) indicates uncontaminated conditions; Class 1 (0 < Igeo ≤ 1) ranges from uncontaminated to moderately contaminated; Class 2 (1 < Igeo ≤ 2) signifies moderately contaminated soils; Class 3 (2 < Igeo ≤ 3) indicates a transition from moderately to strongly contaminated; Class 4 (3 < Igeo ≤ 4) represents strongly contaminated soils; Class 5 (4 < Igeo ≤ 5) signifies a shift from strongly to extremely contaminated; and Class 6 (Igeo > 5) indicates extremely contaminated conditions.
The EF of each element in the samples was calculated by standardising the measured element against a reference element. Commonly used reference elements include Al, Fe, and K [50,51]. The EF is expressed using Equation (4) below.
EF = (Cx/Fe)soil/(Cx/Fe)background
where (Cx/Fe)soil represents the metal-to-Fe ratio in the samples of interest, and (Cx/Fe)background denotes the natural background value of the metal-to-Fe ratio. In this study, because of the unavailability of background values for Fe and heavy metals specific to the study area, average metal values from the continental crust were utilised. The anticipated EF classes, along with their corresponding sediment quality, ranged from six, indicating extremely high enrichment, to one, signifying enrichment derived entirely from crustal materials. The use of continental crust values as a reference is a well-established and widely accepted practice in environmental studies. This approach ensures standardisation and enables comparisons across studies conducted in different regions [47].

2.4. Health Risk Assessment (HRA)

To assess the potential health risks associated with PTM exposure in college students, the human exposure model of risk developed by the United States Environmental Protection Agency [52] was applied; university students may encounter dust through several pathways, including direct oral intake, respiratory, and dermal contact [53]. The average daily dose (ADD) for each exposure pathway was determined using the formulas outlined in Equations (5)–(7), as proposed by [52,54].
A D D i n g   = C × I R i n g × E F × E D B W × A T   ×   10 6
A D D i n h   = C X I R i n h × E F × E D B W × A T × P E F
A D D d e r m a l   = C × E F × E D × S L × S A × D A F B W × A T   ×   10 6
In this study, the ADD, expressed in mg kg−1 day−1, was calculated for each exposure route: ingestion (ADDing), inhalation (ADDinh), and dermal contact (ADDdermal). The exposure frequency (EF) was set to approximately 280 days per year, accounting for vacations during the academic year. The exposure duration (ED) aligned with the typical four-year timeframe for a higher education degree in Egypt. The ingestion rate (IRing) for the students was set to 100 mg/d [52]. The average body weight (BW) used in the analysis was 77.3 kg for males and 75.1 kg for females. The average exposure time (AT) was calculated differently for non-carcinogenic and carcinogenic substances. AT is equivalent to 365 days multiplied by the exposure duration (ED) of non-carcinogens. The exposure times for carcinogens were 24,528 days for males (67.2 years × 365 days) and 26,207 days for females (71.8 years × 365 days). The inhalation rates (IRinh) were recorded as 18.7 m3 per day for male students and 14.6 m3 per day for female students. Additionally, the skin adherence factor (SL) was set at 0.07 mg per cm2 per day, following the guidelines from the [55]. The area of exposed skin (SA) was 4250 cm2 for male students and 3750 cm2 for female students. The dermal absorption factor (DAF) was set at 0.001 for all metals except arsenic (As), which had a higher value of 0.03, as reported in [56].
The particle emission factor (PEF) was set as 1.36 × 10⁹ m3 kg−1 (EPA 2001). For the calculations involving the PTM contaminants in Equations (4)–(6), the concentration, denoted as (C), is expressed in milligrams per kilogram (mg/kg). The values are broadly reflective of the typical age and physical profiles of university students in Egypt, which are generally comparable to those of young adults. Additionally, the physical activity levels and behaviours typical of university students, such as higher exposure to outdoor environments and dust, support the use of adult parameters in this context.
Equations (8) and (9) present the formulas used to assess the non-carcinogenic risk (hazard index; HI) and carcinogenic risk (RT), respectively.
HI = H Q i = A D D i n g R f D i n g
R T = R i = A D D i n g ×   S F i n g
The hazard quotient (HQ) represents the HI associated with exposure to a single pollutant, whereas the HI accounts for the combined risk from multiple exposure pathways. HQ or HI values greater than one indicate a potential HI, whereas values below one suggest that the risk is minimal or negligible. RT was evaluated based on the cancer risk level. An RT value between 10−6 and 10−4 is considered within an adequate range for human health [57]. According to [58], values of RT exceeding 10−4 signal a significant cancer risk, whereas values below 10−6 are indicative of no substantial cancer risk. Table 1 lists the values of the slope factor of carcinogenic pollutants (SF) and the reference dosage of non-carcinogenic pollutants (RfDing) in the PTMs.

2.5. Positive Matrix Factorisation (PMF)

PMF is a powerful technique for identifying and quantifying pollutant sources, and it has been effectively applied in environmental studies [62]. This method excels in source apportionment by decomposing a data matrix into a set of factors that represent distinct sources of pollution and their contributions to observed pollutant levels [63], as it operates on the principle of factor analysis. According to [63,64,65], PMF is particularly useful for analysing pollutants in various environmental matrices, including soil, air, and sediments. In this study, PMF 5.0, provided by the U.S. Environmental Protection Agency (EPA), was employed to analyse dust samples collected from 12 distinct locations. The PTM concentration and uncertainty values were used as input files. The uncertainties associated with the PTM concentrations, which encompassed sampling and analytical errors, were calculated as described by [66,67]. The analysis focused on nine PTMs, and the decomposition was performed with a five-factor model. This approach facilitated the identification of key pollution sources and their respective contributions to the metal concentrations in the dust samples.

2.6. Spatial Analysis

Geochemical maps were constructed using Surfer 8 software Golden Software Inc., Golden, CO, USA. Statistical analyses of the PTM concentrations, along with the percentages of organic materials and carbonates, were performed using MINITAB 16.0 statistical software. The dataset was summarised using descriptive statistics, such as the mean, median, minimum, maximum, and standard deviation. Relationships between different PTMs were established using multivariate statistical analyses. The correlation matrix (CM) was used to determine the Pearson correlation coefficients, which helped identify the linear relationships between metal content and soil characteristics. PCA was utilised to reduce the dimensionality of the dataset and understand the potential PTM sources while categorising them as geogenic, anthropogenic, or mixed based on their contributions to variance [68]. Cluster analysis (CA) grouped soil samples into distinct geochemical categories based on similarities in PTM contents, indicating common sources or environmental conditions. Additionally, the PMF decomposed the PTM concentration data into factors representing different pollution sources and quantitatively estimated their contributions to the observed concentrations.
The relationship between the sampling points and campus activities was explored to better understand the influence of these factors on heavy metal contamination. Points located near high-traffic areas, such as parking lots, exhibited higher concentrations of metals typically associated with vehicle emissions, including Pb and Cd. On the other hand, sites located close to agricultural labs or green areas showed elevated levels of metals linked to the use of fertilisers and chemicals, such as Zn and Cu. These observations suggest that campus activities, including vehicular emissions and agricultural practices, significantly contribute to the observed contamination patterns.

3. Results and Discussion

3.1. PTM Concentration and Pollution Assessment

Descriptive statistics for the physicochemical (total organic carbon (TOC), total carbonate, and pH) and PTM contents (Fe, Mn, Co, Ni, Pb, Zn, Cu, Cr, and Cd) in the soil from the Sohag University campus are provided in Table 2. The measured pH values ranged between 7.6 and 8.6. All soil samples were alkaline (pH > 7.5), with an average pH of approximately 8. Overall, pH values did not vary significantly across the study area. These alkaline conditions reflected the effects of the carbonate fraction. According to [69,70], PTM mobility is influenced by pH. At higher pH levels, PTMs are adsorbed onto mineral surfaces, whereas they become more mobile in acidic environments. Additionally, the sorption of Cu, Zn, and Cd was enhanced by increasing pH [71]. Alkaline conditions are typically observed in regions with silicate and carbonate parent materials, whereas acidic conditions are more likely to develop in areas receiving wastewater effluents rich in organic matter.
The topsoil of the examined sites displayed a broad range of carbonate contents, varying from 0.5% to 11.5%, with an average of 5.2%. Refs. [72,73] investigated the Sohag region, identified significant variations in total carbonate content, and found that calcium carbonate accumulates closer to the surface in dry and semi-arid areas. Coarse-textured soils exhibited a range of 7.28%–56.4%, whereas medium-textured soils exhibited values between 1.07% and 7.68%. In contrast, fine-textured soils had carbonate contents ranging from 0.00% to 7.05%. Moreover, the topsoil layer samples had organic matter concentrations ranging from 0.2% to 3.9% (mean = 1.7). There can be wide variations in the type and quantity of organic matter in the soil. Ref. [74] demonstrated that organic matter is a key factor influencing the specific adsorption of trace metals in different soils. Additionally, the average PTM concentrations in the urban areas were as follows: Fe > Mn > Zn > Cr > Pb > Cu > Co > Ni > Cd, which can be compared to those in the mean crustal composition (Table 2).
Cr, Pb, Cu, Cd, and Zn were present at high concentrations in the topsoil samples. Elevated concentrations along with higher standard deviation values suggest that these components may have anthropogenic origins. The concentrations of Co and Ni were low, resembling the levels reported for Wedepohl’s mean crustal composition. The coefficient of variation (CV) of an elemental concentration can reveal both the variation and interference of human activity; a higher CV value denotes a greater anthropogenic influence [75]. In particular, little variation was indicated by a CV ≤ 15%, moderate variation by a CV < 35%, and significant variance by a CV > 35%. The CV values of the PTMs decreased in the following order: Zn > Cd > Cu > Cr > Pb > Mn, Ni, and Fe > Co (Table 2). Significant human activity was indicated by the high variability (CV > 35%) of Zn, Cu, and Pb content in the soil from the university campus in Sohag [75].

3.2. PTM Spatial Distribution

The spatial patterns of soil pH, TOC, and CaCO3 contents across the study site exhibited distinct trends (Figure 2). TOC levels were highly variable, averaging 1.7%, with pockets of elevated values (>2%) in the southern and northwestern sections, characterised by more productive agricultural soil. The soil pH values were neutral to slightly alkaline, ranging from 7 to 8.4, with the lowest pH levels concentrated in the south. In addition, the CaCO3 content was more heterogeneously distributed, indicating an increasing trend toward the central and southeastern sections.
The PTM spatial distribution within the study area was highly heterogeneous. Figure 3 demonstrates the spatial distribution of PTMs in the soil, characterised by localised ‘hotspots’ in the northern and central sections, where a high metal concentration was bordered by lower levels. In contrast, high concentrations of Cr, Cd, and Fe were detected in the southern and northern regions. This spatial variability underscores the importance of comprehensive site characterisation to fully understand the PTM contamination patterns and potential exposure pathways within the region.

3.3. PTM Ecological Risks

The mean values of Fe, Mn, and Ni were low, ranging from 0.1 to 0.6, 0.1 to 0.8, and 0.4 to 1.3, respectively (Figure 4). Excluding samples 2 and 4, which were at the mid-level for Ni, all samples had low PIs, with mean PIs for Fe, Mn, and Ni of 0.4, 0.5, and 0.7, respectively. This suggests that the concentration of the former metals in the soil samples was comparable to that in the average crust, and that there was no evident pollution by these metals in the soil samples under investigation.
The average PI values for Cr, Pb, Co, Zn, and Cu were 2.5, 2.3, 2.1, 1.9, and 1.2, respectively, indicating moderate contamination. The PIs of Cd were higher, as all samples contained high PIs, except sample 2, which had a moderate value. The PIs ranged from 1.04 to 8.43 for Pb, whereas the PI for Cu varied between 3.1 and 5.1. According to this study, the urban green spaces at the university are heavily contaminated with Cd. The university campus is situated in a densely populated urban area, increasing the potential for Cd deposition from various sources. The proximity of these parks to busy roads, parking lots, and ageing infrastructure can lead to the accumulation of Cd-containing particles from vehicle emissions, brake and tyre wear, and the weathering of older buildings and facilities. Furthermore, the high volumes of foot traffic and recreational activities common in university parks can disturb the soil, potentially exposing students, faculty, and staff to contaminated materials.
Similarly to PIs, the PLI can provide a more comprehensive assessment of the pollution status. The PLI values across the different sites ranged from 0.7 to 2.1 (Figure 4). High pollution load values (Section 2.1) were found at Site 4, indicating a high pollution potential. The remaining sites had relatively modest pollution load values, between 0.7 and 1.6, suggesting that these samples were slightly polluted. A high PLI in university campus soils can negatively affect the growth and development of plants, as well as the overall health and diversity of the soil biota. Furthermore, exposure to contaminated soil, either through direct contact or indirect pathways, can lead to serious health risks for students, faculty, staff, and particularly vulnerable populations such as children. A high PLI can also damage the reputation of an institution and potentially result in legal concerns if the pollution levels exceed regulatory thresholds. Soil contamination was confirmed using Igeo. Based on the results, the mean Igeo of the PTMs in the soil declined in the following order: Cd (1.4) > Pb, Cr (0.5) > Zn (0.3) > Cu (0.1) > Co (−0.4) > Ni (−1.1) > Mn (−1.8) > Fe (−2.1). The assessed PTMs reflect varying levels of pollution. Based on the pollution degree standard of Igeo, mean values <0 occurred for Fe, Mn, and Ni in all soil samples and for Cr, Co, Cu, Zn, and PB in 25%, 83%, 42%, 8%, and in 33% of the samples, respectively, indicating that these PTMs were not regarded as soil pollutants. Moreover, the mean Igeo values of Zn, Pb, Cu, Cr, and Co in 92%, 50%, 42%, 42%, and 16% of soil samples, respectively, had values within 0–1, suggesting uncontaminated-to-moderately contaminated pollution levels. The mean Igeo values for Cr, Cu, Cd, and Pb were between 1 and 2 in 33%, 8%, 100%, and 16% of the samples, respectively, indicating moderate pollution levels. Only 8% of the samples showed mean Igeo values for Cu between 2 and 3, indicating high pollution levels. The EF values across samples ranged from 3.0 to 12.2 (Figure 4).
Approximately 42% of the samples had EF values less than 5, indicating moderate enrichment, whereas those remaining fell in the significant enrichment class (58%). For Cd, Pb, Cr, Zn, Cu, and Co, the corresponding EF values above 5 were 83%, 67%, 58%, 50%, 33%, and 25%, respectively. Excluding Co, which has an EF class of 3, these metals have an EF class of 4, with a notable enhancement in PTMs. Cr displayed the greatest EF (EF = 23) for sample 8, indicating extremely high enrichment. The remaining Cr enrichment was moderate-to-significant. In contrast, 83% of the Cd exhibited considerable enrichment, whereas 17% displayed very high enrichment. To further validate the reliability of the EF calculations, a sensitivity analysis was conducted by comparing results from the global crustal averages with baseline values from similar geochemical settings. The comparative analysis revealed consistent enrichment trends, particularly for Cd, Pb, and Cr, supporting the use of crustal averages as an interim reference.
Despite some limitations, the observed EF patterns, especially for Cd, Cr, and Pb, indicate significant anthropogenic contributions, aligning with earlier studies conducted in urban and campus settings [53,76]. These findings indicate the need for ongoing monitoring and the eventual development of local geochemical baselines to enhance site-specific pollution assessments.

3.4. Health Risks from PTMs

HQ and HI were used to evaluate the health risks from PTMs in dust collected from college campuses for both male and female students, as shown in Table 3. Three exposure routes were considered, namely ingestion, inhalation, and dermal contact. These results suggest that dust ingestion is the main exposure route for most PTMs, which is consistent with the findings of other studies. For both sexes, the non-carcinogenic risks of PTMs such as Zn, Ni, Cr, Cu, and Pb followed the order HQing > HQdermal > HQinh, indicating that ingestion was the most significant exposure pathway. In contrast, for Mn and Co, the risks followed the order of HQing > HQinh > HQdermal. Notably, Pb exhibited the highest value for HQing, Mn showed the highest HQinh, value, and Cr showed the highest HQdermal for both sexes, although none of the HQ values exceeded 1. This suggests that the non-carcinogenic risks posed by these metals are within acceptable levels. For both male and female students, the HI values, which evaluated the cumulative risk of exposure to multiple PTMs, were ranked as follows: Cr > Mn > Pb > Zn > Cu > Ni > Co. All HI values remained below 1, confirming that HI values were minimal for the student population. Female students exhibited slightly higher HI values than male students.
Regarding RT, the exposure to Ni, Cr, and Co was evaluated based on ingestion, inhalation, and dermal contact. The RT values for these metals ranged between 10−4 and 10−6, remaining within acceptable limits for human health. Although Ni and Cr contributed more significantly to the overall RT, the total risk for both male and female students remained below the threshold of concern. The risk ranking for carcinogenic elements for both sexes was Cr > Co > Ni. The cumulative HI values for all metals were below 1, indicating no significant HI from dust exposure. However, it remains essential to monitor carcinogenic metals such as Cr and Ni owing to their potential long-term health impacts. Regular dust sampling and analysis are critical for ensuring exposure levels remain within safe limits. This analysis highlights the importance of ongoing environmental monitoring and mitigation measures to reduce PTM accumulation in campus dust and safeguard student health.

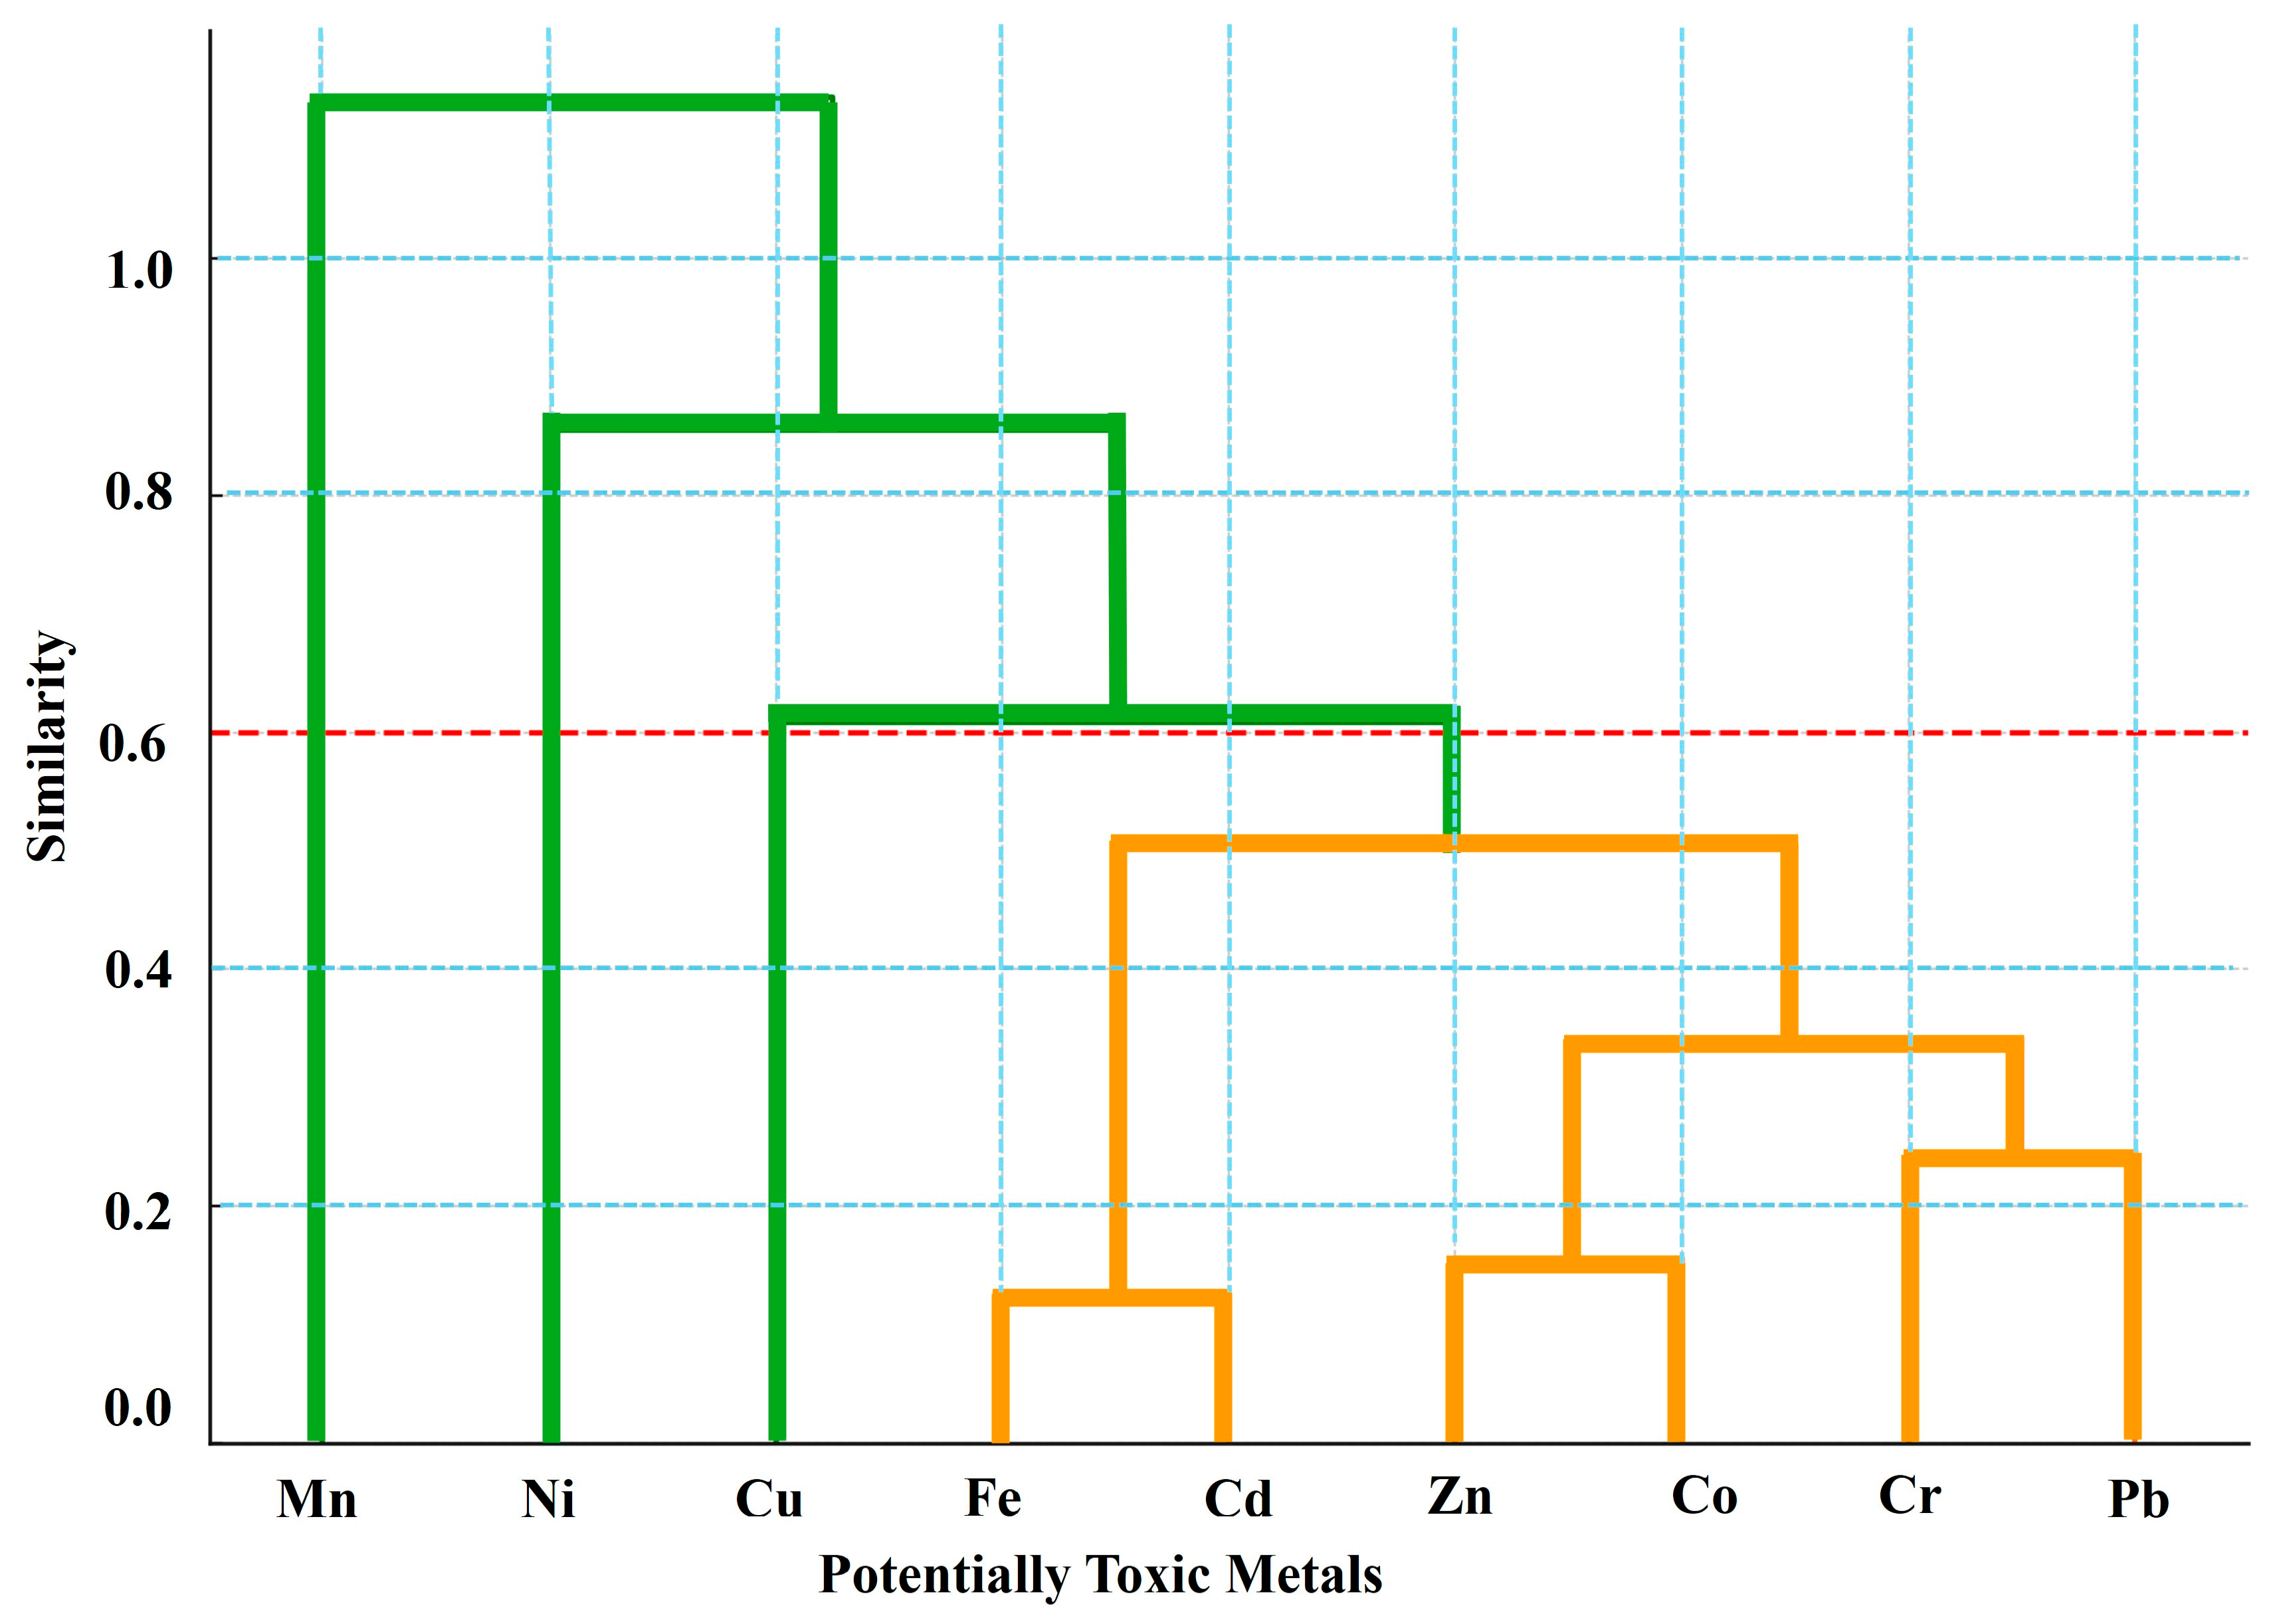
3.5. PTM Source Apportionment

The PMF analysis identified five distinct sources contributing to PTM concentrations in the collected dust samples (Figure 5, Figure 6 and Figure 7). These sources were determined based on the concentrations and contributions of the different PTMs to each factor [77,78,79]. Factor 1 exhibits high concentrations of Cu, Ni, and Cr, with Cu accounting for the largest proportion. This suggests the strong influence of industrial activities and anthropogenic sources [80,81,82,83], including the wear and tear of metallic objects, paintings, and automotives. The presence of Ni and Cr, which are typically associated with industrial pollution [84,85], further supports this hypothesis. The presence of Cu in Factor 1 indicates both industrial emissions and vehicular activity, particularly in areas close to workshops and automotive maintenance facilities [86,87,88,89,90]. Factor 2 is dominated by high levels of Pb and Zn. Pb has long been associated with traffic pollution [91], and although the use of Pb gasoline has been eliminated, residues from historical emissions persist in the environment [92]. Zn, which is widely used in tyre vulcanisation, is attributed to traffic-related sources [93]. This factor reflects the cumulative effects of vehicular wear, exhaust emissions, and road dust resuspension [94,95].
The third factor was described by the elevated loadings of Fe, Mn, Co, and Ni, which are typically geogenic in origin [96,97,98]. Fe, a lithogenic element, exhibited strong correlations with Mn, Co, and Ni, all of which are naturally abundant in soil derived from bedrock. This factor indicates the dominance of natural processes, including soil erosion and rock weathering, that contribute to dust accumulation on university campuses [99]. Factor 4 showed significant contributions from Cd and Cr, which are often linked to agricultural practices, particularly the use of pesticides and fertilisers. Cd is present in phosphate fertilisers [100,101,102], which can lead to soil contamination and subsequently enter the dust [103,104,105]. This factor reflects the anthropogenic impacts of farming practices and the associated application of agrochemicals [106,107,108].
Factor 5 represents a mixed source with contributions from both industrial releases and vehicle-related pollutants. Metals such as Cu, Zn, and Pb contributed to this factor, aligning with the industrial and vehicular activities observed around campuses [109,110,111,112]. Moderate concentrations of these metals suggest overlapping pollution sources from industry and traffic.
To validate the PMF analysis and reduce reliance on speculative interpretations, the proportional contributions of each factor were compared with spatial distribution patterns observed in the study area (Figure 3). For example, higher concentrations of Pb and Zn in areas near roads and parking lots support the classification of Factor 2 as traffic-related sources. Similarly, elevated levels of Cd and Cr in green spaces near agricultural zones confirm the identification of Factor 4 as being linked to agrochemical inputs. Additionally, the correlation matrix (Figure 8) provided further evidence supporting the PMF results. Strong correlations between Fe, Mn, and Co (r = 0.72 and r = 0.67, p < 0.01) reinforced their assignment to geogenic processes in Factor 3. Likewise, moderate correlations between Pb, Zn, and Cd (r = 0.51–0.65) highlighted potential overlapping sources from traffic and agricultural practices. Hierarchical clustering analysis (Figure 9) also identified groups of metals that share similar environmental behaviours and sources, offering complementary insights into the PMF results.
Figure 7 illustrates the proportional contributions of the five factors to the overall distribution based on their normalised contributions. Factor 5 was the most influential, accounting for 30% of the total and exerting the greatest impact. Following this, Factor 2 contributed 25%, marking it as a significant, although secondary, element of the distribution. Factor 1 had a moderate influence, contributing to 20% of the overall distribution. Factors 3 and 4 contributed 15% and 10%, respectively, with Factor 4 having the smallest impact. Despite the strength of the PMF results, this study acknowledges its limitations. The lack of isotopic or source-specific markers limits the precision of source apportionment [113]. Future research could benefit from integrating isotopic analyses, high-resolution chemical profiling, or direct source monitoring to strengthen the identification and quantification of pollution sources.
The Pearson correlation matrix (Figure 8) provides valuable insights into the relationships between the PTMs in the topsoil of the green areas of Sohag University by quantifying the strength and significance of their linear correlations. Strong positive correlations were observed between Fe and Ni (r = 0.69, p < 0.01), and between Fe and Mn (r = 0.72, p < 0.01). These correlations suggest that these PTMs may have originated from similar sources, such as industrial or vehicular emissions. This alignment was consistent with the PMF factors that identified these metals as originating predominantly from human activity.
In addition, Fe and Co displayed a notable correlation (r = 0.67, p < 0.05), reinforcing their potential common sources in industrial and geogenic processes. The substantial correlation between Ni and Pb (r = 0.51) and the moderate relationship with Zn (r = 0.48) indicated a possible overlap in sources, likely tied to both vehicular and industrial emissions. These metals are often present in environments that are affected by traffic and manufacturing processes. Cr was closely correlated with Mn (r = 0.65, p < 0.05) and moderately correlated with Co (r = 0.63, p < 0.05), suggesting that these PTMs may be associated with similar industrial sources, reflecting shared emission patterns.
Additionally, the matrix shows that Zn, although primarily linked to traffic through tyre wear, is correlated with Pb and Cd, which could be indicative of mixed sources, including vehicular emissions and inputs from industrial activities or agricultural practices. The relatively weaker correlations involving Cd, with slight negative correlations with Cu and Ni, suggest divergent sources or behaviours in the environment, likely indicating specific anthropogenic sources, such as agriculture, as noted in its linkage with phosphate fertilisers in the PMF findings. This comprehensive overview provided by the Pearson correlation matrix confirms and expands upon the source apportionment insights from the PMF, illustrating a complex web of relationships and source influences among the studied PTMs.
Figure 9 illustrates the hierarchical clustering of the nine PTMs, which is based on similarities in their concentrations across the samples, with metals that have higher similarity or co-occurrence forming closer clusters [114]. The Fe, Mn, and Co clusters suggest that these metals likely share a common geogenic or industrial source, as supported by their similar environmental behaviours and strong correlations. Another prominent cluster included Ni and Cu, which were grouped closely because of their strong correlation, likely reflecting common industrial sources, including metal processing and vehicular emissions.
Conversely, the grouping of Pb, Cr, Zn, and Cu suggested potential source overlap from a combination of industrial and traffic emissions, with Pb and Zn commonly associated with vehicular sources. Lastly, Cd exhibited separate branching in the dendrogram, indicating a distinct source likely related to agricultural activities, particularly its presence in phosphate fertilisers, as detailed in the PMF analysis. The horizontal axis in the dendrogram represents the degree of similarity between the metals, with shorter linkage lengths indicating a higher degree of similarity. This clustering pattern highlights the possible shared pollution sources or environmental behaviours of certain metals. These correlation and clustering analyses provided a comprehensive understanding of the environmental dynamics affecting PTM pollution. They validated and complemented the source apportionment findings from the PMF analysis, emphasising the significance of both geogenic and anthropogenic sources in influencing the PTM distribution in the study region. This integrated approach is critical for devising effective environmental monitoring and management strategies.

3.6. Comparison with Previous Similar Works

This study builds upon and contributes to a growing body of research investigating PTM pollution in urban soils, including university campuses and similar environments. Table S1 provides a summary of comparable studies conducted globally, highlighting methodologies, findings, and sources of PTM pollution in campus or urban soils. These studies illustrate the broader relevance of the findings at Sohag University and emphasise the significance of adopting transferable methodologies, such as pollution indices and PMF, to identify pollution sources and assess environmental risks.
These studies highlight consistent findings across different geographical and environmental contexts. For instance, Pb and Zn are frequently identified as major pollutants in urban environments due to traffic-related emissions, as observed in studies conducted in Xi’an, China [53], and Vilnius, Lithuania [115]. Similarly, elevated Cd concentrations linked to anthropogenic activities were reported in Madrid, Spain [116], as well as in this study. The methodologies employed across these studies, such as PMF, pollution indices (e.g., PI, PLI, Igeo, and EF), and HRA, align with those used in this study. These methodologies have proven effective in assessing PTM contamination and apportioning sources, reinforcing their value for environmental monitoring and risk evaluation.
By comparing findings, the current study emphasises the broader relevance of assessing PTM pollution in university and urban soils. The results from Sohag University provide a valuable reference for implementing similar environmental monitoring programmes in other academic and urban settings. To contextualise our findings, we compared our results with those of previous studies conducted in urban environments and university campuses worldwide (Table S1) [9,53,117,118,119,120,121,122,123].

3.7. Implications

Based on the findings from this study, we recommend that universities and other educational institutions implement targeted pollution control strategies, particularly in areas with high traffic flow and industrial activity. Pollution prevention measures, such as the use of low-emission vehicles, regular maintenance of infrastructure, and the incorporation of pollution-reducing vegetation, should be prioritised. Furthermore, the results underline the importance of incorporating sustainable green space planning into campus development, ensuring that green areas are not only aesthetically pleasing but also serve as protective barriers against pollution and contribute to improved environmental quality. Ongoing monitoring of heavy metal concentrations in campus soils and green areas will be essential to track pollution levels and implement necessary mitigation actions. By taking these steps, universities can reduce environmental risks and enhance the safety and well-being of their students, staff, and visitors.

3.8. Limitations

While the methodology employed in this study provided valuable insights into heavy metal contamination and its associated risks, there are several limitations to consider. Relying on global average background values for comparison may not accurately reflect local geochemical conditions, which could lead to inaccuracies in interpreting pollution indicators like the PI. The absence of site-specific background data limits the precision of these assessments. Second, this study’s temporal coverage was limited to a single-season sampling period, which may not capture the full variability in heavy metal concentrations that could occur across different seasons. Seasonal fluctuations in environmental conditions, such as precipitation or temperature, may influence the mobility and distribution of metals. Finally, this study did not account for some site-specific anthropogenic or natural factors, such as localised pollution sources (e.g., nearby industries or construction activities) or the potential effects of historical land use. These unaccounted factors may have contributed to the variability in the data and should be considered in future studies that aim to provide a more comprehensive assessment of contamination sources.

4. Conclusions

The soil from university campuses in Sohag, Egypt, exhibited elevated concentrations of PTMs including Cd, Co, Cr, Cu, Fe, Mn, Ni, Pb, and Zn, compared to natural background values. Among these, Zn, Cd, Cr, and Pb were identified as the most concerning pollutants, with Pb and Cd posing significant ecological and environmental risks due to their toxicity and persistence. The use of pollution indices, such as Igeo and EF, highlighted the contribution of both natural and anthropogenic sources, with Pb, Cd, and Cr identified as key contributors to soil contamination. PCA and CA results further indicated that certain metals, such as Fe, Mn, and Co, were primarily linked to geogenic processes, while metals like Pb, Zn, and Cr were largely associated with anthropogenic activities, particularly traffic emissions and agricultural practices. The PMF analysis identified some distinct sources contributing to the observed contamination, including industrial activities, traffic emissions, natural soil processes, agricultural practices, and mixed sources from both industrial and traffic emissions. These findings highlight the importance of managing anthropogenic pollution sources, especially industrial emissions and vehicle activities, to reduce the ecological risks associated with these contaminants.
Despite the contamination observed, the non-carcinogenic risks for both male and female students were within acceptable limits, as defined by the USEPA thresholds. However, this study emphasises the need for continuous monitoring of carcinogenic metals like Pb and Cd, which present long-term health risks. This study highlights the broader applicability of these findings for other university campuses and urban environments, demonstrating the value of using spatial analysis, pollution indices, and statistical methods to assess and manage heavy metal pollution.
Future research should focus on several key directions to conduct multi-seasonal or long-term monitoring to assess temporal variability in contamination levels and to establish local or regional geochemical background values to provide more context-specific assessments. Expanding comparative studies across multiple urban campuses or green spaces can help generalise findings and inform broader environmental management strategies. These future studies will refine our understanding of pollution dynamics and lead to more targeted mitigation measures.

Supplementary Materials

The following supporting information can be downloaded at https://www.mdpi.com/article/10.3390/min15050482/s1: Table S1. Comparison of similar studies globally on HM assessment in campus soils and related urban settings. References [9,53,117,118,119,120,121,122,123] are listed in the Supplementary Material.

Author Contributions

M.A.: conceptualization, data curation, investigation, formal analysis, and writing—original draft and resources; D.A.: review and editing, and formal analysis; T.A.: writing—review and editing, software, and validation; K.M.A.: methodology, visualisation, and project administration; A.A.: supervision, editing, and software and funding acquisition. All authors have read and agreed to the published version of the manuscript.

Funding

This research was funded by the United Arab Emirates University through grant number [I2S319 and 12S158].

Data Availability Statement

Datasets for this research are included in this paper and its Supplementary Information Files.

Acknowledgments

This study was supported by the United Arab Emirates University through the University Program for Advanced Research (Funds no. 12S139 and 12S158). All experiments were completed at the Environmental Geochemistry Laboratory of the Geology Department, Faculty of Science, Sohag University. Laboratory technicians are appreciated for their help in experiments.

Conflicts of Interest

The authors declare no conflict of interest.

References

  1. Arora, N.K.; Chauhan, R. Heavy Metal Toxicity and Sustainable Interventions for Their Decontamination. Environ. Sustain. 2021, 4, 1–3. [Google Scholar] [CrossRef]
  2. Riyazuddin, R.; Nisha, N.; Ejaz, B.; Khan, M.I.R.; Kumar, M.; Ramteke, P.W.; Gupta, R. A Comprehensive Review on the Heavy Metal Toxicity and Sequestration in Plants. Biomolecules 2021, 12, 43. [Google Scholar] [CrossRef]
  3. Rashid, A.; Schutte, B.J.; Ulery, A.; Deyholos, M.K.; Sanogo, S.; Lehnhoff, E.A.; Beck, L. Heavy Metal Contamination in Agricultural Soil: Environmental Pollutants Affecting Crop Health. Agronomy 2023, 13, 1521. [Google Scholar] [CrossRef]
  4. Järup, L. Hazards of Heavy Metal Contamination. Br. Med. Bull. 2003, 68, 167–182. [Google Scholar] [CrossRef] [PubMed]
  5. Li, Y.; Dong, Z.; Feng, D.; Zhang, X.; Jia, Z.; Fan, Q.; Liu, K. Study on the Risk of Soil Heavy Metal Pollution in Typical Developed Cities in Eastern China. Sci. Rep. 2022, 12, 3855. [Google Scholar] [CrossRef] [PubMed]
  6. Larson, L.R.; Jennings, V.; Cloutier, S.A. Public Parks and Wellbeing in Urban Areas of the United States. PLoS ONE 2016, 11, e0153211. [Google Scholar] [CrossRef]
  7. Wiesli, T.X.; Hammer, T.; Knaus, F. Improving Quality of Life for Residents of Biosphere Reserves and Nature Parks: Management Recommendations from Switzerland. Sustain. Sci. Pract. Policy 2022, 18, 601–615. [Google Scholar] [CrossRef]
  8. Lisiak-Zielińska, M.; Borowiak, K.; Budka, A.; Kanclerz, J.; Janicka, E.; Kaczor, A.; Żyromski, A.; Biniak-Pieróg, M.; Podawca, K.; Mleczek, M. How Polluted Are Cities in Central Europe?-Heavy Metal Contamination in Taraxacum Officinale and Soils Collected from Different Land Use Areas of Three Representative Cities. Chemosphere 2021, 266, 129113. [Google Scholar] [CrossRef]
  9. Sojka, M.; Ptak, M.; Jaskuła, J.; Krasniqi, V. Ecological and Health Risk Assessments of Heavy Metals Contained in Sediments of Polish Dam Reservoirs. Int. J. Environ. Res. Public. Health 2022, 20, 324. [Google Scholar] [CrossRef]
  10. Madrid, L.; Díaz-Barrientos, E.; Madrid, F. Distribution of Heavy Metal Contents of Urban Soils in Parks of Seville. Chemosphere 2002, 49, 1301–1308. [Google Scholar] [CrossRef]
  11. Jahandari, A.; Abbasnejad, B. Environmental Pollution Status and Health Risk Assessment of Selective Heavy Metal (Oid) s in Iran’s Agricultural Soils: A Review. J. Geochem. Explor. 2024, 256, 107330. [Google Scholar] [CrossRef]
  12. Wang, S.; Cai, L.-M.; Wen, H.-H.; Luo, J.; Wang, Q.-S.; Liu, X. Spatial Distribution and Source Apportionment of Heavy Metals in Soil from a Typical County-Level City of Guangdong Province, China. Sci. Total Environ. 2019, 655, 92–101. [Google Scholar] [CrossRef]
  13. Wang, C.-C.; Zhang, Q.-C.; Yan, C.-A.; Tang, G.-Y.; Zhang, M.-Y.; Ma, L.Q.; Gu, R.-H.; Xiang, P. Heavy Metal (Loid) s in Agriculture Soils, Rice, and Wheat across China: Status Assessment and Spatiotemporal Analysis. Sci. Total Environ. 2023, 882, 163361. [Google Scholar] [CrossRef]
  14. Zhu, Y.; An, Y.; Li, X.; Cheng, L.; Lv, S. Geochemical Characteristics and Health Risks of Heavy Metals in Agricultural Soils and Crops from a Coal Mining Area in Anhui Province, China. Environ. Res. 2024, 241, 117670. [Google Scholar] [CrossRef]
  15. Rahmadani, A.A.; Syaifudin, Y.W.; Setiawan, B.; Panduman, Y.Y.F.; Funabiki, N. Enhancing Campus Environment: Real-Time Air Quality Monitoring Through IoT and Web Technologies. J. Sens. Actuator Netw. 2024, 14, 2. [Google Scholar] [CrossRef]
  16. Zhang, Y.; Chen, Q. Contents of Heavy Metals in Urban Parks and University Campuses. In IOP Conference Series: Earth and Environmental Science; IOP Publishing: Bristol, UK, 2018; Volume 108, p. 042060. [Google Scholar]
  17. Giordano, A. UNRAVEL THE COMPLEXITIES OF URBAN SOIL CONTAMINATION: REGULATED AND EMERGING METALS CONTAMINANTS IN A POST-INDUSTRIAL CITY. 2024. Available online: https://iris.unito.it/handle/2 (accessed on 30 April 2025).
  18. Li, F. Heavy Metal in Urban Soil: Health Risk Assessment and Management. In Heavy Metals; IntechOpen: London, UK, 2018; p. 337. [Google Scholar]
  19. Rezapour, S.; Siavash Moghaddam, S.; Nouri, A.; Khosravi Aqdam, K. Urbanization Influences the Distribution, Enrichment, and Ecological Health Risk of Heavy Metals in Croplands. Sci. Rep. 2022, 12, 3868. [Google Scholar] [CrossRef]
  20. Pan, L.; Wang, Y.; Ma, J.; Hu, Y.; Su, B.; Fang, G.; Wang, L.; Xiang, B. A Review of Heavy Metal Pollution Levels and Health Risk Assessment of Urban Soils in Chinese Cities. Environ. Sci. Pollut. Res. 2018, 25, 1055–1069. [Google Scholar] [CrossRef]
  21. Clark, H.F.; Brabander, D.J.; Erdil, R.M. Sources, Sinks, and Exposure Pathways of Lead in Urban Garden Soil. J. Environ. Qual. 2006, 35, 2066–2074. [Google Scholar] [CrossRef]
  22. Zhou, H.; Ouyang, T.; Guo, Y.; Peng, S.; He, C.; Zhu, Z. Assessment of Soil Heavy Metal Pollution and Its Ecological Risk for City Parks, Vicinity of a Landfill, and an Industrial Area within Guangzhou, South China. Appl. Sci. 2022, 12, 9345. [Google Scholar] [CrossRef]
  23. Brtnický, M.; Pecina, V.; Hladký, J.; Radziemska, M.; Koudelková, Z.; Klimánek, M.; Richtera, L.; Adamcová, D.; Elbl, J.; Galiová, M.V. Assessment of Phytotoxicity, Environmental and Health Risks of Historical Urban Park Soils. Chemosphere 2019, 220, 678–686. [Google Scholar] [CrossRef]
  24. Huang, J.; Wu, Y.; Sun, J.; Li, X.; Geng, X.; Zhao, M.; Sun, T.; Fan, Z. Health Risk Assessment of Heavy Metal (Loid) s in Park Soils of the Largest Megacity in China by Using Monte Carlo Simulation Coupled with Positive Matrix Factorization Model. J. Hazard. Mater. 2021, 415, 125629. [Google Scholar] [CrossRef]
  25. Rivera, M.B.; Giráldez, M.I.; Fernández-Caliani, J.C. Assessing the Environmental Availability of Heavy Metals in Geogenically Contaminated Soils of the Sierra de Aracena Natural Park (SW Spain). Is There a Health Risk? Sci. Total Environ. 2016, 560, 254–265. [Google Scholar] [CrossRef]
  26. Penteado, J.O.; de Lima Brum, R.; Ramires, P.F.; Garcia, E.M.; Dos Santos, M.; da Silva Júnior, F.M.R. Health Risk Assessment in Urban Parks Soils Contaminated by Metals, Rio Grande City (Brazil) Case Study. Ecotoxicol. Environ. Saf. 2021, 208, 111737. [Google Scholar] [CrossRef]
  27. Han, Q.; Wang, M.; Cao, J.; Gui, C.; Liu, Y.; He, X.; He, Y.; Liu, Y. Health Risk Assessment and Bioaccessibilities of Heavy Metals for Children in Soil and Dust from Urban Parks and Schools of Jiaozuo, China. Ecotoxicol. Environ. Saf. 2020, 191, 110157. [Google Scholar] [CrossRef]
  28. Alotaibi, M.O.; Albedair, L.A.; Alotaibi, N.M.; Elobeid, M.M.; Al-Swadi, H.A.; Alasmary, Z.; Ahmad, M. Pollution Indexing and Health Risk Assessment of Heavy-Metals-Laden Indoor and Outdoor Dust in Elementary School Environments in Riyadh, Saudi Arabia. Atmosphere 2022, 13, 464. [Google Scholar] [CrossRef]
  29. Birgül, A. Assessing Heavy Metal Contamination and Health Risks in Playground Dust near Cement Factory: Exposure Levels in Children. Environ. Geochem. Health 2024, 46, 368. [Google Scholar] [CrossRef]
  30. Zhang, J.; Feng, L.; Liu, Z.; Chen, L.; Gu, Q. Source Apportionment of Heavy Metals in PM2. 5 Samples and Effects of Heavy Metals on Hypertension among Schoolchildren in Tianjin. Environ. Geochem. Health 2023, 45, 8451–8472. [Google Scholar] [CrossRef]
  31. Liu, S.; Zhang, X.; Zhan, C.; Zhang, J.; Xu, J.; Wang, A.; Zhang, H.; Xu, J.; Guo, J.; Liu, X. Evaluating Heavy Metals Contamination in Campus Dust in Wuhan, the University Cluster in Central China: Distribution and Potential Human Health Risk Analysis. Environ. Earth Sci. 2022, 81, 210. [Google Scholar] [CrossRef]
  32. Al-Rawi, A.S.; Aljumialy, A.M.; Saod, W.M.; Al-Heety, E.A. Pollution Level and Sources of Heavy Metals in Indoor Dust from College of Science, University of Anbar Campus, Iraq. In IOP Conference Series: Earth and Environmental Science; IOP Publishing: Bristol, UK, 2024; Volume 1300, p. 012019. [Google Scholar]
  33. Duan, Z.; Wang, J.; Cai, X.; Wu, Y.; Xuan, B. Spatial Distribution and Human Health Risk Assessment of Heavy Metals in Campus Dust: A Case Study of the University Town of Huaxi. Hum. Ecol. Risk Assess. Int. J. 2020, 26, 986–999. [Google Scholar] [CrossRef]
  34. Afroz, R.; Guo, X.; Cheng, C.-W.; Delorme, A.; Duruisseau-Kuntz, R.; Zhao, R. Investigation of Indoor Air Quality in University Residences Using Low-Cost Sensors. Environ. Sci. Atmos. 2023, 3, 347–362. [Google Scholar] [CrossRef]
  35. Massey, D.D.; Habil, M. PM2.5 Exposure Estimates for College Students and Health Risk Assessment. Air Qual. Atmos. Health 2024, 17, 2529–2538. [Google Scholar] [CrossRef]
  36. Schulte, L. Environmental and Occupational Medicine. In Goodman and Fuller’s Pathology: Implications for the Physical Therapist; Elsevier: Amsterdam, The Netherlands, 2020; p. 90. [Google Scholar]
  37. Thongyuan, S.; Khantamoon, T.; Aendo, P.; Binot, A.; Tulayakul, P. Ecological and Health Risk Assessment, Carcinogenic and Non-Carcinogenic Effects of Heavy Metals Contamination in the Soil from Municipal Solid Waste Landfill in Central, Thailand. Hum. Ecol. Risk Assess. Int. J. 2021, 27, 876–897. [Google Scholar] [CrossRef]
  38. Jia, Z.; Li, S.; Wang, L. Assessment of Soil Heavy Metals for Eco-Environment and Human Health in a Rapidly Urbanization Area of the Upper Yangtze Basin. Sci. Rep. 2018, 8, 3256. [Google Scholar] [CrossRef]
  39. Modabberi, S.; Tashakor, M.; Sharifi Soltani, N.; Hursthouse, A.S. Potentially Toxic Elements in Urban Soils: Source Apportionment and Contamination Assessment. Environ. Monit. Assess. 2018, 190, 1–18. [Google Scholar] [CrossRef] [PubMed]
  40. Arshad, A.; Ashraf, M.; Sundari, R.S.; Qamar, H.; Wajid, M.; Hasan, M. Vulnerability Assessment of Urban Expansion and Modelling Green Spaces to Build Heat Waves Risk Resiliency in Karachi. Int. J. Disaster Risk Reduct. 2020, 46, 101468. [Google Scholar] [CrossRef]
  41. Abdelfadil, K.M.; Mansour, S.; Asran, A.M.; Younis, M.H.; Lentz, D.R.; Fowler, A.-R.; Fnais, M.S.; Abdelrahman, K.; Radwan, A. Composite Granitic Plutonism in the Southern Part of the Wadi Hodein Shear Zone, South Eastern Desert, Egypt: Implications for Neoproterozoic Dioritic and Highly Evolved Magma Mingling during Volcanic Arc Assembly. Minerals 2024, 14, 1002. [Google Scholar] [CrossRef]
  42. Abdelfadil, K.M.; Asran, A.M.; Rehman, H.U.; Sami, M.; Ahmed, A.; Sanislav, I.V.; Fnais, M.S.; Mogahed, M.M. The Evolution of Neoproterozoic Mantle Peridotites Beneath the Arabian–Nubian Shield: Evidence from Wadi Sodmein Serpentinites, Central Eastern Desert, Egypt. Minerals 2024, 14, 1157. [Google Scholar] [CrossRef]
  43. Salminen, R.; Tarvainen, T. Geochemical Mapping and Databases in Finland. J. Geochem. Explor. 1995, 55, 321–327. [Google Scholar] [CrossRef]
  44. Tarvainen, T. The Geochemical Correlation between Coarse and Fine Fractions of till in Southern Finland. J. Geochem. Explor. 1995, 54, 187–198. [Google Scholar] [CrossRef]
  45. Wedepohl, K.H. The Composition of the Continental Crust. Geochim. Cosmochim. Acta 1995, 59, 1217–1232. [Google Scholar] [CrossRef]
  46. Brown, M.; Rushmer, T. Evolution and Differentiation of the Continental Crust; Cambridge University Press: Cambridge, UK, 2006; ISBN 0521782376. [Google Scholar]
  47. Taylor, S.R.; McLennan, S.M. The Geochemical Evolution of the Continental Crust. Rev. Geophys. 1995, 33, 241–265. [Google Scholar] [CrossRef]
  48. Likuku, A.S.; Mmolawa, K.B.; Gaboutloeloe, G.K. Assessment of Heavy Metal Enrichment and Degree of Contamination around the Copper-Nickel Mine in the Selebi Phikwe Region, Eastern Botswana. Environ. Ecol. Res. 2013, 1, 32–40. [Google Scholar] [CrossRef]
  49. Müller, L. Fundamentals of Rock Mechanics; Springer: Berlin/Heidelberg, Germany, 1969. [Google Scholar]
  50. Sezgin, N.; Nadeem, I.; El Afandi, G. Environmental Pollution Assessment of Trace Metals in Road Dust of Istanbul in Turkey. Earth Syst. Environ. 2022, 6, 189–198. [Google Scholar] [CrossRef]
  51. Duzgoren-Aydin, N.S. Sources and Characteristics of Lead Pollution in the Urban Environment of Guangzhou. Sci. Total Environ. 2007, 385, 182–195. [Google Scholar] [CrossRef]
  52. United States Environmental Protection Agency. Soil Screening Guidance: Technical Background Document |Superfund| US EPA; US Environmental Protection Agency: Washington, DC, USA, 1996.
  53. Fan, X.; Lu, X.; Yu, B.; Zuo, L.; Fan, P.; Yang, Y.; Zhuang, S.; Liu, H.; Qin, Q. Risk and Sources of Heavy Metals and Metalloids in Dust from University Campuses: A Case Study of Xi’an, China. Environ. Res. 2021, 202, 111703. [Google Scholar] [CrossRef]
  54. Means, B. Risk-Assessment Guidance for Superfund. Volume 1. Human Health Evaluation Manual. Part A. Interim Report (Final); Environmental Protection Agency Office of Solid Waste: Washington, DC, USA, 1989.
  55. EPA, U. Supplemental Guidance for Developing Soil Screening Levels for Superfund Sites. Peer Rev. Draft. OSWER 2001, 9355, 4–24. [Google Scholar]
  56. Miletić, A.; Lučić, M.; Onjia, A. Exposure Factors in Health Risk Assessment of Heavy Metal(Loid)s in Soil and Sediment. Metals 2023, 13, 1266. [Google Scholar] [CrossRef]
  57. Ferreira-Baptista, L.; De Miguel, E. Geochemistry and Risk Assessment of Street Dust in Luanda, Angola: A Tropical Urban Environment. Atmos. Environ. 2005, 39, 4501–4512. [Google Scholar] [CrossRef]
  58. Wu, S.; Peng, S.; Zhang, X.; Wu, D.; Luo, W.; Zhang, T.; Zhou, S.; Yang, G.; Wan, H.; Wu, L. Levels and Health Risk Assessments of Heavy Metals in Urban Soils in Dongguan, China. J. Geochem. Explor. 2015, 148, 71–78. [Google Scholar] [CrossRef]
  59. Human Health Evaluation Manual; EPA: Washington, DC, USA, 1991; Volume 1003. Available online: https://www.epa.gov/sites/default/files/2015-11/documents/defaultExposureParams.pdf (accessed on 30 April 2025).
  60. Public Health Assessment Guidance Manual. Appendix G: Calculating Exposure Doses. 2005. Available online: http://medbox.iiab.me/modules/en-cdc/www.atsdr.cdc.gov/hac/phamanual/appg.html (accessed on 30 April 2025).
  61. United States Environmental Protection Agency. Recommended Use of BW3/4 as the Default Method in Derivation of the Oral Reference Dose; EPA: Washington, DC, USA, 2015.
  62. Ke, L.; Liu, W.; Wang, Y.; Russell, A.G.; Edgerton, E.S.; Zheng, M. Comparison of PM2.5 Source Apportionment Using Positive Matrix Factorization and Molecular Marker-Based Chemical Mass Balance. Sci. Total Environ. 2008, 394, 290–302. [Google Scholar] [CrossRef] [PubMed]
  63. Zhang, S.; Wang, L.; Zhang, W.; Wang, L.; Shi, X.; Lu, X.; Li, X. Pollution Assessment and Source Apportionment of Trace Metals in Urban Topsoil of Xi’an City in Northwest China. Arch. Environ. Contam. Toxicol. 2019, 77, 575–586. [Google Scholar] [CrossRef] [PubMed]
  64. Chen, X.; Lu, X. Contamination Characteristics and Source Apportionment of Heavy Metals in Topsoil from an Area in Xi’an City, China. Ecotoxicol. Environ. Saf. 2018, 151, 153–160. [Google Scholar] [CrossRef] [PubMed]
  65. Park, M.-B.; Lee, T.-J.; Lee, E.-S.; Kim, D.-S. Enhancing Source Identification of Hourly PM2. 5 Data in Seoul Based on a Dataset Segmentation Scheme by Positive Matrix Factorization (PMF). Atmos. Pollut. Res. 2019, 10, 1042–1059. [Google Scholar] [CrossRef]
  66. Kim, E.; Hopke, P.K. Comparison between Sample-Species Specific Uncertainties and Estimated Uncertainties for the Source Apportionment of the Speciation Trends Network Data. Atmos. Environ. 2007, 41, 567–575. [Google Scholar] [CrossRef]
  67. Reff, A.; Eberly, S.I.; Bhave, P. V Receptor Modeling of Ambient Particulate Matter Data Using Positive Matrix Factorization: Review of Existing Methods. J. Air Waste Manag. Assoc. 2007, 57, 146–154. [Google Scholar] [CrossRef]
  68. Ahmad, T.; Ali, L.; Alshamsi, D.; Aldahan, A.; El-Askary, H.; Ahmed, A. AI-Powered Water Quality Index Prediction: Unveiling Machine Learning Precision in Hyper-Arid Regions. Earth Syst. Environ. 2024. [Google Scholar] [CrossRef]
  69. Dzombak, D.A.; Morel, F.M.M. Development of a Data Base for Modelling Adsorption of Inorganics on Iron and Aluminum Oxides. Environ. Prog. 1987, 6, 133–137. [Google Scholar] [CrossRef]
  70. Dzombak, D.A.; Morel, F.M.M. Adsorption of Inorganic Pollutants in Aquatic Systems. J. Hydraul. Eng. 1987, 113, 430–475. [Google Scholar] [CrossRef]
  71. Shaheen, S.M.; Tsadilas, C.D.; Rinklebe, J. A Review of the Distribution Coefficients of Trace Elements in Soils: Influence of Sorption System, Element Characteristics, and Soil Colloidal Properties. Adv. Colloid. Interface Sci. 2013, 201, 43–56. [Google Scholar] [CrossRef]
  72. Ibrahim, M.S.; El-Galil, A.A.; Kotb, M.M. Total and Available Fe, Mn, Zn, and Cu in Some Soils of Sohag Governorate and Their Association with Some Soil Properties. Assiut J. Agric. Sci. 2001, 32, 71–86. [Google Scholar]
  73. Khalifa, E.M.; El-Aziz, S.H.A.; Ghallab, A.; Negim, S.E.A. Studies on Some Soils of the College of Agriculture Farm at Sohag, South Valley University. Assiut J. Agric. Sci. 2003, 34, 109–130. [Google Scholar]
  74. Alloway, B.J. The Origins of Heavy Metals in Soils; Blackie & Son Ltd.: London, UK, 1990. [Google Scholar]
  75. Han, X.; Shi, D.; Lu, X. Concentration and Source of Trace Metals in Street Dust from an Industrial City in Semi-Arid Area of China. J. Environ. Sci. Manag. 2018, 21, 90–99. [Google Scholar] [CrossRef]
  76. Rezaei, M.; Saravi, H.N.; Younesipour, H.; Firouzkandian, S.; Golrooye, M.R. Study of Resistant and Non-Resistant Fractions of Copper, Cadmium, Lead and Mercury Based on the Sequential Extraction Method in the Surface Sediments of the Southern Caspian Sea. Sciences 2008, 35, 413–418. [Google Scholar]
  77. Faisal, M.; Wu, Z.; Wang, H.; Hussain, Z.; Shen, C. Geochemical Mapping, Risk Assessment, and Source Identification of Heavy Metals in Road Dust Using Positive Matrix Factorization (PMF). Atmosphere 2021, 12, 614. [Google Scholar] [CrossRef]
  78. Jiang, H.-H.; Cai, L.-M.; Wen, H.-H.; Luo, J. Characterizing Pollution and Source Identification of Heavy Metals in Soils Using Geochemical Baseline and PMF Approach. Sci. Rep. 2020, 10, 6460. [Google Scholar] [CrossRef]
  79. Liu, H.; Anwar, S.; Fang, L.; Chen, L.; Xu, W.; Xiao, L.; Zhong, B.; Liu, D. Source Apportionment of Agricultural Soil Heavy Metals Based on PMF Model and Multivariate Statistical Analysis. Environ. Forensics 2024, 25, 40–48. [Google Scholar] [CrossRef]
  80. Chai, L.; Wang, Y.; Wang, X.; Ma, L.; Cheng, Z.; Su, L. Pollution Characteristics, Spatial Distributions, and Source Apportionment of Heavy Metals in Cultivated Soil in Lanzhou, China. Ecol. Indic. 2021, 125, 107507. [Google Scholar] [CrossRef]
  81. Li, Z.; Ma, C.; Sun, Y.; Lu, X.; Fan, Y. Ecological Health Evaluation of Rivers Based on Phytoplankton Biological Integrity Index and Water Quality Index on the Impact of Anthropogenic Pollution: A Case of Ashi River Basin. Front. Microbiol. 2022, 13, 942205. [Google Scholar] [CrossRef]
  82. Long, Z.; Huang, Y.; Zhang, W.; Shi, Z.; Yu, D.; Chen, Y.; Liu, C.; Wang, R. Effect of Different Industrial Activities on Soil Heavy Metal Pollution, Ecological Risk, and Health Risk. Environ. Monit. Assess. 2021, 193, 1–12. [Google Scholar] [CrossRef]
  83. Su, C.; Meng, J.; Zhou, Y.; Bi, R.; Chen, Z.; Diao, J.; Huang, Z.; Kan, Z.; Wang, T. Heavy Metals in Soils from Intense Industrial Areas in South China: Spatial Distribution, Source Apportionment, and Risk Assessment. Front. Environ. Sci. 2022, 10, 820536. [Google Scholar] [CrossRef]
  84. Tumolo, M.; Ancona, V.; De Paola, D.; Losacco, D.; Campanale, C.; Massarelli, C.; Uricchio, V.F. Chromium Pollution in European Water, Sources, Health Risk, and Remediation Strategies: An Overview. Int. J. Environ. Res. Public. Health 2020, 17, 5438. [Google Scholar] [CrossRef]
  85. Khorshidi, N.; Parsa, M.; Lentz, D.R.; Sobhanverdi, J. Identification of Heavy Metal Pollution Sources and Its Associated Risk Assessment in an Industrial Town Using the K-Means Clustering Technique. Appl. Geochem. 2021, 135, 105113. [Google Scholar] [CrossRef]
  86. Hou, S.; Zheng, N.; Tang, L.; Ji, X.; Li, Y.; Hua, X. Pollution Characteristics, Sources, and Health Risk Assessment of Human Exposure to Cu, Zn, Cd and Pb Pollution in Urban Street Dust across China between 2009 and 2018. Environ. Int. 2019, 128, 430–437. [Google Scholar] [CrossRef]
  87. Johansson, C.; Norman, M.; Burman, L. Road Traffic Emission Factors for Heavy Metals. Atmos. Environ. 2009, 43, 4681–4688. [Google Scholar] [CrossRef]
  88. Lu, X.; Wang, L.; Li, L.Y.; Lei, K.; Huang, L.; Kang, D. Multivariate Statistical Analysis of Heavy Metals in Street Dust of Baoji, NW China. J. Hazard. Mater. 2010, 173, 744–749. [Google Scholar] [CrossRef]
  89. Rastmanesh, F.; Mousavi, M.; Zarasvandi, A.; Edraki, M. Investigation of Elemental Enrichment and Ecological Risk Assessment of Surface Soils in Two Industrial Port Cities, Southwest Iran. Environ. Earth Sci. 2017, 76, 1–13. [Google Scholar] [CrossRef]
  90. Ytreberg, E.; Lagerström, M.; Holmqvist, A.; Eklund, B.; Elwing, H.; Dahlström, M.; Dahl, P.; Dahlström, M. A Novel XRF Method to Measure Environmental Release of Copper and Zinc from Antifouling Paints. Environ. Pollut. 2017, 225, 490–496. [Google Scholar] [CrossRef]
  91. Shahab, A.; Hui, Z.; Rad, S.; Xiao, H.; Siddique, J.; Huang, L.L.; Ullah, H.; Rashid, A.; Taha, M.R.; Zada, N. A Comprehensive Review on Pollution Status and Associated Health Risk Assessment of Human Exposure to Selected Heavy Metals in Road Dust across Different Cities of the World. Environ. Geochem. Health 2023, 45, 585–606. [Google Scholar] [CrossRef]
  92. Ye, J.; Li, J.; Wang, P.; Ning, Y.; Liu, J.; Yu, Q.; Bi, X. Inputs and Sources of Pb and Other Metals in Urban Area in the Post Leaded Gasoline Era. Environ. Pollut. 2022, 306, 119389. [Google Scholar] [CrossRef]
  93. Adachi, K.; Tainosho, Y. Characterization of Heavy Metal Particles Embedded in Tire Dust. Environ. Int. 2004, 30, 1009–1017. [Google Scholar] [CrossRef]
  94. Shi, D.; Lu, X. Accumulation Degree and Source Apportionment of Trace Metals in Smaller than 63 Μm Road Dust from the Areas with Different Land Uses: A Case Study of Xi’an, China. Sci. Total Environ. 2018, 636, 1211–1218. [Google Scholar] [CrossRef] [PubMed]
  95. Trujillo-González, J.M.; Torres-Mora, M.A.; Keesstra, S.; Brevik, E.C.; Jiménez-Ballesta, R. Heavy Metal Accumulation Related to Population Density in Road Dust Samples Taken from Urban Sites under Different Land Uses. Sci. Total Environ. 2016, 553, 636–642. [Google Scholar] [CrossRef]
  96. Bondu, R.; Cloutier, V.; Rosa, E.; Roy, M. An Exploratory Data Analysis Approach for Assessing the Sources and Distribution of Naturally Occurring Contaminants (F, Ba, Mn, As) in Groundwater from Southern Quebec (Canada). Appl. Geochem. 2020, 114, 104500. [Google Scholar] [CrossRef]
  97. Kierczak, J.; Pietranik, A.; Pędziwiatr, A. Ultramafic Geoecosystems as a Natural Source of Ni, Cr, and Co to the Environment: A Review. Sci. Total Environ. 2021, 755, 142620. [Google Scholar] [CrossRef]
  98. Soltani-Gerdefaramarzi, S.; Ghasemi, M.; Ghanbarian, B. Geogenic and Anthropogenic Sources Identification and Ecological Risk Assessment of Heavy Metals in the Urban Soil of Yazd, Central Iran. PLoS ONE 2021, 16, e0260418. [Google Scholar] [CrossRef]
  99. Gök, G.; Tulun, Ş.; Çelebi, H. Mapping of Heavy Metal Pollution Density and Source Distribution of Campus Soil Using Geographical Information System. Sci. Rep. 2024, 14, 1–18. [Google Scholar] [CrossRef] [PubMed]
  100. Suciu, N.A.; De Vivo, R.; Rizzati, N.; Capri, E. Cd Content in Phosphate Fertilizer: Which Potential Risk for the Environment and Human Health? Curr. Opin. Environ. Sci. Health 2022, 30, 100392. [Google Scholar] [CrossRef]
  101. Khatun, J.; Intekhab, A.; Dhak, D. Effect of Uncontrolled Fertilization and Heavy Metal Toxicity Associated with Arsenic (As), Lead (Pb) and Cadmium (Cd), and Possible Remediation. Toxicology 2022, 477, 153274. [Google Scholar] [CrossRef]
  102. Verbeeck, M.; Salaets, P.; Smolders, E. Trace Element Concentrations in Mineral Phosphate Fertilizers Used in Europe: A Balanced Survey. Sci. Total Environ. 2020, 712, 136419. [Google Scholar] [CrossRef]
  103. Isinkaralar, O.; Isinkaralar, K.; Nguyen, T.N.T. Spatial Distribution, Pollution Level and Human Health Risk Assessment of Heavy Metals in Urban Street Dust at Neighbourhood Scale. Int. J. Biometeorol. 2024, 68, 2055–2067. [Google Scholar] [CrossRef]
  104. Qin, M.; Jin, Y.; Peng, T.; Zhao, B.; Hou, D. Heavy Metal Pollution in Mongolian-Manchurian Grassland Soil and Effect of Long-Range Dust Transport by Wind. Environ. Int. 2023, 177, 108019. [Google Scholar] [CrossRef] [PubMed]
  105. Yang, Z.-Y.; Liu, H.; Li, J.-Y.; Bao, Y.-B.; Yang, J.; Li, L.; Zhao, Z.-Y.; Zheng, Q.-X.; Xiang, P. Road Dust Exposure and Human Corneal Damage in a Plateau High Geological Background Provincial Capital City: Spatial Distribution, Sources, Bioaccessibility, and Cytotoxicity of Dust Heavy Metals. Sci. Total Environ. 2024, 912, 169140. [Google Scholar] [CrossRef] [PubMed]
  106. Bawa, U. Heavy Metals Concentration in Food Crops Irrigated with Pesticides and Their Associated Human Health Risks in Paki, Kaduna State, Nigeria. Cogent Food Agric. 2023, 9, 2191889. [Google Scholar] [CrossRef]
  107. Guo, G.; Wang, Y.; Zhang, D.; Li, K.; Lei, M. Human Health Risk Apportionment from Potential Sources of Heavy Metals in Agricultural Soils and Associated Uncertainty Analysis. Environ. Geochem. Health 2023, 45, 881–897. [Google Scholar] [CrossRef]
  108. Taghavi, M.; Darvishiyan, M.; Momeni, M.; Eslami, H.; Fallahzadeh, R.A.; Zarei, A. Ecological Risk Assessment of Trace Elements (TEs) Pollution and Human Health Risk Exposure in Agricultural Soils Used for Saffron Cultivation. Sci. Rep. 2023, 13, 4556. [Google Scholar] [CrossRef]
  109. Aljumialy, A.M.; Al-Rawi, A.S.; Saod, W.M.; Al-Heety, E.A. Ecological and Health Risk Assessment of Heavy Metals in Interior Dust from College Campus. Anal. Sci. 2024, 40, 1919–1926. [Google Scholar] [CrossRef]
  110. Duan, X.; Yan, Y.; Li, R.; Deng, M.; Hu, D.; Peng, L. Seasonal Variations, Source Apportionment, and Health Risk Assessment of Trace Metals in PM2. 5 in the Typical Industrial City of Changzhi, China. Atmos. Pollut. Res. 2021, 12, 365–374. [Google Scholar] [CrossRef]
  111. Karim, Z.; Qureshi, B.A.; Mumtaz, M.; Qureshi, S. Heavy Metal Content in Urban Soils as an Indicator of Anthropogenic and Natural Influences on Landscape of Karachi—A Multivariate Spatio-Temporal Analysis. Ecol. Indic. 2014, 42, 20–31. [Google Scholar] [CrossRef]
  112. Nawrot, N.; Wojciechowska, E.; Rezania, S.; Walkusz-Miotk, J.; Pazdro, K. The Effects of Urban Vehicle Traffic on Heavy Metal Contamination in Road Sweeping Waste and Bottom Sediments of Retention Tanks. Sci. Total Environ. 2020, 749, 141511. [Google Scholar] [CrossRef]
  113. Li, W.; Cao, X.; Hu, Y.; Cheng, H. Source Apportionment and Risk Assessment of Heavy Metals in Agricultural Soils in a Typical Mining and Smelting Industrial Area. Sustainability 2024, 16, 1673. [Google Scholar] [CrossRef]
  114. Ahmad, T.; Muhammad, S.; Umar, M.; Azhar, M.U.; Ahmed, A.; Ahmad, A.; Ullah, R. Spatial Distribution of Physicochemical Parameters and Drinking and Irrigation Water Quality Indices in the Jhelum River. Environ. Geochem. Health 2024, 46, 263. [Google Scholar] [CrossRef] [PubMed]
  115. Unsal, M.H.; Ignatavičius, G.; Valiulis, A.; Prokopciuk, N.; Valskienė, R.; Valskys, V. Assessment of Heavy Metal Contamination in Dust in Vilnius Schools: Source Identification, Pollution Levels, and Potential Health Risks for Children. Toxics 2024, 12, 224. [Google Scholar] [CrossRef]
  116. De Miguel, E.; Iribarren, I.; Chacon, E.; Ordonez, A.; Charlesworth, S. Risk-Based Evaluation of the Exposure of Children to Trace Elements in Playgrounds in Madrid (Spain). Chemosphere 2007, 66, 505–513. [Google Scholar] [CrossRef]
  117. Han, Z.; Wang, H.; Huang, X.; Song, X.; Shu, Y.; Wu, J.; Sun, J.; Li, R.; Fan, Z. Determination of Soil Environmental Criteria for High-Risk Trace Metals in Urban Park Soils Using Improved CLEA Model. J. Hazard. Mater. 2024, 480, 136001. [Google Scholar] [CrossRef] [PubMed]
  118. Delgado-Iniesta, M.J.; Marín-Sanleandro, P.; Canca Pedraza, M.d.C.; Díaz-Pereira, E.; Sánchez-Navarro, A. Geoenvironmental and Health Indices to Assess the Hazardousness of Heavy Metals in Urban Dust in Schoolyards in Murcia, Spain. Toxics 2024, 12, 804. [Google Scholar] [CrossRef]
  119. Tan, S.Y.; Praveena, S.M.; Abidin, E.Z.; Cheema, M.S. Heavy Metal Quantification of Classroom Dust in School Environment and Its Impacts on Children Health from Rawang (Malaysia). Environ. Sci. Pollut. Res. 2018, 25, 34623–34635. [Google Scholar] [CrossRef]
  120. Gohain, M.; Deka, P. Trace Metals in Indoor Dust from a University Campus in Northeast India: Implication for Health Risk. Env. Monit Assess 2020, 192, 1–14. [Google Scholar] [CrossRef] [PubMed]
  121. Eneji, I.S.; Adams, I.U.; Julius, K.A. Assessment of Heavy Metals in Indoor Settled Harmattan Dust from the University of Agriculture Makurdi, Nigeria. Open J. Air Pollut. 2015, 4, 198. [Google Scholar] [CrossRef]
  122. McDonald, L.T.; Rasmussen, P.E.; Chénier, M.; Levesque, C. Wipe Sampling Methodologies to Assess Exposures to Lead and Cadmium in Urban Canadian Homes. In Proceedings of the Annual International Conference on Soils, Sediments, Water and Energy, Amherst, MA, USA, 18–21 October 2010; Volume 15, p. 6. [Google Scholar]
  123. Moghtaderi, T.; Aminiyan, M.M.; Alamdar, R.; Moghtaderi, M. Index-Based Evaluation of Pollution Characteristics and Health Risk of Potentially Toxic Metals in Schools Dust of Shiraz Megacity, SW Iran. Hum. Ecol. Risk Assess. Int. J. 2019, 25, 410–437. [Google Scholar] [CrossRef]
Figure 1. (a) Location map indicating the study area. (b) Satellite photo showing the study site map and sample locations.
Minerals 15 00482 g001
Figure 2. Spatial distribution of the physiochemical parameters throughout the study area: (a) total carbonate, (b) pH, and (c) organic matter.
Minerals 15 00482 g002
Figure 3. Spatial distribution of the PTMs in the study area: (a) Cd, (b) Co, (c) Cr, (d) Cu, (e) Fe, (f) Mn, (g) Ni, (h) Pb, and (i) Zn.
Minerals 15 00482 g003
Figure 4. PTM concentrations across studied samples along with pollution and ecological risk indices.
Minerals 15 00482 g004
Figure 5. Factor fingerprints, represented as a stacked bar chart, indicate the percentage contribution of each factor to each metal.
Minerals 15 00482 g005
Figure 6. Profile graphs displaying the percentage of each metal allocated to the factor as a red box and the concentration of each metal allocated to the factor as a blue bar.
Minerals 15 00482 g006
Figure 7. (a) Contribution rates of each species from different sources by the PMF; (b) contribution of each factor.
Minerals 15 00482 g007
Figure 8. Correlation heatmap showing relationships among PTMs in dust samples.
Minerals 15 00482 g008
Figure 9. Dendrogram illustrating the hierarchical clustering of nine PTMs found in dust samples.
Minerals 15 00482 g009
Table 1. Non-carcinogenic reference dose and carcinogenic slope factor of PTMs; adapted from [59,60,61].
ElementRfDing (mg/kg/day)RfDinh (mg/kg/day)RfDdermal (mg/kg/day)SF
(mg/kg/day)
Fe7.0--
Mn0.0460.000010.00184
Ni0.0200.020600.000540.840
Cr0.0030.000030.0000642.00
Cu0.0400.0400.012
Zn0.3000.3000.060
Cd0.0000.001 0.001
Pb0.00350.0030.00053
Co0.0200.000010.016009.800
Table 2. Descriptive statistics for PTMs in the studied samples.
VariableMeanMd.StDevCV%Min.Max.[45]
Physicochemical propertiespH8.180.347.68.6
OC%1.71.71.2710.23.9
CaCO3%5.24.73.2680.511.5
Total Heavy Metal ContentFe%1.611.750.58330.582.644.09
Mn ppm4414861.8939115759904
Ni ppm141353972419
Cr ppm868243522415035
Co ppm151442872412
Cu ppm2924239669314
Zn ppm971001701706912552
Cd ppm0.40.380.631680.320.520.102
Pb ppm39382155179817
Table 3. Health risk evaluation of health risks from PTMs in the dust samples for students.
PTMsHQingHQinhHqdermalHIRT
Male StudentsFe2.43 × 10−7--2.43 × 10⁻⁷-
Mn9.37 × 10−32.03 × 1011.33 × 1021.54 × 102-
Cu7.38 × 10−41.00 × 10−75.99 × 10−15.99 × 10⁻¹-
Zn3.16 × 10−44.54 × 10−83.21 × 10−13.21 × 10⁻¹-
Pb1.05 × 10−21.40 × 10−61.03 × 1011.03 × 101-
Co—Non-Cancer7.60 × 10−43.66 × 10−41.28 × 10−11.29 × 10⁻¹-
Co—Cancer1.26 × 10−26.08 × 10−31.28 × 10−1-2.48 × 10⁻³
Ni—Non-Cancer6.58 × 10−47.98 × 10−19.87 × 1001.07 × 101-
Ni—Cancer1.19 × 10−2-1.07 × 1011.07 × 1011.99 × 10−4
Cr—Non-Cancer2.96 × 10−24.26 × 10−44.50 × 1024.50 × 102-
Cr—Cancer4.93 × 10−17.12 × 10−34.50 × 102-6.21 × 10⁻²
Cd—Non-Cancer3.96 × 10−35.54 × 10⁻⁸-3.96 × 10⁻³-
Cd—Cancer6.60 × 10−2---0
Female Students HQingHQinhHqdermalHiRT
Fe2.49 × 10−7--2.49 × 10⁻⁷-
Mn9.51 × 10−32.03 × 1011.33 × 1021.54 × 102-
Cu7.60 × 10−48.15 × 10−85.99 × 10−15.99 × 10⁻¹-
Zn3.26 × 10−43.62 × 10−83.21 × 10−13.21 × 10⁻¹-
Pb1.08 × 10−21.12 × 10−61.03 × 1011.03 × 101-
Co—Non-Cancer7.82 × 10−42.94 × 10−41.28 × 10−11.29 × 10⁻¹-
Co—Cancer1.22 × 10−24.59 × 10⁻³--2.39 × 10⁻³
Ni—Non-Cancer6.77 × 10−47.98 × 10−19.87 × 1001.07 × 101-
Ni—Cancer1.14 × 10−2-2.31 × 101.14 × 10−21.92 × 10⁻⁴
Cr—Non-Cancer3.04 × 10−23.43 × 10−44.50 × 1024.50 × 102-
Cr—Cancer4.75 × 10−15.35 × 10−32.55 × 10−3-5.98 × 10⁻²
Cd—Non-Cancer4.08 × 10−34.38 × 10⁻⁸-4.08 × 10⁻³-
Cd—Cancer6.36 × 10−2---0
Disclaimer/Publisher’s Note: The statements, opinions and data contained in all publications are solely those of the individual author(s) and contributor(s) and not of MDPI and/or the editor(s). MDPI and/or the editor(s) disclaim responsibility for any injury to people or property resulting from any ideas, methods, instructions or products referred to in the content.

