Article

Crystal Chemistry, High-Pressure Behavior, Water Content, and Thermal Stability of Natural Spodumene

1
School of Earth Sciences and Resources, China University of Geosciences, Beijing 100083, China
2
Center for High Pressure Science and Technology Advanced Research, Beijing 100193, China
3
State Key Laboratory of Lithospheric Evolution, Institute of Geology and Geophysics, Chinese Academy of Sciences, Beijing 100029, China
4
School of Earth and Space Sciences, Peking University, Beijing 100871, China
5
School of Water Resources and Environment, China University of Geosciences, Beijing 100083, China
*
Author to whom correspondence should be addressed.
Minerals 2025, 15(3), 307; https://doi.org/10.3390/min15030307
Submission received: 20 January 2025 / Revised: 8 March 2025 / Accepted: 13 March 2025 / Published: 16 March 2025
(This article belongs to the Special Issue High-Pressure and High-Temperature Mineral Physics)

Abstract

:
Spodumene (LiAlSi2O6) is a member of pyroxene-group minerals. It has the highest theoretical lithium abundance among all of the Li-bearing minerals. In the present work, in situ high-pressure Raman spectroscopic investigation of natural spodumene have been conducted up to 19.04 GPa. Unheated spodumene and spodumene recovered after heat treatments (up to 1000 °C) have also been analyzed by X-ray diffraction and infrared spectroscopy. The results indicate that spodumene, after the displacive C2/cP21/c transformation triggered at ~3.2 GPa, remains stable at pressures up to 19 GPa at ambient temperature without undergoing decomposition, amorphization, or a second phase transition. The major OH bands of the spodumene samples are observed within the wavenumber range of 2580–3220 cm−1, implying a strong hydrogen bond interaction. The water content of the spodumene is estimated to be 19–97 ppm wt. H2O based on the integrated absorption area of the OH bands. The FTIR analysis of the spodumene samples recovered after heat treatments implies that spodumene can retain a significant amount of water (up to ~100 ppm H2O by weight) under high-temperature conditions up to 1000 °C. This suggests that spodumene in subducted slabs is unlikely to undergo dehydration at temperatures below 1000 °C, and is therefore not expected to trigger partial melting. Thus, spodumene may serve as a key carrier for Li, transporting it into the deep mantle without releasing Li into melts during subduction.

1. Introduction

Spodumene (LiAlSi2O6) is a member of pyroxene-group minerals and an important lithium ore. It has the highest theoretical lithium abundance among all of the Li-bearing minerals [1,2]. The crystal structure of spodumene (Figure S1) is monoclinic with space group C2/c. It is composed of chains of SiO4 tetrahedra (Si site), which are linked by chains of AlO6 octahedra (M1 site). Li+ occupies another symmetrically distinct octahedral site (M2 site) via the coupled substitution with Al3+ at M1 [2,3].
Pommier et al. (2003) [2] investigated the high-pressure behavior of spodumene by in situ Raman spectroscopy in a diamond-anvil cell up to 13.03 GPa at near hydrostatic conditions, using a 15:4:1 methanol–ethanol–water mixture as the pressure-transmitting medium. Data were collected within a wavenumber range of 200–1000 cm−1 under compression and within a wavenumber range of 1000–1200 cm−1 in a pressure region from 9.63 to 1.39 GPa under decompression. The results confirmed a well-established displacive C2/cP21/c transformation at ~3.2 GPa [4] and indicated an additional change in the spectrum at 7.7–8.9 GPa. Ullrich et al. (2009) [5] studied the lattice elasticity of spodumene by means of in situ Raman spectroscopy and single-crystal X-ray diffraction in a diamond-anvil cell up to 9.3 GPa, using a 4:1 methanol–ethanol mixture as the pressure-transmitting medium. Although the results also confirmed the C2/cP21/c transformation at 3.19 GPa, the observed spectral changes showed no evidence for a second phase transition within the pressure range of 3.2–9.3 GPa. Due to the hydrostatic limits of the pressure-transmitting mediums used in the previous measurements [2,5], the high-pressure behavior of spodumene at higher pressures has not been investigated. In addition, the Raman scattering peak of the ethanol at 883 cm−1 [2] may interfere with the analysis of the spectral data collected during compression and decompression.
Pyroxene-group minerals can contain notable amounts of hydrogen (water) as structural hydroxyl groups [6,7,8,9,10]. Since water contents of pyroxenes are strongly influenced by geological and crystal chemical factors, they are therefore expected to indicate the environments of the solid–fluid interactions during and/or after mineral formation [6,7,8]. Although previous studies [6,9] have showed that natural spodumene can accommodate up to 205 ppm wt. H2O (depending on calibration method), the thermal stabilities of OH groups within the crystal structure of spodumene remain unclear.
To better understand the crystal chemistry, high-pressure behavior, water content, and thermal stability of spodumene. In situ high-pressure Raman spectroscopic measurements of natural spodumene have been conducted up to 19.04 GPa, using argon as the pressure-transmitting medium in this study. Unheated spodumene and spodumene recovered after heat treatments (up to 1000 °C) have also been analyzed by X-ray diffraction and infrared spectroscopy.

2. Experimental Methods

The natural spodumene sample in this study was collected from Nuristan area in Pakistan. The chemical composition of the sample was determined via a JEOL JXA-8230 electron probe microanalyzer at Testing Center of Shangdong Bureau of China Metallurgical Geology Bureau, with 15 kV accelerating voltage, 20 nA beam current, and 1 µm beam size, using mineral and metal as standards. For single-crystal X-ray diffraction analysis, the spodumene sample (several-centimeter-big) was crushed into single-crystal fragments (Figure 1). A small fragment with a size of about 120 μm × 80 μm × 70 μm was selected and mounted on the glass fiber. The X-ray diffraction data was collected via a Bruker D8 Venture X-ray diffractometer equipped with a PHOTON detector, using an APEX 4 operating system at the Center for High Pressure Science and Technology Advanced Research, Beijing. The X-ray (0.71073 Å) was generated by an IuS 3.0 generator with a Mo anode at a voltage of 50 kV and a current of 1.4 mA. The crystal structure of spodumene was refined from the intensity data (hkl file) with SHELX-2018/3 [11] in WINGX v 2018.1 software platform [12], based on the previously reported scattering factors and absorption coefficients for Li, Al, O, and Si in International Tables for Crystallography, Volume C [13]. The X-ray powder diffraction pattern for Cu Kα radiation (λ = 1.5405 Å) was also calculated using Vesta 4.6.0 software (Figure S2). The CIF file is provided in Supplementary Materials.
For high-pressure Raman spectroscopic measurements, a pair of type Ia diamond anvils with 0.4 mm culet diameter in a symmetric-type diamond-anvil cell (DAC) was used to compress the spodumene sample. A polished chip with flat surfaces (about 50 μm × 50 μm × 30 μm in size) and two ruby spheres (for pressure calibration) were selected and loaded into the hole (150 μm in diameter and 45 μm in depth) in a rhenium (Re) gasket. Argon (Ar) was loaded as a pressure-transmitting medium at 1.93 GPa. The potential pressure gradients are lower than 0.2 GPa at pressures up to 20 GPa [14]. Raman spectra were excited by a 532 nm solid-state laser, and were measured via a HORIBA LabRAM HR Evolution laser Raman spectrometer equipped with a 20× microscope objective at Institute of Geology, Chinese Academy of Geological Sciences. All spectra were collected in the wavenumber range of 100 to 1200 cm−1, using 2400 gr/mm grating (with a spectral resolution of 1 cm−1), 5 accumulations, 10 s exposure time, and 40 mW laser power. During data collection, pressures were calculated according to the shift of the ruby R1 luminescent line [15].
In order to investigate the water (hydrogen) content and the thermal stability of hydroxyl in the crystal structure, the fragments of the spodumene sample were divided into four groups (No 1, 2, 3, and 4). The fragments from group 2, 3, and 4 were heated in platinum foils inside a muffle furnace at 300, 700, and 1000 °C respectively during one hour, and were extracted and subjected to uncontrolled cooling in ambient air until reaching room temperature. The fragments from group 1 were not subjected to any thermal treatment and were kept as a reference sample. After heating, the power X-ray diffraction patterns of the recovered samples from group 1, 2, 3, and 4 were collected respectively via a Y-2000 type X-ray diffractometer under ambient condition at the Institute of Geology, Chinese Academy of Geological Science, at 30 kV and 20 mA (Kα radiation of Cu, λ = 1.54056 Å) in the 2θ range of 10–80°. For FTIR analyses, more than 10 fragments (with a thickness of 0.4–1.4 mm) were selected from group 1, 2, 3, and 4 respectively, and doubly polished. Unpolarized infrared spectra of these recovered fragments were collected in the wavenumber range of 2400–3600 cm−1 using a Bruker INVENIO-R FTIR spectrometer with a 20× objective on the HYPERION 1000 microscope, CaF2 beam-splitter and a MCT detector at Institute of Geology and Geophysics, Chinese Academy of Sciences. For each spectrum, 128 scans were accumulated with 50 μm × 50 μm apertures. During data collection, the fragments were placed on a sapphire plate. Water contents of the spodumene samples were estimated based on the modified form of the Beer–Lambert law [16,17]:
Δ = I × c × t × γ
where c is the water content in ppm wt. H2O, Δ is the integrated absorption area (cm−1) of the OH bands, t is the fragment thickness in centimeters, γ is the orientation factor (1/3) suggested by Paterson (1982) [18], and I is the integral specific absorption coefficient of the sample (1/ppm·cm2). In this study, the previously reported coefficient of 7.09 [19] for clinopyroxene was used.

3. Results and Discussion

The results of electron microprobe analysis show that the spodumene sample in this study contains 65.63 wt.% SiO2, and 28.15 wt.% Al2O3. Assuming a total sum of 100 wt.% (Li2O content cannot be directly measured), the estimated formula unit of the sample is very near to the ideal formula of LiAlSi2O6.
The results of single-crystal X-ray analysis indicate that the spodumene sample has a typical monoclinic C2/c structure. The structural refinement based on 599 unique reflections yields a R(int) value of 0.0212, a wR2 value of 0.0731, a R1 value of 0.0245, and a GooF value of 1.188. The refined lattice parameters are a = 9.4727 (14) Å, b = 8.3967 (12) Å, c = 5.2239 (8) Å, β =110.153 (3)°, V = 390.07 (10) Å3. This result is consistent with the previously reported unit-cell parameters [a = 9.4649 (6) Å, b = 8.3934 (6) Å, c= 5.2190 (8) Å, β =110.146 (8)°, V= 389.25 (7) Å3] of LiAlSi2O6 spodumene [5]. The refined atom positions of Li, Al, Si, and O are presented in Table 1. The calculated bond distances (Li-O, Al-O, and Si-O) and O-O edge lengths of the tetrahedral and octahedral sites are detailed in Table 2. The O-O edge lengths of the SiO4 tetrahedra and AlO6 octahedra are similar (2.504–2.955 Å). By comparison, the O-O edge lengths of the highly distorted LiO6 octahedron vary widely within a range of 2.537–4.078 Å (Table 2).
The Raman spectrum of the spodumene sample under ambient pressure displays 11 bands at 133, 191, 251, 301, 355, 394, 443, 523, 590, 708, and 787 cm−1 (Figure 2). These bands can also be observed in the Raman spectra of previously reported C2/c spodumene [5]. The bands at 708 and 787 cm−1 correspond to the stretching vibrations of Si-O in the crystal structure, while those at 443, 523, and 590 cm−1 are due to the bending vibrations of Si-O. In the low-frequency region, the bands at 133, 191, 251, 301, 355, and 394 cm−1 are attributed to the bending and stretching vibrations of Li-O and Al-O [2,5].
The results of the in situ high-pressure Raman spectroscopy analysis are presented in Figure 3 and Table 3. Within the pressure range from 1.93 to 3.67 GPa, the major bands shift towards higher frequencies without notable changes, indicating the compression of the structure framework. However, at pressures over 3.67 GPa, a series of new bands (ν11–ν14) in the low wavenumber region can be observed. This is attributed to the non-quenchable C2/cP21/c transformation of the crystal structure at about 3.2 GPa [5,20]. By comparison, the intense band at about 708 cm−11), which is related to the stretching vibration of Si-O, shifts continuously towards higher frequencies (Figure 3). This implies that the influence of the transformation on the geometric configuration of the SiO4 tetrahedra is limited. Within the pressure range of 3.67–19.04 GPa, no new bands emerge in the Raman spectra of the spodumene sample during compression. In addition, the 14 bands (ν1–ν14) observed after the C2/cP21/c transformation show a linear shift towards higher frequencies (Figure 3), without significant changes in intensity and width (Figure 3). The shift rates of these bands are estimated to be 2.82, 2.70, 3.28, 3.09, 3.17, 6.73, 2.96, 1.85, 2.56, 1.93, 1.20, 1.31, 1.10, and 1.55 cm−1/GPa, respectively.
During decompression, the Raman bands (ν1–ν14) of the spodumene sample display linear downshifts within the pressure range of 6.41–19.04 GPa, without notable changes in spectral features (Figure 3). At lower pressure (3.01 GPa), the bands within the wavenumber range of 100–500 cm−1 shift discontinuously (Figure 3) with the disappearance of the four new bands (ν11–ν14) observed after the C2/cP21/c transformation (Figure 3). This can be due to the occurrence of the reverse transformation (P21/cC2/c). In addition, full reverses in intensity, width, and positions for all Raman bands in the investigated wavenumber range can also be observed (Figure 3). Therefore, the in situ high-pressure Raman spectroscopy analysis in this study reveals that the crystal structure of spodumene, after the displacive C2/cP21/c transformation triggered at ~3.2 GPa, can remain stable under pressures up to 19 GPa at ambient temperature, without undergoing decomposition, irreversible amorphization, or structural changes related to further phase transitions.
As shown in Figure 4, the spodumene samples from group 1 (unheated), group 2 (after heat treatment at 300 °C), group 3 (after heat treatment at 700 °C), and group 4 (after heat treatment at 1000 °C) exhibit nearly identical X-ray powder diffraction patterns, which align with the pattern (Figure S2) calculated based on the single-crystal X-ray diffraction data of the unheated sample. This suggests that the crystal structure of spodumene remains stable at temperatures up to 1000 °C. Previous studies [21,22] have revealed that the β-spodumene (space group P43212) can be crystallized from a glass melt at approximately 1400 °C, or alternatively, formed via crystallization from a lithium-vanadate flux through a slow cooling process (2–2.6 °C per day) starting from 980 °C over a period of 20 days. However, the X-ray diffraction analysis in this study revealed no evidence of the phase transition from spodumene to β-spodumene. This implies that such a phase transition may not occur under ambient pressure conditions below 1000 °C. An alternative explanation is that the rapid uncontrolled cooling in this study caused β-spodumene to revert back to spodumene. Therefore, whether the phase transition from spodumene to β-spodumene can occur at temperatures ≤ 1000 °C requires future validation through in situ high-temperature XRD experiments.
In the OH vibration region (2400–3600 cm−1), the infrared spectra of the spodumene in this study exhibits 9 absorption bands at 2582, 3141, 3220, 3278, 3411, 3426, 3498, 3525, and 3571 cm⁻1 (Figure 5). This spectral feature can be indicative of multiple hydrogen positions. The five sharp bands at 3411, 3426, 3498, 3525, and 3571 cm⁻1 have also been observed in previous FTIR studies [6,9,23] of spodumene and other natural pyroxene samples (such as diopside and enstatite). However, the four bands at 2582, 3141, 3220, and 3278 cm⁻1 have not been reported in the previous investigations [6,9,23]. Although the mutual intensity ratios of the observed OH bands vary from fragment to fragment, the bands at 2582 and 3220 cm−1 are usually intense and broad (Figure 5). The low frequencies of these two major bands indicate a strong hydrogen bond interaction [24]. According to the previously reported correlation between OH stretching frequency and O···O distance [24], hydrogen in the spodumene sample in this study may primarily reside near the O-O edges with a length of 2.55–2.7 Å (Table 2). In the crystal structure of spodumene, O2 is bonded to one Li+, one Al3+, and one Si4+. O1 is bonded to one Li+, two Al3+, and one Si4+. O3 is the bridging oxygen of two SiO4 tetrahedra and is also bonded to one Li+. As a result, O2 is relatively underbonded (Figure S1). Therefore, it is expected to be the potential sites for protonation (hydrogen incorporation).
The water contents of the four groups (No. 1, 2, 3 and 4) of spodumene are calculated to be 19–97, 15–101, 10–89 ppm, and 7–91 ppm wt. H2O, respectively, based on the integrated absorption areas of the OH bands in the IR spectra. This indicates that their water contents are within the same order of magnitude. The calculation results are also consistent with previously reported water contents of natural spodumenes (<205 ppm wt. H2O) [6,9]. Although the low-intensity sharp absorption bands in the 3400–3600 cm⁻1 range are difficult to observe in the infrared spectra of the samples from group 4 (after heat treatment at 1000 °C), the two strong absorption bands at 2582 and 3220 cm⁻1 remain clearly visible (Figure 5). Additionally, some fragments from group 4 were selected and further heated at 1000 °C for 3 h. The infrared spectral characteristics of the recovered samples (Figure S3) showed no observable changes compared to those of the fragments from original group 4 (Figure 5). This demonstrates that spodumene can retain a significant amount (up to ~100 ppm wt. H2O) of water under high-temperature conditions up to 1000 °C.
Water (tens to hundreds of parts per million) released from the interior of nominally anhydrous minerals may diffuse to phase boundaries and enhance deformation of the grain. This initial dehydration process could subsequently trigger further hydrolytic weakening, release of water, and anatexis [25]. Therefore, if dehydration of spodumene within subducting slabs triggers melt formation, Li may partition into the melt through partitioning processes [26]. This would impede Li from being transported further into Earth’s deep interior with the descending slab. However, infrared spectroscopy analyses in this study suggest that such dehydration-induced melting may not occur at temperatures below 1000 °C. This implies that spodumene could act as an effective carrier, delivering Li into the deep mantle. Further heating experiments employing extended durations and elevated temperatures would better constrain the thermal response of hydrogen within spodumene’s crystal framework.
Previous investigations on the water storage capacity of enstatite demonstrate that the incorporation of Li+ into its crystal structure does not significantly alter its water content [27]. In contrast, Al3+ can markedly enhance the water storage capacity of enstatite through the substitution mechanism Al3+ + H+ = 2Mg2+ [27,28]. Consequently, enstatite containing 1 wt.% Al2O3 can host water content exceeding 1100 ppm wt. H2O [27]. In spodumene, Al3+ directly couples with Li+, enabling these ions to occupy two distinct octahedral sites independently without requiring association with H+. As a result, neither Al3+ nor Li+ enhances the water storage capability of spodumene.

4. Conclusions

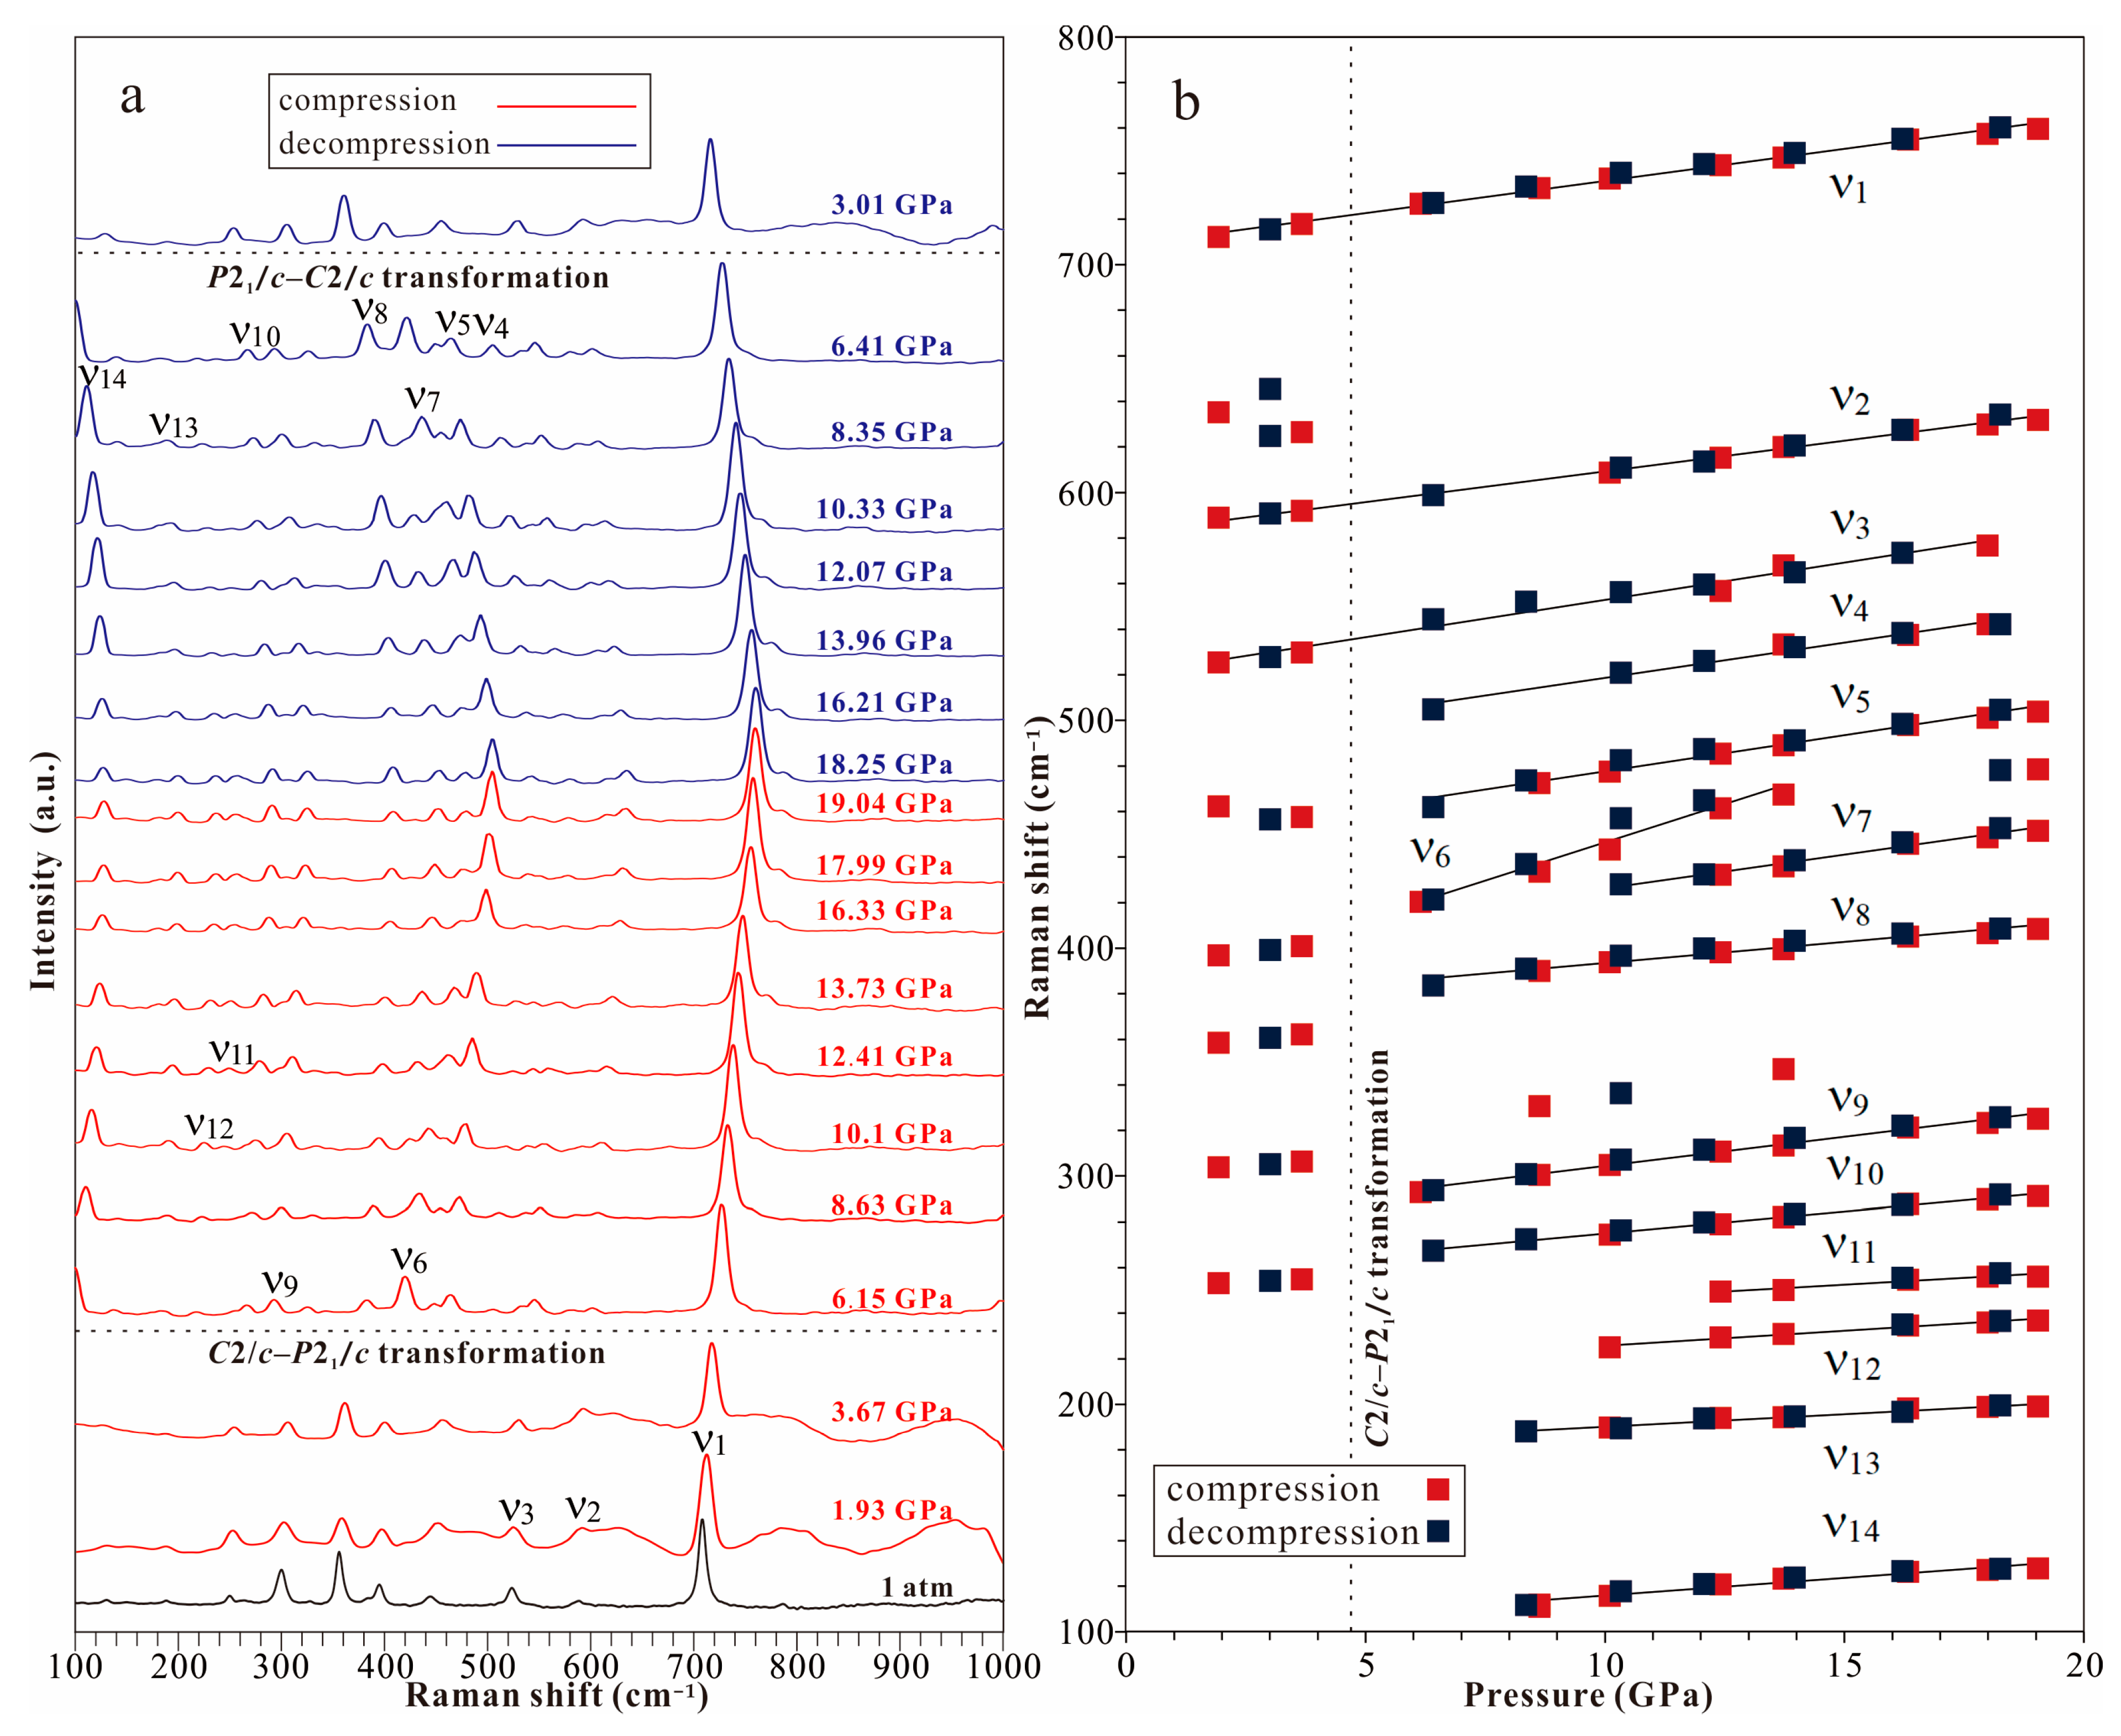
  • In situ high-pressure Raman spectroscopy investigation demonstrates that spodumene, after the C2/cP21/c transformation triggered at ~3.2 GPa, can remain stable under pressures up to 19 GPa at room temperature without undergoing decomposition, irreversible amorphization, or a second transformation.
  • According to the results of FTIR analysis, the water content of the natural spodumene sample in this study is estimated to be 19–97 ppm wt. H2O. The relatively low wavenumbers of the OH bands (at 2580–3220 cm−1) indicate a strong hydrogen bond interaction. Hydrogen may primarily reside near the O-O edges with a length of 2.55–2.7 Å. O2 can be the potential site for hydrogen incorporation.
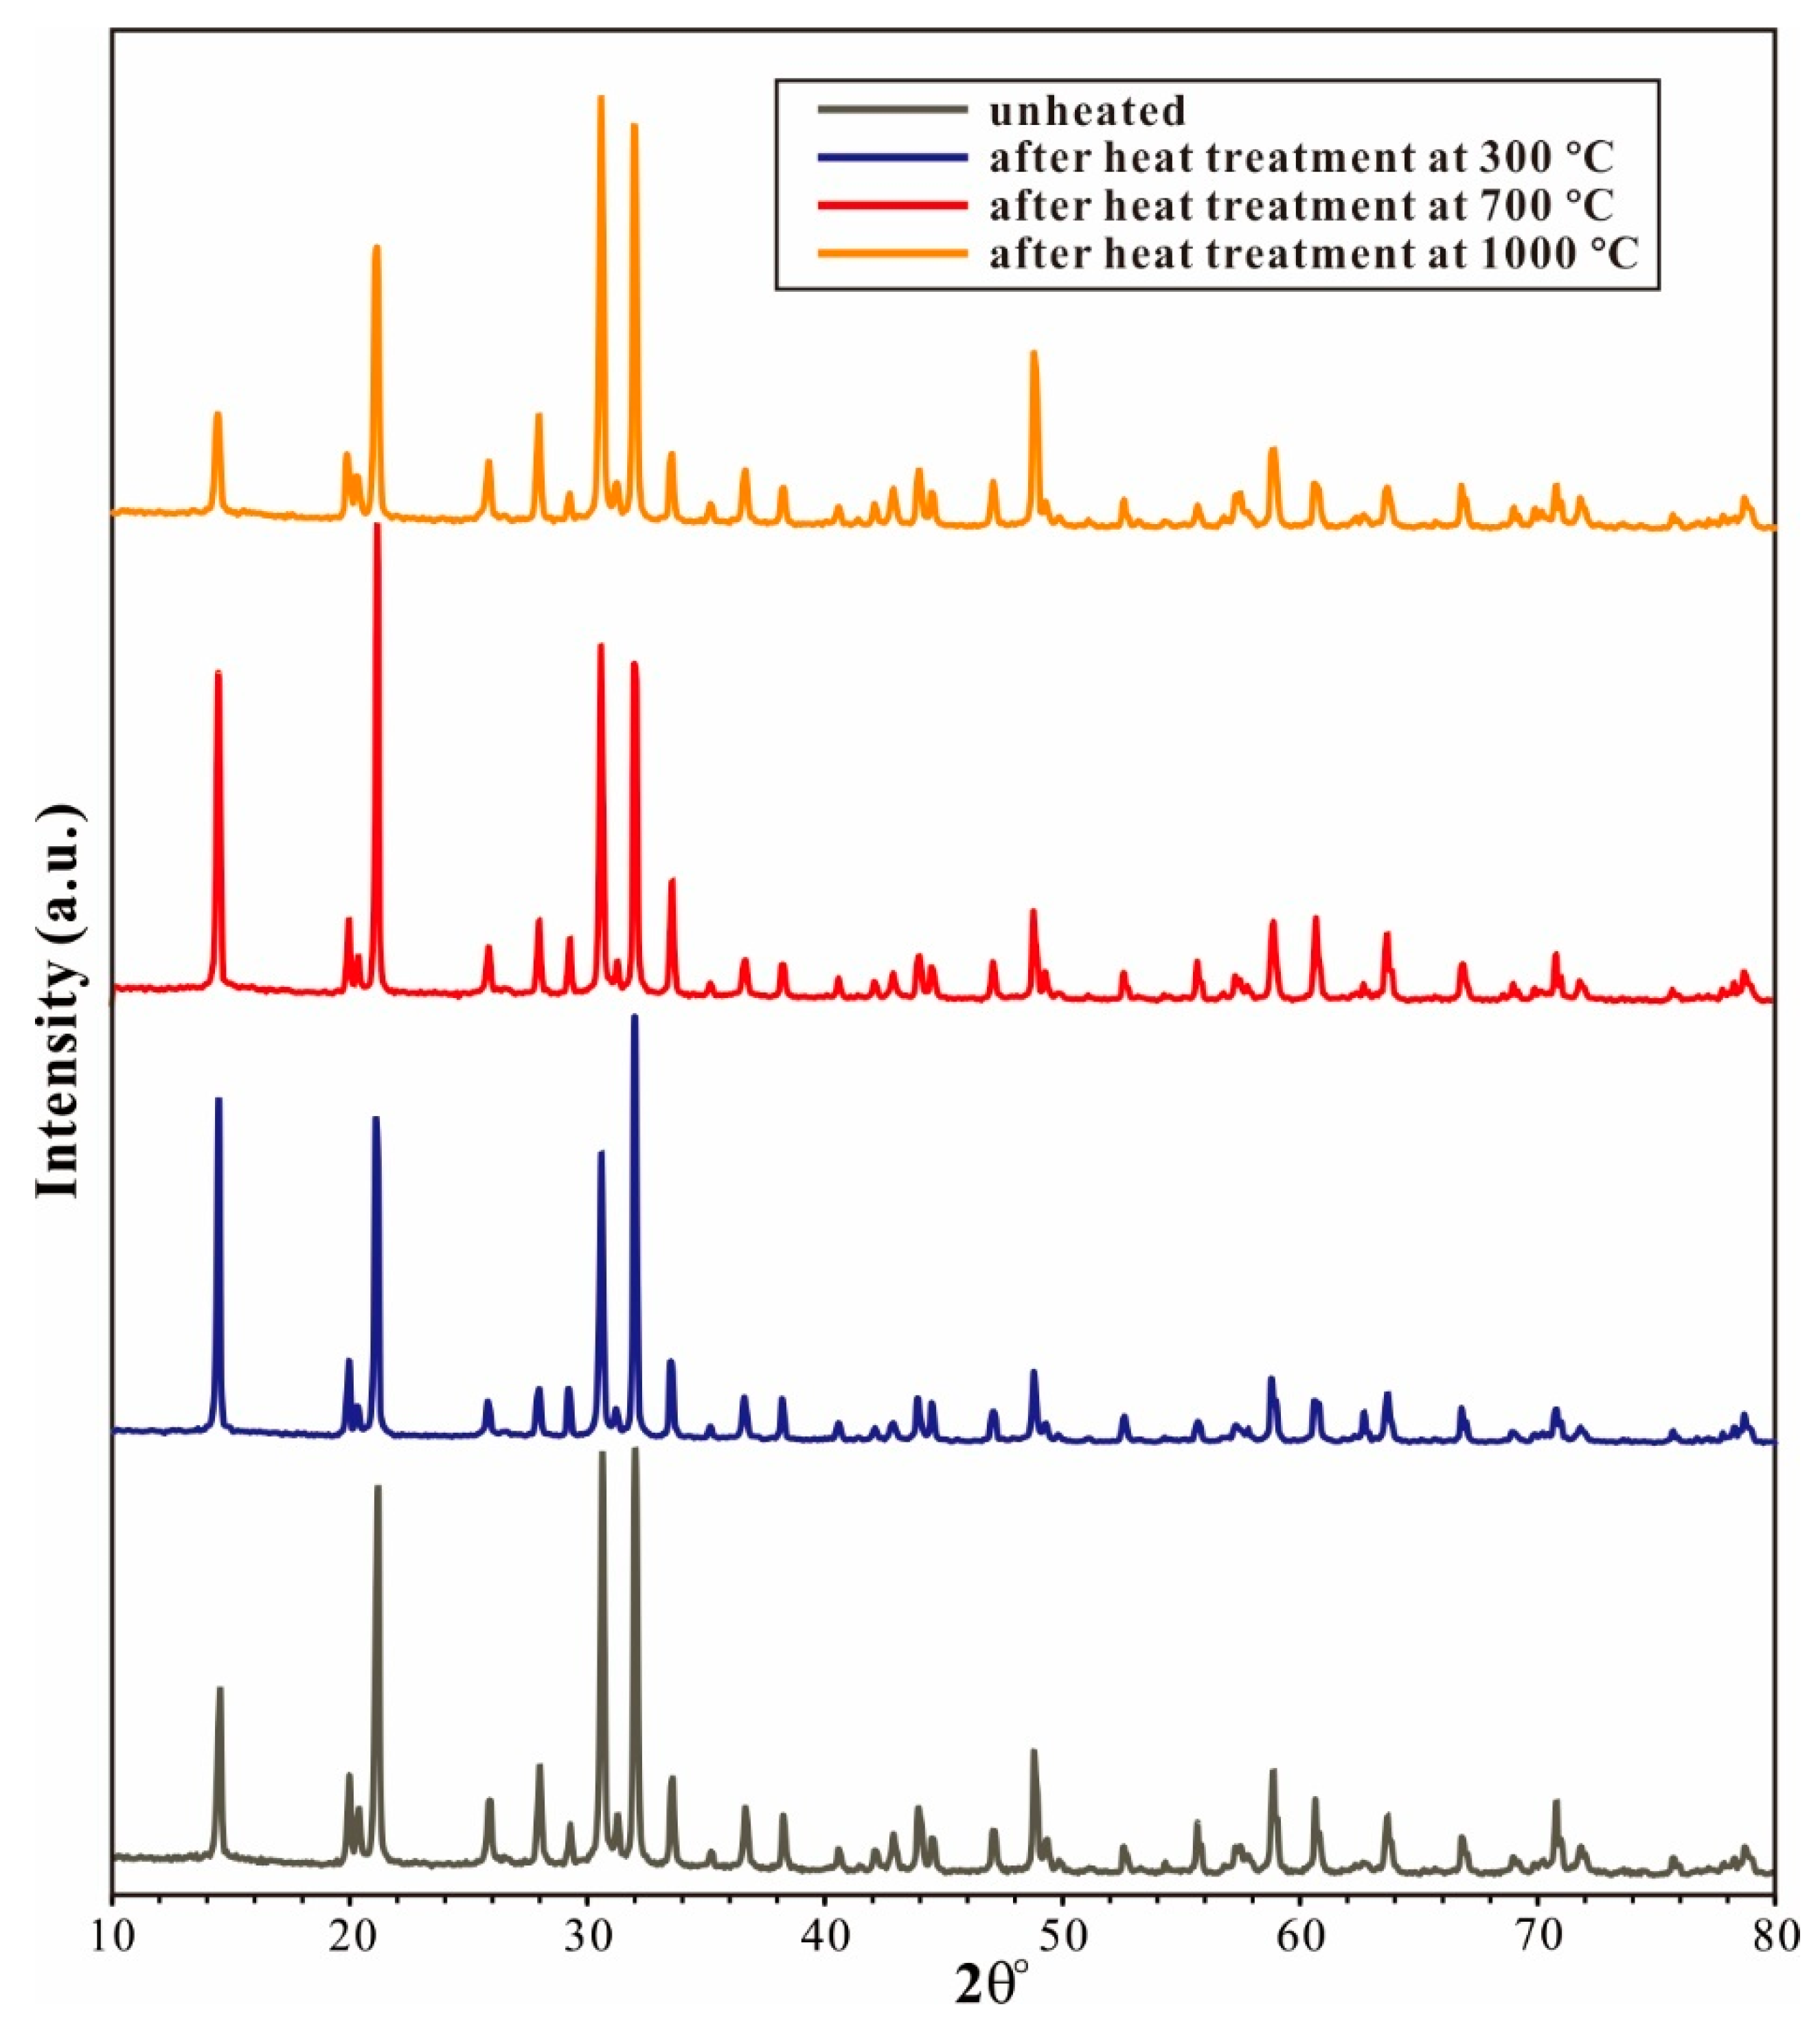
  • Spodumene can retain a significant amount (up to ~100 ppm wt. H2O) of water under high-temperature conditions up to 1000 °C. This indicates that spodumene in subducted slabs is unlikely to undergo dehydration at temperatures below 1000 °C, and is therefore not expected to trigger partial melting. Thus, spodumene may act as an important carrier for Li, transporting it into the deep mantle without releasing Li into melts during subduction.

Supplementary Materials

The following supporting information can be downloaded at: https://www.mdpi.com/article/10.3390/min15030307/s1, The CIF file of the structure refinement; Figure S1: Crystal structure of spodumene (atom positions were estimated based on the single-crystal X-ray diffraction analysis in this study); Figure S2: Calculated X-ray powder diffraction pattern for Cu Kα radiation (λ = 1.5405 Å) of unheated spodumene sample (calculation based on CIF file from single-crystal X-ray diffraction analysis); Figure S3: Infrared spectra of recovered spodumene fragments, which were selected from group 4 (after heat treatment at 1000 °C) and further heated at 1000 °C for 3 h. In the 2800–3000 cm⁻1 region, only two bands caused by hydrocarbon contamination (at 2850 and 2940 cm⁻1) are observed, and thus excluded from the figure.

Author Contributions

L.Z. suggested the basis of the paper; Y.J. and L.Z. wrote the paper; Y.J. and J.Y. performed high-pressure Raman spectroscopic measurements; J.Y. and X.L. performed infrared spectroscopic measurements; L.Z. performed electron microprobe analysis; L.Z. and Z.Z. performed single-crystal X-ray diffraction analysis; Y.O. and L.Z. performed powder X-ray diffraction analysis; Y.L. and Z.Z. discussed the methods and results. All authors have read and agreed to the published version of the manuscript.

Funding

This study was supported by the National Natural Science Foundation of China (no. 42172044).

Data Availability Statement

Data are contained within the article and Supplementary Materials.

Conflicts of Interest

The authors declare no conflicts of interest.

References

  1. Asif, A.H.; Li, C.; Lim, H.; Sun, H. Australia’s spodumene: Advances in lithium extraction technologies, decarbonization, and circular Economy. Ind. Eng. Chem. Res. 2024, 63, 2073–2086. [Google Scholar] [CrossRef]
  2. Pommier, C.J.S.; Denton, M.B.; Downs, R.T. Raman spectroscopic study of spodumene (LiAlSi2O6) through the pressure-induced phase change from C2/c to P21/c. J. Raman. Spectrosc. 2003, 34, 769–775. [Google Scholar] [CrossRef]
  3. Tribaudino, M.; Nestola, F.; Prencipe, M. A single-crystal neutron-diffraction investigation of spodumene at 54 K. Can. Miner. 2003, 41, 521–527. [Google Scholar] [CrossRef]
  4. Arlt, T.; Angel, R.J. Displacive phase transitions in C-centred clinopyroxenes: Spodumene, LiScSi2O6 and ZnSiO3. Phys. Chem. Miner. 2000, 27, 719–731. [Google Scholar] [CrossRef]
  5. Ullrich, A.; Schranz, W.; Miletich, R. The nonlinear anomalous lattice elasticity associated with the high-pressure phase transition in spodumene: A high-precision static compression study. Phys. Chem. Miner. 2009, 36, 545–555. [Google Scholar] [CrossRef]
  6. Filip, J.; Novák, M.; Beran, A.; Zboil, R. Crystal chemistry and OH defect concentrations in spodumene from different granitic pegmatites. Phys. Chem. Miner. 2006, 32, 733–746. [Google Scholar] [CrossRef]
  7. Ingrin, J.; Skogby, H. Hydrogen in nominally anhydrous upper-mantle minerals: Concentrations levels and implications. Eur. J. Miner. 2000, 12, 543–570. [Google Scholar] [CrossRef]
  8. Johnson, E.A. Water in nominally anhydrous crustal minerals: Speciation, concentration, and geologic significance. Rev. Miner. Geochem. 2006, 62, 117–154. [Google Scholar] [CrossRef]
  9. Skogby, H.; Bell, D.R.; Rossman, G.R. Hydroxide in pyroxene: Variations in the natural environment. Am. Miner. 1990, 75, 764–774. [Google Scholar]
  10. Zhang, L.; Jin, Z.M. High-temperature metamorphism of the Yushugou ophiolitic slice: Late Devonian subduction of seamount and mid-oceanic ridge in the South Tianshan orogen. J. Asian Earth Sci. 2016, 132, 75–93. [Google Scholar] [CrossRef]
  11. Sheldrick, G.M. SHELXL: Programs for Crystal Structure Analysis; University of Göttingen: Göttingen, Germany, 2018. [Google Scholar]
  12. Farrugia, L.J. WinGX suite for small-molecule single-crystal crystallography. J. Appl. Cryst. 1999, 32, 837–838. [Google Scholar] [CrossRef]
  13. Prince, E. International Tables for Crystallography. Volume C: Mathematical Physical and Chemical Tables, 3rd ed.; Springer Science & Business Media: New York, NY, USA, 2004. [Google Scholar]
  14. Klotz, S.; Chervin, J.C.; Munsch, P.; Le Marchand, G. Hydrostatic limits of 11 pressure transmitting media. J. Appl. Phys. 2009, 42, 075413. [Google Scholar] [CrossRef]
  15. Chijioke, A.J.; Nellis, W.J.; Soldatov, A.; Silvera, I.F. The ruby pressure standard to 150 GPa. J. Appl. Phys. 2005, 98, 114905. [Google Scholar] [CrossRef]
  16. Yang, X.Z.; Xia, Q.K.; Deloule, E.; Dallai, L.; Fan, Q.C.; Feng, M. Water in minerals of the continental lithospheric mantle and overlying lower crust: A comparative study of peridotite and granulite xenoliths from the north China craton. Chem. Geol. 2008, 256, 33–45. [Google Scholar] [CrossRef]
  17. Li, W.; Jin, Z.M.; Li, H.M.; Tao, C.H. High water content in primitive mid-ocean ridge basalt from southwest Indian ridge (51.56°E): Implications for recycled hydrous component in the mantle. J. Earth Sci. 2017, 28, 411–421. [Google Scholar] [CrossRef]
  18. Paterson, M.S. The determination of hydroxyl by infrared absorption in quartz, silicate-glasses and similar materials. Bull. Minéral. 1982, 105, 20–29. [Google Scholar] [CrossRef]
  19. Bell, D.R.; Ihinger, P.D.; Rossman, G.R. Quantitative analysis of trace OH in garnet and pyroxenes. Am. Miner. 1995, 80, 465–474. [Google Scholar] [CrossRef]
  20. Gatta, G.D.; Ballaran, T.B.; Iezzi, G. High-pressure X-ray and Raman study of a ferrian magnesian spodumene. Phys. Chem. Miner. 2005, 32, 132–139. [Google Scholar] [CrossRef]
  21. Li, C.T.; Peacor, D.R. The crystal structure of LiAlSi2O6-II (“β spodumene″). Z. Kristallogr. 1968, 126, 1–6. [Google Scholar] [CrossRef]
  22. Clarke, P.T.; Spink, J.M. The crystal structure of β spodumene, LiAlSi2O6-II. Z. Kristallogr. 1969, 130, 420–426. [Google Scholar] [CrossRef]
  23. Johnson, E.A.; Rossman, G.R.; Dyar, M.D.; Valley, J.W. Correlation between OH concentration and oxygen isotope diffusion rate in diopsides from the Adirondack Mountains, New York. Am. Mineral. 2002, 87, 899–908. [Google Scholar] [CrossRef]
  24. Libowitzky, E. Correlation of O-H stretching frequencies and O-H···O hydrogen bond lengths in minerals. Monatsh. Chem. 1999, 130, 1047–1059. [Google Scholar] [CrossRef]
  25. Seaman, S.J.; Williams, M.L.; Jercinovic, M.J.; Koteas, G.C.; Brown, L.B. Water in nominally anhydrous minerals: Implications for partial melting and strain localization in the lower crust. Geology 2013, 41, 1051–1054. [Google Scholar] [CrossRef]
  26. Marschall, H.R.; Pogge von Strandmann, P.A.E.; Seitz, H.M.; Elliott, T.; Niu, Y.L. The lithium isotopic composition of orogenic eclogites and deep subducted slabs. Earth Planet. Sc. Lett. 2007, 262, 563–580. [Google Scholar] [CrossRef]
  27. Rauch, M.; Keppler, H. Water solubility in orthopyroxene. Contrib. Mineral. Petrol. 2002, 143, 525–536. [Google Scholar] [CrossRef]
  28. Zhang, B.H.; Matsuzaki, T.; Wu, X.P. Water solubility in orthopyroxene: Dependence on temperature and Al content. Chin. Sci. Bull. 2013, 58, 3895–3902. [Google Scholar] [CrossRef]
Figure 1. Photomicrographs of representative single-crystal fragments of spodumene sample.
Minerals 15 00307 g001
Figure 2. Raman spectra of the spodumene sample in wavenumber region of 100–1000 cm−1 at 1 atm.
Minerals 15 00307 g002
Figure 3. (a). Raman spectra of spodumene sample in wavenumber range of 100–1000 cm−1 as a function of increasing and decreasing pressure. (b) Pressure dependence of Raman bands in range of 100–1000 cm−1 (error bars are within the size of the symbols). The three data points shown in the region between the trend lines of ν8 and ν9 represent three bands visible only in the spectra collected at pressures of 8.6, 13.7, and 10.3 GPa within the 320–360 cm⁻1 range. These bands could not be tracked under other pressure conditions.
Minerals 15 00307 g003
Figure 4. Powder X-ray diffraction patterns of spodumene samples.
Minerals 15 00307 g004
Figure 5. Infrared spectra of spodumene samples from groups 1, 2, 3, and 4 in OH vibration region. Relative intensities of the absorption bands vary in the infrared spectra of different sample fragments due to the influence of crystal lattice orientation. Therefore, two representative spectra from the IR spectra of each sample group are selected and displayed in the figure. In the 2800–3000 cm⁻1 region, only two bands caused by hydrocarbon contamination (at 2850 and 2940 cm⁻1) are observed and thus excluded from the figure.
Minerals 15 00307 g005
Table 1. Unit-cell and atom position parameters for spodumene.
Unit-Cell Parameters
abcβ
9.4727 (14) Å8.3967 (12) Å5.2239 (8) Å110.153 (3)°
Atom position parameters
xyz
Si0.29410 (4) 0.09342 (5) 0.25604 (8)
Li00.2743 (6) 0.25
Al00.90671 (7) 0.25
O10.10956 (12)0.08230 (12)0.1404 (2)
O20.36487 (12)0.26709 (13)0.3005 (2)
O30.35660 (11) 0.98669 (14) 0.0584 (2)
Space Group: C2/c
Table 2. Site geometry parameters for spodumene.
SiLiAl
Si-O11.644 ÅLi-O1 (2)2.101 ÅAl-O1 (2)1.946 Å
Si-O21.588 ÅLi-O2 (2)2.281 ÅAl-O1 (2)1.997 Å
Si-O31.625 ÅLi-O3 (2)2.256 ÅAl-O2 (2)1.821 Å
Si-O31.629 ÅO1-O12.694 ÅO1-O1 (2)2.955 Å
O1-O22.750 ÅO1-O2 (2)2.700 ÅO1-O1 (2)2.504 Å
O1-O32.657 ÅO1-O2 (2)3.115 ÅO1-O12.694 Å
O1-O32.645 ÅO1-O3 (2)3.710 ÅO1-O2 (2)2.700 Å
O2-O32.661 ÅO2-O3 (2)2.537 ÅO1-O2 (2)2.666 Å
O2-O32.537 ÅO2-O3 (2)4.078 ÅO1-O2 (2)2.711 Å
O3-O32.621 ÅO3-O32.764 ÅO2-O22.786 Å
Tetrahedral
Volume
2.173 Å3Octahedral
Volume
10.792 Å3Octahedral
Volume
9.268 Å3
Table 3. Frequencies (cm−1) of the bands in spectra from in situ high-pressure Raman spectroscopic measurements of spodumene.
Compression
Pressure (GPa)1 atm a1.9 3.7 6.2 8.6 10.1 12.4 13.7 16.3 18.0 19.0
ν1708.3 (0)712.1 (1)717.8 (1)726.6 (1)733.6 (1)737.8 (1)743.6 (0)747.0 (0)754.9 (0)757.3 (0)759.6 (0)
ν2590.2 (1)588.9 (16)592.0 (13)608.7 (9)615.2 (6)619.9 (5)627.4 (5)629.7 (6)631.7 (5)
ν3523.0 (0)525.4 (8)529.7 (9)556.7 (14)567.9 (9)576.7 (16)
ν4533.3 (13)537.4 (10)542.2 (10)
ν5472.3 (4)477.5 (2)485.2 (1)488.9 (1)497.9 (1)501.1 (1)503.8 (1)
ν6420.3 (3)433.6 (3)443.2 (5)461.4 (3)467.4 (3)
ν7432.2 (3)435.9 (3)445.8 (3)448.6 (4)451.4 (3)
ν8389.9 (5)393.9 (4)398.2 (3)399.5 (5)405.0 (4)406.6 (4)408.4 (4)
ν9292.9 (8)300.4 (6)304.8 (3)310.6 (3)313.3 (3)321.2 (3)323.2 (3)325.0 (3)
ν10274.4 (6)279.0 (3)281.9 (3)287.8 (3)289.8 (3)291.1 (2)
ν11249.5 (6)250.1 (5)254.6 (6)255.9 (6)256.0 (7)
ν12225.0 (6)229.4 (5)230.8 (5)234.5 (4)235.8 (5)236.7 (5)
ν13189.7 (7)194.0 (4)194.4 (5)198.2 (4)198.8 (3)199.0 (4)
ν14110.8 (5)115.7 (1)120.8 (1)123.2 (1)126.3 (2)127.1 (2)127.7 (2)
Decompression
Pressure (GPa) 3.0 6.4 8.4 10.3 12.1 14.0 16.2 18.3
ν1715.4 (0)726.9 (1)734.3 (1)740.2 (0)744.1 (0)749.0 (1)755.1 (1)760.1 (0)
ν2590.7 (4)598.7 (32)610.8 (8)613.5 (10)620.6 (9)627.4 (6)634.1 (4)
ν3527.7 (3)544.3 (11)552.0 (4)556.2 (4)559.6 (6)565.0 (11)573.5 (12)
ν4504.7 (10)520.9 (3)526.1 (4)532.1 (6)538.3 (8)542.2 (6)
ν5461.8 (9)473.6 (2)482.4 (1)487.3 (1)491.2 (2)498.3 (1)504.6 (1)
ν6421.2 (3)436.8 (3)456.9 (3)464.9 (2)
ν7427.9 (3)432.3 (2)438.5 (4)446.3 (5)452.6 (3)
ν8383.6 (4)390.9 (2)396.7 (1)399.7 (2)403.2 (3)406.3 (4)408.6 (2)
ν9293.7 (12)300.8 (4)307.2 (4)311.4 (5)316.6 (5)322.1 (5)325.7 (4)
ν10267.4 (10)272.4 (5)276.2 (5)279.8 (5)283.3 (5)287.5 (3)291.9 (2)
ν11255.4 (8)257.5 (7)
ν12235.1 (6)236.6 (6)
ν13188.1 (9)189.5 (8)193.7 (7)194.6 (11)196.7 (7)199.5 (5)
ν14111.7 (1)117.7 (1)121.0 (1)123.8 (1)126.7 (2)127.6 (3)
a Spectrum of sample shown in Figure 2 (before loading into DAC device). Shift rates of these bands (ν1–ν14) are estimated to be 2.82, 2.70, 3.28, 3.09, 3.17, 6.73, 2.96, 1.85, 2.56, 1.93, 1.20, 1.31, 1.10, and 1.55 cm−1/GPa, respectively, based on data collected during compression and decompression.
Disclaimer/Publisher’s Note: The statements, opinions and data contained in all publications are solely those of the individual author(s) and contributor(s) and not of MDPI and/or the editor(s). MDPI and/or the editor(s) disclaim responsibility for any injury to people or property resulting from any ideas, methods, instructions or products referred to in the content.

