Abstract
This study employs multi-source remote sensing information and machine learning methods to comprehensively assess the geological background, structural features, alteration anomalies, and spectral characteristics of the Malkansu Manganese Ore Belt in Xinjiang. Manganese mineralization is predicted, and areas with high mineralization potential are delineated. The results of the feature factor weight analysis indicate that structural density and lithological characteristics contribute most significantly to manganese mineralization. Notably, linear structures are aligned with the direction of the manganese belt, and areas exhibiting high controlling structural density are closely associated with the locations of mineral deposits, suggesting that structure plays a crucial role in manganese production in this region. The Area Under the Curve (AUC) values for the Random Forest (RF), Naïve Bayes (NB), and eXtreme Gradient Boosting (XGBoost) models were 0.975, 0.983, and 0.916, respectively, indicating that all three models achieved a high level of performance and interpretability. Among these, the NB model demonstrated the highest performance. By algebraically overlaying the predictions from these three machine learning models, a comprehensive mineralization favorability map was generated, identifying 11 prospective mineralization zones. The performance metrics of the machine learning models validate their robustness, while regional tectonics and stratigraphic lithology provide valuable characteristic factors for this approach. This study integrates multi-source remote sensing information with machine learning methods to enhance the effectiveness of manganese prediction, thereby offering new research perspectives for manganese forecasting in the Malkansu Manganese Ore Belt.
1. Introduction
Manganese ore, regarded as a bulk pillar metal resource, is crucial for national economic growth and defense security, with widespread applications in various fields [1,2,3,4]. China is the largest consumer and importer of manganese resources globally, facing a shortage of manganese ore resources, particularly high-quality manganese-rich ore. Therefore, the search for and development of such resources has become a focus of geological exploration [5,6,7,8,9]. In recent years, high-grade, stable manganese deposits represented by the Ortokarnash and Muhu in the Malkansu area of the Western Kunlun have been discovered [10,11,12,13,14]. These deposits are expected to serve as a base for exploring and developing manganese resources on the scale of hundreds of millions of tons [10,12,15,16,17]. Although previous studies have extensively examined the geological features of the region [9,10,12,14], controlling factors for mineralization [18,19], mineralization models [16,19], and the material sources of manganese [7,11,20,21,22], a stronger focus on mineralization prediction is needed. Due to the region’s location in the westernmost border of Xinjiang and its cold, high-altitude environment, geological exploration is limited, necessitating new breakthroughs in mineral exploration to increase the volume of manganese-rich resources.
Advancements in technology have propelled mineral exploration into a data-intensive era, with the vast amounts of data generated by traditional geological, geophysical, geochemical, and remote sensing techniques providing a solid foundation for mineral prediction. However, reliance on a single disciplinary approach struggles to address the complexities arising from the interactions among various factors in the mineralization process, thereby limiting a comprehensive assessment of mineralization distribution. Consequently, the integration of multi-source information has become essential for enhancing the efficiency and accuracy of mineral exploration [23,24,25,26,27,28]. As an emerging detection method, remote sensing technology enables comprehensive non-contact exploration of the Earth’s surface, identifying land features and reflecting their properties through specific spectral bands. In light of the high costs and low efficiency associated with traditional geological exploration, remote sensing technology has found widespread application in mineral resource exploration due to its maturity and inherent advantages [29,30]. Numerous scholars have utilized remote sensing satellite imagery, including Landsat and Sentinel-2, to identify surface alteration minerals and indicate the locations of mineral deposits. Practical evidence demonstrates that the comprehensive analysis of multi-source remote sensing data is more accurate than the use of single images, thereby providing a more reliable basis for mineral prediction [31,32,33,34,35]. For example, Lyu’s study demonstrates that the integrated analysis of multi-source remote sensing data is more accurate than the use of a single image when extracting alteration minerals such as chloritization and biotitization [36]. At the same time, short-wave infrared spectral technology has become an important tool for modern mineral exploration and resource assessment, being widely applied in ore deposit investigations [37,38]. However, the fusion of multi-source remote sensing data increases both the dimensionality and complexity of the data, which can lead to a reduction in prediction accuracy. The introduction of machine learning methods, such as neural network models, Bayesian models, and random forest models [39,40,41], is capable of effectively evaluating mineral resources and mitigating the adverse effects of data fusion [42]. Previous studies have demonstrated that machine learning methods can efficiently process and analyze large volumes of multi-source geological data, thereby providing guidance for mineral exploration. By exploring the relationships between multi-source geological data and known mineral deposits, predictive models can be constructed to avoid misinterpretation or omission inherent in single mineral exploration methods, thereby accurately identifying areas with exploration potential. Nonetheless, the extraction and prediction of mineral resources still necessitate continuous exploration and innovation.
This study quantitatively predicted and analyzed the mineralization potential of the Malkansu manganese ore belt by integrating multisource remote sensing data (including geological background, structural features, alteration anomalies, and spectral characteristics) and applying three machine learning models—RF, NB, and XGBoost. Ultimately, 11 prospective mineralization areas were delineated. Compared to previous studies that relied on single features, this research integrated multiple features, effectively enhancing prediction accuracy and model robustness, and addressing the gap in multisource data fusion and mineralization prediction methods in the Malkansu region. Through this innovative approach, the accuracy of delineating favorable mineralization areas was improved, providing valuable scientific and technical support for mineralization predictions in similar regions.
2. Geological Setting
The study area is located in Akto County and Wuqia County within the Kizilsu Kirgiz Autonomous Prefecture in Xinjiang, characterized by rugged terrain and a continental alpine climate. The region experiences significant temperature variations, with limited precipitation occurring primarily in the form of snowfall, and it is covered by perennial frozen ground. The harsh environmental conditions render the area prone to natural disasters, including flash floods and mudslides. Transportation within the region is challenging, vegetation is sparse, and the bedrock is well exposed, which facilitates the extraction of geological information through remote sensing.
The MMOB is classified as a marine sedimentary manganese deposit [16]. Its tectonic location is situated at the intersection of the southwestern Tian Shan orogenic belt and the back-arc basin of the western Kunlun tectonic belt (Figure 1a,b) [7,43,44]. The region exhibits a complex geological structure, characterized by the development of faults and folds, primarily consisting of east–west trending faults, with the main faults being the Wuchibielishankou-Akecheyi Fault and the Kongbeili-Muzhaling Fault. The Cambrian metamorphic rocks of the Blenkole Group and the Silurian metamorphic rocks are faulted to the north along the Kongbeili-Muzhaling Fault, where they are in contact with the Carboniferous-Permian strata. Both the Cretaceous and Paleogene-Neogene formations are in contact with the Carboniferous-Permian strata along the regional Wuchibielishankou-Akecheyi Fault located to the south (Figure 1c) [45]. The area is influenced by north–south reverse thrust structures, leading to the formation of a near east–west complex anticline system, with the Malkansu syncline (Figure 2a) being the primary ore-bearing structure [16]. The MMOB extends approximately 100 km east–west and 0.2 to 2 km north–south. The manganese-bearing rock series is distributed along the late Paleozoic rift basin of Malkansu, with exposed strata primarily consisting of Lower Carboniferous volcanic rocks, Upper Carboniferous sedimentary rocks, Lower Permian volcanic–sedimentary rocks, and metamorphic rocks from the ancient Precambrian (Figure 1c and Figure 2b) [18]. The Upper Carboniferous Kalaatehe Formation (C2k) serves as the primary manganese-bearing horizon, where manganese mineralization occurs in carbonaceous muddy limestone interbedded with thin-bedded limestone (Figure 2c). The Lower Permian Maerkanquekusaishan Formation (P1m) also contributes, primarily composed of altered basalt and marble [7,11,12,16].

Figure 1.
(a) Study area (image from Google maps); (b) schematic tectonic map of Xinjiang China; (c) regional geological map and location of manganese deposits in the Malkansu area [7].
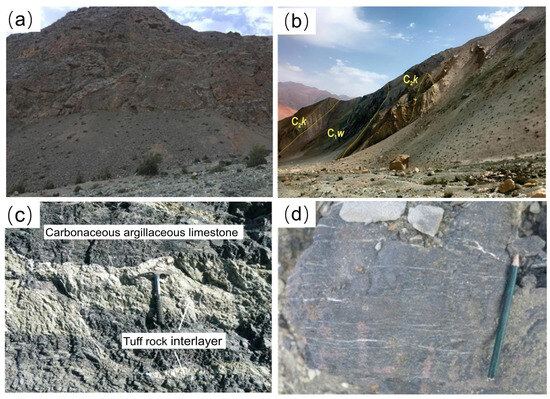
Figure 2.
(a) Malkantu syncline; (b) stratigraphic division in the field; (c) carbonaceous argillaceous limestone and tuff Interbeds; (d) rhodochrosite ore.
Magmatic activity in the region is relatively weak, primarily consisting of intrusive and volcanic rocks. The mineral bodies are primarily vein-like and lens-shaped. The alteration of the surrounding rocks is widespread, primarily involving carbonation, silicification, gypsumization, chloritization, and sericitization. Carbonate alteration, gypsum alteration, and silicification were commonly observed in both the ore body and the surrounding rocks. Chloritization and sericitization were more frequently observed at structural contact zones. The intensity of alteration decreased with increasing distance from the structural belt. The metallic minerals in the ore consist mainly of rhodochrosite (75%–95%) (Figure 2d), followed by pyrolusite, alabandite, and trace amounts of pyrite. A small quantity of iron-manganese oxides and carbonate minerals is observed along the fault zones. The non-metallic minerals primarily consist of calcite, dolomite, quartz, and clay minerals [10]. The manganese ore is characterized by a mud-microcrystalline structure, primarily exhibiting massive and banded–striated textures, with localized occurrences of clastic texture. The manganese deposits identified within this mineral belt consist of one large deposit, two medium-sized deposits, one small deposit, and several occurrences of mineralization (Figure 1c). The average manganese grade of the ore exceeds 35%, and the ore layers are stable and of considerable thickness. The projected resource potential is greater than 100 million tons, suggesting a significant potential for discovering high-quality manganese ore in this sedimentary deposit.
3. Materials and Methods
3.1. Data Acquisition and Preprocessing
GF-2, Sentinel-2, Landsat 8, and ASTER data were selected for remote sensing information extraction (Table 1), followed by preprocessing steps including radiometric calibration, atmospheric correction, orthorectification and so on (Table S1). This study primarily utilizes Sentinel-2A, Landsat 8 OLI, and GF-2 for the interpretation of structural and stratigraphic lithology, along with Sentinel-2A and ASTER for extraction alteration information, and DEM data for the extraction of topographic information. Based on the RF, NB, and XGBoost algorithms, this research comprehensively considers the geological background, structure, alteration anomalies, and spectral features of the MMOB in Xinjiang to predict manganese mineralization and delineate areas of high mineralization potential. The specific research workflow is illustrated in Figure 3.

Table 1.
List of usage data.

Figure 3.
Flow chart.
3.1.1. GF-2 Remote Sensing Data
The GF-2 satellite, independently developed by China, was successfully launched on 19 August 2014, marking it as the first domestic satellite with a spatial resolution exceeding 1 m. This satellite features sub-meter spatial resolution, high positioning accuracy, and rapid attitude maneuverability. Its spatial resolution at the ground point reaches 0.8 m in the panchromatic band and 3.2 m in the multispectral bands. The satellite data consist of five bands, encompassing four standard spectral bands: blue (0.45–0.52 μm), green (0.52–0.59 μm), red (0.63–0.69 μm), and near-infrared (0.77–0.89 μm), as well as one panchromatic band (0.45–0.90 μm) [46].
3.1.2. Sentinel-2 Remote Sensing Data
The Sentinel-2 satellite, launched by the European Space Agency (ESA) in 2015, is a polar-orbiting satellite equipped with a filter-based push-broom high-resolution multispectral imaging sensor (MSI). It has an imaging swath width of 290 km and includes a total of 13 spectral bands spanning visible light to shortwave infrared, with ground resolutions of 10, 20, and 60 m, respectively.
3.1.3. Landsat-8 Remote Sensing Data
In 2013, the Landsat 8 satellite, launched by the National Aeronautics and Space Administration (NASA), was equipped with advanced Earth observation instruments: the Operational Land Imager (OLI) and the Thermal Infrared Sensor (TIRS). OLI comprises nine spectral bands, each with a spatial resolution of 30 m. Additionally, it is equipped with a panchromatic band exhibiting a spatial resolution of 15 m. TIRS includes two independent thermal infrared bands, each possessing a spatial resolution of 100 m [47].
3.1.4. ASTER Remote Sensing Data
The ASTER sensor, mounted on the Terra satellite, is an advanced multispectral imaging device that integrates high spatial, spectral, and radiometric resolutions. ASTER data exhibit high resolution in the infrared bands and are widely utilized in remote sensing geology to identify lithology and extract alteration anomalies. The ASTER imagery comprises 14 bands, with a visible and near-infrared (VNIR) resolution of 15 m, suitable for locating surface water and mineral resources; the shortwave infrared resolution is 30 m, and the thermal infrared resolution is 90 m [48,49].
3.2. Research Methods
3.2.1. Alteration Information Extraction
- (1)
- Principal Component Analysis (PCA).
PCA, also known as the K–L transform, is an unsupervised dimensionality reduction technique based on statistical principles proposed by Crosta. This method transforms the original data into uncorrelated new variables (principal components) through a multidimensional orthogonal linear transformation, thereby reducing data dimensionality and extracting feature information. PCA can reduce the dimensionality of remote sensing information, enhance and compress data, and eliminate correlations between different areas or bands, making it widely applicable in information filtering and discrimination in image processing [36,50].
- (2)
- Spectral Angle Mapper (SAM).
The SAM is a spectral matching classification method that utilizes the spectral information of remote sensing image pixels. The class of a pixel is determined by comparing the spatial vector angle similarity between the pixel spectrum and known reference spectra for each category. SAM requires that each class have a known reference spectrum; the smaller the spectral angle or the lower the SAM value, the higher the similarity, thereby enabling supervised terrain classification [51,52].
3.2.2. Remote Sensing Geological Interpretation
To address the limited information available from a single image, lithological enhancement techniques were employed to clearly delineate stratigraphic lithological boundaries. These techniques primarily include band ratio analysis, Principal Component Analysis (PCA), Independent Component Analysis (ICA), Minimum Noise Fraction (MNF), and color synthesis. Among these, band ratio analysis highlights specific lithologies through band ratios; PCA removes redundant information from the bands; ICA further eliminates higher-order redundancies and enhances data independence; MNF performs PCA after denoising, achieving both noise reduction and data compression [53]. Stratigraphic interpretation was carried out using these methods in combination with geological data. For structural interpretation, convolutional enhancement processing was applied to remote sensing images to accurately extract fault information in specific directions. Additionally, fault structure interpretation and analysis were performed by interpreting indicators such as tone, color, morphology, and their relationships with surrounding features, in conjunction with existing geological data.
3.2.3. Machine Learning
- (1)
- Random Forest (RF).
Random Forest is an ensemble classification algorithm proposed by Breiman, which is based on the Bagging algorithm and ensemble learning principles. Multiple samples are repeatedly extracted from the original data through self-sampling, and decision trees are constructed for each sample. These decision trees are aggregated, and voting is performed based on the outputs of each tree to achieve classification and prediction. Random Forest demonstrates excellent performance in situations involving large datasets with numerous features, exhibiting a low error rate and resistance to overfitting [54,55]. The process of the Random Forest model is illustrated in Figure 4.
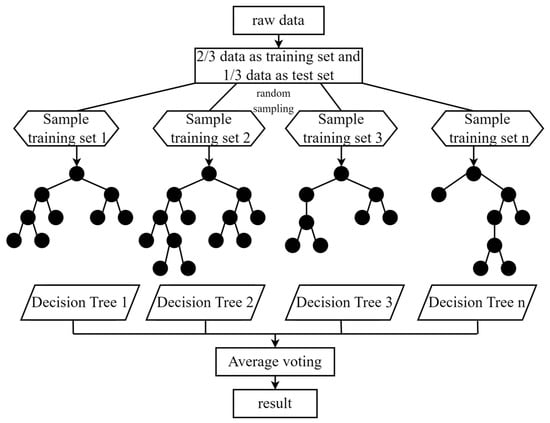
Figure 4.
Random forest flow chart [56].
- (2)
- Naïve Bayes (NB).
Bayesian networks, also referred to as belief networks, are a classification method grounded in Bayes’ theorem and the assumption of conditional independence among features, which holds substantial significance in the fields of machine learning and data mining. The core idea involves calculating the probability of each category given the presence of certain items to be classified, and assigning the item to the category with the highest probability. This algorithm exhibits widespread applications in classification tasks, including, but not limited to, text analysis, sentiment analysis, medical diagnosis, user preference analysis, and geographic information service matching [57].
- (3)
- eXtreme Gradient Boosting (XGBoost).
XGBoost is an enhanced Boosting algorithm grounded in Gradient Boosted Decision Trees, recognized for its rapid training speed and high accuracy of results [58]. This algorithm employs first-order and second-order gradient functions to optimize the loss function, thereby reducing model complexity and enhancing training speed [59]. The XGBoost algorithm facilitates continuous iteration and optimization of the model through the integration of multiple Classification and Regression Trees (CARTs), thereby generating new tree models that fit the residuals present in the preceding tree model. The final prediction of the model is calculated as the sum of the scores from all CARTs [60].
- (4)
- Receiver Operating Characteristic Curve (ROC).
The ROC curve is widely utilized in machine learning for binary classification tasks [61]. The classification outcomes are divided into four categories: True Positive (TP), False Negative (FN), False Positive (FP), and True Negative (TN). These four outcomes are used to calculate the True Positive Rate (TPR) and the False Positive Rate (FPR), where TPR represents the proportion of correctly identified positive instances and FPR represents the proportion of negative instances incorrectly classified as positive. The ROC curve is generated by plotting TPR on the vertical axis and FPR on the horizontal axis. The area under the ROC curve (AUC) measures the overall accuracy of the model; a larger AUC indicates better predictive performance [62,63].
Three models—RF, NB, and XGB—are employed in this study to analyze and predict mineralization potential, with the results evaluated using metrics such as the ROC curve. RF is particularly effective in handling high-dimensional and complex data, exhibiting robust stability. NB, conversely, is highly efficient and computationally light, particularly when applied to small datasets or independent features. XGBoost excels in capturing intricate nonlinear relationships through the optimization of algorithms. The integration of these three models reduces both bias and variance that could arise from using a single model, thereby enhancing the accuracy and robustness of mineralization zone predictions. Based on the predictions from these models, mineralization potential was classified into different grades, and a comprehensive model was developed and ultimately employed to predict and delineate potential mineralization belts in the Malkansu region.
4. Predictive Factors
4.1. Geologic Factor
4.1.1. Stratum Lithology
Mineralization is constrained by the stratigraphic lithology of specific geological eras; moreover, mineral-bearing rocks serve as important markers for mineral exploration and are typically more exposed than the ore bodies themselves, thus providing crucial clues for mineral prospecting [64]. The exposed strata in the MMOB are primarily composed of Lower Carboniferous volcanic rocks, Upper Carboniferous sedimentary rocks, and Lower Permian volcanic sedimentary rocks. Among these, the large Ortokarnash manganese deposit and the medium-sized Malkansu and Muhu manganese deposits are situated within the C2k. Previous studies have indicated that the Tandyle manganese occurrence is located within the Middle Permian and C2k, and manganese mineralization is also observed in the C1w volcanic tuff beneath the Kalasu manganese deposit, accompanied by massive copper-zinc sulfides [7,45,65].
Bands B7, B5, B2 from Landsat 8 OLI data were selected for band combination (Figure 5a), enhancing lithological boundaries; however, further differentiation of stratigraphic variations remains necessary. PCA was applied to the Landsat 8 OLI image, and the first three principal components were selected for color composition (Figure 5b), which enhanced tonal differences and spectral features, emphasizing the Quaternary. The third principal component (PC3) primarily reflects lithological information, and a combination of PC5 (R), PC3 (G), PC1 (B) was used for color composition (Figure 5c), which clearly delineated the boundary of the Miocene Anju’an Formation (N1a). Further processing of Landsat 8 data using MNF and ICA was conducted, with IC6 (R), IC3 (G), B1 (B) selected for composition, highlighting the Miocene Keziluoyi Formation (N1k), as shown by the light green area in Figure 5d. Additionally, the color composition of MNF1 (R), MNF2 (G), MNF3 (B) (Figure 5e) emphasized the Silurian (S) and Middle Devonian Togmaiti Formation (D2t), with clear lithological boundaries that can be easily delineated. The combination of IC1 (R), IC2 (G), IC3 (B) (Figure 5f) highlighted the Upper Cretaceous Yingjisha Group (K2y) and the Middle-Upper Silurian Tartakuli Formation (S2-3t). Stratigraphic information for the study area was obtained using direct judgment, comparative methods, and comprehensive judgment, along with texture, tone, and other features (Figure 6). Stratigraphic lithology was quantitatively processed (Figure 7a), with favorable mineralized layer (e.g., C2k, P1m, C1w) assigned a value of 1, indicating a high probability of mineralization, while other strata were assigned a value of 0, indicating a lower probability. Spatial overlay analysis of favorable mineralized strata with known mineral deposits (points) revealed that 11 out of 13 known deposits (points) were located within the favorable mineralization strata, with a distribution probability of approximately 0.85, suggesting that the stratigraphic factor holds mineralization-indicating significance.

Figure 5.
Enhancement of stratigraphic lithology information using Landsat 8 data. (a) B7(R) B5(G) B2(B); (b) PC3(R) PC2(G) PC1(B); (c) PC5(R) PC3(G) PC1(B); (d) IC6(R) IC3(G) B1(B); (e) MNF1(R) MNF2(G) MNF3(B); (f) IC1(R) IC2(G) IC3(B). Notes: Q: Quaternary; N1a: Miocene Anju’an Formation; N1k: Miocene Keziluoyi Formation; K2y: Upper Cretaceous Yingjisha Group; D2t: Middle Devonian Togmaiti Formation; S2-3t: Middle-Upper Silurian Tartakuli Formation; S: Silurian.
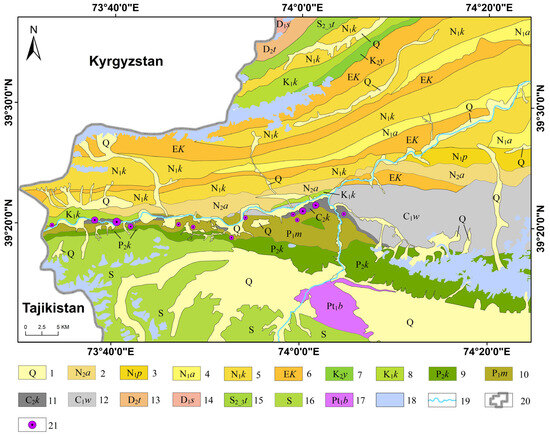
Figure 6.
Remote sensing interpretation of stratigraphy. 1—Quaternary; 2—Pliocene Atushi Fm; 3—Miocene Pakabulake Fm; 4—Miocene Anju’an Fm; 5—Miocene Keziluoyi Fm; 6—Paleogene Kashi Group; 7—Upper Cretaceous Yingjisha Group; 8—Lower Cretaceous Kezilesu Group; 9—Upper Permian Kungaytao Fm; 10—Lower Permian Maerkanquekusaishan Fm; 11—Upper Carboniferous Kalaatehe Fm; 12—Lower Carboniferous Wuluate Fm; 13—Middle Devonian Togmaiti Fm; 14—Lower Devonian Sawayaerdun Fm; 15—Middle-Upper Silurian Tartakuli Fm; 16—Silurian; 17—Paleoproterozoic Bulunkuoler Group; 18—Snow; 19—River; 20—National border; 21—Manganese deposit.

Figure 7.
Mineralization factors: (a) normalization of favorable mineralization strata; (b) structural density; (c) aspect; (d) slope; (e) terrain ruggedness; (f) NDWI; (g) NDRI; (h) band ratios; (i) normalization of rhodochrosite anomaly information; (j) normalization of argillization anomaly information; (k) normalization of hydroxyl anomaly information; (l) normalization of iron staining anomaly information; (m) normalization of silicification anomaly information; (n) normalization of sericitization anomaly information; (o) normalization of soft manganese anomaly information; (p) normalization of chloritization anomaly information.
4.1.2. Regional Structure
The regional tectonic setting is a key factor that controls the formation of manganese deposits, as it determines the provenance of manganese ores, mineralization depth, types of elements, genetic types, and their temporal and spatial distribution. Late Carboniferous manganese mineralization anomalies are observed in this study area, likely related to the unique regional discrete extensional tectonic environment [7,65,66,67,68]. Therefore, tectonics, as an important geological condition for mineralization, provides quantitative information that can reflect the intensity of tectonic activity, making it one of the favorable factors for mineralization.
Convolution filtering was applied to Sentinel-2 data at angles of 0°, 45°, 90°, and 135°, and linear and circular structures within the region were extracted based on hue and texture features in conjunction with high-resolution GF-2 remote sensing data (Figure 8). The linear structures are characterized by an east–west distribution and exhibit a high correlation with known mineral deposits (points). In contrast, the circular structures display a bead-like distribution oriented east–west, which bears some resemblance to the east–west distribution pattern of mineral deposits in the area but shows no significant correlation with the distribution of known mineral points. Therefore, the presence of manganese deposits in the region is, to some extent, controlled by linear structures. The influence of structures on mineralization is reflected in their density; a higher structural density indicates greater complexity and activity of fractures, which is more favorable for mineralization, as shown in Figure 7b.
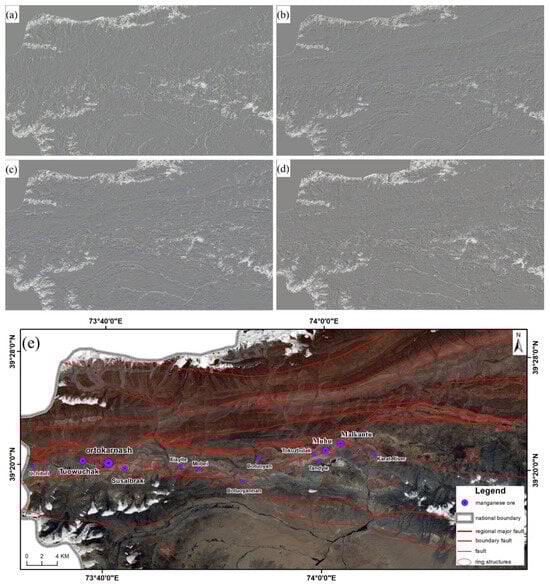
Figure 8.
(a–d) Filtering in 0°, 45°, 90°, and 135° directions; (e) interpretation of linear structures via remote sensing.
4.2. Orographic Factor
Topographic and geomorphological conditions play a crucial role in the mineralization process, as they not only control the processes of erosion and deposition but also determine the dynamics of groundwater, the state of weathering products, and their retention. Generally, when the dip of a mineral layer aligns with the slope of the terrain, manganese mineralization is favored. Conversely, when the dip of the mineral layer is opposite to the slope of the terrain, the presence of multi-stage active interlayer fracture zones in the roof of the ore body may also be beneficial for mineralization [69]. The formation of mineral deposits is influenced and controlled not only by the mineralized parent rock and weathering processes [70], but also by the degree of microtopographic variation, which affects the development and preservation of weathering crusts and ore bodies. In summary, topography and geomorphology are vital conditions for mineralization and serve as crucial indicators for mineral exploration [71]. Three characteristic factors were selected for this study: aspect (Figure 7c), slope (Figure 7d), and topographic relief (Figure 7e), which were calculated using ArcGIS and 12.5 m DEM data from Xinjiang.
4.3. Spectral Features
A close relationship exists between spectral features and mineralization prediction. Spectral features refer to the characteristics of an object’s reflection, absorption, or emission of light at different wavelengths, reflecting the physical and chemical properties of the object. In geological mineral exploration, the comprehensive utilization of various indices extracted from remote sensing technology has become an important method to enhance the accuracy and efficiency of mineralization predictions. This study employs the Normalized Difference Water Index (NDWI) (Figure 7f) and the Normalized Difference Rock Index (NDRI) (Figure 7g) as significant factors in predicting mineralization.
The NDWI enhances the characteristics of water bodies in remote sensing images, enabling the rapid identification of water systems, lakes, and wetlands. These water bodies participate directly or indirectly in the mineralization process, and their values and spatial distributions serve as key references for assessing the favorability of mineralization environments. The NDRI highlights specific rock types or alteration features and, by integrating various rock spectral characteristics, improves the ability to identify rocks that are favorable for mineralization. This approach effectively recognizes rocks and alteration zones closely associated with the mineralization process, thereby delineating potential exploration targets [72]. Rhodochrosite is the primary ore mineral in the region, and its spectral curve from the USGS standard spectral library (Figure S1) exhibits distinct absorption peaks at 0.55 μm, 1.4 μm, 1.9 μm, and 2.3 μm, with a notable reflectance peak near 0.8 μm. These spectral features are consistent with the manganese ore analysis conducted by Li [46]. Sentinel-2 data, which consist of 13 bands spanning the visible, near-infrared, and shortwave infrared regions, is employed in this study, enabling the detection of key spectral bands associated with rhodochrosite. In particular, absorption and reflectance features of rhodochrosite at 0.55 μm and 0.8 μm correspond to Sentinel-2’s B3 and B8 bands, respectively. Therefore, this study calculated the ratio between these two bands to highlight the rhodochrosite information (Figure 7h). The integrated application of these methods provides a more precise and efficient approach to mineralization prediction.
4.4. Alteration Anomaly Information
A close relationship is usually observed between rock alteration and mineralization, with different types of alteration and their combinations indicating specific types of ore deposits. Based on this relationship, rock alteration can be regarded as an effective indicator for mineral exploration [62,73]. The alteration types of the surrounding rocks in the MMOB primarily include carbonation, silicification, gypsumization, chloritization, and sericitization. The primary manganese ore mineral is identified as rhodochrosite, followed by psilomelane, manganese sulfate, and a small amount of pyrite [16]. Guided by the aforementioned research, multi-temporal ASTER and Sentinel-2 data are processed in this study by removing interference factors and performing band combinations. Principal component analysis (PCA) and spectral angle mapping (SAM) are employed to extract alteration information from the study area [74,75].
4.4.1. Alteration Information Extraction Based on PCA
Based on the analysis of the spectral characteristics of manganese mineralization-related alteration minerals, the PCA method based on Crosta technology is utilized in this study to extract information on iron staining, hydroxyl, argillic, and rhodochrosite alteration within the region. The extraction results indicate that hydroxyl alteration exhibits a concentrated anomaly, primarily observed in the lower Permian and C2k. Overlay analysis with known deposits indicates a high degree of overlap between the areas of elevated hydroxyl alteration and the known mineralization points. Notably, six known deposits in the area, including the Ortokarnash and the Susalbrak manganese deposit, are observed to exhibit significant hydroxyl alteration anomalies (Figure 9a). The iron-staining alteration anomalies in the area primarily exhibit a northeast-trending, banded distribution, being widespread and primarily located in the P1m and N1k (Figure 9b). The distribution of argillic alteration anomalies is more scattered, predominantly found in the C1w (Figure 9c). The distribution of rhodochrosite alteration anomalies is also relatively dispersed, occurring in a banded pattern primarily in the Lower Permian. There is a high degree of overlap between the areas of elevated alteration anomalies and known mineralization points, particularly where high rhodochrosite anomalies are developed at locations such as the Mobei and Botuoyannan manganese point (Figure 9d). Overall, the extraction of hydroxyl anomalies is the most effective, followed by argillic alteration.
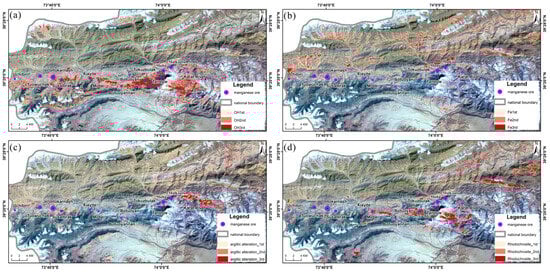
Figure 9.
Alteration information extraction results based on PCA: (a) hydroxyl anomaly information; (b) iron staining abnormal information; (c) argillic anomaly information; (d) rhodochrosite anomaly information.
4.4.2. Alteration Information Extraction Based on SAM
SAM is a technique for extracting alteration minerals based on the spectral data of image pixels. Its classification accuracy is highly dependent on the variability in the spectral curve shapes of the pixels within the imaged rock units, shifts in the positions of absorption troughs and peaks (i.e., spectral variability), and the distinguishability of samples between different rock units. The classification results are presented in Figure 10. After excluding interference information (primarily from clouds, snow, and Quaternary deposits), the minerals are predominantly distributed in the central part of the study area. Notable anomalies of soft manganese and chloritization have been observed in the southern part of the Muhu deposit, as well as in the eastern parts of the Xiayite and Mobei points and the southern section of the Karat River, while other alteration types are less pronounced and more scattered.
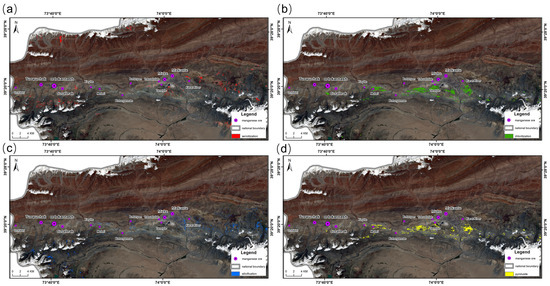
Figure 10.
Alteration information extraction results based on SAM: (a) sericitization abnormal information; (b) chloritization anomaly information; (c) silicification anomaly information; (d) pyrolusite anomaly information.
The above two results indicate that the correlation of alteration anomalies interpreted from small-scale remote sensing imagery in the manganese mining area is not significant. However, compared to the PCA extraction results, the extraction performance of SAM is generally superior, with the distribution of information being more concentrated, primarily in the P1m, C2k, and C1w, all of which are manganese-bearing strata. Overlay analysis with known deposit points indicates a high degree of overlap between the regions of chloritization and soft manganese and the known mining points. The extraction of alteration anomaly information using PCA and SAM can also serve as indirect indicators of mineralization, with mineralization-related alteration represented by the normalization of secondary and tertiary alteration anomalies, as illustrated in Figure 7i–p.
5. Predictive Modeling
5.1. Selection and Establishment of Training Samples
In the supervised learning of mineral resource prediction models, the selection and processing of training samples are critical [27,76,77]. Prior to the application of predictive algorithms, it is essential to determine the locations of training sample points within the study area. The training samples in the Malkansu region consist of two categories: mineral point samples and non-mineral point samples, totaling 100 points (Figure 11), with 20 mineral points sourced from known mineral deposits and their vicinity. The 80 non-mineral points are distributed relatively evenly throughout the study area, primarily in regions characterized by human engineering activity, permanent snow cover, and Quaternary deposits. Of these samples, 70% are utilized as the training set, while 30% are reserved for the test set. Due to the significantly larger number of non-mineralized points compared to mineralized points in the study area, a 1:4 sample ratio was employed to optimize model performance and mitigate overfitting. By increasing the number of non-mineralized samples, this ratio effectively improved the model’s generalization ability, mitigated the risk of overfitting, and enhanced its capacity to distinguish between mineralized and non-mineralized regions, thereby improving the model’s robustness, accuracy, and reliability in practical applications.

Figure 11.
Sample point distribution map.
Using the Random Forest model, the importance of feature factors is ranked, which allows for the exclusion of elements that are not significant for mineralization prediction based on the weights of each factor. In constructing the Random Forest algorithm, all feature layers of the study area are initially converted into grid data with a cell size of ten meters, and all feature grids are then overlaid, with each feature layer corresponding to a specific band. The training and validation data for the Random Forest are allocated randomly in a 3:7 ratio.
This study selects 16 factors from the four factors controlling mineralization mentioned above, which are represented by X1–X16 (Sb3/Sb8, NDRI, aspect, slope, topographic roughness, structural density, stratigraphic lithology, NDWI, silicification, sericitization, soft manganese, chloritization, rhodochrosite, argillization, hydroxyl, and iron staining alteration information), for inclusion in the mineralization prediction. An importance ranking of the above 16 factors is conducted using the Random Forest method (Figure 12a). When constructing factors related to mineralization, it is essential to avoid excessive correlation among factors to prevent information redundancy and overfitting [78]. Accordingly, the Pearson correlation coefficient is employed to evaluate the degree of association among the factors (Figure 12b). Among these, high correlations are observed between X1 and X8, X4 and X5, as well as X11 and X12, all exceeding 0.95. Consequently, one variable from each of these three pairs is selected for training purposes, specifically X1, X5, and X12. In contrast, the correlation coefficients among the remaining variables are relatively low and statistically insignificant. Consequently, the final selection includes the top ten ranked factors excluding X8, X4 and X11, namely structural density, stratigraphic lithology, Sb3/Sb8, NDRI, iron staining anomaly information, aspect, topographic roughness, chloritization, rhodochrosite, and hydroxyl anomaly information, to establish a new training sample for mineralization prediction.
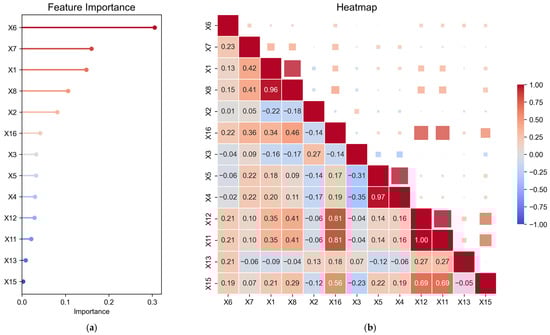
Figure 12.
(a) The predictor factor importance lollipop chart. (b) The predictor factor Pearson correlation heat map.
5.2. Model Construction
To achieve a more accurate predictive model, the model’s performance must be evaluated under different parameter combinations to determine the optimal set of parameters and model [62]. Based on the aforementioned factors, three models—Random Forest (RF), Naive Bayes (NB), and Extreme Gradient Boosting (XGB)—were constructed for predicting mineralization using the sklearn library in Python 2.5. The previously constructed dataset was input into the three models for training, and a grid search was conducted during the model-building process to optimize parameters. This resulted in predictions for favorable mineralization areas and analyses of model accuracy.
5.3. Evaluation of Model Accuracy
During the model construction and optimization process, the effectiveness of model fitting is influenced by various factors, including data quality, feature dimensions, the selection of hyperparameters, and randomness [25,79,80,81]. To enhance model performance and interpretability, these factors must be comprehensively considered, and a precision analysis of the model must be conducted. Methods for analyzing model precision include the confusion matrix, ROC curve, AUC value, cross-validation, and feature importance analysis. The ROC curve illustrates the classification ability of the model by plotting the true positive rate against the false positive rate across various thresholds [23,79]. The closer the curve is to the upper left corner of the graph, the better the model’s performance; this indicates a more accurate classification of mineral and non-mineral prospects. The AUC value ranges from 0 to 1, with values approaching 1 indicating improved model performance [82,83,84]. The confusion matrix is employed to calculate various metrics, including accuracy (ACC), precision, and recall. In this context, ACC reflects the overall accuracy of the model, while precision and recall assess the predictive accuracy. The F1 score summarizes the model’s performance. It is generally considered ideal for accuracy, precision, recall, and the F1 score to all be high.
This study utilizes the area under the ROC curve (AUC), along with accuracy (ACC), precision, recall, and F1 score as evaluation metrics, aiming to achieve superior model performance and interpretability. The optimized RF, NB, and XGBoost models are utilized to process the predicted dataset. An empirical threshold of 0.6 has been selected for sample classification. The ROC curve is plotted, and metrics including ACC are calculated to evaluate the trained and optimized RF, NB, and XGBoost models, as illustrated in Figure 13.
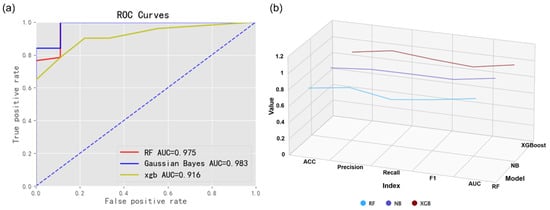
Figure 13.
(a) The ROC curve for the mineral prediction algorithm. (b) The 3D line plot of accuracy metrics across models.
Based on the results of the ROC curve (Figure 13a), the three models—RF, NB, and XGBoost—exhibit high performance metrics, with AUC values of 0.975, 0.983, and 0.916, respectively, all exceeding 0.9. This indicates that they possess excellent and stable classification capabilities, effectively identifying favorable mineralization areas. Among these models, the NB model demonstrates the highest AUC value, followed by the RF model.
The results indicate (Table 2 and Figure 13b) that the performance metrics of the RF and NB models are quite similar, whereas the overall accuracy of the XGBoost model is comparatively lower. Notably, the AUC value of the NB model is 0.983, which is the highest among the three models. Additionally, the NB model demonstrates superior performance in terms of ACC, precision, recall, and F1 score, highlighting the accuracy and reliability of the Naive Bayes model.
Table 2.
Model accuracy comparison table.
5.4. Metallogenic Prediction Results
In this study, the research area was divided into 53,881 analytical units, each with a pixel size of 130 m on each side. Based on the selected top ten feature factors, optimal mineralization prediction models were constructed using the RF, NB, and XGBoost algorithms. Kriging interpolation was employed to generate the mineral prospectivity map, with the mineralization probability predicted by the machine learning models classified into five levels—low, relatively low, medium, high, and very high—using the natural breaks method. This resulted in the creation of a manganese mineralization prediction map for the study area, as illustrated in Figure 14.
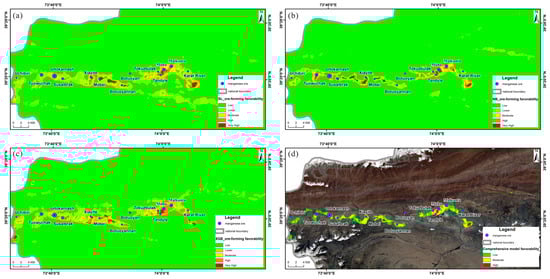
Figure 14.
(a) RF mineralization prediction map. (b) NB mineral prediction map. (c) XGBoost mineralization prediction map. (d) Composite model mineralization prediction map.
Table 3.
The area and proportion of favorable mineralization zones for each model.
- (1)
- Random Forest Model: The high favorability and very high favorability zones occupy the smallest area proportions, covering 0.87% and 0.23% of the study area, respectively, with distribution probabilities slightly lower than those in the NB model. Regarding known mineral occurrences, eight mineral points are located within the high favorability or higher zones, two within the medium favorability zone, and three within the low and very low favorability zones. The proportion of mineral points in the medium favorability and above zones is 76.9%, the lowest among the three models.
- (2)
- Gaussian Naïve Bayes Model: The proportions of the high favorability and very high favorability zones are moderate, at 0.84% and 0.31% of the study area, respectively, with the latter representing the highest value among the three models. For known mineral occurrences, eight points are located in the high favorability or above zones, three in the medium favorability zone, and two in the low and very low favorability zones. The proportion of mineral points in the medium favorability and above zones is 84.6%.
- (3)
- eXtreme Gradient Boosting Model: The high favorability and very high favorability zones exhibit the largest area proportions, covering 1.24% and 0.20% of the study area, respectively. Among the known mineral occurrences, five points are located in the high and very high favorability zones, six in the medium favorability zone, and two in the low and very low favorability zones. The proportion of mineral points in the medium favorability and above zones is also 84.6%.
Among the three models, the NB model demonstrates superior accuracy and predictive performance, particularly in aligning high mineralization probability areas with known mineral deposits. Consequently, the NB model exhibits optimal prediction accuracy and generalization capability, rendering it the most effective model for accurately identifying zones favorable for mineralization within the study area.
Finally, areas classified as low and very low mineralization favorability by the three models were excluded, and the regions with moderate and higher favorability were algebraically combined and overlaid to produce a comprehensive mineralization favorability map for the Malkansu area (Figure 14d). This map delineates eleven potential mineralization zones across three levels (Figure 15), including four A-class, four B-class, and three C-class prospective mineralization areas.
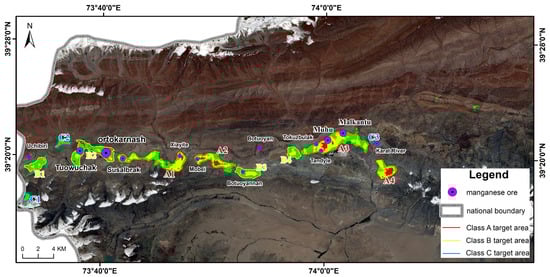
Figure 15.
Delineation of target areas.
6. Discussion
6.1. Extraction of Remote Sensing Geological Information
Remote sensing technologies, particularly those employing Landsat 8 OLI, Sentinel-2, GF-2, and ASTER data, have significantly improved the extraction of lithological, alteration, and structural features. The application of band combinations and enhancement techniques to Landsat 8 OLI data has greatly enhanced the clarity of lithological boundaries, overcoming the limitations of traditional geological mapping. Sentinel-2 and GF-2 data offer higher resolution and additional spectral bands, facilitating the extraction of alteration information and the interpretation of large-scale linear structures. Directional filtering further improves the visibility of these linear features. Since most alteration minerals exhibit at least one pair of reflection peaks and absorption valleys in the SWIR region of ASTER data, it is frequently employed to extract alteration information related to manganese deposits [85,86]. The panchromatic band of GF-2, with a spatial resolution of 0.8m, is particularly effective for identifying small-scale linear structures. Additionally, multispectral remote sensing techniques can effectively extract alteration information from surrounding rocks, providing valuable insights for mineral exploration [87]. In this study, Sentinel-2 and ASTER data were integrated, and PCA and SAM methods were employed to extract eight distinct anomalies. Notably, anomalies associated with hydroxyl, chlorite, rhodochrosite, and soft manganese minerals align with fault zones and exhibit significant overlap with known deposits, suggesting that the extracted alteration information is accurate and strongly correlated with the distribution of manganese deposits.
Rhodochrosite, a typical carbonate mineral, exhibits absorption features at 1.4 µm, 1.9 µm, and 2.3 µm, corresponding to the vibration modes of hydroxyl, water molecules, and carbonate ions, respectively. These features are essential for mineral detection. Both Sentinel-2 and ASTER remote sensing datasets cover these key spectral bands and effectively highlight and extract rhodochrosite information. Sentinel-2 data, particularly in the visible and near-infrared bands (e.g., 0.55 µm, 0.8 µm, 1.4 µm, and 1.9 µm), show a strong correlation with the absorption features of rhodochrosite, thereby enabling precise highlighting of its information. ASTER, with its higher spectral resolution, offers significant advantages in extracting absorption features from the short-wave infrared region (e.g., 1.4 µm, 1.9 µm, and 2.3 µm), providing precise support for rhodochrosite identification. By integrating data from both sensors, a balance between spatial and spectral resolution can be achieved, thus enhancing the accuracy of manganese deposit prediction and the ability to extract anomalous information.
6.2. Feature Factor Selection and Weight Analysis
In research on the application of machine learning to mineralization prediction, feature selection is a critical step for improving predictive accuracy. The RF algorithm was employed for feature selection and importance evaluation to identify the dominant factors in the mineralization process. The results indicate that RF effectively ranked the importance of various geological features in mineralization prediction, further confirming the robustness of RF in identifying key feature factors, as proposed by previous studies [88,89]. A major advantage of the RF algorithm is its ability to handle complex, high-dimensional data while accounting for nonlinear relationships and interactions among features. In this study, RF successfully captured these interactions, thereby providing a more precise and comprehensive understanding of the key factors driving mineralization. Additionally, by quantifying the importance of each feature, RF provides insight into the relative contributions of different variables to mineralization prediction, which not only enhances model interpretability but also optimizes prediction outcomes for mineralization belts by highlighting key influencing factors.
The importance of feature factors was quantified using Random Forest, and data with excessively high correlations were removed based on the Pearson correlation coefficient. The results (Figure 12) indicate that the influence of structural density is the greatest, with a weight of 0.305. This can be attributed to the unique tectonic environment of the MMOB, which plays a decisive role in the manganese source and mineralization processes of the manganese deposits, serving as an important indicator for manganese prospecting. This finding aligns with the conclusions of previous studies. Other significant features include the controlling mineral strata, the Sb3/Sb8 ratio, NDRI, and iron staining anomaly information. The contributions of rhodochrosite and hydroxyl anomaly information are minimal, indicating that their predictive capabilities for mineralization prospects in the region are weak. Wang calculated the weights for controlling mineral strata, hydroxyl, iron staining, and manganese anomalies based on the MARS evidence weighting method, concluding that the controlling mineral strata have the strongest influence on mineralization characterization, while iron staining anomalies have the least impact [44]. Since his study did not incorporate regional tectonic factors, his conclusions align with the optimal mineralization factor results of this paper under the assumption of disregarding tectonic influences. However, due to the limited and subjective nature of the selected feature factors, the feature selection results in this study, based on Random Forest, are more reliable by comparison.
6.3. Study on Metallogenic Prediction Model of Manganese Ore
Previous research on the MMOB has predominantly focused on geological characteristics, mineralization patterns, and material sources, while relatively little attention has been given to mineralization prediction. Mineralization prediction mainly relies on remote sensing technology. For instance, Xie and Li utilized multi-source remote sensing data, employing methods such as PCA and SAM to extract alteration information and delineate mineralization target areas [46,90]. However, using a single remote sensing method is insufficient to address the complexity arising from the interaction of multiple factors, which may result in low prediction accuracy. Xu and Wang employed different approaches for manganese ore prediction. Xu used a mineral deposit model to integrate geological information, while Wang applied the MARS evidence weighting method to assign weights to various factors for manganese ore prediction [9,44]. Although the prediction incorporates various mineralization information from remote sensing and geological sources, the weighting method involves a degree of subjectivity, making the prediction results difficult to interpret.
The application of multi-source remote sensing information coupled with machine learning methods in mineral exploration within the study area is limited. Through model algorithms, interference from subjective weighting can not only be avoided, but geological features related to minerals can also be extracted from a large volume of remote sensing data, thereby revealing their association with mineral distribution. By training a model capable of identifying regions with similar mineral geological characteristics, potential manganese deposit areas can be identified, thereby improving the efficiency and accuracy of manganese exploration and providing important support for resource development.
This study employs three machine learning models to predict manganese mineralization using the same dataset, allowing for a comprehensive comparison of the predictive differences among the models in the same region. Among these models, RF has been widely applied in mineralization prediction, while NB and XGBoost have been utilized to a lesser extent [91,92]. In terms of model accuracy, the results of NB and RF are similar, but NB demonstrates superior performance, and XGBoost exhibits the lowest accuracy. Consequently, the NB model shows greater generalization capability. According to the prediction results, XGBoost covers the largest area classified as highly favorable for mineralization, whereas the results of RF and NB are comparable. In the provided dataset, predictions for areas classified as highly favorable and above exhibit a significant degree of overlap among the three models, predominantly arranged in an east–west orientation and primarily distributed between the Wuchibielishankou-Akecheyi Fault and the Kongbeili-Muzhaling Fault. This suggests that the models may have identified common features or patterns within the dataset. Overall, all three models perform exceptionally well in mineralization prediction, with the NB model showing relatively better performance.
6.4. Deficiency and Outlook
The current extraction of alteration information is reliant on USGS spectral data, which exhibit biases and have limited spectral bands, thereby impacting accuracy. Future research should aim to incorporate multispectral and hyperspectral data, along with ground truth measurements, to enhance recognition precision through the utilization of multi-source data. Additionally, the improvement of model algorithms is essential, and a comprehensive selection of influencing factors from various data types is required to ensure more accurate and stable results. The predicted mineralization area shows a high degree of alignment with known mineralization points; however, its accuracy has not yet been validated through field verification. Field investigations will be conducted in future research to validate and improve the reliability and accuracy of the predictions.
7. Conclusions
This study employs remote sensing technology, utilizing ASTER, Sentinel-2, Landsat-8, and GF-2 data as a foundation. By leveraging software platforms such as ArcGIS and ENVI to extract geological anomaly information, and applying methods including RF, NB, and XGBoost models, a comprehensive mineralization prediction method is constructed, which is based on multi-source remote sensing data and machine learning to predict mineralization in the MMOB. The primary conclusions are as follows:
- By integrating multi-source remote sensing data, ore-controlling stratigraphy, linear structures, and alteration anomalies were extracted using PCA, MNF, ICA, SAM, and directional filtering techniques. This approach facilitated stratigraphic subdivision and clarified boundary delineations. High-density areas of linear structures demonstrated a strong spatial correlation with known deposits, indicating that manganese mineralization is influenced by regional tectonics. Additionally, the results indicated that alteration mainly occurs along faults, with iron staining, pyrolusite, and chloritization being especially significant for manganese mineralization.
- The results of the feature factor weighting indicate that the factors of structural density and stratigraphy have the greatest impact on mineralization in the study area, followed by the importance of three factors: Sb3/Sb8, NDRI, and iron staining anomalies.
- The multi-source mineralization information data were input into three models—RF, NB, and XGB—for training, yielding AUC values of 0.975, 0.983, and 0.916, respectively, with all three models demonstrating excellent performance. Using the natural break method to classify mineralization prediction probability levels, the advantages of the three models were integrated, successfully delineating eleven mineralization prospect areas. This confirms the effectiveness of the fusion of multi-source remote sensing information with machine learning methods, thereby providing new insights and directions for mineral exploration in the study area.
Supplementary Materials
The following supporting information can be downloaded at: https://www.mdpi.com/article/10.3390/min15020113/s1.
Author Contributions
Conceptualization, J.Z., L.H., J.G. and Z.H.; methodology, J.Z., L.H., J.G. and Z.H.; software, J.Z. and J.P.; validation, J.Z., L.H. and Z.H.; formal analysis, J.Z.; investigation, J.Z., Z.F. and Y.Y. (Yujun Yan); resources, Z.H.; data curation, J.Z. and Z.F.; writing—original draft preparation, J.Z. and L.H.; writing—review and editing, Z.H., W.Z. and Y.Y. (Yan Yuan); visualization, J.Z., L.H. and Z.H.; supervision, L.H. and Z.H.; project administration, L.H. and Z.H.; funding acquisition, L.H. and Z.H. All authors have read and agreed to the published version of the manuscript.
Funding
This research was supported by the Key Research and Development Program of the Ministry of Science and Technology (The Third Comprehensive Scientific Expedition to Xinjiang) (2022xjkk1301-15).
Data Availability Statement
Data are contained within the article and supplementary materials; further inquiries can be directed to the corresponding author.
Acknowledgments
We are very thankful for all the editors and reviewers who have helped us improve the manuscript.
Conflicts of Interest
Author Jiansheng Gong was employed by the company Zijin Mining Group Southwest Geological Exploration Co., Ltd. The remaining authors declare that the research was conducted in the absence of any commercial or financial relationships that could be construed as a potential conflict of interest.
References
- Luo, H.X.; He, T.; Chen, D.; Xiao, L. Geological Characteristics and Ore Searching Potential of Fengjiawan Manganese Mine, Zunyi, Guizhou, China. China Manganese Ind. 2024, 42, 31–36. [Google Scholar] [CrossRef]
- Cheng, X.; Hu, P.; Zhang, H.K.; Jiang, J.S. The main types, distributionand current development of manganese ore deposits. Geol. China 2021, 48, 102–119. [Google Scholar]
- Cong, Y.; Dong, Q.J.; Xiao, K.Y.; Chen, J.P.; Gao, Y.B.; Yin, J.N. Characteristics and predicted potential of Mn resources in China. Earth Sci. Front. 2018, 25, 118–137. [Google Scholar] [CrossRef]
- Deng, W.B.; Zhang, Y.W.; Kong, L.H.; Shang, L. Current status of manganese ore resources in China and selecting for national physical geological data of manganese ore deposits. China Min. 2019, 28, 175–182. [Google Scholar]
- Luo, H.B. The direction of prospecting for high quality manganese ore resources in China. Geol. Prospect. 2002, 38, 8–11. [Google Scholar]
- Yan, W.Z.; Liu, S.W.; Yang, L.Y.; Cao, Y.C.; An, D.J.; Huang, G.Y. Current Status and Technological Advances in Development and Utilizationof Manganese Resources. China Manganese Ind. 2024, 42, 16–21+26. [Google Scholar] [CrossRef]
- Gao, Y.; Bagas, L.; Liu, Y.; Li, W.; Hattori, K.; Papineau, D.; Jing, D.; Chen, D.; Teng, J.; He, Y.; et al. Discovery of Late Carboniferous High-Grade Carbonate-Hosted Manganese Mineralization in the Maerkansu Area of the Western Kunlun Orogen, Northwest China. Gondwana Res. 2024, 133, 129–147. [Google Scholar] [CrossRef]
- Ren, H.; Liu, M.; Wang, Z.G.; Wu, H.; Mao, J.W. Security of Manganese Resources and Industrial Chain in China. Strateg. Study CAE 2022, 24, 20–28. [Google Scholar] [CrossRef]
- Xu, S.Q.; Feng, J.; Feng, C.R.; Zhang, L.C.; Zhang, B.L. Geological Characteristics and Mineral Resource Potential Assessment of Manganese Deposits Belt of Maerkansu-Muhu in Western Kunlun. Xinjiang Geol. 2018, 36, 68–73. [Google Scholar]
- Zhang, B.L.; Zhang, L.C.; Feng, J.; Xu, S.Q.; Feng, C.R.; Hao, Y.H.; Zheng, M.T.; Peng, Z.D.; Dong, Z.G. Genesis of The Large-scale Orto Karnash Manganese Carbonate Deposit in the Malkansu District, Western Kunlun: Evidence from Geological Features. Geol. Rev. 2018, 64, 361–377. [Google Scholar] [CrossRef]
- Gao, Y.B.; Teng, J.X.; Li, W.Y.; Chen, D.H.; Sui, Q.L.; Jing, D.L.; He, Y.K.; Bai, J.K. Geology, geochemistry and ore genesis of the Aoertuokanashi manganese deposit, western Kunlun, Xinjiang, Northwest China. Acta Petrol. Sin. 2018, 34, 2341–2358. [Google Scholar]
- Gao, Y.B.; Teng, J.X.; Chen, D.H.; Sui, Q.L. Metallogenic Geological Characteristics and Prospecting Direction of Maerkansu Manganese Ore Belt in West Kunlun, Xinjiang. Northwestern Geol. 2017, 50, 261–269. [Google Scholar] [CrossRef]
- Zha, B.; Xie, Z.M. Discovery and Significance of Aoertuokanashi-muhu Rich-Manganese Ore Belt in Xinjiang. Xinjiang Geol. 2018, 36, 102–105. [Google Scholar]
- Zha, B.; Zhang, L.C.; Zhang, B.L.; Dong, Z.G.; Wang, B.; Xie, Z.M. Geology Characteristic and Metallogenic Conditions of the Manganese Ore Belt in Maerkansu, Aketao, Xinjiang. Xinjiang Geol. 2019, 37, 75–84. [Google Scholar]
- Zhang, B.L.; Zhang, L.C.; Dong, Z.G.; Peng, Z.D.; Zhu, M.T.; Wang, C.L. Metallogenic regularity of Paleozoic sedimentary iron-manganese deposits in the northern segment of West Kunlun and its relationship with the evolution of the Proto-Paleo-Tethys Ocean. Geol. Sci. 2022, 57, 1047–1063. [Google Scholar]
- Zhang, L.C.; Zhang, B.L.; Dong, Z.G.; Xie, Y.Q.; Li, W.J.; Peng, Z.D.; Zhu, M.T.; Wang, C.L. Tectonic Setting and Metallogenetic Conditions of Carboniferous Malkansu Giant Manganese Belt in West Kunlun Orogen. J. Jilin Univ. Earth Sci. Ed. 2020, 50, 1340–1357. [Google Scholar] [CrossRef]
- Chen, D.H.; Sui, Q.L.; Guo, Z.P.; Zhao, X.J.; Teng, J.X.; Gao, Y.B. Sedimentary Environment of Mn-bearing Carbonate from the Muhu Manganese Deposit in Malkansu, West Kunlun: Evidences from Fusulinids and C-0-Sr lsotopes. Northwestern Geol. 2022, 55, 1–13. [Google Scholar] [CrossRef]
- Zhang, L.C.; Dong, Z.G.; Zhang, B.L.; Li, W.J.; Peng, Z.D.; Wang, C.L.; Zhu, M.T. Controlling factors and “Malkansu style” metallogenetic model of high grade manganese ore in West Kunlun orogen. Acta Geol. Sin. 2022, 96, 3195–3210. [Google Scholar] [CrossRef]
- Dong, Z.G.; Zhang, L.C.; Dong, F.Y.; Zhang, B.L.; Xie, Y.Q.; Zha, B.; Peng, Z.D.; Wang, C.L. Geological Characteristics, Ore-Controlling Factors and Metallogenic Model of Muhu Manganese Deposit in West Kunlun, China. J. Jilin Univ. Earth Sci. Ed. 2020, 50, 1358–1372. [Google Scholar] [CrossRef]
- Lu, Y.; Jiang, S.; Lu, Y.; Xu, S.; Shu, Y.; Wang, Y. Productivity or Preservation? The Factors Controlling the Organic Matter Accumulation in the Late Katian through Hirnantian Wufeng Organic-Rich Shale, South China. Mar. Pet. Geol. 2019, 109, 22–35. [Google Scholar] [CrossRef]
- Li, W.-J.; Peng, Z.-D.; Dong, Z.-G.; Zhang, B.-L.; Gao, B.-Y.; Zhang, L.-C.; Zhu, M.-T.; Robbins, L.J.; Konhauser, K.O. Direct Re-Os dating of manganese carbonate ores and implications for the formation of the ortokarnash manganese deposit, northwest China. Econ. Geol. 2022, 117, 237–252. [Google Scholar] [CrossRef]
- Chen, D.H.; Sui, Q.L.; Zhao, X.J.; Jing, D.L.; Teng, J.X.; Gao, Y.B. Geology, Geochemical Characteristics, and Sedimentary Environment of Mn-bearing Carbonate from the Late Carboniferous Muhu Manganese Deposit in West Kunlun. Acta Sedimentol. Sin. 2019, 37, 477–490. [Google Scholar] [CrossRef]
- Zhang, Z.; Zuo, R.; Xiong, Y. A Comparative Study of Fuzzy Weights of Evidence and Random Forests for Mapping Mineral Prospectivity for Skarn-Type Fe Deposits in the Southwestern Fujian Metallogenic Belt, China. Sci. China Earth Sci. 2016, 59, 556–572. [Google Scholar] [CrossRef]
- Yin, J.; Li, N. Ensemble Learning Models with a Bayesian Optimization Algorithm for Mineral Prospectivity Mapping. Ore Geol. Rev. 2022, 145, 104916. [Google Scholar] [CrossRef]
- Sun, T.; Chen, F.; Zhong, L.; Liu, W.; Wang, Y. GIS-Based Mineral Prospectivity Mapping Using Machine Learning Methods: A Case Study from Tongling Ore District, Eastern China. Ore Geol. Rev. 2019, 109, 26–49. [Google Scholar] [CrossRef]
- Sun, X.; Deng, J.; Gong, Q.; Wang, Q.; Yang, L.; Zhao, Z. Kohonen Neural Network and Factor Analysis Based Approach to Geochemical Data Pattern Recognition. J. Geochem. Explor. 2009, 103, 6–16. [Google Scholar] [CrossRef]
- Prado, E.M.G.; De Souza Filho, C.R.; Carranza, E.J.M.; Motta, J.G. Modeling of Cu-Au Prospectivity in the Carajás Mineral Province (Brazil) through Machine Learning: Dealing with Imbalanced Training Data. Ore Geol. Rev. 2020, 124, 103611. [Google Scholar] [CrossRef]
- Zhao, Z.; Chen, J.; Cheng, B.; Liu, Y.; Qiao, K.; Cui, X.; Yin, Y.; Li, C. Spatial Analysis of Structure and Metal Mineralization Based on Fractal Theory and Fry Analysis: A Case Study in Nenjiang−Heihe Metallogenic Belt. Minerals 2023, 13, 313. [Google Scholar] [CrossRef]
- Liu, D.C.; Ye, F.W.; Zhao, Y.J.; Yang, X.; Yi, P.Y.; Dong, X.Z. Comprehensive Study and Deepened Application of Remote Sensing Information:A Case Study of Uranium Exploration. Remote Sens. Nat. Resour. 2011, 90, 14–19. [Google Scholar]
- Wang, R.S.; Xiong, S.Q.; Nie, H.F.; Liang, S.N.; Qi, Z.R.; Yang, J.Z.; Yan, B.K.; Zhao, F.Y.; Fan, J.H.; Tong, L.Q.; et al. Remote sensing geological exploration technology and application research. Acta Geol. Sin. 2011, 85, 1699–1743. [Google Scholar]
- AlKashghari, W.A.; Matsah, M.; Baggazi, H.M.; EL-Sawy, E.-S.K.; Elfakharani, A.; El-Shafei, M.K. Detection of Alteration Zones Using ASTER Imagery and Geological Field Observations: Al Wajh Area, Northwestern Arabian Shield, Saudi Arabia. Arab. J. Geosci. 2020, 13, 763. [Google Scholar] [CrossRef]
- Fan, Y.-H.; Wang, H. Application of Remote Sensing to Identify Copper–Lead–Zinc Deposits in the Heiqia Area of the West Kunlun Mountains, Chinas. Sci. Rep. 2020, 10, 12309. [Google Scholar] [CrossRef]
- Esmaeili, S.; Tangestani, M.H.; Tayebi, M.H. Sub-Pixel Mapping of Copper- and Iron-Bearing Metamorphic Rocks Using ASTER Data: A Case Study of Toutak and Surian Complexes, NE Shiraz, Iran. Nat. Resour. Res. 2020, 29, 2933–2948. [Google Scholar] [CrossRef]
- Takodjou Wambo, J.D.; Pour, A.B.; Ganno, S.; Asimow, P.D.; Zoheir, B.; Salles, R.D.R.; Nzenti, J.P.; Pradhan, B.; Muslim, A.M. Identifying High Potential Zones of Gold Mineralization in a Sub-Tropical Region Using Landsat-8 and ASTER Remote Sensing Data: A Case Study of the Ngoura-Colomines Goldfield, Eastern Cameroon. Ore Geol. Rev. 2020, 122, 103530. [Google Scholar] [CrossRef]
- He, L.; Lyu, P.; He, Z.; Zhou, J.; Hui, B.; Ye, Y.; Hu, H.; Zeng, Y.; Xu, L. Identification of Radioactive Mineralized Lithology and Mineral Prospectivity Mapping Based on Remote Sensing in High-Latitude Regions: A Case Study on the Narsaq Region of Greenland. Minerals 2022, 12, 692. [Google Scholar] [CrossRef]
- Lyu, P.; He, L.; He, Z.; Liu, Y.; Deng, H.; Qu, R.; Wang, J.; Zhao, Y.; Wei, Y. Research on Remote Sensing Prospecting Technology Based on Multi-Source Data Fusion in Deep-Cutting Areas. Ore Geol. Rev. 2021, 138, 104359. [Google Scholar] [CrossRef]
- Chen, H.Y.; Zhang, S.T.; Chu, G.B.; Zhang, Y.; Cheng, J.M.; Tian, J.; Han, J.S. The short wave infrared (SWlR) spectral characteristics of alteration minerals and applications for ore exploration in the typical skarn-porphyry deposits, Edong ore district, eastern China. Acta Petrol. Sin. 2019, 35, 3629–3643. [Google Scholar]
- Huang, J.H.; Chen, H.Y.; Han, J.S.; Lu, W.J.; Zhang, W.F. Spacial and temporal characteristics of mineralization and alteration zonation of the Honghai VMS Cu-Zn deposit in the Kalatag District, EastTianshan, NW China. Geochimica. 2016, 45, 582–600. [Google Scholar] [CrossRef]
- Wang, W.; Zhao, J.; Cheng, Q.; Carranza, E.J.M. GIS-Based Mineral Potential Modeling by Advanced Spatial Analytical Methods in the Southeastern Yunnan Mineral District, China. Ore Geol. Rev. 2015, 71, 735–748. [Google Scholar] [CrossRef]
- Chen, Y.; Wu, W. Mapping Mineral Prospectivity Using an Extreme Learning Machine Regression. Ore Geol. Rev. 2017, 80, 200–213. [Google Scholar] [CrossRef]
- Esmaeiloghli, S.; Tabatabaei, S.H.; Carranza, E.J.M. Spatio-Geologically Informed Fuzzy Classification: An Innovative Method for Recognition of Mineralization-Related Patterns by Integration of Elemental, 3D Spatial, and Geological Information. Nat. Resour. Res. 2021, 30, 989–1010. [Google Scholar] [CrossRef]
- Xiao, K.Y.; Sun, L.; Li, N.; Wang, K.; Fan, J.F.; Ding, J.H. Mineral resources assessment under the thought of big data. Geol. Bull. China 2015, 34, 1266–1272. [Google Scholar]
- Qin, Y.; Wen, G.G.; Li, D.P. The discovery and significance of high-quality manganese-rich ore in Aketao area of West Kunlun, Xinjiang. West-China Explor. Eng. 2014, 26, 112–115. [Google Scholar]
- Wang, A.T.; Gao, Y.B.; Sun, J.G.; Chen, D.H.; Guo, Z.P.; Wang, Z.F.; Qian, J.L. Metallogenic prediction of manganese deposits with weighting of evidence based on MRAS in Maerkansu area, West Kunlun. Miner. Explor. 2024, 15, 428–434. [Google Scholar] [CrossRef]
- Zhang, B.-L.; Lv, Z.-C.; Dong, Z.-G.; Zhang, X.; Yu, X.-F.; Li, Y.-S.; Zhen, S.-M.; Wang, C.-L. Source Characteristics of the Carboniferous Ortokarnash Manganese Deposit in the Western Kunlun Mountains. Minerals 2022, 12, 786. [Google Scholar] [CrossRef]
- Li, X.Q.; Ni, B.; Peng, X. Analysis and Comparison of Extracting Manganese Mineralization Information from OLl and GF-2 Data:An Example of the Malkansu Manganese Mine in West Kunlun, Xinjiang. Geol. Prospect. 2020, 56, 1040–1049. [Google Scholar]
- Irons, J.R.; Dwyer, J.L.; Barsi, J.A. The next Landsat Satellite: The Landsat Data Continuity Mission. Remote Sens. Environ. 2012, 122, 11–21. [Google Scholar] [CrossRef]
- Pei, Q.M.; Sehn, J.L.; Wang, S.M.; Fang, D.R.; Gao, Y.Z.; Li, D.; Ma, S.B. Exploring Luorite Veins Using Multi-source Remote Sensing Astellite Data:A Case Study from the Shuitou Fluorite Deposit in Inner Mongolia, China. Northwestern Geol. 2024, 57, 121–134. [Google Scholar]
- Mami Khalifani, F.; Bahroudi, A.; Aliyari, F.; Abedi, M.; Yousefi, M.; Mohammadpour, M. Generation of an Efficient Structural Evidence Layer for Mineral Exploration Targeting. J. Afr. Earth Sci. 2019, 160, 103609. [Google Scholar] [CrossRef]
- Pour, A.B.; Hashim, M. The Application of ASTER Remote Sensing Data to Porphyry Copper and Epithermal Gold Deposits. Ore Geol. Rev. 2012, 44, 1–9. [Google Scholar] [CrossRef]
- Chang, C.-I. New Hyperspectral Discrimination Measure for Spectral Characterization. Opt. Eng. 2004, 43, 1777. [Google Scholar] [CrossRef]
- Keshava, N. Distance Metrics and Band Selection in Hyperspectral Processing with Applications to Material Identification and Spectral Libraries. IEEE Trans. Geosci. Remote Sens. 2004, 42, 1552–1565. [Google Scholar] [CrossRef]
- Wang, D.; Chen, J.; Dai, X. Extracting Geological and Alteration Information and Predicting Antimony Ore Based on Multisource Remote Sensing Data in Huangyangling, Xinjiang. Front. Earth Sci. 2024, 12, 1366727. [Google Scholar] [CrossRef]
- Han, S.L.; Xiao, J.; Liu, W. Review on the of Machine Learning Method and Application in the Geophysical Exploration of Uranium Deposit. Uranium Geol. 2024, 40, 555–564. [Google Scholar]
- Breiman, L. Random Forests. Mach. Learn. 2001, 45, 5–32. [Google Scholar] [CrossRef]
- Li, M.; Li, L.; Lai, Y.; He, L.; He, Z.; Wang, Z. Geological Hazard Susceptibility Analysis Based on RF, SVM, and NB Models, Using the Puge Section of the Zemu River Valley as an Example. Sustainability 2023, 15, 11228. [Google Scholar] [CrossRef]
- Li, S.H.; Zhang, J. Review of Bayesian networks structure learnind. Appl. Res. Comput. 2015, 32, 641–646. [Google Scholar]
- Chen, T.; Guestrin, C. XGBoost: A Scalable Tree Boosting System. In Proceedings of the 22nd ACM SIGKDD International Conference on Knowledge Discovery and Data Mining, San Francisco, CA, USA, 13 August 2016; pp. 785–794. [Google Scholar]
- Dietterich, T.G. An Experimental Comparison of Three Methods for Constructing Ensembles of Decision Trees: Bagging, Boosting, and Randomization. Mach. Learn. 2000, 40, 139–157. [Google Scholar] [CrossRef]
- Yan, H.B.; Liang, Y.H.; Lu, X.J.; Wang, J.H.; Wu, S.Y. Remote Sensing Modeling and Applications in Drought Monitoring Based on XGBoost and Fusion of Multi-dimensional Spatiotemporal Data. J. Geo-Inf. Sci. 2024, 26, 1531–1546. [Google Scholar]
- Omar, L.; Ivrissimtzis, I. Using Theoretical ROC Curves for Analysing Machine Learning Binary Classifiers. Pattern Recognit. Lett. 2019, 128, 447–451. [Google Scholar] [CrossRef]
- Chen, J.; Zhao, Z.; Yang, Y.; Li, C.; Yin, Y.; Zhao, X.; Zhao, N.; Tian, J.; Li, H. Metallogenic Prediction Based on Fractal Theory and Machine Learning in Duobaoshan Area, Heilongjiang Province. Ore Geol. Rev. 2024, 168, 106030. [Google Scholar] [CrossRef]
- Fawcett, T. An Introduction to ROC Analysis. Pattern Recognit. Lett. 2006, 27, 861–874. [Google Scholar] [CrossRef]
- Feng, X.L.; Wang, m.j.; Wen, C.M.; Zhang, H.H. The preliminary study of the exploration potential of the Liwu copper deposit and its surrounding areas, western Sichuan. Sediment. Geol. Tethyan Geol. 2007, 27, 9–13. [Google Scholar]
- Zang, Z.J. Study on Metallogenic Regularity and Prediction of Late Paleozoic Sedimentary Manganese Deposits near the Junction of West Kunlun Tectonic Belt and Southwest Tianshan Tectonic Belt. Ph.D. Thesis, China University of Geosciences, Wuhan, China, 2021. [Google Scholar]
- Kuleshov, V.N. Manganese Deposits: Communication 2. Major Epochs and Phases of Manganese Accumulation in the Earth’s History. Lithol. Miner. Resour. 2011, 46, 546–565. [Google Scholar] [CrossRef]
- Dong, Y.; Sun, S.; Santosh, M.; Hui, B.; Sun, J.; Zhang, F.; Cheng, B.; Yang, Z.; Shi, X.; He, D.; et al. Cross Orogenic Belts in Central China: Implications for the Tectonic and Paleogeographic Evolution of the East Asian Continental Collage. Gondwana Res. 2022, 109, 18–88. [Google Scholar] [CrossRef]
- Schier, K.; Bau, M.; Smith, A.J.B.; Beukes, N.J.; Coetzee, L.L.; Viehmann, S. Chemical Evolution of Seawater in the Transvaal Ocean between 2426 Ma (Ongeluk Large Igneous Province) and 2413 Ma Ago (Kalahari Manganese Field). Gondwana Res. 2020, 88, 373–388. [Google Scholar] [CrossRef]
- Mao, X.C.; Zeng, W.B.; Zhou, S.G.; Yan, F.; Deng, J.Q.; Zhang, B.Y. Research on Relationship between Digital Terrain Characteristics and Spatial Distribution of Secondary Enrichment Manganese Ore in Western Guangxi and South-eastern Yunan, SW China. Geol. Prospect. 2009, 45, 292–298. [Google Scholar]
- Li, X.N.; Liu, X.J.; Jia, Z.Q. DEM Geomorphological Features and Topographical Factor Analysis of lon Adsorption Rare Earth Deposits in South China. South China Geol. 2023, 39, 376–386. [Google Scholar]
- Liu, X.S.; Chen, Y.C.; Wang, D.H.; Huang, F.; Zhao, Z. The Metallogenic Geomorphic Condition Analysis of the lon-absorbing Type Rare Earths Ore in the Eastern Nanling Region Based on DEM Data. Acta Geosci. Sin. 2016, 37, 174–184. [Google Scholar]
- Xi, H.P.; Wang, S.J.; Bai, X.Y.; Tang, H.; Wu, L.H.; Chen, F.; Xiao, J.Y.; Wang, M.M.; Li, H.W.; Cao, Y.; et al. Spatio-temporal characteristics of rocky desertification in typical Karst areas of Southwest China: A case study of Puding County, Guizhou Province. Acta Ecol. Sin. 2018, 38, 8919–8933. [Google Scholar] [CrossRef]
- Wang, R.D.; Xing, L.X. The Alteration Information Extraction by Remote Sensing. Global Geol. 2000, 19, 397–401. [Google Scholar]
- Crósta, A.P.; De Souza Filho, C.R.; Azevedo, F.; Brodie, C. Targeting Key Alteration Minerals in Epithermal Deposits in Patagonia, Argentina, Using ASTER Imagery and Principal Component Analysis. Int. J. Remote Sens. 2003, 24, 4233–4240. [Google Scholar] [CrossRef]
- Loughlin, W.P. Principal Component Analysis for Alteration Mapping. Photogramm. Eng. 1991, 57, 1163–1169. [Google Scholar]
- Carranza, E.J.M.; Laborte, A.G. Random Forest Predictive Modeling of Mineral Prospectivity with Small Number of Prospects and Data with Missing Values in Abra (Philippines). Comput. Geosci. 2015, 74, 60–70. [Google Scholar] [CrossRef]
- Zuo, R.; Xiong, Y. Big Data Analytics of Identifying Geochemical Anomalies Supported by Machine Learning Methods. Nat. Resour. Res. 2018, 27, 5–13. [Google Scholar] [CrossRef]
- Wu, G.P. Mapping Mineral Prospectivity for Molybdenum Polymetallic Mineralization by Machine Learning Methods in Jining, Inner Mongolia, China. Ph.D. Thesis, China University of Geosciences, Beijing, China, 2021. [Google Scholar]
- Qin, Y.Z.; Wu, W.C.; Xie, L.F.; Ou, P.H.; Huang, X.L. Application of Machine Learning Based Mineral Prospectivity Mapping in the Yuexi Antimony Orefield, Hunan Province. J. East China Inst. Technol. Nat. Sci. 2021, 44, 28–40. [Google Scholar]
- Zhang, Z.J.; Cheng, Q.M.; Yang, J.; Wu, G.P.; Ge, Y.Z. Machine learning for mineral prospectivity:A case study of iron-polymetallic mineral prospectivity in southwestern Fujian. Earth Sci. Front. 2021, 28, 221–235. [Google Scholar] [CrossRef]
- Xia, Q.L.; Zhao, M.Y.; Wang, X.C.; Leng, S.; Li, T.F.; Xiong, S.C. Quantitative prediction of molybdenum-copper polymetallic mineral resources in the Xindalai grassland-covered area of Inner Mongolia based on geological anomalies. Earth Sci. Front. 2021, 28, 56–66. [Google Scholar] [CrossRef]
- Nykänen, V.; Törmänen, T.; Niiranen, T. Cobalt Prospectivity Using a Conceptual Fuzzy Logic Overlay Method Enhanced with the Mineral Systems Approach. Nat. Resour. Res. 2023, 32, 2387–2416. [Google Scholar] [CrossRef]
- Nykänen, V.; Niiranen, T.; Molnár, F.; Lahti, I.; Korhonen, K.; Cook, N.; Skyttä, P. Optimizing a Knowledge-Driven Prospectivity Model for Gold Deposits Within Peräpohja Belt, Northern Finland. Nat. Resour. Res. 2017, 26, 571–584. [Google Scholar] [CrossRef]
- Khammar, F.; Nykänen, V.; Beier, C.; Niiranen, T. Translating Mineral Systems Criteria into a Prospectivity Model for IOCG Deposits in the Kolari Region, Finland. Ore Geol. Rev. 2024, 174, 106326. [Google Scholar] [CrossRef]
- Zhang, X.; Zhao, Z.; Chen, Q.; Chai, W.; Li, Z.; Zhang, G.; Yang, H.; Niu, L. Mapping Hydrothermal Alteration of the Pulang Porphyry Copper Deposit, SW China, Using ASTER and ZY1-02D Satellite Data. Ore Geol. Rev. 2023, 161, 105605. [Google Scholar] [CrossRef]
- Mujabar, P.S.; Dajkumar, S. Mapping of Bauxite Mineral Deposits in the Northern Region of Saudi Arabia by Using Advanced Spaceborne Thermal Emission and Reflection Radiometer Satellite Data. Geo-Spat. Inf. Sci. 2019, 22, 35–44. [Google Scholar] [CrossRef]
- Sun, Y.; Tian, S.; Di, B. Extracting Mineral Alteration Information Using WorldView-3 Data. Geosci. Front. 2017, 8, 1051–1062. [Google Scholar] [CrossRef]
- Zhang, H.; Xie, M.; Dan, S.; Li, M.; Li, Y.; Yang, D.; Wang, Y. Optimization of Feature Selection in Mineral Prospectivity Using Ensemble Learning. Minerals 2024, 14, 970. [Google Scholar] [CrossRef]
- Rodriguez-Galiano, V.; Sanchez-Castillo, M.; Chica-Olmo, M.; Chica-Rivas, M. Machine Learning Predictive Models for Mineral Prospectivity: An Evaluation of Neural Networks, Random Forest, Regression Trees and Support Vector Machines. Ore Geol. Rev. 2015, 71, 804–818. [Google Scholar] [CrossRef]
- Xie, Y.Q.; Zhang, Y.; Jin, C.; Li, K.; Li, Y.F.; Duan, B.; Huang, J.B. Application of remote sensing technology in manganese prospecting in Maerkansu area of southwest Tianshan Mountains. Xinjiang Youse Jinshu 2018, 41, 24–27. [Google Scholar] [CrossRef]
- Carranza, E.J.M.; Sadeghi, M. Predictive Mapping of Prospectivity and Quantitative Estimation of Undiscovered VMS Deposits in Skellefte District (Sweden). Ore Geol. Rev. 2010, 38, 219–241. [Google Scholar] [CrossRef]
- Hu, D.Q.; He, F.B.; Li, H.; Hao, Y.H.; Zhang, Q.; Feng, C.R.; Liao, F.Y. Gold Mine in Muji Area of Xinjiang Based on Random Forest Algorithm Regional Metallogenic Prediction. Xinjiang Geol. 2024, 42, 158–163. [Google Scholar]
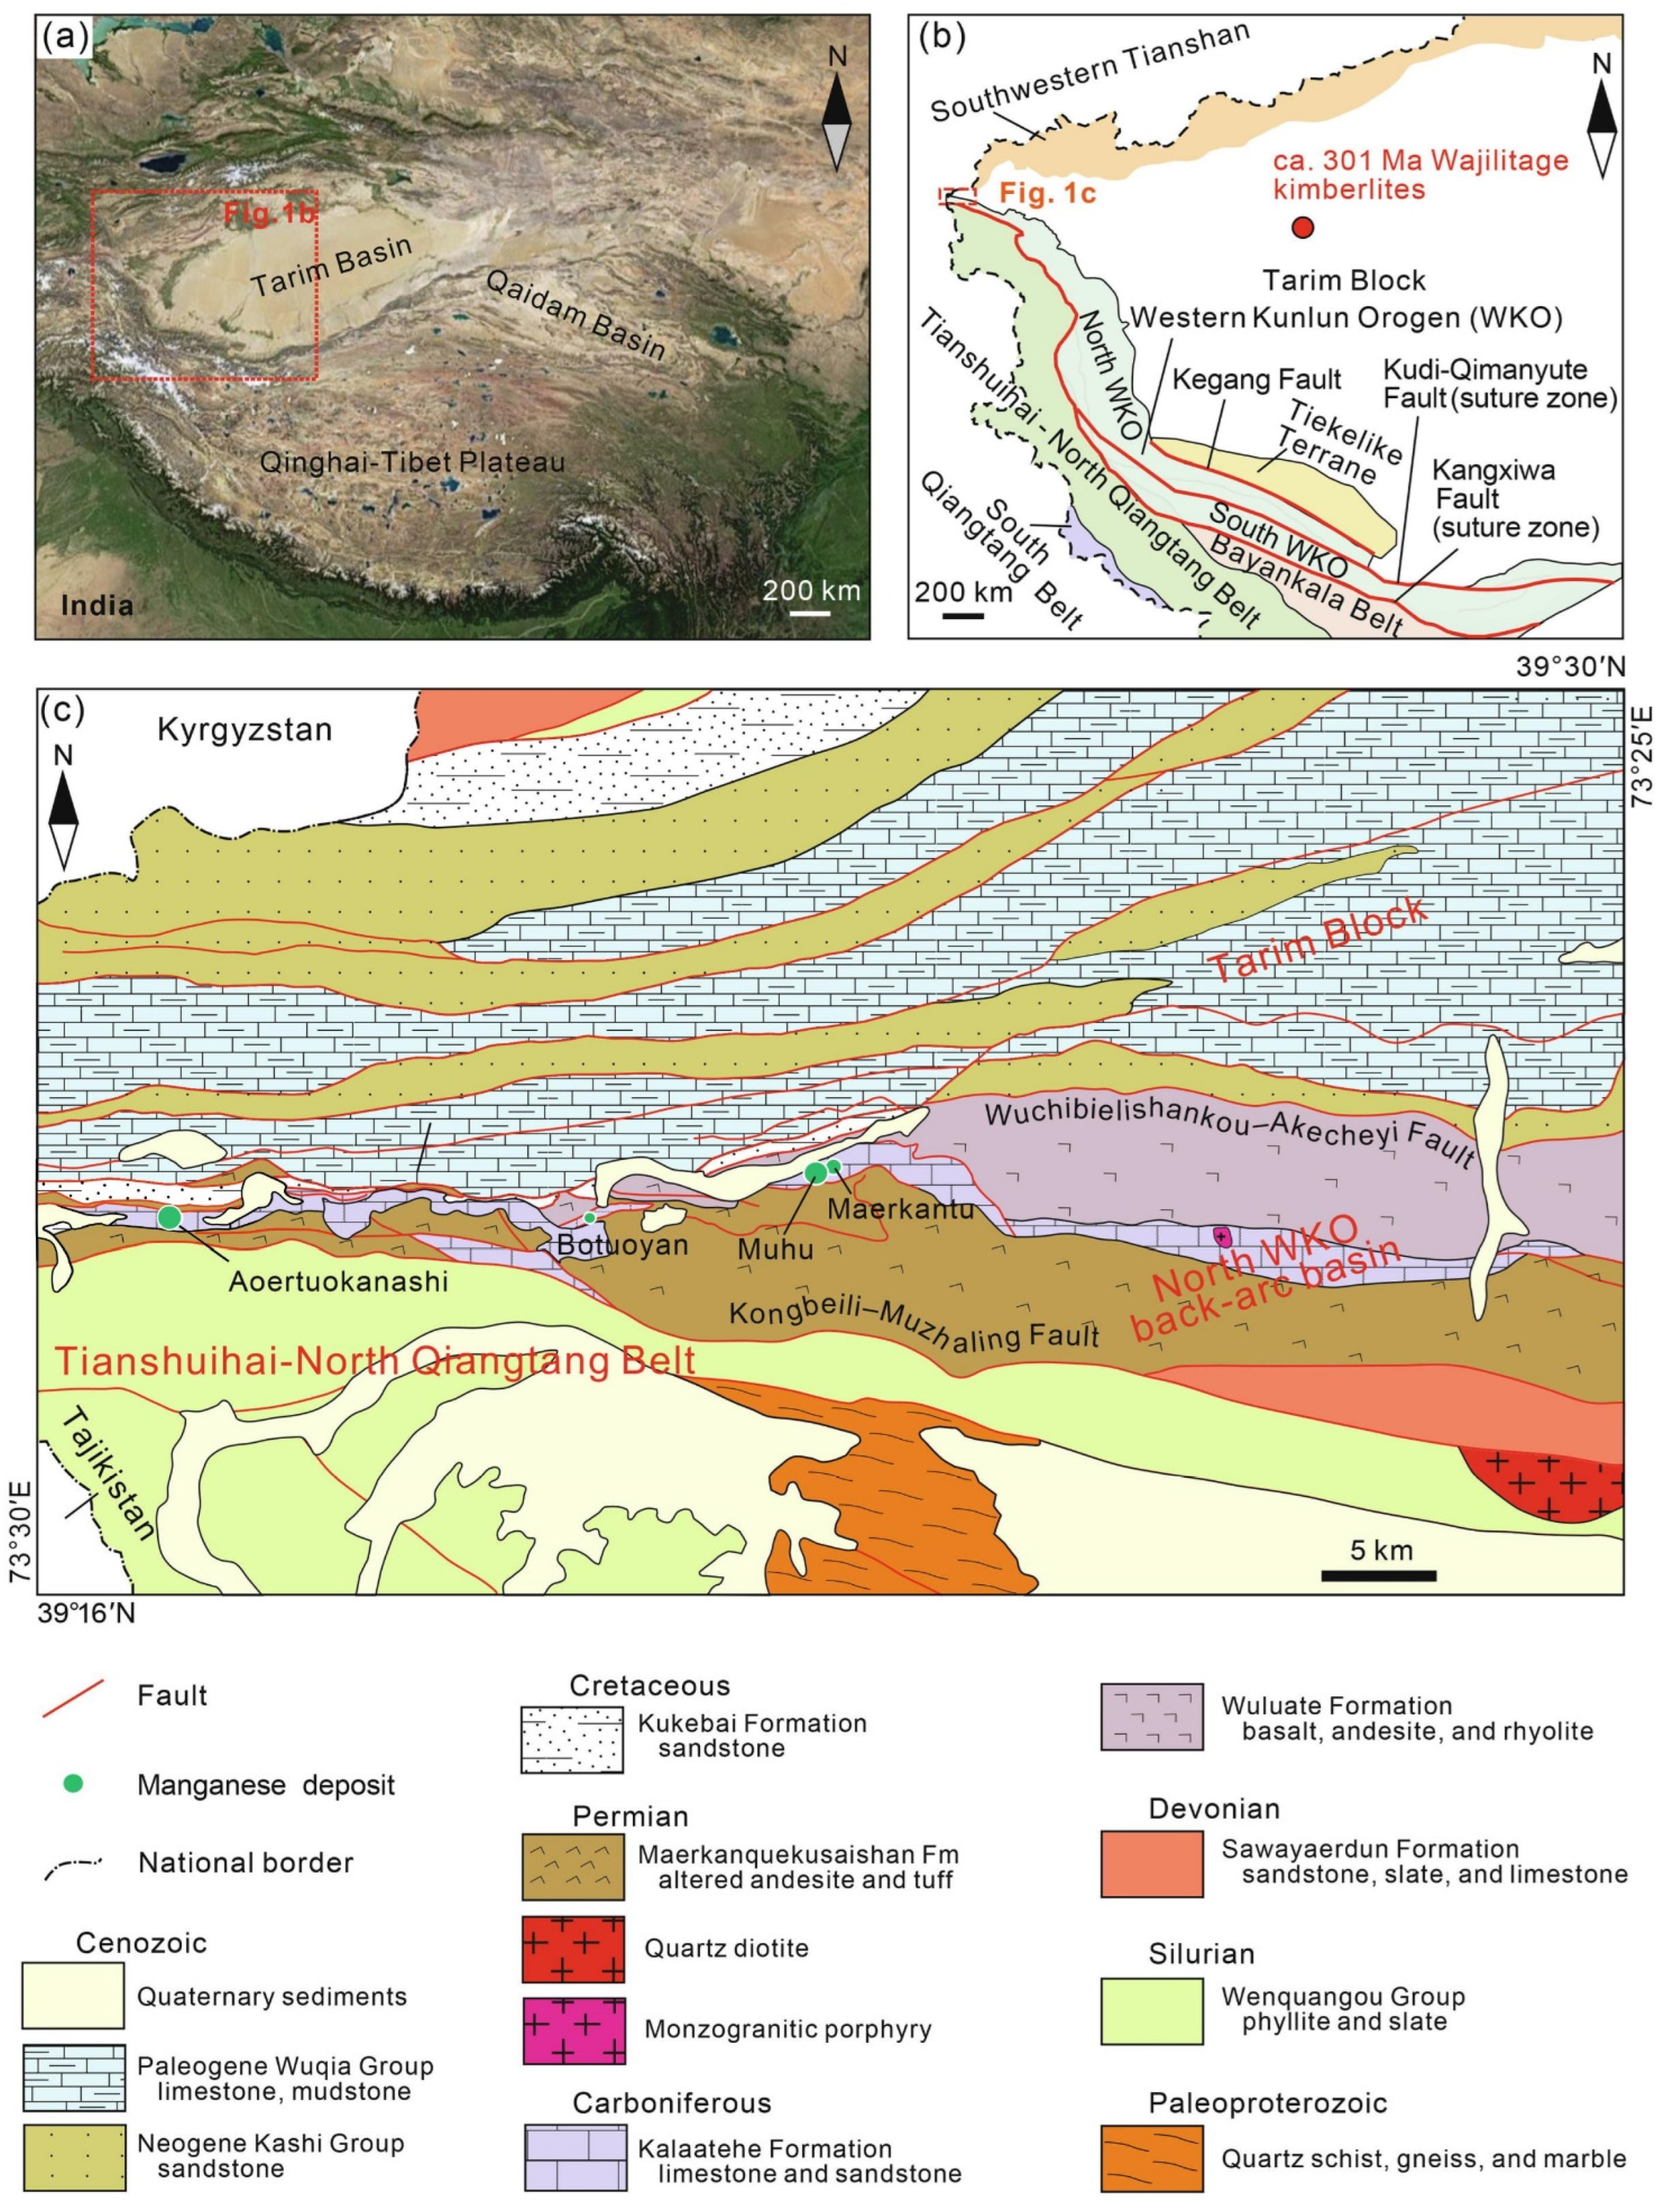
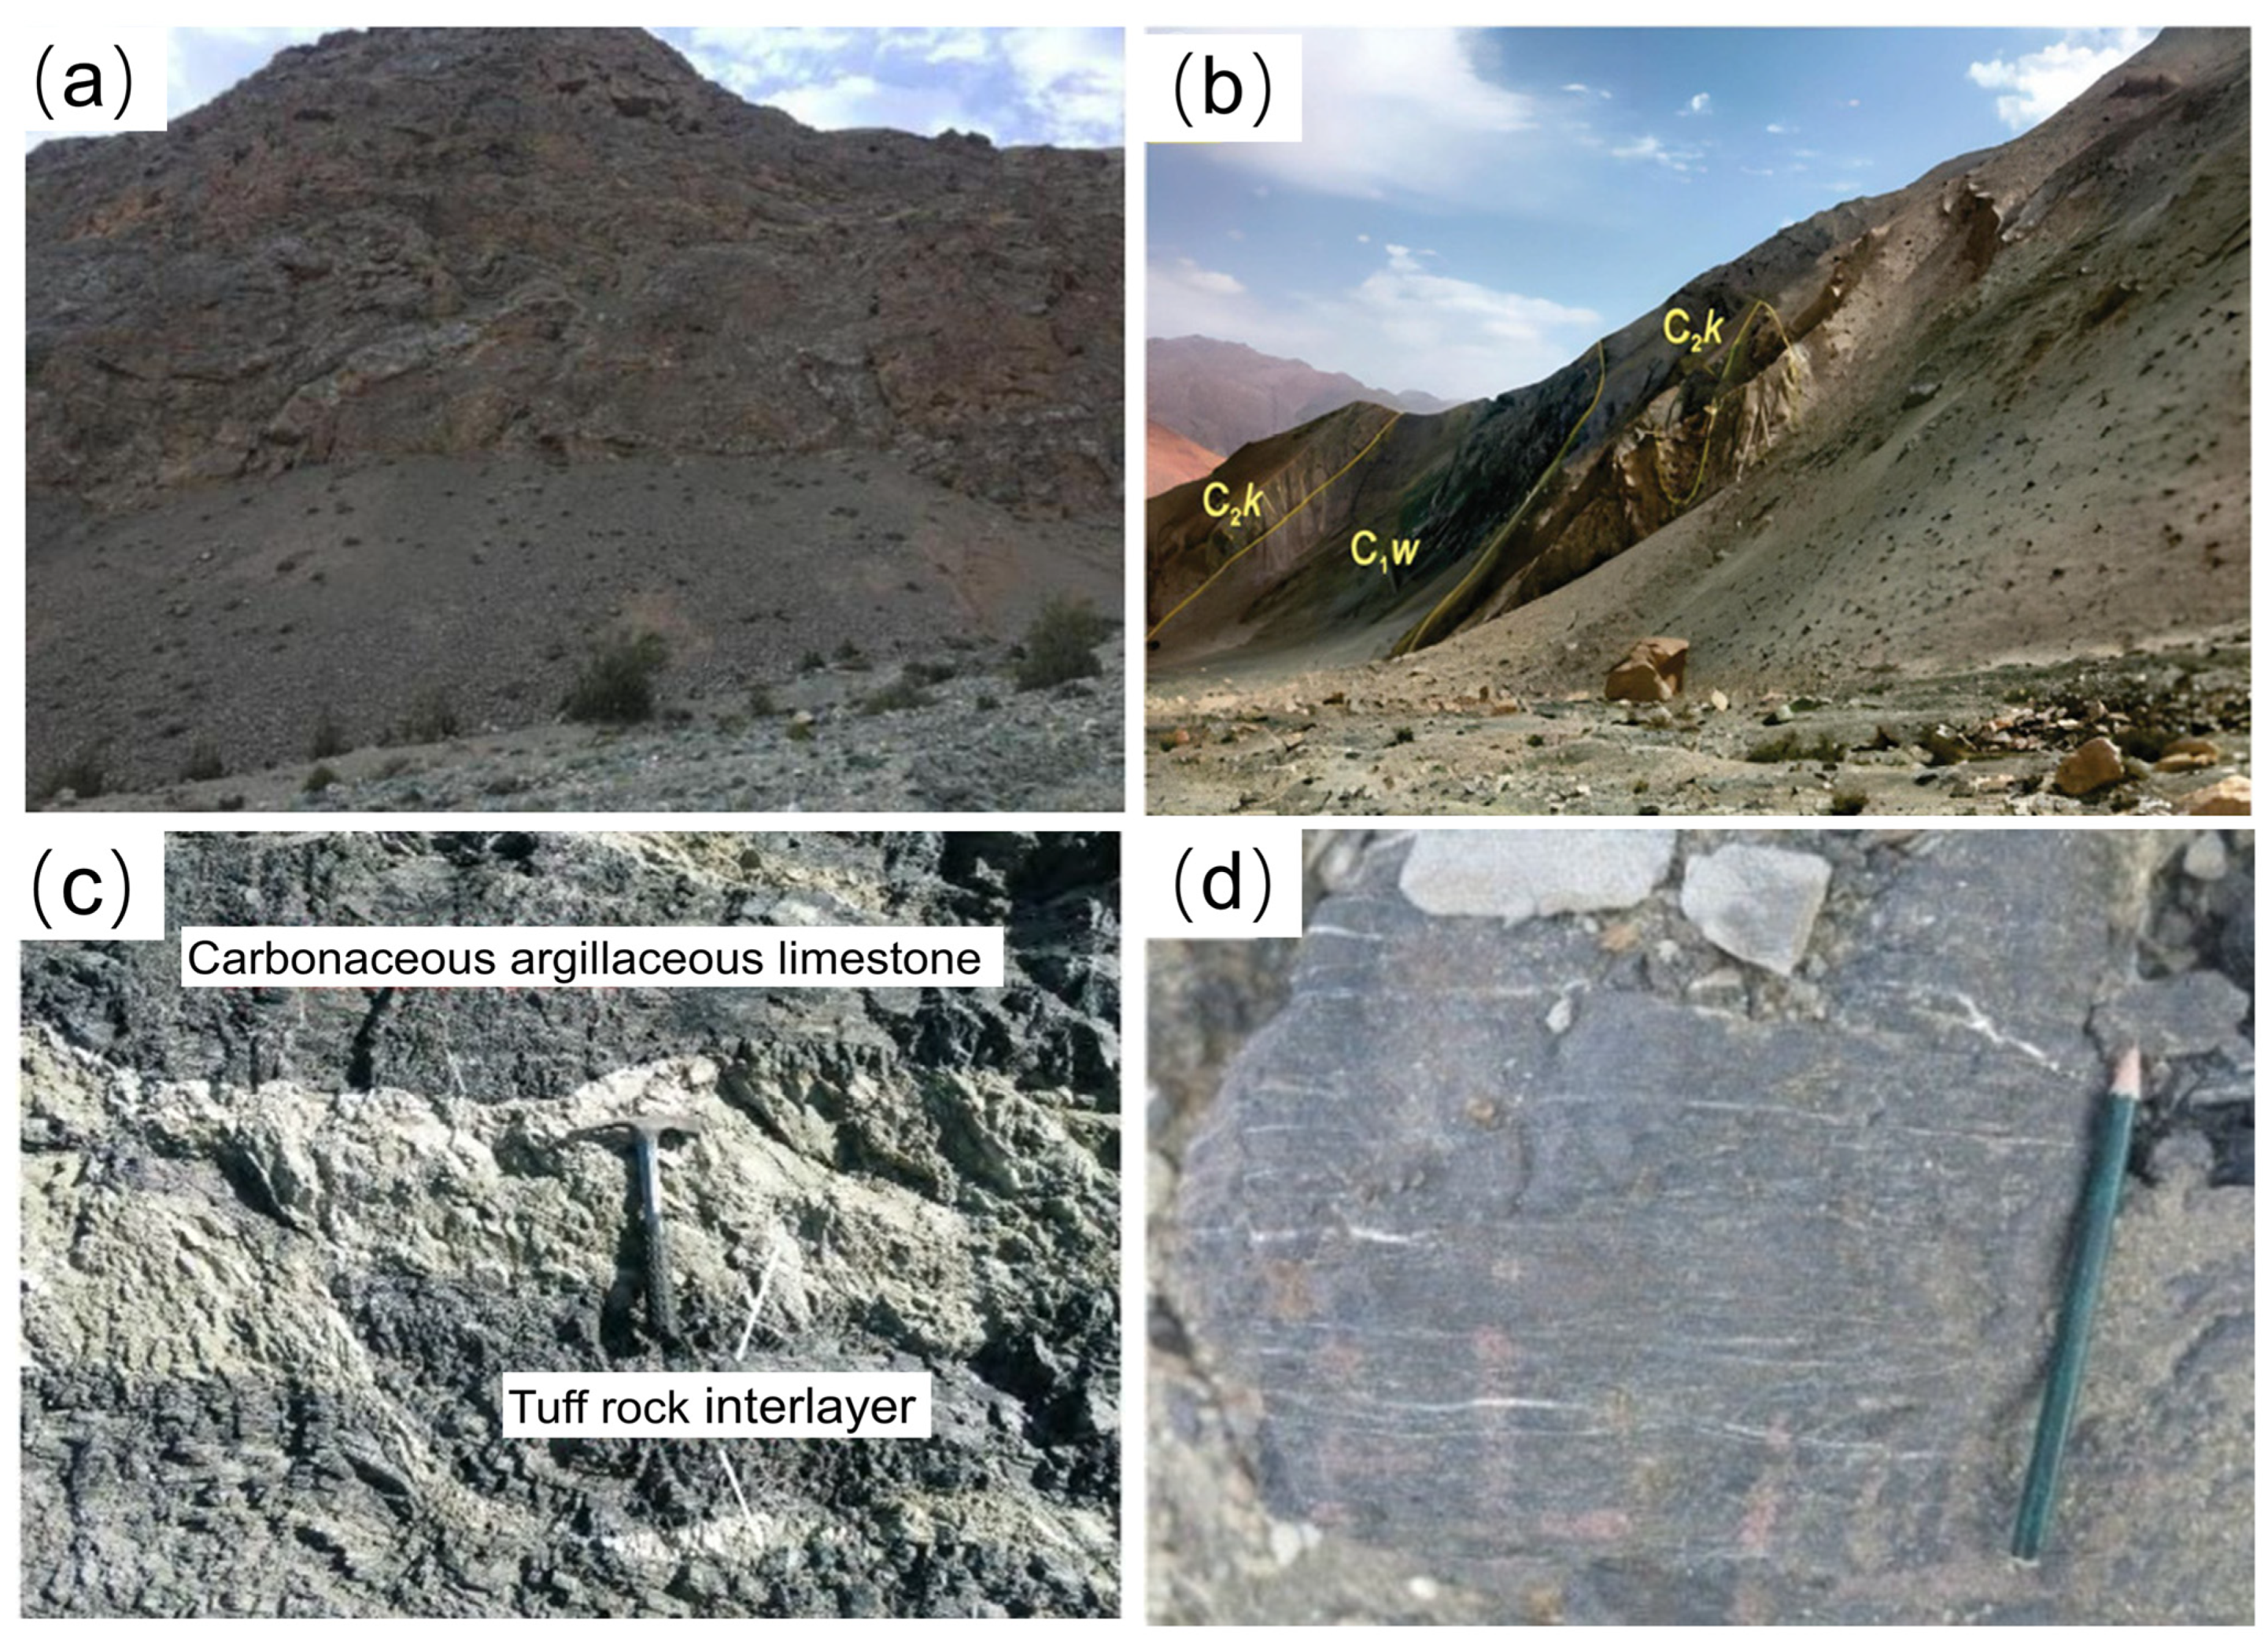
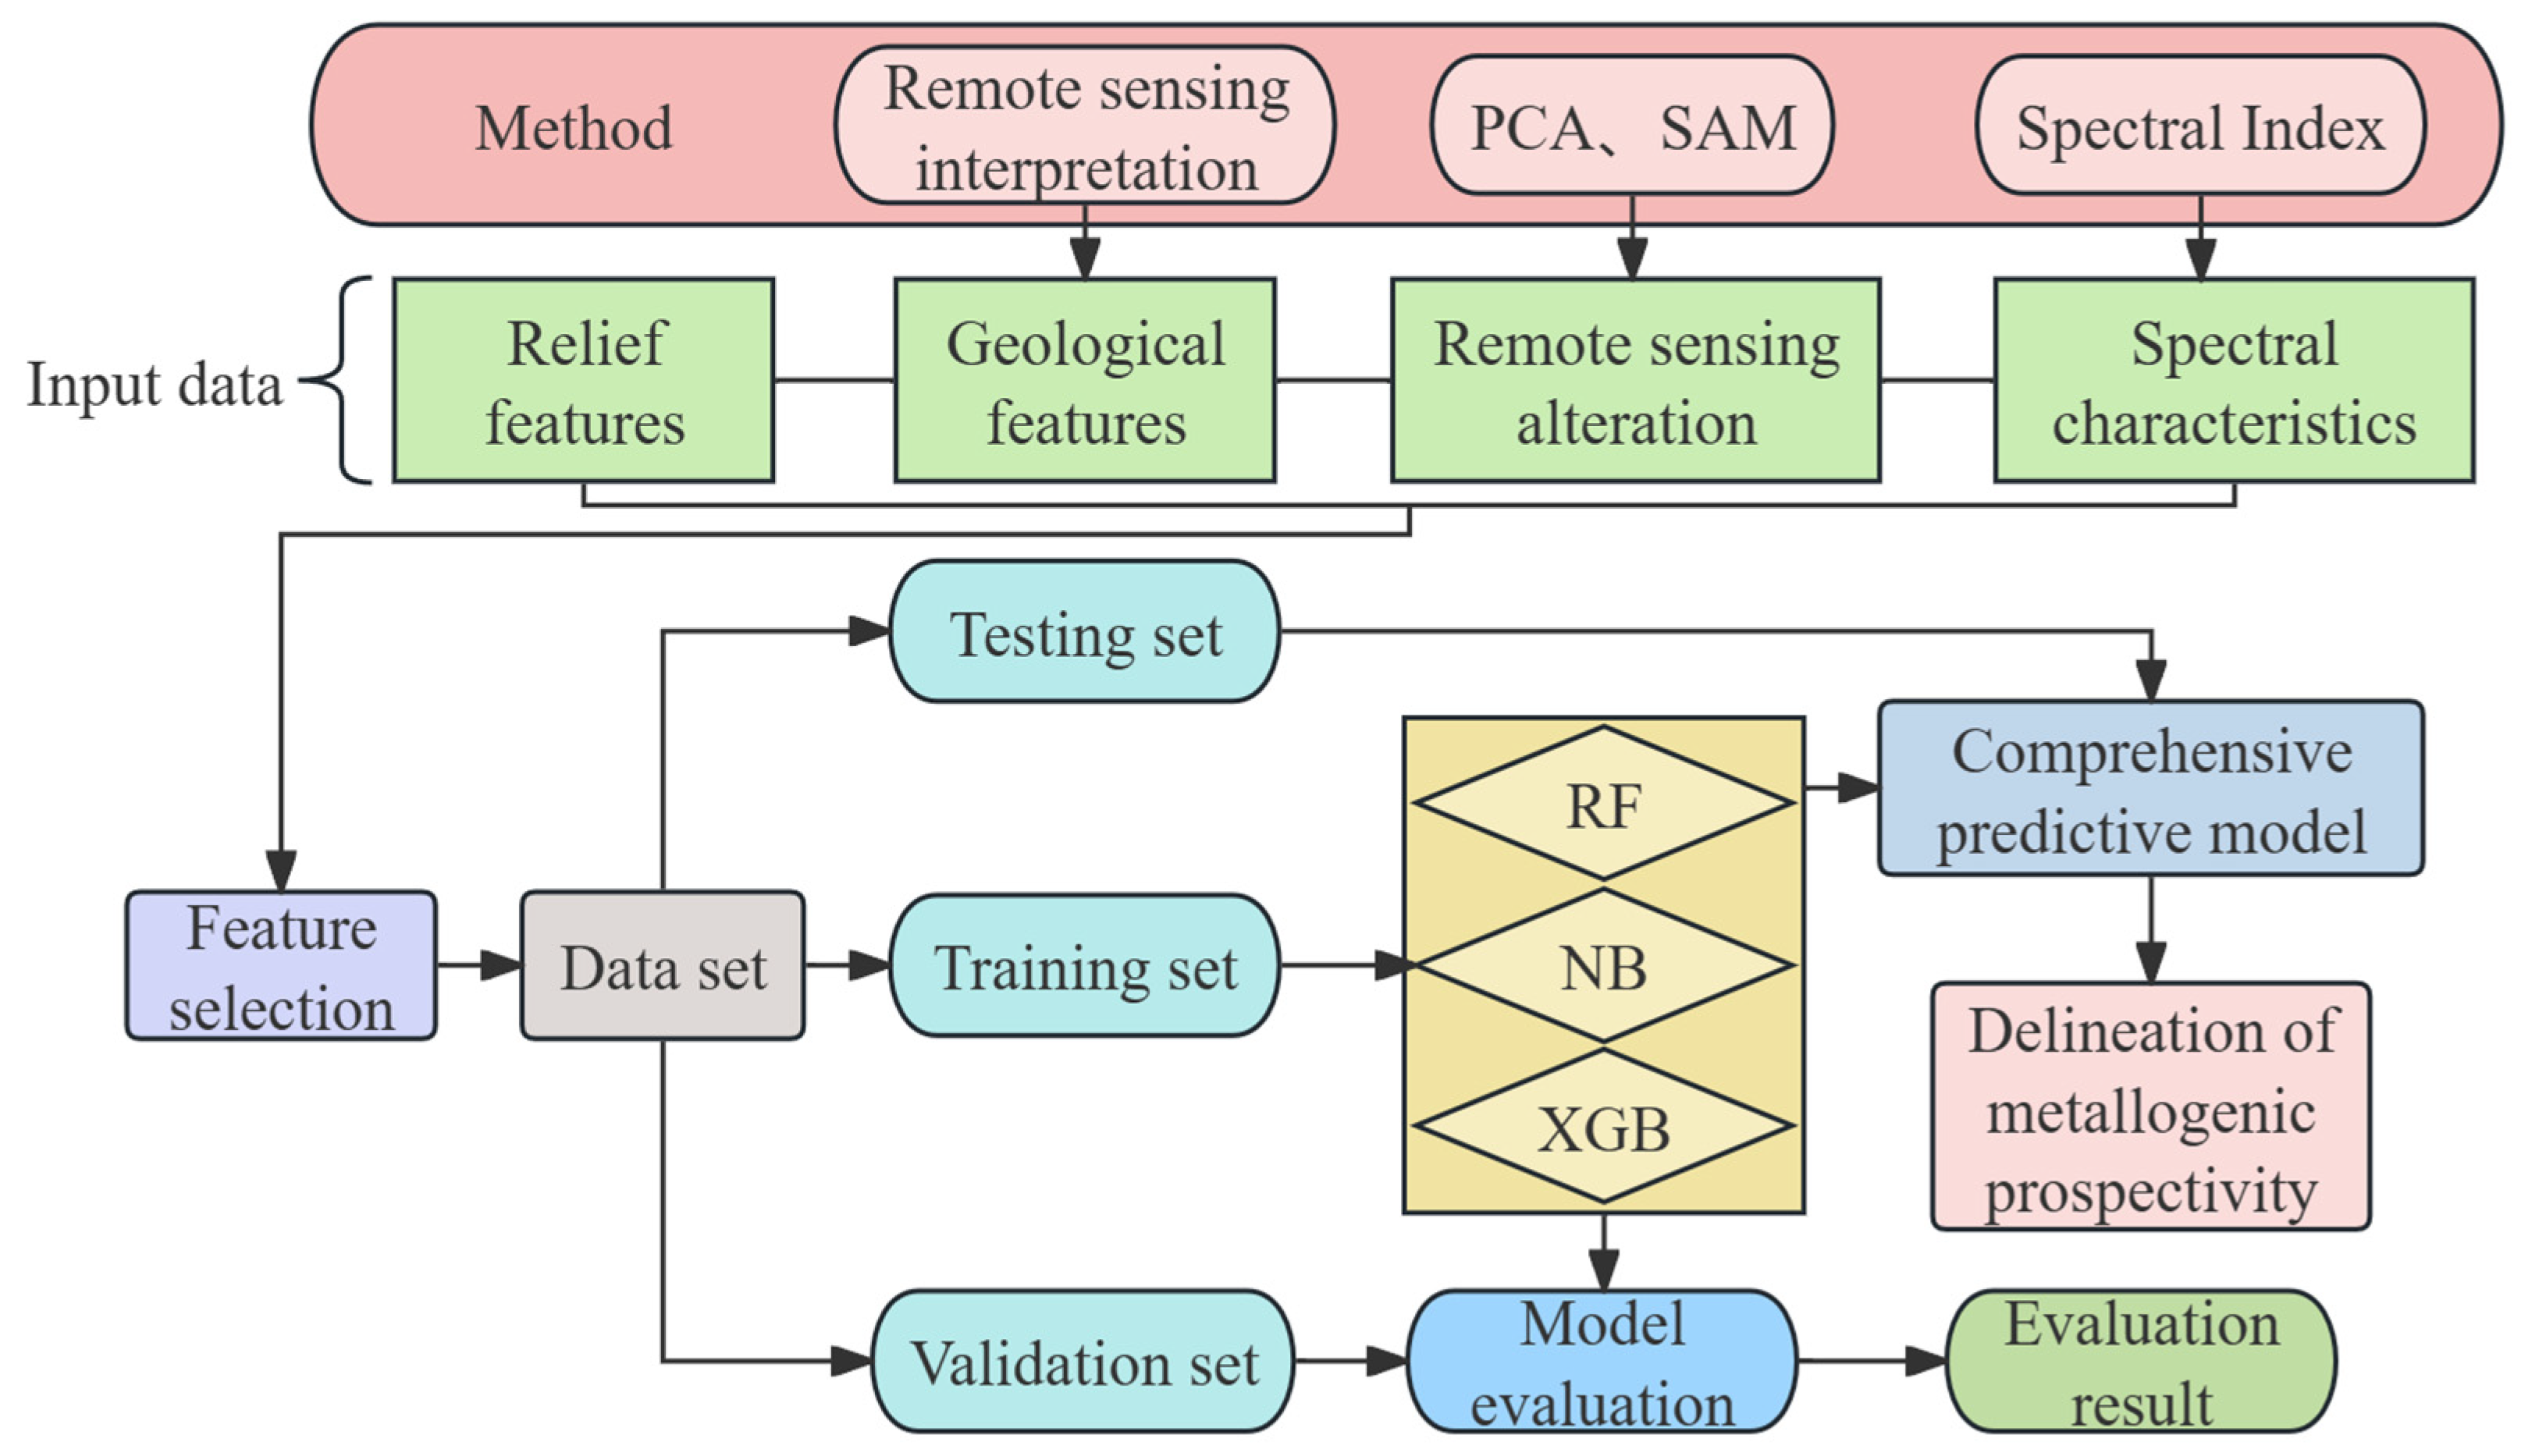
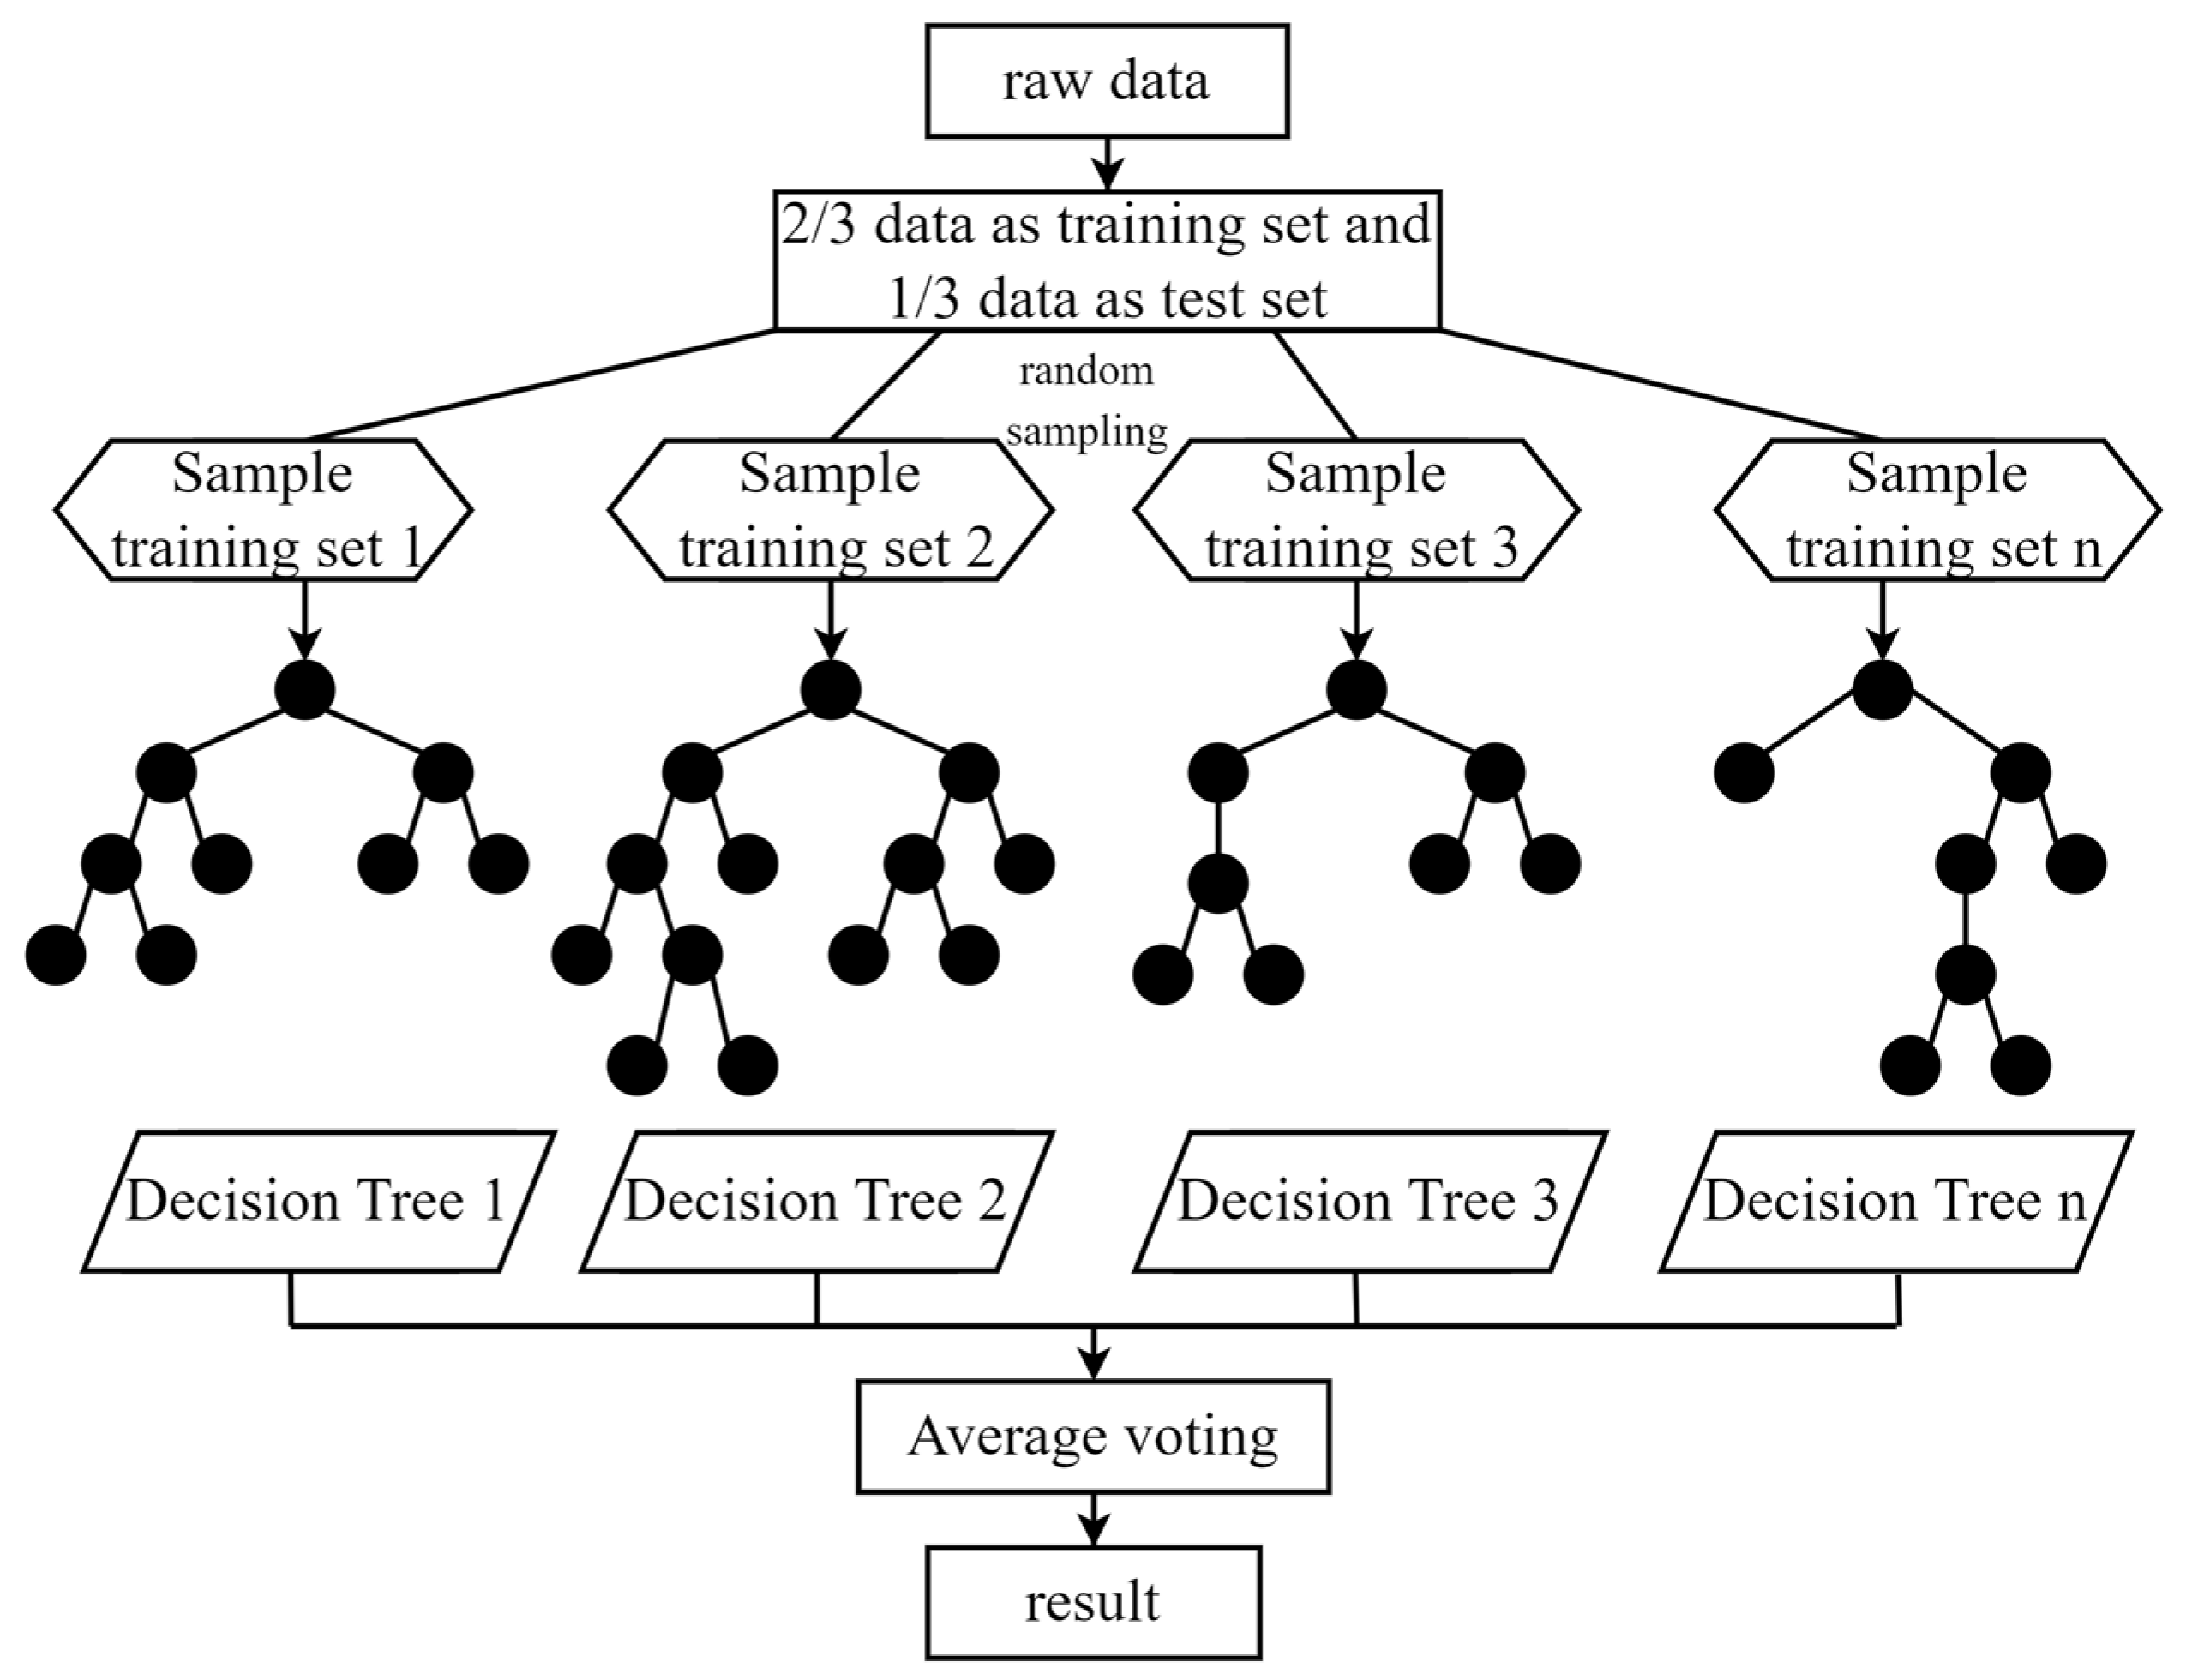
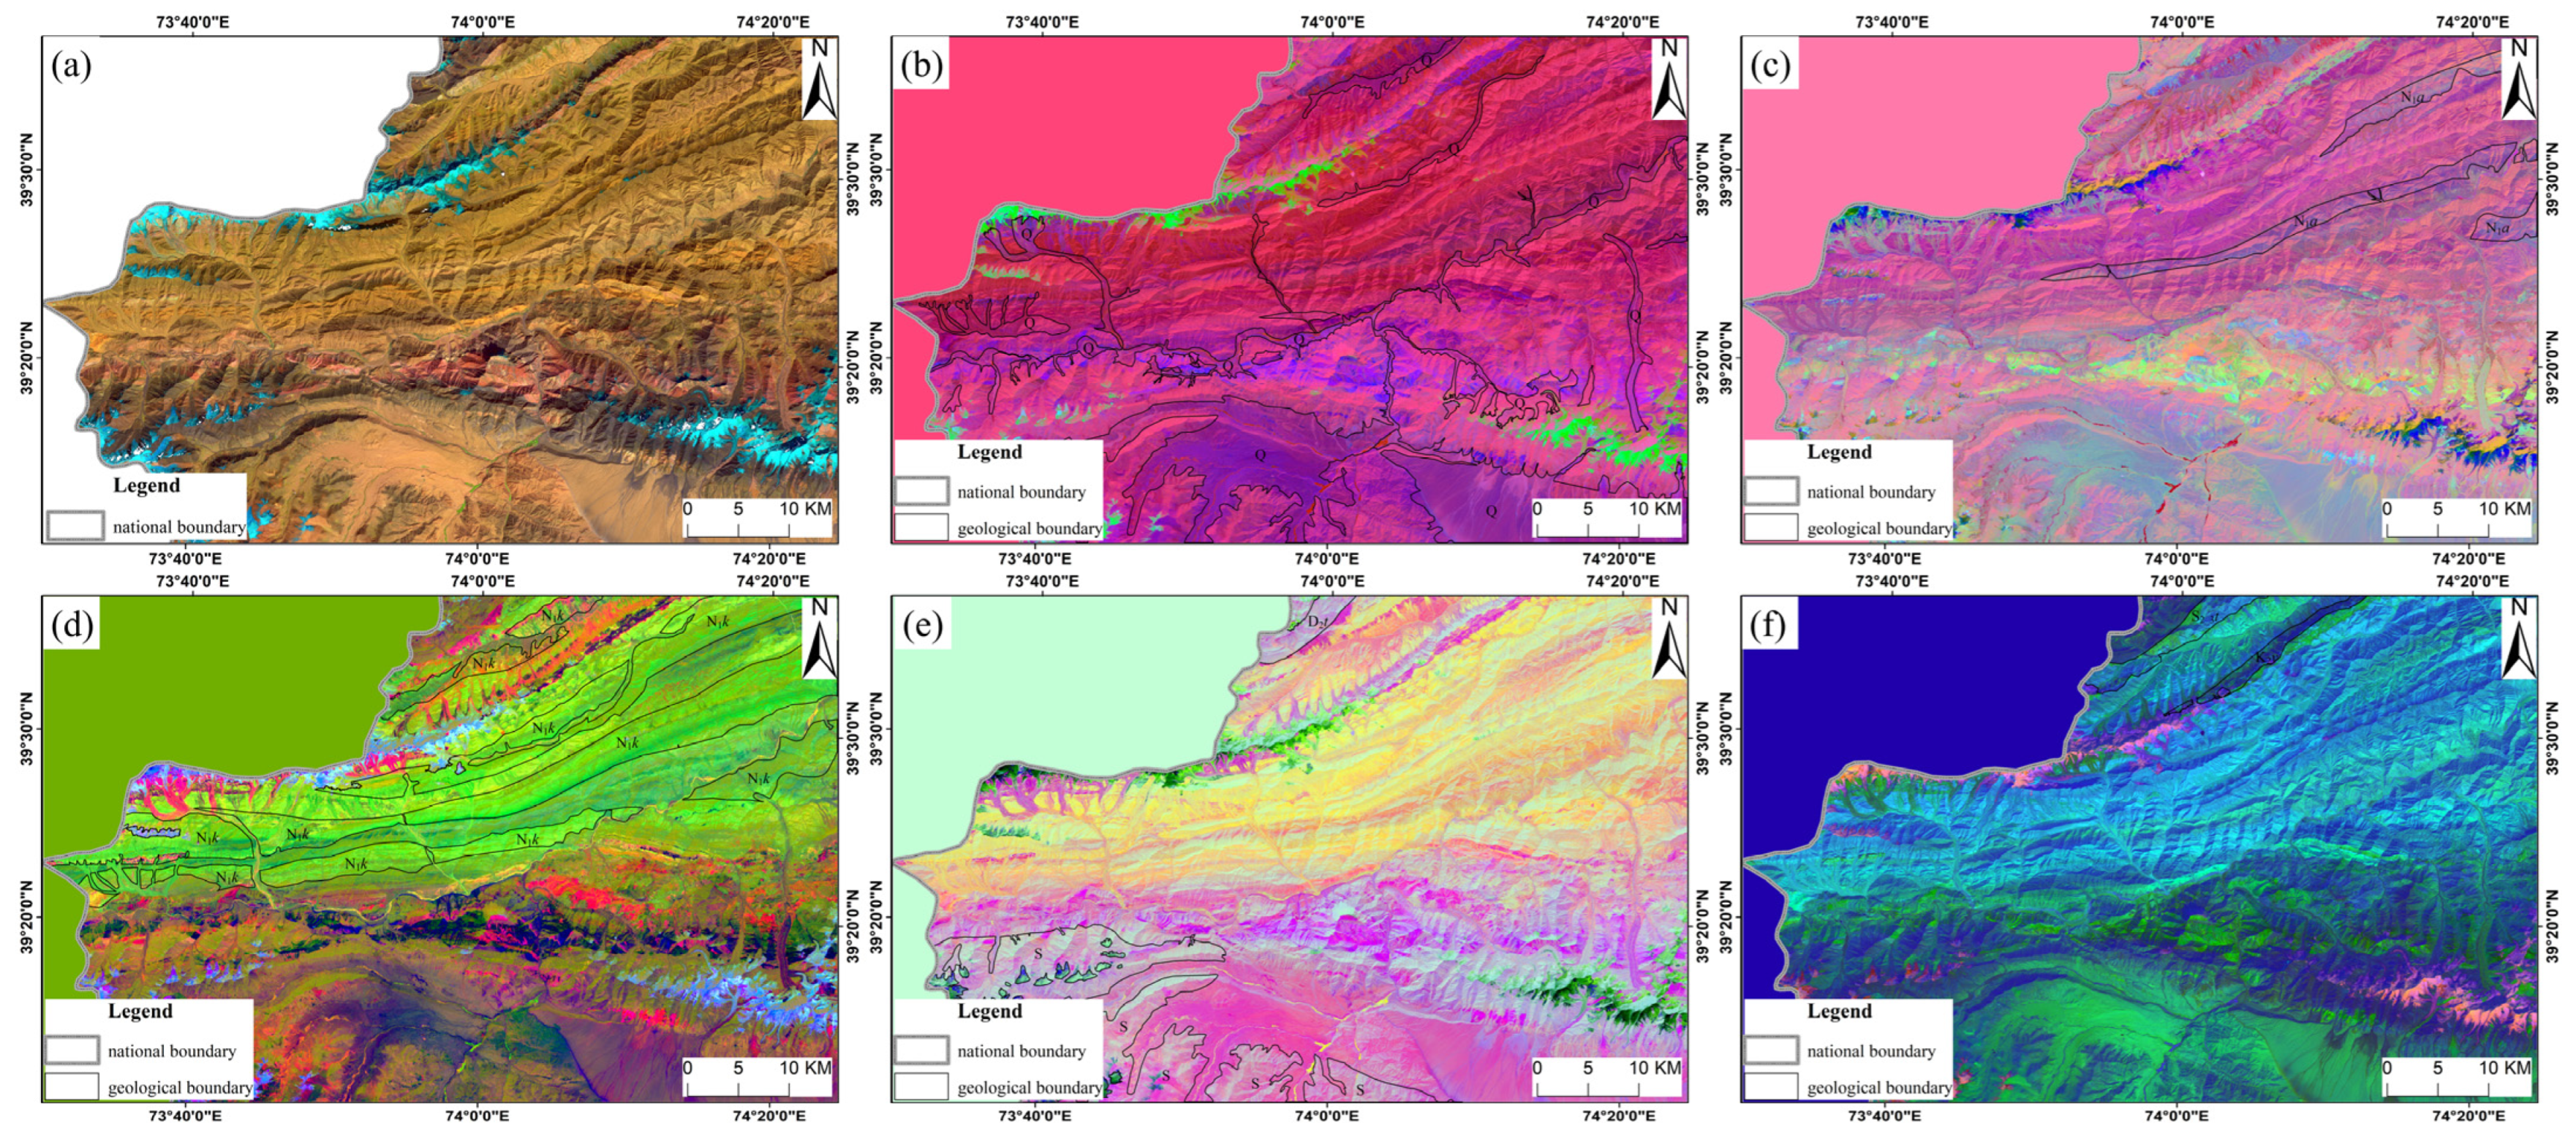
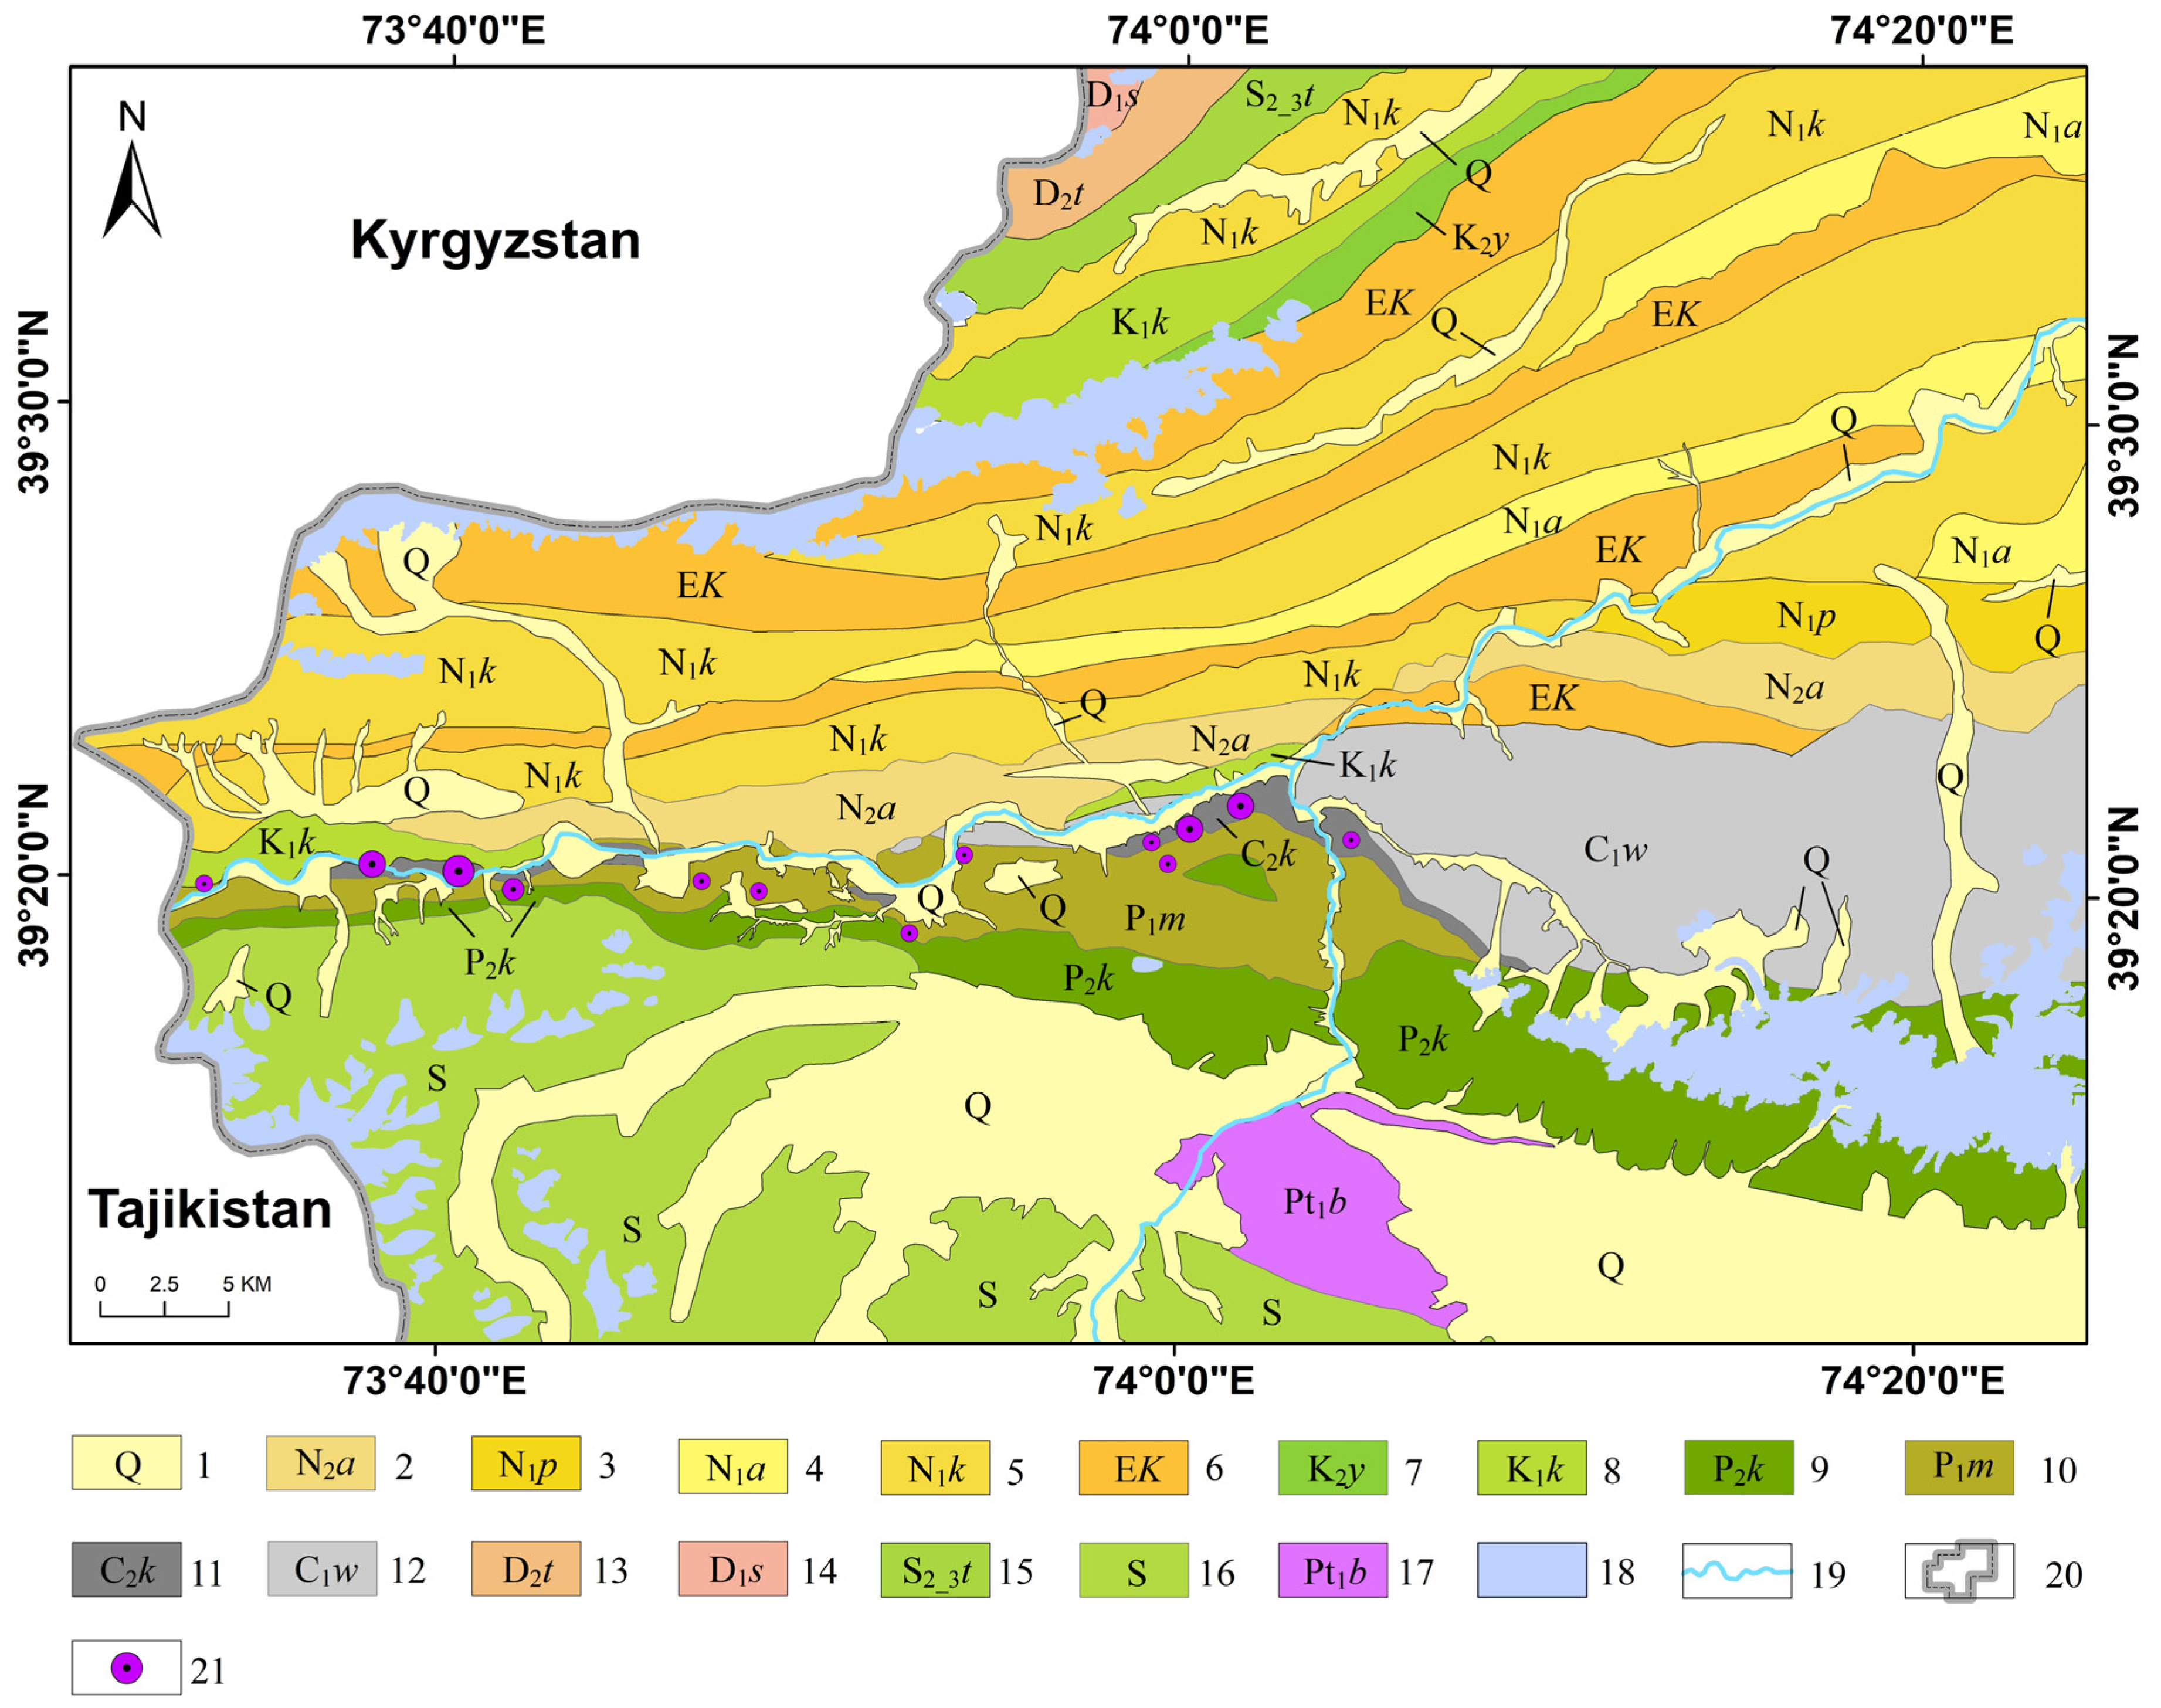
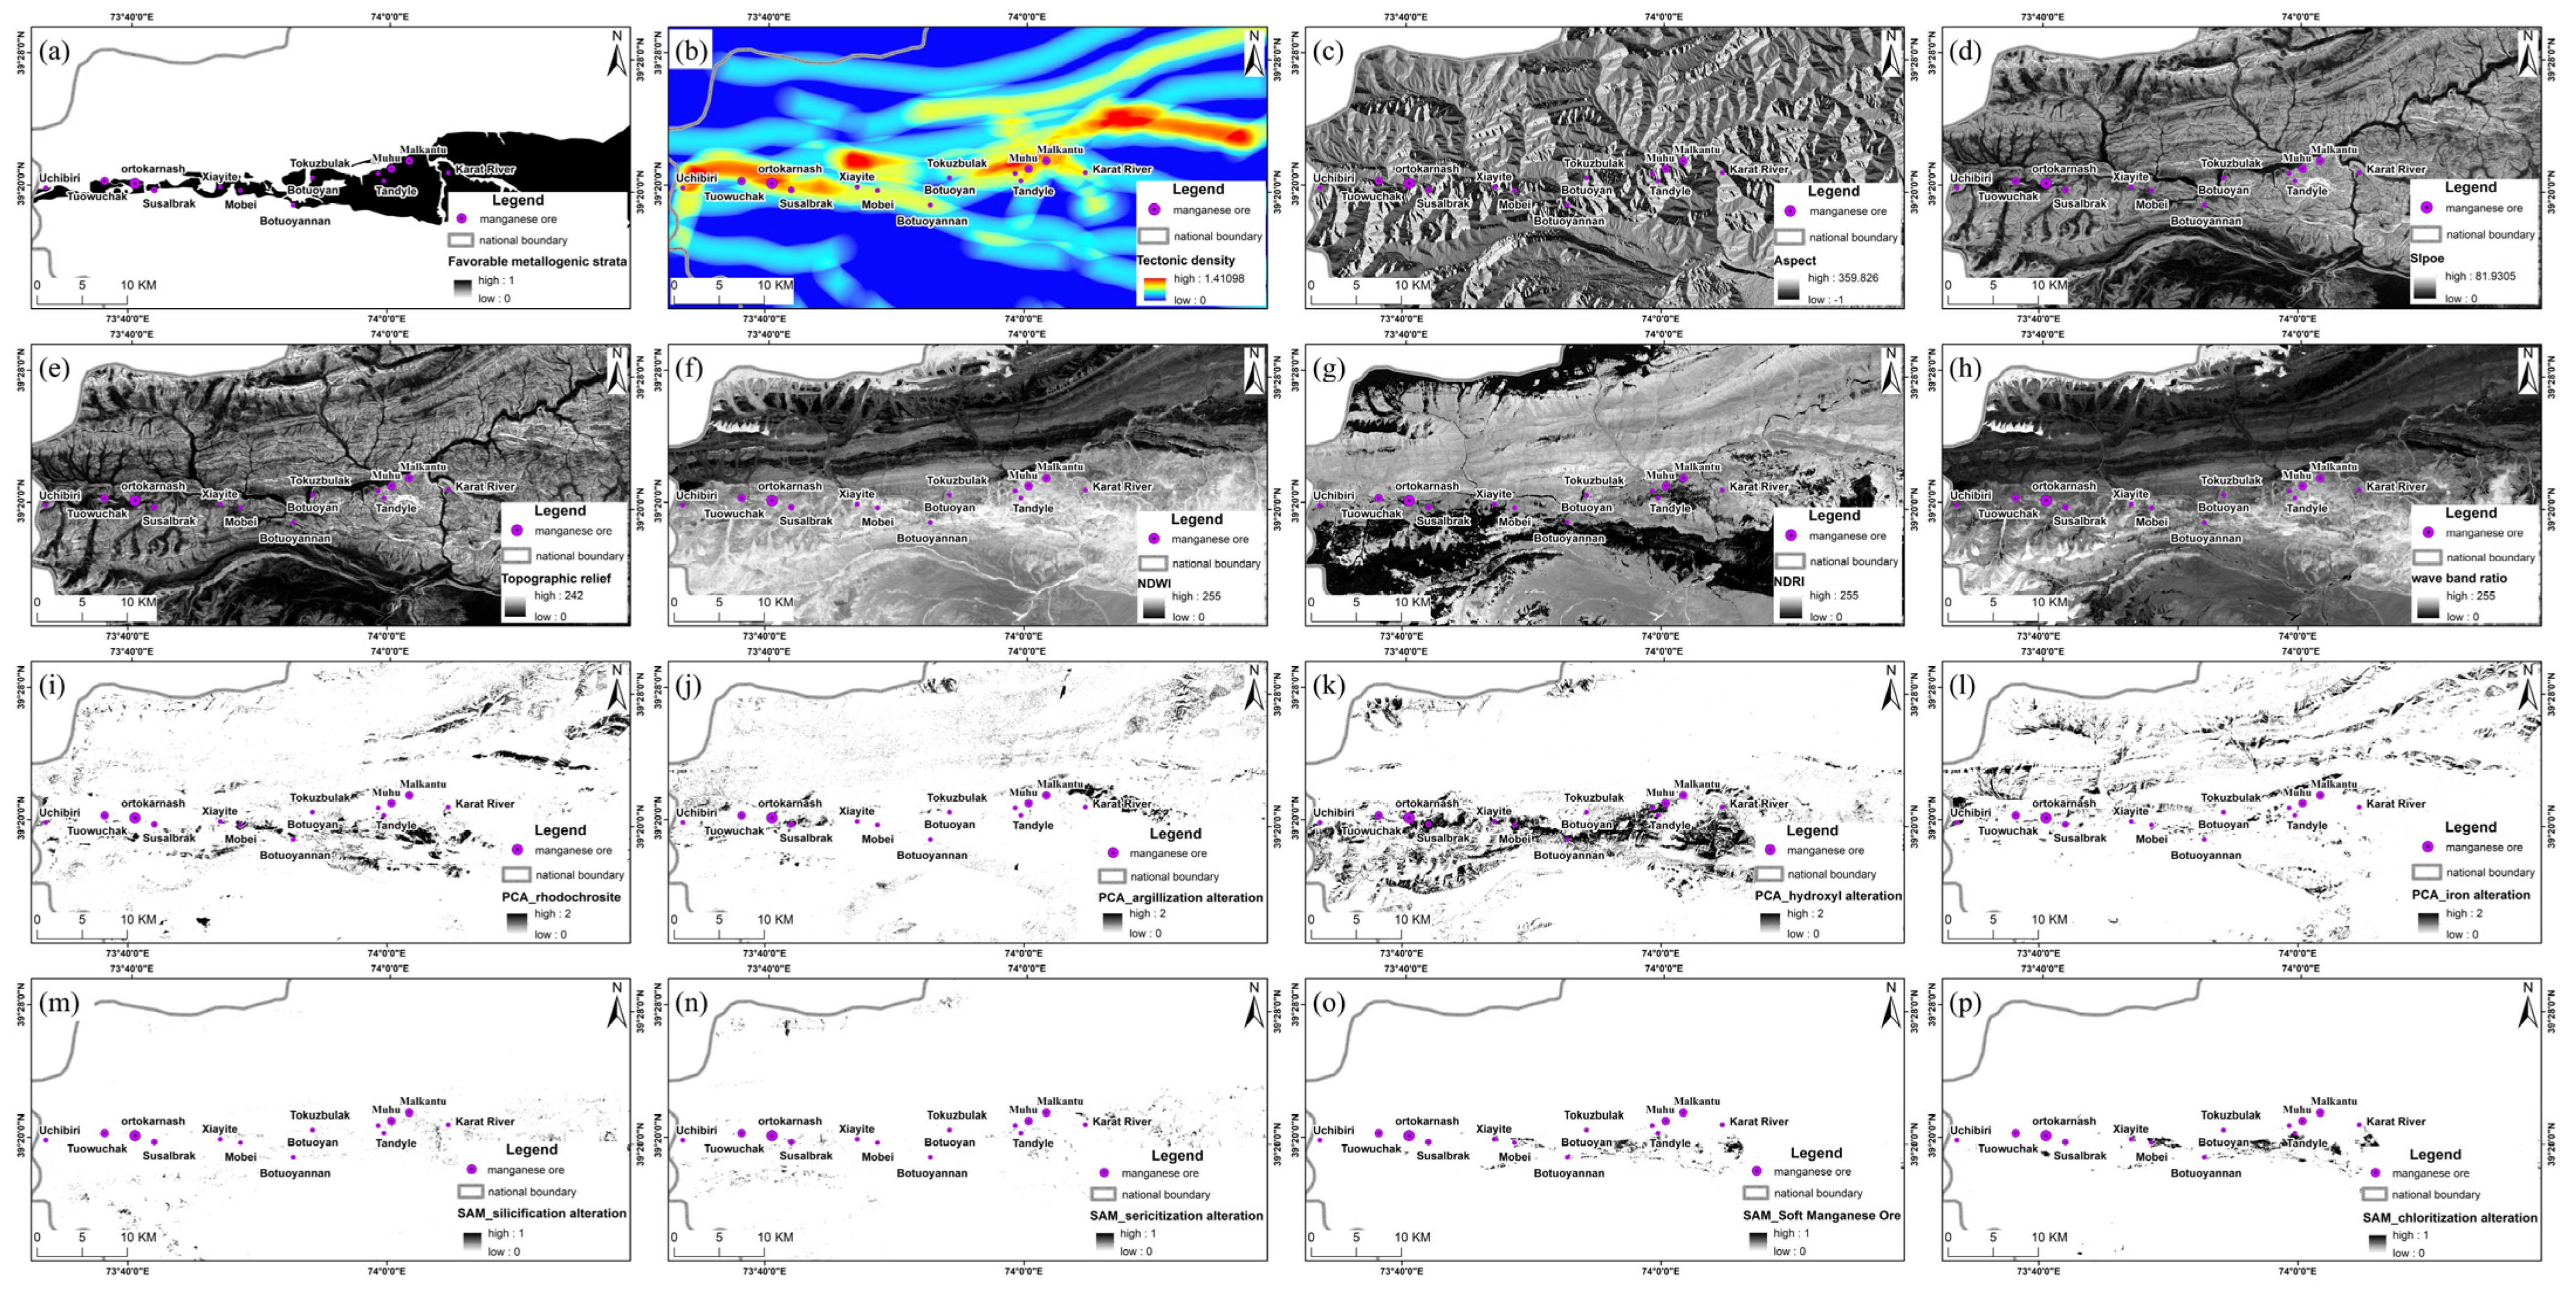
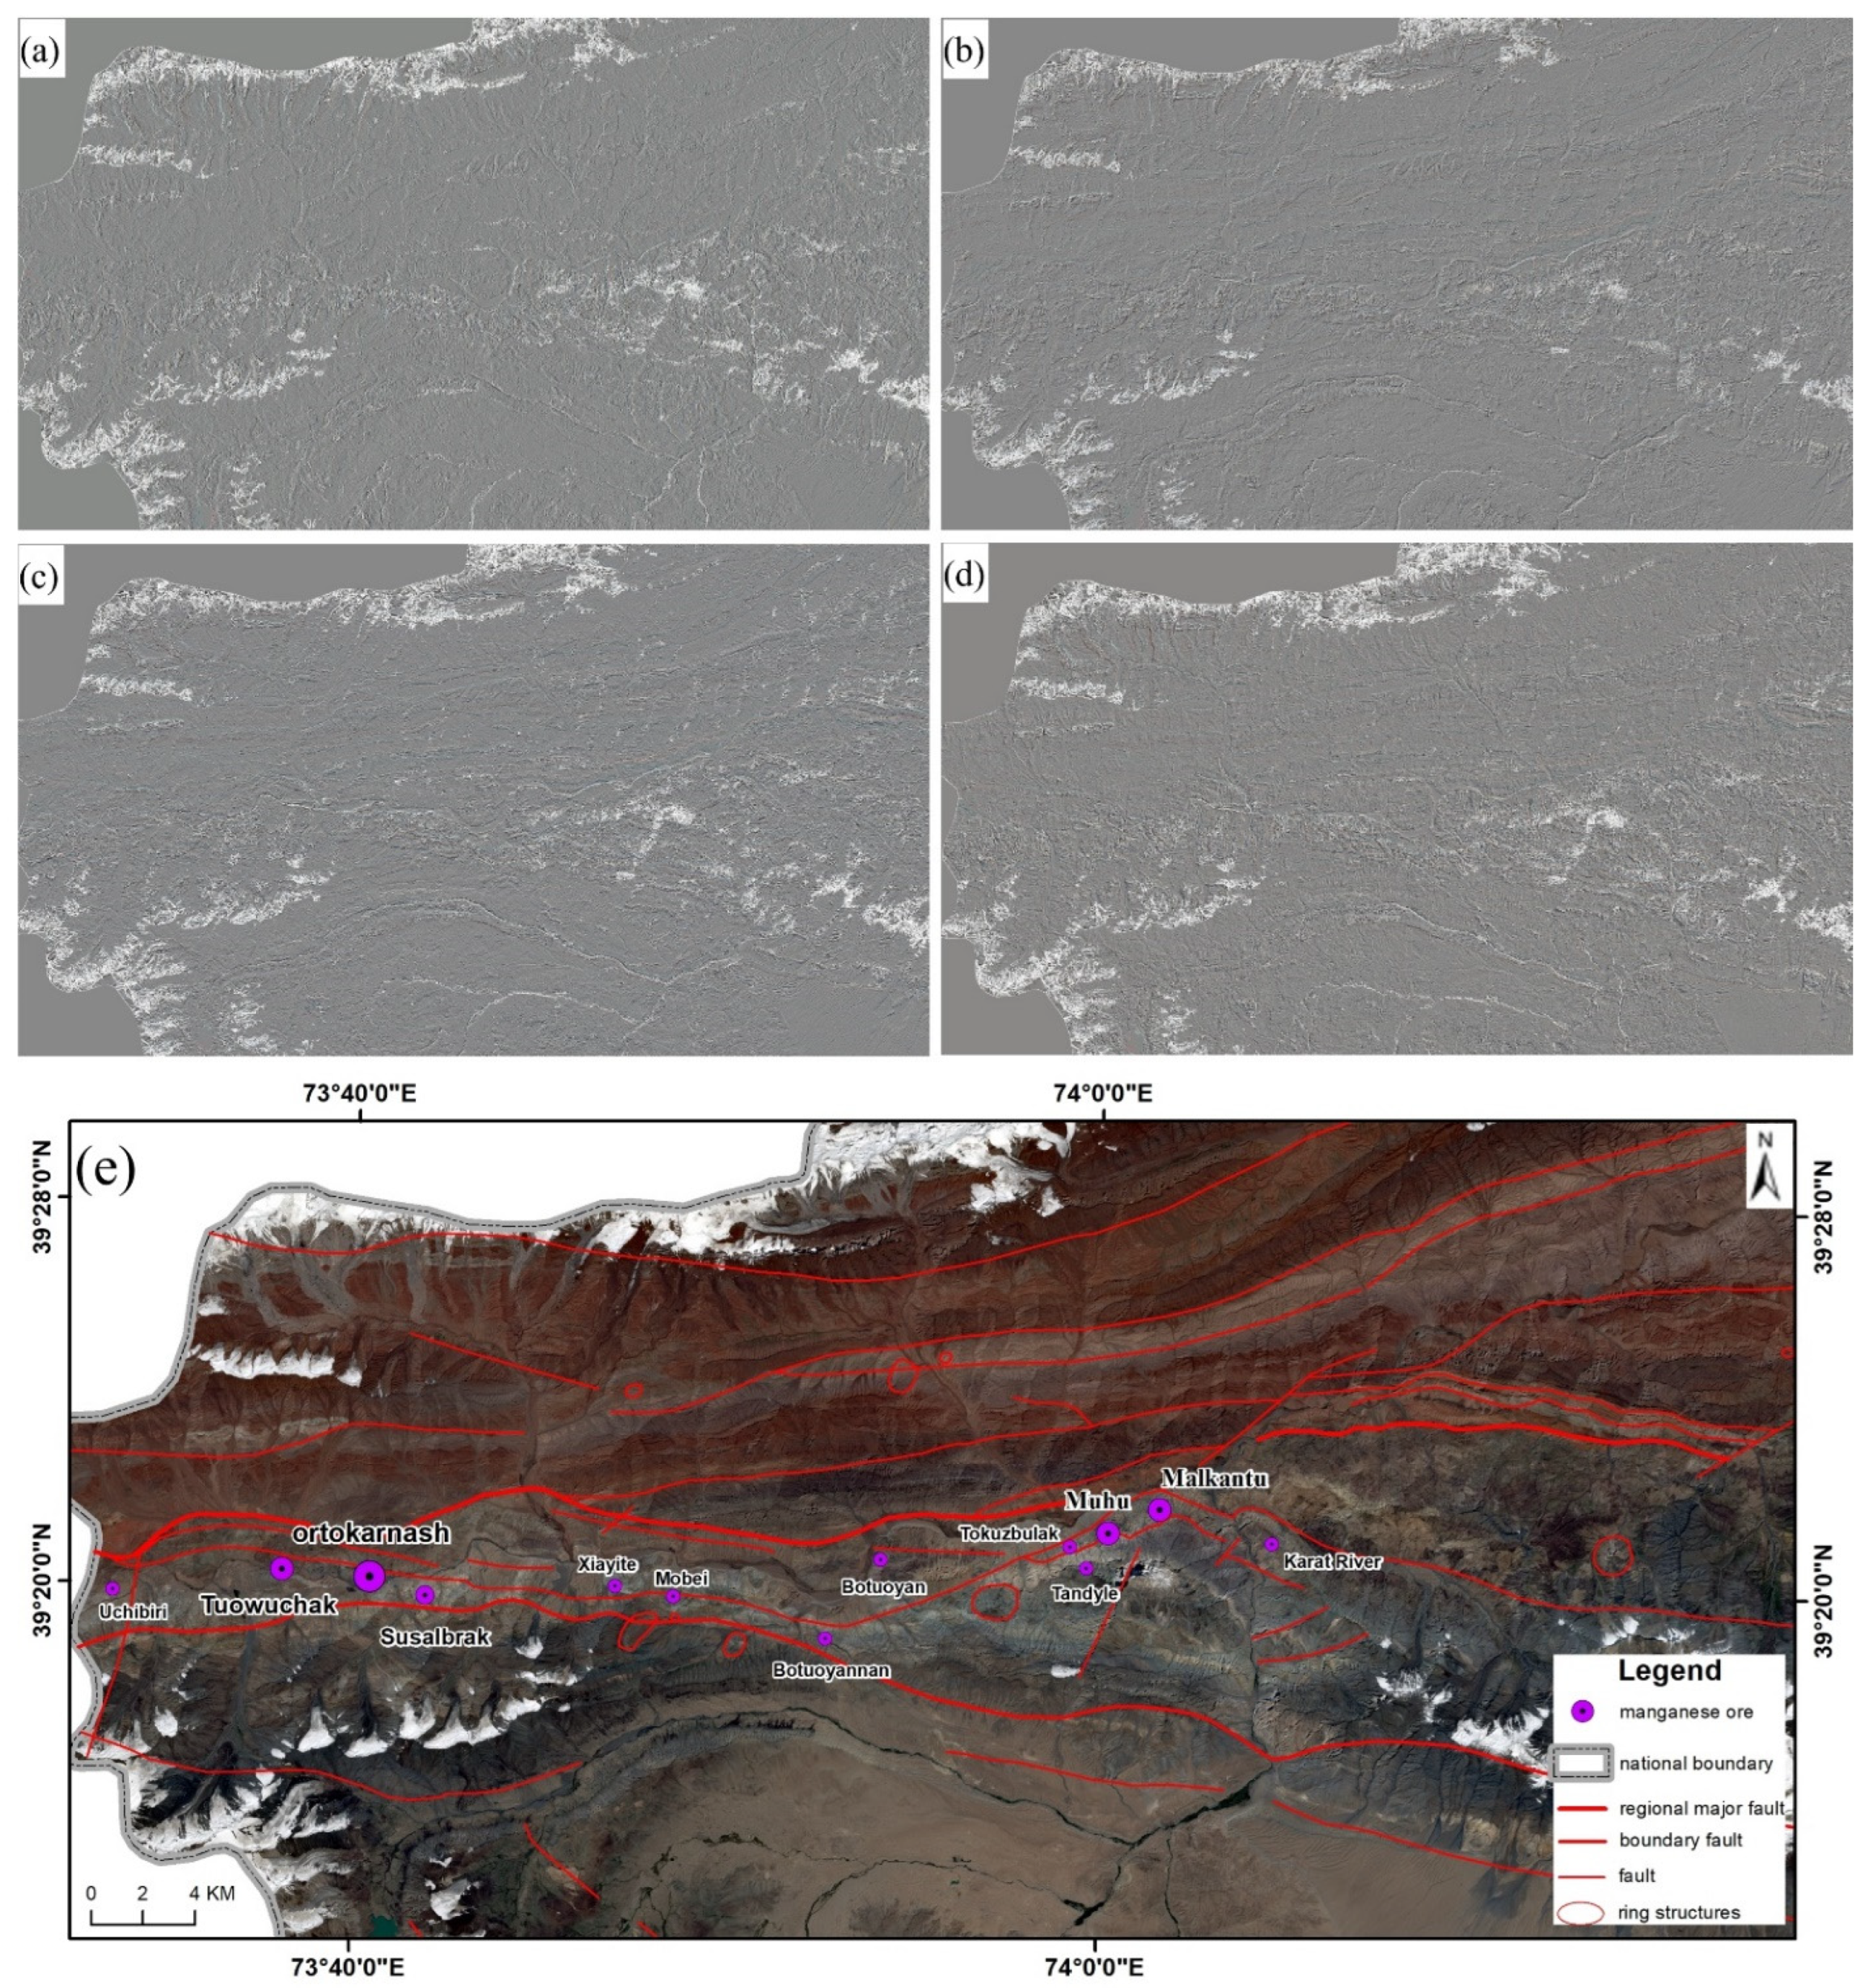
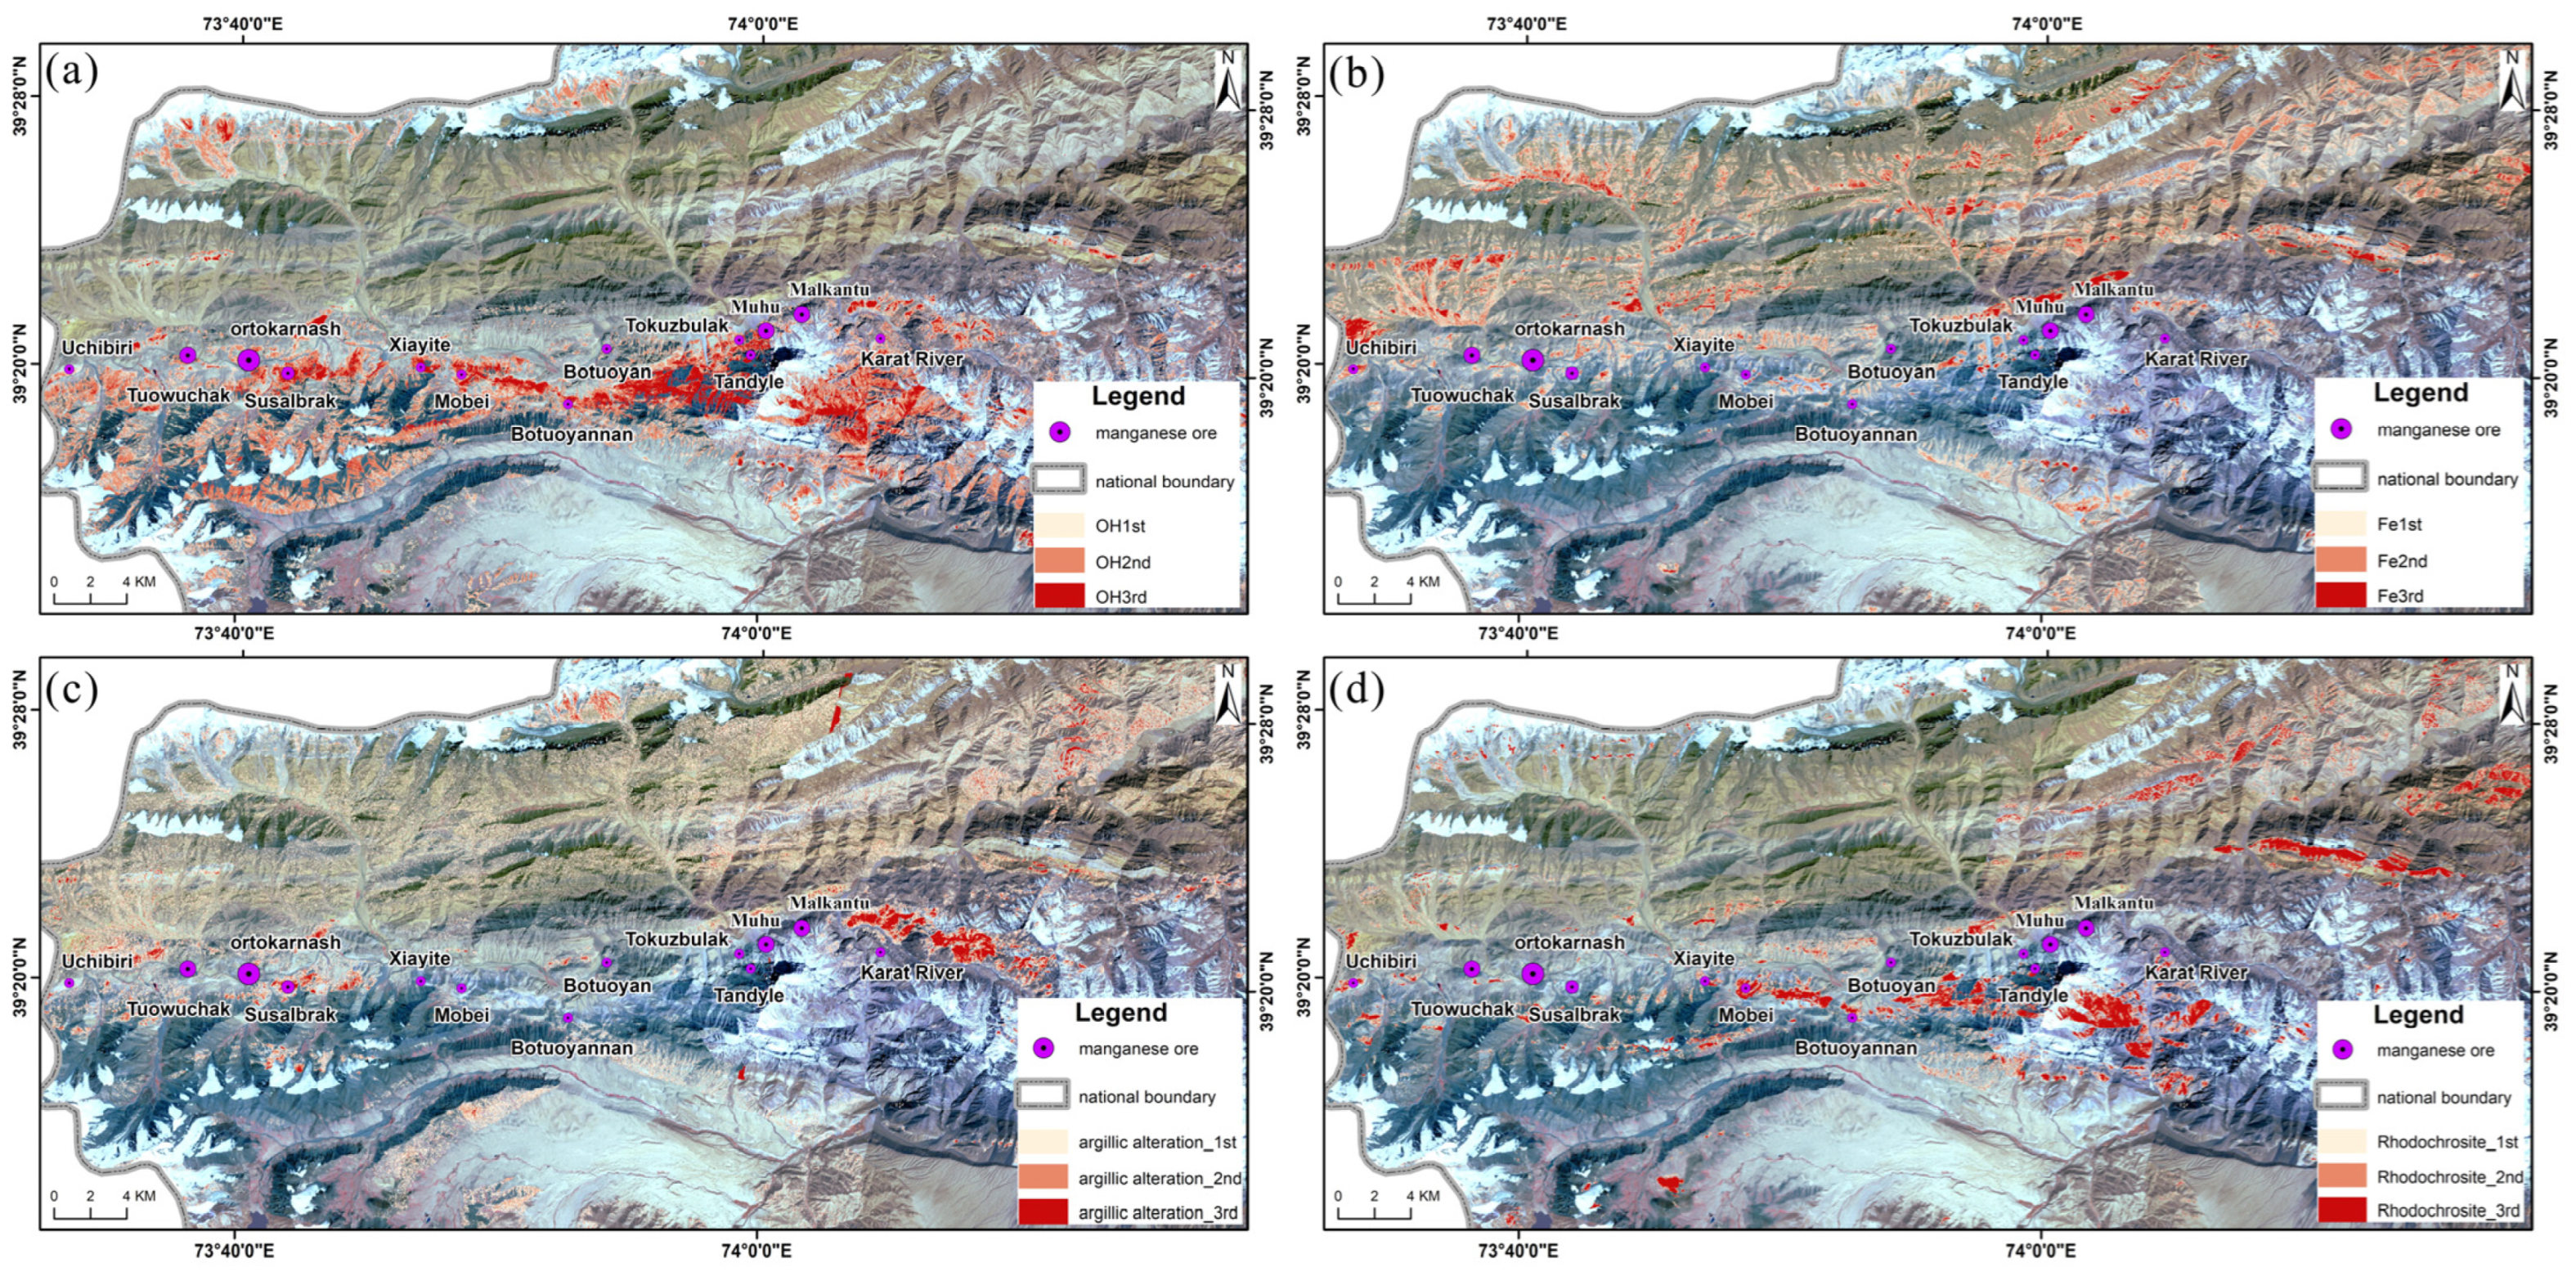

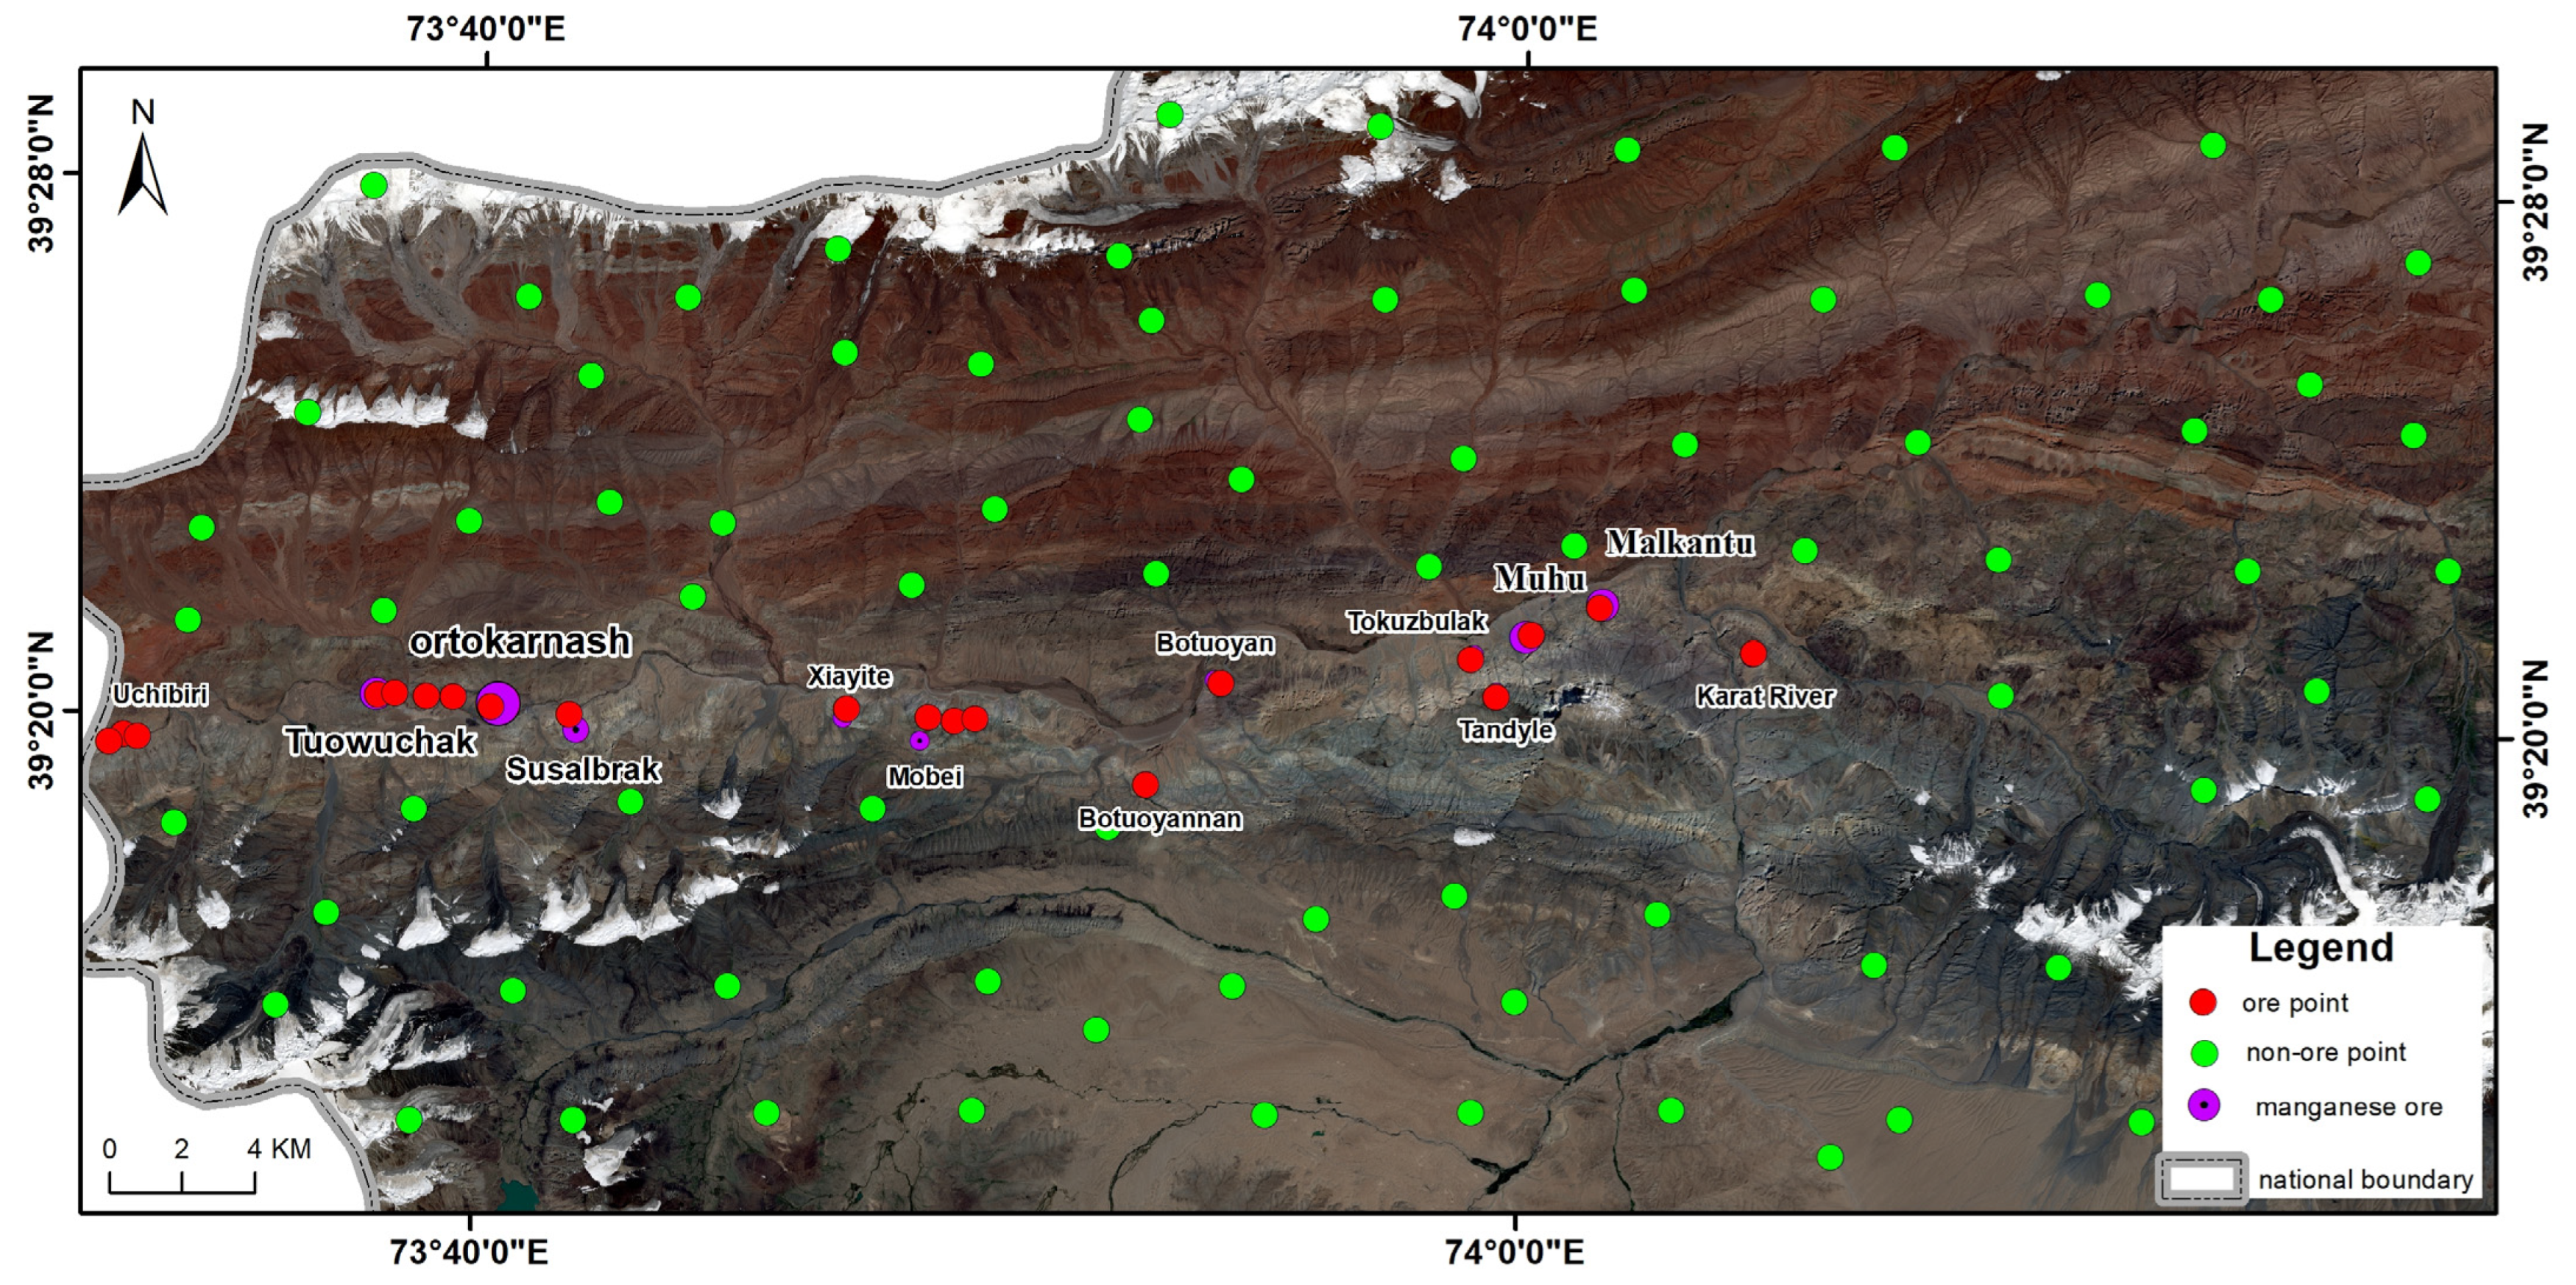

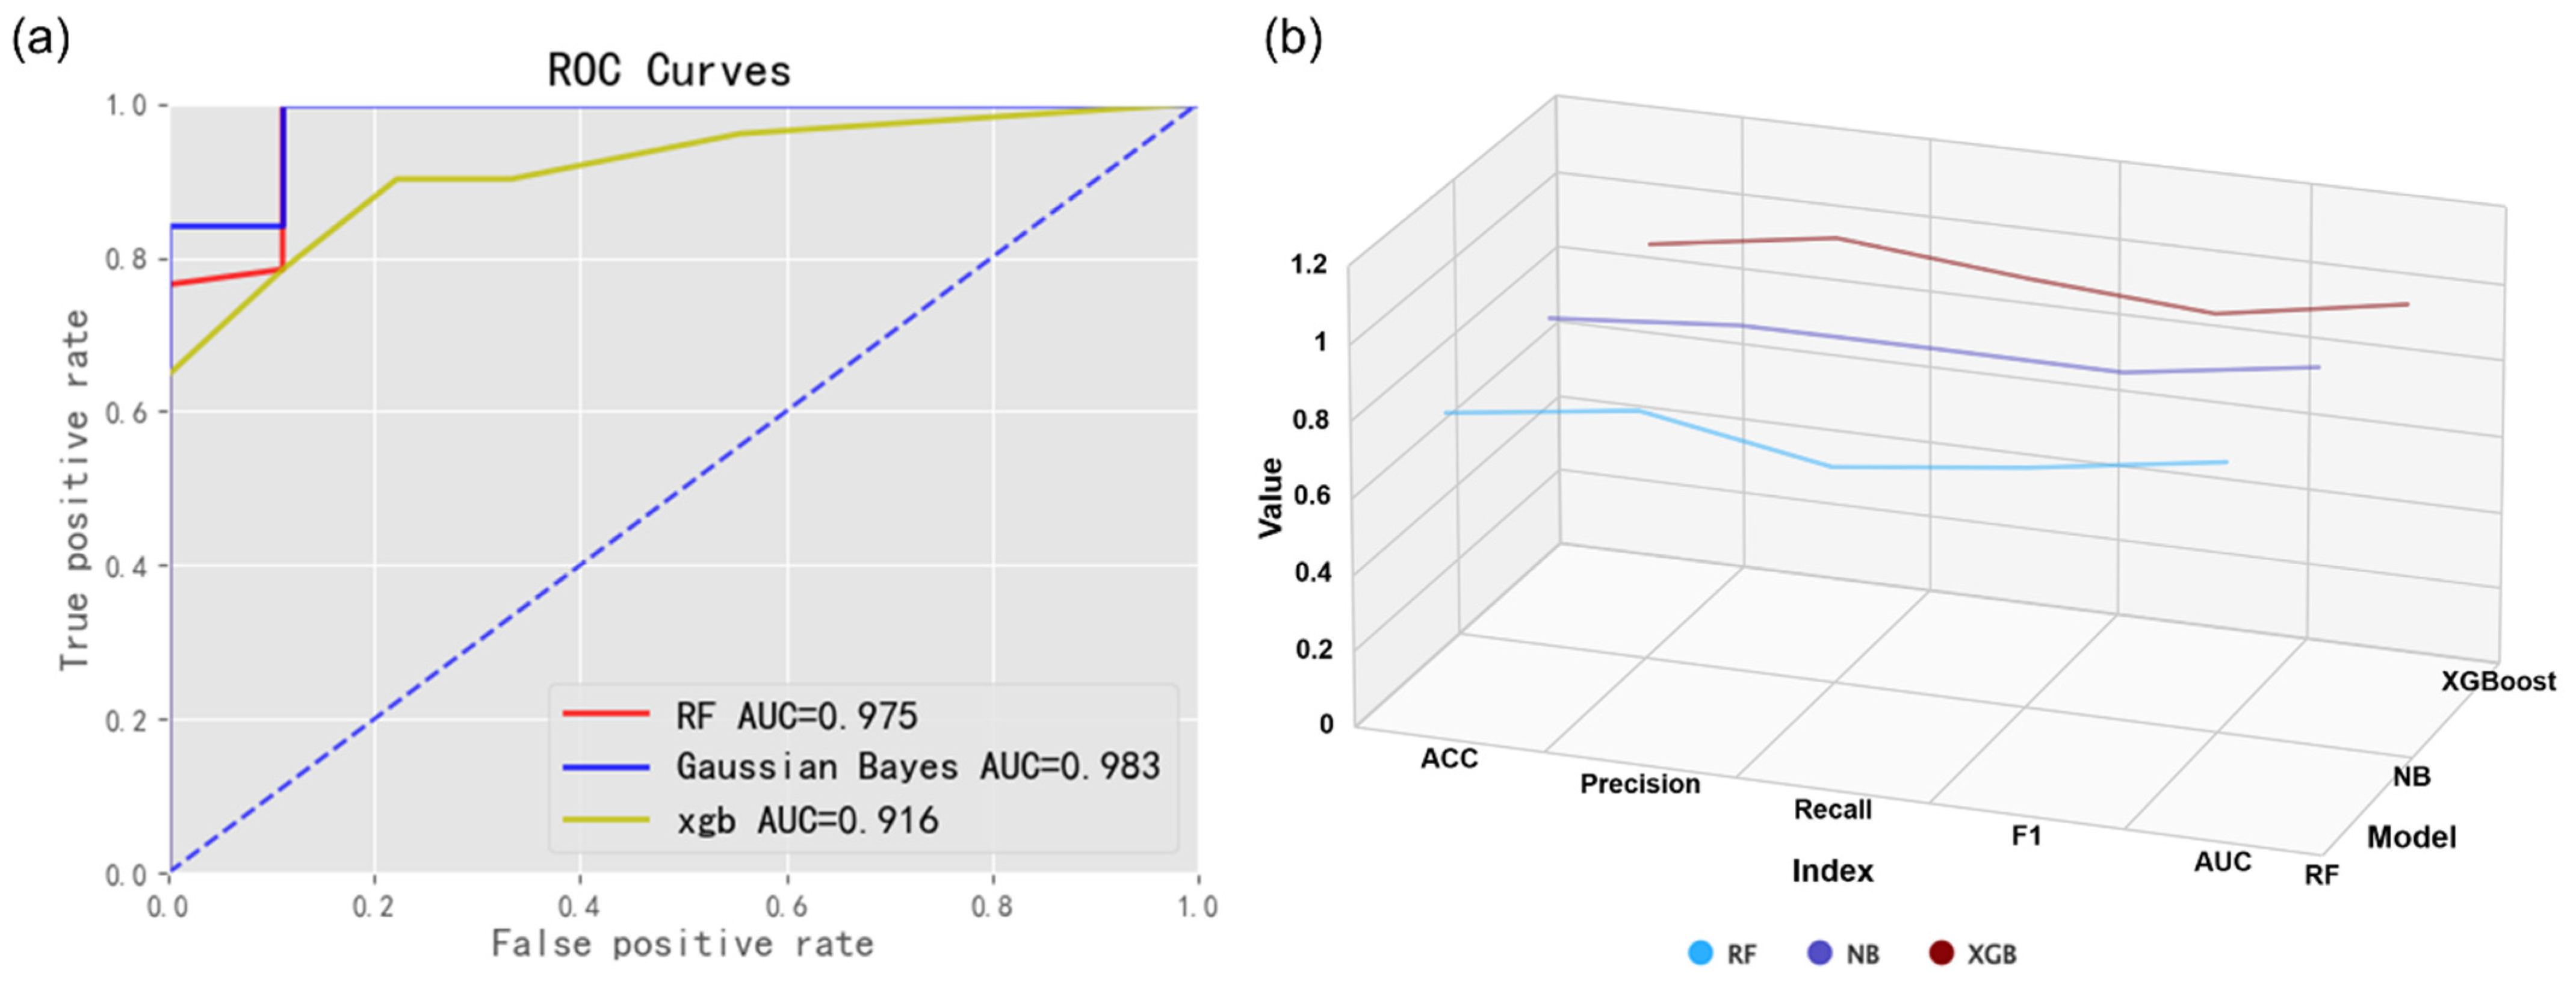
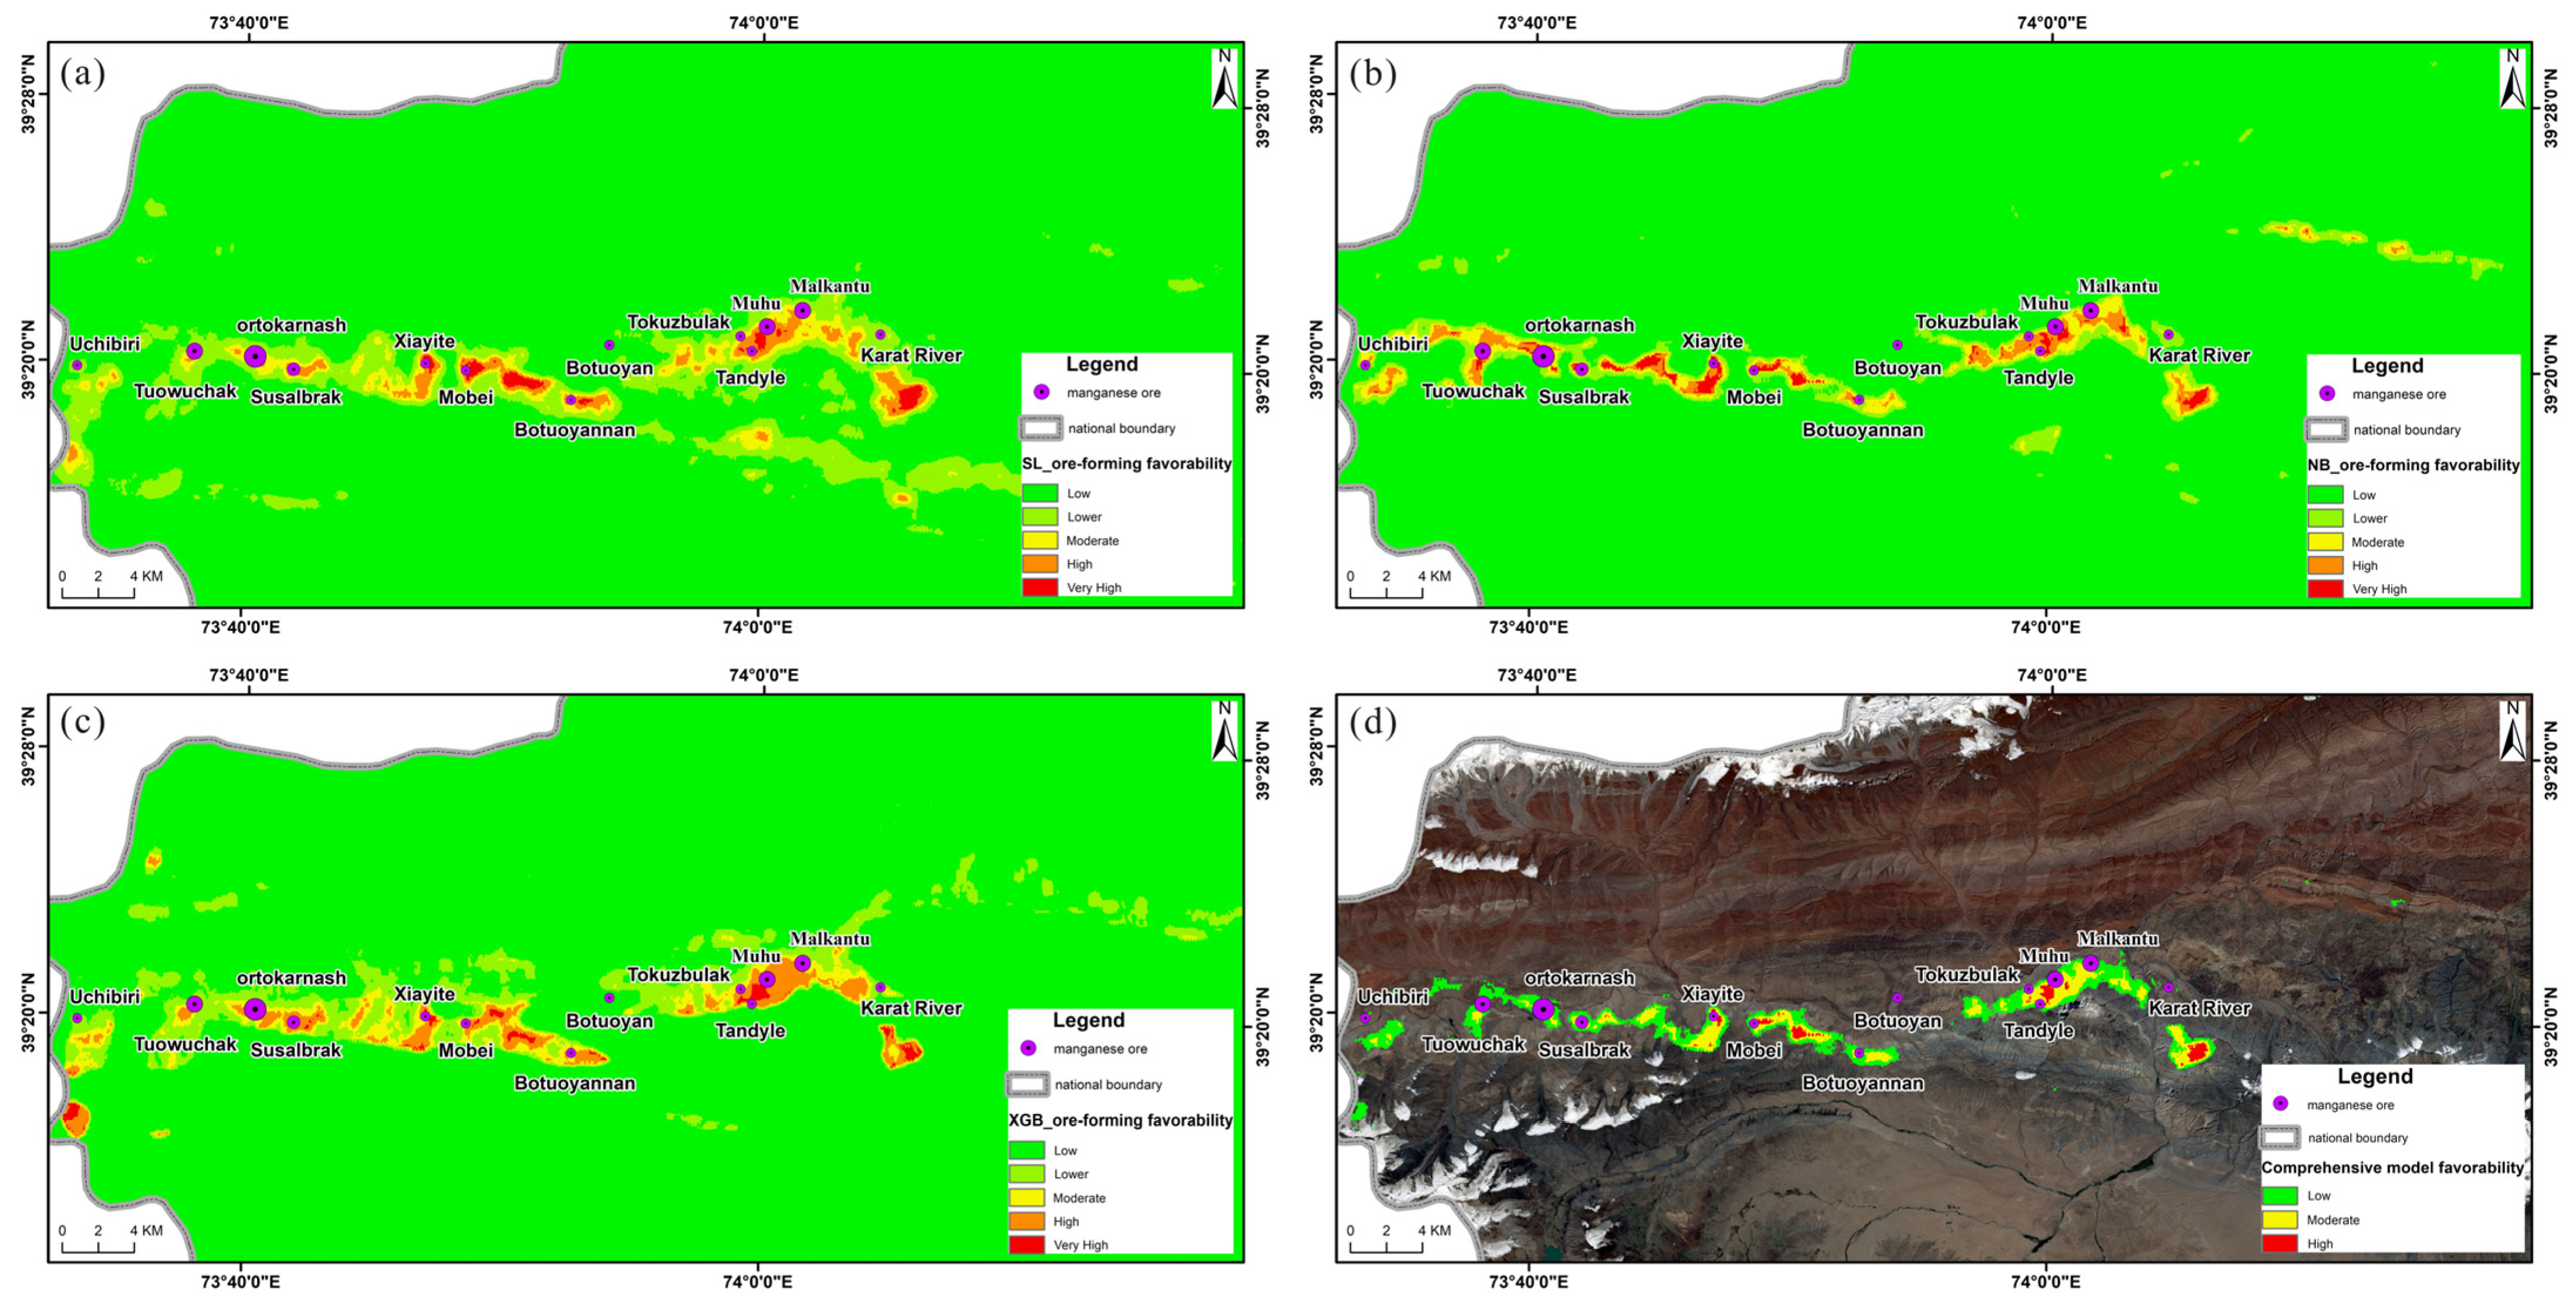
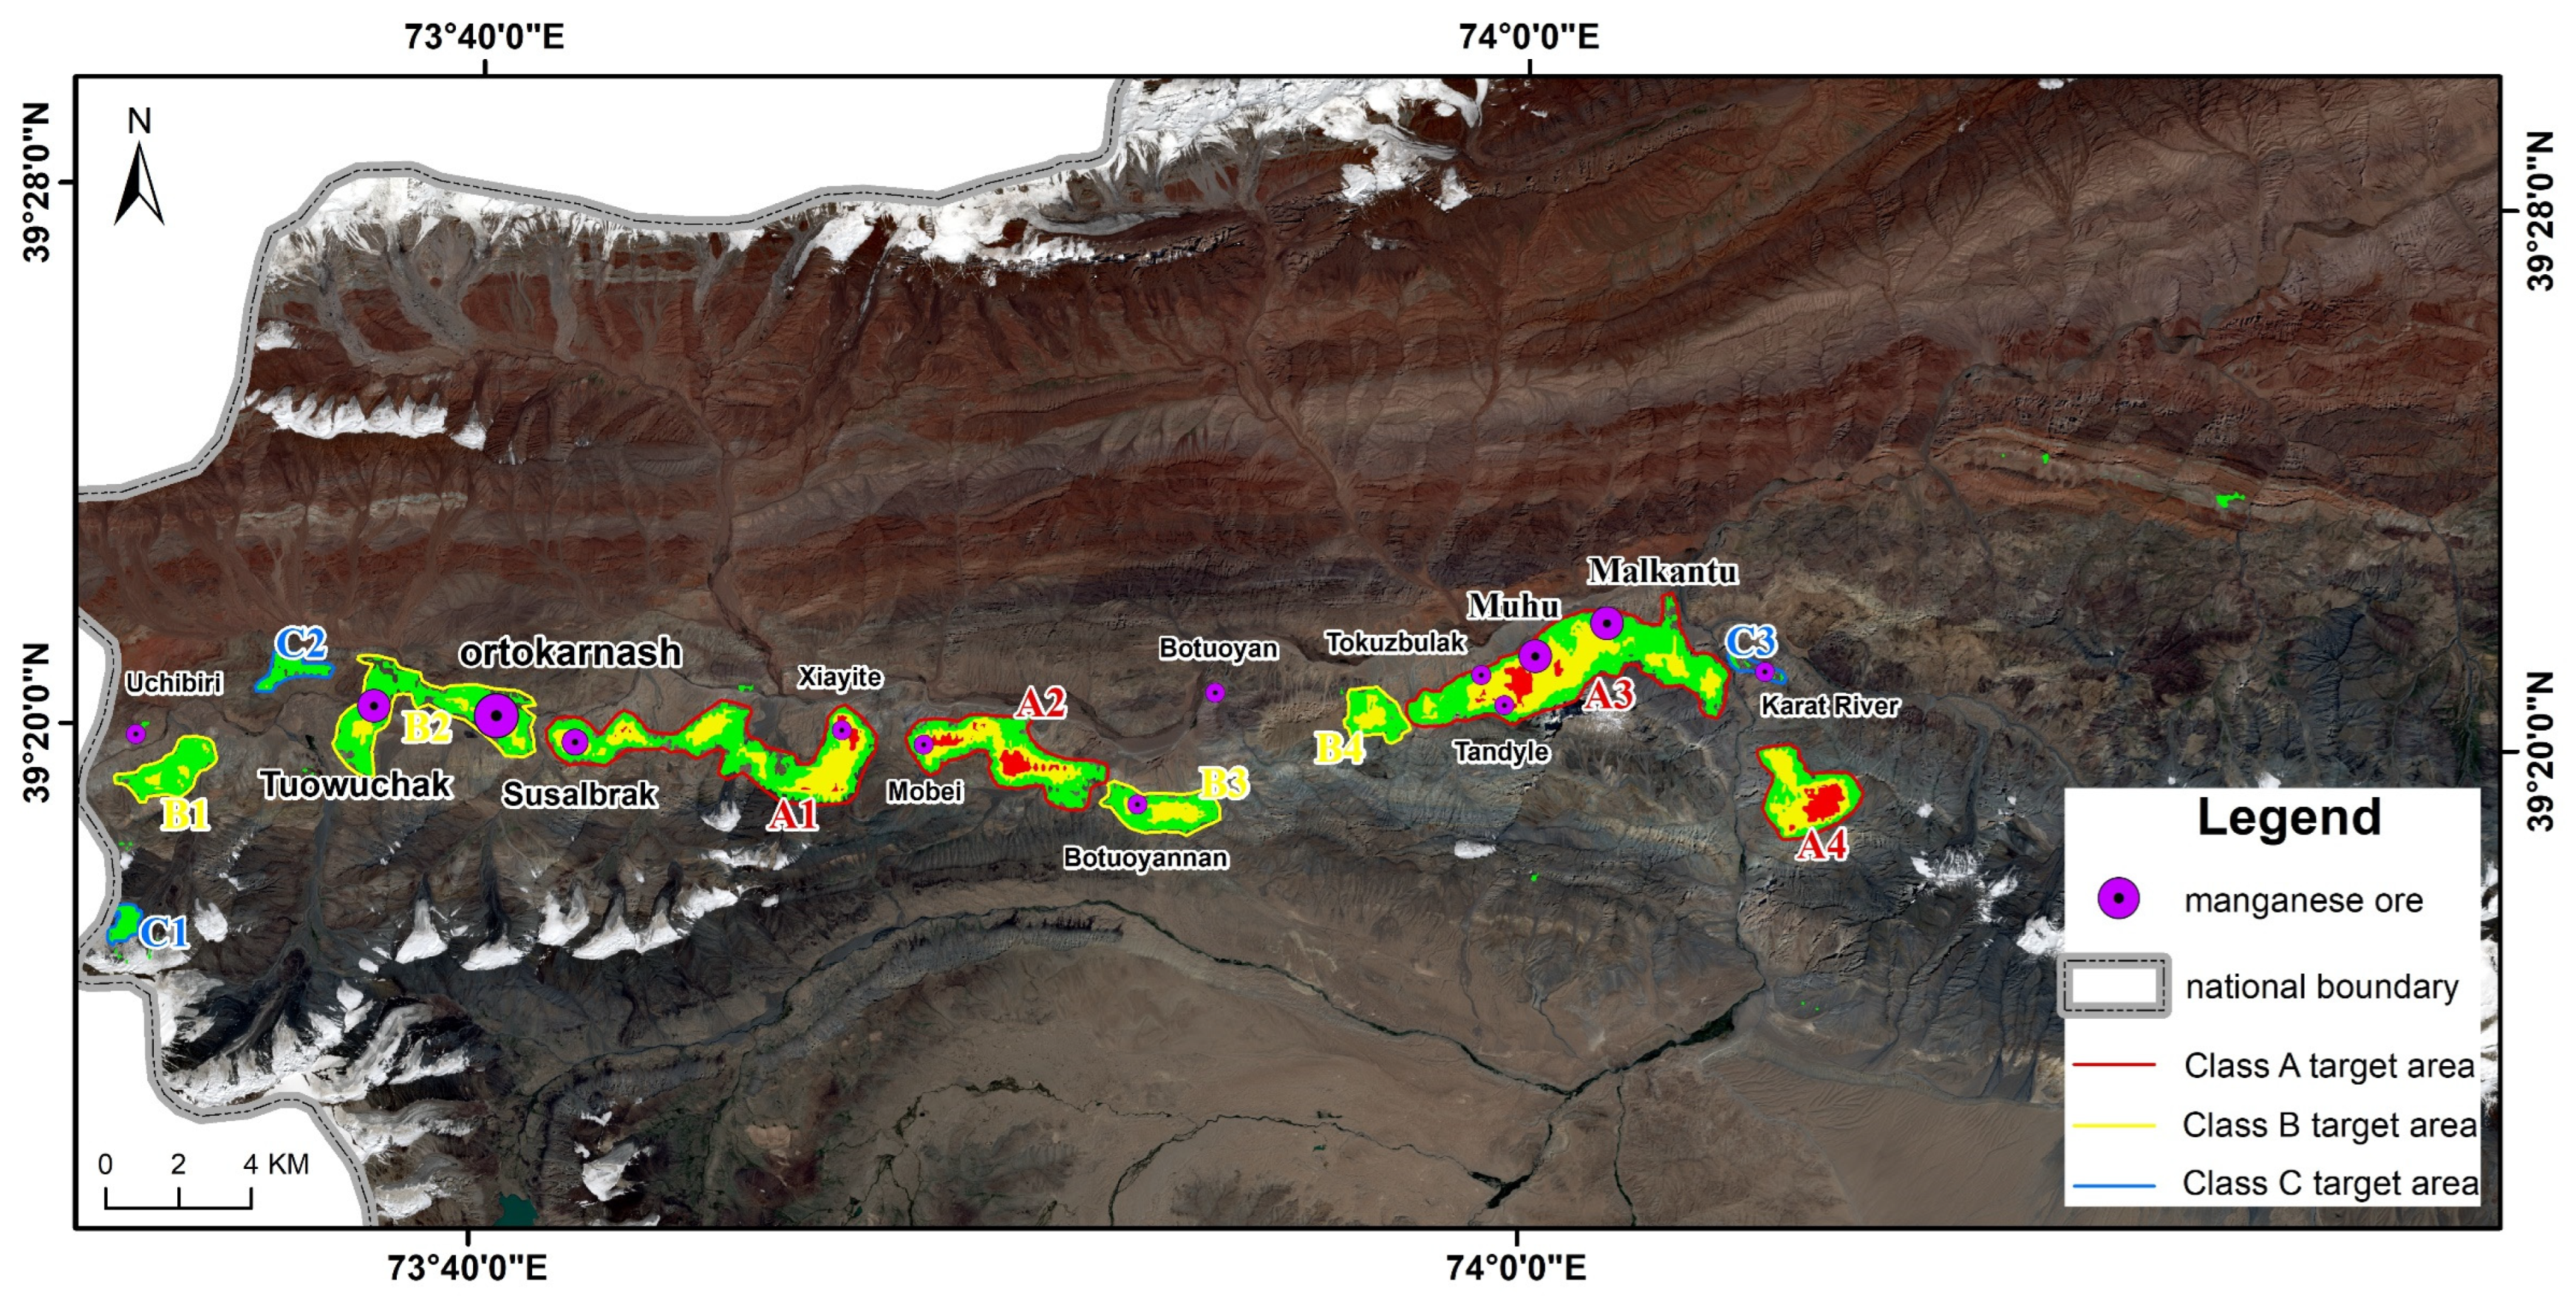
Disclaimer/Publisher’s Note: The statements, opinions and data contained in all publications are solely those of the individual author(s) and contributor(s) and not of MDPI and/or the editor(s). MDPI and/or the editor(s) disclaim responsibility for any injury to people or property resulting from any ideas, methods, instructions or products referred to in the content. |
© 2025 by the authors. Licensee MDPI, Basel, Switzerland. This article is an open access article distributed under the terms and conditions of the Creative Commons Attribution (CC BY) license (https://creativecommons.org/licenses/by/4.0/).