

Developing Characteristics of Shale Lamination and Their Impact on Reservoir Properties in the Deep Wufeng–Longmaxi Formation Shale of the Southern Sichuan Basin

Abstract
1. Introduction
2. Geological Background
3. Materials and Methods
3.1. Elemental Analysis
3.2. Microscopic Observations
3.3. Organic Petrologic Analysis
3.4. Mineral Composition Analysis
3.5. Pore Structure Analysis
4. Results
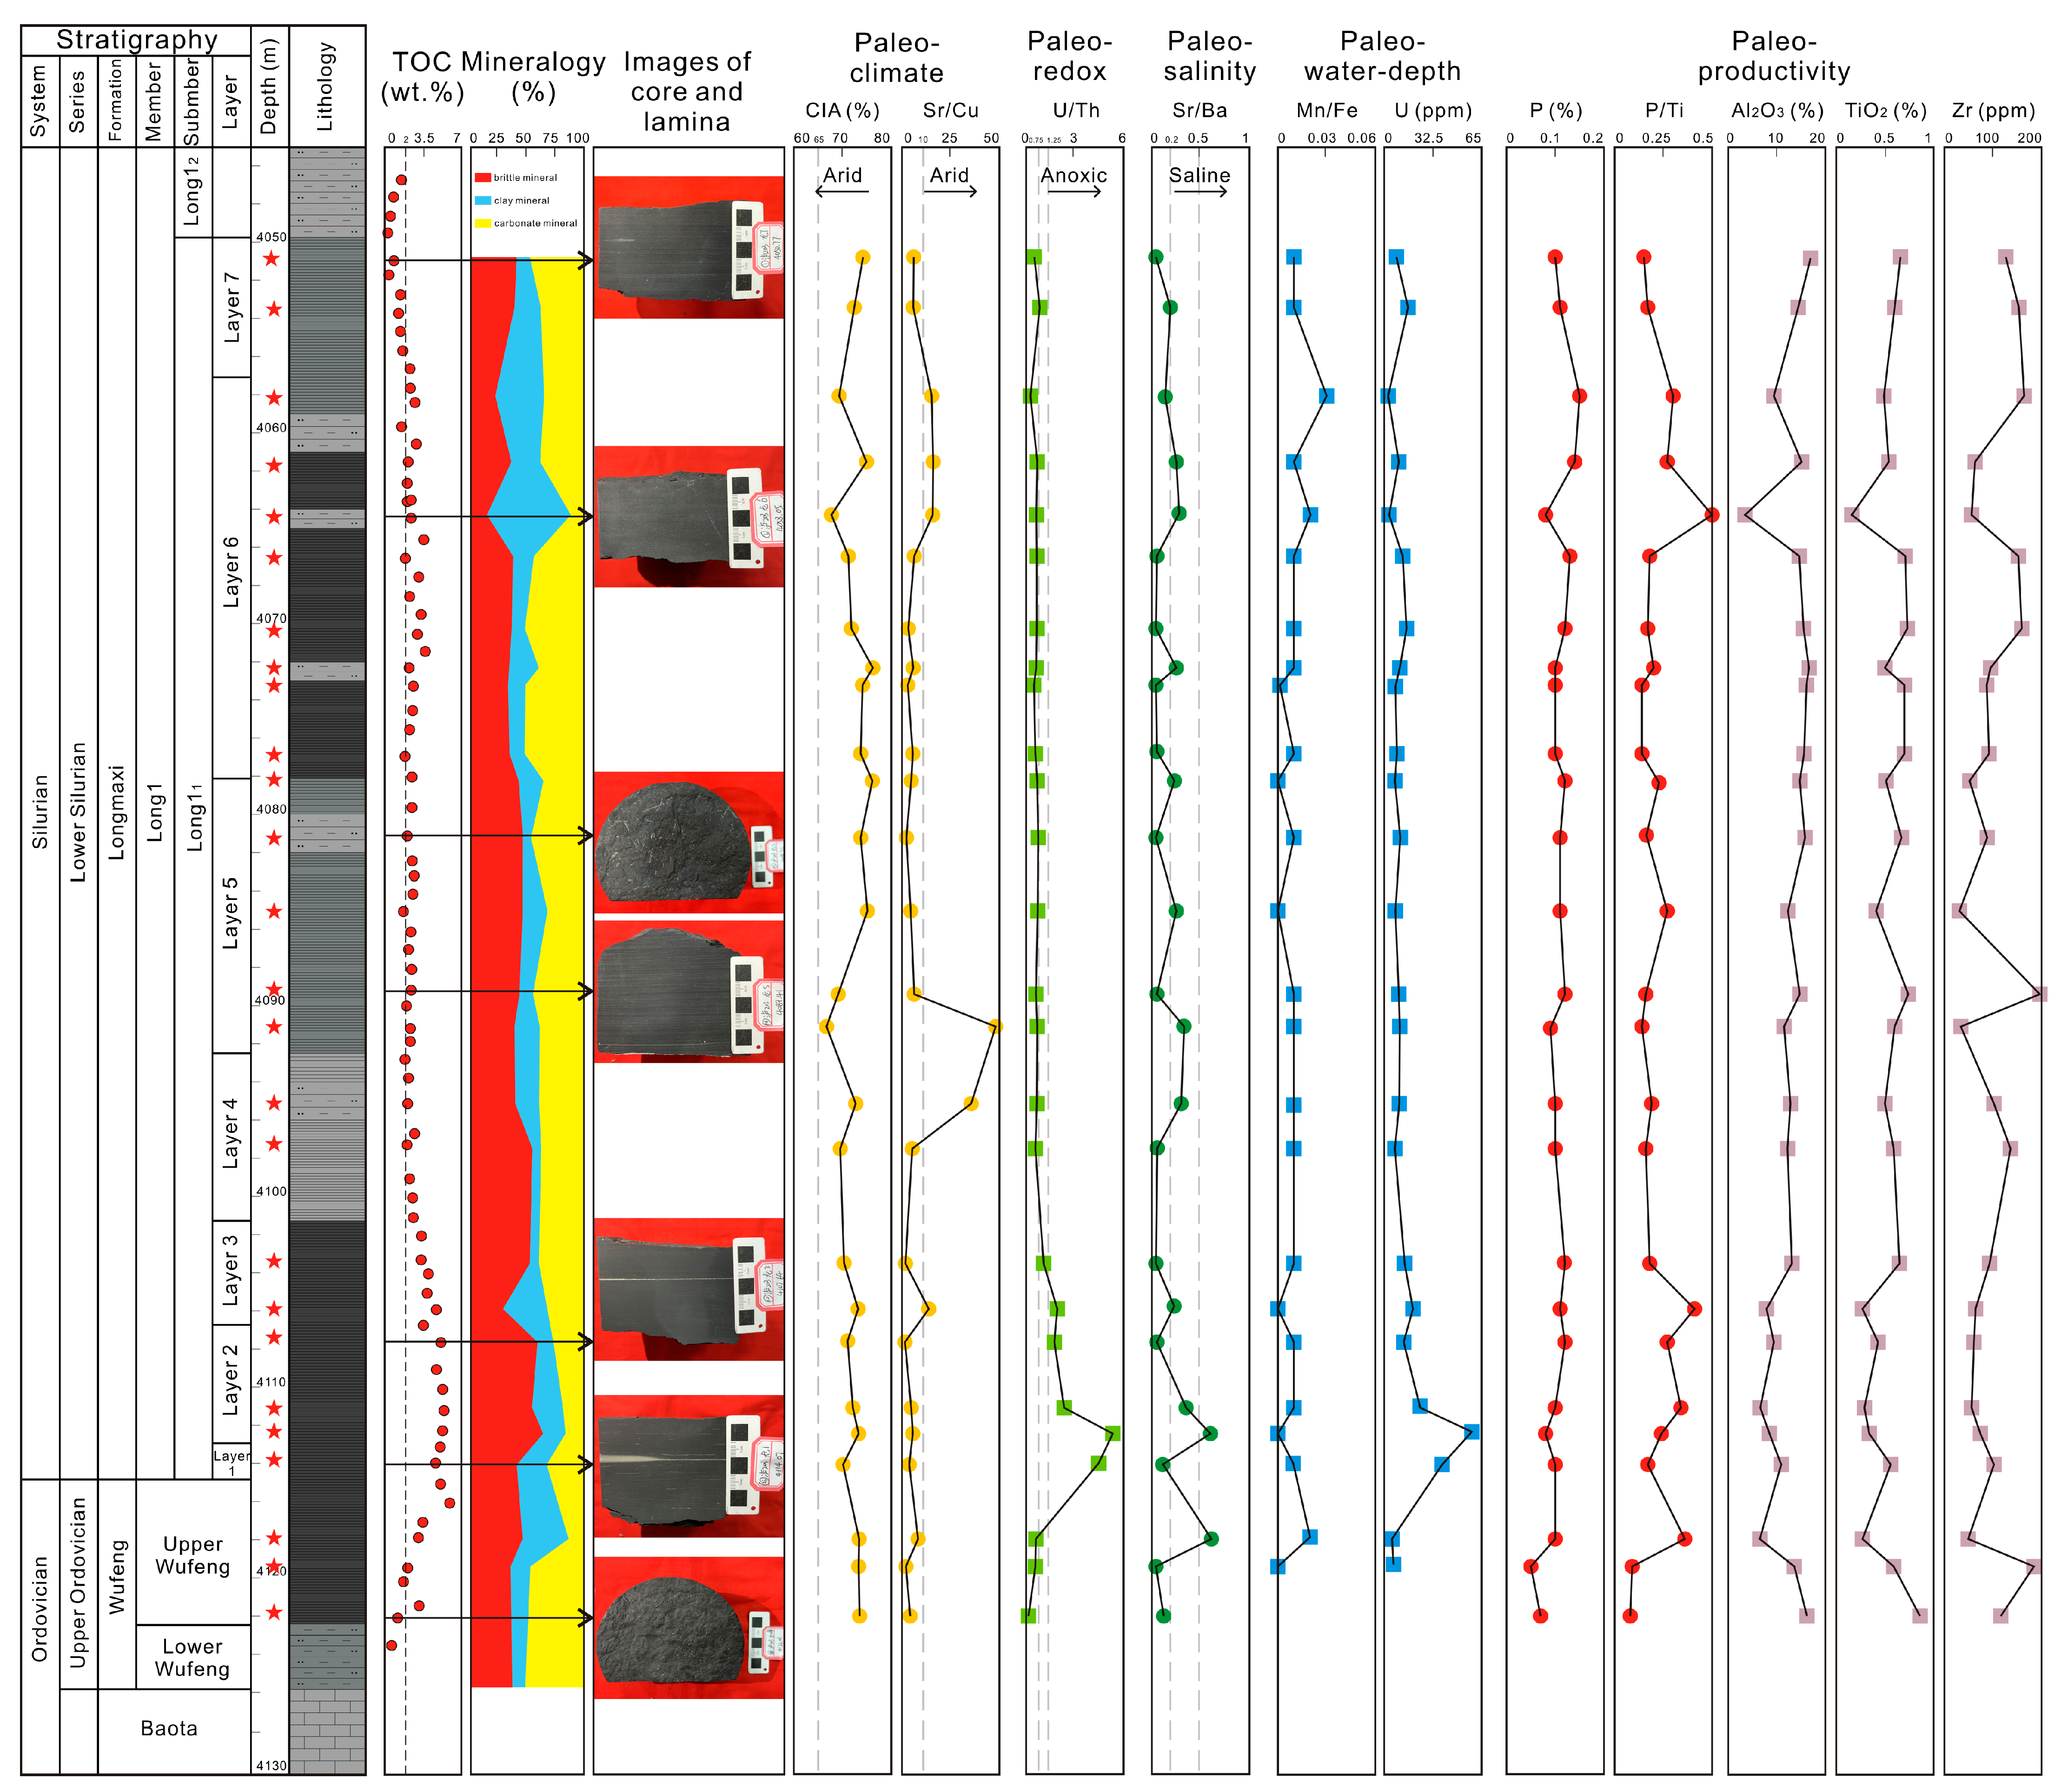
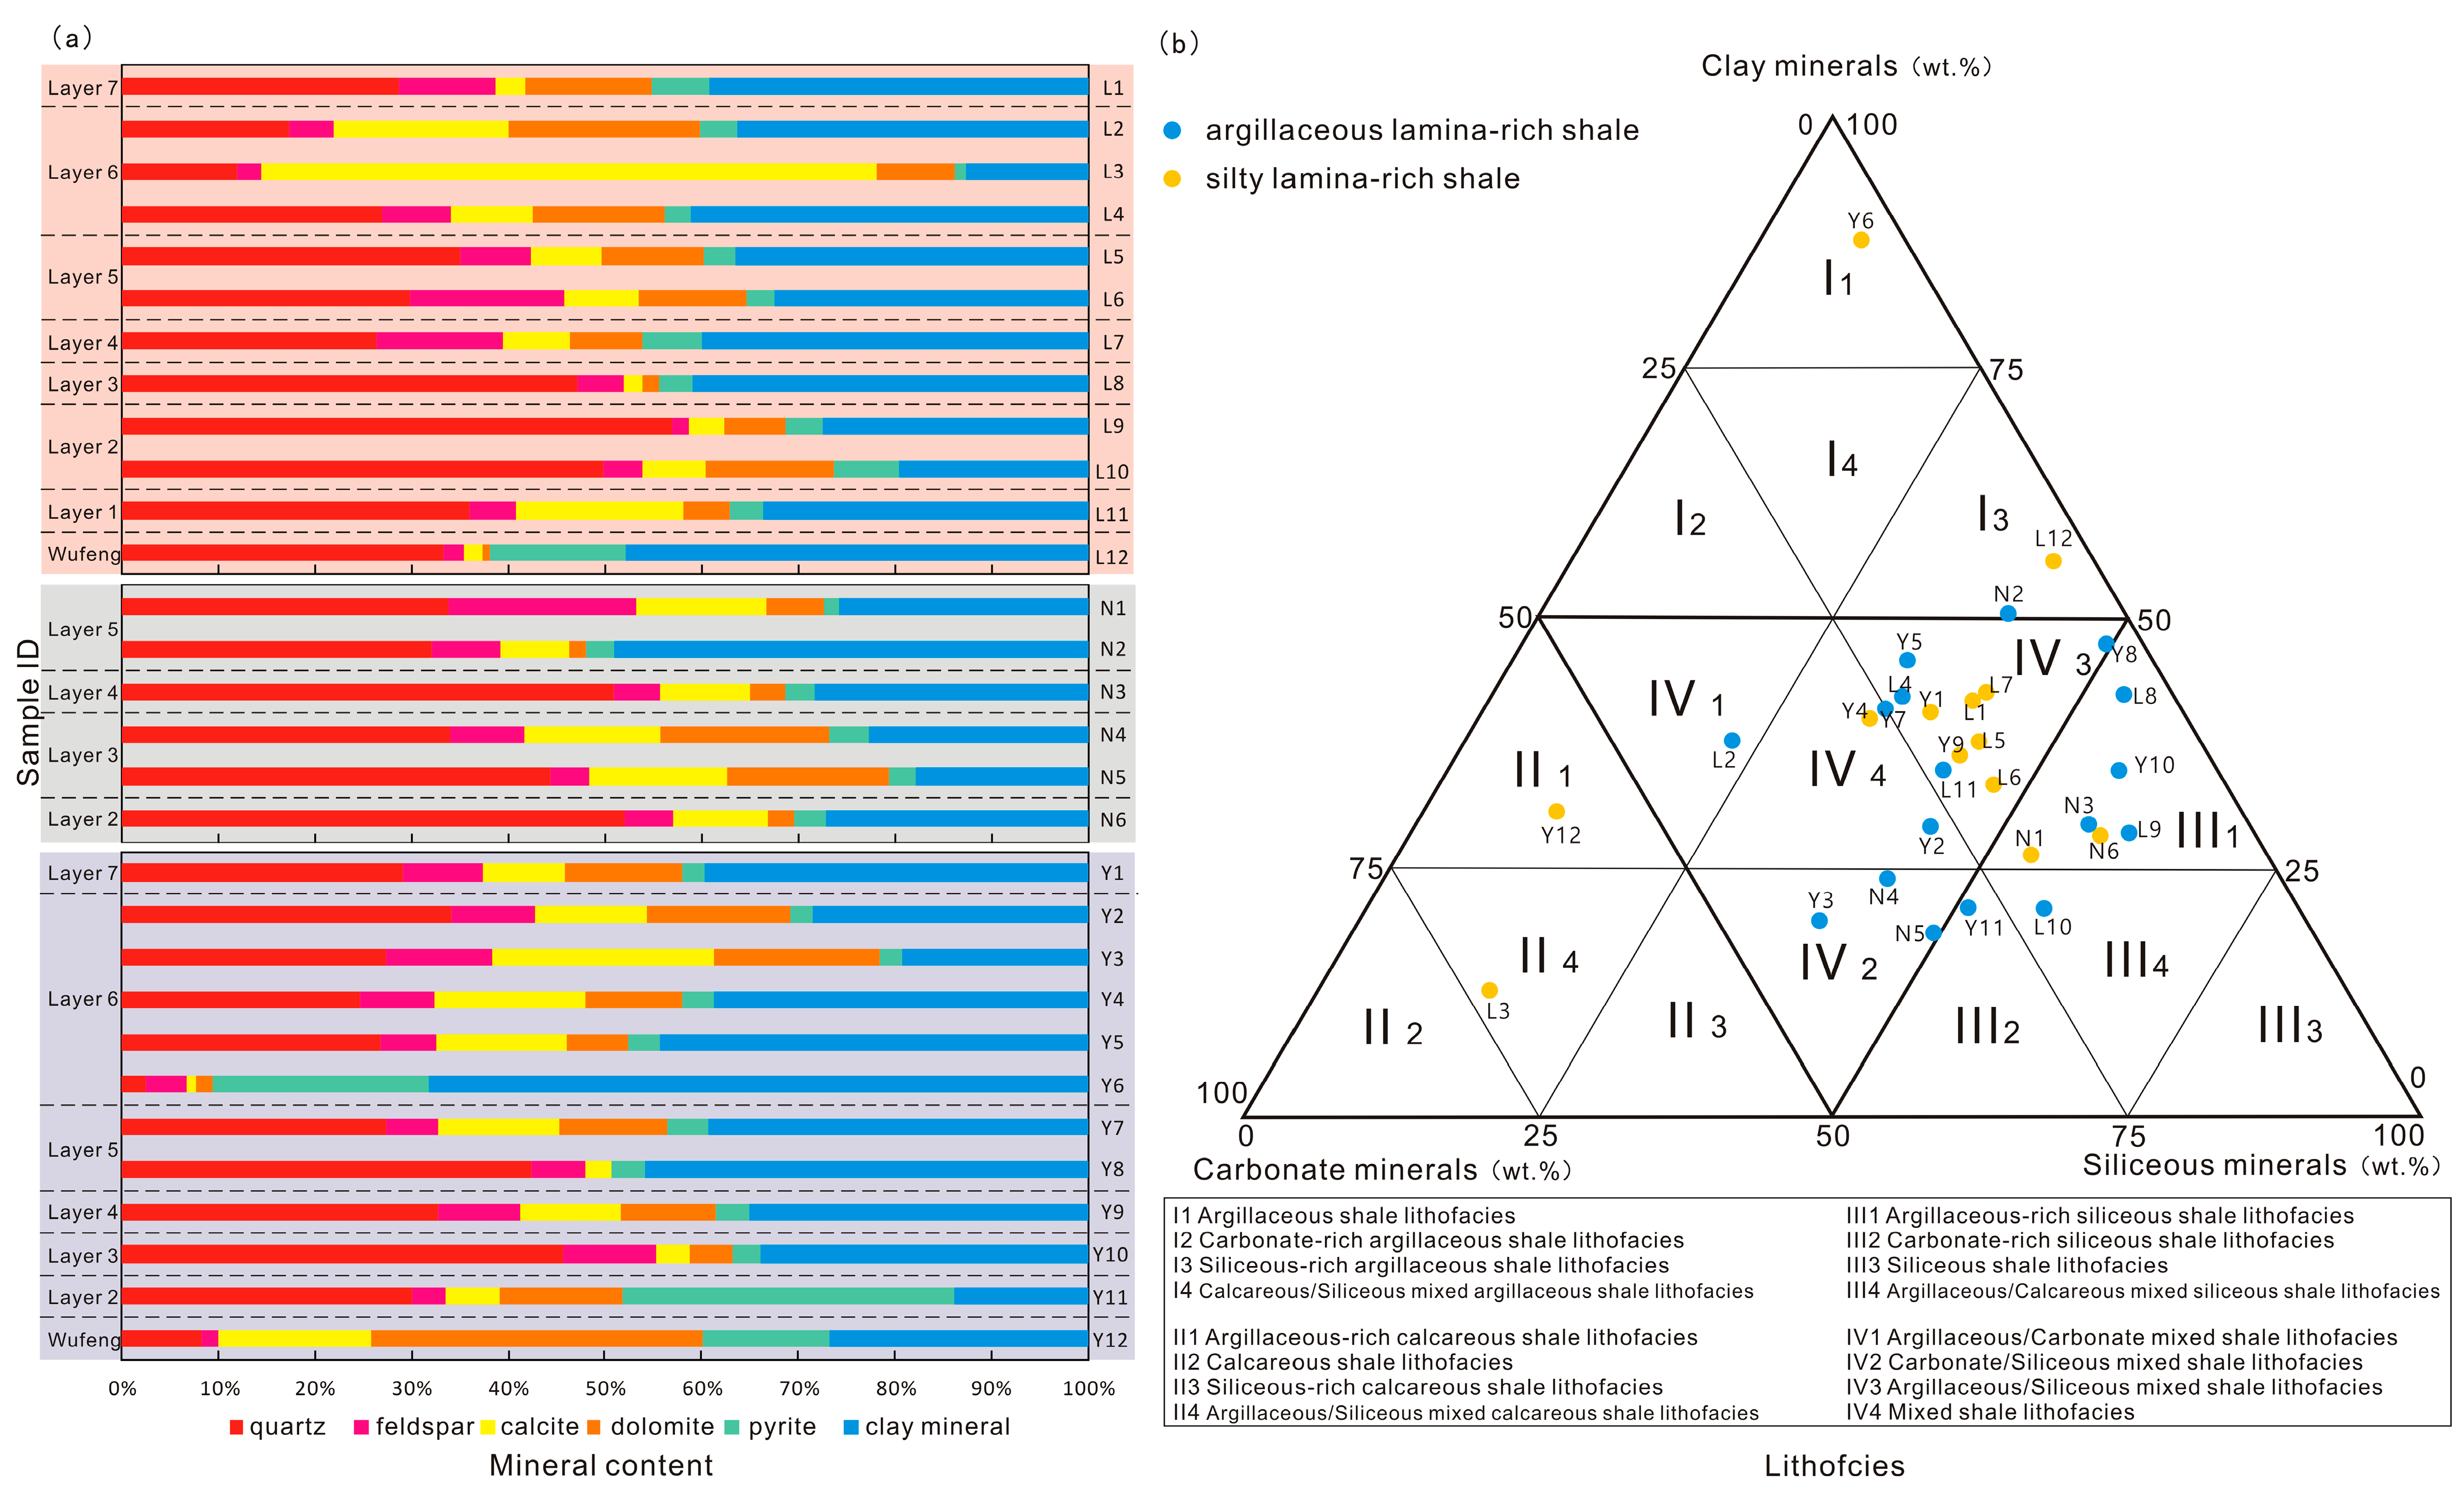
4.1. Shale Lithological and Mineralogical Characteristics
4.2. Shale Sedimentary Environment
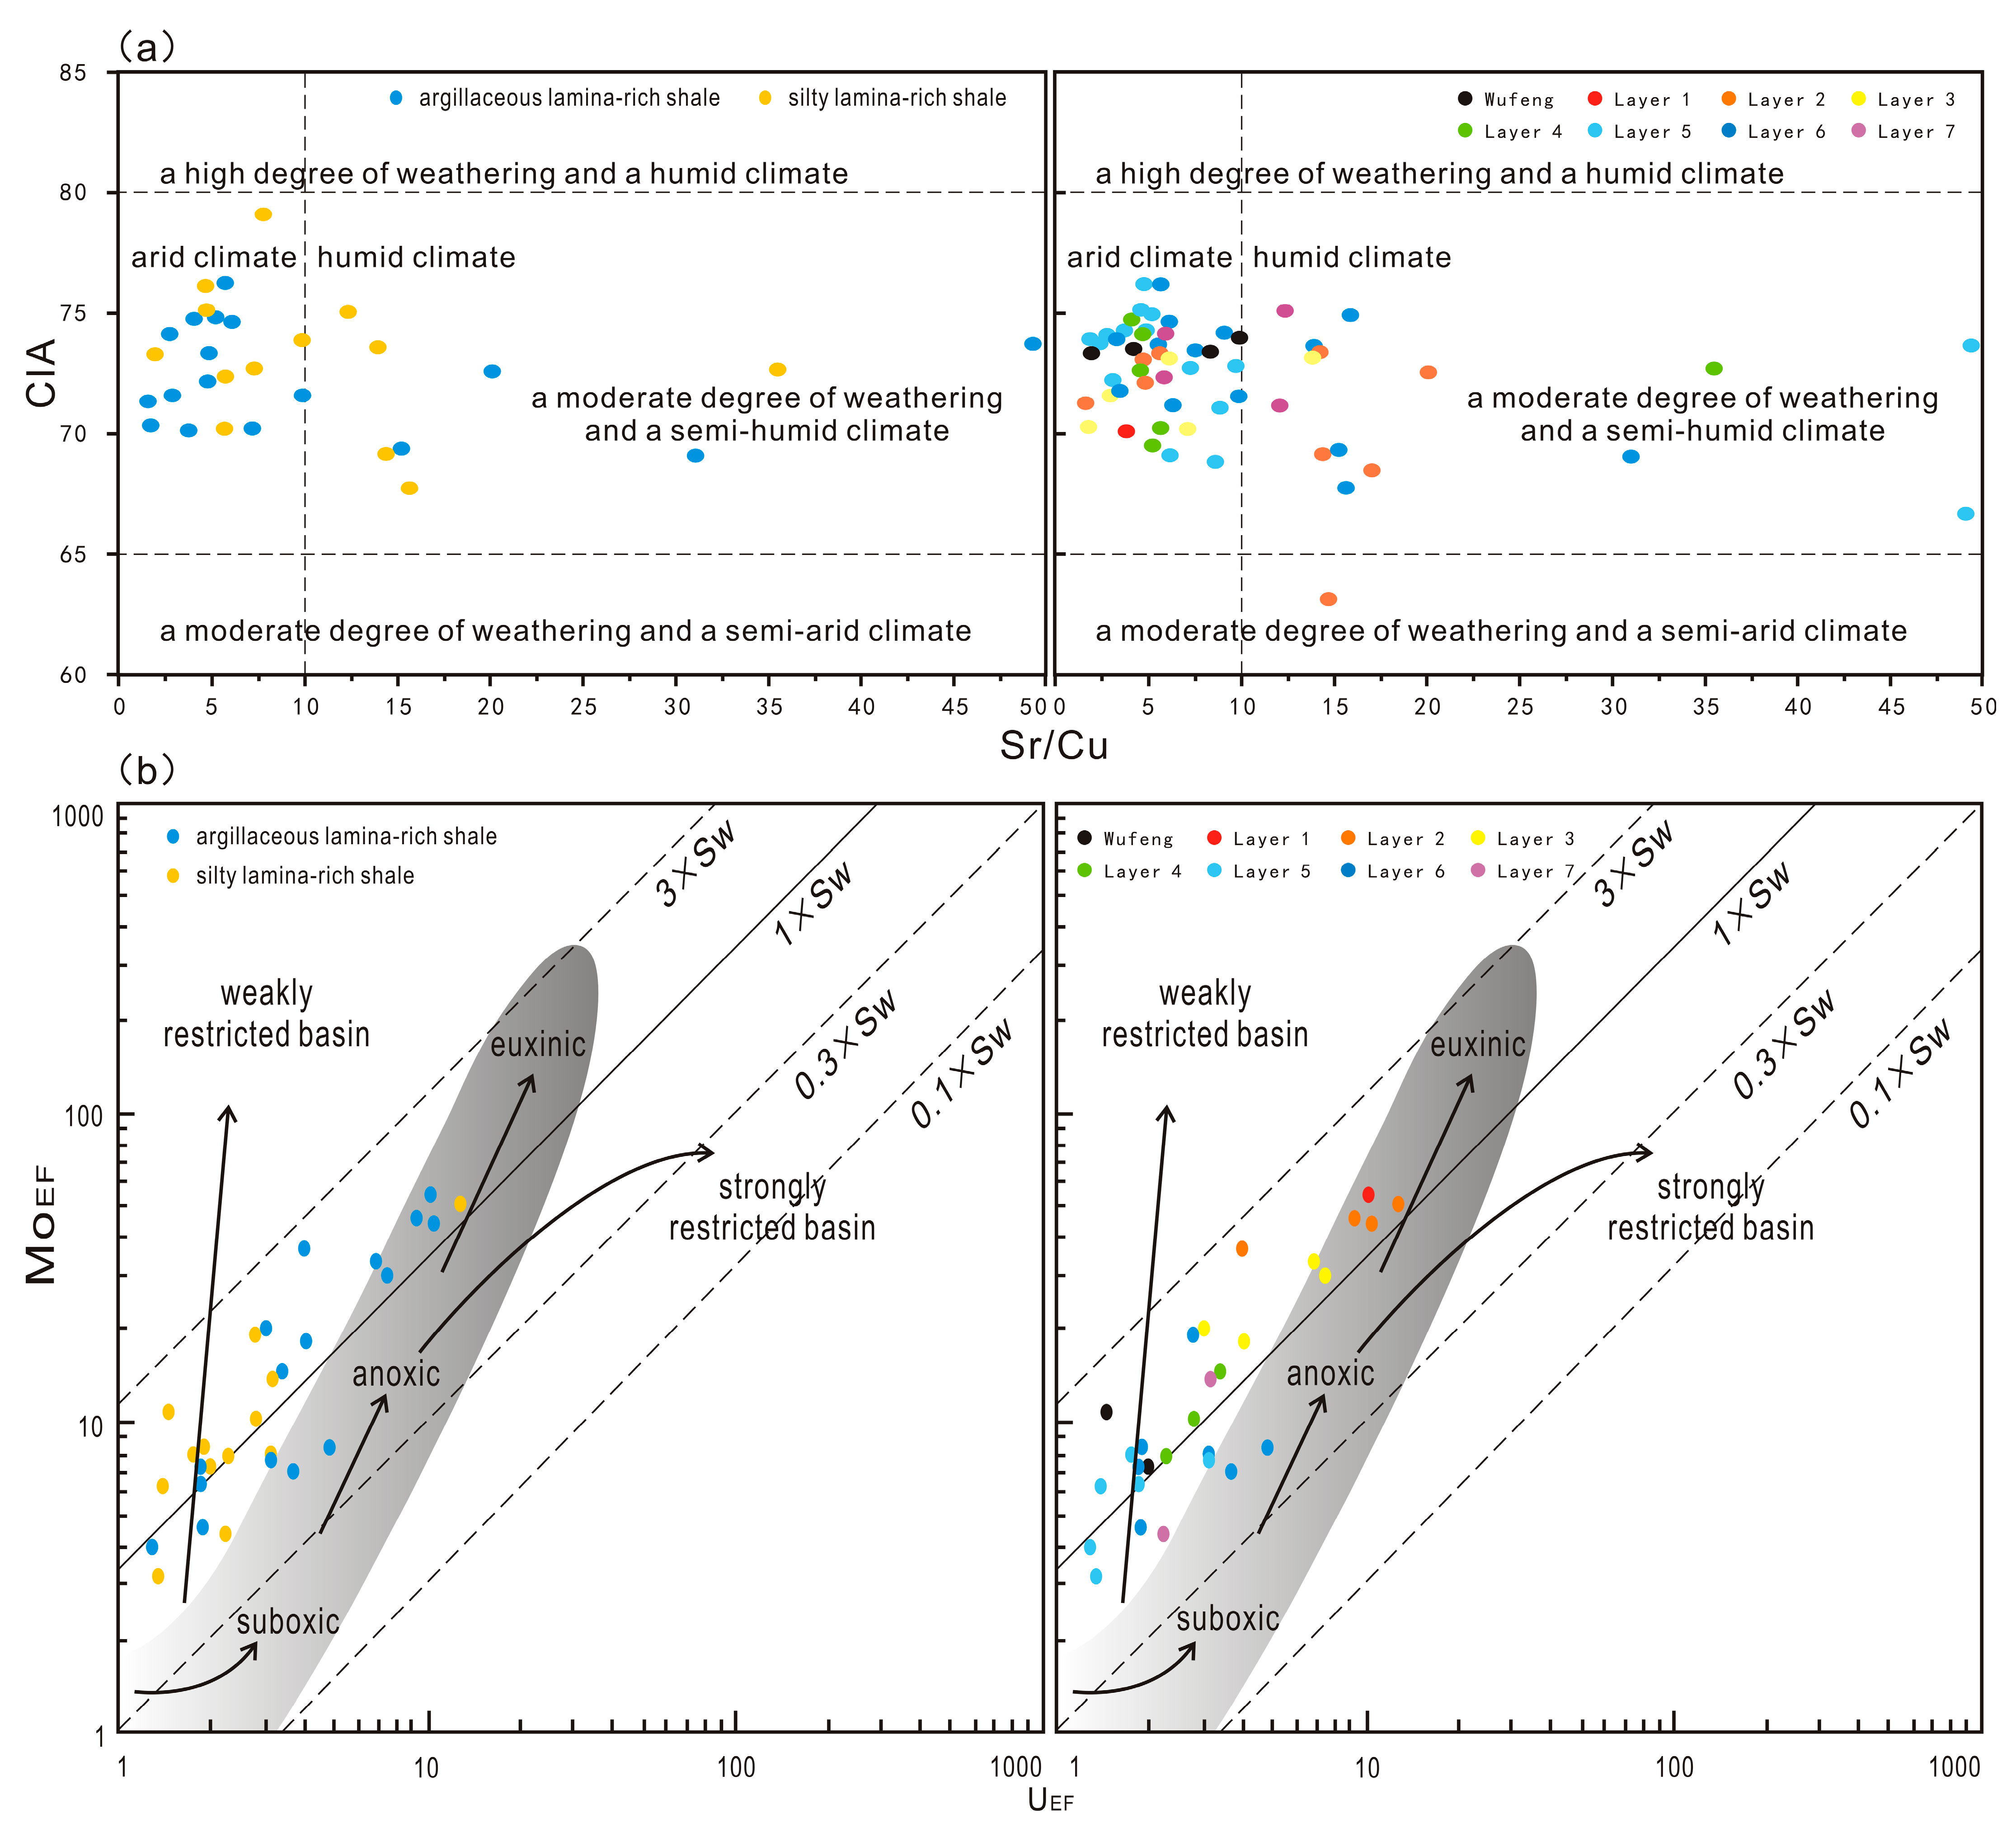
4.2.1. Paleoclimate
4.2.2. Paleoredox Conditions
4.2.3. Paleowater Depth, Paleosalinity, and Paleoproductivity
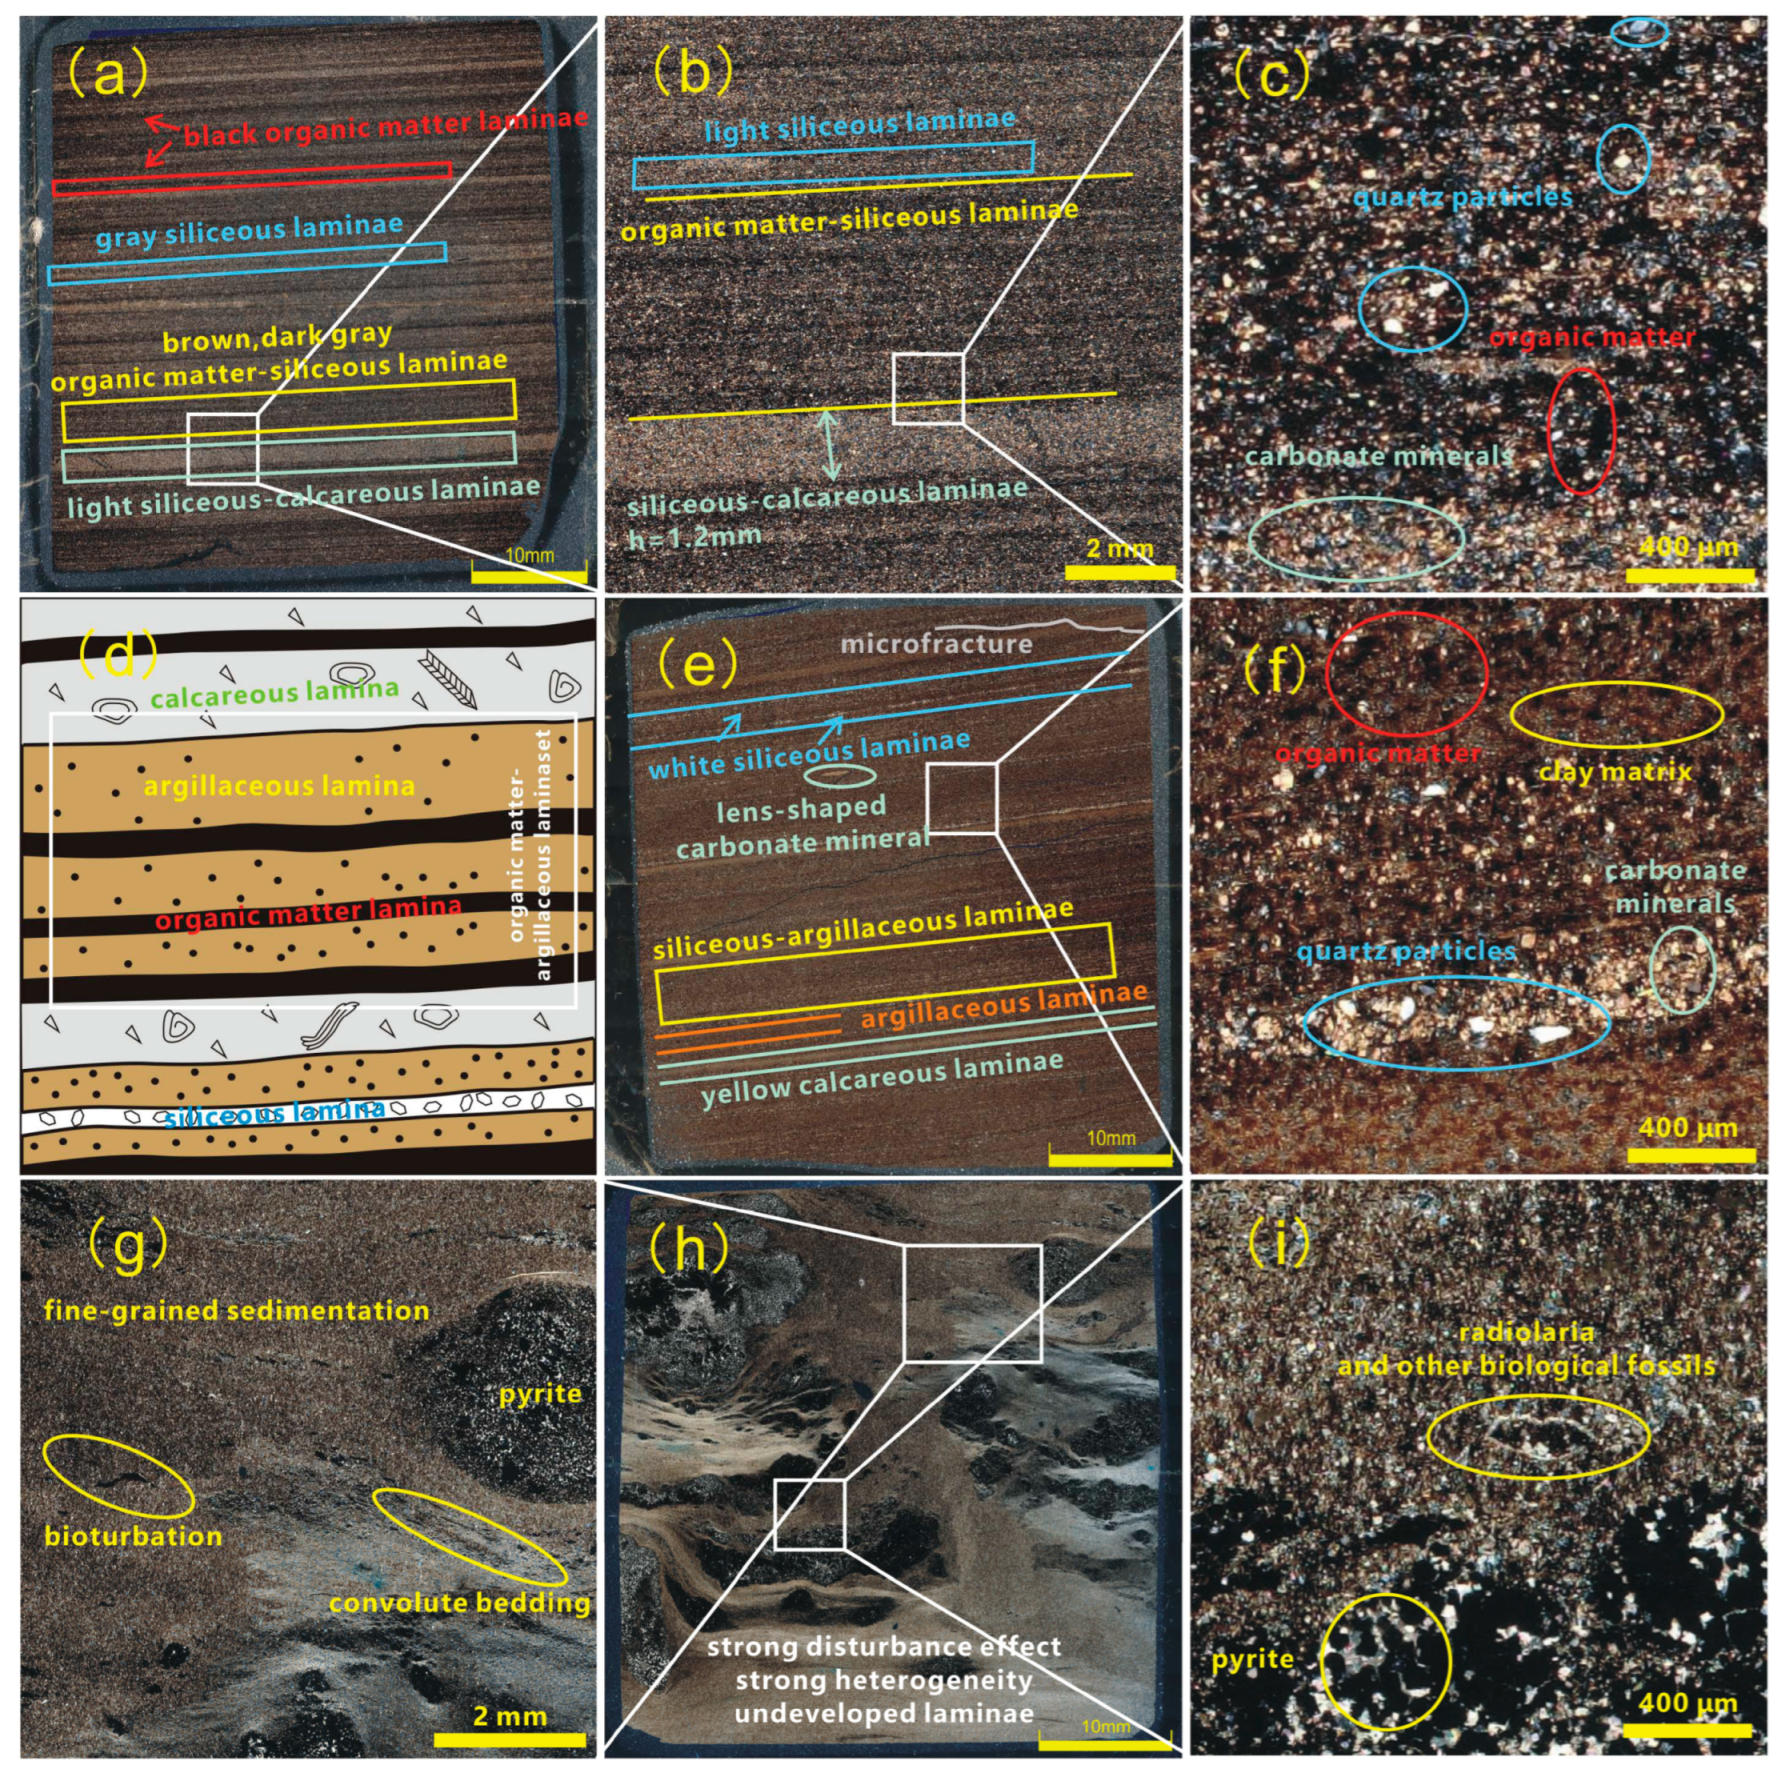
4.3. Lamination Characterization
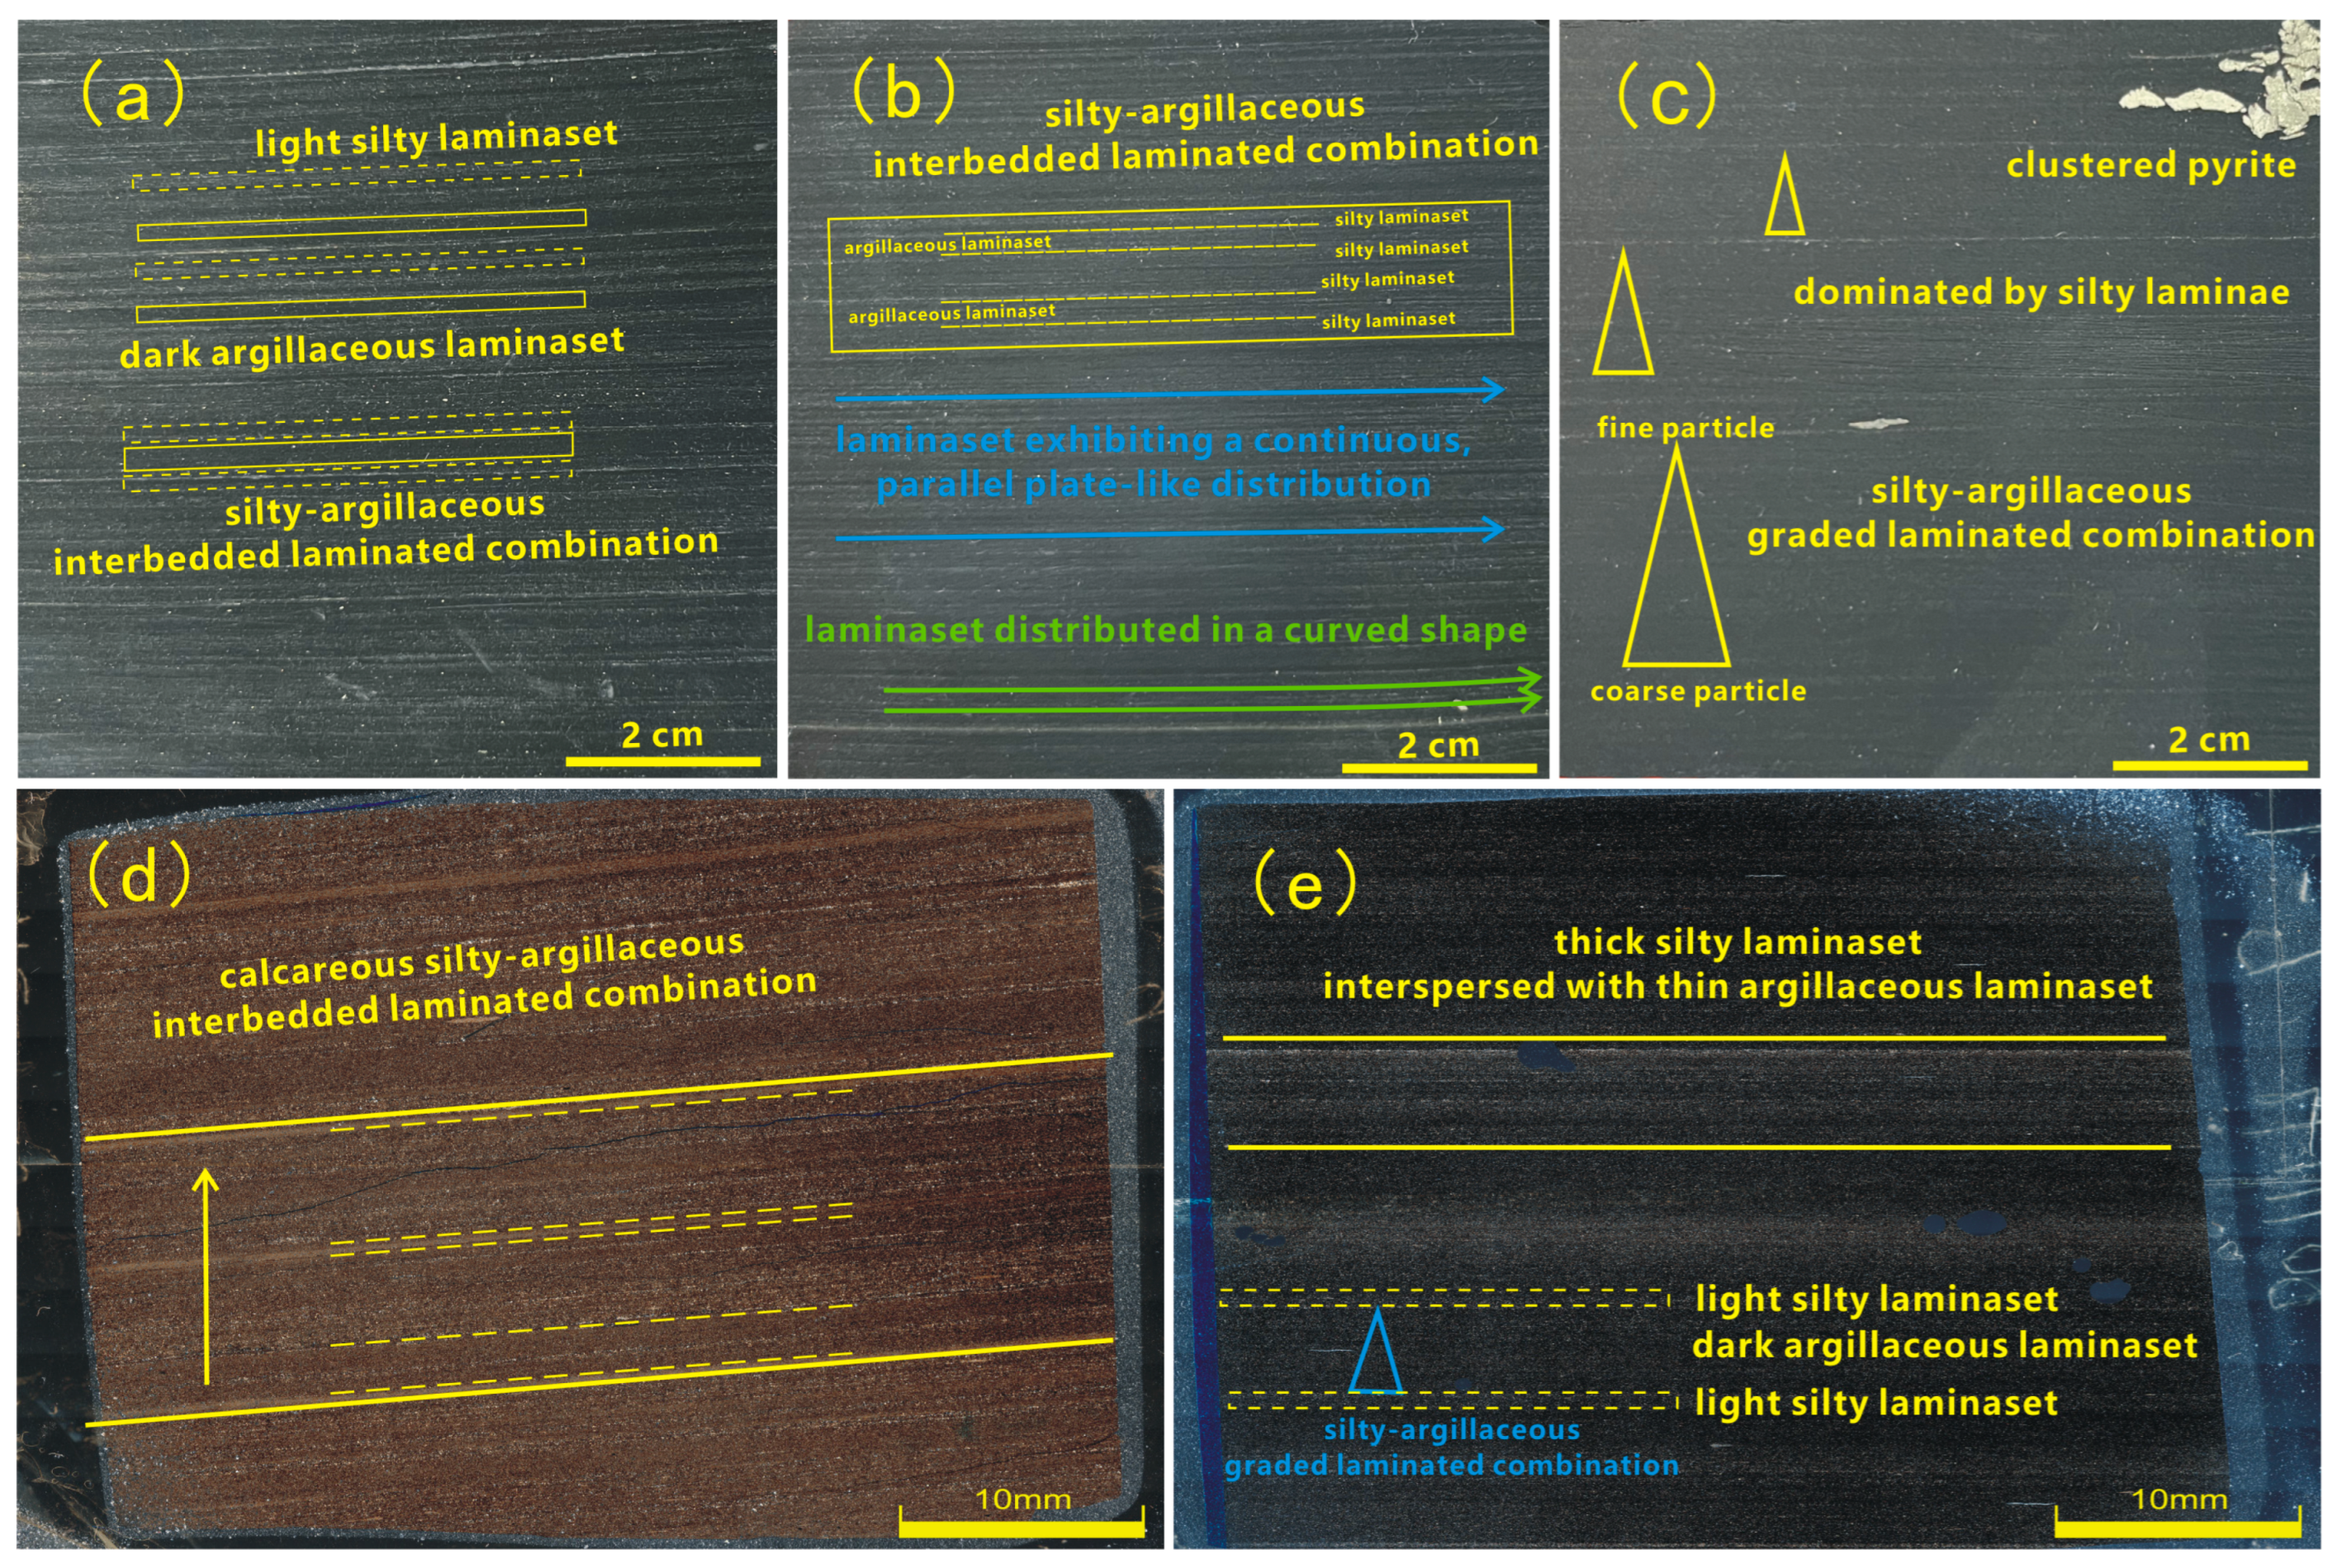
4.3.1. Composition, Texture and Structure of Lamina
4.3.2. Composition, Texture and Structure of the Laminaset
4.4. Shale Reservoir Characterization
4.4.1. Organic Geochemical Characteristics
4.4.2. Porosity
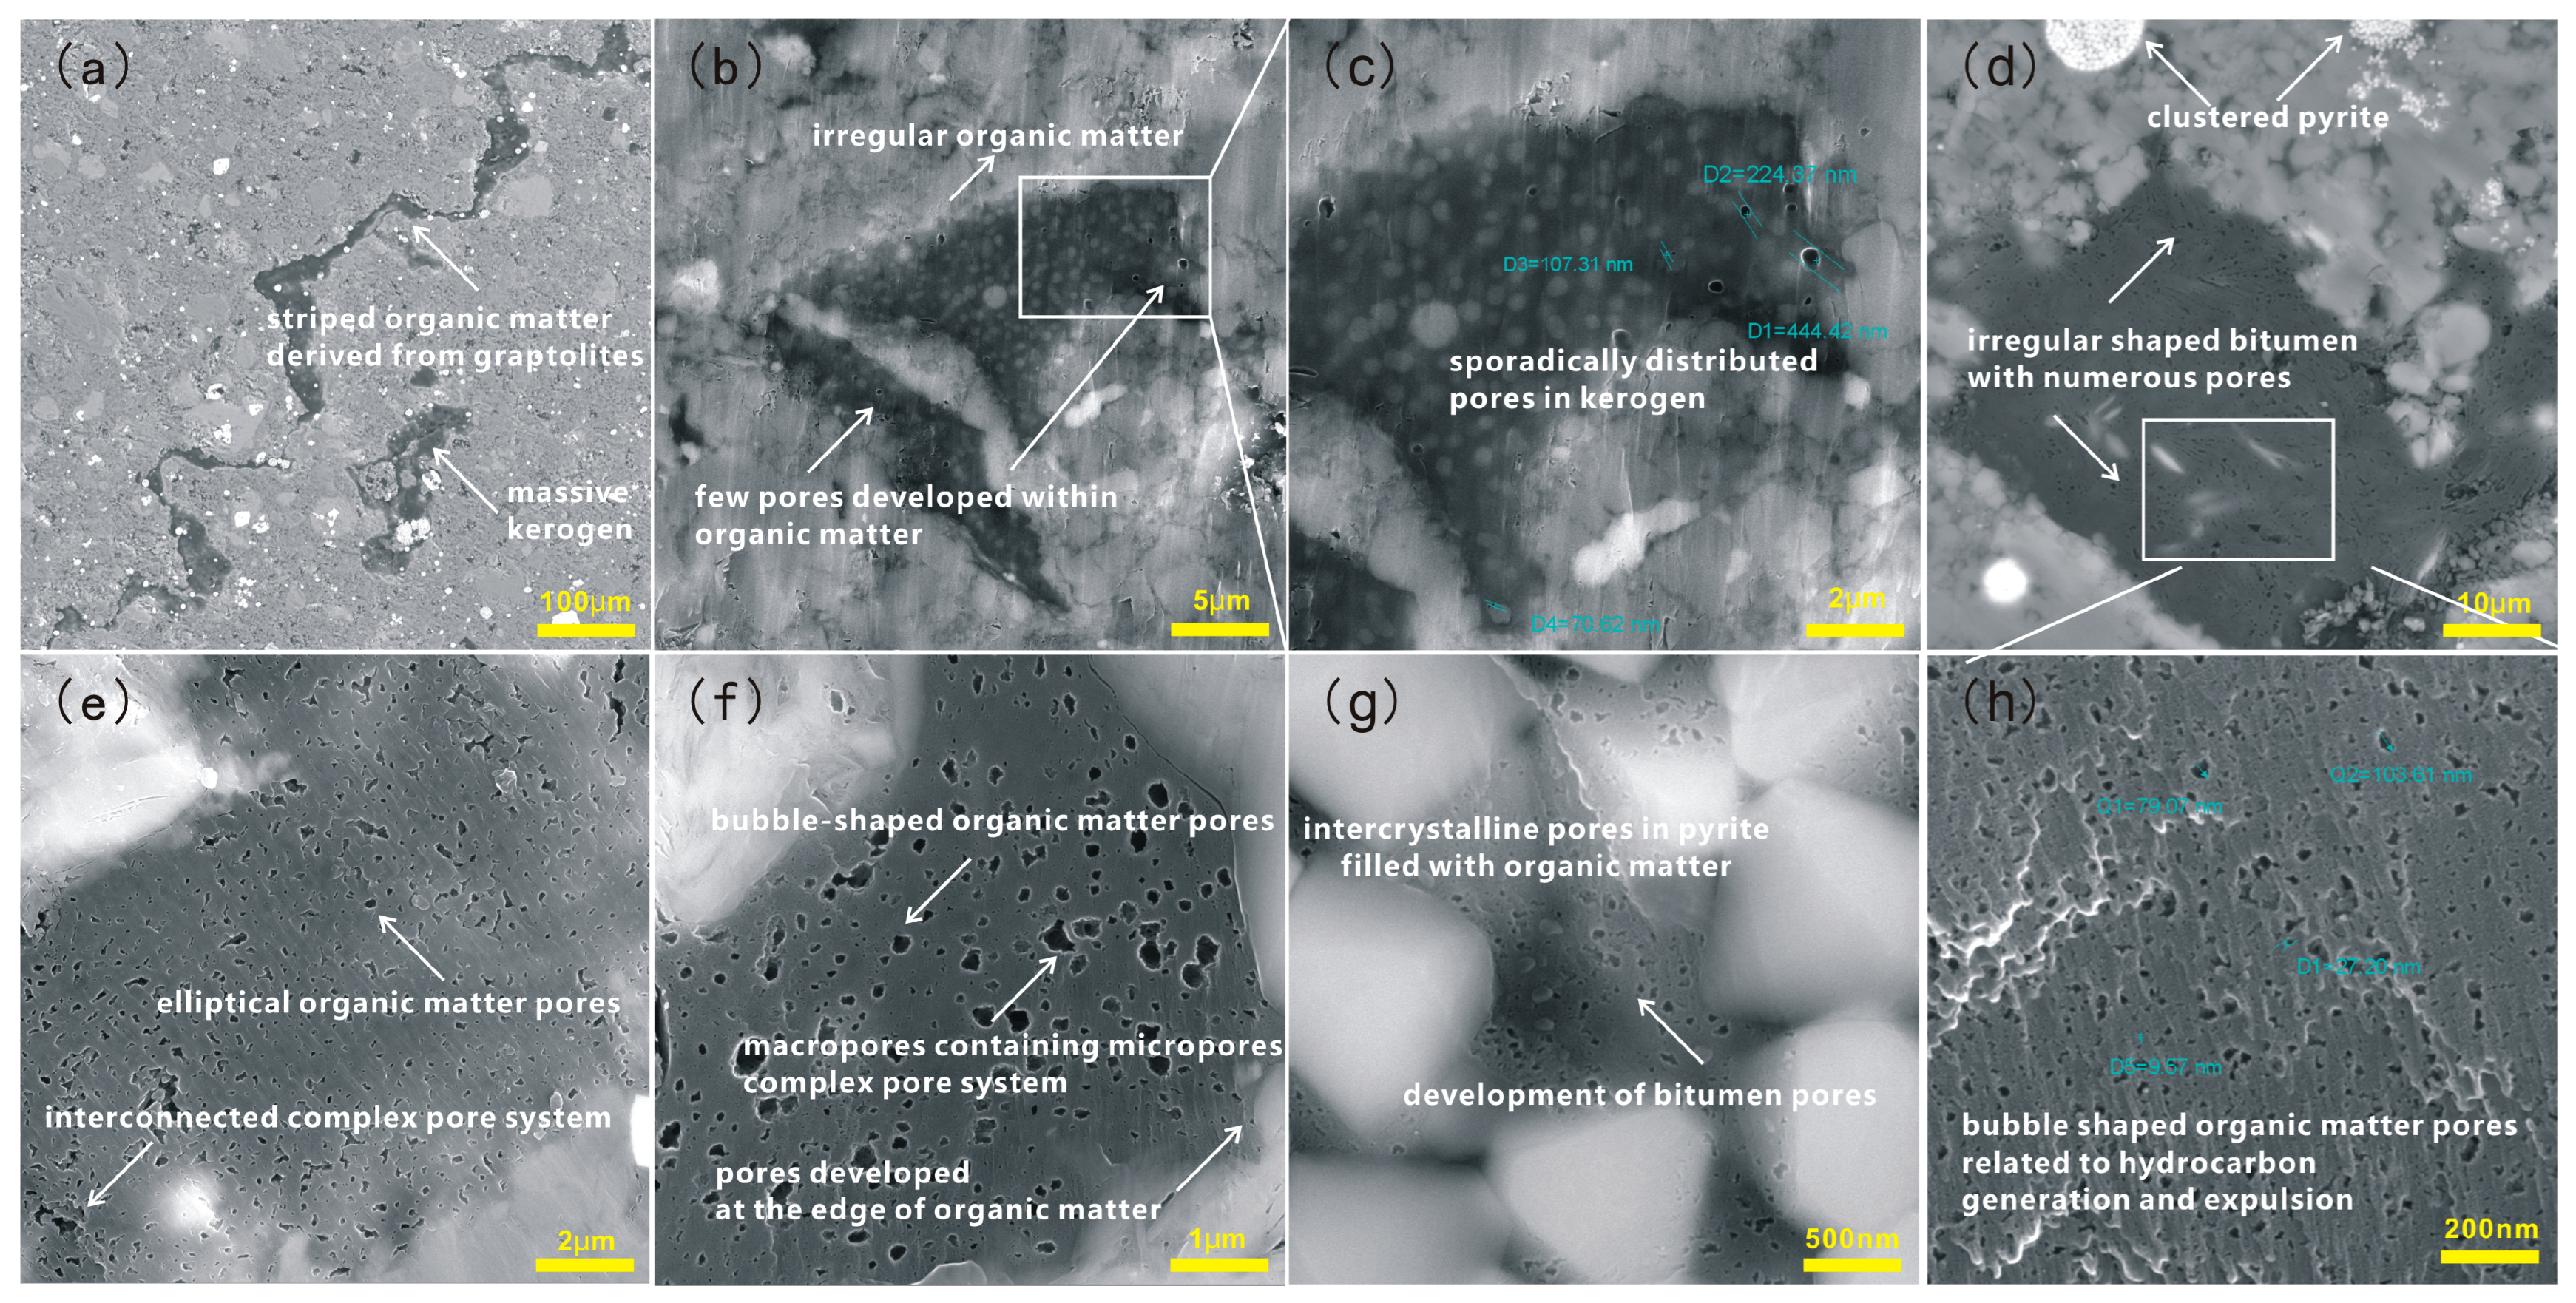
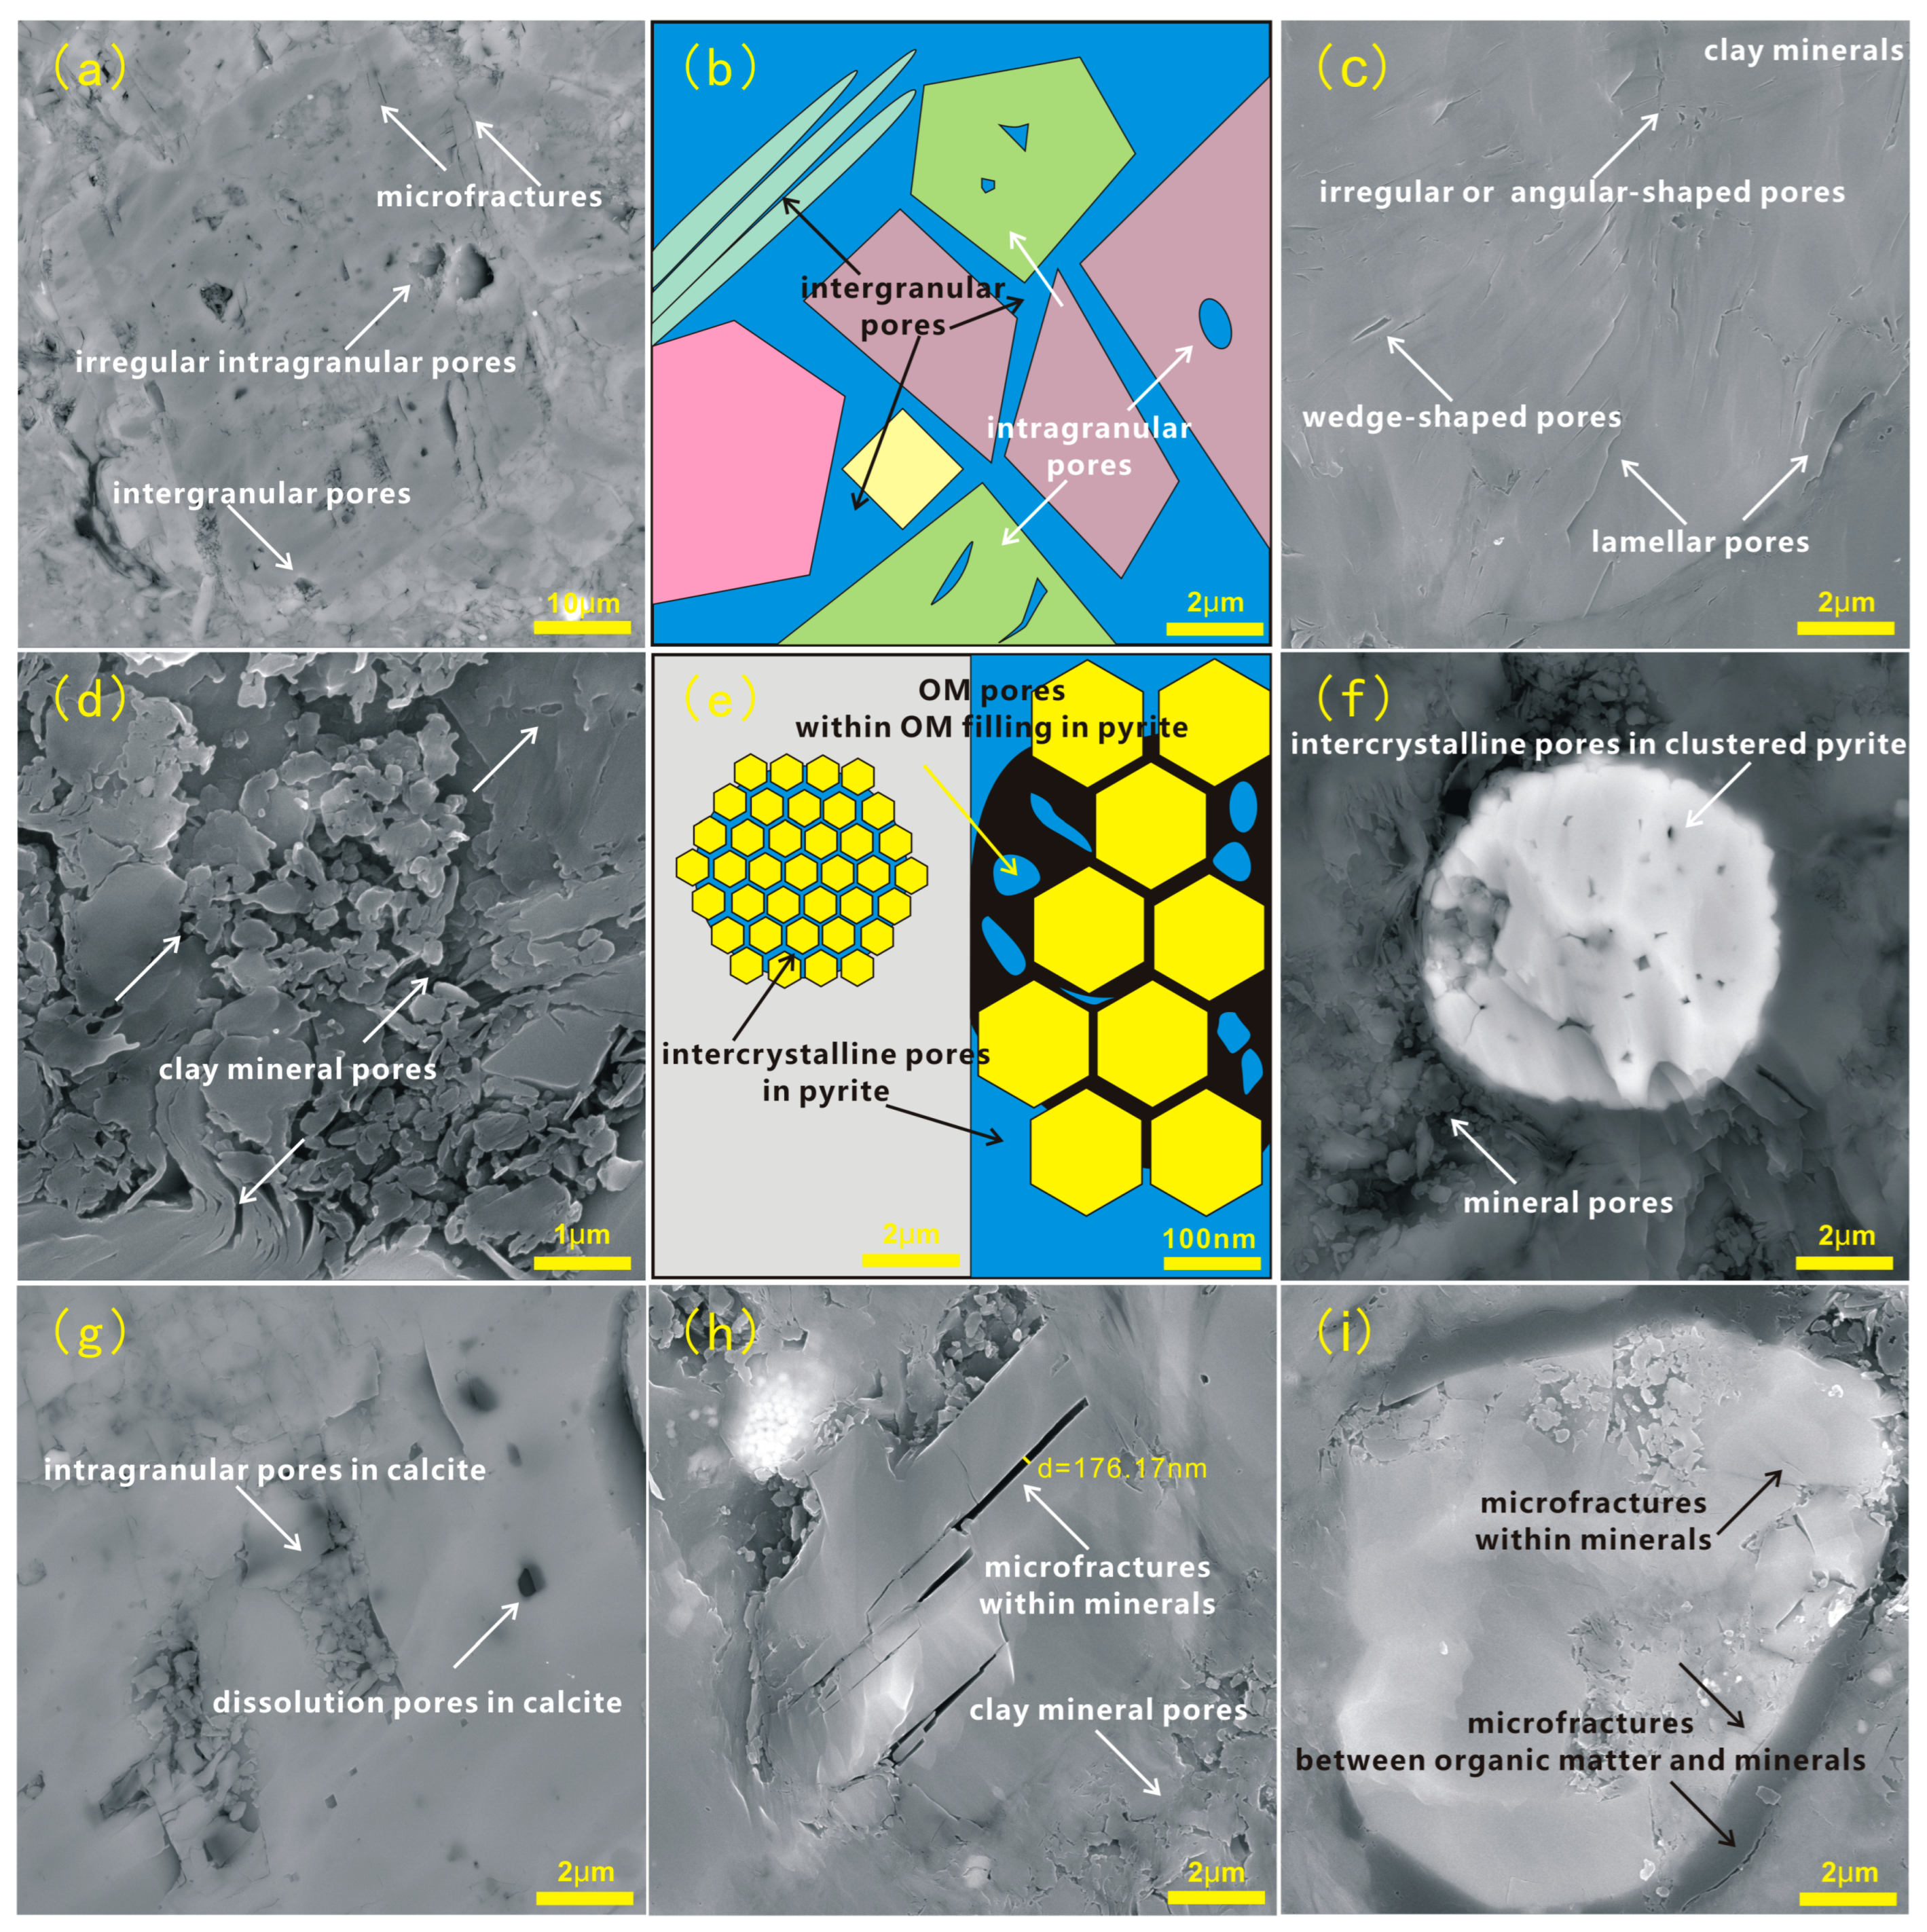
4.4.3. Pore Type
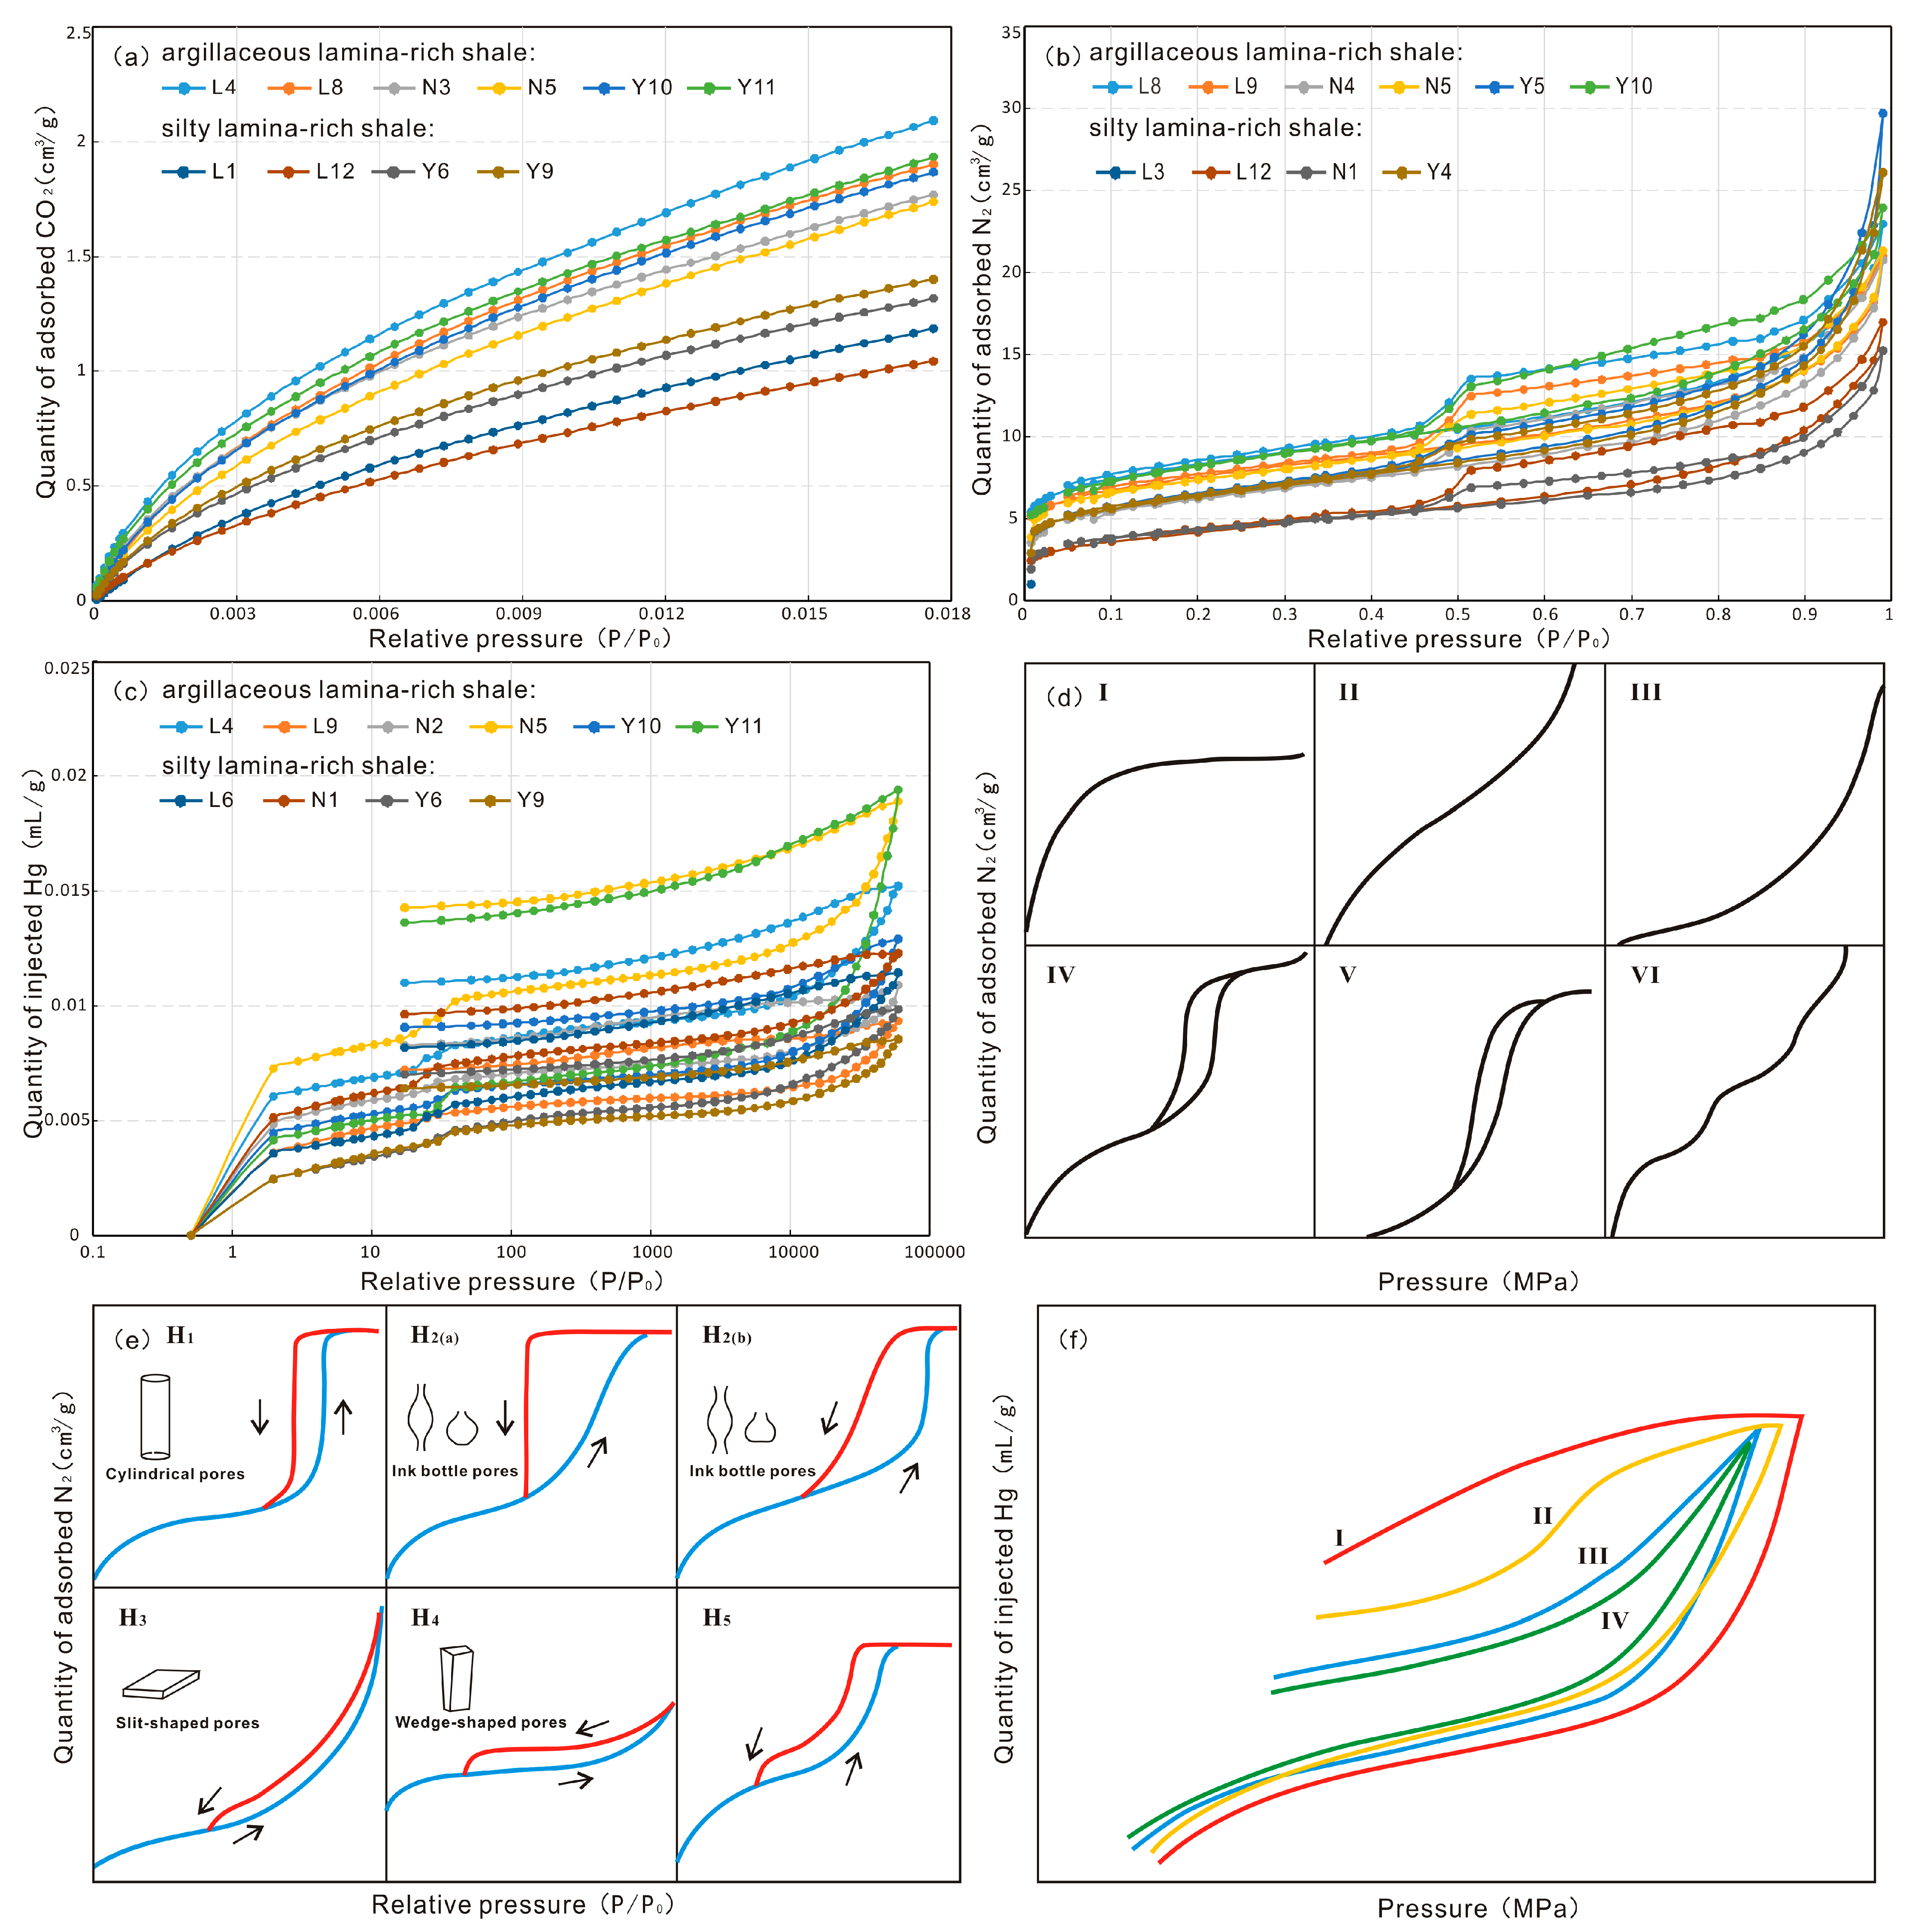
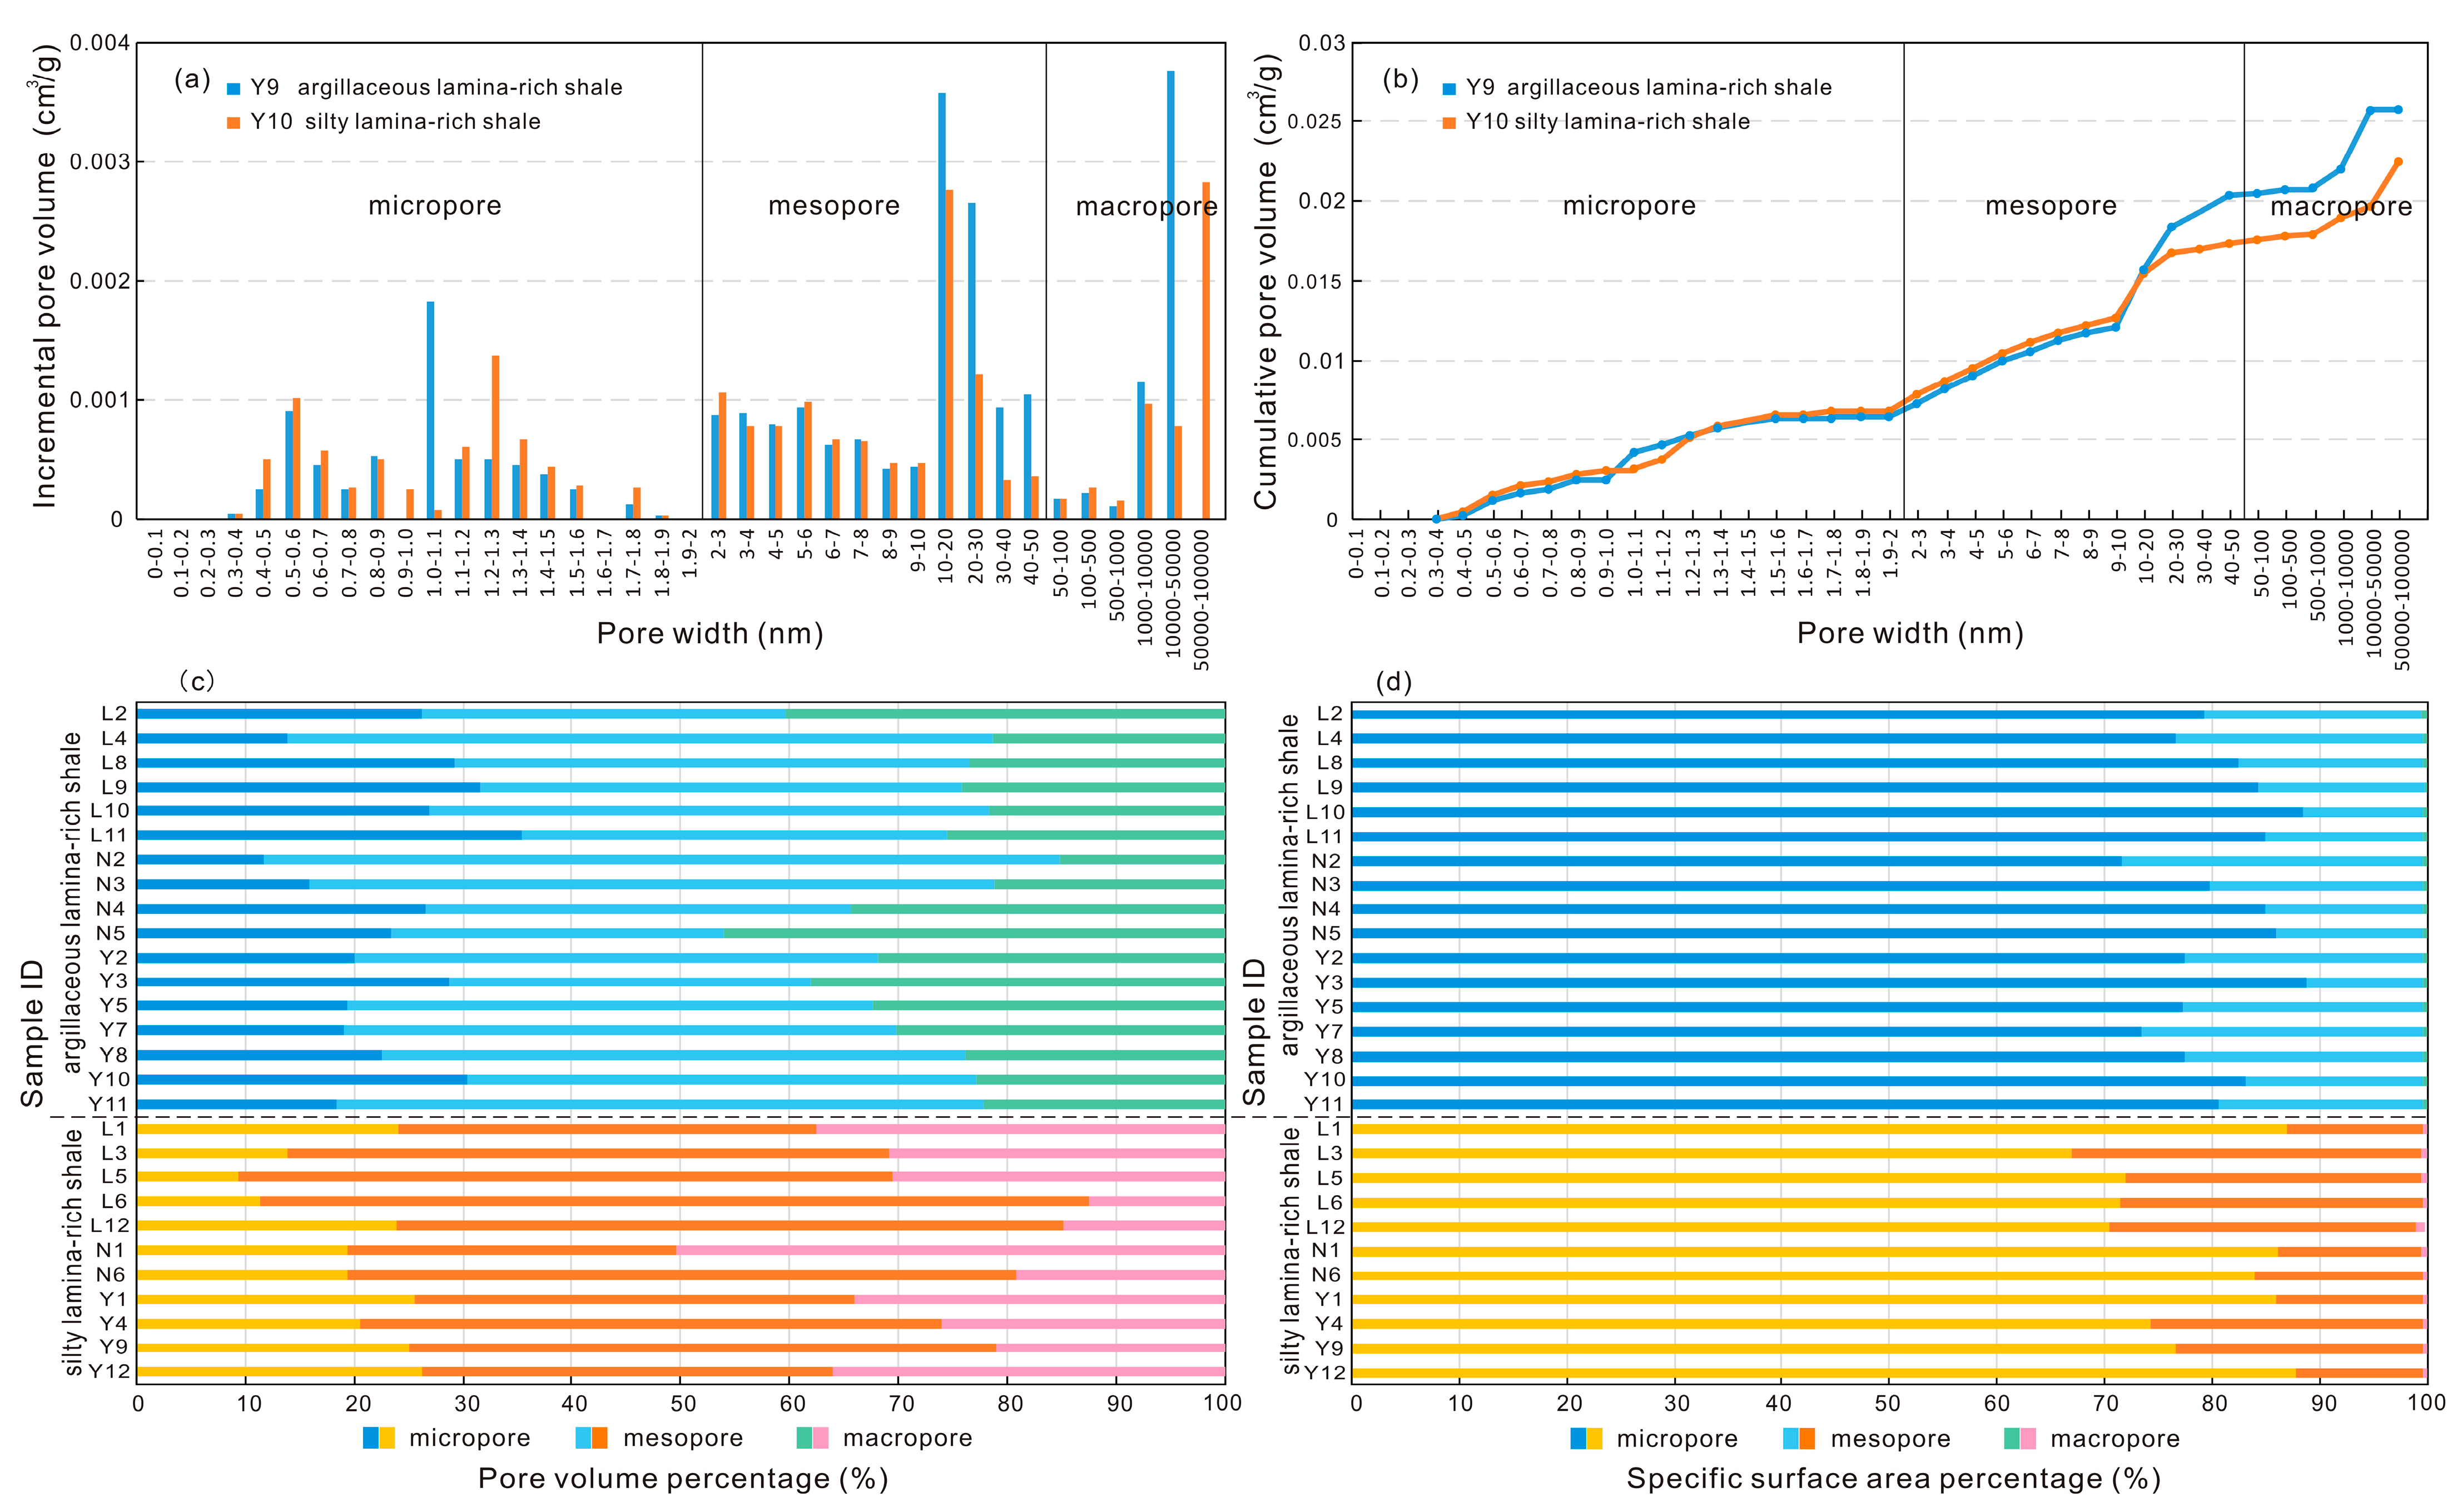
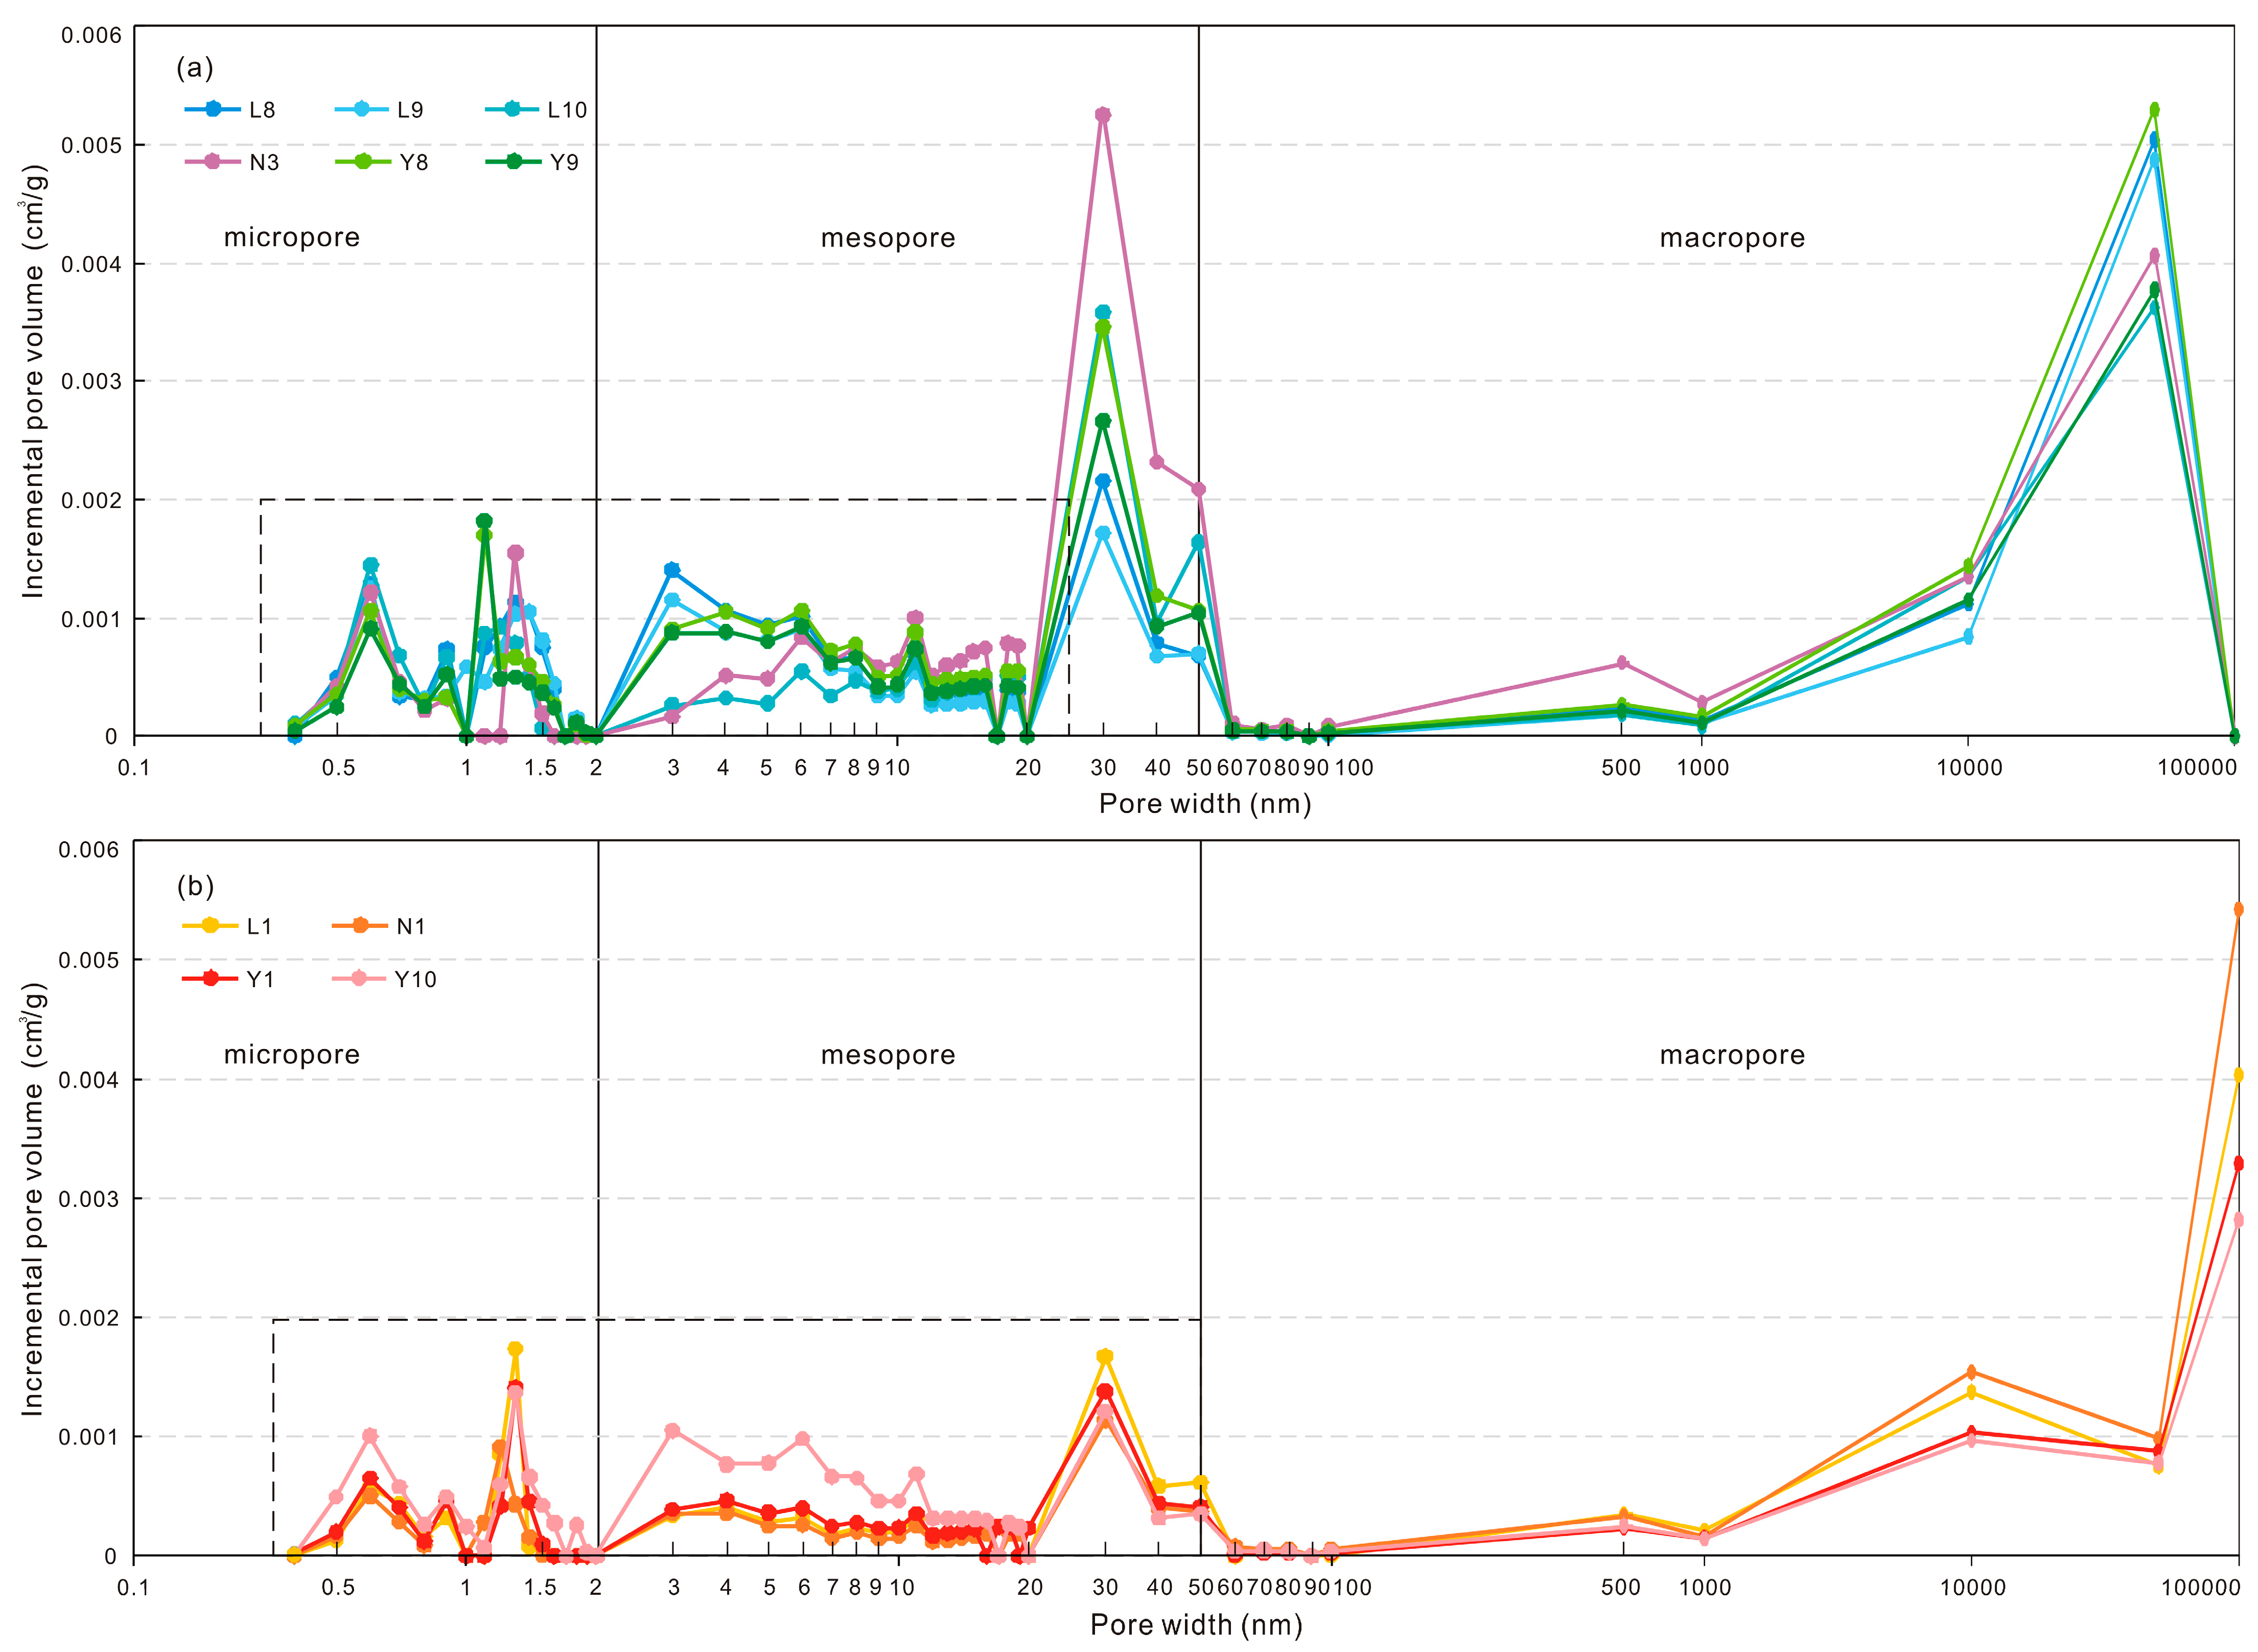
4.4.4. Pore Structure
5. Discussion
5.1. Influence of Lamination on Shale Reservoir Properties
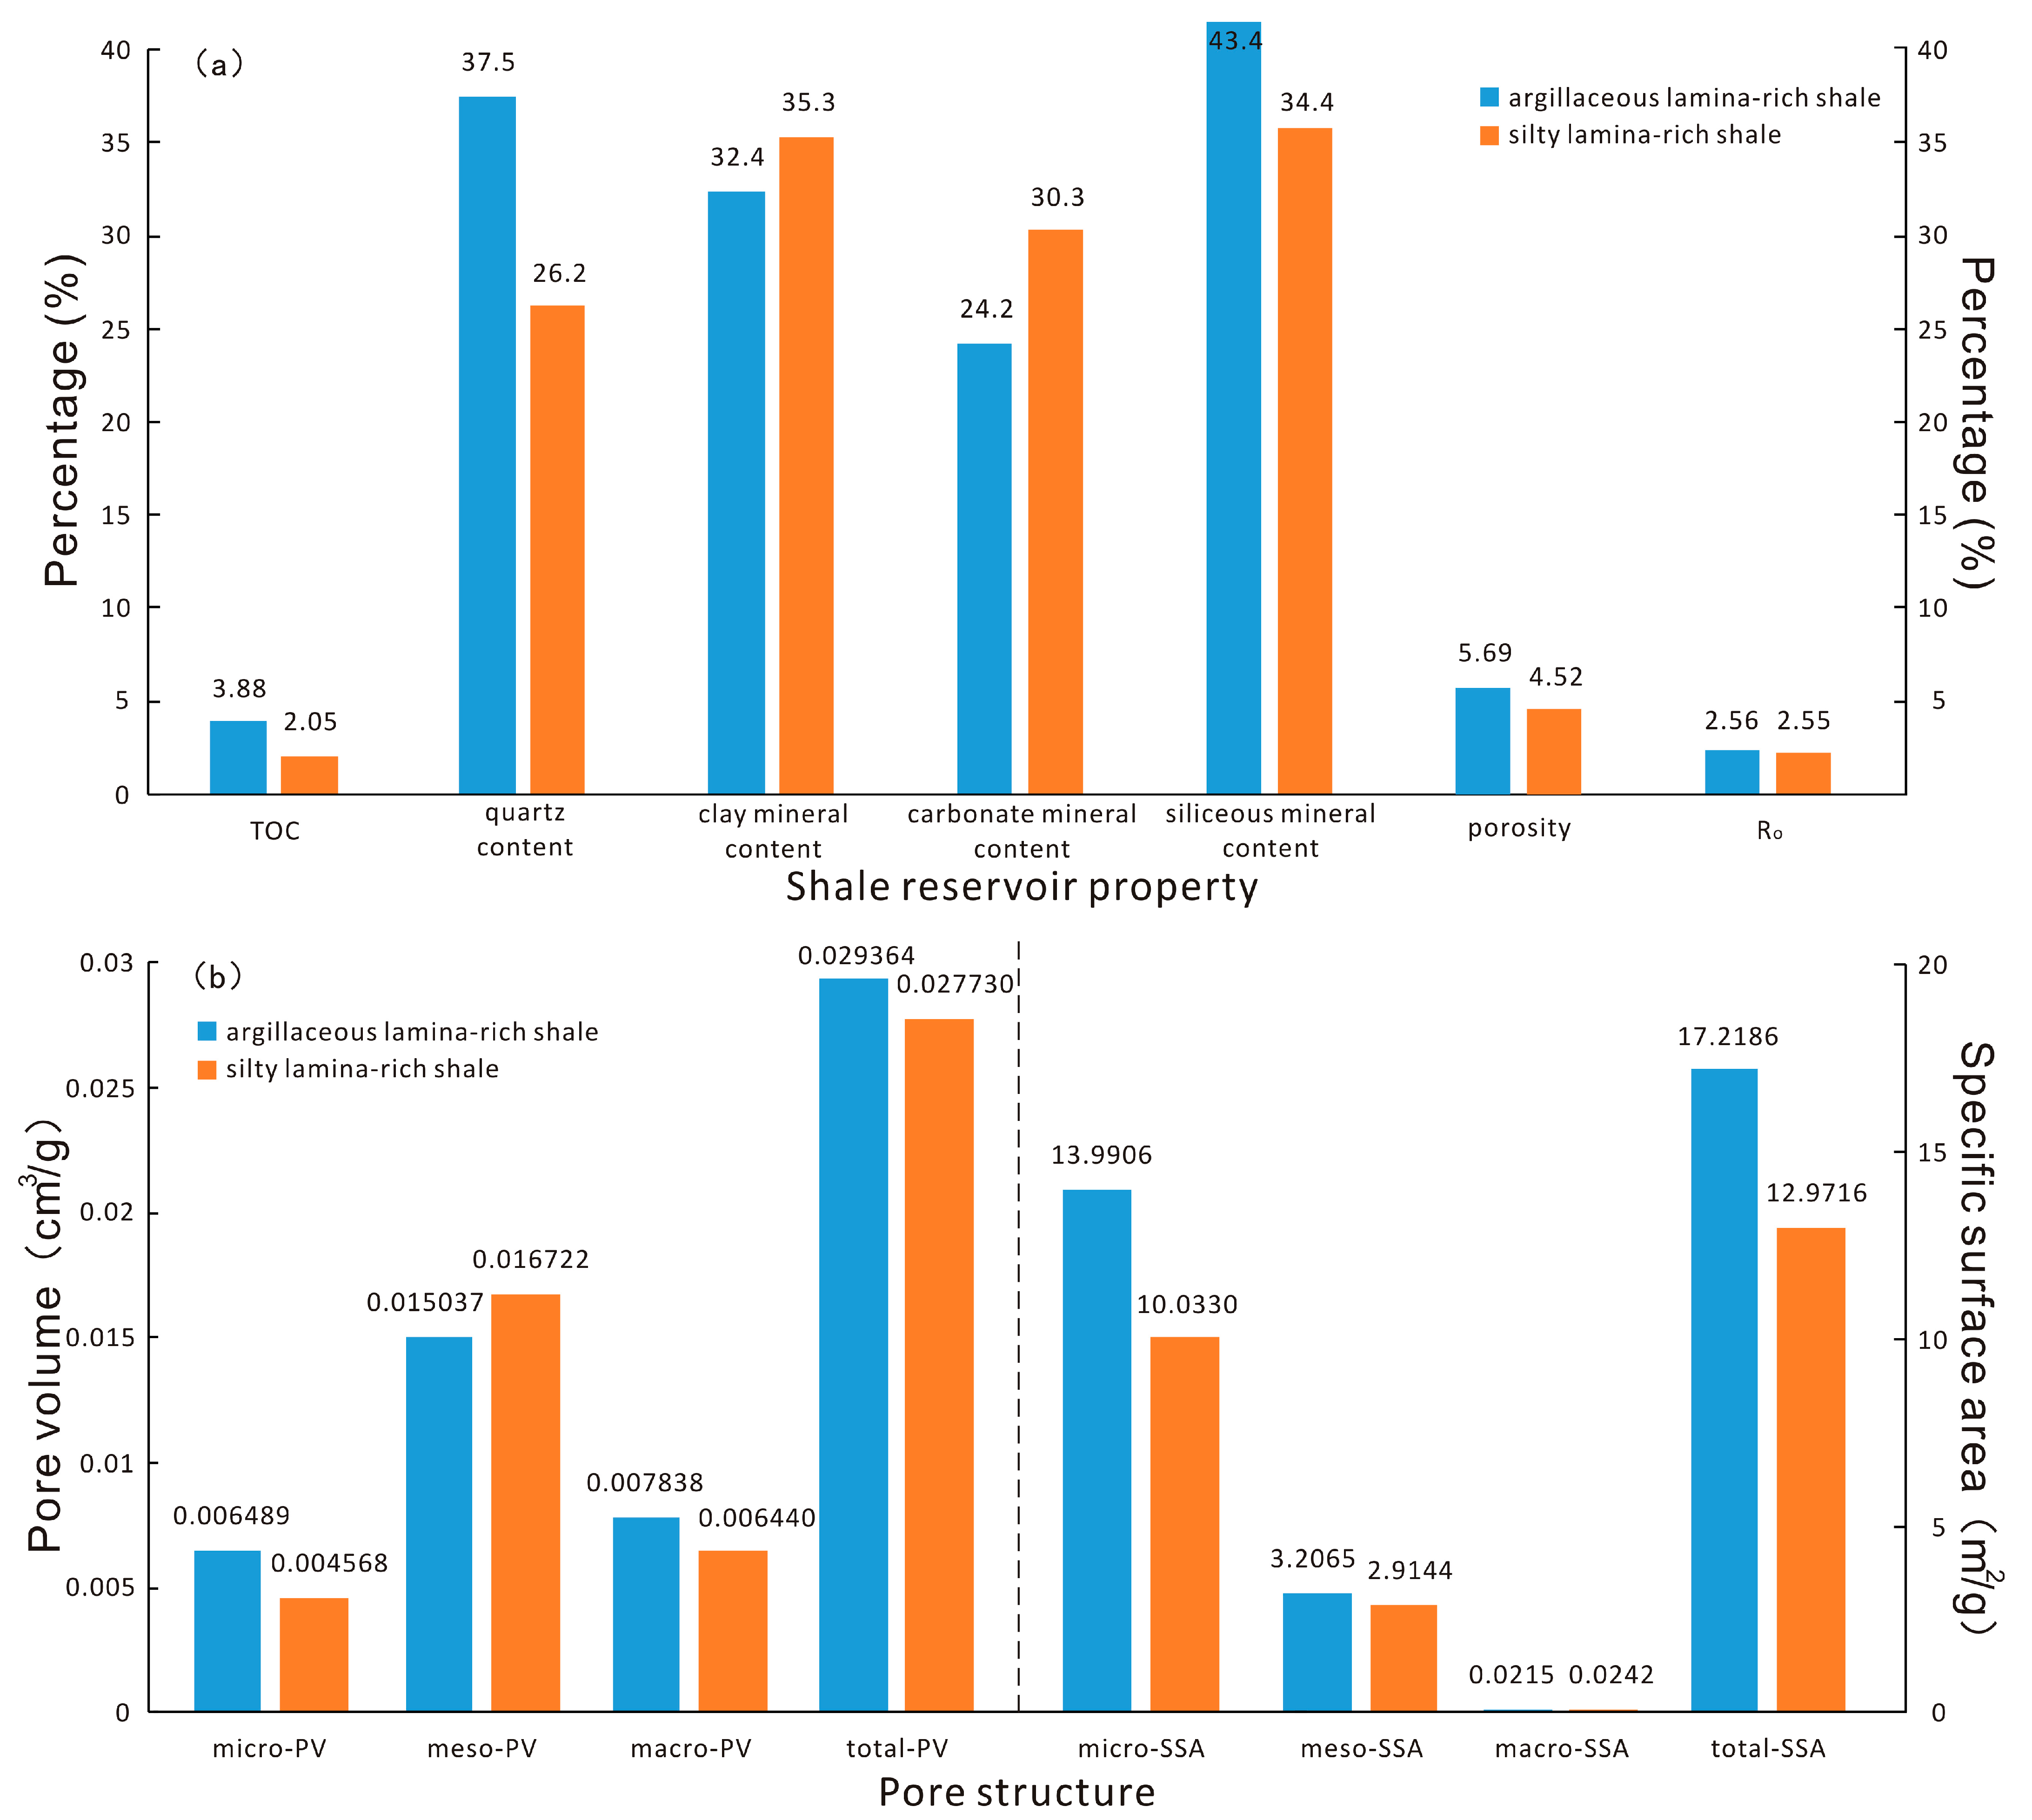
5.1.1. Comparison between Argillaceous Lamina-Rich Shale and Silty Lamina-Rich Shale
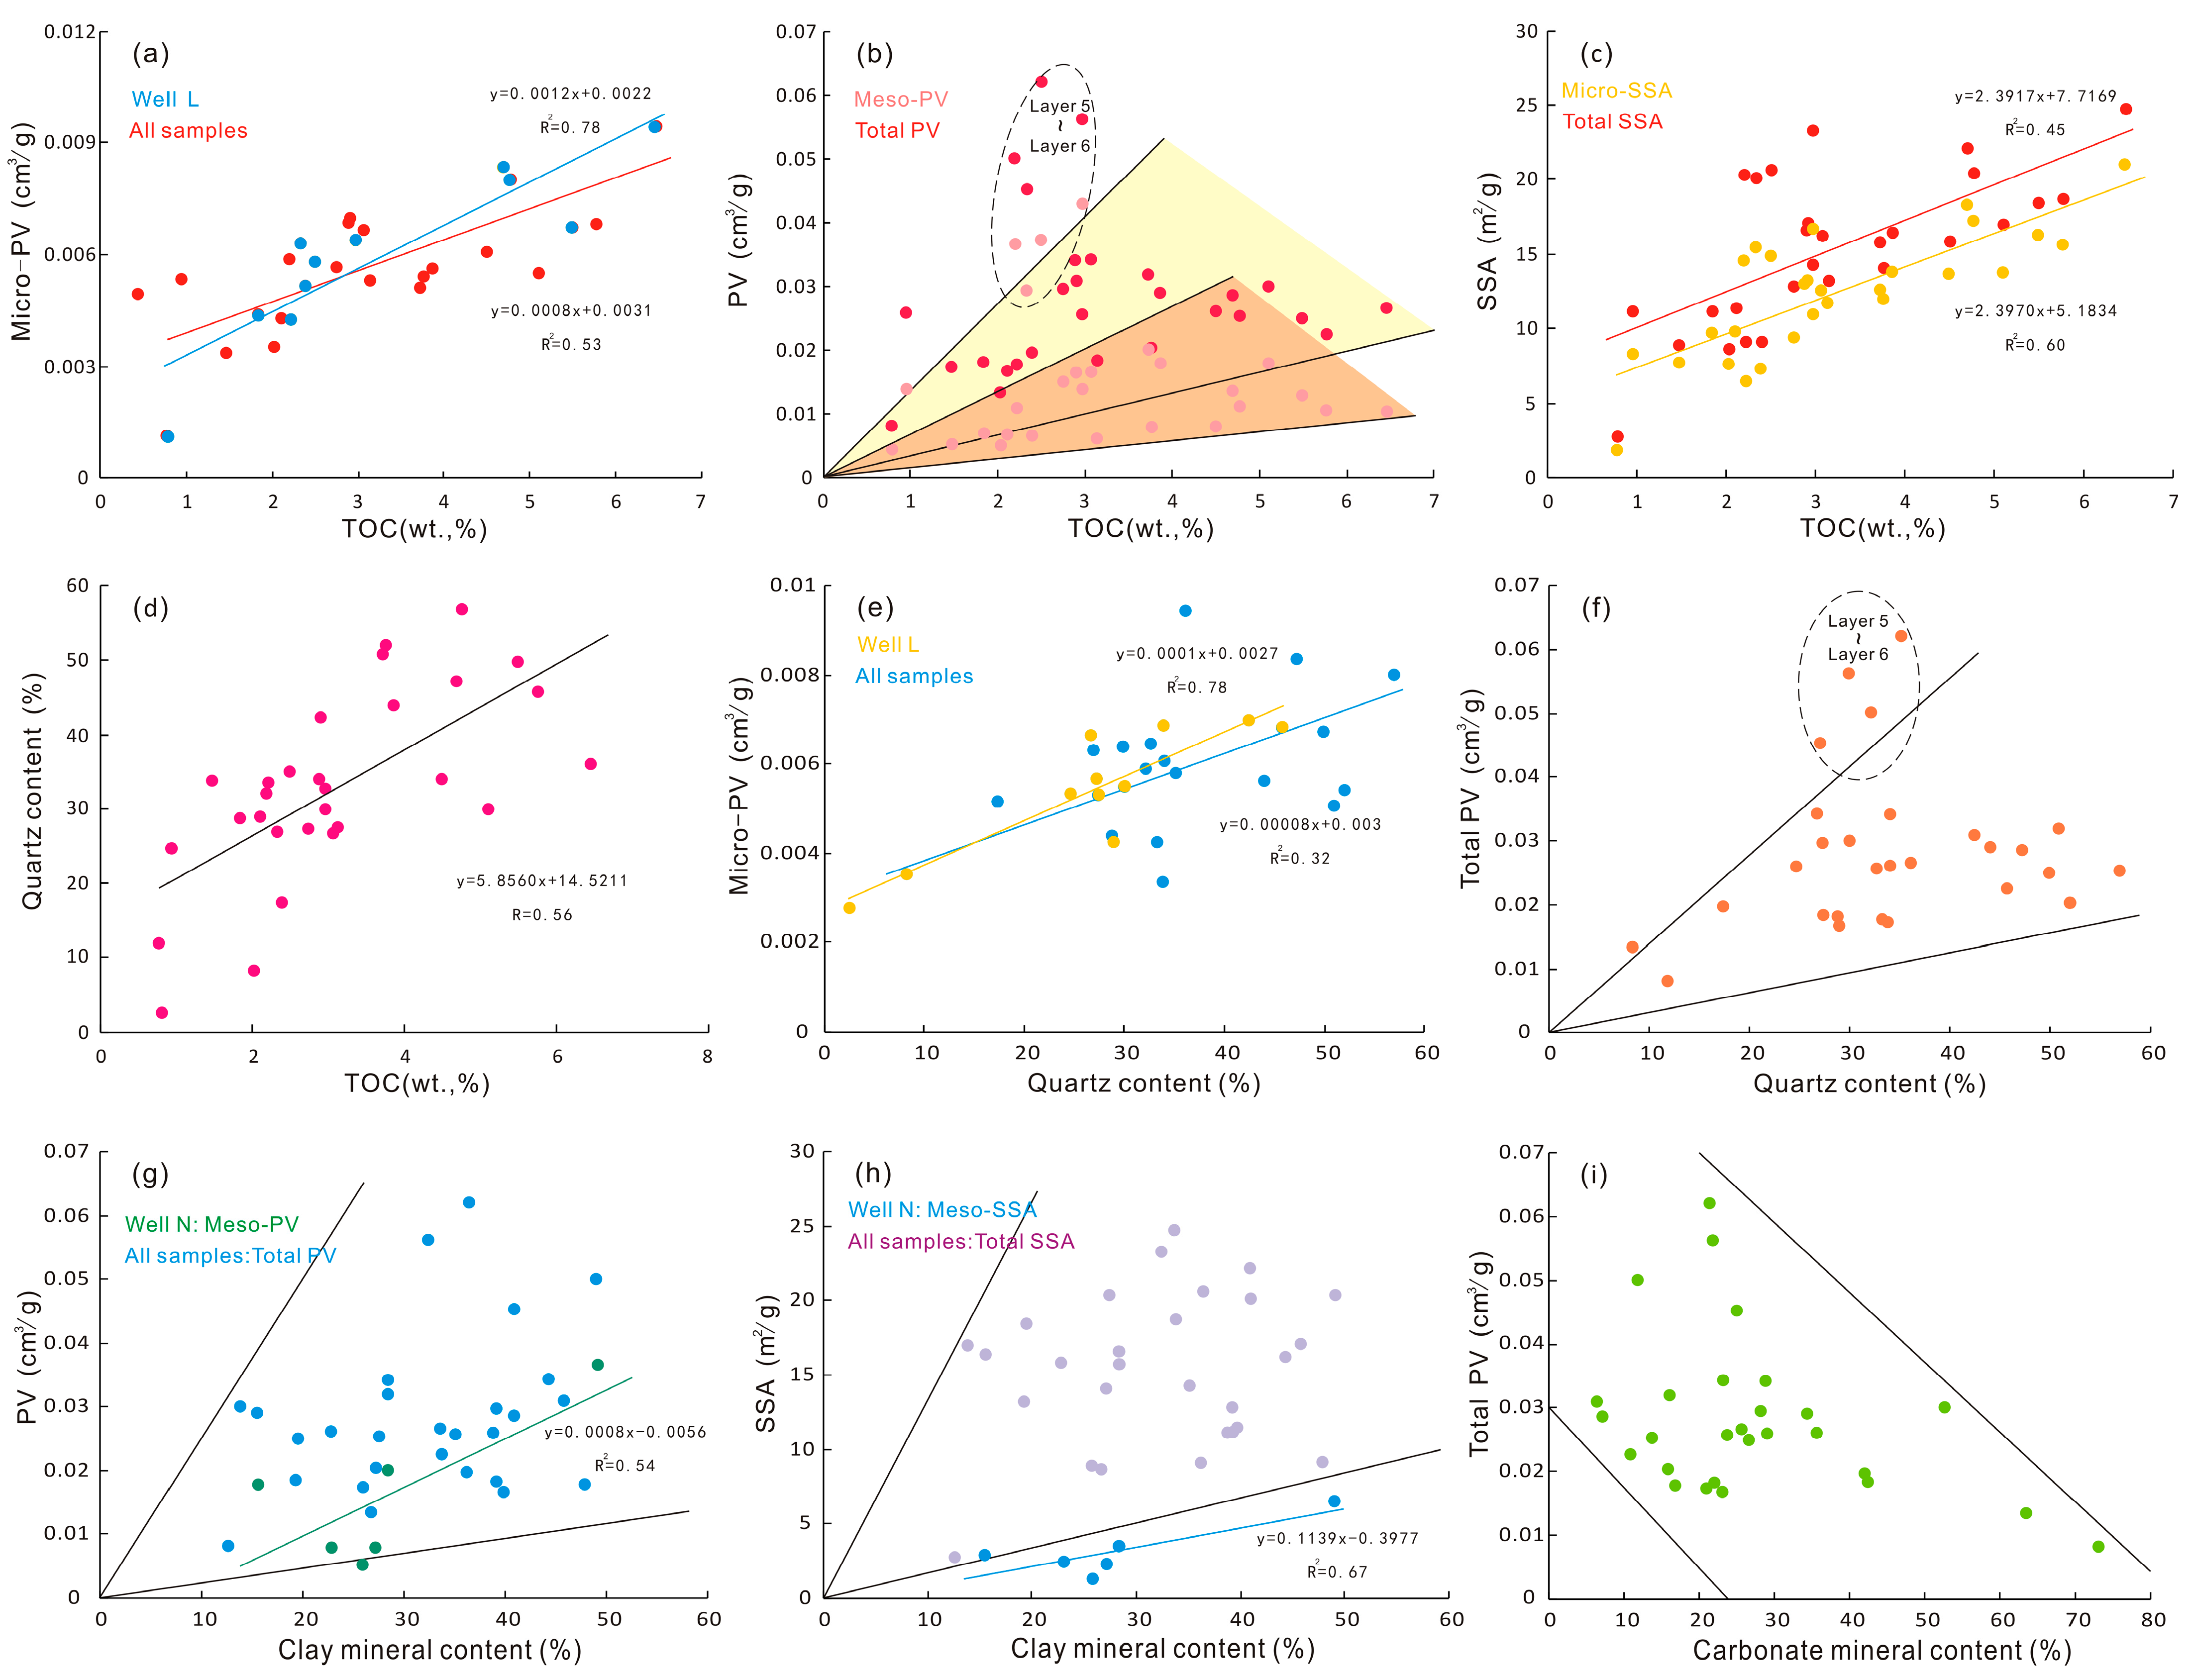
5.1.2. Main Factors Influencing the Development of Shale Pores
5.2. Sedimentary Characteristics and Patterns of Variation
5.3. Variations in Lamina and Laminaset and Their Relationship with the Depositional Environment
5.4. Pore Structure and Its Relationship with the Depositional Environment and Lamination
6. Conclusions
Author Contributions
Funding
Data Availability Statement
Acknowledgments
Conflicts of Interest
References
- Liao, C.J.; Chen, L.; Zheng, J.; Chen, Y.N.; Jin, Z.M.; Li, M.L.; Chen, X.; Tan, X.C. Classification of shale lithofacies from Ordovician Wufeng Formation to first section of first member of Silurian Longmaxi Formation, western Changning area, Sichuan Basin, and its significance. Pet. Geol. Exp. 2022, 44, 1037–1047. [Google Scholar] [CrossRef]
- Ma, X.H.; Xie, J. The progress and prospects of shale gas exploration and exploitation in southern Sichuan Basin, NW China. Pet. Explor. Dev. 2018, 45, 161–169. [Google Scholar] [CrossRef]
- Pu, B.L.; Dong, D.Z.; Wang, F.Q.; Wang, Y.M.; Huang, J.L. The effect of sedimentary facies on Longmaxi shale gas in southern Sichuan Basin. Geol. China 2020, 47, 111–120. [Google Scholar] [CrossRef]
- Wang, H.Y.; Shi, Z.S.; Sun, S.S. Biostratigraphy and reservoir characteristics of the Ordovician Wufeng Formation-Silurian Longmaxi Formation shale in the Sichuan Basin and its surrounding areas, China. Pet. Explor. Dev. 2021, 48, 1019–1032. [Google Scholar] [CrossRef]
- Yang, X.; Shi, X.W.; Zhu, Y.Q.; Liu, J.; Li, Y.; He, L.; Xu, L.; Li, Y.Y.; Chen, Y.; Jiang, J.Y. Sedimentary evolution and organic matter enrichment of Katian-Aeronian deep-water shale in Luzhou area, southern Sichuan Basin. Acta Pet. Sin. 2022, 43, 469–482. [Google Scholar] [CrossRef]
- Zhu, Y.Q.; Chen, G.S.; Liu, Y.; Shi, X.W.; Wu, W.; Luo, C.; Yang, X.; Yang, Y.R.; Zou, Y.H. Sequence stratigraphy and lithofacies paleogeographic evolution of Katian Stage–Aeronian Stage in southern Sichuan Basin, SW China. Pet. Explor. Dev. 2021, 48, 1126–1138. [Google Scholar] [CrossRef]
- Zhang, J.C.; Tao, J.; Li, Z.; Wang, X.W.; Li, X.Q.; Jiang, S.L.; Wang, D.S.; Zhao, X.X. Prospect of deep shale gas resources in China. Nat. Gas Ind. 2021, 41, 15–28. [Google Scholar] [CrossRef]
- Ma, X.H.; Xie, J.; Yong, R.; Zhu, Y.Q. Geological characteristics and high production control factors of shale gas reservoirs in Silurian Longmaxi Formation, southern Sichuan Basin, SW China. Pet. Explor. Dev. 2020, 47, 901–915. [Google Scholar] [CrossRef]
- Algeo, T.J.; Kuwahara, K.; Sano, H.; Bates, S.; Lyons, T.; Elswick, E.; Hinnov, L.; Ellwood, B.; Moser, J.; Maynard, J.B. Spatial variation in sediment fluxes, redox conditions, and productivity in the Permian-Triassic Panthalassic Ocean. Palaeogeogr. Palaeoclimatol. Palaeoecol. 2011, 308, 65–83. [Google Scholar] [CrossRef]
- Gao, P.; Liu, G.D.; Jia, C.Z.; Yong, A.; Wang, Z.C.; Wang, T.S.; Zhang, P.W.; Wang, D.P. Redox variations and organic matter accumulation on the Yangtze carbonate platform during late Ediacaran-early Cambrian: Constraints from petrology and geochemistry. Palaeogeogr. Palaeoclimatol. Palaeoecol. 2016, 450, 91–110. [Google Scholar] [CrossRef]
- Chen, S.B.; Qin, Y.; Wang, Y.; Zhang, H.; Zuo, Z.X. Pore structure and heterogeneity of marine shales in the Middle-Upper Yangtze. Nat. Gas Geosci. 2015, 26, 1455–1463. [Google Scholar] [CrossRef]
- Chalmers, G.R.; Bustin, R.M.; Power, I.M. Characterization of gas shale pore systems by porosimetry, pycnometry surface area, and field emission scanning electron microscopy/transmission electron microscopy image analyses: Examples from the Barnett, Woodford, Haynesville, Marcellus, and Doig units. AAPG Bull. 2012, 96, 1099–1119. [Google Scholar] [CrossRef]
- Loucks, R.G.; Reed, R.M.; Ruppel, S.C.; Jarvie, D.M. Morphology, genesis, and distribution of nanometer-scale pores in siliceous mudstones of the Mississippian Barnett Shale. J. Sediment. Res. 2009, 79, 848–861. [Google Scholar] [CrossRef]
- Chen, S.B.; Xia, X.H.; Qin, Y.; Fu, C.Q.; Hu, L. Classification of pore structures in shale gas reservoir at the Longmaxi Formation in the south of Sichuan Basin. J. China Coal Soc. 2013, 38, 760–765. [Google Scholar] [CrossRef]
- Slatt, E.M.; O’Brien, N.R. Pore types in the Barnett and Wood-ford gas shales: Contribution to understanding gas storage and migration pathways in fine-grained rocks. AAPG Bull. 2011, 95, 2017–2030. [Google Scholar] [CrossRef]
- Loucks, R.G.; Reed, R.M.; Ruppel, S.C.; Hammes, U. Spectrum of pore types and networks in mudrocks and a descriptive classification for matrix-related mudrock pores. AAPG Bull. 2012, 96, 1071–1098. [Google Scholar] [CrossRef]
- IUPAC (International Union of Pure and Applied Chemistry). Physical chemistry division commission on colloid and surface chemistry, subcommittee on characterization of porous solids: Recommendations for the characterization of porous solids (Technical report). Pure Appl. Chem. 1994, 66, 1739–1758. [Google Scholar] [CrossRef]
- Wang, Y.R.; Hu, Z.Q.; Dong, L.; Gao, B.; Sun, C.X.; Yang, T.; Wang, G.P.; Yin, S. Advancement and trends of shale gas reservoir characterization and evaluation. Oil Gas Geol. 2021, 42, 54–65. [Google Scholar] [CrossRef]
- Li, Y.; Yang, J.H.; Pan, Z.J.; Tong, W.S. Nanoscale pore structure and mechanical property analysis of coal: An insight combing AFM and SEM images. Fuel 2020, 260, 116352. [Google Scholar] [CrossRef]
- Clarkson, C.R.; Solano, N.R.; Bustin, R.M.; Bustin, A.M.M.; Chalmers, G.R.L.; He, L.; Melnichenko, Y.B.; Radlinski, A.P.; Blach, T.P. Pore structure characterization of North American shale gas reservoirs using USANS/SANS, gas adsorption, and mercury intrusion. Fuel 2013, 103, 606–616. [Google Scholar] [CrossRef]
- Ma, X.; Guo, S.; Shi, D.; Zhou, Z.; Liu, G.H. Investigation of pore structure and fractal characteristics of marine-continental transitional shales from Longtan Formation using MICP, gas adsorption, and NMR (Guizhou, China). Mar. Pet. Geol. 2019, 107, 555–571. [Google Scholar] [CrossRef]
- Hu, Q.H.; Liu, H.M.; Li, M.W.; Li, Z.; Yang, R.; Zhang, Y.X.; Sun, M.D. Wettability, pore connectivity and fluid-tracer migration in shale oil reservoirs of Paleogene Shahejie Formation in Dongying sag of Bohai Bay Basin, East China. Acta Pet. Sin. 2018, 39, 278–289. [Google Scholar] [CrossRef]
- Ma, X.; Guo, S.B. Study on pore evolution and diagenesis division of a Permian Longtan transitional shale in Southwest Guizhou, China. Energy Sci. Eng. 2020, 9, 58–79. [Google Scholar] [CrossRef]
- Lin, C.M.; Wang, H.Y.; Liang, P.P.; Shi, Z.S.; Sun, S.S.; Liu, D.X. The characteristics of laminae and its reservoir significance in black shale: Taking the Wufeng-Longmaxi formations in the Changning-Shuanghe section as an example. J. Stratigr. 2019, 43, 133–140. [Google Scholar] [CrossRef]
- Xi, K.L.; Li, K.; Cao, Y.C.; Lin, M.R.; Niu, X.B.; Zhu, R.K.; Wei, X.Z.; You, Y.; Liang, X.W.; Feng, S.B. Laminae combination and shale oil enrichment patterns of Chang 73 sub-member organic-rich shales in the Triassic Yanchang Formation, Ordos Basin, NW China. Pet. Explor. Dev. 2020, 47, 198–209. [Google Scholar] [CrossRef]
- Shi, Z.S.; Dong, D.Z.; Wang, H.Y.; Sun, S.S.; Wu, J. Reservoir characteristics and genetic mechanisms of gas-bearing shales with different laminae and laminae combinations:A case study of Member 1 of the Lower Silurian Longmaxi shale in Sichuan Basin, SW China. Pet. Explor. Dev. 2020, 47, 829–840. [Google Scholar] [CrossRef]
- Hua, G.L.; Wu, S.T.; Qiu, Z.; Jiang, Z.H.; Xu, J.L.; Guan, M.D. Lamination Texture and Its Effect on Reservoir Properties: A Case Study of Longmaxi Shale, Sichuan Basin. Acta Sedimentol. Sin. 2021, 39, 281–296. [Google Scholar] [CrossRef]
- Shi, Z.; Qiu, Z.; Dong, D.; Lu, B.; Liang, P.P.; Zhang, M.Q. Lamina characteristics of gas-bearing shale fine-grained sediment of the Silurian Longmaxi Formation of Well Wuxi 2 in Sichuan Basin, SW China. Pet. Explor. Dev. 2018, 45, 358–368. [Google Scholar] [CrossRef]
- Aplin, A.C.; Macquaker, J.H.S. Mudstone diversity: Origin and implications for source, seal, and reservoir properties in petroleum systems. AAPG Bull. 2011, 95, 2031–2059. [Google Scholar] [CrossRef]
- Lazar, O.R.; Bohacs, K.M.; Macquaker, J.H.S.; Schieber, J.; Demko, T.M. Capturing key attributes of fine-grained sedimentary rocks in outcrops, cores, and thin sections: Nomenclature and description guidelines. J. Sediment. Res. 2015, 85, 230–246. [Google Scholar] [CrossRef]
- Guo, L.; Feng, C.J.; Guo, F. Sedimentary Environment and Sedimentary Facies of Fine-Grained Rock Reservoirs-Taking Longmaxi Formation in the Southeast of Sichuan Basin as an Example; Sinopec Press: Beijing, China, 2017; pp. 1–213. [Google Scholar]
- Wo, Y.J.; Xiao, K.X.; Zhou, Y.; Yang, Z.Q. Types of marine plays in southern China and exploration prospects. Oil Gas Geol. 2006, 27, 11–16. [Google Scholar] [CrossRef]
- Lu, Y.B.; Hao, F.; Lu, Y.C.; Yan, D.T.; Xu, S.; Shu, Z.G.; Wang, Y.X.; Wu, L.Y. Lithofacies and depositional mechanisms of the Ordovician-Silurian Wufeng-Longmaxi organic-rich shales in the Upper Yangtze area, southern China. AAPG Bull. 2020, 104, 97–129. [Google Scholar] [CrossRef]
- Wang, Y.W. Deep Shale Reservoir Characteristics of Wufeng-Longmaxi Formation in Luzhou Block; China University of Mining and Technology: Xuzhou, China, 2023. [Google Scholar] [CrossRef]
- Li, J.; He, D.F.; Mei, Q.H. Tectonic-depositional environment and proto-type basins evolution of the Ordovician in Sichuan Basin and adjacent area. Acta Pet. Sin. 2015, 36, 427–445. [Google Scholar] [CrossRef]
- Feng, Z.Z. Discussion on petroleum exploration of marine strata South China from quantitative lithofacies palaeogeography. J. Palaeogeogr. 2005, 7, 1–11. [Google Scholar] [CrossRef]
- Chen, X.; Fan, J.X.; Zhang, Y.D.; Wang, H.Y.; Chen, Q.; Wang, W.H.; Liang, F.; Guo, W.; Zhao, Q.; Nie, H.K.; et al. Subdivision and delineation of the Wufeng and lungmachi black shales in the subsurface areas of the Yangtze platform. J. Stratigr. 2015, 39, 351–358. [Google Scholar] [CrossRef]
- Qiu, Z.; Dong, D.Z.; Lu, B.; Zhou, J.; Shi, Z.S.; Wang, H.Y.; Lin, W.; Zhang, C.C.; Liu, D.X. Discussion on the relationship between graptolite abundance and organic enrichment in shales from the Wufeng and Longmaxi Formation, South China. Acta Sedimentol. Sin. 2016, 34, 1011–1020. [Google Scholar] [CrossRef]
- Zhao, S.X.; Yang, Y.M.; Zhang, J.; Wang, L.S.; Wang, X.Z.; Luo, C.; Tian, C. Micro-layers division and fine reservoirs contrast of Lower Silurian Longmaxi Formation shale, Sichuan Basin, SW China. Nat. Gas Geosci. 2016, 27, 470–487. [Google Scholar] [CrossRef]
- Luo, C.; Li, J.X.; Li, Z.W.; Zhang, D.J.; Tong, K.L.; Dai, Y.; Hu, X.; Liu, A.D.; Ye, Y.H.; Zhong, K.S.; et al. Structural deformation characteristics and formation process of Luzhou Block in Sichuan Basin, China. J. Chengdu Univ. Technol. 2022, 49, 665–673. [Google Scholar] [CrossRef]
- Zhang, M.L.; Li, G.Q.; He, J.; Heng, D. Main controlling factors of Ordovician Wufeng-Silurian Longmaxi shale gas enrichment in Tiangongtang structure, southwestern margin of Sichuan Basin. Lithol. Reserv. 2022, 34, 141–151. [Google Scholar] [CrossRef]
- He, D.F.; Lu, R.Q.; Huang, H.Y.; Wang, X.S.; Jiang, H.; Zhang, W.K. Tectonic and geological setting of the earthquake hazards in the Changning shale gas development zone, Sichuan Basin, SW China. Pet. Explor. Dev. 2019, 46, 993–1003. [Google Scholar] [CrossRef]
- Dong, D.Z.; Shi, Z.S.; Sun, S.S.; Guo, C.M.; Zhang, C.C.; Guo, W.; Guan, Q.Z.; Zhang, M.Q.; Jiang, S.; Zhang, L.F.; et al. Factors controlling microfractures in black shale: A case study of Ordovician Wufeng Formation Silurian Longmaxi Formation in Shuanghe Profile, Changning area, Sichuan Basin, SW China. Pet. Explor. Dev. 2018, 45, 763–774. [Google Scholar] [CrossRef]
- Nesbitt, H.W.; Young, G.M. Early Proterozoic climates and plate motions inferred from major element chemistry of lutites. Nature 1982, 299, 715–717. [Google Scholar] [CrossRef]
- Xie, W.Q.; Tan, J.Q.; Wang, W.H.; Schulz, H.M.; Liu, Z.J.; Kang, X.; Wang, Y.; Shahzad, A.; Jan, I.U. Middle Jurassic lacustrine source rocks controlled by an aridification event: A case study in the northern Qaidam Basin (NW China). Int. J. Coal Geol. 2021, 242, 103779. [Google Scholar] [CrossRef]
- Tribovillard, N.; Algeo, T.J.; Baudin, F.; Riboulleau, A. Analysis of marine environmental conditions based on molybdenum-uranium covariation-Applications to Mesozoic paleceanography. Chem. Geol. 2012, 299, 324–325. [Google Scholar] [CrossRef]
- Xie, W.Q.; Jia, J.L.; Miao, C.S.; Wu, Y.J.; Wang, X.M.; Qin, J.Y. Formation and evolution of coal- and oil-bearing source rocks in the Lower Cretaceous Shahai Formation in the Fuxin Basin (NE China): Evidence from organic and inorganic geochemical analyses. J. Pet. Sci. Eng. 2021, 202, 108544. [Google Scholar] [CrossRef]
- Li, Y.F.; Shao, D.Y.; Lv, H.G.; Zhang, Y.; Zhang, X.L.; Zhang, T.W. A relationship between elemental geochemical characteristics and organic matter enrichment in marine shale of Wufeng Formation-Longmaxi Formation, Sichuan Basin. Acta Pet. Sin. 2015, 36, 1470–1483. [Google Scholar] [CrossRef]
- Chang, H.J.; Chu, X.L.; Feng, L.J.; Huang, J.; Zhang, Q.R. Redox Sensitive Trace Elements as Paleoenvironments Proxies. Geol. Rev. 2009, 55, 91–99. [Google Scholar] [CrossRef]
- Wignall, P.B.; Myers, K.J. Interpreting benthic oxygen levels in mudrocks: A new approach. Geology 1988, 16, 452–455. [Google Scholar] [CrossRef]
- Zhang, T.; Wang, L.L.; Liao, H.H.; Zou, M.; Liang, R.; Wang, P.; Su, Z.T. Methods and research progress of Paleo-water depth reconstruction in Sedimentary Basin. Sediment. Geol. Tethyan Geol. 2023, 1–28. [Google Scholar] [CrossRef]
- Zhang, Y.Y.; He, Z.L.; Jiang, S.; Gao, B.; Liu, Z.B.; Han, B.; Wang, H. Marine redox stratification during the early Cambrian (ca.529-509Ma) and its control on the development of organic-rich shales in Yangtze Platform. Geochem. Geophys. Geosystems 2017, 18, 2354–2369. [Google Scholar] [CrossRef]
- Goldhammer, T.; Brüchert, V.; Ferdelman, T.G.; Zabel, M. Microbial sequestration of phosphorus in anoxic upwelling sediments. Nat. Geosci. 2010, 3, 557–561. [Google Scholar] [CrossRef]
- Campbell, C.V. Lamina, laminaset, bed and bedset. Sedimentology 1967, 8, 7–26. [Google Scholar] [CrossRef]
- Guo, S.B.; Mao, W.J.; Ma, X. Thermal simulation experiment study of the hydrocarbon generation characteristics of low maturity shale. Earth Sci. Front. 2017, 24, 365–369. [Google Scholar] [CrossRef]
- Huang, L.; Shen, W. Characteristics and controlling factors of the formation of pores of a shale gas reservoir: A case study from Longmaxi Formation of the Upper Yangtze region, China. Earth Sci. Front. 2015, 22, 374–385. [Google Scholar] [CrossRef]
- Gregg, S.J.; Sing, K.S.W. Adsorption, Surface Area, and Porosity; Academic Press: New York, NY, USA, 1982. [Google Scholar] [CrossRef]
- Thommes, M.; Kaneko, K.; Neimark, A.V.; Olivier, J.P.; Rodriguez-Reinoso, F.; Rouquerol, J.; Sing, K.S.W. Physisorption of gases, with special reference to the evaluation of surface area and pore size distribution (IUPAC Technical Report). Pure Appl. Chem. 2015, 87, 1051–1069. [Google Scholar] [CrossRef]
- Li, Y.Z.; Wang, X.Z.; Wu, B.; Li, G.Q.; Wang, D. Sedimentary facies of marine shale gas formations in Southern China: The Lower Silurian Longmaxi Formation in the southern Sichuan Basin. J. Earth Sci. 2016, 27, 807–822. [Google Scholar] [CrossRef]
- Wang, Y.M.; Li, X.J.; Wang, H.; Jiang, S.; Chen, B.; Ma, J.; Dai, B. Developmental characteristics and geological significance of the bentonite in the Upper Ordovician Wufeng-Lower Silurian Longmaxi Formation in eastern Sichuan Basin, SW China. Pet. Explor. Dev. 2019, 46, 653–665. [Google Scholar] [CrossRef]
- Wang, Y.M.; Dong, D.Z.; Li, X.J.; Huang, J.L.; Wang, S.F.; Wu, W. Stratigraphic sequence and sedimentary characteristics of Lower Silurian Longmaxi Formation in the Sichuan Basin and its peripheral areas. Nat. Gas Ind. 2015, 35, 12–21. [Google Scholar] [CrossRef]
- Schierber, J. Experimental testing of the transport-durability of shale lithics and its implications for interpreting the rock record. Sediment. Geol. 2016, 331, 162–169. [Google Scholar] [CrossRef]


| Sample | Stratum | Depth (m) | Quartz | Feldspar | Calcite | Dolomite | Pyrite | Clay | Kaolinite | Illite | Chlorite | I/S * |
|---|---|---|---|---|---|---|---|---|---|---|---|---|
| L1 | Layer 7 * | 4053.42 | 28.8 | 10 | 2.9 | 13.1 | 6 | 39.2 | 2 | 84 | 13 | 1 |
| L2 | Layer 6 | 4058.05 | 17.4 | 4.5 | 18.2 | 19.7 | 4 | 36.2 | 4 | 64 | 9 | 23 |
| L3 | Layer 6 | 4064.29 | 11.9 | 2.6 | 63.6 | 8.2 | 1.1 | 12.6 | 0 | 64 | 0 | 36 |
| L4 | Layer 6 | 4072.31 | 27 | 7.1 | 8.5 | 13.7 | 2.7 | 41 | 0 | 85 | 14 | 1 |
| L5 | Layer 5 | 4078.24 | 35.1 | 7.2 | 7.3 | 10.6 | 3.4 | 36.4 | 0 | 89 | 7 | 4 |
| L6 | Layer 5 | 4085.03 | 29.9 | 15.9 | 7.8 | 11.1 | 2.9 | 32.4 | 0 | 87 | 12 | 1 |
| L7 | Layer 4 | 4095.14 | 26.4 | 13 | 7.1 | 6.1 | 7.4 | 40 | 0 | 87 | 10 | 3 |
| L8 | Layer 3 | 4103.53 | 47.2 | 4.8 | 2 | 1.7 | 3.4 | 40.9 | 0 | 68 | 0 | 32 |
| L9 | Layer 2 | 4107.64 | 56.9 | 1.9 | 3.6 | 6.3 | 3.8 | 27.5 | 0 | 52 | 6 | 42 |
| L10 | Layer 2 | 4111.08 | 49.9 | 4 | 6.6 | 13.3 | 6.7 | 19.5 | 1 | 90 | 7 | 2 |
| L11 | Layer 1 | 4114.07 | 36.1 | 4.7 | 17.4 | 4.8 | 3.4 | 33.6 | 0 | 45 | 0 | 55 |
| L12 | Wufeng | 4119.40 | 33.3 | 2.1 | 2 | 0.7 | 14 | 47.9 | 3 | 22 | 2 | 73 |
| Y1 | Layer 7 | 3846.34 | 29 | 8.3 | 8.6 | 12.2 | 2.2 | 39.7 | 3 | 75 | 21 | 1 |
| Y2 | Layer 6 | 3851.28 | 34 | 8.8 | 11.5 | 14.8 | 2.5 | 28.4 | 7 | 33 | 18 | 42 |
| Y3 | Layer 6 | 3852.53 | 27.4 | 10.9 | 23 | 17.1 | 2.3 | 19.3 | 0 | 74 | 20 | 6 |
| Y4 | Layer 6 | 3856.39 | 24.6 | 7.7 | 15.6 | 10.2 | 3.1 | 38.8 | 1 | 79 | 14 | 6 |
| Y5 | Layer 6 | 3860.28 | 26.7 | 5.9 | 13.4 | 6.5 | 3.2 | 44.3 | 0 | 67 | 18 | 15 |
| Y6 | Layer 6 | 3861.09 | 2.5 | 4.2 | 1 | 1.7 | 22.3 | 68.3 | 0 | 31 | 5 | 64 |
| Y7 | Layer 5 | 3862.89 | 27.3 | 5.4 | 12.5 | 11.3 | 4.3 | 39.2 | 0 | 44 | 15 | 41 |
| Y8 | Layer 5 | 3868.25 | 42.4 | 5.5 | 2.8 | 0 | 3.5 | 45.8 | 0 | 49 | 13 | 38 |
| Y9 | Layer 4 | 3875.43 | 32.7 | 8.6 | 10.3 | 9.9 | 3.4 | 35.1 | 8 | 55 | 22 | 15 |
| Y10 | Layer 3 | 3879.06 | 45.7 | 9.6 | 3.5 | 4.4 | 3 | 33.8 | 2 | 73 | 16 | 9 |
| Y11 | Layer 2 | 3882.35 | 30 | 3.6 | 5.5 | 12.8 | 34.3 | 13.8 | 2 | 81 | 16 | 1 |
| Y12 | Wufeng | 3887.91 | 8.3 | 1.6 | 15.8 | 34.5 | 13.1 | 26.7 | 1 | 79 | 17 | 3 |
| N1 | Layer 5 | 2533.39 | 33.8 | 19.4 | 13.5 | 6 | 1.4 | 25.9 | 3 | 78 | 17 | 2 |
| N2 | Layer 5 | 2542.65 | 32.1 | 7.1 | 7.1 | 1.8 | 2.8 | 49.1 | 1 | 71 | 27 | 1 |
| N3 | Layer 4 | 2559.23 | 50.9 | 4.7 | 9.4 | 3.5 | 3.1 | 28.4 | 1 | 74 | 19 | 6 |
| N4 | Layer 3 | 2560.67 | 34 | 7.2 | 14 | 18 | 4 | 22.8 | 1 | 87 | 8 | 4 |
| N5 | Layer 3 | 2565.34 | 44.3 | 3.7 | 14.4 | 17 | 2.7 | 17.9 | 3 | 86 | 8 | 3 |
| N6 | Layer 2 | 2574.85 | 52 | 5 | 9.9 | 2.6 | 3.3 | 27.2 | 2 | 85 | 10 | 3 |
| Sample | Depth (m) | MoEF | UEF | CIA | Sr/Cu | U/Th | Sr/Ba | Mn/Fe | U (ppm) | P (%) | P/Ti | Al (%) | Ti (%) | Zr (%) |
|---|---|---|---|---|---|---|---|---|---|---|---|---|---|---|
| L1 | 4053.42 | 13.90 | 3.16 | 72.38 | 5.76 | 0.84 | 0.21 | 0.007 | 15.85 | 0.11 | 0.17 | 14.41 | 0.60 | 152.84 |
| L2 | 4058.05 | 5.68 | 0.80 | 69.33 | 15.23 | 0.26 | 0.13 | 0.027 | 2.60 | 0.15 | 0.30 | 9.35 | 0.49 | 164.29 |
| L3 | 4064.29 | 19.19 | 2.77 | 67.73 | 15.63 | 0.62 | 0.28 | 0.020 | 3.41 | 0.08 | 0.50 | 3.53 | 0.16 | 55.91 |
| L4 | 4072.31 | 7.42 | 1.82 | 76.22 | 5.76 | 0.70 | 0.25 | 0.07 | 10.37 | 0.10 | 0.20 | 16.31 | 0.50 | 95.29 |
| L5 | 4078.24 | 6.25 | 1.40 | 76.14 | 4.68 | 0.70 | 0.23 | 0.004 | 7.18 | 0.12 | 0.23 | 14.73 | 0.51 | 52.02 |
| L6 | 4085.03 | 7.84 | 1.75 | 75.09 | 4.61 | 0.73 | 0.25 | 0.04 | 7.51 | 0.11 | 0.27 | 12.31 | 0.41 | 30.90 |
| L7 | 4095.14 | 7.87 | 2.27 | 72.67 | 35.47 | 0.65 | 0.30 | 0.08 | 10.13 | 0.10 | 0.19 | 12.79 | 0.50 | 102.30 |
| L8 | 4103.53 | 20.40 | 2.99 | 70.28 | 1.75 | 1.09 | 0.04 | 0.006 | 13.70 | 0.12 | 0.18 | 13.14 | 0.65 | 93.20 |
| L9 | 4107.64 | 36.85 | 3.98 | 71.27 | 1.57 | 1.75 | 0.05 | 0.005 | 13.06 | 0.12 | 0.27 | 9.41 | 0.43 | 60.65 |
| L10 | 4111.08 | 45.20 | 10.41 | 72.11 | 4.80 | 2.33 | 0.35 | 0.009 | 24.00 | 0.10 | 0.34 | 6.62 | 0.29 | 56.20 |
| L11 | 4114.07 | 55.48 | 10.19 | 70.07 | 3.74 | 4.57 | 0.11 | 0.013 | 38.56 | 0.10 | 0.17 | 10.87 | 0.56 | 101.92 |
| L12 | 4119.40 | 10.86 | 1.46 | 73.30 | 1.94 | 0.56 | 0.04 | 0.004 | 6.90 | 0.05 | 0.09 | 13.58 | 0.59 | 184.26 |
| Y1 | 3846.34 | 4.36 | 2.20 | 75.06 | 12.33 | 0.65 | 0.26 | 0.012 | 11.63 | 0.10 | 0.19 | 15.15 | 0.52 | 89.90 |
| Y2 | 3851.28 | 6.99 | 3.64 | 71.53 | 9.88 | 0.82 | 0.17 | 0.017 | 17.23 | 0.12 | 0.20 | 13.60 | 0.61 | 189.90 |
| Y3 | 3852.53 | 4.60 | 1.87 | 69.02 | 31.06 | 0.38 | 0.50 | 0.033 | 5.58 | 0.16 | 0.37 | 8.59 | 0.43 | 185.90 |
| Y4 | 3856.39 | 7.93 | 3.08 | 73.58 | 13.94 | 0.89 | 0.27 | 0.018 | 13.93 | 0.13 | 0.30 | 12.98 | 0.45 | 103.90 |
| Y5 | 3860.28 | 8.33 | 4.76 | 74.60 | 6.15 | 1.72 | 0.19 | 0.013 | 20.60 | 0.12 | 0.28 | 12.43 | 0.44 | 96.10 |
| Y6 | 3861.09 | 8.37 | 1.88 | 79.09 | 7.74 | 0.36 | 0.09 | 0.004 | 13.58 | 0.11 | 0.10 | 20.75 | 1.09 | 907.69 |
| Y7 | 3862.89 | 7.62 | 3.08 | 73.63 | 50.09 | 0.79 | 0.20 | 0.011 | 13.46 | 0.10 | 0.22 | 12.53 | 0.44 | 87.06 |
| Y8 | 3868.25 | 6.38 | 1.83 | 74.07 | 2.78 | 0.83 | 0.13 | 0.005 | 9.26 | 0.09 | 0.17 | 14.50 | 0.51 | 69.90 |
| Y9 | 3875.43 | 10.40 | 2.76 | 70.20 | 5.68 | 0.92 | 0.21 | 0.017 | 12.19 | 0.10 | 0.19 | 12.69 | 0.54 | 133.46 |
| Y10 | 3879.06 | 33.94 | 6.70 | 71.54 | 2.93 | 1.98 | 0.15 | 0.008 | 17.86 | 0.08 | 0.29 | 7.65 | 0.29 | 47.75 |
| Y11 | 3882.35 | 47.01 | 9.06 | 72.54 | 20.13 | 2.46 | 0.36 | 0.09 | 22.70 | 0.12 | 0.43 | 7.19 | 0.28 | 52.80 |
| Y12 | 3887.91 | 7.28 | 1.97 | 73.89 | 9.86 | 0.31 | 0.51 | 0.012 | 5.80 | 0.01 | 0.04 | 8.47 | 0.42 | 140.10 |
| N1 | 2533.39 | 3.21 | 1.35 | 72.68 | 7.27 | 0.38 | 0.94 | 0.006 | 7.12 | 0.09 | 0.15 | 15.20 | 0.62 | 163.78 |
| N2 | 2542.65 | 3.97 | 1.28 | 74.91 | 5.13 | 0.42 | 0.60 | 0.005 | 7.39 | 0.09 | 0.15 | 16.53 | 0.62 | 75.10 |
| N3 | 2559.23 | 14.63 | 3.35 | 74.69 | 4.06 | 1.03 | 0.75 | 0.006 | 12.83 | 0.10 | 0.25 | 10.99 | 0.40 | 56.18 |
| N4 | 2560.67 | 18.30 | 4.00 | 73.31 | 4.86 | 1.06 | 0.80 | 0.005 | 12.32 | 0.09 | 0.26 | 8.85 | 0.35 | 61.67 |
| N5 | 2565.34 | 29.87 | 7.29 | 70.17 | 7.20 | 1.50 | 1.41 | 0.012 | 21.10 | 0.08 | 0.21 | 8.31 | 0.39 | 83.80 |
| N6 | 2574.85 | 50.79 | 12.67 | 69.14 | 14.39 | 2.31 | 2.09 | 0.036 | 22.50 | 0.05 | 0.19 | 5.10 | 0.25 | 71.30 |
| Sample | Depth (m) | TOC (wt.%) | Ro (%) | δ13C (‰) | Type * | Porosity (%) |
|---|---|---|---|---|---|---|
| L1 | 4053.42 | 1.84 | 2.48 | −30.0 | Ⅰ | 4.65 |
| L2 | 4058.05 | 2.39 | 2.39 | −27.7 | Ⅱ1 | 5.23 |
| L3 | 4064.29 | 0.78 | 2.51 | −29.9 | Ⅰ | 6.67 |
| L4 | 4072.31 | 2.33 | 2.49 | −29.9 | Ⅰ | 6.15 |
| L5 | 4078.24 | 2.50 | 2.48 | −29.8 | Ⅰ | 6.20 |
| L6 | 4085.03 | 2.97 | 2.47 | −29.2 | Ⅰ | 6.03 |
| L7 | 4095.14 | 2.12 | 2.50 | −29.6 | Ⅰ | 4.51 |
| L8 | 4103.53 | 4.69 | 2.45 | −29.8 | Ⅰ | 6.15 |
| L9 | 4107.64 | 4.77 | 2.45 | −30.4 | Ⅰ | 6.85 |
| L10 | 4111.08 | 5.49 | 2.54 | −30.3 | Ⅰ | 6.27 |
| L11 | 4114.07 | 6.46 | 2.45 | −30.2 | Ⅰ | 6.38 |
| L12 | 4119.4 | 2.22 | 2.39 | −30.7 | Ⅰ | 3.53 |
| Y1 | 3846.34 | 2.11 | 2.61 | −29.9 | Ⅰ | 3.40 |
| Y2 | 3851.28 | 2.89 | 2.64 | −29.2 | Ⅰ | 5.54 |
| Y3 | 3852.53 | 3.14 | 2.63 | −27.9 | Ⅱ1 | 3.59 |
| Y4 | 3856.29 | 0.95 | 2.64 | −29.9 | Ⅰ | 2.34 |
| Y5 | 3860.28 | 3.07 | 2.66 | −30.0 | Ⅰ | 1.91 |
| Y6 | 3861.09 | 0.83 | 2.62 | −30.4 | Ⅰ | 2.44 |
| Y7 | 3862.89 | 2.75 | 2.62 | −30.2 | Ⅰ | 4.52 |
| Y8 | 3868.25 | 2.91 | 2.61 | −29.8 | Ⅰ | 5.21 |
| Y9 | 3875.43 | 2.97 | 2.60 | −29.9 | Ⅰ | 4.11 |
| Y10 | 3879.06 | 5.77 | 2.63 | −30.5 | Ⅰ | 7.12 |
| Y11 | 3882.35 | 5.10 | 2.60 | −30.5 | Ⅰ | 6.15 |
| Y12 | 3887.91 | 2.03 | 2.65 | −30.3 | Ⅰ | 4.31 |
| N1 | 2533.39 | 1.47 | 2.58 | −28.8 | Ⅰ | 3.79 |
| N2 | 2542.62 | 2.20 | 2.59 | −29.3 | Ⅰ | 6.08 |
| N3 | 2559.23 | 3.72 | 2.61 | −30.2 | Ⅰ | 6.63 |
| N4 | 2560.67 | 3.76 | 2.65 | −30.3 | Ⅰ | 6.15 |
| N5 | 2565.34 | 4.50 | 2.56 | −30.5 | Ⅰ | 6.80 |
| N6 | 2574.85 | 3.86 | 2.64 | −29.8 | Ⅰ | 6.74 |
| Sample | Stratum | Pore Volume (cm3/g) | Specific Surface Area (m2/g) | Average Diameter Calc. (nm) * | ||||||
|---|---|---|---|---|---|---|---|---|---|---|
| Micro- | Meso- | Macro- | Total- | Micro- | Meso- | Macro- | Total- | |||
| L1 | Layer 7 | 0.004394 | 0.006970 | 0.006852 | 0.018216 | 9.7281 | 1.4156 | 0.0147 | 11.1584 | 13.06 |
| L2 | Layer 6 | 0.005169 | 0.006604 | 0.007954 | 0.019727 | 7.2450 | 1.8512 | 0.0202 | 9.1164 | 17.31 |
| L3 | Layer 6 | 0.001121 | 0.004450 | 0.002496 | 0.008067 | 1.8461 | 0.8937 | 0.0070 | 2.7468 | 23.49 |
| L4 | Layer 6 | 0.006312 | 0.029297 | 0.009684 | 0.045293 | 15.4559 | 4.6514 | 0.0238 | 20.1311 | 18.00 |
| L5 | Layer 5 | 0.005813 | 0.037259 | 0.019000 | 0.062072 | 14.8734 | 5.6982 | 0.0562 | 20.6278 | 24.07 |
| L6 | Layer 5 | 0.006395 | 0.042861 | 0.007027 | 0.056283 | 16.6959 | 6.5621 | 0.0223 | 23.2803 | 19.34 |
| L7 | Layer 4 | 0.006072 | 0.036185 | 0.002793 | 0.045050 | 15.8564 | 5.6636 | 0.0226 | 21.5426 | 16.73 |
| L8 | Layer 3 | 0.008359 | 0.013547 | 0.006744 | 0.028650 | 18.3527 | 3.8114 | 0.0173 | 22.1814 | 10.33 |
| L9 | Layer 2 | 0.008017 | 0.011194 | 0.006128 | 0.025339 | 17.2312 | 3.1563 | 0.0108 | 20.3983 | 9.94 |
| L10 | Layer 2 | 0.006741 | 0.012880 | 0.005427 | 0.025048 | 16.3583 | 2.0632 | 0.0143 | 18.4358 | 10.87 |
| L11 | Layer 1 | 0.009439 | 0.010365 | 0.006788 | 0.026592 | 21.0543 | 3.6673 | 0.0165 | 24.7381 | 8.60 |
| L12 | Wufeng | 0.004251 | 0.010886 | 0.002631 | 0.017768 | 6.4607 | 2.5994 | 0.0786 | 9.1387 | 15.55 |
| Y1 | Layer 7 | 0.004286 | 0.006778 | 0.005712 | 0.016776 | 9.8072 | 1.5613 | 0.0129 | 11.3814 | 11.79 |
| Y2 | Layer 6 | 0.006863 | 0.016429 | 0.010876 | 0.034168 | 12.8901 | 3.6762 | 0.0286 | 16.5949 | 16.47 |
| Y3 | Layer 6 | 0.005306 | 0.006115 | 0.006999 | 0.018420 | 11.7375 | 1.4447 | 0.0076 | 13.1898 | 11.17 |
| Y4 | Layer 6 | 0.005335 | 0.013857 | 0.006762 | 0.025954 | 8.2890 | 2.8317 | 0.0193 | 11.1400 | 18.64 |
| Y5 | Layer 6 | 0.006653 | 0.016561 | 0.011081 | 0.034295 | 12.5641 | 3.6381 | 0.0292 | 16.2314 | 16.90 |
| Y6 | Layer 6 | 0.002756 | 0.016110 | 0.005919 | 0.024785 | 6.7489 | 2.5680 | 0.0228 | 9.3397 | 21.23 |
| Y7 | Layer 5 | 0.005673 | 0.015016 | 0.008963 | 0.029652 | 9.4504 | 3.3705 | 0.0245 | 12.8454 | 18.47 |
| Y8 | Layer 5 | 0.006994 | 0.016574 | 0.007369 | 0.030937 | 13.2551 | 3.7914 | 0.0173 | 17.0638 | 14.50 |
| Y9 | Layer 4 | 0.006448 | 0.013860 | 0.005416 | 0.025724 | 10.9667 | 3.2849 | 0.0145 | 14.2661 | 14.43 |
| Y10 | Layer 3 | 0.006825 | 0.010516 | 0.005154 | 0.022495 | 15.6228 | 3.0951 | 0.0200 | 18.7379 | 9.60 |
| Y11 | Layer 2 | 0.005503 | 0.017860 | 0.006686 | 0.030049 | 13.7423 | 3.2148 | 0.0370 | 16.9941 | 14.15 |
| Y12 | Wufeng | 0.003528 | 0.005070 | 0.004839 | 0.013437 | 7.6098 | 1.0386 | 0.0059 | 8.6543 | 12.42 |
| N1 | Layer 5 | 0.003357 | 0.005250 | 0.008719 | 0.017326 | 7.7272 | 1.1955 | 0.0221 | 8.9448 | 15.50 |
| N2 | Layer 5 | 0.005889 | 0.036628 | 0.007631 | 0.050148 | 14.6001 | 5.7367 | 0.0147 | 20.3515 | 19.71 |
| N3 | Layer 4 | 0.005078 | 0.020105 | 0.006739 | 0.031922 | 12.6159 | 3.1105 | 0.0317 | 15.7581 | 16.21 |
| N4 | Layer 3 | 0.005409 | 0.007960 | 0.007014 | 0.020383 | 12.0128 | 2.0670 | 0.0194 | 14.0992 | 11.57 |
| N5 | Layer 3 | 0.006078 | 0.007982 | 0.012001 | 0.026061 | 13.6519 | 2.1651 | 0.0330 | 15.8500 | 13.15 |
| N6 | Layer 2 | 0.005625 | 0.017855 | 0.005558 | 0.029038 | 13.8196 | 2.5746 | 0.0153 | 16.4095 | 14.16 |
Disclaimer/Publisher’s Note: The statements, opinions and data contained in all publications are solely those of the individual author(s) and contributor(s) and not of MDPI and/or the editor(s). MDPI and/or the editor(s) disclaim responsibility for any injury to people or property resulting from any ideas, methods, instructions or products referred to in the content. |
© 2024 by the authors. Licensee MDPI, Basel, Switzerland. This article is an open access article distributed under the terms and conditions of the Creative Commons Attribution (CC BY) license (https://creativecommons.org/licenses/by/4.0/).
Share and Cite
Ma, X.; Xu, J.; Liu, W.; Wang, Y.; Wu, H.; Tan, J. Developing Characteristics of Shale Lamination and Their Impact on Reservoir Properties in the Deep Wufeng–Longmaxi Formation Shale of the Southern Sichuan Basin. Minerals 2024, 14, 171. https://doi.org/10.3390/min14020171
Ma X, Xu J, Liu W, Wang Y, Wu H, Tan J. Developing Characteristics of Shale Lamination and Their Impact on Reservoir Properties in the Deep Wufeng–Longmaxi Formation Shale of the Southern Sichuan Basin. Minerals. 2024; 14(2):171. https://doi.org/10.3390/min14020171
Chicago/Turabian StyleMa, Xiao, Jinqi Xu, Wenhui Liu, Yaohua Wang, Huricha Wu, and Jingqiang Tan. 2024. "Developing Characteristics of Shale Lamination and Their Impact on Reservoir Properties in the Deep Wufeng–Longmaxi Formation Shale of the Southern Sichuan Basin" Minerals 14, no. 2: 171. https://doi.org/10.3390/min14020171
APA StyleMa, X., Xu, J., Liu, W., Wang, Y., Wu, H., & Tan, J. (2024). Developing Characteristics of Shale Lamination and Their Impact on Reservoir Properties in the Deep Wufeng–Longmaxi Formation Shale of the Southern Sichuan Basin. Minerals, 14(2), 171. https://doi.org/10.3390/min14020171