Article

Mesozoic and Cenozoic Tectono-Thermal Reconstruction of the Southern Ordos Basin: Revealed by Apatite Fission Track and (U-Th)/He Dating

1
Oil and Gas Survey, China Geological Survey, Beijing 100083, China
2
Key Laboratory of Unconventional Oil and Gas, China Geological Survey, Beijing 100083, China
3
State Key Laboratory of Oil and Gas Reservoir Geology and Exploitation, Chengdu University of Technology, Chengdu 610059, China
4
Institute of Geology and Geophysics, Chinese Academy of Sciences, Beijing 100029, China
*
Author to whom correspondence should be addressed.
Minerals 2024, 14(2), 172; https://doi.org/10.3390/min14020172
Submission received: 1 December 2023 / Revised: 28 January 2024 / Accepted: 29 January 2024 / Published: 5 February 2024
(This article belongs to the Special Issue Low-Temperature Thermochronology and Its Applications to Tectonics)

Abstract

:
The Ordos Basin is rich in oil and gas resources in the Paleozoic strata. The southern part of the basin boasts a thick Paleozoic sedimentary sequence, enriched organic matter, favorable sedimentary facies, and hydrocarbon source rocks with an over-mature thermal evolution stage. However, the lack of in-depth study of the tectono-thermal evolution in the southern basin limits regional oil and gas exploration. In this study, drill core and outcrop samples were collected from the Shanbei Slope and the Weibei Uplift, respectively. These samples were subjected to apatite fission track (AFT) and (U-Th)/He dating (AHe). The results were used to reconstruct the thermal history of the southern basin, calculate exhumation rates, and analyze the tectonic evolution of the basin. The seven annealed AFT data values from the Shanbei Slope range from 21.4 to 52.8 Ma, with mean track lengths of 13.24 μm, and the twelve unannealed AFT data values from the Weibei Uplift range from 111.9 to 204.6 Ma. The seven AHe data values from the Shanbei Slope range from 17.0 to 31.8 Ma, and the eight AHe data values from the Weibei Uplift range from 31.7 to 47.5 Ma. The thermal history is characterized by a prolonged phase of burial and heating from the Triassic to the Late Early Cretaceous, followed by a phase of uplift and cooling that continued into the Cenozoic. This cooling phase exhibits three distinct stages with varying rates of uplift and cooling. According to the dating results, the cooling timing of the southern basin was earlier than that of the central part, and the southern basin experienced higher uplift rates during the Paleogene than in other periods of the Cenozoic. This may be attributed to the far-field effects of the collision between the Indian Plate and the Eurasian Plate during the Paleogene.

1. Introduction

For decades, studying the thermal history of basins has constituted a crucial aspect of the analysis of basins [1,2,3,4,5,6,7,8,9,10]. It can provide significant information about tectono-thermal events during basin evolution [11,12], as well as the coupling of basin-mountain processes such as uplift and erosion [13,14,15]. Furthermore, the thermal history of a basin exerts control over various energy and mineral resources within the basin [11], including the generation and accumulation of resources like coal, uranium, oil, and natural gas [16]. The study of basin thermal history has evolved from qualitative to semi-quantitative and ultimately quantitative methods [17]. It has progressively gained prominence in the field of deep basin tectonic evolution and the quantitative assessment of oil and gas resources [6]. Nowadays, it stands as one of the forefront and focal points in the domains of basin dynamics research and oil and gas production studies [7,18].
The Ordos Basin, situated in central China, stands as one of the largest sedimentary basins in China and is renowned for its significant oil and gas production [19,20]. The central, eastern, and northern regions of the Ordos Basin have revealed substantial oil and gas fields within the Paleozoic strata. Notably, the Lower Paleozoic Ordovician Majiagou Formation has unveiled a world-class integrated gas field—the Jingbian Gas Field [21]. However, exploration efforts for oil and gas in the southern basin’s Lower Paleozoic strata have faced challenges in achieving significant breakthroughs [22,23,24,25,26]. In recent years, several Chinese petroleum companies including CNPC, Sinopec, and Yanchang Petroleum Group have shifted their research focus from the internal basin area to the peripheral tectonic zones, resulting in noteworthy discoveries of Paleozoic oil and gas resources in the southern part of the basin [27]. Fields such as the Yichuan Gas Field, the Huanglong Gas Field, and the Qingcheng Gas Field have been successively found, indicating promising exploration prospects in the southern region of the Ordos Basin [22]. The southern basin boasts a thick Paleozoic sedimentary sequence, enriched organic matter, favorable sedimentary facies, and hydrocarbon source rocks with an over-mature thermal evolution stage [28]. Influenced by a complex interplay of tectonic systems such as the Paleo-Asian Ocean, Tethys-Paleo-Pacific Ocean, Indian-Pacific Ocean, and Siberian-Eurasian plates, the Ordos Basin has undergone multiple tectonic-sedimentary cycles since the Paleozoic era [29,30,31,32,33,34]. The complex tectono-thermal evolution process of the basin, coupled with the lack of key data points and precise geological frameworks, has resulted in a relatively underdeveloped understanding of the southern basin’s tectono-thermal history [35,36]. This knowledge gap has hindered the advancement of oil and gas exploration efforts in the southern part of the basin.
Among various thermochronology methods, apatite fission track (AFT) and (U-Th)/He dating (AHe) are often used to study hydrocarbon-bearing basins [37,38] due to their ability to recover the basin evolution temperature range (40–110 °C) [39,40,41], which is close to the temperature of oil and gas generation [8,42]. Although low-temperature thermochronology methods have been applied in the Ordos Basin, there are still some shortcomings: one is that most previous studies used AFT [43,44], whereas AHe, which is a technology developed in recent years, has not been widely used in the Ordos Basin [36]; the other is that the southern part of the basin, especially the Weibei Uplift, has a relatively low level of research due to the lack of oil and gas discoveries in the early stage, and vitrinite reflectance [45,46] and bitumen reflectance [25,26] have mostly been used to reconstruct the thermal history of the region.
With increased efforts in oil and gas exploration in the southern region of the Ordos Basin, this study has been supported by multiple research projects in recent years. The study involved the systematic sampling of numerous boreholes and outcrop sections in the southern basin. Subsequently, AFT and AHe were applied to the collected samples. Benefiting from comprehensive drilling geological data, geological frameworks, and sample testing results, the study delved into various aspects of the southern Ordos Basin. These aspects included the erosion cooling period, the tectonic uplift process, and the differentiation of the southern part of the Ordos Basin. Through the approach, the study has achieved a novel understanding of the tectono-thermal evolution history of the southern Ordos Basin.

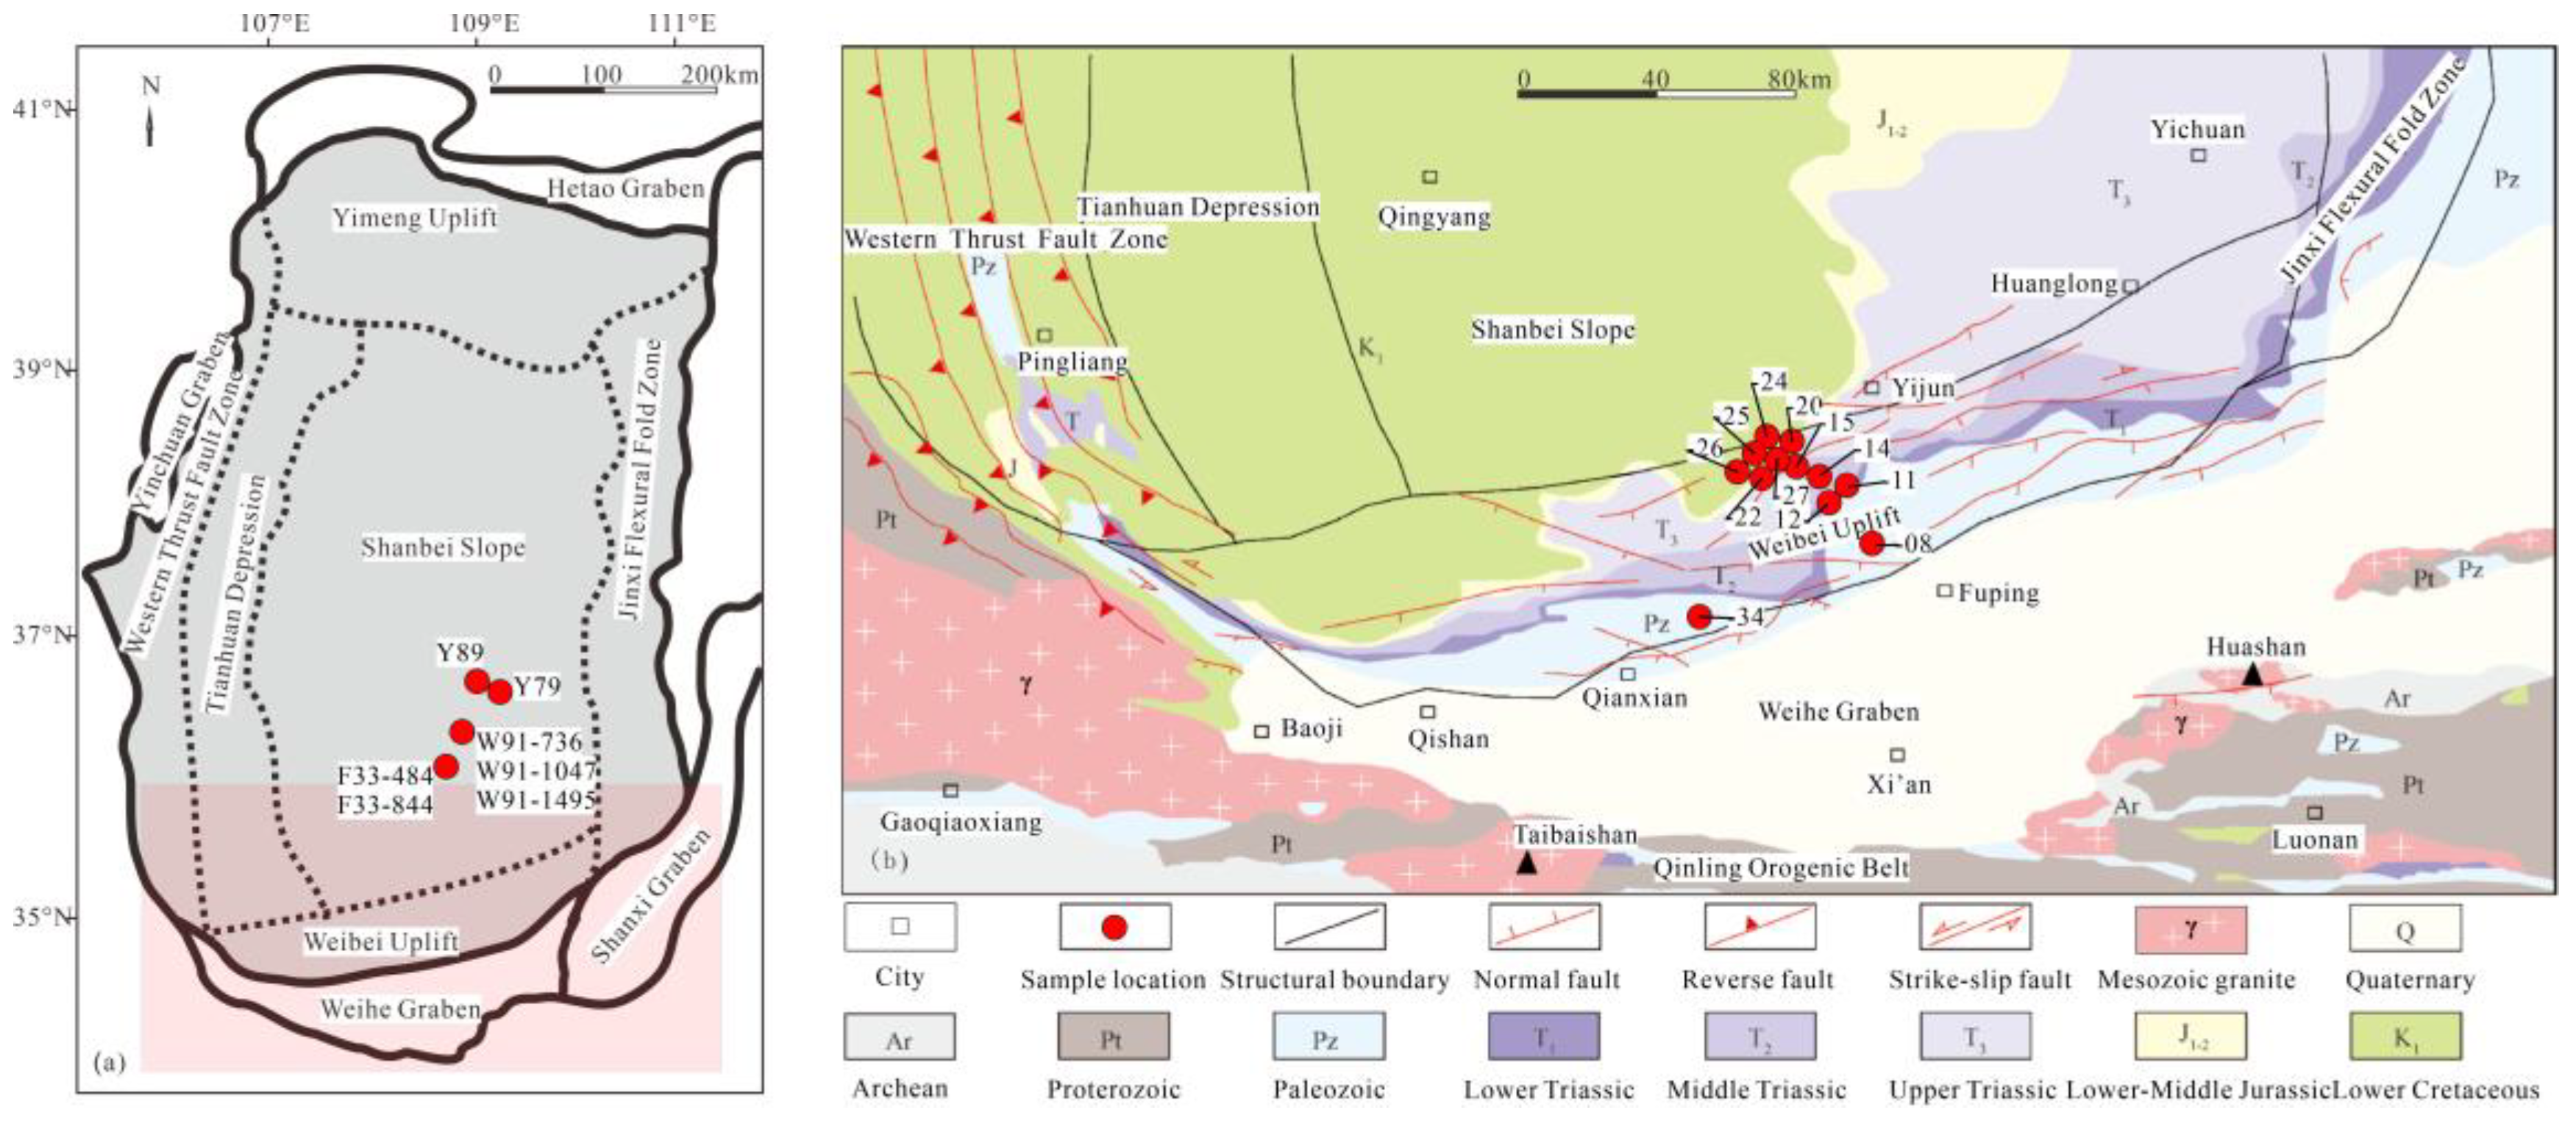
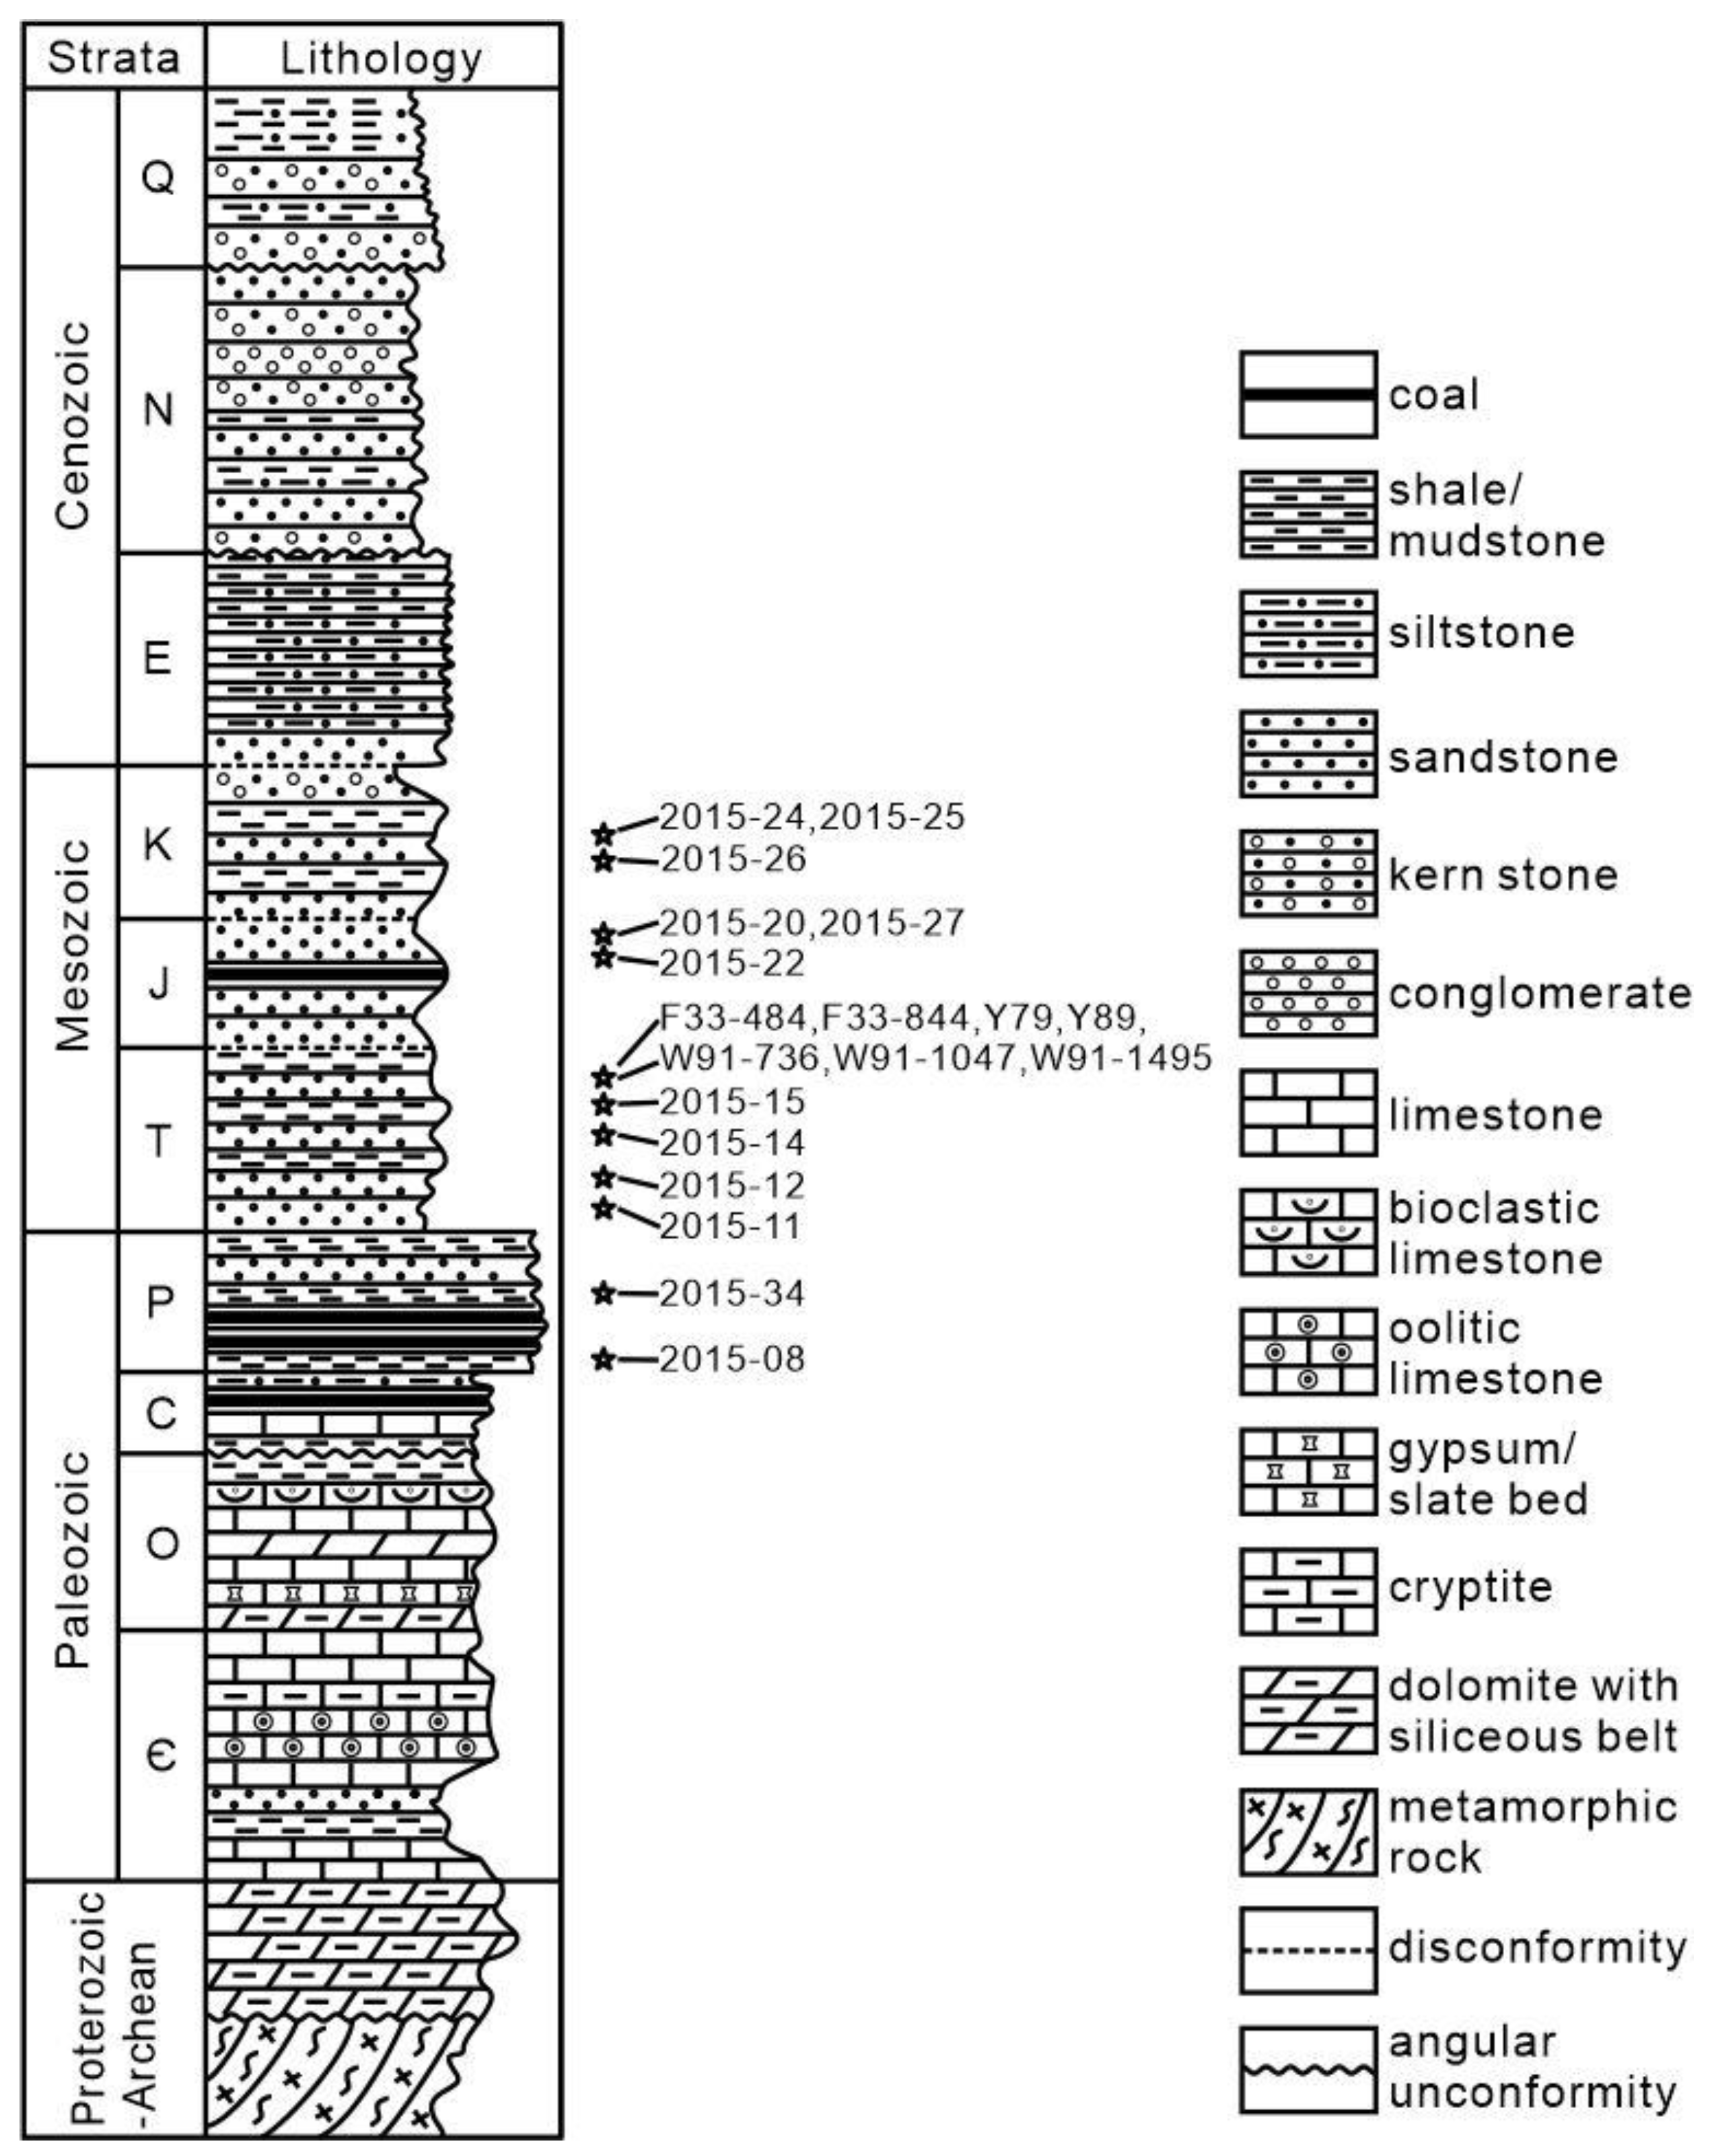
2. Geological Setting

The Ordos Basin is a large superimposed basin that has undergone multiple cycles of sedimentary and tectonic evolution. Previous structural research indicates distinct phases in its evolution. During the Middle to Late Proterozoic, the basin exhibited characteristics of rift basin evolution. In the Paleozoic era, it transitioned into a stable cratonic basin stage, featuring extensive marine carbonate sedimentation and reflecting the characteristics of a passive continental margin sea and nearshore basin. The Early to Middle Mesozoic period showcased characteristics of an intracratonic basin evolution, marked by the accumulation of abundant clastic sedimentary layers. Since the Late Cretaceous, the basin has entered a stage of peripheral rift basin development. Particularly, the influence of the Himalayan orogeny since the Cenozoic has led to a phase of overall uplift in the basin. Simultaneously, a series of peripheral rifts have formed, giving rise to a multitude of rifts such as the Weihe Graben, Shanxi Graben, and Hetao Graben (Figure 1) [45,46,47,48,49,50].
The southern part of the Ordos Basin mainly comprises secondary tectonic units such as the southern Shanbei Slope and the Weibei Uplift. Geotectonically, it is adjacent to the northeastern margin of the Qinghai-Tibet Plateau and faces the Qinling orogenic belt across the Weihe Graben. The region has developed Proterozoic, Lower Paleozoic (Cambrian, Ordovician), Upper Paleozoic (Upper Carboniferous, Permian), Mesozoic (Triassic, Jurassic, and Lower Cretaceous), and Cenozoic (Paleogene, Neogene, and Quaternary) strata, with Silurian, Devonian, Lower Carboniferous, and Upper Cretaceous missing (Figure 2) [51]. During the Early Paleozoic, as the ancient Qinling Ocean, a remnant of the Paleo-Tethys Ocean, subducted and disappeared northward, a significant mountain-building event occurred in the southern basin. This led to the formation of a series of thrust faults and folds in the southwestern part of the basin, with deformation intensity gradually weakening from the peripheral structural zone towards the interior of the basin [52,53,54,55]. A noticeable angular unconformity marks the contact between the Upper and Lower Paleozoic strata [52,53]. During the Hercynian-Indosinian period, the basin primarily experienced subsidence. The Carboniferous to Middle Jurassic sedimentary records are well preserved (Figure 2). In the Late Jurassic, due to the convergence of the Paleo-Tethys Ocean along the basin’s margins, and under the influence of the far-field effect of the convergence of the Paleo-Pacific Plate and Siberian Plate to the Eurasian continent, the basin was dominated by compression and uplift [29,54]. During the Yanshanian period, an intense tectonic deformation occurred in the southern part of the basin, progressing from south to north, resulting in a series of anticlinal structures and large-scale north-verging thrust faults [52,53,54,55]. The cross-section exhibits a south-dipping, north-thrust imbricate fault zone, and in planar view, it displays a characteristic of stronger activity in the south and weaker activity in the north. Extensive folding and faulting occurred in the southern part, causing deformation in all strata below the Jurassic, showing an angular unconformity with the Upper Cretaceous [25,26]. Since the Himalayan period, the southern part of the Ordos Basin has experienced rapid uplift and significant erosion [55,56], exposing Cambrian-Ordovician marine carbonate formations at the surface. In summary, influenced by various active tectonic plates, the southern part of the basin has undergone multiple cycles of sedimentation and tectonics since the Paleozoic era. Its tectonic evolution history is complex, with weak research on the specific timing of activities and uncertainties regarding the differential evolution of different stages of tectonics.

3. Sampling and Experimental Methods

Low-temperature thermochronology methods, such as AFT and AHe, are sensitive to the cooling history of rocks through temperature intervals between 300 and 20 ℃. Therefore, these methods can only record the cooling or uplift events in sedimentary basins if the samples underwent track annealing or He diffusion at high temperatures after deposition and were subsequently exhumed to low temperatures [58]. The tectonic evolution history of the Ordos Basin can be broadly divided into early sedimentary burial and continuous uplift and erosion since the Late Cretaceous [50]. As a result, samples from the Ordos Basin are suitable for conducting low-temperature thermochronological studies. The samples used for low-temperature thermochronology dating in this study were sourced from two main regions. One set of samples originated from the drill cores (Table 1) of four boreholes (F33, Y79, Y89, and W91) in the southern Shanbei Slope of the Ordos Basin (Figure 1a), and the other set came from outcrop samples (Table 1) in the Weibei Uplift of the southern Ordos Basin (Figure 1b).
AFT and AHe methods measure the cooling history of rocks through specific temperature intervals, known as the partial annealing or retention zone (AHe: 40–75 °C; AFT: 60–110 °C) [39,40,41]. These methods can be used to estimate the rate and timing of exhumation of geological units in the upper crust [59,60]. We applied traditional mineral separation techniques (heavy liquid such as SPT and DIM, as well as magnetic separation) to isolate apatite grains from the samples. We performed AFT and AHe analyses at the University of Melbourne (Melbourne, Australia). We followed the low-temperature thermochronology analytical procedures described by Gleadow et al. (2015) [61].
We used a Zeiss Axio Imager M1m microscope to acquire data for AFT analysis. This microscope is equipped with Track-Works and Fast-Tracks software (v3.0.13, University of Melbourne), developed by the Melbourne thermochronology group [61]. We determined the uranium concentrations of corresponding grains using an Agilent 7700 LA-ICP-MS (Agilent Technologies Inc, Santa Clara, USA) equipped with a New Wave UP-213 laser. We measured the etch pit diameters (Dpar) as the kinetic parameter for thermal history modeling. To enhance the reliability of the dataset for inverse modeling, two mounts were prepared for all samples—one for age acquisition and another for the confined track length measurement. In the latter, to augment the number of confined track lengths available for measurement, we implanted 252Cf tracks into polished grains. Additional details of the AFT analytical procedures can be found in Gleadow et al. (2015) [61].
We immersed apatite grains in ethanol and examined them under polarized light to detect mineral inclusions. Only clear and well-formed (euhedral) grains were chosen for AHe analysis. These selected samples were then loaded into platinum capsules and subjected to outgassing under vacuum at 900 °C for 5 min using a fiber-optically coupled diode laser (820 nm wavelength). Subsequently, we spiked the samples with 3He and determined gas volumes using a Balzers quadrupole mass spectrometer. We obtained AHe data through the total dissolution of outgassed apatite in HNO3 and analyzed this using the Varian quadrupole inductively coupled plasma mass spectrometer (ICP-MS) located in the School of Earth Sciences at the University of Melbourne. Unless stated otherwise, AHe ages were calculated and corrected for α-emission, following the approach outlined in Farley et al. (1996) [62]. The analytical uncertainties for the AHe facility are evaluated to be 6.2% (±1σ), encompassing the α-correction-related component and considering an estimated 5 μm uncertainty in grain size measurements, ICP-MS uncertainties, and gas analysis.

4. Results and Interpretation
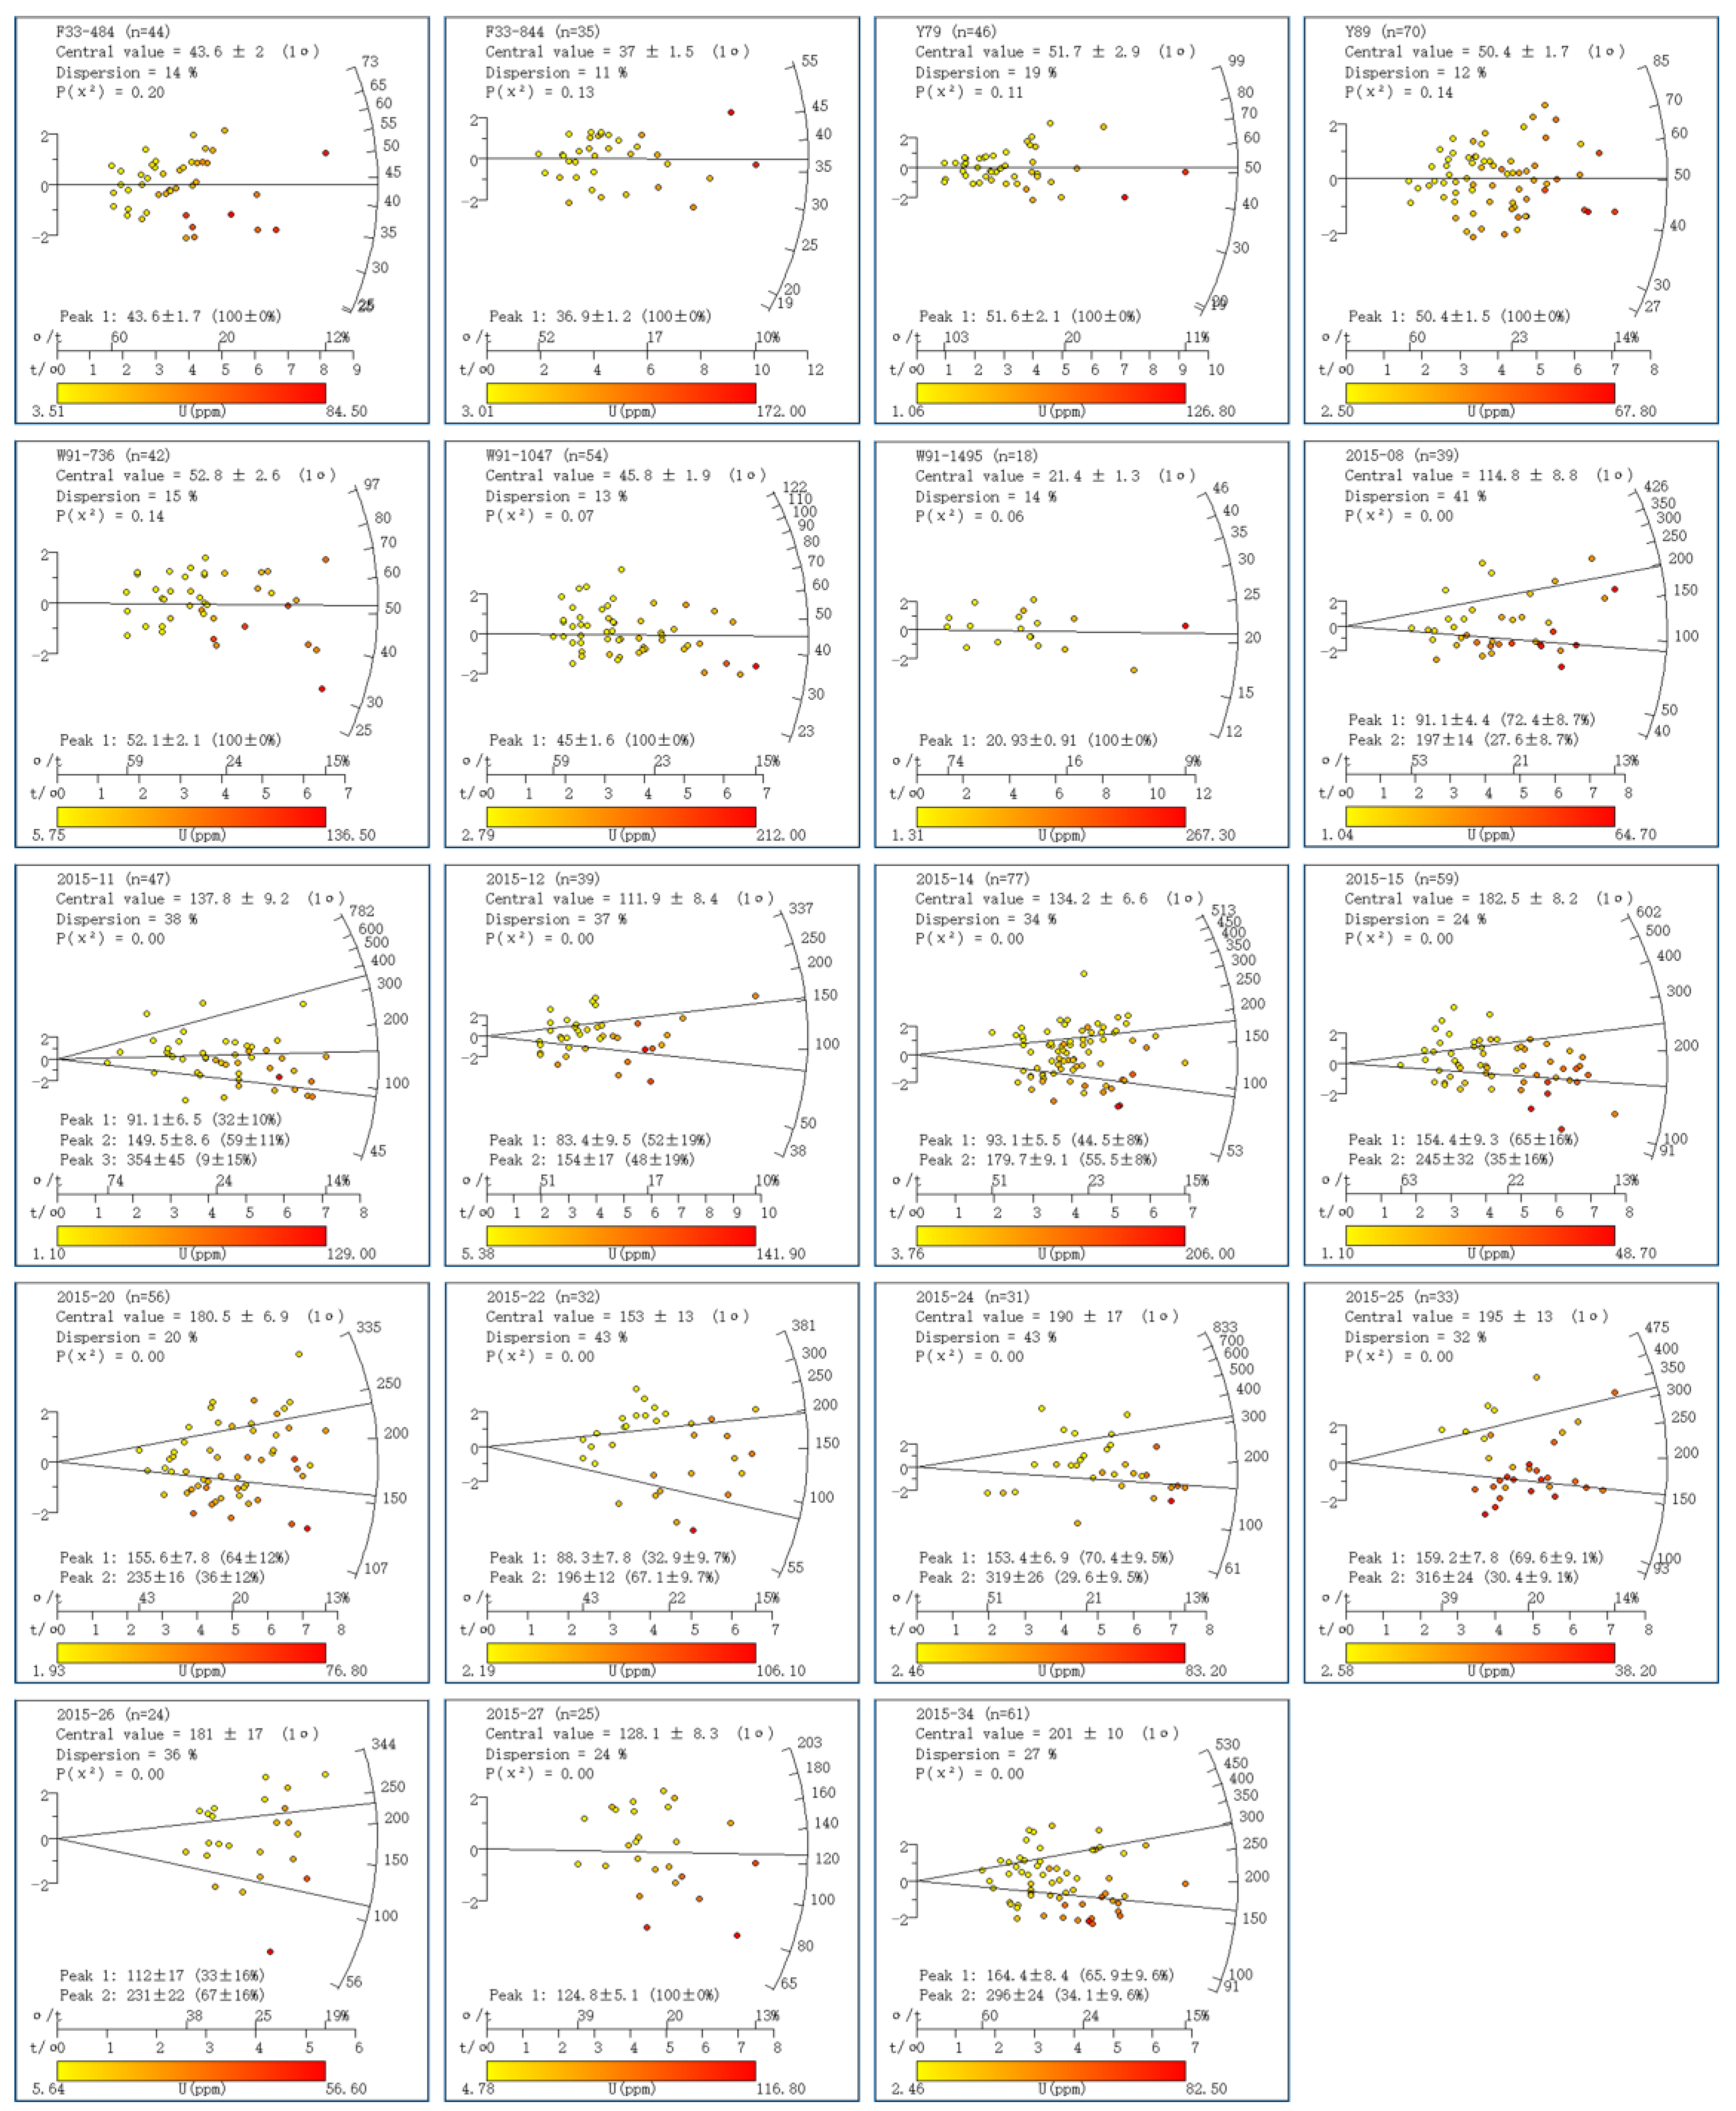
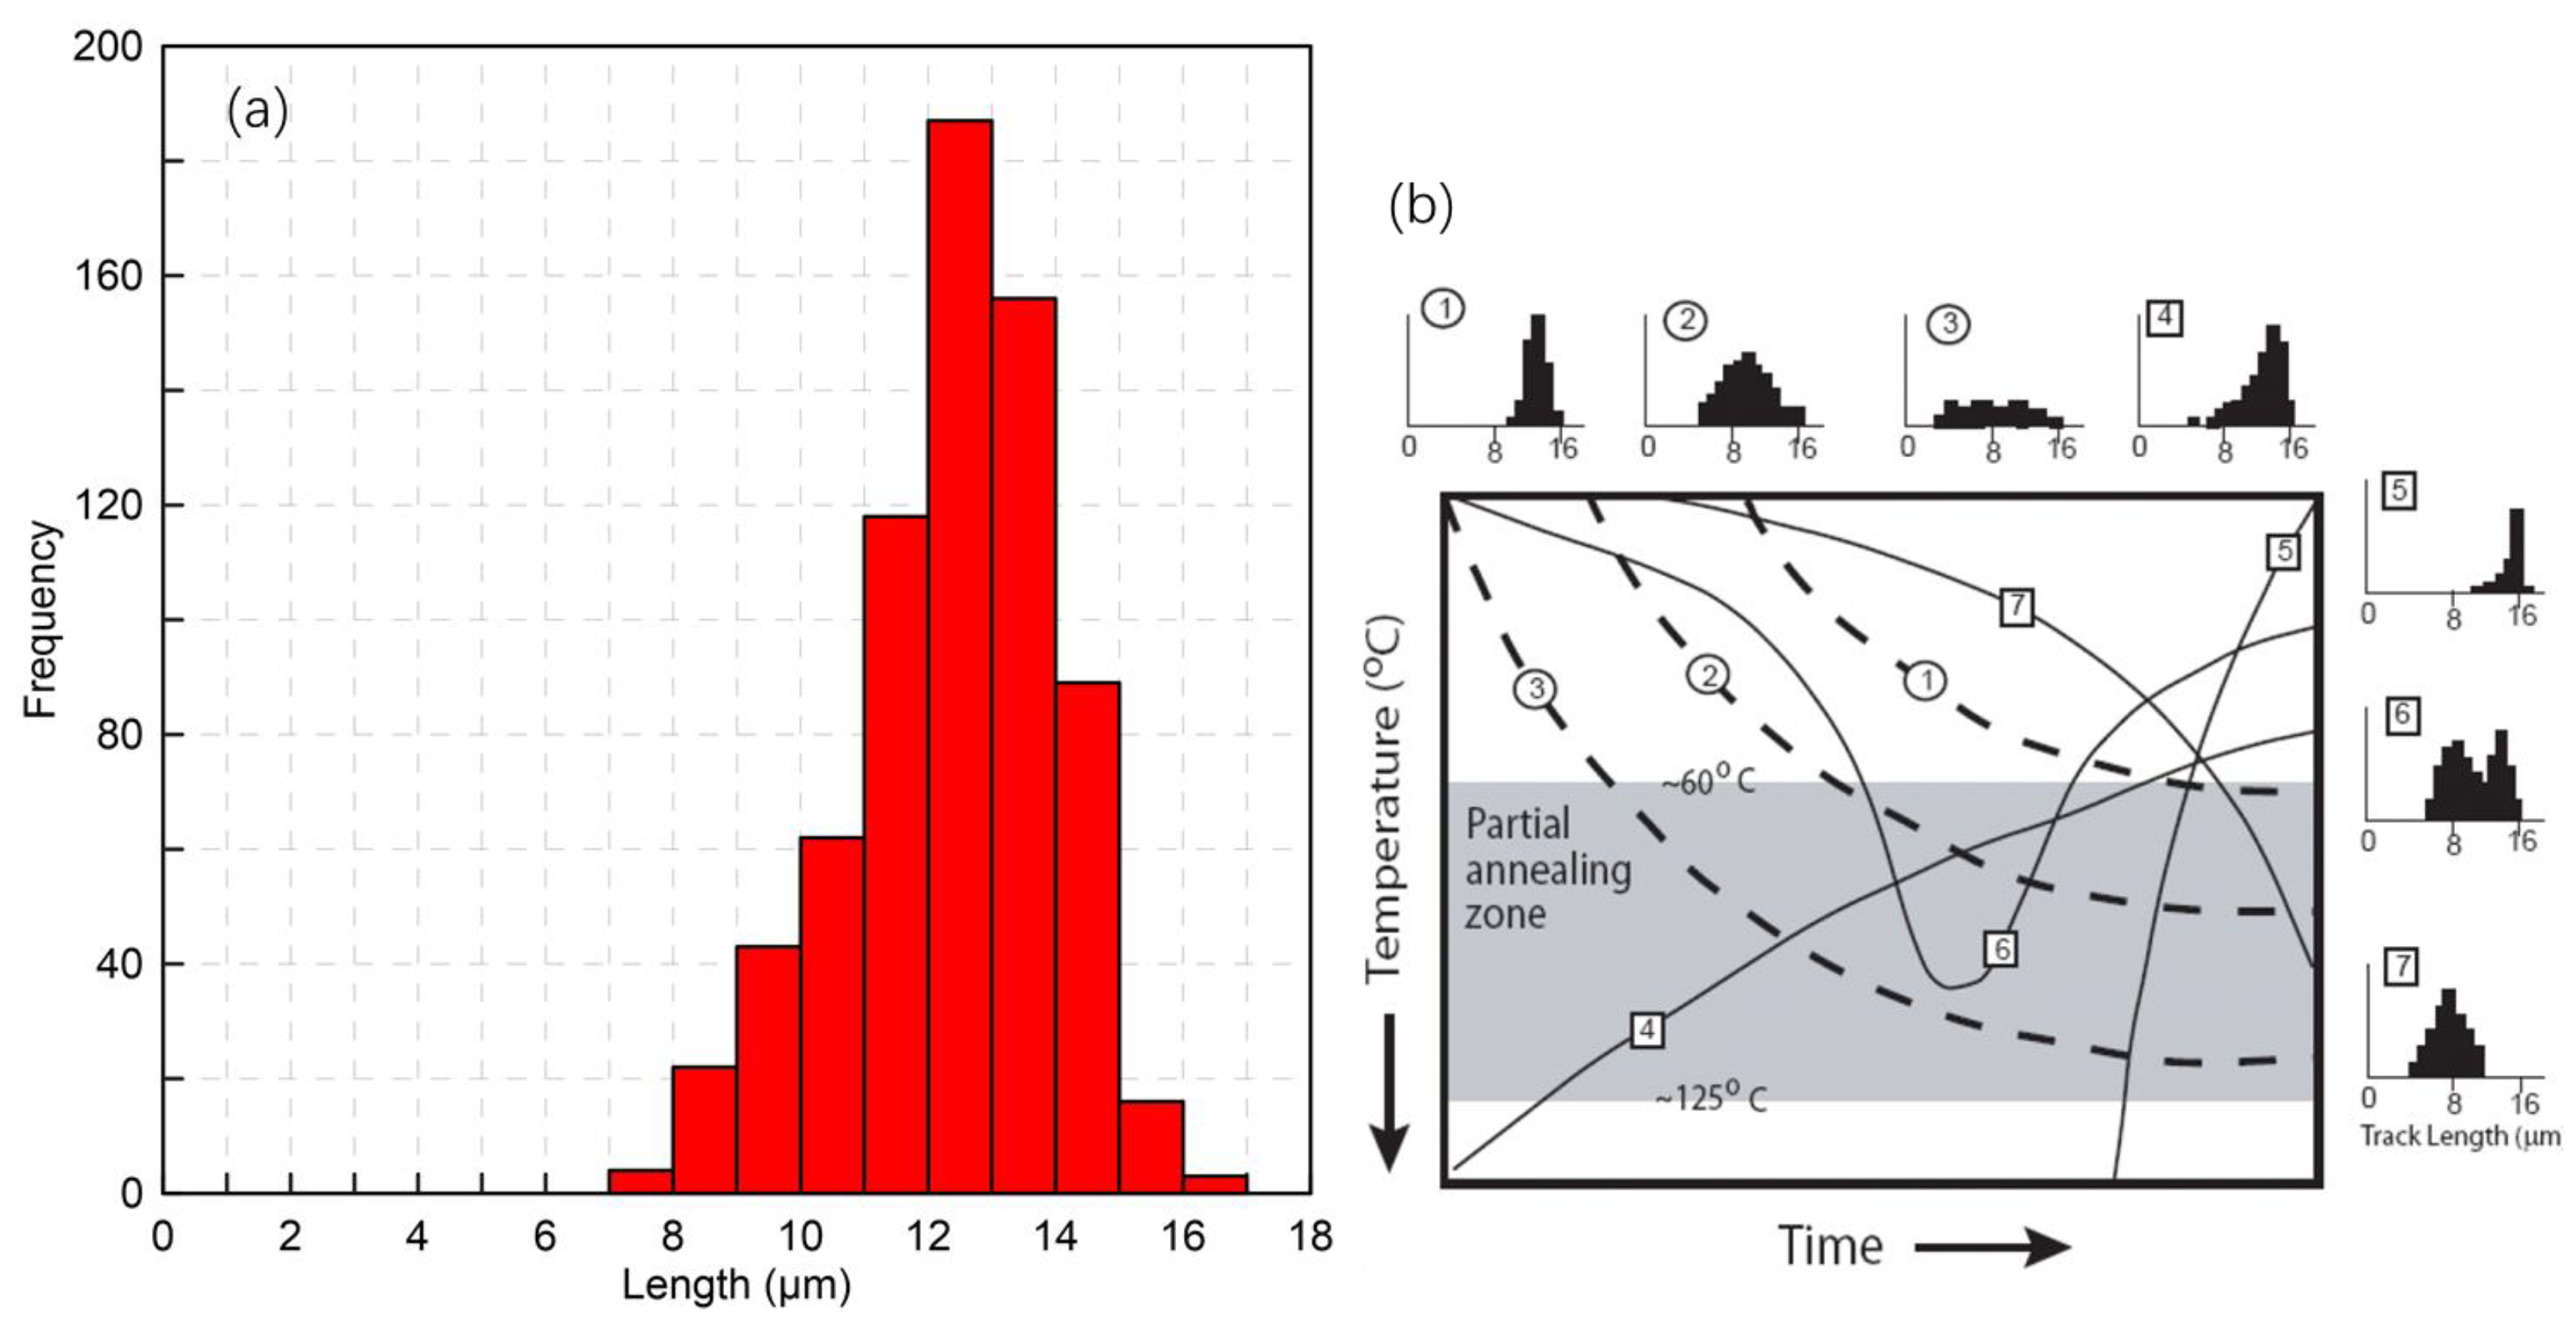
4.1. AFT Data

In this study, a total of 19 AFT samples were tested, comprising a total of 832 grains. The testing results are presented in Table 2. These results were plotted using RadialPlotter [63] to visualize the distribution of the AFT ages. Graphical representations of the results are shown in Figure 3.
Upon analyzing the apparent ages of all AFT samples, it is evident that the core samples from the southern Shanbei Slope exhibit relatively young ages, ranging from 21.4 to 52.8 Ma, whereas the outcrop samples from the Weibei Uplift possess comparatively older ages, ranging from 111.9 to 204.6 Ma. Comparing the apparent ages of the samples to their corresponding stratigraphic ages (Table 2), the samples can be roughly categorized into four types: first, the apparent ages significantly younger than stratigraphic ages, including all core samples; second, the apparent ages slightly younger than stratigraphic ages, including samples 2015-08, 2015-11, 2015-12, and 2015-14; third, the apparent ages relatively close to stratigraphic ages, including samples 2015-15, 2015-22, 2015-27, and 2015-34; fourth, the apparent ages greater than stratigraphic ages, including samples 2015-20, 2015-24, 2015-25, and 2015-26. Based on the chi-squared probability tests P(χ2) for each set of samples, only the P(χ2) values for the core samples are greater than 5%, indicating that the particles within these samples reflect the same component’s apparent ages. In contrast, the P(χ2) values for the outcrop samples are less than 5%, suggesting that the apparent ages of particle samples reflect information from different source areas. Additionally, the core samples generally show a single age–peak distribution, whereas most of the outcrop samples exhibit a multi-age–peak distribution. Considering the comparison between apparent ages and stratigraphic ages, P(χ2) values, and the distribution of individual particle ages, it can be deduced that the core samples from the southern Shanbei Slope have undergone total annealing, allowing the individual particle ages to reflect the ages of basin tectono-thermal events. Conversely, the outcrop samples from the Weibei Uplift have not experienced total annealing, resulting in apparent ages of individual particles reflecting either source area information or mixed ages. The second type of samples (2015-08, 2015-11, 2015-12, and 2015-14) underwent a relatively high degree of annealing, yet their apparent ages were not completely reset. As a result, their apparent ages are slightly younger than stratigraphic ages, and their P(χ2) values are less than 5%. The third type of samples (2015-15, 2015-22, 2015-27, and 2015-34) experienced a milder annealing process compared to the second type, resulting in apparent ages relatively close to stratigraphic ages. The fourth type of samples (2015-20, 2015-24, 2015-25, and 2015-26) underwent the least amount of annealing or remained completely unannealed, thus reflecting information from the source area in their apparent ages.

4.2. AHe Data

In this study, a total of 15 AHe samples were tested, comprising a total of 59 grains. The testing results were analyzed using Isoplot [64], and detailed testing information for AHe is provided in Table 3.
The apparent AHe ages of all samples are significantly younger than the stratigraphic ages, indicating that the AHe ages of all samples have been reset. Due to the lower closure temperature of the AHe dating system compared to AFT, the AHe ages are more easily reset. The outcrop samples’ AFT ages have not been reset, whereas the AHe ages have been reset. This suggests that the maximum temperature experienced by the strata of the outcrop samples in the Weibei Uplift exceeded 75 °C [39] but did not reach 110 °C [40,41]. Among all the AHe results, the AHe ages of the core samples from the Shanbei Slope range from 17.0 to 31.8 Ma. Within the same borehole, the AHe ages of deep samples are younger than those of shallow samples, reflecting the timing of samples from different depths passing through the AHe system closure temperature well. The AHe ages of the outcrop samples from the Weibei Uplift range from 31.7 to 47.5 Ma, primarily concentrated around 40 Ma. This indicates a rapid exhumation and cooling event that occurred in the Weibei Uplift during the Eocene, causing the strata to cool rapidly and uplift to the surface, thus beginning the record within the AHe system. Comparing the AHe results of the core samples with those of the outcrop samples reveals that the uplift and exhumation event in the southern basin happened earlier, during the Eocene, whereas the timing in the central basin is later, during the Oligocene.

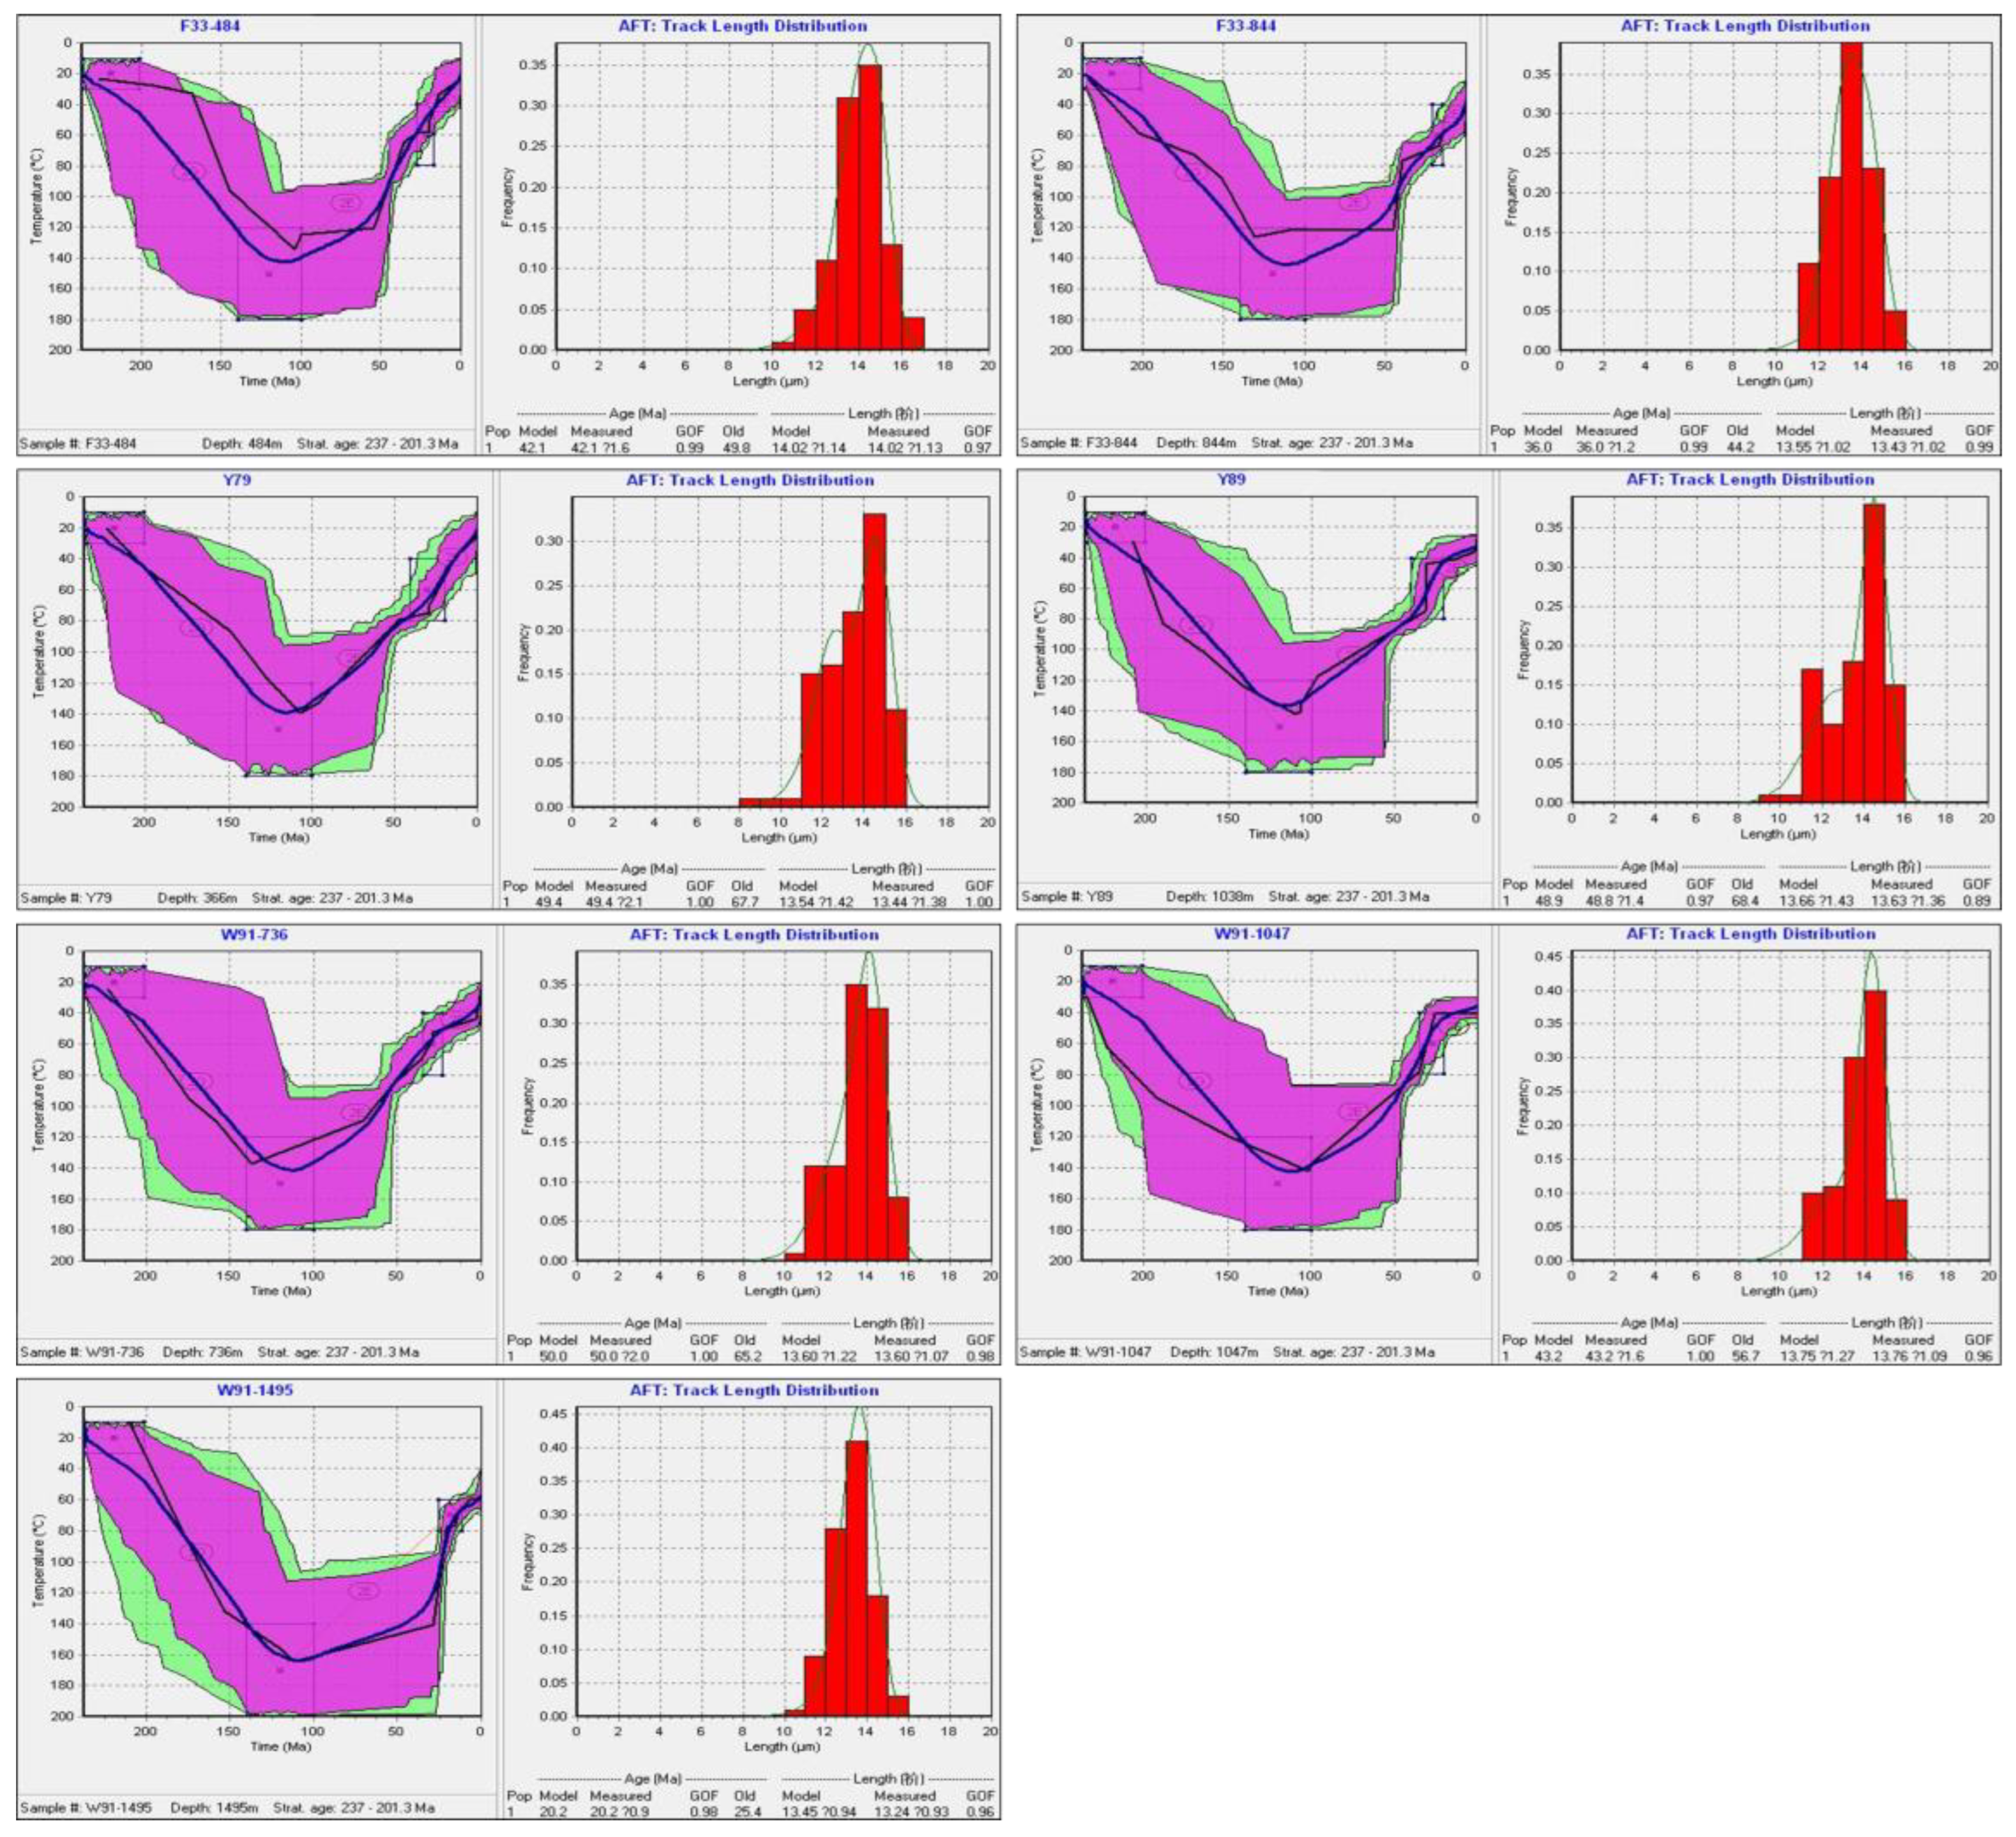
5. Thermal History Inversion and Interpretation

The apparent ages of AFT do not contain direct geological significance [59]. It is necessary to combine the track length data with the thermal annealing kinetics parameters of the AFT to simulate the thermal history of the basin. In this study, HeFTy software (v1.9.1, developed by Richard Ketcham.) [65,66] was used for thermal history modeling based on AFT data. The modeling employed the multiple-apatite annealing model [66,67] and the Monte Carlo inverse modeling method, with Dpar as a kinetic parameter. The AHe data were modeled using the helium diffusion model [68]. The simulation used a random inversion method. The condition for ending the simulation was to obtain 200 good-fitting thermal history paths, that is, the thermal history paths with a goodness of fit (GOF) greater than 0.5 between the simulation results and the measured results. According to the present-day geothermal characteristic of the basin [69], a temperature of 10 ℃ was assumed for the mean present surface. The premodeling settings of the inversion were always included with large uncertainties to give the inversion algorithm sufficient freedom to search for a wide range of possible thermal histories. As the outcrop samples from the southern part were not completely reset and contained source area information, they were not used for thermal history modeling. Only the AFT results from the core samples in the central part of the basin, which were fully reset, were selected for thermal history modeling.
To prepare for thermal history modeling using the reset AFT data from the core samples, the track lengths of these core samples were measured. All core samples’ track lengths exhibited a single-peaked distribution (Figure 4a), with relatively long track lengths, averaging greater than 13.24 μm. This distribution is similar to paths 4 and 5 in Figure 4b, indicating continuous exhumation and cooling in the central part of the basin. The samples underwent a relatively straightforward thermal history process, transitioning from the annealing zone to the unannealed zone.
The thermal history paths of the core samples are shown in Figure 5. The blue line can be regarded as the burial and uplift history of the strata where the samples were located.
F33-484 and F33-844: Both samples come from the same borehole. After sedimentation in the Triassic, they experienced rapid burial and heating, reaching total annealing around 140 Ma. After the Late Early Cretaceous, as the basin experienced uplift and erosion, the samples began to cool.
Y79 and Y89: Since sedimentation in the Triassic, both samples underwent rapid burial and heating, reaching total annealing around 130–150 Ma. After the Late Early Cretaceous, as the basin experienced uplift and erosion, the samples began cooling.
W91-736, W91-1047, and W91-1495: These samples come from the same borehole. Since sedimentation in the Triassic, they experienced rapid burial and heating, achieving total annealing around 150–155 Ma. After the Late Early Cretaceous, as the basin underwent uplift and erosion, the samples started cooling.
Based on the thermal history inversion results from the seven core samples, it is evident that the thermal history path experienced in the central part of the basin is relatively simple, characterized by rapid exhumation and cooling from the total annealing zone to the unannealed zone [57,71]. From the Triassic to the Late Early Cretaceous, it was a continuous burial and heating stage. After the Late Early Cretaceous, it began to uplift and cool, and the cooling process was roughly divided into three stages. In the Late Cretaceous, the uplift and cooling rate was slow. In the Paleogene, the basin began to uplift and cool rapidly. After entering the Neogene, the uplift and cooling rate of the basin decreased. In summary, the thermal history of the central part of the basin is characterized by a prolonged phase of burial and heating from the Triassic to the Late Early Cretaceous, followed by a phase of uplift and cooling that began in the Late Early Cretaceous and continued into the Cenozoic. This cooling phase exhibits three distinct stages with varying rates of uplift and cooling.

6. Discussion

6.1. Cooling Events Revealed by Low-Temperature Thermochronology

The AFT ages from core samples show a strong correlation with depth. Within the same borehole, shallow samples tend to yield older ages, whereas deeper samples yield younger ages. This indicates that during the uplift and exhumation processes in the central part of the basin, shallow samples re-entered the closure temperature zone, allowing them to record their ages earlier than deeper samples. This correlation allows for a rough estimation of the uplift and exhumation rates in the central basin. For example, two samples from borehole F33 record an uplift and exhumation event in the Eocene, with an estimated rate of approximately 54.5 m/Ma. Similarly, three samples from borehole W91 record uplift and exhumation events, with an estimated rate of around 44.4 m/Ma for the Eocene and approximately 18.4 m/Ma for the Oligocene, with an average rate of approximately 24.2 m/Ma. It is important to note that the cooling rate from a single borehole cannot accurately reflect the uplift of the basin.
In addition, since the outcrop samples from the Weibei Uplift did not experience complete resetting, their AFT ages represent mixed ages resulting from partial annealing of the source area information. No significant correlation was observed between their AFT ages and elevation or geographical coordinates, making it inadequate for addressing this issue.
Based on the AHe results obtained in this study, a rough estimate of the uplift and exhumation rates of the basin during this period can be calculated. In the central part of the basin, specifically in the Shanbei Slope area (borehole F33), two samples record an uplift and exhumation event in the Miocene, with an estimated rate of approximately 80 m/Ma. Similarly, in borehole W91, three samples record uplift and exhumation events, with rates of around 111 m/Ma for the Late Oligocene and approximately 50 m/Ma for the Early Miocene. The average uplift and exhumation rate for this region is estimated to be approximately 64 m/Ma. Similar to AFT data, the AHe data from a single borehole cannot accurately represent the uplift rate of the basin.
To calculate the uplift and exhumation rate for the southern part of the basin, specifically the Weibei Uplift, from the Eocene to the present day, it is necessary to obtain the geothermal gradient of the Weibei Uplift during this period. This calculation is based on the equation “exhumation rate × age = (closure temperature − surface temperature)/geothermal gradient” [72]. According to available data, the average geothermal gradient of the Weibei Uplift from the Eocene to the present day is 34 °C/km [73], the average surface temperature is 10 °C (from local meteorological offices), and the AHe system closure temperature is 75 °C [39]. Therefore, the calculated average exhumation amount for the Weibei Uplift from the Eocene to the present day is approximately 1911 m. This corresponds to an exhumation rate ranging between 40 and 60 m/Ma, with an average of approximately 47 m/Ma.
Considering that both AFT and AHe dating methods for the core samples have experienced total annealing and have recorded cooling events during the Paleogene, it is possible to roughly calculate the basin’s uplift and exhumation rates using the results from both dating methods for the same samples. The calculation is based on the equation “exhumation rate × (fission track age − (U-Th)/He age) = (fission track closure temperature − (U-Th)/He closure temperature)/geothermal gradient” [72]. According to the existing research, the average geothermal gradient of the basin in the Paleogene is 34 °C/km [73], the closure temperature of AFT is 110 °C [40,41], and the closure temperature of the AHe system is 75 °C [39]. Based on the calculation, the erosion amount of the basin in the Paleogene is about 1029 m, and the erosion rate ranges from 39 to 52 m/Ma, with an average of about 46 m/Ma.
Overall, considering the differing temperature sensitivities of different low-temperature thermochronology methods (AHe < AFT), the AHe ages and AFT ages of the core samples from the Shanbei Slope have experienced complete resetting. The AHe ages of the outcrop samples from the Weibei Uplift have also undergone complete resetting, and AFT results show partial annealing or unannealing. Furthermore, from all the low-temperature thermochronology results obtained in this study, it can be observed that the basin experienced a rapid uplift and erosion event in the Eocene, and the cooling timing of the southern part of the basin was earlier than that of the central part.
It should be noted that the cooling rates calculated by the above methods may not accurately represent the uplift and erosion rate of the southern Ordos Basin. Firstly, tectonic uplift and erosion is a continuous process, during which the paleo-geothermal gradient and paleo-surface temperature of the study area may change [74], resulting in errors in parameter selection. Secondly, the topographic relief and its evolution in the study area may disturb the underground temperature field [75,76], and the existence of the constant temperature layer [69] in the region may also influence the calculation of erosion thickness. Finally, different mineral grains have different closure temperatures [77,78,79,80] due to factors such as crystal size and structure and radioactive element content and distribution; moreover, the cooling rate experienced by the mineral grains themselves will also affect their closure temperatures [81].
The Ordos Basin, rich in oil and gas resources, has numerous boreholes, and previous studies have extensively investigated the tectono-thermal evolution history of the basin [43,57]. However, most of the previous studies were based on vitrinite reflectance [46,71]. As the most reliable and commonly used organic matter paleothermometer in basin thermal history research, vitrinite reflectance has a mature chemical kinetics model [8,82]. Nevertheless, the reconstruction of thermal history through vitrinite reflectance has its limitations. Specifically, vitrinite reflectance, serving as the highest paleotemperature indicator [83,84], can only record the maximum paleotemperature experienced by the sample, and the cooling process thereafter cannot be recorded. Therefore, in the previous research results, the uplift process of the Ordos Basin from the Cretaceous to the present mostly showed a long-term stable linear uplift [45].
This study employs two low-temperature thermochronology methods to reveal variations in uplift rates during the tectonic uplift and erosion processes in the southern Ordos Basin from the Late Early Cretaceous to the present, indicating non-uniform uplift rates instead of constant and stable uplift. In comparison to organic matter paleothermometer methods, the advantages of low-temperature thermochronology lie in the reversibility of the recorded temperature information [85,86]. Even after total annealing of samples to closure temperature, the geological ages corresponding to the closure temperature can still be recorded upon subsequent cooling [87]. Fission track analysis, especially, carries both age and track length information [88]. By analyzing the distribution of track lengths in sample particles, it is possible to simulate and invert the specific evolutionary paths experienced by the samples [89]. Typically, these thermal history inversion paths exhibit stochasticity, and the credibility of the simulated paths is determined by the fit between the simulated and measured track length distributions [65]. In this study, AFT and AHe are combined, with the AHe ages of the same samples serving as constraints for AFT thermal history simulation. This approach limits the stochasticity of thermal history path inversion, significantly improving the accuracy of the thermal history reconstruction results. Therefore, the late-stage tectonic evolution trends recovered for the southern Ordos Basin in this study exhibit high credibility. Integrating multiple analytical methods and diverse data parameters, the comprehensive interpretation of low-temperature thermochronological data has become mainstream in geological research and applications [90,91].
However, this study has certain limitations. The fission tracks of the outcrop samples from the Weibei Uplift in the southern basin were not reset, and the P(χ2) values less than 5% indicated that the apparent ages of the samples cannot reflect the ages of the geological events in this area [92]. The outcrop samples only had AHe ages reset, but the age data obtained by AHe dating alone contained relatively simple information and could not reflect the evolution process of the samples. Subsequent studies in this area should select borehole samples that have experienced higher temperatures for fission track testing. Moreover, although seven samples with high-quality fission track results were obtained in this study, the spatial distribution of these samples was limited, and they all came from four boreholes within the basin. Such a limited distribution restricted the study of the tectono-thermal evolution history of the southern basin, and it was difficult to compare the differences in the evolution of different tectonic units through the thermal history inversion of fission tracks. Future research should aim to broaden the sampling range.

6.2. Tectono-Thermal Evolution of the Southern Ordos Basin

During the Ordovician, the southern part of the Ordos Basin was characterized by a carbonate platform environment. Thick deposits of marine carbonate rocks accumulated during this period, indicating a shallow marine setting. Following the Ordovician, the southern basin entered a stage of evolution characterized by a cratonic basin. During this period, tectonic activity was relatively low, and sedimentation rates rapidly decreased. This resulted in the absence of significant sedimentary deposits from the Silurian and Devonian. During this phase, the southern part of the basin experienced relatively lower strata temperatures due to reduced tectonic activity and sedimentation rates.
Entering the Carboniferous, the Ordos Basin experienced sustained subsidence. This subsidence intensified further into the Triassic, resulting in high rates of sedimentation. As a consequence, the basin accumulated thick deposits of fluvial and swampy facies in this period. During the Late Triassic, significant changes occurred in the sedimentary and paleogeographic patterns of the basin, with the northern part being relatively higher in elevation compared to the southern part. Sediment thickness decreased towards the north, and rock types transitioned from coarse sediments in the north to finer sediments in the south. The center of sedimentation and subsidence was located in the southern part of the basin. This tectonic setting and high sedimentation rates in the southern part of the basin led to a steady increase in strata temperature in the southern region.
During the Jurassic, the geological evolution of the Ordos Basin was characterized by the dominance of the Pacific Plate. At the end of the Middle Jurassic, the Pacific Plate subducted northwestward, causing large-scale volcanic eruptions in the eastern part of the North China Craton. In the western part of the North China Craton, which includes the Ordos Basin, although it did not exhibit significant volcanic activity like the eastern region, it did experience a thermal event characterized by hydrothermal activity [93]. Therefore, though the Ordos Basin did not witness large-scale volcanic eruptions, it did experience thermal events associated with the Yanshanian Movement. These events are supported not only by evidence of hydrothermal karstification but also by K-Ar age data from illite [94]. As a result, during this period, the strata below the Triassic in the basin reached their highest paleotemperatures.
The southern part of the Ordos Basin continued to receive rapid sedimentation after entering the Early Cretaceous. The Jurassic and Cretaceous strata in the southern part of the basin reached the highest paleotemperature during this period. However, in the Late Early Cretaceous, sedimentation rates in the basin dramatically decreased, and a period of uplift and erosion began. As a result of this large-scale uplift and erosion event, the paleotemperatures in the southern part of the basin gradually decreased.
In the Cenozoic, the peripheral regions of the Ordos Basin experienced strong tectonic subsidence, and the interior of the basin underwent continuous uplift. As a result, the strata temperatures in the basin have gradually decreased to the present-day values. This is in contrast to the eastern part of the North China Craton, which experienced significant extensional tectonics, lithospheric thinning, and increased geothermal heat flow during the Cenozoic. Additionally, although the southern part of the basin has been continuously uplifted and eroded throughout the Cenozoic, the uplift rates have varied slightly. The southern part of the basin experienced higher uplift rates during the Paleogene than in other periods of the Cenozoic. This may be attributed to the far-field effects of the collision between the Indian Plate and the Eurasian Plate that began during the Paleogene, influencing the uplift and erosion in the southern part of the basin [25,26].
In summary, the southern part of the Ordos Basin has undergone multiple tectonic events, including faulting and hydrothermal activity. Particularly significant has been the period of continuous uplift and erosion since the Late Early Cretaceous. This uplift has been intense, resulting in substantial erosion, and the uplift rate has been non-uniform due to the influence of far-field tectonic effects caused by collision between the Indian Plate and the Eurasian Plate. These strong tectonic modifications, especially since the late Yanshanian period, have severely disrupted the conditions for the preservation of hydrocarbon resources in the region. This is not conducive to the accumulation and preservation of oil and gas reserves in the southern part of the Ordos Basin.

7. Conclusions

This study provides an investigation of the Mesozoic and Cenozoic tectono-thermal evolution history of the southern Ordos Basin, utilizing a combination of newly acquired AFT and AHe data.
The seven annealed AFT data values from the Shanbei Slope range from 21.4 to 52.8 Ma, and the twelve unannealed AFT data values from the Weibei Uplift range from 111.9 to 204.6 Ma. The seven AHe data values from the Shanbei Slope range from 17.0 to 31.8 Ma, and the eight AHe data values from the Weibei Uplift range from 31.7 to 47.5 Ma.
The thermal history of the Shanbei Slope is characterized by a prolonged phase of burial and heating from the Triassic to the Late Early Cretaceous, followed by a phase of uplift and cooling that continued into the Cenozoic.
The cooling timing of the southern basin was earlier than that of the central part, and the southern basin experienced higher uplift rates during the Paleogene than in other periods of the Cenozoic.

Author Contributions

Conceptualization, P.G. and S.H.; methodology, S.H.; software, J.H.; validation, J.H.; formal analysis, P.G.; investigation, J.H.; resources, P.G.; data curation, J.H.; writing—original draft preparation, P.G.; writing—review and editing, J.H.; visualization, P.G.; supervision, S.H.; project administration, S.H.; funding acquisition, P.G. and S.H. All authors have read and agreed to the published version of the manuscript.

Funding

This study was financially supported by the Science and Technology Innovation Project of Oil and Gas Survey, China Geological Survey (No. 2023YC04) and the National Natural Science Foundation of China (No. 42074096).

Data Availability Statement

The data for this study are available in this manuscript.

Acknowledgments

We would like to express our gratitude to Zhenli Ren from the Northwest University for his assistance in sampling, and to Barry Kohn from the University of Melbourne for helping us with low-temperature thermochronology dating.

Conflicts of Interest

The authors declare that they have no conflicts of interest.

References

  1. Welte, D.H.; Yalçin, M.N. Basin modelling—A new comprehensive method in petroleum geology. Org. Geochem. 1988, 13, 141–151. [Google Scholar] [CrossRef]
  2. Ungerer, P.; Burrus, J.; Doligez, B.; Chénet, P.Y.; Bessis, F. Basin Evaluation by Integrated Two-Dimensional Modeling of Heat Transfer, Fluid Flow, Hydrocarbon Generation, and Migration1. AAPG Bull. 1990, 74, 309–335. [Google Scholar] [CrossRef]
  3. Petmecky, S.; Meier, L.; Reiser, H.; Littke, R. High thermal maturity in the Lower Saxony Basin: Intrusion or deep burial? Tectonophysics 1999, 304, 317–344. [Google Scholar] [CrossRef]
  4. Brandes, C.; Astorga, A.; Littke, R.; Winsemann, J. Basin modelling of the Limón Back-arc Basin (Costa Rica): Burial history and temperature evolution of an island arc-related basin-system. Basin Res. 2008, 20, 119–142. [Google Scholar] [CrossRef]
  5. Bruns, B.; Littke, R.; Gasparik, M.; van Wees, J.-D.; Nelskamp, S. Thermal evolution and shale gas potential estimation of the Wealden and Posidonia Shale in NW-Germany and the Netherlands: A 3D basin modelling study. Basin Res. 2016, 28, 2–33. [Google Scholar] [CrossRef]
  6. Sachse, V.F.; Wenke, A.; Littke, R.; Jabour, H.; Kluth, O.; Zühlke, R. 2D petroleum system analysis of the Tarfaya Basin, on-offshore Morocco, North Africa. Mar. Pet. Geol. 2016, 77, 1108–1124. [Google Scholar] [CrossRef]
  7. Torelli, M.; Traby, R.; Teles, V.; Ducros, M. Thermal evolution of the intracratonic Paris Basin: Insights from 3D basin modelling. Mar. Pet. Geol. 2020, 119, 104487. [Google Scholar] [CrossRef]
  8. Tissot, B.P.; Pelet, R.; Ungerer, P. Thermal History of Sedimentary Basins, Maturation Indices, and Kinetics of Oil and Gas Generation. AAPG Bull. 1987, 71, 1445–1466. [Google Scholar] [CrossRef]
  9. Green, P.F.; Duddy, I.R.; Bray, R.J. Applications of Thermal History Reconstruction in inverted basins. Geol. Soc. Lond. Spec. Publ. 1995, 88, 149–165. [Google Scholar] [CrossRef]
  10. Armstrong, P.A. Thermochronometers in Sedimentary Basins. Rev. Mineral. Geochem. 2005, 58, 499–525. [Google Scholar] [CrossRef]
  11. Qiu, N.; Chang, J.; Zhu, C.; Liu, W.; Zuo, Y.; Xu, W.; Li, D. Thermal regime of sedimentary basins in the Tarim, upper Yangtze and north China cratons, China. Earth-Sci. Rev. 2022, 224, 103884. [Google Scholar] [CrossRef]
  12. Ershov, A.V.; Brunet, M.-F.; Nikishin, A.M.; Bolotov, S.N.; Nazarevich, B.P.; Korotaev, M.V. Northern Caucasus basin: Thermal history and synthesis of subsidence models. Sediment. Geol. 2003, 156, 95–118. [Google Scholar] [CrossRef]
  13. Hu, S.; O’Sullivan, P.B.; Raza, A.; Kohn, B.P. Thermal history and tectonic subsidence of the Bohai Basin, northern China: A Cenozoic rifted and local pull-apart basin. Phys. Earth Planet. Inter. 2001, 126, 221–235. [Google Scholar] [CrossRef]
  14. Qiu, N.; Zuo, Y.; Xu, W.; Chang, J. Meso-Cenozoic thermal structure of the lithosphere in the Bohai Bay Basin, eastern North China Craton. Geol. J. 2016, 51, 794–804. [Google Scholar] [CrossRef]
  15. Ren, Z. Thermal history of Ordos Basin assessed by apatite fission track analysis. Acta Geophys. Sin. 1995, 38, 339–349, (In Chinese with English Abstract). [Google Scholar]
  16. Qiu, N. Thermal evaluation and hydrocarbon generation history of the sedimentary basins in western China. Pet. Explor. Dev. 2002, 29, 6–8, (In Chinese with English Abstract). [Google Scholar]
  17. Ren, Z.; Cui, J.; Qi, K.; Yang, P.; Liu, X.; Zhang, C.; Yang, G.; Gao, Y.; Zhang, Y.; Xing, G. New progress in research on theories and methods for reconstruction of deep and ultra-deep thermal evolution history in superimposed basins. J. Northwest Univ. 2022, 52, 910–929, (In Chinese with English Abstract). [Google Scholar]
  18. Gao, P.; Hu, S.; Jiang, G.; Li, C.; Wang, Y.; Zhang, C.; Hu, D.; Wang, Y.; Wang, Z. Principles and progresses on methods of thermal history reconstruction of sedimentary basins. Earth Sci. Front. 2017, 24, 65–78, (In Chinese with English Abstract). [Google Scholar]
  19. Yang, Y.; Li, W.; Ma, L. Tectonic and stratigraphic controls of hydrocarbon systems in the Ordos basin: A multicycle cratonic basin in central China. AAPG Bull. 2005, 89, 255–269. [Google Scholar] [CrossRef]
  20. Zou, C.N.; Yang, Z.; Tao, S.Z.; Yuan, X.J.; Zhu, R.K.; Hou, L.H.; Wu, S.T.; Sun, L.; Zhang, G.S.; Bai, B.; et al. Continuous hydrocarbon accumulation over a large area as a distinguishing characteristic of unconventional petroleum: The Ordos Basin, North-Central China. Earth-Sci. Rev. 2013, 126, 358–369. [Google Scholar] [CrossRef]
  21. Liu, Q.; Chen, M.; Liu, W.; Li, J.; Han, P.; Guo, Y. Origin of natural gas from the Ordovician paleo-weathering crust and gas-filling model in Jingbian gas field, Ordos basin, China. J. Asian Earth Sci. 2009, 35, 74–88. [Google Scholar] [CrossRef]
  22. Du, J.; Li, X.; Bao, H.; Xu, W.; Wang, Y.; Huang, J.; Wang, H.; Wanyan, R.; Wang, J. Geological conditions of natural gas accumulation and new exploration areas in the Mesoproterozoic to Lower Paleozoic of Ordos Basin, NW China. Pet. Explor. Dev. 2019, 46, 820–835, (In Chinese with English Abstract). [Google Scholar] [CrossRef]
  23. Yang, J. Discovery of the natural gas in Lower Palaeozoic in Shanganning Basin. Nat. Gas Ind. 1991, 11, 1–6, (In Chinese with English Abstract). [Google Scholar]
  24. Liu, Q.; Jin, Z.; Wang, Y.; Han, P.; Tao, Y.; Wang, Q.; Ren, Z.; Li, W. Gas filling pattern in Paleozoic marine carbonate reservoir of Ordos Basin. Acta Pet. Sin. 2012, 28, 847–858, (In Chinese with English Abstract). [Google Scholar]
  25. Ren, Z.; Cui, J.; Li, J.; Wang, J.; Guo, K.; Wang, W.; Tian, T.; Li, H.; Cao, Z.; Yang, P. Tectonic-Thermal History Reconstruction of Ordovician in the Weibei Uplift of Ordos Basin. Acta Geol. Sin. 2014, 88, 2044–2056, (In Chinese with English Abstract). [Google Scholar]
  26. Ren, Z.; Cui, J.; Guo, K.; Tian, T.; Li, H.; Wang, W.; Yang, P.; Cao, Z. Fission-track analysis of uplift times and processes of the Weibei Uplift in the Ordos Basin. Chin. Sci. Bull. 2015, 60, 1298–1309, (In Chinese with English Abstract). [Google Scholar]
  27. Fu, J.; Fan, L.; Liu, X.; Hu, X.; Li, J.; Ji, H. New progresses, prospects and countermeasures of natural gas exploration in the Ordos Basin. China Pet. Explor. 2019, 24, 418–430, (In Chinese with English Abstract). [Google Scholar]
  28. Zuo, Z.; Li, R. Ordovician source rocks and natural gas potential in the southern Ordos basin marginal paleo-depression. Geol. China 2008, 35, 279–285, (In Chinese with English Abstract). [Google Scholar]
  29. He, D.; Jia, C.; Tong, X.; Wang, G. Discussion and analysis of superimposed sedi-mentary basins. Pet. Explor. Dev. 2004, 34, 1–7, (In Chinese with English Abstract). [Google Scholar]
  30. He, D.; Ma, Y.; Cai, X.; Zhang, J.; Zhang, Y. Comparison study on controls of geologic structural framework upon hydrocarbon distribution of marine basins in western China. Acta Pet. Sin. 2017, 33, 1037–1057, (In Chinese with English Abstract). [Google Scholar]
  31. Liu, C.; Zhao, H.; Gui, X.; Yue, L.; Zhao, J.; Wang, J. Space-time coordinate of the evolution and reformation and mineralization response in Ordos Basin. Acta Geol. Sin. 2006, 80, 617–638. [Google Scholar]
  32. Liu, S.; Ke, A.; Wu, L.; Huang, S. Sediment Provenance Analysis and Its Tectonic Significance in the Foreland Basin of the Ordos Southwestern Margin. Acta Sedimentol. Sin. 1997, 15, 156–160, (In Chinese with English Abstract). [Google Scholar]
  33. Zhang, Y.; Shi, W.; Liao, C.; Hu, B. Fault Kinematic Analysis and Change in Late Mesozoic Tectonic Stress Regimes in the Peripheral Zones of the Ordos Basin, North China. Acta Geol. Sin. 2006, 80, 639–647, (In Chinese with English Abstract). [Google Scholar]
  34. Xiao, H.; Li, J.; Han, W.; Yang, Q. The tectonic uplift time and evolution characteristics of Weibei uplift in the south edge of Ordos Basin. J. Xi’an Univ. Sci. Technol. 2013, 33, 576–593, (In Chinese with English Abstract). [Google Scholar]
  35. Yang, P.; Ren, Z.; Zhao, J.; Nguyen, A.D.; Feng, Y.; Qi, K.; Wang, K. Tectonic evolution analysis constrained jointly by in-situ calcite U-Pb dating and apatite fission track for southwestern Ordos Basin. Oil Gas Geol. 2021, 42, 1189–1201, (In Chinese with English Abstract). [Google Scholar]
  36. Yu, Q.; Ren, Z.; Li, R.; Chung, L.; Tao, N.; Cui, J.; Wang, B.; Qi, K.; Khaled, A. Cooling history of the southwestern Ordos Basin (northern China) since Late Jurassic: Insights from thermochronology and geothermometry. J. Asian Earth Sci. 2021, 219, 104895. [Google Scholar] [CrossRef]
  37. Osadetz, K.; Kohn, B.; Feinstein, S.; O’Sullivan, P. Thermal history of Canadian Williston basin from apatite fission-track thermochronology—Implications for petroleum systems and geodynamic history. Tectonophysics 2002, 349, 221–249. [Google Scholar] [CrossRef]
  38. Sahu, H.S.; Raab, M.J.; Kohn, B.P.; Gleadow, A.J.W.; Bal, K.D. Thermal history of the Krishna–Godavari basin, India: Constraints from apatite fission track thermochronology and organic maturity data. J. Asian Earth Sci. 2013, 73, 1–20. [Google Scholar] [CrossRef]
  39. Wolf, R.; Farley, K.; Silver, L. Helium diffusion and low-temperature thermochronometry of apatite. Geochim. Cosmochim. Acta 1996, 60, 4231–4240. [Google Scholar] [CrossRef]
  40. Green, P.F.; Duddy, I.R.; Gleadow, A.J.W.; Tingate, P.R.; Laslett, G.M. Fission-track annealing in apatite: Track length measurements and the form of the Arrhenius plot. Nucl. Tracks Radiat. Meas. 1985, 10, 323–328. [Google Scholar] [CrossRef]
  41. Green, P.F.; Duddy, I.R.; Gleadow, A.J.W.; Tingate, P.R.; Laslett, G.M. Thermal annealing of fission tracks in apatite: 1. A qualitative description. Chem. Geol. Isot. Geosci. 1986, 59, 237–253. [Google Scholar] [CrossRef]
  42. Pepper, A.S.; Corvi, P.J. Simple kinetic models of petroleum formation. Part I: Oil and gas generation from kerogen. Mar. Pet. Geol. 1995, 12, 291–319. [Google Scholar] [CrossRef]
  43. Zhao, M.-W.; Behr, H.-J.; Ahrendt, H.; Wemmer, K.; Ren, Z.-L.; Zhao, Z.-Y. Thermal and tectonic history of the Ordos Basin, China: Evidence from apatite fission track analysis, vitrinite reflectance, and K-Ar dating. AAPG Bull. 1996, 80, 1110–1133. [Google Scholar]
  44. Chen, G.; Sun, J.; Zhou, L.; Zhang, H.; Li, X.; Wang, Z. Fission-track-age records of the Mesozoic tectonic-events in the southwest margin of the Ordos Basin, China. Sci. China Ser. D Earth Sci. 2007, 50, 133–143. [Google Scholar] [CrossRef]
  45. Ren, Z.; Zhang, S.; Gao, S.; Cui, J.; Xiao, Y.; Xiao, H. Tectonic thermal history and its significance on the formation of oil and gas accumulation and mineral deposit in Ordos Basin. Sci. China Earth Sci. 2007, 50, 27–38. [Google Scholar] [CrossRef]
  46. Yuan, Y.; Hu, S.; Wang, H.; Sun, F. Meso-Cenozoic tectonothermal evolution of Ordos basin, central China: Insights from newly acquired vitrinite reflectance data and a revision of existing paleothermal indicator data. J. Geodyn. 2007, 44, 33–46. [Google Scholar] [CrossRef]
  47. Ren, Z. Research on the relations between geothermal history and oil-gas accumulation in the ordos Basin. Acta Pet. Sin. 1996, 17, 17–24, (In Chinese with English Abstract). [Google Scholar]
  48. Liu, C.; Zhao, H.; Wang, F.; Chen, H. Attributes of the Mesozoic Structure on the West Margin of the Ordos Basin. Acta Geol. Sin. 2005, 79, 737–747, (In Chinese with English Abstract). [Google Scholar]
  49. Zhao, Z.; Liu, C. Formation, Evolution and Hydrocarbon Occurrence of Sedimentary Basins in North China Craton; Northwest University Press: Xi’an, China, 1990. (In Chinese) [Google Scholar]
  50. Yang, J. Tectonic Evolution and the Distribution of Petroleum in the Ordos Basin, China; Petroleum Industry Press: Beijing, China, 2002. (In Chinese) [Google Scholar]
  51. Yang, P.; Ren, Z.; Zhang, J.; Xia, B.; Tian, T.; Cai, Z.; Zhang, Y. Discussion of the coupling relationships between the Cenozoic sedimentary-tectonic migration of the Weihe Basin and the uplift of the Weibei and East Qinling areas. Chin. J. Geol. 2018, 53, 876–892, (In Chinese with English Abstract). [Google Scholar]
  52. Yuan, W.; Zhao, Y. Characteristics and Evolution of Passive Continental Margin during Early Palaeozoic Era in Southern Ordos. J. Northwest Univ. 1996, 26, 451–454, (In Chinese with English Abstract). [Google Scholar]
  53. Yuan, W.; Wang, P. On the Caledonian movement in the Southern Eerduos Basin. J. Xi’an Coll. Geol. 1996, 18, 36–42, (In Chinese with English Abstract). [Google Scholar]
  54. Zhang, Y.; Liao, C.; Shi, W.; Zhang, T.; Guo, F. Jurassic deformation in and around the Ordos basin, North China. Earth Sci. Front. 2007, 14, 182–196. [Google Scholar] [CrossRef]
  55. Zhang, Y.; Liao, C.; Shi, W.; Hu, B. Neotectonic evolution of the peripheral zones of the Ordos Basin and geodynamic setting. Geol. J. China Univ. 2006, 12, 285–297, (In Chinese with English Abstract). [Google Scholar]
  56. Sun, S.; Li, X.; Gong, G.; Liu, S. Tectono-thermal events in Ordos Basin, China. Chin. Sci. Bull. 1997, 42, 306–309, (In Chinese with English Abstract). [Google Scholar]
  57. Yang, P.; Ren, Z.; Zhou, R.; Cui, J.; Qi, K.; Fu, J.; Li, J.; Liu, X.; Li, W.; Wang, K. Tectonic evolution and controls on natural gas generation and accumulation in the Ordovician system of the Ordos Basin, North China. Energy Rep. 2021, 7, 6887–6898. [Google Scholar] [CrossRef]
  58. Chang, J.; Qiu, N.; Zhao, X.; Shen, F.; Liu, N.; Xu, W. Mesozoic and Cenozoic tectono-thermal reconstruction of the western Bohai Bay Basin (East China) with implications for hydrocarbon generation and migration. J. Asian Earth Sci. 2018, 160, 380–395. [Google Scholar] [CrossRef]
  59. Gleadow, A.J.; Belton, D.X.; Kohn, B.P.; Brown, R.W. Fission track dating of phosphate minerals and the thermochronology of apatite. Rev. Mineral. Geochem. 2002, 48, 579–630. [Google Scholar] [CrossRef]
  60. Flowers, R.M.; Ketcham, R.A.; Shuster, D.L.; Farley, K.A. Apatite (U–Th)/He thermochronometry using a radiation damage accumulation and annealing model. Geochim. Cosmochim. Acta 2009, 73, 2347–2365. [Google Scholar] [CrossRef]
  61. Gleadow, A.; Harrison, M.; Kohn, B.; Lugo-Zazueta, R.; Phillips, D. The Fish Canyon Tuff: A new look at an old low-temperature thermochronology standard. Earth Planet. Sci. Lett. 2015, 424, 95–108. [Google Scholar] [CrossRef]
  62. Farley, K.; Wolf, R.; Silver, L. The effects of long alpha-stopping distances on (U-Th)/He ages. Geochim. Cosmochim. Acta 1996, 60, 4223–4229. [Google Scholar] [CrossRef]
  63. Vermeesch, P. RadialPlotter: A Java application for fission track, luminescence and other radial plots. Radiat. Meas. 2009, 44, 409–410. [Google Scholar] [CrossRef]
  64. Ludwig, K.R. User’s manual for isoplot 3.00, a geochronlogical toolkit for microsoft excel. Berkeley Geochronl. Cent. Spec. Publ. 2003, 4, 25–32. [Google Scholar]
  65. Ketcham, R.A. Forward and inverse modeling of low-temperature thermochronometry data. Rev. Mineral. Geochem. 2005, 58, 275–314. [Google Scholar] [CrossRef]
  66. Ketcham, R.A.; Carter, A.; Donelick, R.A.; Barbarand, J.; Hurford, A.J. Improved modeling of fission-track annealing in apatite. Am. Mineral. 2007, 92, 799–810. [Google Scholar] [CrossRef]
  67. Ketcham, R.A.; Carter, A.; Donelick, R.A.; Barbarand, J.; Hurford, A.J. Improved measurement of fission-track annealing in apatite using c-axis projection. Am. Mineral. 2007, 92, 789–798. [Google Scholar] [CrossRef]
  68. Guenthner, W.R.; Reiners, P.W.; Ketcham, R.A.; Nasdala, L.; Giester, G. Helium diffusion in natural zircon: Radiation damage, anisotropy, and the interpretation of zircon (U-Th)/He thermochronology. Am. J. Sci. 2013, 313, 145–198. [Google Scholar] [CrossRef]
  69. Gao, P.; Qiu, Q.; Jiang, G.; Zhang, C.; Hu, S.; Lei, Y.; Wang, X. Present-day geothermal characteristics of the Ordos Basin, western North China Craton: New findings from deep borehole steady-state temperature measurements. Geophys. J. Int. 2018, 214, 254–264. [Google Scholar] [CrossRef]
  70. Gleadow, A.; Duddy, I.; Lovering, J. Fission track analysis: A new tool for the evaluation of thermal histories and hydrocarbon potential. Aust. Pet. Explor. Assoc. J. 1983, 23, 93–102. [Google Scholar] [CrossRef]
  71. Yu, Q.; Ren, Z.; Li, R.; Wang, B.; Qin, X.; Tao, N. Paleogeotemperature and maturity evolutionary history of the source rocks in the Ordos Basin. Geol. J. 2017, 52, 97–118. [Google Scholar] [CrossRef]
  72. Chang, Y.; Zhou, Z. Basic Methods to Inverse Exhumation Rates Using Low-Temperature Thermochronological Data. Sci. Technol. Rev. 2010, 28, 86–94, (In Chinese with English Abstract). [Google Scholar]
  73. Qi, K.; Ren, Z.; Cui, J.; Yu, Q.; Cao, Z.; Yang, P.; Deng, Y.; Zhang, M. The Meso-cenozoic Tectonic Thermal Evolution of the Qishan-Linyou Areas in Weibei Uplift of Ordos Basin and Its Response in Geology: Evidence from Fission-track Analysis. Acta Geol. Sin. 2017, 91, 151–162, (In Chinese with English Abstract). [Google Scholar]
  74. Huvaz, O.; Karahanoglu, N.; Ediger, V. The Thermal Gradient History of The Thrace Basin, Nw Turkey: Correlation with Basin Evolution Processes. J. Pet. Geol. 2007, 30, 3–24. [Google Scholar] [CrossRef]
  75. Mancktelow, N.S.; Grasemann, B. Time-dependent effects of heat advection and topography on cooling histories during erosion. Tectonophysics 1997, 270, 167–195. [Google Scholar] [CrossRef]
  76. Stüwe, K.; White, L.; Brown, R. The influence of eroding topography on steady-state isotherms. Application to fission track analysis. Earth Planet. Sci. Lett. 1994, 124, 63–74. [Google Scholar] [CrossRef]
  77. Donelick, R.A.; O’Sullivan, P.B.; Ketcham, R.A. Apatite fission-track analysis. Rev. Mineral. Geochem. 2005, 58, 49–94. [Google Scholar] [CrossRef]
  78. Farley, K.A.; Stockli, D.F. (U-Th)/He dating of phosphates: Apatite, monazite, and xenotime. Rev. Mineral. Geochem. 2002, 48, 559–577. [Google Scholar] [CrossRef]
  79. Reiners, P.W.; Farley, K.A.; Hickes, H.J. He diffusion and (U–Th)/He thermochronometry of zircon: Initial results from Fish Canyon Tuff and Gold Butte. Tectonophysics 2002, 349, 297–308. [Google Scholar] [CrossRef]
  80. Wolf, R.; Farley, K.; Kass, D. Modeling of the temperature sensitivity of the apatite (U–Th)/He thermochronometer. Chem. Geol. 1998, 148, 105–114. [Google Scholar] [CrossRef]
  81. Dodson, M.H. Closure temperature in cooling geochronological and petrological systems. Contrib. Mineral. Petrol. 1973, 40, 259–274. [Google Scholar] [CrossRef]
  82. Sweeney, J.J.; Burnham, A.K. Evaluation of a simple model of vitrinite reflectance based on Chemical kinetics. AAPG Bull. 1990, 74, 1559–1570. [Google Scholar]
  83. Price, L.C. Geologic time as a parameter in organic metamorphism and vitrinite reflectance as an absolute paleogeothermometer. J. Pet. Geol. 1983, 6, 5–37. [Google Scholar] [CrossRef]
  84. Barker, C.E.; Elders, W.A. Vitrinite reflectance geothermometry and apparent heating duration in the Cerro Prieto geothermal field. Geothermics 1981, 10, 207–223. [Google Scholar] [CrossRef]
  85. Gleadow, A.; Duddy, I.; Green, P.F.; Lovering, J. Confined fission track lengths in apatite: A diagnostic tool for thermal history analysis. Contrib. Mineral. Petrol. 1986, 94, 405–415. [Google Scholar] [CrossRef]
  86. Green, P.F.; Duddy, I.R.; Gleadow, A.J.; Lovering, J.F. Apatite fission-track analysis as a paleotemperature indicator for hydrocarbon exploration. In Thermal History of Sedimentary Basins; Springer: Berlin/Heidelberg, Germany, 1989; pp. 181–195. [Google Scholar]
  87. Galbraith, R.F. Statistics for Fission Track Analysis; CRC Press: Boca Raton, FL, USA, 2005. [Google Scholar]
  88. Laslett, G.M.; Kendall, W.S.; Gleadow, A.J.W.; Duddy, I.R. Bias in measurement of fission-track length distributions. Nucl. Tracks Radiat. Meas. 1982, 6, 79–85. [Google Scholar] [CrossRef]
  89. Gallagher, K.; Brown, R.; Johnson, C. Fission track analysis and its applications to geological problems. Annu. Rev. Earth Planet. Sci. 1998, 26, 519–572. [Google Scholar] [CrossRef]
  90. Valla, P.G.; Herman, F.; van der Beek, P.A.; Braun, J. Inversion of thermochronological age-elevation profiles to extract independent estimates of denudation and relief history—I: Theory and conceptual model. Earth Planet. Sci. Lett. 2010, 295, 511–522. [Google Scholar] [CrossRef]
  91. van der Beek, P.A.; Valla, P.G.; Herman, F.; Braun, J.; Persano, C.; Dobson, K.J.; Labrin, E. Inversion of thermochronological age–elevation profiles to extract independent estimates of denudation and relief history—II: Application to the French Western Alps. Earth Planet. Sci. Lett. 2010, 296, 9–22. [Google Scholar] [CrossRef]
  92. Galbraith, R.; Laslett, G. Statistical models for mixed fission track ages. Nucl. Tracks Radiat. Meas. 1993, 21, 459–470. [Google Scholar] [CrossRef]
  93. Zheng, C.; Zhang, G.; Wang, F. Hot Water Karst Characteristics of Ordovician Period in Ordos Basin. Acta Sedimentol. Sin. 2001, 19, 524–529, (In Chinese with English Abstract). [Google Scholar]
  94. Zhao, M.; Ahrendt, H.; Wemmer, K.; Behr, H.-J. Silurian-Devonian and Jurassic thermal events in the Ordos Basin, China: Evidence from K-Ar dating on illites. Acta Geol. Sin. 1996, 70, 186–194, (In Chinese with English Abstract). [Google Scholar]
Figure 1. (a) Sketch map showing the core sample locations and the main structural subdivisions of the Ordos Basin and adjacent grabens [46,50]. (b) Geological map showing the outcrop sample locations of the Weibei Uplift and adjacent tectonic units (modified from Yang et al. (2021) [35]).
Minerals 14 00172 g001
Figure 2. Generalized stratigraphic column of the Ordos Basin (modified from Yang et al. (2021) [57]). The stars show the locations of samples. Є: Cambrian; O: Ordovician; C: Carboniferous; P: Permian; T: Triassic; J: Jurassic; K: Cretaceous; E: Paleogene; N: Neogene; Q: Quaternary.
Minerals 14 00172 g002
Figure 3. Radial plots with age peaks of the apatite fission track using RadialPlotter [63].
Minerals 14 00172 g003
Figure 4. (a) Apatite fission track length distribution of all core samples. (b) Temperature–time paths and the resulting apatite track length distributions for rocks of varying thermal history (modified from Gleadow et al. (1983) [70]).
Minerals 14 00172 g004
Figure 5. Thermal history modeling results of core samples. For each sample: (left) “Good” paths (GOF > 0.55) are shown as pink envelopes, and “acceptable” paths (GOF > 0.05) as green envelopes. The black line represents the weighted mean thermal path for all good models, and the blue line is the best-fit thermal path for each sample. (right) Red bars are histograms of measured track lengths. The green line represents modeled length distribution.
Minerals 14 00172 g005
Table 1. Sample information.
Sample No.FormationLithologySourceSampling Depth (m)Sampling Elevation (m)
F33-484Upper Triassic Yanchang Formation (T3y)SandstoneCore484
F33-844Upper Triassic Yanchang Formation (T3y)SandstoneCore844
Y79Upper Triassic Yanchang Formation (T3y)SandstoneCore366
Y89Upper Triassic Yanchang Formation (T3y)SandstoneCore1038
W91-736Upper Triassic Yanchang Formation (T3y)SandstoneCore736
W91-1047Upper Triassic Yanchang Formation (T3y)SandstoneCore1047
W91-1495Upper Triassic Yanchang Formation (T3y)SandstoneCore1495
2015-08Lower Permian Shanxi Formation (P1s)SandstoneOutcrop 919
2015-11Lower Triassic Liujiagou Formation (T1l)SandstoneOutcrop 943
2015-12Lower Triassic Heshanggou Formation (T1h)SandstoneOutcrop 943
2015-14Middle Triassic Zhifang Formation (T2z)SandstoneOutcrop 916
2015-15Upper Triassic Yanchang Formation (T3y)SandstoneOutcrop 1102
2015-20Middle Jurassic Anding Formation (J2a)SandstoneOutcrop 1428
2015-22Middle Jurassic Zhiluo Formation (J2z)SandstoneOutcrop 1383
2015-24Lower Cretaceous Huanhe Formation (K1h)SandstoneOutcrop 1530
2015-25Lower Cretaceous Huanhe Formation (K1h)SandstoneOutcrop 1530
2015-26Upper Triassic Yanchang Formation (T3y)SandstoneOutcrop 1617
2015-27Upper Triassic Yanchang Formation (T3y)SandstoneOutcrop
2015-34Upper Triassic Yanchang Formation (T3y)SandstoneOutcrop 620
Table 2. Apatite fission track data for Shanbei Slope and Weibei Uplift.
Sample No.No.of GrainsNo.of TracksTrack Density238UDparP(χ2)Central AgeFormationStratigraphic AgeNo. of Track LengthMean Track Length
(×105 cm−2)(ppm)(μm ± 1σ)(Ma ± 1σ)(Ma)(μm ± 1σ)
F33-484447640.57927.381.69 ± 0.2420%43.6 ± 2.0T3y22710014.02 ± 1.13
F33-8443510870.69637.101.65 ± 0.2213%37.0 ± 1.5T3y22710013.43 ± 1.02
Y79466980.43017.501.59 ± 0.2311%51.7 ± 2.9T3y22710013.44 ± 1.38
Y897014070.50820.351.73 ± 0.2214%50.4 ± 1.7T3y22710013.63 ± 1.36
W91-736427070.86534.331.75 ± 0.2514%52.8 ± 2.6T3y22710013.60 ± 1.07
W91-1047548460.76434.611.58 ± 0.247%45.8 ± 1.9T3y22710013.76 ± 1.09
W91-1495186280.46942.031.84 ± 0.216%21.4 ± 1.3T3y22710013.24 ± 0.93
2015-083910921.45826.011.52 ± 0.200%114.8 ± 8.8P1s290--
2015-114712541.62325.231.48 ± 0.190%137.8 ± 9.2T1l250--
2015-12398701.87436.021.53 ± 0.260%111.9 ± 8.4T1h247--
2015-147714802.68344.501.41 ± 0.170%134.2 ± 6.6T2z240--
2015-155915881.22814.271.59 ± 0.150%182.5 ± 8.2T3y230--
2015-205619981.99723.001.46 ± 0.210%180.5 ± 6.9J2a165--
2015-22327471.60423.872.29 ± 0.630%153 ± 13J2z174--
2015-243111551.82420.901.62 ± 0.330%190 ± 17K1h140--
2015-25339491.99121.801.75 ± 0.240%195 ± 13K1h140--
2015-26244441.43616.961.82 ± 0.380%181 ± 17K1l125--
2015-27257122.25738.362.66 ± 0.570%128.1 ± 8.3J2a165--
2015-34619911.86020.312.26 ± 0.600%201 ± 10P2s254--
Table 3. Apatite (U-Th)/He data for Shanbei Slope and Weibei Uplift.
Sample No.4He Gas nccMassaMean FTUThSmTh/Ub[eU]Uncorrected AgeAgeError ± 1 sGrain LengthGrain Half-WidthcGrain Morphology
(mg) (ppm)(ppm)(ppm) (ppm)(Ma)(Ma)(Ma)(mm)(mm)
F33-4840.0580.003460.722.828.531.510.149.514.319.81.2171.155.71T
0.4520.008810.7940.863.989.81.5755.87.59.50.6173.071.20T
0.3980.004080.7119.3104.9130.75.4444.018.225.51.6172.048.60T
Weighted mean age21.91.9
F33-8440.2190.008660.8013.29.9183.80.7415.513.116.51.0193.466.70T
0.0430.010450.803.520.061.85.778.24.15.10.3179.376.10T
0.1030.005590.778.313.757.71.6611.513.117.11.1214.162.51T
0.1170.006920.774.520.735.34.559.414.619.11.2154.066.80T
0.0270.009370.780.97.633.18.952.78.811.20.7212.166.30T
Weighted mean age17.41.2
Y79-3660.0650.003800.712.211.8570.65.375.024.835.12.2231.747.81T
0.0510.004880.731.911.449.96.044.618.325.11.6186.551.00T
0.8220.012280.8016.15.9161.40.3617.531.038.72.4309.969.12T
0.1050.009330.782.313.445.65.895.416.821.41.3216.065.50T
0.0260.002480.674.82.8248.10.595.514.722.01.4159.543.22T
Weighted mean age25.51.4
Y89-10380.1070.007740.781.68.739.25.293.630.439.22.4155.870.30T
0.0490.008060.811.70.9235.30.541.922.628.01.7243.570.21T
0.3500.006530.769.11.6215.20.179.545.259.23.7241.857.02T
0.0300.006590.782.00.9143.50.462.215.920.41.3171.361.90T
2.5000.006090.76126.854.1170.90.43139.524.131.82.0212.158.82T
Weighted mean age26.71.7
W91-7360.2960.002940.6825.158.375.12.3238.821.331.31.9146.549.12T
0.1060.008480.803.32.1223.90.643.825.131.52.0189.066.80T
0.2900.005210.7517.713.021.40.7320.822.029.41.8167.461.22T
0.0240.004690.732.010.576.15.214.59.112.50.8146.056.50T
0.0510.002380.682.731.971.711.8710.217.024.91.5158.447.61T
Weighted mean age28.71.8
W91-10470.0570.004300.745.32.8143.30.526.017.623.91.5183.048.40T
0.3700.005060.7318.575.722.94.1036.316.622.71.4208.349.20T
0.1940.002760.6712.556.1156.04.5025.722.333.12.1159.441.50T
0.1440.005180.745.821.326.13.7010.821.128.51.8176.554.00T
Weighted mean age25.91.6
W91-14950.1320.008980.795.523.030.44.2110.911.014.00.9194.067.90T
0.9260.008750.7847.667.4174.81.4263.413.617.51.1226.468.22T
0.1950.027330.851.06.546.36.212.522.426.31.6264.9101.30T
0.4870.004920.777.33.724.20.508.298.2126.87.9197.061.61T
0.0430.009390.7820.330.832.61.5227.51.41.70.1265.859.30T
Weighted mean age17.01.3
2015-085.1260.017990.8318.2111.6101.76.1244.452.363.43.9279.480.00T
0.8740.008810.808.354.490.76.5521.138.348.03.0239.474.81T
1.1070.014830.8317.712.9142.30.7320.729.335.32.2223.381.30T
Weighted mean age43.73.2
2015-111.2050.004810.7334.4110.8440.73.2260.433.746.12.9185.150.80T
0.8180.009260.7810.731.5150.02.9518.139.650.53.1236.562.40T
0.2270.005470.755.638.8102.96.9214.722.930.71.9150.760.10T
Weighted mean age38.52.8
2015-120.2940.010890.802.913.232.14.566.036.645.72.8193.774.80T
2015-140.6300.002970.7142.428.0325.40.6649.024.934.12.1142.745.50T
0.0750.002580.684.922.130.44.4810.123.434.62.1114.247.40T
0.4200.003380.7237.120.076.537.1041.824.333.62.1146.947.80T
Weighted mean age34.12.1
2015-150.0820.002820.671.69.442.45.903.861.891.85.7158.842.00T
0.0720.004240.712.717.127.56.446.720.729.01.8185.647.70T
0.1290.007400.785.24.750.60.906.322.328.51.8180.663.90T
Weighted mean age31.72.5
2015-202.3710.013330.8326.036.9309.21.4234.741.650.13.1284.283.81T
0.0280.005520.740.25.49.622.721.527.637.22.3151.660.20T
1.1820.026440.855.921.5132.93.6711.033.138.82.4253.0102.00T
2.6530.021370.8411.949.9172.84.1823.642.650.83.2276.287.70T
1.5100.005310.7819.872.3434.63.6536.862.380.15.0167.173.51T
Weighted mean age42.52.7
2015-242.6830.007230.7515.875.0274.54.7433.489.6119.07.4257.152.90T
1.6280.007420.7736.152.1136.21.4448.337.147.93.0208.659.50T
0.6510.006590.7611.145.0143.94.0521.737.048.53.0161.563.70T
0.2550.006480.765.819.0122.23.2610.330.840.42.5182.559.40T
Weighted mean age45.03.2
2015-343.2810.005480.7640.629.1191.60.7247.4102.2134.08.3162.258.00T
0.2980.004960.748.234.1129.34.1616.230.040.62.5155.256.40T
0.1020.002760.650.00.4−0.310.280.11925.52974.4184.4172.743.82T
0.3590.002900.699.652.8142.25.4822.045.566.04.1116.049.90T
0.2430.002470.660.11.60.324.820.51666.82519.9156.2126.344.10T
Weighted mean age47.54.3
Disclaimer/Publisher’s Note: The statements, opinions and data contained in all publications are solely those of the individual author(s) and contributor(s) and not of MDPI and/or the editor(s). MDPI and/or the editor(s) disclaim responsibility for any injury to people or property resulting from any ideas, methods, instructions or products referred to in the content.

