Highlights
- arsenian pyrite and marcasite with pronounced chemical zoning are synthesized
- Au-As atomic clusters with probable composition of [AuAs10] form in pyrite
- incorporation of Au in As-rich pyrite proceeds via a reductive deposition mechanism
- in marcasite the Au and As concentrations are not correlated
- the “invisible” gold content in pyrite is dictated by the hydrothermal fluid chemistry
Abstract
Hydrothermal synthesis experiments were performed in order to quantify the states of Au and As in pyrite and marcasite. The experiments were performed at 350 °C/500 bar and 490 °C/1000 bar (pyrite–pyrrhotite buffer, C(NaCl) = 15 and 35 wt.%). The synthesis products were studied by EPMA, LA-ICP-MS, and EBSD. The EPMA was applied for simultaneous determinations of Au, As, Fe, and S, with a Au detection limit of 45–48 ppm (3σ). The analyses were performed along profiles across zonal grains. The concentrations of As and Au up to 5 wt.% and 8000 ppm, respectively, were determined in pyrite and up to 6 wt.% and 1300 ppm in marcasite. In pyrite, the Au concentration decreases with fluid salinity and temperature increases. Strong positive Au–As correlation and strong negative Au–Fe and As–S correlation were identified in pyrite. Comparison of the correlations with theoretical lines implies Au–As clustering. The cluster stoichiometry is inferred to be [AuAs10]. Most probably, As in pyrite presents in the form of clusters and in the As→S solid solution. Incorporation of Au in As-rich pyrite can be controlled by the reductive deposition mechanism. In marcasite, the concentrations of Au are not correlated with the As content. The [AuAs10] clusters enrich the {210}, {113}, and {111} pyrite faces, where the former exhibits the highest affinity to Au and As. The affinity of {110} and {100} forms to Au and As is lower. Implication of the experimental results to data for natural auriferous pyrite shows that the increase of Au content at C(As) > 0.5–1 wt.% is caused by the incorporation of the Au-As clusters, but not because of the formation of Au→Fe solid solution. Therefore, the concentration of “invisible” gold in pyrite is dictated solely by the hydrothermal fluid chemistry and subsequent ore transformations.
1. Introduction
Pyrite is an ubiquitous ore mineral in all types of hydrothermal deposits where Au is extracted as the main or byproduct component—sediment-hosted, Carlin-type, intrusion-related gold (IRG), “orogenic”, epithermal, Au-porphyry, and volcanogenic massive sulfide (VMS) deposits (see [1,2] and references therein). The ores of the deposits were formed in the wide range of PT-compositional parameters, which extend from low to moderate temperature with low fluid salinity at Carlin-type deposits (~180–240 °C, 2–3 wt.% NaCl equiv [3]) to high temperature and concentrated chloride brines (cf., ~470 °C, 35 wt.% NaCl equiv at IRG deposits of the Darasun Goldfield, Eastern Transbaikalia, Russia [4]). The redox state and acidity of the ore-forming fluids are also highly variable, ranging from reduced near-neutral at sediment-hosted and VMS deposits [5,6] to highly oxidized acidic in high-sulfidation epithermal deposits [7]. In Au deposits, pyrite is commonly associated with subordinate arsenopyrite and marcasite. These minerals host an important and dominant fraction of “invisible” gold (see [8] and references therein). The “invisible” gold content in ore minerals can reach a wt.% level in As-rich ones (arsenian pyrite, arsenopyrite), but usually ranges from a few ppm to a few tens ppm. Because of the inefficiencies of conventional ore processing methods, a substantial amount of Au can be lost when an “invisible” form of Au predominates in the ore. In particular, in VMS deposits, the Urals Au extraction into commercial concentrates reaches only 12–35%, with annual losses of 13–15 t Au [9].
The composition of Au-bearing sulfides is usually determined by electron probe micro-analysis (EPMA), laser ablation inductively coupled mass spectrometry (LA-ICP-MS), secondary ion mass spectrometry (SIMS), and instrumental neutron-activation analysis (INAA). In As-rich minerals and synthetic phases, the direct correlation Au–As was observed (cf., [10,11]) together with the inverse Au–Fe correlation (e.g., [12,13]—arsenopyrite; [10]—pyrite, arsenopyrite, marcasite). These results imply that Au can exist in the solid solution state, substituting for Fe in the structure of arsenian pyrite and arsenopyrite, where Au is coordinated by As and S atoms. Recent studies performed by means of the synchrotron-based spectroscopy method—high energy resolution fluorescence detection spectroscopy (HERFD-XAS)—confirmed this conclusion and characterized the local atomic environment of Au in As-free and arsenian pyrite, arsenopyrite, and löllingite [14,15,16,17,18]). It was found that in As-free and As-poor pyrite, Au substitutes for Fe, and only S atoms are present as first neighbors of Au. According to [16], in As-rich pyrite, Au exists in the form of Au–S–As atomic units with a composition extending to [AuAs6]. Analysis of HERFD-XAS spectra of synthetic and natural pyrite allowed us to identify three forms of “invisible” gold: the solid solution Au, Au nanoparticles (clusters), and Au2S-like clusters [18]. The above studies shed new light on the problem of “invisible” gold. However, the problem is far from being resolved. In particular, the effect of redox state and fluid composition on the Au content in ore sulfides is unclear. The mechanism of the formation of Au-bearing minerals has to be quantified.
The aim of this study was to determine the different forms of Au and As occurrence in arsenian pyrite and marcasite. For this purpose, hydrothermal synthesis experiments were performed in the systems with varying fluid salinity and As content in the starting materials. The synthesized products were studied by EPMA and LA-ICP-MS. The EPMA technique developed in our laboratory made it possible to determine simultaneously the concentrations of all components of importance (trace—Au, minor—As, main—Fe, S). The combination of the EPMA data and the electron backscatter diffraction EBSD measurements allowed us to discriminate between pyrite and marcasite in crystal intergrowths and to gain insight into the forms of occurrence of Au and As in these minerals. The EBSD was used to identify the crystallographic position of the sectional view of a few crystals and crystal aggregates, which allowed us to characterize the affinity to Au and As of specific crystal faces. The developed EPMA technique was applied to samples of the ore-stage sulfides from the Vorontsovka deposit (North Urals, type Carlin) and Pavlik (Magadan district, north-east Russia, orogenic gold deposit). These results were compared to the data obtained for synthetic phases and allowed to explain the mechanism of the incorporation of Au in arsenian pyrite.
2. Materials and Methods
2.1. Method of Synthesis
The hydrothermal method was employed to synthesize auriferous arsenian pyrite. Experiments were carried out at 490 °C/1000 bar and 350 °C/500 bar using Ti autoclaves (VT-8 alloy) with an internal volume of ~20 mL (Supplementary Materials S1, Figure S1). The redox conditions of the experimental system were controlled by a pyrite–pyrrhotite buffer. Ultrapure NaCl and freshly boiled distilled water cooled under Ar flow were used throughout the synthesis experiments. Troilite FeS was used as a precursor for the synthesis of pyrite. The conventional solid-state technique was used to synthesize the troilite powder. The starting chemicals for the troilite synthesis were powders of Fe and S. The necessary quantities of the reagents were sealed under vacuum in the silica glass tube and kept at 450 °C for 7 days. The phase composition of the synthesized powder was verified using X-ray powder diffraction (XRD). The stock mixtures of troilite with 5 to 15 wt.% As were ground in an agate mortar. For each experiment, the stock mixture was mixed with the necessary mass of troilite and ground again. About 0.5 g of the obtained mixture of As + FeS was placed into a small Ti container attached to the Ti partition in the upper part of the autoclave. A strip of Au foil was also attached to the partition, avoiding contact with the starting As + FeS mixture. The autoclaves were loaded with the necessary amount of Scr to get ca. 70% of pyrite, NaCl, distilled water, and 5 mg of Al strip. Aluminium was used as a source of hydrogen to yield reduced redox conditions at the beginning of the experiment (Al + 2 H2O → AlOOH + 1.5 H2) and, by this way, reach stationary Au concentrations from undersaturation and avoid contact of newly formed pyrite with supersaturated Au-bearing fluid. The solution in the autoclave was bubbled with Ar for 5 min. Pressure in the autoclaves was controlled by the degree of filling according to the PVT data of the H2O–NaCl system [19]. The closed autoclaves were placed into the gradientless furnaces preheated to 350 °C or 490 °C. During the experiment, the temperature was controlled within ±2 °C using a K-type thermocouple. The duration of the synthesis experiments was 18 days (490 °C) and 20 days (350 °C). After the experiment, the autoclaves were quenched in cold water, and the synthesized products were extracted from the containers, washed with water, and dried under vacuum.
2.2. Analytical Methods
Phase identification was performed using XRD. The chemical composition of the synthesized phases and natural minerals was determined via EPMA and LA-ICP-MS. The EBSD was used for phase mapping of synthesized crystals and the determination of the crystal cross-section orientations. Samples of natural ores were crushed. The small amount of the crushed ore (~1 cm−3) was placed in a Teflon beaker, which was filled with concentrated HF, closed, and kept for 24 h. The obtained sulfide grains were washed with distilled water and dried in the air. The grains of natural minerals and synthetic phases were mounted into the epoxy pellets and polished.
2.2.1. XRD
The phase identification was carried out using a Proto AXRD Benchtop powder diffractometer (Proto Manufacturing, Windsor, ON, Canada). The parameters of the analyses are shown in Table S1. Calculations of the quantitative phase ratio were performed using the Rietveld method.
2.2.2. EPMA
In the present study, the concentrations of trace, minor (Au, As), and main (Fe, S) components of sulfide minerals and phases were measured simultaneously at one point of analysis. The EPMA analyses were performed using a JEOL JXA-8200 WD/ED combined electron probe microanalyzer equipped with five-wavelength dispersive X-ray spectrometers. The current intensity on a Faraday cup was 300 nA, and the beam diameter was 3 μm. The determinations of major elements (Fe, S, and As) were performed at an accelerating voltage of 20 kV. Because of the high signal intensity of the main components, we used the Fe Kβ-line (LIF) and the S Kα-line, second-order (TAP). The As Lα-line (TAP) was used. The acquisition time (peak/background, s) was 100/50 for As, 100/50 for Fe, and 50/25 for S. The As detection limit (3σ) was 93 ppm.
The determination of trace concentrations of Au was performed as described below. It is known that the Au concentration can be measured using the LIFH crystal at the Au Lα-line and the PETH crystal at the Au Mα- and Mβ-lines. The spectral data that we collected close to these lines showed: (i) a “hole” (decrease of the signal) at the short-wavelength side of the Au Lα-line described in [20]; (ii) a narrow band of the third-order reflection Fe Kα close to the Au Mα-line; (iii) a first identified broad non-diagram X-ray line whose intensity is proportional to the S content (Figure 1, top); and (iv) the Au Mβ-line, which is close to the S Kα-line. To eliminate the effect of the above factors on the determination of low Au concentrations, it is necessary to accurately determine the background shape near the Au analytical lines.
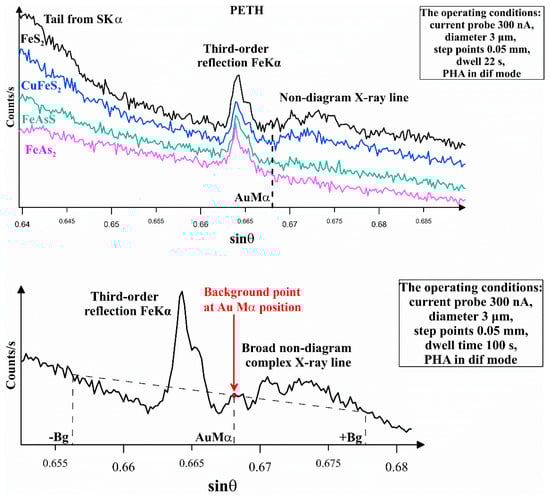
Figure 1.
Top: Spectral data near the Au Mα-line (PETH), collected for Au-free minerals. Synthetic pyrite, arsenopyrite, löllingite, and natural chalcopyrite are used for the analysis. The sulfur content increases from the bottom to the top of the figure. Bottom: Spectral data near the Au Mα-line (PETH), the Au-free pyrite. Positions of two RBPs (−Bg, +Bg) and background point at position of Au Mα-line are indicated.
In the course of our research, we found that the Au Mα-line (PETH crystal) is preferable for the determination of the “invisible” gold as the signal/background ratio of this line is 5 times higher than that of the Au Lα-line (LIFH crystal). The operating conditions for the analysis at Au Lα- and Au Mα-lines are given in Table 1. These operating conditions and correctly selected background points made it possible to decrease the detection limit LOD (3σ) down to 78 and 45 ppm for Au Lα-line and Mα-line, respectively.

Table 1.
The operating conditions for the determination of low content of Au by JXA-8200.
For positioning the reference background points (RBPs) at Au Mα-line, it is necessary to take account for the artifacts listed above. Figure 1 (bottom) illustrates the method of RBP determination. The background line, which is shown in the Figure, is highly reproducible. The RBP parameters for pyrite and arsenopyrite are listed in Table 2. The RBP at the long-wavelength side +Bg is selected close to the border of the non-diagram line and has an equivalent position for all studied sulfides. The second point, −Bg, is chosen so that a straight line drawn through two RBPs crosses the background exactly at the Au Mα-line position. The use of these RBPs enables accurate positioning of background points at the Au Mα-line for minerals of variable compositions (e.g., arsenian pyrites and arsenopyrites with different As/S ratios).
Table 2.
Reference background points, Au Mα-line (PETH, sinθ = 0.66804, mm = 187.050).
For the calibration drift control, the blank sample, stoichiometric pure pyrite, was measured after each of the ten points of analysis.
Most of the EPMA results were obtained along linear profiles across zoned crystals. Comparison of these data, presented in the form of correlation dependencies, with theoretical lines enables the determination of Au and As forms of occurrence.
2.2.3. LA-ICP-MS
The New Wave 213 laser coupled with the Thermo X Series2 quadrupole ICP-MS was used to determine the concentrations of 197Au and 75As. The sulfide reference materials MASS-1 [21] and UQAC-FeS-1 [22] were used as the calibration standards. The 33S and 57Fe isotopes were used as internal standards. Operating conditions applied for LA-ICP-MS analyses are listed in Table S2.
2.2.4. EBSD
The analyses were performed on a JEOL JSM 5610-lv electron scanning microscope equipped with an UltimMax-100 EDS detector and a Symmetry EBSD detector. The analysis of zoning geometry was performed using the SHAPE V7.2.2 program [23].
3. Results
Parameters of the synthesis experiments are listed in Table 3. The phase composition of synthesized samples, together with the averaged concentrations of Au and As, is given in Supplementary Materials S1, Tables S3 and S4. EPMA data, along with profiles, are presented in Table S5. Scanning electron microscopy backscatter electron SEM BSE images of the experiment products are given in Supplementary Materials S2.
The synthesis products contain pyrite and pyrrhotite (experiment Pr#4, 490 °C, Table S3), whereas pyrite, pyrrhotite, and, in some autoclaves, marcasite and lepidocrocite are present in the lower-temperature experimental products (experiment Pr#5, 350 °C, Table S4). We consider lepidocrocite to be the oxidation product that formed during quenching and the washing of the solids, whereas sulfur was deposited during quenching. Marcasite is an intermediate phase that precedes pyrite formation and, therefore, presents in low-temperature experiments because of kinetic factors (cf., [24]).
3.1. Pyrite: The Effect of T and C(NaCl) on Au and As Content
From the data given in Tables S3 and S4 and shown in Figure 2, it follows that a decrease in temperature generally leads to an increase in the concentration of As and Au. At the same time, as temperature decreases, the range of As concentrations increases, which is associated with the formation of crystals with pronounced sectoral and concentric zones (Figure 3). At a temperature of 490 °C, the As concentration is lower, and zoning is not so pronounced. The distribution of As over pyrite grains at 490 °C, according to LA-ICP-MS (green lines in Figure S2), is close to homogeneous at C(As) in the starting mixture < ca. 1 wt.%. The starting As concentration of ~1 wt.% is borderline, and at higher As content, the pronounced zones in the LA-ICP-MS signal spectra appear. At low As concentrations in pyrite (<1 wt.% in the starting mixture), the content of Au is 1–2 ppm or less. High Au concentrations in these samples are associated with small zones (Figure S2, aut. 2). It is likely that these zones of anomalously high Au contents are associated with accumulations of submicron-size inclusions of metallic Au [14].
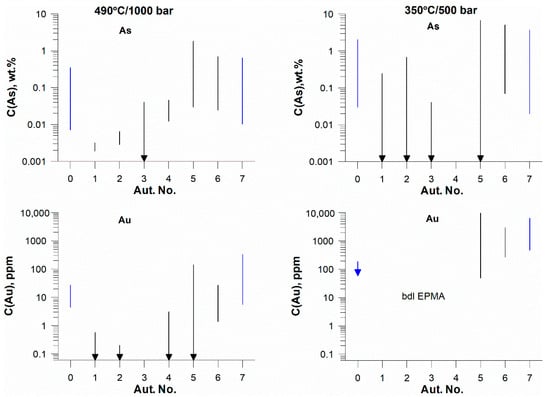
Figure 2.
Variation of the concentrations of As and Au in the synthesis products. Black lines—35 wt.% NaCl; blue lines—15 wt.% NaCl. Arrows indicate that some values are below the detection limit of analytical method. The autoclave number is indicated on the X axis. Results of EPMA and LA-ICP-MS.
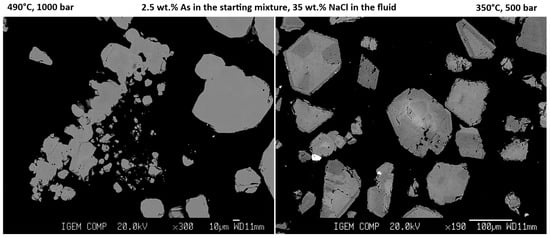
Figure 3.
BSE images of the experimental products synthesized at 490 °C/1000 bar (left) and 350 °C/1000 bar (right). The compositions of the starting As + FeS mixture and the fluid phase are equivalent in both experiments.
Table 3.
Parameters of the synthesis experiments, composition of fluid phase, and starting solids.
Table 3.
Parameters of the synthesis experiments, composition of fluid phase, and starting solids.
| Autoclave No. | Fluid | Starting Solids |
|---|---|---|
| Exp. Pr#4, 490 °C/1000 bar | ||
| 0 | 15 wt.% NaCl | 1 wt.% As + FeS |
| 1 | 35 wt.% NaCl | 0.1 wt.% As + FeS |
| 2 | 35 wt.% NaCl | 0.25 wt.% As + FeS |
| 4 | 35 wt.% NaCl | 1 wt.% As + FeS |
| 5 | 35 wt.% NaCl | 2.5 wt.% As + FeS |
| 6 | 35 wt.% NaCl | 5 wt.% As + FeS |
| 7 | 15 wt.% NaCl | 2.5 wt.% As + FeS |
| Exp. Pr#5, 350 °C/500 bar | ||
| 0 | 15 wt.% NaCl | 1 wt.% As + FeS |
| 1 | 35 wt.% NaCl | 0.1 wt.% As + FeS |
| 2 | 35 wt.% NaCl | 0.25 wt.% As + FeS |
| 3 | 15 wt.% NaCl | 0.5 wt.% As + FeS |
| 4 | 35 wt.% NaCl | 1 wt.% As + FeS |
| 5 | 35 wt.% NaCl | 2.5 wt.% As + FeS |
| 6 | 35 wt.% NaCl | 5 wt.% As + FeS |
| 7 | 15 wt.% NaCl | 2.5 wt.% As + FeS |
A decrease in NaCl concentration leads to a significant increase in the concentrations of As and Au and a more distinct zoning for both elements. As follows from the data in Figure S2, pyrite from autoclave 4 (35 wt.% NaCl in fluid, 1 wt.% As in the starting mixture) contains ~280 ppm As and 0.4–1.7 ppm Au, while pyrite from autoclave 0 (15 wt.% NaCl in fluid, 1 wt.% As in the starting mixture) contains 1640–2740 ppm As and 7.2–25 ppm Au.
Analysis of Figure 4 reveals an important feature of the effect of chlorides on the behavior of Au in arsenian pyrite. The figure shows EPMA data for two samples synthesized with equal initial As content in the starting As + FeS mixture. At 490 °C, a positive Au–As correlation appears at C(NaCl) = 15 wt.% and As concentration in the synthesized pyrite > ~1 wt.%. At C(NaCl) = 35 wt.% the Au concentration is close to or below the EPMA LOD of 48 ppm. At 350 °C, a positive Au-As correlation was observed at both NaCl concentrations of 15 and 35 wt.%. Since an increase in NaCl concentration leads to a decrease in Au content in pyrite, the positive Au-As correlation at high C(NaCl) starts at a higher As concentration. Therefore, the line that approximates the Au vs. As dependence is shifted towards a higher As concentration with an increase in C(NaCl) (Figure 4, right panel). The difference in Au concentration in pyrite with the same As concentration is about 1100 ppm, i.e., an increase in C(NaCl) of 1 wt.% causes a ~60 ppm decrease in the Au concentration at the same As content. As follows from the figure, the decrease in Au content, caused by an increase in the NaCl concentration by 1 wt.%, is compensated by an increase in the As content in pyrite by ~0.05 wt.%.
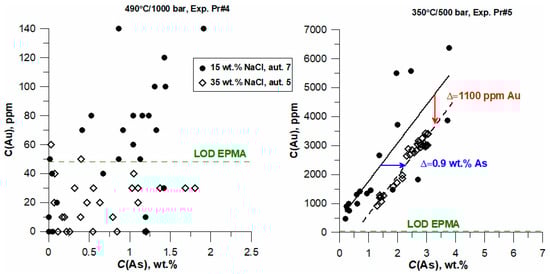
Figure 4.
The effect of temperature and NaCl content in the fluid on the concentration of Au in pyrite. High scatter of points for 15 wt.% NaCl is because the analyses were performed on the individual points in different grains; 350 °C/1000 bar, 35 wt.% NaCl—analyses along profiles.
3.2. Grains of Pyrite and Marcasite: The Effect of As on Au Content
At a temperature of 350 °C and at a high concentration of As in the system, pyrite grains exhibit a distinct sectoral zoning in BSE images (Figure 5). Figure 6 shows the results of the EPMA analysis (As, Au) of two zonal grains. For both profiles, the concentrations of Au and As are correlated; zones with high As concentrations have high Au content as well. The range of Au concentrations in these grains extends from ca. 1000 to 3500 ppm. Despite these extremely high Au concentrations, no inclusions of Au-bearing phases were observed with the resolution of EPMA.
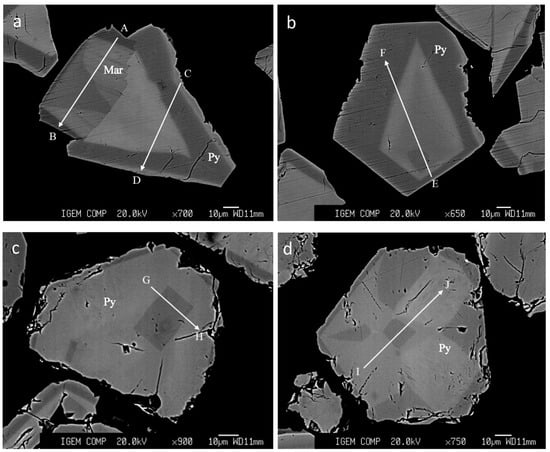
Figure 5.
BSE images of grains that were used for EPMA analyses along profiles. The profiles are shown by arrows. (a,b)—Exp. Pr#5, aut. 6, 5 wt.% As in the starting As + FeS mixture, 35 wt.% NaCl in the fluid; (c,d)—Exp. Pr#5, aut. 5, 2.5 wt.% As in the starting As + FeS mixture, 35 wt.% NaCl in the fluid. Profiles A–B and C–D include two lines for each profile with steps 3 and 6 µm, profile E–F—step 9 µm, profiles G–H, I–J—step 5 µm. The grain of marcasite was identified by EBSD.
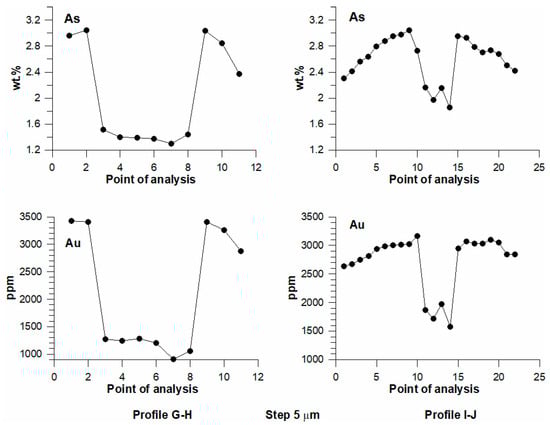
Figure 6.
EPMA results for As and Au in pyrite grains (Figure 5c,d) along profiles G–H (left) and I–J (right).
Figure 7 presents EPMA data (weight units) for zonal crystals of pyrite and marcasite, as shown in Figure 5. For all profiles across pyrite grains, strong direct correlation Au–As and strong inverse correlation Au–Fe are observed. The parallel regression lines are shifted along the C(As) and C(Fe) axes depending on the initial As content in the As + FeS mixture. An increase in the starting As content results in elevated concentrations of Au. Data of profile I-G, which correspond to the 2.5 wt.% As in the starting mixture, are separated into two groups in the C(Au)-C(Fe) plot. The first group with low measured As content is close to the regression line describing the mixture with initial 5 wt.% As, but as the measured As concentration increases, the points shift towards the second line of initial 2.5 wt.% As. Nonetheless, all the points for this profile fall within the region confined by two regression lines.
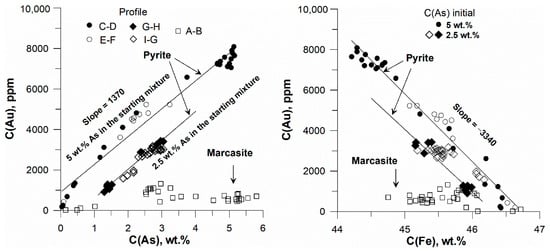
Figure 7.
Variations of Au vs. As (left) and Au vs. Fe (right) in pyrite and marcasite. Concentrations are in weight units. Points—results of EPMA analysis along profiles shown in Figure 5, lines are linear approximations of the measurement results. Points that cross the X axes correspond to EPMA detection limit.
The data obtained for marcasite can be divided into two groups. The first group corresponds to low As concentrations ≤ 1 wt.%. In two points with C(As) < 0.5 wt.%, the Au concentration is below the EPMA LOD, and in two other points with C(As) = 0.58 and 1.01 wt.%, the Au concentrations are 110 and 200 ppm, respectively (Table S5). This small data set does not allow us to unambiguously define the effect of As on the Au concentration. From the available data, it follows that in this region, the concentrations of these elements may be directly correlated. In all other points with high As content ≥ 2.5 wt.%, the concentrations of Au and As are not correlated. The absence of Au–As and Au–Fe correlations in marcasite is clearly seen in Figure 7.
Figure 8 shows the EPMA data for pyrite (grains and profiles in Figure 5) plotted in atomic percentages. The lines in the figure were calculated for different forms of occurrence of Au and As. As follows from the left-side panels, for both compositions of the starting As + FeS mixture, the measurement results do not correspond either to the Au→Fe isomorphic solid solution or the mixture of Au metal + FeS2. The best model that describes the EPMA data corresponds to a mixture of atomic groups (clusters) with a composition close to [AuAs10] + FeS2, although the scatter of the EPMA data does not allow to unambiguously determine the Au/As ratio in the cluster. The slope of the lines that correspond to the formation of [AuAs10] clusters is much lower than that of the Au→Fe substitution. It is also probable that at high Au and As concentrations (C(Au) > 7000 ppm, C(As) > 4.5 wt.%), the clusters grow in size, which results in further flattening of the Au vs. Fe correlation dependence. Data for As also miss the As→S substitution line. At high As content in the starting As+FeS mixture (5 wt.% As), the deviation from the [AuAs10] + FeS2 line increases with increasing measured As concentration, and the group of the points at maximum As content is located in between the As→S and [AuAs10] lines. Therefore, there are two forms of As occurrence in these grains: the As→S solid solution and the [AuAs10] clusters. The pyrite compositions that correspond to low starting As content (2.5 wt.% As) are close to the line [AuAs10] + FeS2, and the deviation becomes visible only at high measured As concentrations.
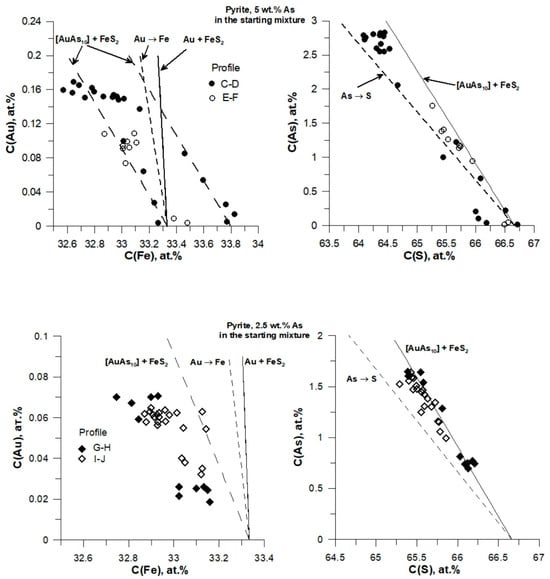
Figure 8.
Variations of Au vs. Fe (left) and As vs. S (right) in pyrite. Concentrations are in atomic percentages. The composition of the starting As + FeS mixture is indicated at the top of each figure. Points—results of EPMA analysis along profiles shown in Figure 5. Lines are calculated for different forms of occurrence of Au and As. Solid line—mixture of Au + FeS2, hyphenated lines are substitutions Au→Fe and As→S, long dashed line is a mixture of [AuAs10] atomic units and FeS2. All the lines start at the stoichiometric pyrite composition except one [AuAs10] + FeS2 line (left-side top figure), which was shifted rightwards to match the measured compositions.
The data for another group of grains, shown in Figure 9, show similar trends in Au vs. As and Au vs. Fe variations. The concentration of Au in pyrite (wt.%) increases with As concentration. The EPMA data for Au and As were tentatively divided into two trends; the slope of the lines is close to the slopes given in Figure 7. A group of points with low Au content and no Au-As correlation is inferred to be marcasite. This choice is discussed below. The points being plotted in atomic percent scale Au vs. Fe (right-side panel) are grouped close to the [AuAs10] + FeS2 line.
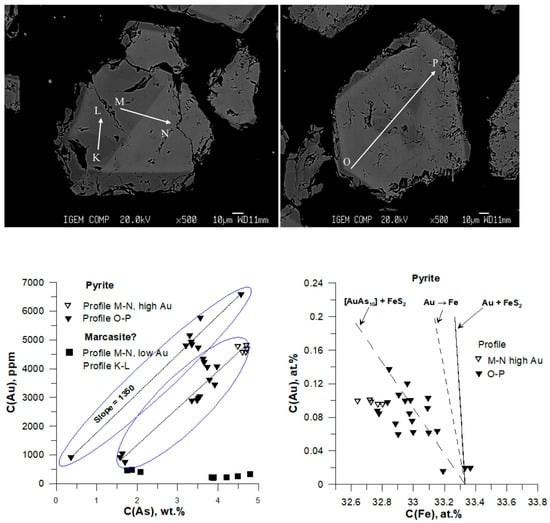
Figure 9.
Variations of Au vs. As (weight units) and Au vs. Fe (atomic percent scale) in pyrite and marcasite. Marcasite is inferred from sections with the lowest Au content with no Au-As correlation. Exp. Pr#5, aut. 6, 5 wt.% As in the starting As + FeS mixture, 35 wt.% NaCl in the fluid. BSE images of grains, together with EPMA profiles, are shown at the top. Points—results of EPMA analysis; lines are linear approximations of the measurement results. In the Au-As figure (left), two groups of points in pyrite with equal slope but shifted along the C(As) axis are indicated by blue circles.
Figure 10 shows the variation of As vs. S for marcasite. Strong negative correlations are observed on both weight and atomic concentration scales. The points are described by two parallel lines that are slightly shifted along the C(S) axis. The slope of the lines exactly corresponds to the As→S substitution model. This argues for the presence of marcasite in the grain intergrowth shown in Figure 9.
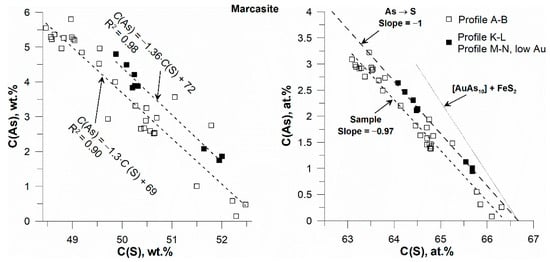
Figure 10.
Marcasite: variation of As vs. S. Weight units (left), atomic percent scale (right). Profiles A–B, K–L, M–N with low Au content. Lines in the right figure are explained in Figure 8.
The concentrations of Au and As, measured in all grains of pyrite described above, are plotted as log at.% in Figure 11. The EPMA data are described by two linear dependencies. The line with a smaller slope was obtained by the regression of points obtained for high initial As content (5 wt.%) in the As + FeS mixture; the second line with a sharper slope was calculated by the regression of data for lower starting As content of 2.5 wt.%. The other points for profiles shown in Figure 9, exhibiting higher scatter, are also grouped near these lines. The lines intersect at log C(Au) = −0.71, and log C(As) = 0.53 (at.%). This point probably corresponds to the maximum content of Au–As clusters at a given temperature.
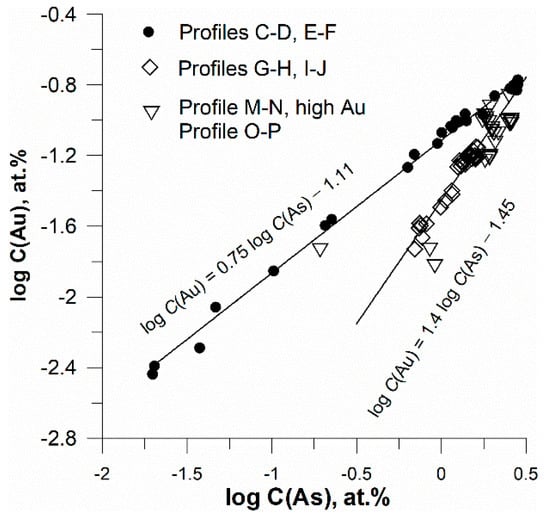
Figure 11.
Pyrite: variation of Au vs. As in atomic percent scales, logarithmic scales. Lines are results of linear regression of points located in the profiles C–D + E–F and profiles G–H + I–G.
3.3. Fine Intergrowth of Pyrite and Marcasite
EBSD analysis of one grain obtained in Exp. Pr#5 aut. 5 showed the fine intergrowth of pyrite and marcasite. This intergrowth probably reflects an intermediate stage of the marcasite-to-pyrite transformation. The results of EBSD and EPMA for this grain are shown in Figure 12, and the EPMA data are given in Table S5. The scatter of the EPMA data are much higher compared to the well-crystallized pyrite and marcasite grains described above. Profile Q5–Q6, which started in marcasite and then passed through the pyrite part, shows no Au–As and Au–Fe correlations. We suggest that this profile reflects the initial stages of the formation of pyrite at the expense of marcasite, when Au behavior in pyrite is inherited from marcasite. The highest Au content is determined in Profile Q7–Q8 near the grain boundary, and the starting points of Profile Q9–Q10 are also close to the boundary. This behavior shows that the Au-bearing fluid is the source of Au, which supplies the metal to pyrite in the course of the transformation. The points of Profile Q9–Q10 in the pyrite part with the highest As content show a slow increase of Au concentration, but the increase is much smaller than it was observed for well-crystallized grains.
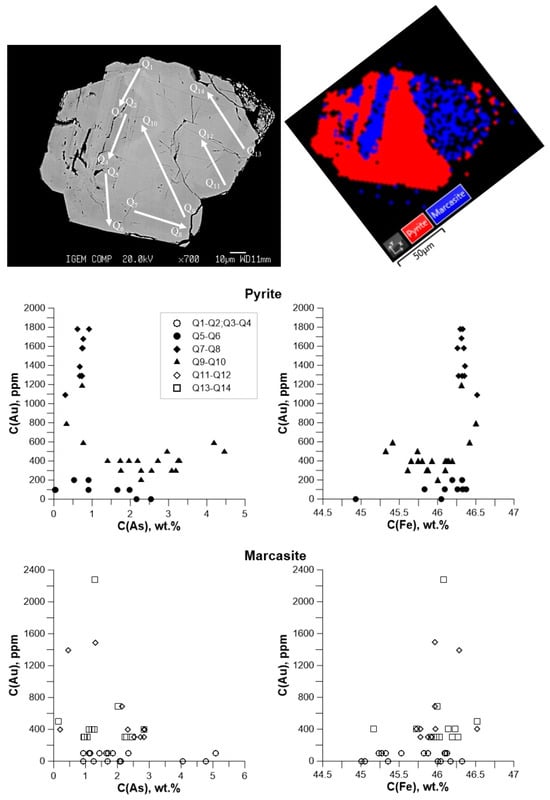
Figure 12.
Variations of Au vs. As (left) and Au vs. Fe (right) in pyrite + marcasite intergrowths. Concentrations are in weight units. Exp. Pr#5, aut. 5, 2.5 wt.% As in the starting As + FeS mixture, 35 wt.% NaCl in the fluid. BSE image of the grain aggregate with indications of the analysis profiles and EBSD phase map are shown at the top. Points that cross the X axes correspond to the EPMA detection limit.
In marcasite, the Au concentration is not correlated with the As or Fe content. The Au concentration in most points of analysis is below 600 ppm, which is consistent with results for well-crystallized grains. The anomalously high Au concentrations at some points probably account for the presence of small grains of pyrite or submicron Au inclusions, which were formed at the pyrite–marcasite grain boundaries.
The variation of As vs. S plotted in wt.% in Figure 13 for pyrite and marcasite is close to the well-crystallized marcasite pattern (Figure 10). The at.% plot (right panel of Figure 13) implies that in both minerals, As→S solid solution predominates. A small deviation of points with high As content from the regression line in the case of pyrite can be explained by minor fractions of Au–As clusters. In total, since the marcasite–pyrite transformation is not instantaneous, we can suggest that at the initial stages, pyrite inherits the chemical “signature” of marcasite (no Au–As correlation).
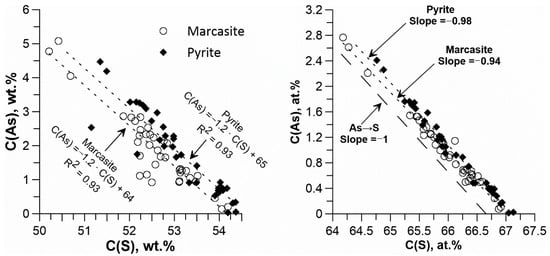
Figure 13.
Variation of As vs. S (left, weight units; right, atomic percent scale) in pyrite and marcasite grain intergrowths shown in Figure 12.
3.4. Affinity of Pyrite and Marcasite Grain Faces to Au and As
The cross-sections of two grains of well-crystallized minerals with a zonal distribution of Au and As were studied by means of EBSD. The results of the analysis are shown in Figure 14 and Figure 15. The phase color and inverse pole figures show that the first studied sample is an intergrowth of pyrite and marcasite grains (Figure 14), whereas the second sample is a single pyrite grain (Figure 15). The inverse pole figures demonstrate that the cross-section of both pyrite crystals are oriented close to the [001] direction. The observed zoning of Au and As concentrations can be described by the combination of {100}, {110}, and {hhl} forms. The {hhl} form cannot be unambiguously defined, but most probably the central part of the crystals is the {113} form. This form has a strong affinity to Au and As. As follows from the reconstruction of zoning geometry performed using the SHAPE program, the second form, which borders the central {113} form and has a lower affinity to Au and As, can be {110}.
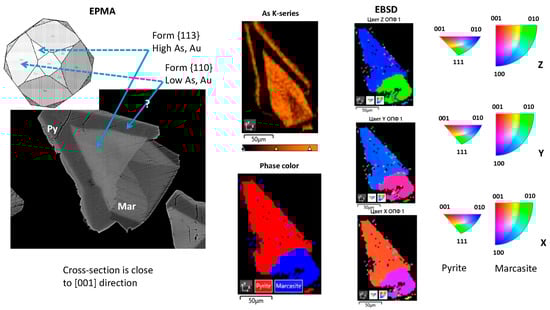
Figure 14.
SEM and EBSD mapping of intergrowth of pyrite + marcasite grains shown in Figure 5a. The BSE image is shown for comparison on the left.
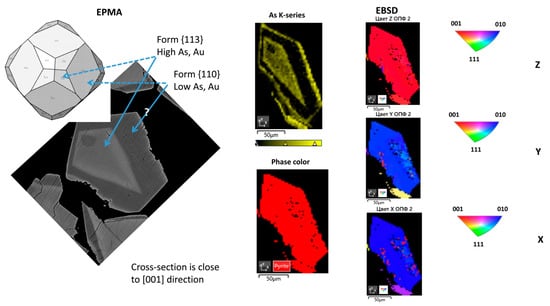
Figure 15.
SEM and EBSD mapping of pyrite grain shown in Figure 5b. The BSE image is shown for comparison on the left.
Starting at the point that {113} form in pyrite has high affinity to Au and As, other crystals with strongly pronounced zoning can be analyzed in terms of grain faces. Two examples of these grains are presented in Figure 16. In both grains, the {113} form is enriched in Au and As. The second form, which exhibits high affinity to these elements, is {111}, whereas forms {110} and {100} incorporate lower concentrations of the impurities.
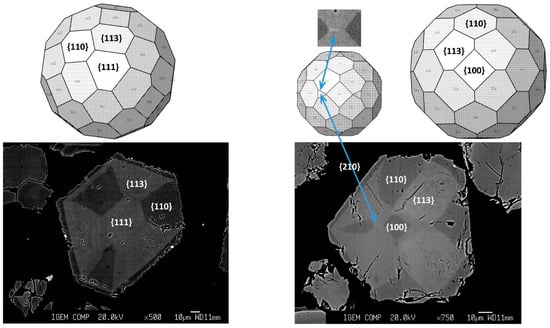
Figure 16.
Crystallographic interpretation of strongly pronounced sectoral zoning in pyrite grains.
As shown in the inset in Figure 16, there is a small trace of {210} face, which can be seen in the right panel. This face is located leftward from the central {100} face and separates two {113} faces. When the {210} face is present, instead of the vertex on the {110} low-Au–As face, a small edge on the face is developed. The Z-contrast indicates that the {210} face has the highest affinity for heavy elements, As and Au.
The marcasite crystal in Figure 14 is oriented along [001]. The crystal shape demonstrates extensive twinning on {101}. According to Z-contrast in Figure 14 and EPMA data (Table S5), As enriches {110} faces, while {001} faces accumulate less As. Gold is indifferent to the marcasite type of grain within the precision of our EPMA data.
4. Discussion
4.1. The Forms of Occurrence of Au and As in Pyrite and Marcasite
The results from EPMA of hydrothermal synthesis products provide evidence of Au-As clustering in arsenian pyrite. Based on this data, we infer that the clusters [AuAs10] are the main form of Au occurrence in the synthesized samples of arsenian pyrite. This form of “invisible” gold can be interpreted as löllingite-like clusters that are disseminated in the host mineral matrix. Our results from X-ray absorption spectroscopy XAS [14], as well as data [25,26], demonstrated a high affinity of this mineral to Au. The concentration of uniformly distributed Au in synthetic löllingite, studied in [14], reached 1000 ppm. We note that the studied löllingite sample was obtained by means of dry synthesis, which makes the dopant concentration lower compared to the hydrothermal method. According to extended X-ray absorption fine structure spectroscopy (EXAFS), the 1st coordination sphere of Au in löllingite consists of six As atoms at a distance of 2.52 Å, and there are four As atoms in the 3rd sphere at a distance of 3.88 Å. Therefore, the nearest anionic coordination spheres of Au in löllingite contain ten As atoms. The next coordination sphere includes six As atoms at a distance of 4.06 Å, whereas in the 2nd sphere there are two Fe atoms. We cannot unambiguously determine the composition of the clusters from EPMA results, but comparison with the available XAS data makes this suggestion quite plausible.
An important conclusion regarding the state of Au in pyrite, which comes from the analysis of correlation dependencies, is that the observed slopes of the regression lines cannot be described by the Au→Fe solid solution models. In the case when Au substitutes for Fe, the slope of the Au–Fe correlation line, plotted in atomic percentages, is equivalent for any number of As atoms in the nearest coordination spheres of Au from [AuS6] to [AuAs6] atomic units. Therefore, the increase in Au concentration in our pyrite samples is not the result of the step-by-step replacement of S atoms by As but is caused by the increase in the concentration of Au–As clusters. The same conclusion follows from the analysis of the As–S variation. At low As concentrations, the EPMA data are close to the [AuAs10] + FeS2 trend and deviate towards the As→S solid solution line as the As concentration increases. Accordingly, there are two forms of As occurrence in pyrite—the solid solution As and the Au–As clusters.
Our previous XAS results for base metal sulfides argue for the tendency of “invisible” gold to form clusters. Clustering at high Au concentrations was established in sphalerite [27], arsenic-free, and As-poor pyrite [18]. In both minerals, “invisible” gold presents itself in the form of a solid solution, which coexists with clusters of composition and local atomic environment similar to Au2S. In phases of the Cu–Fe–S system (digenite solid solution, bornite solid solution) at high temperature, Au also forms atomic clusters with a composition close to CuAuS and atomic structure corresponding to the minerals stromeyerite and petrovskaite [28]. It should be noted that there is no mineral with the composition of CuAuS. The available XAS results imply that the Au2S-like and CuAuS clusters are not randomly disseminated but incorporated in accordance with the principle crystallographic directions of the host phases.
An additional insight into the nature of the Au–As clusters can be provided by XAS data for sulfide phases doped with the other 11 group elements. Filimonova et al. [29] discovered that the “invisible” form of Ag in pyrrhotite most likely corresponds to Ag2S-like clusters. In the clusters, two S atoms are present as the first Ag neighbors, whereas the distant coordination spheres of Ag are disordered. Warkentin et al. [30] studied copper-doped ZnS and found that Cu has a local atomic structure different from ZnS. The EXAFS data showed that the first coordination sphere of Cu corresponds to CuS, whereas the second- and third-neighbor spheres are quite different from CuS. The authors interpreted the Cu form of occurrence as CuS-like nanocrystallites (clusters), which “are integrated into the ZnS host and do not have a completely random orientation, i.e., there is not an amorphous layer between the CuS-like nanocrystallites and the host crystal”.
A comparison of the XAS data with the results of the present study obtained for pyrite and marcasite shows that the same model can be valid for Au in arsenian pyrite. Despite the fact that the local atomic environment of the cations in pyrite and marcasite is equivalent, the Au–As clusters enrich pyrite but not marcasite. This means that the pyrite crystal structure is suitable for the incorporation of the clusters, but the structure of marcasite is not.
As follows from published XAS data, in As-free pyrite and at low As concentrations <~0.5–1 wt.%, gold can form an isomorphous solid solution with Au→Fe substitution [14,17,18]. The concentration of this form of Au decreases with temperature increase, and at the synthesis parameters (350 °C, 500 bar), it can reach more than 100 ppm in an Au-saturated system. The second form of “invisible” gold, found in [18], is the Au2S-like clusters, which can present along with the solid solution Au. In total, the concentration of both forms of Au occurrence can reach 300 ppm in samples of natural arsenian pyrite with more than 0.3 wt.% As (for example, arsenian pyrite from the Samolazovskoe deposit, Russia, studied in [18], which was formed at temperatures of 325–380 °C). Accordingly, the 100–300 ppm of “invisible” gold is a reasonable approximation for Au concentration in As-poor pyrite at 350 °C in an Au-saturated system. The concentration of Au in marcasite, determined in the present study, varies from the EPMA detection limit of 48 ppm to 1100 ppm, with an average value of 580 ± 300 ppm. Since the local atomic environment of a cation in pyrite and marcasite is the same, we suggest that marcasite also contains the solid solution Au + Au2S-like clusters; the latter can dominate at high Au concentrations. The upper concentration limit of the Au2S-like clusters in marcasite can be somewhat higher compared to pyrite.
Pokrovski et al. [16] studied one sample of natural As-rich pyrite by means of XAS. The authors conclude that in arsenian pyrite, Au is “in As- enriched Fe site” and “is likely to exhibit a range of Au(AsnS6-n) environments, from S-rich (n ≤ 1) to As-rich (n ≥ 3)”. Our results are not in line with this conclusion. Indeed, in As-poor pyrite, Au and As form solid solutions with Au→Fe and As→S substitutions. However, our EXAFS data [18], as well as the results of [17], demonstrated that, in this case, Au and As are randomly distributed within the crystal lattice of pyrite. In As-poor pyrite, in both studies, As was not detected in the Au nearest coordination spheres. Our new data show that in As-rich pyrite, in contrast to As-poor ones, Au–As clusters are the main form of Au occurrence. Therefore, it is probable that the spectra recorded in [16] for As-rich pyrite (2.6 ± 0.8 wt.% As) result from a mixture of three forms of “invisible” Au: the solid solution Au, the Au–As clusters, and, probably, the Au2S-like clusters. To separate the contribution of individual forms of Au, it is necessary to perform an XAS experiment using a micron-sized beam to be able to study different zones within a crystal. The batch sample experiment is not suitable for this purpose.
As a result of an extensive study of natural arsenian pyrite samples, Reich et al. [11] obtained an equation that describes the highest limit of Au content as a function of As concentration. The equation C(Au) = 0.02 C(As) + 4·10−5 (at.%) was inferred to be “maximum solid solution Au contents”. In our study, the Au vs. As lines exhibit much higher slopes. Being roughly approximated by linear dependency, the variation of Au vs. As (at.%) yields a slope close to 0.05, which results in much higher Au concentrations in As-rich pyrite. Since the concentration of the solid solution Au in As-free and As-poor pyrite is the same [14,18], this solid solution line extends horizontally to high As concentrations, whereas an increase in Au content results from the formation of Au–As clusters. One can speculate that at high As concentrations, the solid solution Au content increases somewhat because of the increase in pyrite unit cell parameters (cf., [31]). However, the contribution of the solid solution Au in As-rich pyrite is masked by the predominance of the Au–As clusters. Moreover, this suggestion contradicts the Au behavior in marcasite, where the solid solution Au + As2S-like cluster concentration is independent of the As content. From this point of view, the Au vs. As correlation obtained in [11] reflects the chemistry of the hydrothermal fluid, which forms the auriferous pyrite, rather than the Au solubility limit. The fluid can be undersaturated in gold, and the degree of saturation can vary from one deposit to another, as demonstrated in Section 5, “Implications to the natural ore-stage sulfides”.
4.2. Affinity of Pyrite and Marcasite Grain Faces to Au and As
By means of the interpretation of EBSD results for well-crystallized pyrite grains and the combination of these data with the analysis of pronounced sectoral zoning developed in some pyrite grains, we ascertained the affinity of different grain faces to Au and As. The forms {210}, {113}, and {111} have a high affinity for these admixtures, whereas the affinity for the {110} and {100} forms is lower. The contrast ability of different forms to incorporate Au and As can affect the Au content in natural pyrite when the growth conditions promote the development of the definite grain faces, which can be an additional reason for a high scatter of the measured Au concentrations in natural pyrite samples. This finding is opposite to the results of Chouinard et al. [32]. The authors studied a pyrite grain with sector and concentric chemical zoning from the Pascua epithermal high-sulfidation deposit (Chile–Argentina) and determined that trace elements (Ag, As, and Te) are preferentially incorporated on the {110} form and rejected by {111} faces. There are two reasons that can explain the difference between our study and [32]. The first one is the difference in the forms of occurrence of Au and As in pyrite. In our samples, Au–As clusters account for a significant proportion of these elements, whereas the pyrite studied in [32] is Au-poor. It is probable that the form {111} incorporates Au and As as clusters, whereas the affinity of the form {110} to the clusters is low. The second reason can be the difference in the chemistry of the hydrothermal fluid, which forms pyrite. Our synthesis experiments were performed at reducing conditions and low sulfur content, when the redox state and sulfur fugacity are buffered by the pyrite–pyrrhotite assemblage and pH is near-neutral. Pyrite sampled at the high-sulfidation deposit was formed in an oxidized system with a high dissolved sulfur concentration and an extremely low pH. The differences in fluid chemistry can account for different mechanisms of impurity sorption. Our results do not allow discrimination between the two reasons. Nonetheless, comparisons with other studies can elucidate this problem.
Xian et al. [33] studied the affinity of different pyrite faces to Au, which precipitated from a Au3+Cl4− aqueous solution at ambient temperature. They found that the {210} faces have the highest Au precipitation rate, followed by the {111} faces. The {110} form exhibited the lowest Au precipitation rate. The amount of Au precipitated on the {210} and {111} faces was found to be much higher than the one on the {110} face. The same consequence of pyrite grain affinity to Au was observed in our study.
Comparison of our data with [32,33] shows that in the presence of the Au–As clusters, the affinity of the pyrite grain faces to As changes. In the Au-poor system, As is predominantly sorbed by the {110} form [32]. Analysis of our experimental products implies that such a situation is also true for marcasite, where the Au–As clusters do not form and As enriches the {110} form. In the presence of the clusters, Au, together with As, which is part of the clusters, enriches {210} and {111} faces, whereas the solid solution As may still be preferentially incorporated on the {110} form. Therefore, the forms of occurrence can be considered the main factor that affects the affinity of pyrite grain faces to Au and As.
4.3. Mechanisms of the Formation of Auriferous Pyrite and Marcasite
Further comparison of our data with the results of [33] makes it possible to get insight into the mechanisms of the formation of auriferous pyrite and marcasite. By means of X-ray photoelectron spectroscopy XPS measurements, the authors of [33] determined that Au on pyrite faces exists in two forms: metallic gold and Au+. It was suggested that the latter may be bonded to surface S atoms as a thin film. To interpret the experimental observations, the density functional theory DFT calculations were performed with a simulation of the surface electronic structure of pyrite faces and a calculation of gold adsorption energy. Since Au existed in +3 oxidation state in aqueous solution and 0 and +1 oxidation states on pyrite surfaces, the gold reductive deposition mechanism was used to explain the experimental and theoretical data. The calculated adsorption energy of Au on pyrite surfaces was found to increase in the order {100} < {111} < {210}, which may explain the observed sequence of the absorption rate values. The highest occupied molecular orbital HOMO—lowest unoccupied molecular orbital LOMO gaps were determined as 0.56, 0.28, and 0.15 eV for {100}, {111}, and {210} forms, respectively. Because the {210} faces possess the narrowest gap, the electrons on this surface can be more easily excited than those on the other faces, which explains the high reactivity of this form, the intermediate of {111}, and the low of {100}.
In our experimental fluids, Au was presented in the +1 “formal” oxidation state, and Au(HS)2− was the dominant species [34,35]. In Au+1(HS)2− gold is a cation and is positively charged, whereas in compounds with As, it behaves like an anion. The DFT calculations performed for auriferous löllingite solid solution yield the Bader partial atomic charge of −0.37 e for Au, whereas the charges of As atoms are −0.08 and −0.01 e (see Table S3 in [14]). A similar value of Au charge can be expected in Au–As löllingite-like clusters. Therefore, the reductive deposition model is appropriate for the incorporation of Au in As-rich pyrite as well. In this case, the sequence of the pyrite faces affinity to Au {100} < {111} < {210} [33] is in agreement with our results. The reductive deposition mechanism may also account for the incorporation of As, which changes its oxidation state from positive in the main aqueous species As(OH)3(aq) [36] to close to zero values in auriferous löllingite and löllingite-like clusters.
In contrast to As-rich pyrite, in As-free, As-poor pyrite, and, probably, marcasite, Au substitutes for Fe and mostly has S ligands in the nearest coordination spheres. In this case, the charge of Au is positive. The DFT calculations yield a Au charge of +0.42 e for the Au→Fe solid solution in pyrite [14]. Note that the coordination number of a cation in pyrite equals six. In Au2S, gold is coordinated by two nearest-neighbor S atoms, and the Au partial atomic charge of +0.21 e is even less than that in pyrite. As the 1st coordination spheres of Au in aqueous species Au(HS)2− and solid phase Au2S are equivalent, the Au atomic charges are also close to each other. Accordingly, oxidation, but not reduction, is necessary to incorporate Au in As-poor pyrite as well as in marcasite solid solutions.
It is worth noting that in the case of Au incorporation as Au2S-like clusters, the process is insensitive to the face-specific redox reactivity. This may explain the negligible effect of the type of grain faces on the concentration of Au in marcasite observed in our study. Similar behavior can exhibit As-poor pyrite.
4.4. The Effect of Au and As on the Growth Rate of Pyrite Grain Faces
In natural pyrite, the {100}, {111}, and {210} faces are most frequent [37], whereas in our samples only traces of the {210} form were found. It is known that the surface of a real crystal has defects and imperfections. During crystal growth, the attachment of a particle to the site of a local dislocation (imperfection) is energetically most favorable [38]. The Au-As clusters, formed on the pyrite surface, are a kind of imperfection. They can act as seeds and enhance the growth rate. As the affinity of {210} form to Au and As is the highest, these faces exhibit the highest growth rate in As-rich auriferous pyrite. The higher the growth rate, the lower the probability of face formation. As a result, the {210} faces are replaced by the neighboring {113} ones, which pose a lower growth rate because of the lower content of imperfections—the Au–As clusters. Natural arsenian pyrite is formed by fluids with a much lower Au concentration and, accordingly, contains less Au. For this reason, the {210} faces are abundant, whereas the {113} form is rare. This conclusion can be verified by means of the analysis of the typomorphism of natural arsenian pyrite crystals of contrast Au content.
A growth of NaCl crystals from aqueous solutions is an example that confirms this hypothesis because NaCl and pyrite belong to the same structure type (sp gr Fm3m). For NaCl crystals, which form from pure aqueous solution, the growth rates increase in the order v100 < v111 < v210 < v110 [38]. Therefore, the crystals exhibit cubic habitus, whereas other forms are rare. The addition of a small amount of urea to the aqueous solution changes the growth rates: v111 < v100 < v110 < v210, and the crystals grow in the form of octahedra. In this case, the {210} faces do not form.
It is known that even trace amounts of As inhibit pyrite formation in sulfidic solutions (cf., [39]). Several mechanisms were employed to explain this behavior, most of them suggesting that As sorption sites are crucial for the transformation of FeS to pyrite. In the case of As-rich auriferous pyrite, the opposite effect of As is observed. Incorporation of Au–As clusters accelerates the formation of pyrite faces, which is consistent with the change of the main As form of occurrence in the presence of Au in our experiments.
5. Implications to Natural Ore-Stage Sulfides
Insight into the processes that influence ore-grade gold mineralization can be obtained by comparing the experimental data with the compositions of the natural ore-stage sulfides. For this purpose, we studied a few samples of natural sulfide ore from the Vorontsovka Carlin-type gold deposit [5,40,41] (Figure 17, Figure 18 and Figure 19) and the Pavlik orogenic gold deposit [42,43,44] (Figure 20). The phase composition of the studied samples is given in Supplementary Materials S1, Table S6. The SEM BSE images of a few crystals from the samples are given in Supplementary Materials S2. General information on the deposits is provided in Supplementary Materials S3.
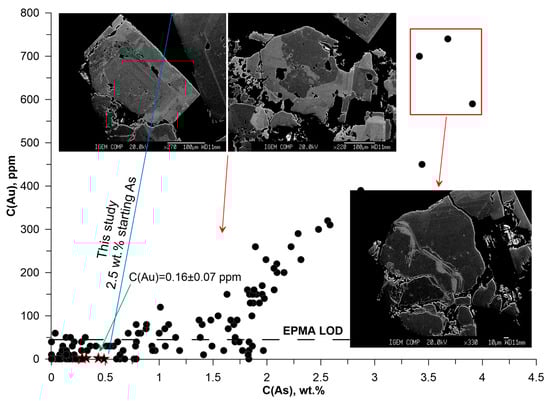
Figure 17.
Variation of Au vs. As in pyrite from the sample “Vorontsovka black” (weight units). BSE images illustrate several grains that were used for EPMA. Points—EPMA data, stars—LA-ICP-MS data (the average Au concentration is given for LA-ICP-MS data). Line corresponds to the experimental data obtained for pyrite synthesized using the 2.5 wt.% As + FeS starting mixture (cross-sections G–H + I–J in Figure 5, Exp. Pr#5, aut. 5). The electron microprobe analysis is performed on individual points (not profiles).
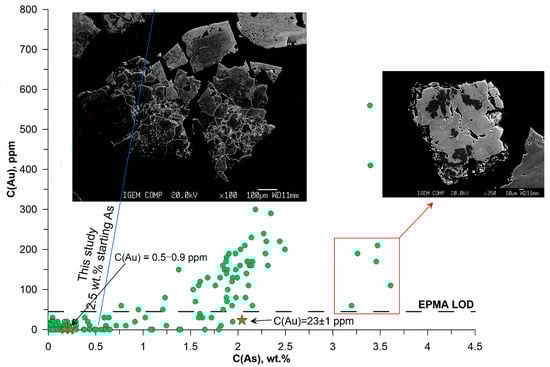
Figure 18.
Variation of Au vs. As in sulfides from the sample “Vorontsovka green”.
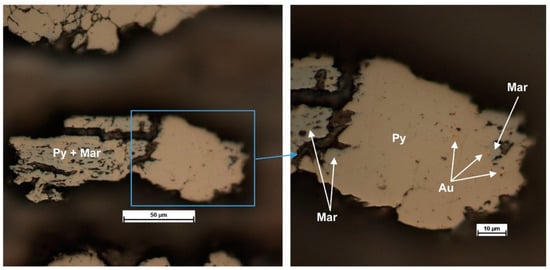
Figure 19.
Sample “Vorontsovka green”. Photomicrographs of pyrite+marcasite intergrowth with native gold inclusions at the pyrite–marcasite boundaries.
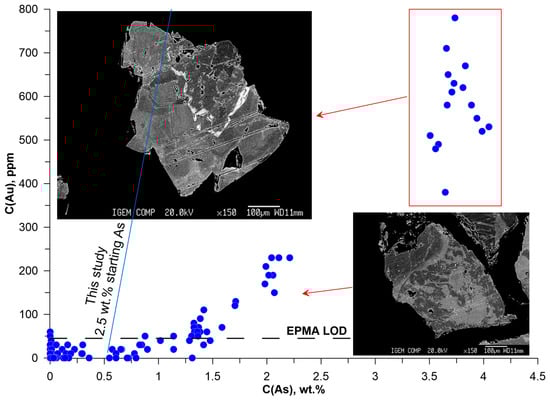
Figure 20.
Variation of Au vs. As in sulfides from the sample “Vorontsovka VS”.
The EPMA method developed in the present study was used to determine the chemical composition of the samples. The LA-ICP-MS was applied to several zones within a grain with low Au content. In Figure 17, Figure 18, Figure 20, Figure 21 and Figure 22, the points located between zero and the EPMA LOD characterize the statistical scatter of the measured values (background level). The fact that the points fall within the 3σ interval validates the correctness of the EPMA LOD calculation. These points do not contain information about the real Au content, which is determined by means of the LA-ICP-MS (stars in the figures).
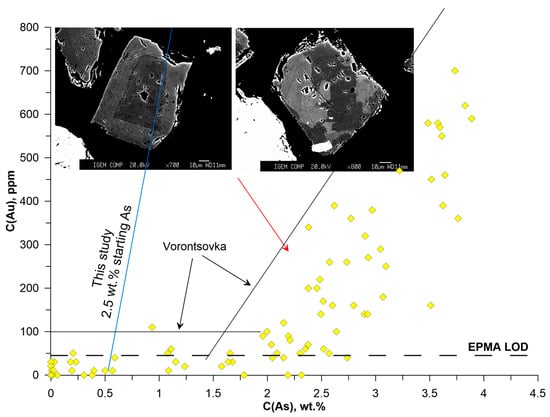
Figure 21.
Variation of Au vs. As in pyrite from the sample “Pavlik”. Black solid lines show the maximum Au content in pyrite from Vorontsovka deposit.

Figure 22.
Top: Variation of Au vs. As in all studied natural samples (atomic percent scale). Dash-dotted line—equation from [11], solid line—describes the experimental data obtained for the 2.5 wt.% As + FeS starting mixture. Horizontal line shows the EPMA detection limit. Bottom: variation of As vs. S (atomic percent scale).
Apart from Au and As, some other admixtures were included in the EPMA protocol. In all studied samples, the concentrations of these elements were below the EPMA LOD (3σ, wt.%: Ni—0.06, Cu—0.09, Sb—0.06, Co—0.06).
5.1. Vorontsovka Deposit
According to XRD, the sulfide minerals separated from the studied sample are pyrite and a small amount of marcasite. The sample consists of two sections, which correspond to two groups of grains: (1) the silicified dark-colored part with scattered fine inclusions of sulfides—named “Vorontsovka black”, and (2) the epidotized zone (with carbonate) with larger dissemination and nest-like accumulations of sulfides—named “Vorontsovka green”. The 3rd series of measurements was carried out on the generalized sulfide grain fraction containing grains of two zones without their separation—Vorontsovka VS (without separation).
Grains from the silicified dark-colored zone (Vorontsovka black, Figure 17) are hypidiomorphic, in most cases strongly “corroded”, with a large number of inclusions of nonmetallic mass. Only pyrite was identified in this sample by optical examination (Supplementary Materials S2). In general, a strong Au–As correlation is observed at C(As) > 1.5 wt. %. The As content varies from 0.28 to 3.91 wt.%, and the Au content varies from 0.2 (LA-ICP-MS data) to 790 ppm. This group of grains exhibits spotted and oscillatory zoning. The maximum contents of Au are characteristic of high-arsenic contrast zones in grains with oscillatory zoning, which is consistent with the symmetry elements of pyrite crystals. We believe that this part of the sample contains an earlier generation of pyrite, formed directly by the precipitation from the ore fluid.
Sulfides from epidotized rock (Vorontsovka green, Figure 18) form isometric crystals and their aggregates. Optical examination showed that this sample mostly consists of pyrite with a small amount of pyrite + marcasite intergrowths (Figure 19). The edges of the crystals are often sinuous, sometimes have an “openwork” structure, and contain inclusions of nonmetallic mass. The scatter of C(Au) is significantly higher than in the dark-colored Vorontsovka black, and the Au–As correlation is much less pronounced. Like the dark-colored sample, in the epidotized rock, the majority of points correspond to C(As) < 2.5 wt. %. The As concentrations vary from 0.02 to 3.6 wt. %, and the Au concentrations range from 0.5 ppm (LA-ICP-MS data) to 560 ppm. Sulfides in this sample are characterized by various types of zoning: fuzzy oscillatory, cloudy, openwork (lenticular, lenticular banded), and associated with various As concentrations. The grains with openwork zoning in zones with C(As) > 1.5 wt. % contain no more than 100 ppm Au. For most grains with C(As) < 2.5 wt. %, C(Au) does not exceed 300 ppm.
There is a group of points that stand out from the general pattern of the Au vs. As variation (5 points highlighted with a red rectangle). The As content in this grain is 3.2–3.6 wt. %, whereas the Au content is 60–210 ppm, which is not typical for grains with spotty zoning. We infer this group of points to be pyrite + marcasite intergrowth, as the EPMA data were collected without discriminating between these minerals. The shape of the grain, with cracks and “corroded” sinuous edges, testifies in favor of this suggestion. An example of such pyrite + marcasite intergrowth is shown in Figure 19. Of note are the native gold inclusions that formed at the pyrite–marcasite grain boundaries. It is probable that the presence of marcasite affected the measured Au content because of the absence of a Au–As correlation in this mineral. Gold extraction by hydrothermal fluid with the deposition of submicron-size metal inclusions at the phase boundaries can also contribute to the lower Au concentration. Overall, the wide variation in Au contents is likely due to hydrothermal reworking of the earlier mafic zone, which was caused by local epidotization.
The data for the generalized fraction (Vorontsovka VS, Figure 20) clearly indicate the presence of three regions of Au content: (1) at C(As) < 1.5 wt.% the Au–As correlation is absent and C(Au) varies from a few tens to ~100 ppm; (2) in pyrite with spotty zoning and C(As) 1.5–2.2 wt.% the Au concentration varies from the EPMA detection limit to 230 ppm; (3) pyrite with oscillatory zoning, where in zones with C(As) = 3.5–4.5 wt.% the Au concentration varies widely—from 350 to 800 ppm. In this sample, the gap in the region 2.2 wt.% < C(As) < 3.5 wt.% probably separates two stages of the ore formation, which correspond to contrasting contents of As and Au in the ore-forming.
5.2. Pavlik Deposit
According to XRD, the sulfides in this sample comprise arsenopyrite and pyrite. Only data for pyrite are discussed below. It is characterized by hypidiomorphic crystals with different types of zoning: oscillatory and spotted (Figure 21). The As content varies from the detection limit to 3.91 wt. %, Au—up to 700 ppm. The maximum Au concentrations are mostly lower than in pyrite from the Vorontsivka deposit (black lines in Figure 21). It is worth noting that in As-rich pyrite of the Pavlik deposit at C(As) > 2 wt. % the Au concentration varies over a wider range than in pyrite of the Vorontsovka deposit.
5.3. General Trends of Au and As Behavior in Natural Sulfides
Figure 22 (top) compares the variation of Au vs. As determined in all studied natural samples with the empirical line of Reich et al. [11] and the line derived from our experimental data. The data for natural sulfides point to the presence of two types of “invisible” gold. The first type corresponds to the As-poor compositions when Au and As behave independently. In this region, Au presents in the pyrite and marcasite solid solutions can coexist with Au2S-like clusters [14,17,18]. The Au concentration in this region extends to ca. 100–150 ppm. The second type of “invisible” gold is formed in As-rich pyrite. This composition range is characterized by a strong Au–As correlation because of the predominance of Au–As clusters. It is worth noting that the Au concentration in all natural pyrite grains is well below the upper composition limit defined in [11] and varies widely, not only depending on the deposit type but also from one sample (or grain within a sample) to another. This means that the Au content in pyrite is mostly defined by the chemistry of the ore-forming hydrothermal fluid and subsequent ore transformations, but not by the pyrite affinity to Au, which is much higher.
This point of view enables an explanation of the effect of the fluid salinity on the Au content in pyrite. In our experiments, an increase in NaCl concentration resulted in a decrease in Au content in pyrite (Figure 4). With the increase in NaCl concentration, the pH of the fluid increases (the fluid becomes more alkaline) because of the difference in NaOH vs. HCl dissociation constants. In the pH region, from weakly acidic to alkaline, Au(HS)2− is the main form of dissolved Au (cf., [34,35]). The pH increases from near-neutral to alkaline values, causing a decrease in the concentration of this species. The concentration of Au in pyrite follows this trend.
Two lines shown in Figure 22 (top) intersect at the 0.85 wt.% As—450 ppm Au point. The position of this point is of high uncertainty because the composition of Au–As clusters is not unambiguously defined in our study, and the cluster concentration depends on the fluid PT-compositional parameters. Moreover, the line from [11] presents an averaged approximation of a large body of compositions, which is also of high variation. Nonetheless, a point located at Au concentration ranging from ca. 100 to a few hundred ppm and ca. 0.5–1 wt.% As seems to be a reasonable approximation of a boundary where the Au main form of occurrence in pyrite changes.
Figure 22 (bottom) shows the variation As vs. S in the atomic percent scale. The points (EPMA data) are grouped around the trend with the slope of the As→S solid solution. The close agreement between the measurement results and the solid solution model line implies a negligible contribution of the As→Fe substitution described in [45,46] in the studied samples.
6. Conclusions
In the present study, we performed hydrothermal experiments on the synthesis of auriferous sulfides in NaCl-rich fluids (pyrite–pyrrhotite buffer) at 490 °C, 1000 bar, and 350 °C, 500 bar. The method of precise EPMA measurements of the composition of sulfide minerals with simultaneous determination of the concentrations of trace, minor (Au, As), and main components (Fe, S) was developed and approbated. The study of the synthesized pyrite and marcasite grains by EPMA, EBSD, and LA-ICP-MS methods results in the following conclusions:
- In pyrite with high “invisible” gold content, there is a strong positive Au–As correlation and a strong negative Au–Fe and As–S correlation. The identified correlations cannot be described by theoretical models based on the mixing of Au + FeS2 or by the formation of a solid solution of Au and As via Au→Fe and As→S substitutions. The measurement results imply Au–As clustering. The best model that describes the observed Au–Fe variation is the mixing of atomic clusters of composition close to [AuAs10] with FeS2. We suggest that the local atomic structure of the clusters corresponds to löllingite. The As–S variation is described by a mixture of two forms of As: [AuAs10] clusters and As→S solid solution. The mechanism of Au reductive deposition can account for the formation of auriferous As-rich pyrite.
- In the marcasite (350 °C experiment), in contrast to pyrite, the concentration of Au is independent of As content at C(As) up to 6 wt.%. The state of Au in marcasite is inferred from the solid solution Au + Au2S-like clusters, according to published XAS data for pyrite.
- EBSD and EPMA data for pyrite grains with pronounced sectoral zoning allowed us to identify forms of different affinities to As and Au. The {210}, {113}, and {111} forms exhibit high affinity to As and Au, while the {110} and {100} forms are of low affinity to these elements. The wide range of As and Au concentrations determined in natural pyrite can be partly explained by the preferential development of different simple forms.
- These results, together with data on the ore-stage pyrite from Carlin-type Vorontsovka (North Urals) and Pavlik orogenic-type (Upper Kolyma, north-eastern Russia) gold deposits, imply that the increase in Au content observed in natural pyrite samples at C(As) > ca. 1 wt.% results from the incorporation of the Au–As clusters but not because of the formation of Au→Fe solid solution. Therefore, the concentration of “invisible” gold in As-poor to As-rich pyrite is dictated by the chemistry of the hydrothermal fluid and subsequent ore transformations, whereas the capacity of pyrite to incorporate Au is very high and, in our experimental samples, reaches 0.8 wt.% at C(As) = 5 wt.%.
Our experiments were performed at a relatively high temperature of 350 °C in a system with low redox potential, high salinity, and a high As concentration. These conditions enabled the formation of pyrite with high concentrations of Au–As clusters, which are not characteristic of natural minerals, but made possible the qualitative characterization of the synthesis products by precise EPMA measurements. We believe that the results of the experiments are of universal character and can be applied to any type of hydrothermal ore with auriferous arsenian pyrite and marcasite as gold carriers and lower Au content.
Supplementary Materials
The following supporting information can be downloaded at: https://www.mdpi.com/article/10.3390/min14020170/s1, S1—Tables S1 and S2: operating conditions of XRD and LA-ICP-MS, Tables S3 and S4: Phase and chemical composition of the synthesis products, Table S5: Chemical composition of pyrite and marcasite according to EPMA, Table S6: Phase composition of natural samples, Figure S1: Sketch of the experimental method, Figure S2: Time-resolved LA-ICP-MS signal spectra of pyrite samples from experiment Pr#4; S2—SEM BSE images of the synthesis products and natural minerals, photomicrographs of pyrite from the Vorontsovka black sample; S3—General information of Vorontsovka and Pavlik deposits.
Author Contributions
E.V.K. developed and approbated the EPMA method, performed EPMA analyses, and interpreted the results; B.R.T. designed the study, performed hydrothermal synthesis experiments, interpreted the data, and wrote the paper; S.E.B. developed the EPMA method and studied a part of the natural pyrite samples; M.S.N. and V.B.K. prepared samples for SEM-EBSD analysis, studied the samples, and interpreted the results; E.E.T. and N.V.S. sampled natural ores and prepared them for the following work; A.A.M. performed XRD analyses and interpreted the results; V.Y.P. participated in the writing of geological applications and interpretation of data for natural samples; I.V.V. was in charge of the field work and interpreted data on the natural pyrite samples; and all the authors participated in the manuscript preparation. All authors have read and agreed to the published version of the manuscript.
Funding
This study was supported by the Russian Science Foundation, grant No. 23-17-00090.
Data Availability Statement
The original data presented in the study are included in the article as Supplementary Materials.
Acknowledgments
We thank Vera Abramova and Sofia Obysova for the LA-ICP-MS analysis of synthetic and natural minerals. We are grateful to Lydia Samoshnikova for studying our samples by SEM. Three anonymous reviewers are acknowledged for numerous insightful comments and suggestions that greatly improved the manuscript. We wish to thank Reviewer# 1 for providing us with an important reference that helped us get further insight into the problem. Reviewer# 3 is greatly acknowledged for his thorough review of the text. Chemical analyses were carried out at the “IGEM-Analytica” Center of collective use.
Conflicts of Interest
The authors declare no conflicts of interest.
References
- Cook, N.J.; Chryssoulis, S.L. Concentrations of “invisible gold” in the common sulfides. Can. Miner. 1990, 28, 1–16. [Google Scholar]
- Deditius, A.P.; Reich, M.; Kesler, S.E.; Utsunomiya, S.; Chryssoulis, S.L.; Walshe, J.; Ewing, R.C. The coupled geochemistry of Au and As in pyrite from hydrothermal ore deposits. Geochim. Cosmochim. Acta 2014, 140, 644–670. [Google Scholar] [CrossRef]
- Cline, J.S.; Hofstra, A.H.; Muntean, J.L.; Tosdal, R.M.; Hickey, K.A. Carlin-type gold deposits in Nevada: Critical geologic characteristics and viable models. In Economic Geology; 100th Anniversary Volume; Society of Economic Geologists: Littleton, CO, USA, 2005; pp. 451–484. [Google Scholar]
- Prokofiev, V.; Brovchenko, V.; Zorina, L.; Krasnov, A.; Abramova, V.; Bortnikov, N. Trace elements in pyrite and its crystallization temperature: An example of gold deposits in the Darasun Goldfield, Eastern Transbaikalia, Russia. Minerals 2023, 13, 288. [Google Scholar] [CrossRef]
- Vikentyev, I.V.; Tyukova, E.E.; Vikent’eva, O.V.; Chugaev, A.V.; Dubinina, E.O.; Prokofiev, Y.V.; Murzin, V.V. Vorontsovka Carlin-style gold deposit in the North Urals: Mineralogy, fluid inclusion and isotope data for genetic model. Chem. Geol. 2019, 508, 144–166. [Google Scholar] [CrossRef]
- Vikentyev, I.V.; Damdinov, B.B.; Minina, O.R.; Spirina, A.V.; Damdinova, L.B. Classification of polymetallic ore-forming processes and transitional VMS–SEDEX–MV-type: The example of the giant Ozernoe deposit in Transbaikalia, Russia. Geol. Ore Deposits 2023, 65, 191–223. [Google Scholar] [CrossRef]
- Cooke, D.R.; Simmons, S.F. Characteristics and genesis of epithermal gold deposits. In Gold in 2000, Reviews in Economic Geology; Hageman, S.G., Brown, P.E., Eds.; Society of Economic Geologists: Littleton, CO, USA, 2000; Volume 13, pp. 221–244. [Google Scholar]
- Vikentyev, I.; Vikent’eva, O.; Tyukova, E.; Nikolsky, M.; Ivanova, J.; Sidorova, N.; Tonkacheev, D.; Abramova, V.; Blokov, V.; Spirina, A.; et al. Noble metal speciations in hydrothermal sulphides. Minerals 2021, 11, 488. [Google Scholar] [CrossRef]
- Vikentyev, I.V. Invisible and microscopic gold in pyrite: Methods and new data for massive sulfide ores of the Urals. Geol. Ore Depos. 2015, 57, 237–265. [Google Scholar] [CrossRef]
- Fleet, M.E.; Mumin, A.H. Gold-bearing arsenian pyrite and marcasite and arsenopyrite from Carlin Trend gold deposits and laboratory synthesis. Am. Mineral. 1997, 82, 182–193. [Google Scholar] [CrossRef]
- Reich, M.; Kesler, S.E.; Utsunomiya, S.; Palenik, C.S.; Chryssoulis, S.L.; Ewing, R.C. Solubility of gold in arsenian pyrite. Geochim. Cosmochim. Acta 2005, 69, 2781–2796. [Google Scholar] [CrossRef]
- Wu, X.; Delbove, F. Hydrothermal synthesis of gold-bearing arsenopyrite. Econ. Geol. 1989, 84, 2029–2032. [Google Scholar] [CrossRef]
- Kovalchuk, E.V.; Tagirov, B.R.; Vikentyev, I.V.; Chareev, D.A.; Tyukova, E.E.; Nikolsky, M.S.; Borisovsky, S.E.; Bortnikov, N.S. “Invisible” Gold in synthetic and natural arsenopyrite crystals, Vorontsovka Deposit, Northern Urals. Geol. Ore Depos. 2019, 61, 447–468. [Google Scholar] [CrossRef]
- Trigub, A.L.; Tagirov, B.R.; Kvashnina, K.O.; Chareev, D.A.; Nickolsky, M.S.; Shiryaev, A.A.; Baranova, N.N.; Kovalchuk, E.V.; Mokhov, A.V. X-ray spectroscopy study of the chemical state of “invisible” Au in synthetic minerals in the Fe-As-S system. Am. Mineral. 2017, 102, 1057–1065. [Google Scholar]
- Pokrovski, G.; Kokh, M.; Proux, O.; Hazemann, J.L.; Bazarkina, E.; Testemale, D.; Escoda, C.; Boiron, M.-C.; Blanchard, M.; Aigouy, T.; et al. The nature and partitioning of invisible gold in the pyrite-fluid system. Ore Geol. Rev. 2019, 109, 545–563. [Google Scholar] [CrossRef]
- Pokrovski, G.S.; Escoda, C.; Blanchard, M.; Testemale, D.; Hazemann, J.-L.; Gouy, S.; Kokh, M.A.; Boiron, M.-C.; de Parseval, F.; Aigouy, T.; et al. An arsenic-driven pump for invisible gold in hydrothermal systems. Geochem. Perspect. Let. 2021, 17, 39–44. [Google Scholar] [CrossRef]
- Merkulova, M.; Mathon, O.; Glatzel, P.; Rovezzi, M.; Batanova, V.; Marion, P.; Boiron, M.-C.; Manceau, A. Revealing the chemical form of “invisible” gold in natural arsenian pyrite and arsenopyrite with High energy-resolution X-ray absorption spectroscopy. ACS Earth Space Chem. 2019, 3, 1905–1914. [Google Scholar] [CrossRef]
- Filimonova, O.N.; Tagirov, B.R.; Trigub, A.L.; Nickolsky, M.S.; Rovezzi, M.; Belogub, E.V.; Reukov, V.L.; Vikentyev, I.V. The state of Au and As in pyrite studied by X-ray absorption spectroscopy of natural minerals and synthetic phases. Ore Geol. Rev. 2020, 121, 103475. [Google Scholar] [CrossRef]
- Driesner, T. The system H2O-NaCl. II. Correlations for molar volume, enthalpy, and isobaric heat capacity from 0 to 1000 °C, 1 to 5000 bar, and 0 to 1 XNaCl. Geochim. Cosmochim. Acta 2007, 71, 4902–4919. [Google Scholar] [CrossRef]
- Self, P.G.; Norrish, K.; Milnes, A.R.; Graham, J.; Robinson, B.W. Holes in the background in XRS. X-ray Spectr. 1990, 19, 59–61. [Google Scholar] [CrossRef]
- Wilson, S.A.; Ridley, W.I.; Koenig, A.E. Development of sulfide calibration standards for the laser ablation inductively-coupled plasma mass spectrometry technique. J. Anal. At. Spectrom. 2002, 17, 406–409. [Google Scholar] [CrossRef]
- Piña, R.; Gervilla, F.; Barnes, S.J.; Oberthür, T.; Lunar, R. Platinum-group element concentrations in pyrite from the Main Sulfide Zone of the Great Dyke of Zimbabwe. Miner. Depos. 2016, 51, 853–872. [Google Scholar] [CrossRef]
- Dowty, E. Atoms 5.0: A Complete Program for Displaying Atomic Structures; Shape Software: Kingsport, TN, USA, 1999. [Google Scholar]
- Zotov, A.V.; Rusinov, V.L. The effect of kinetic factors on the formation conditions of pyrite and marcasite. In Contributions to Physico-Chemical Petrology; Zharikov, V.A., Marakushev, A.A., Perchuk, L.L., Eds.; Nauka Press: Moscow, Russia, 1969; Volume 1, pp. 61–64. (In Russian) [Google Scholar]
- Cabri, L.J.; Newville, M.; Gordon, R.A. Chemical speciation of gold in arsenopyrite. Can. Mineral. 2000, 38, 1265–1281. [Google Scholar] [CrossRef]
- Tyukova, E.E.; Voroshin, S.V. Arsenopyrite Compositions and Assemblages in Ore Deposits and Host Rocks of the Upper Kolyma River Area (Interpreting the Genesis of Sulfide Mineral Assemblages); NEISRI, Far East Branch, Russian Academy of Sciences: Magadan, Russia, 2007; 107p. (In Russian) [Google Scholar]
- Filimonova, O.N.; Trigub, A.L.; Tonkacheev, D.E.; Nickolsky, M.S.; Kvashnina, K.O.; Chareev, D.A.; Chaplygin, I.V.; Kovalchuk, E.V.; Lafuerza, S.; Tagirov, B.R. Substitution mechanisms in In, Au, and Cu-bearing sphalerites studied by X-ray absorption spectroscopy of synthetic and natural minerals. Mineral. Magaz. 2019, 83, 435–451. [Google Scholar] [CrossRef]
- Tagirov, B.R.; Filimonova, O.N.; Trigub, A.L.; Vikentyev, I.V.; Kovalchuk, E.V.; Nickolsky, M.S.; Shiryaev, A.A.; Reukov, V.L.; Chareev, D.A. The state of gold in phases of the Cu-Fe-S system: In situ X-ray absorption spectroscopy study. Geosci. Front. 2023, 14, 101533. [Google Scholar] [CrossRef]
- Filimonova, O.N.; Wermeille, D.; Kvashnina, K.O. State of Ag in pyrrhotite: Insights from X-ray absorption spectroscopy. ACS Earth Space Chem. 2023, 7, 1648–1660. [Google Scholar] [CrossRef]
- Warkentin, M.; Bridges, F.; Carter, S.A.; Anderson, M. Electroluminescence materials ZnS:Cu,Cl and ZnS:Cu,Mn,Cl studied by EXAFS spectroscopy. Phys. Rev. B 2007, 75, 075301. [Google Scholar] [CrossRef]
- Zotov, A.V.; Laputina, I.P.; Chichagov, A.V. Arsenian pyrite from hot springs of Kunashir Island (Kuril Islands). Geol. Ore Depos. 1972, 14, 125–131. (In Russian) [Google Scholar]
- Chouinard, A.; Paquette, J.; Williams-Jones, A. Crystallographic controls on trace-element incorporation in auriferous pyrite from the Pascua epithermal high-sulfidation deposit, Chile–Argentina. Can. Mineral. 2005, 43, 951–963. [Google Scholar] [CrossRef]
- Xian, H.; He, H.; Zhu, J.; Du, R.; Wu, X.; Tang, H.; Tan, W.; Liang, X.; Zhu, R.; Teng, H.H. Crystal habit-directed gold deposition on pyrite: Surface chemical interpretation of the pyrite morphology indicative of gold enrichment. Geochim. Cosmochim. Acta 2019, 264, 191–204. [Google Scholar] [CrossRef]
- Benning, L.G.; Seward, T.M. Hydrosulphide complexing of Au (I) in hydrothermal solutions from 150–400 °C and 500–1500 bar. Geochim. Cosmochim. Acta 1996, 60, 1849–1871. [Google Scholar] [CrossRef]
- Stefánsson, A.; Seward, T.M. Gold(I) complexing in aqueous sulphide solutions to 500 °C at 500 bar. Geochim. Cosmochim. Acta 1996, 68, 4121–4143. [Google Scholar] [CrossRef]
- Pokrovski, G.; Gout, R.; Schott, J.; Zotov, A.; Harrichoury, J.-C. Thermodynamic properties and stoichiometry of As (III) hydroxide complexes at hydrothermal conditions. Geochim. Cosmochim. Acta 1996, 60, 737–749. [Google Scholar] [CrossRef]
- Sunagawa, I. Variation in the crystal habit of pyrite. Geol. Surv. Japan 1957, 175, 1–47. [Google Scholar]
- Shaskolskaya, M.P. Crystallography; Vysshaya Shkola: Moscow, Russia, 1976; pp. 358–370. (In Russian) [Google Scholar]
- Baya, C.; Le Pape, P.; Baptiste, B.; Brest, J.; Landrot, G.; Elkaim, E.; Noël, V.; Blanchard, M.; Ona-Nguema, G.; Juillot, F.; et al. Influence of trace level As or Ni on pyrite formation kinetics at low temperature. Geochim. Cosmochim. Acta 2021, 300, 333–353. [Google Scholar] [CrossRef]
- Vikentyev, I.V.; Tykova, E.E.; Murzin, V.V.; Vikent’eva, O.V.; Pavlov, L.G. Vorontsovsk Gold Deposit: Geology, Gold Modes, Genesis; Fort-Dialog-Iset: Ekaterinburg, Russia, 2016; 204p. (In Russian) [Google Scholar]
- Murzin, V.V.; Naumov, E.A.; Azovskova, O.B.; Varlamov, D.A.; Rovnushkin, M.Y.; Pirajno, F. The Vorontsovskoe Au-Hg-As ore deposit (Northern Urals, Russia): Geological setting, ore mineralogy, geochemistry, geochronology and genetic model. Ore Geol. Rev. 2017, 85, 271–298. [Google Scholar] [CrossRef]
- Voroshin, S.V.; Tyukova, E.E.; Newberry, R.J.; Layer, P.W. Orogenic gold and rare metal deposits of the Upper Kolyma District, Northeastern Russia: Relation to igneous rocks, timing, and metal assemblages. Ore Geol. Rev. 2014, 62, 1–24. [Google Scholar] [CrossRef]
- Sidorova, N.V.; Aristov, V.V.; Grigor’eva, A.V. Invisible gold in pyrite and arsenopyrite from Pavlik deposit (Northeastern Russia). Dokl. Earth Sci. 2020, 495, 821–826. [Google Scholar] [CrossRef]
- Aristov, V.V.; Grigorieva, A.V.; Savchuk, Y.S.; Sidorova, N.V.; Sidorov, V.A. Forms of gold and some typomorphic characteristics of native gold of the Pavlik orogenic deposit (Magadan Oblast). Geol. Ore Deposits 2021, 63, 1–33. [Google Scholar] [CrossRef]
- Le Pape, P.; Blanchard, M.; Brest, J.; Boulliard, J.C.; Ikogou, M.; Stetten, L.; Wang, S.; Landrot, G.; Morin, G. Arsenic incorporation in pyrite at ambient temperature at both tetrahedral S–I and octahedral FeII sites: Evidence from EXAFS–DFT analysis. Environ. Sci. Technol. 2016, 51, 150–158. [Google Scholar] [CrossRef]
- Le Pape, P.; Blanchard, M.; Juhin, A.; Rueff, J.-P.; Ducher, M.; Morin, G.; Cabaret, D. Local environment of arsenic in sulfide minerals: Insights from high-resolution X-ray spectroscopies, and first-principles calculations at the As K-edge. J. Anal. At. Spectrom. 2018, 33, 2070. [Google Scholar]
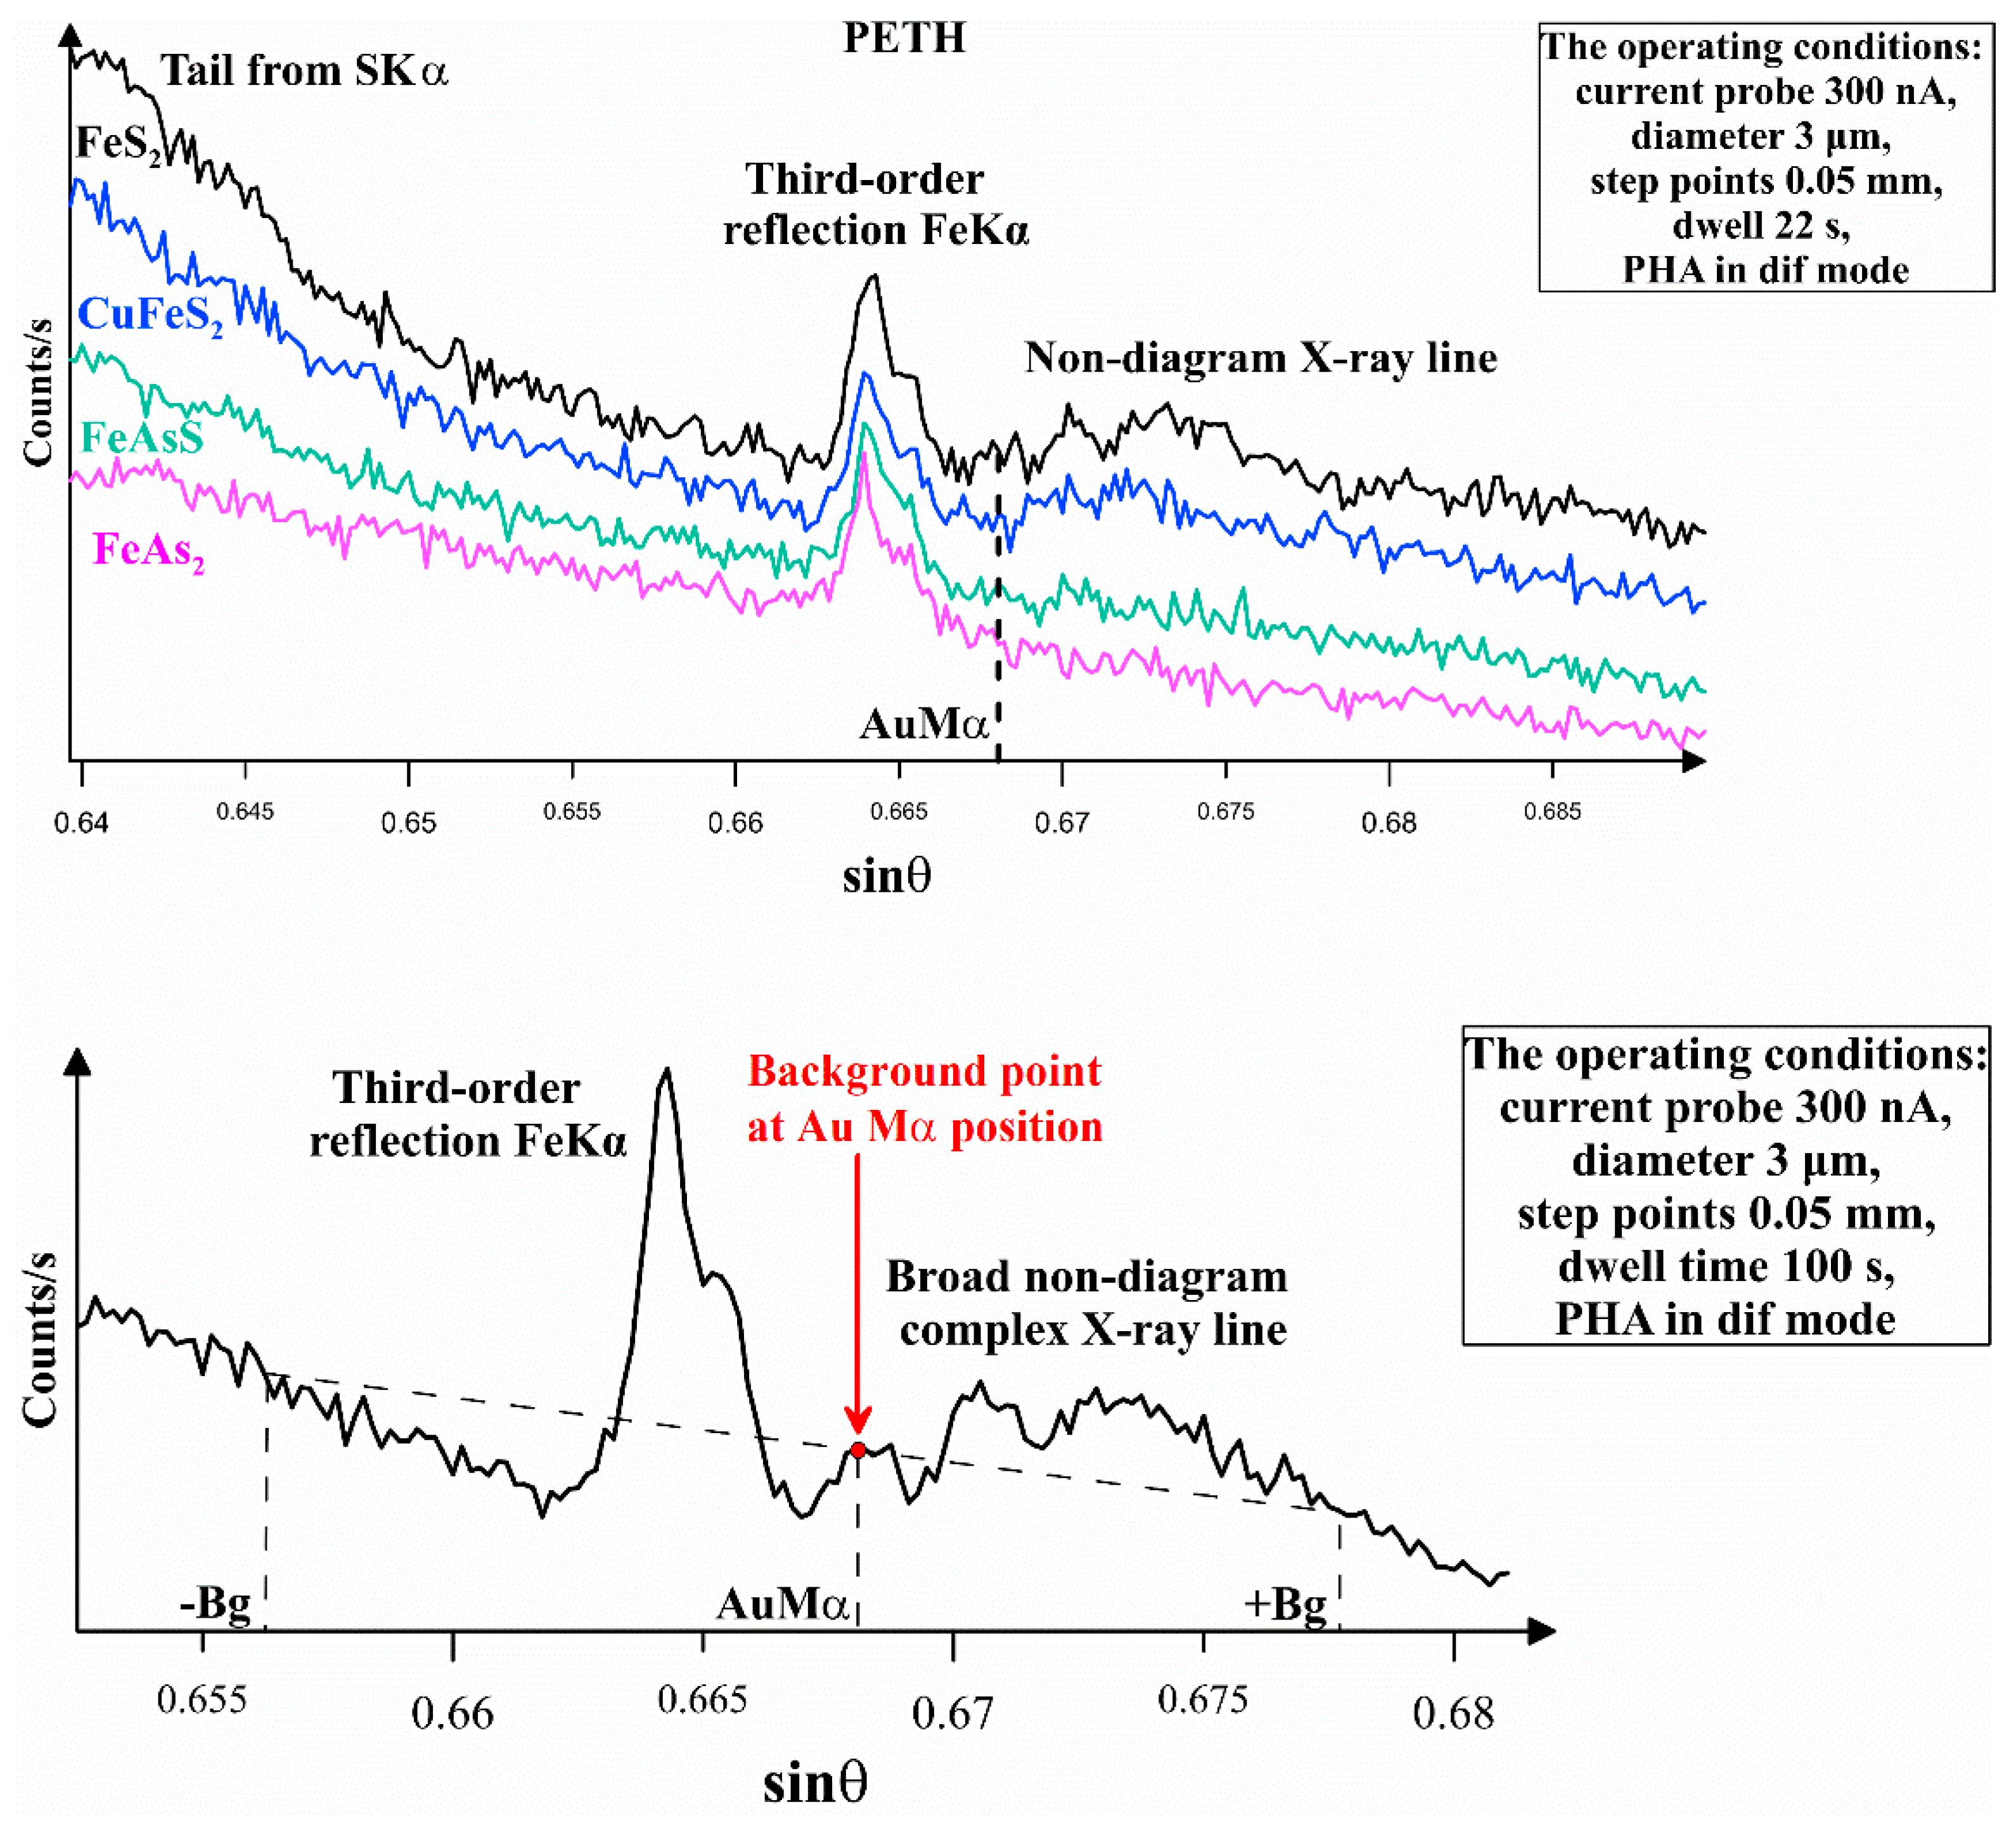
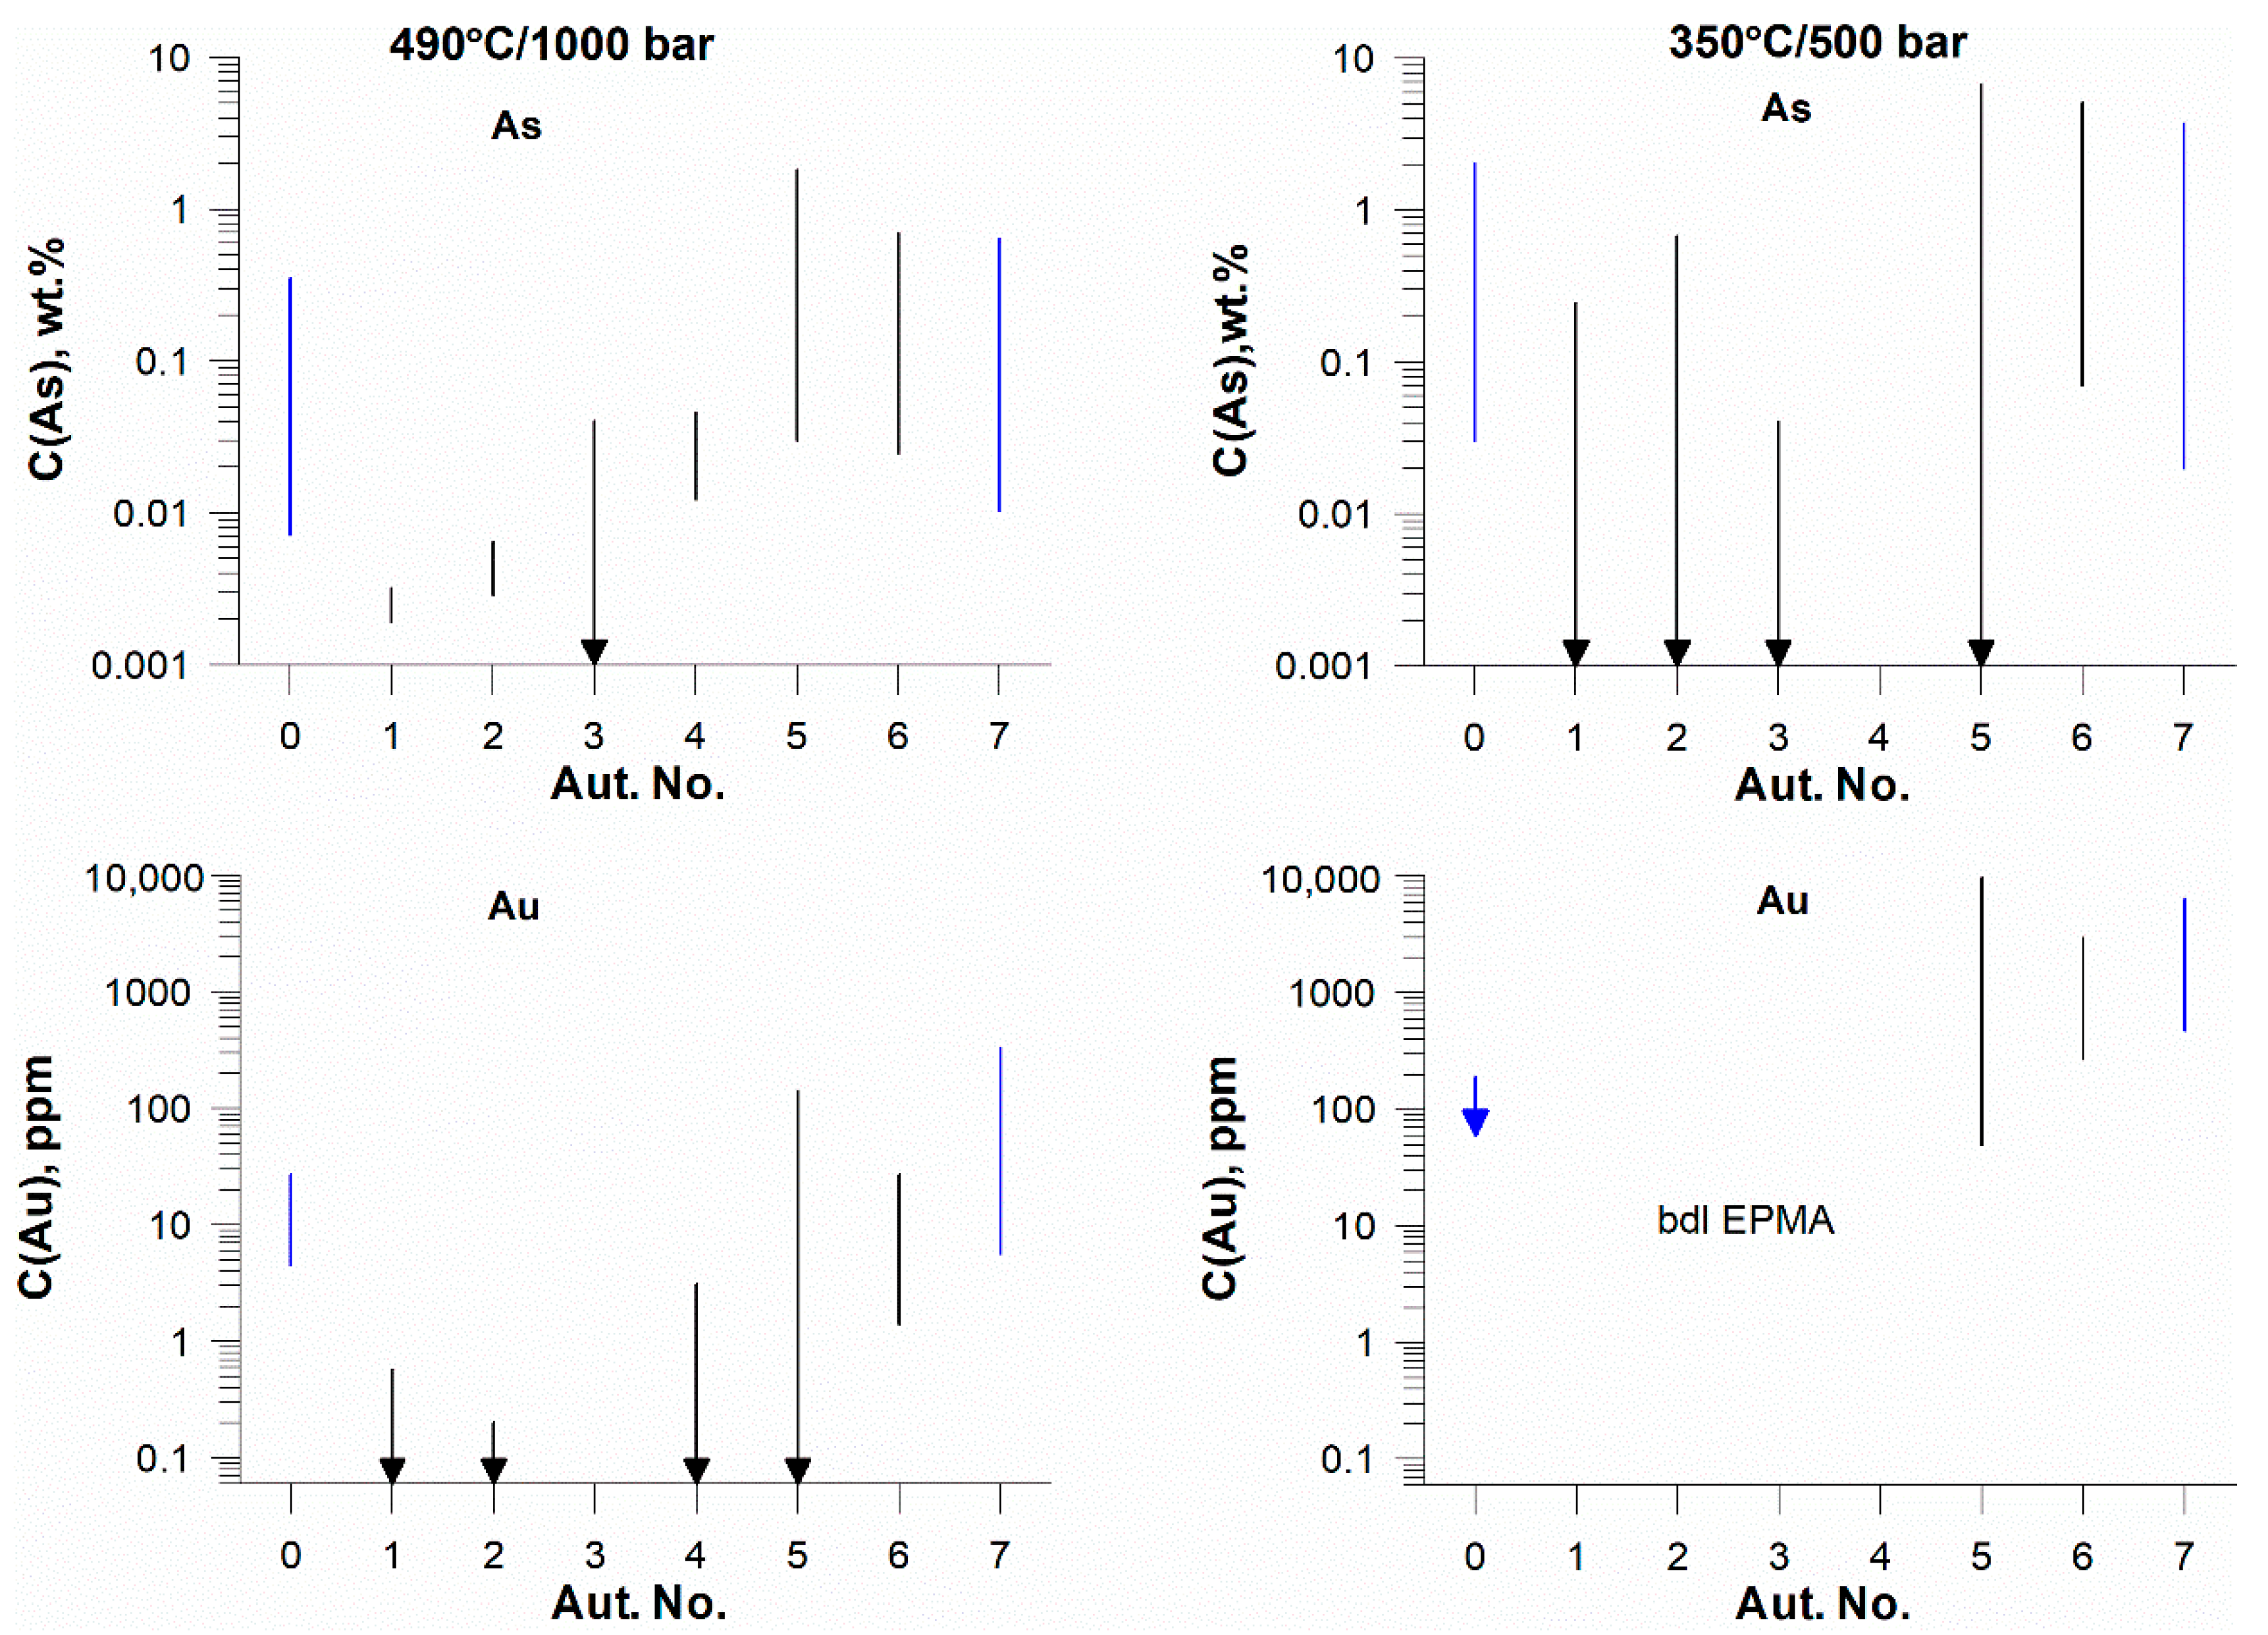

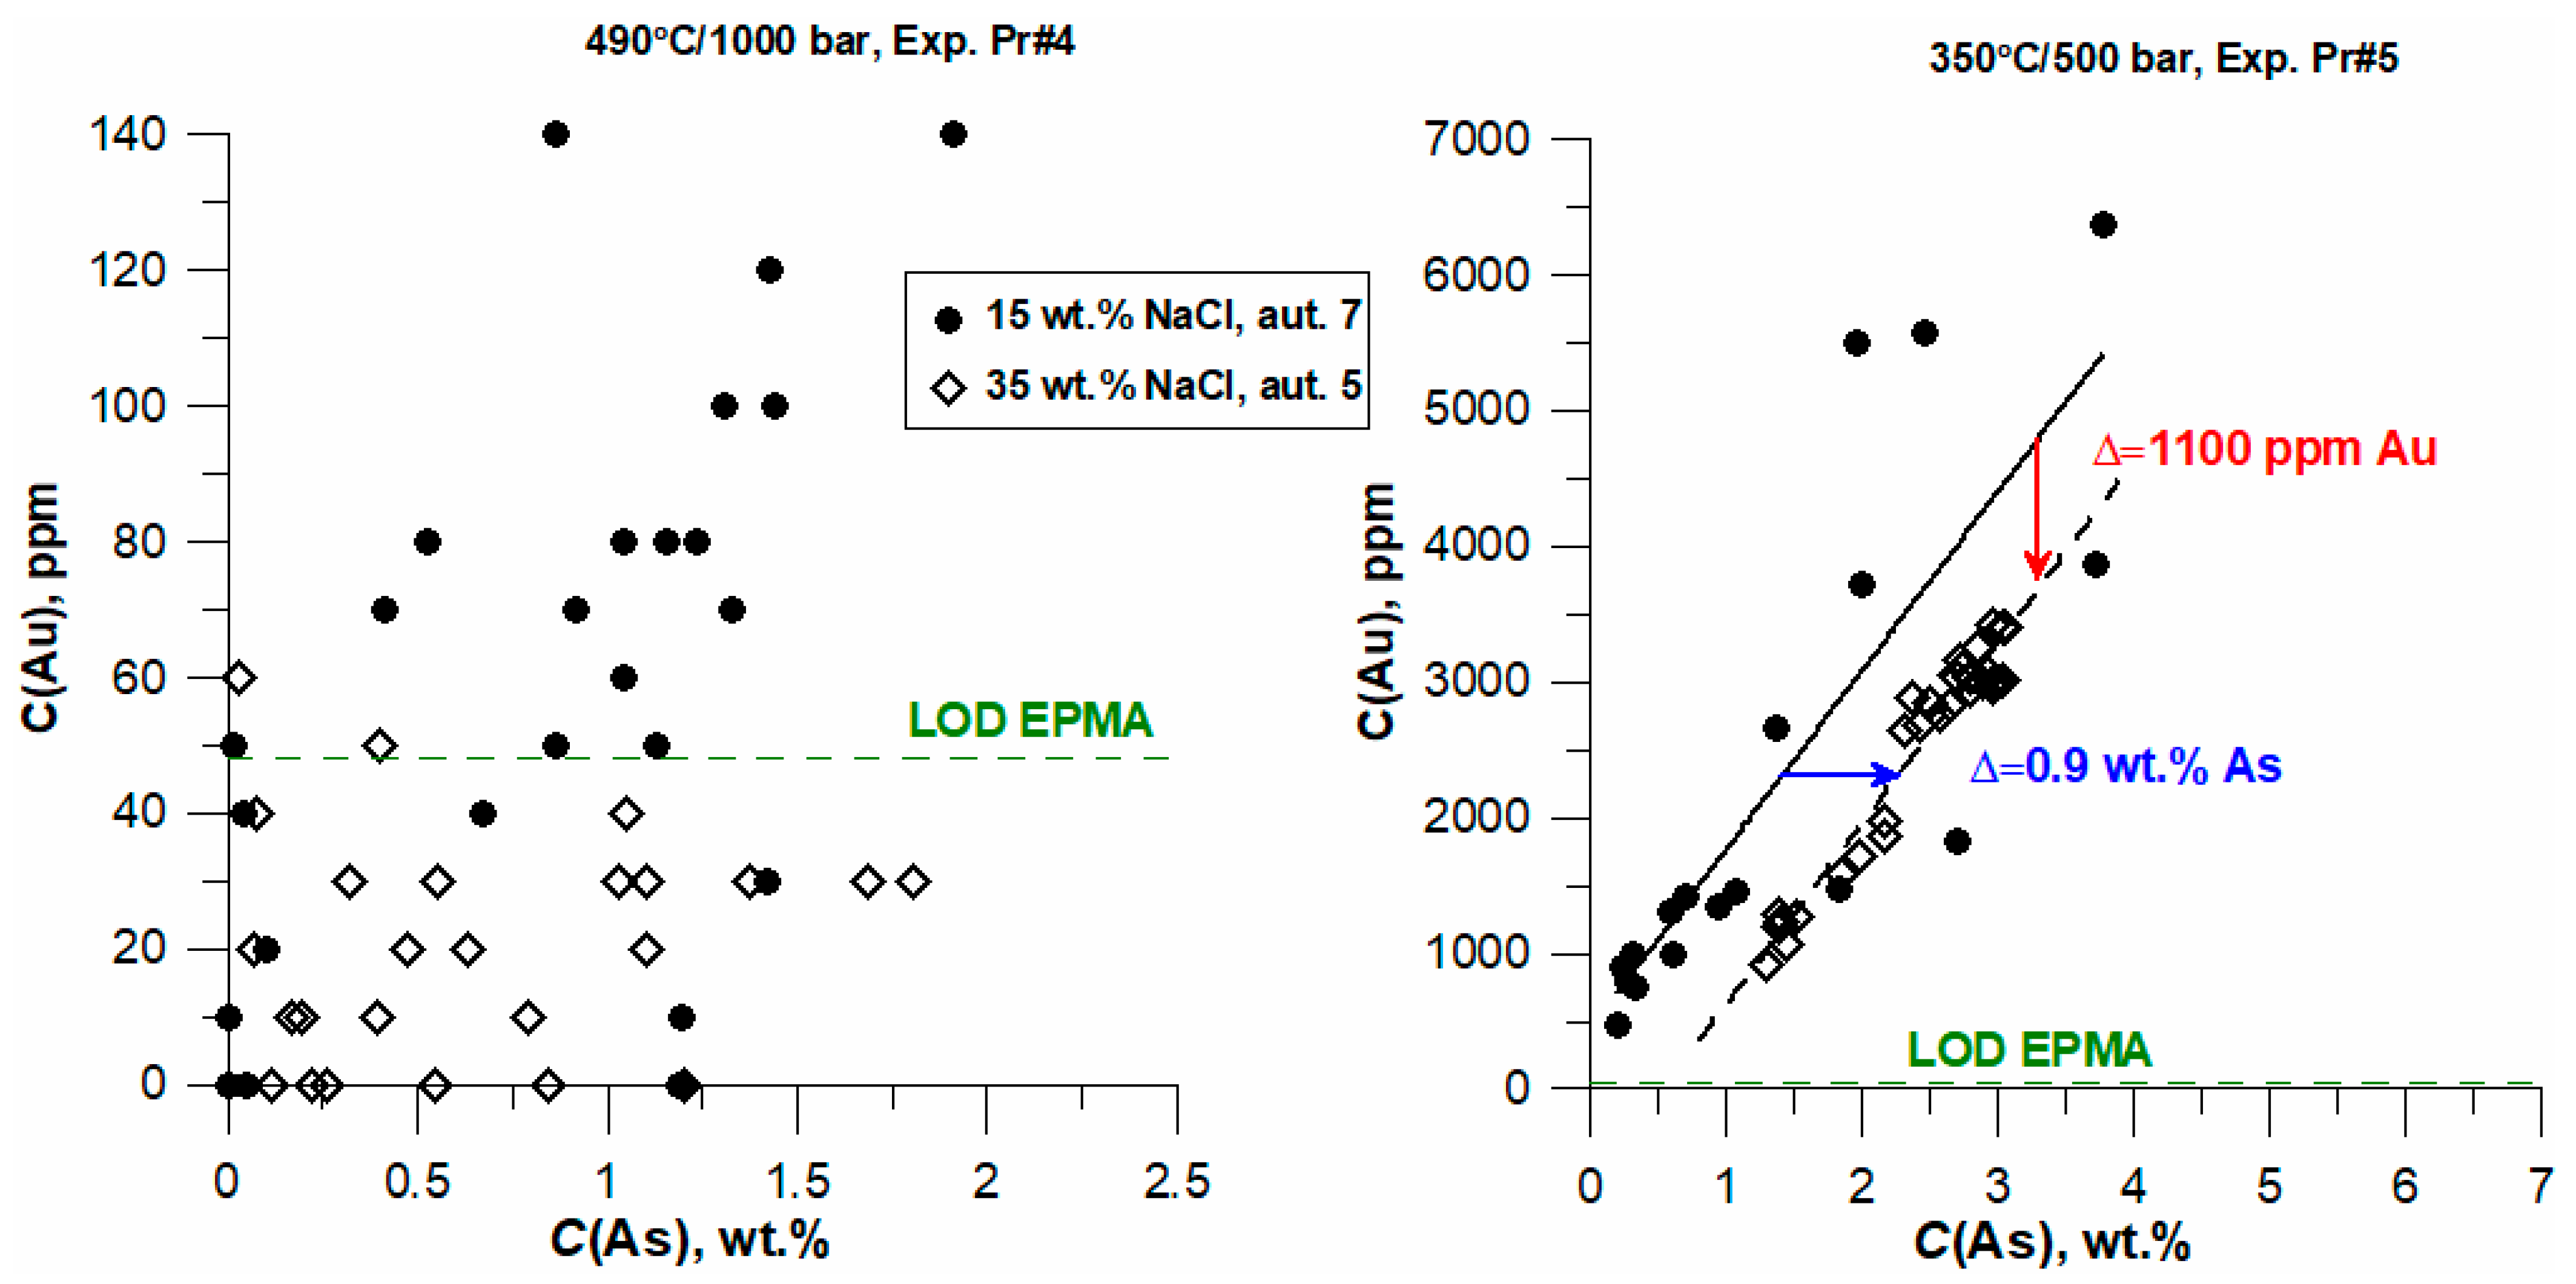
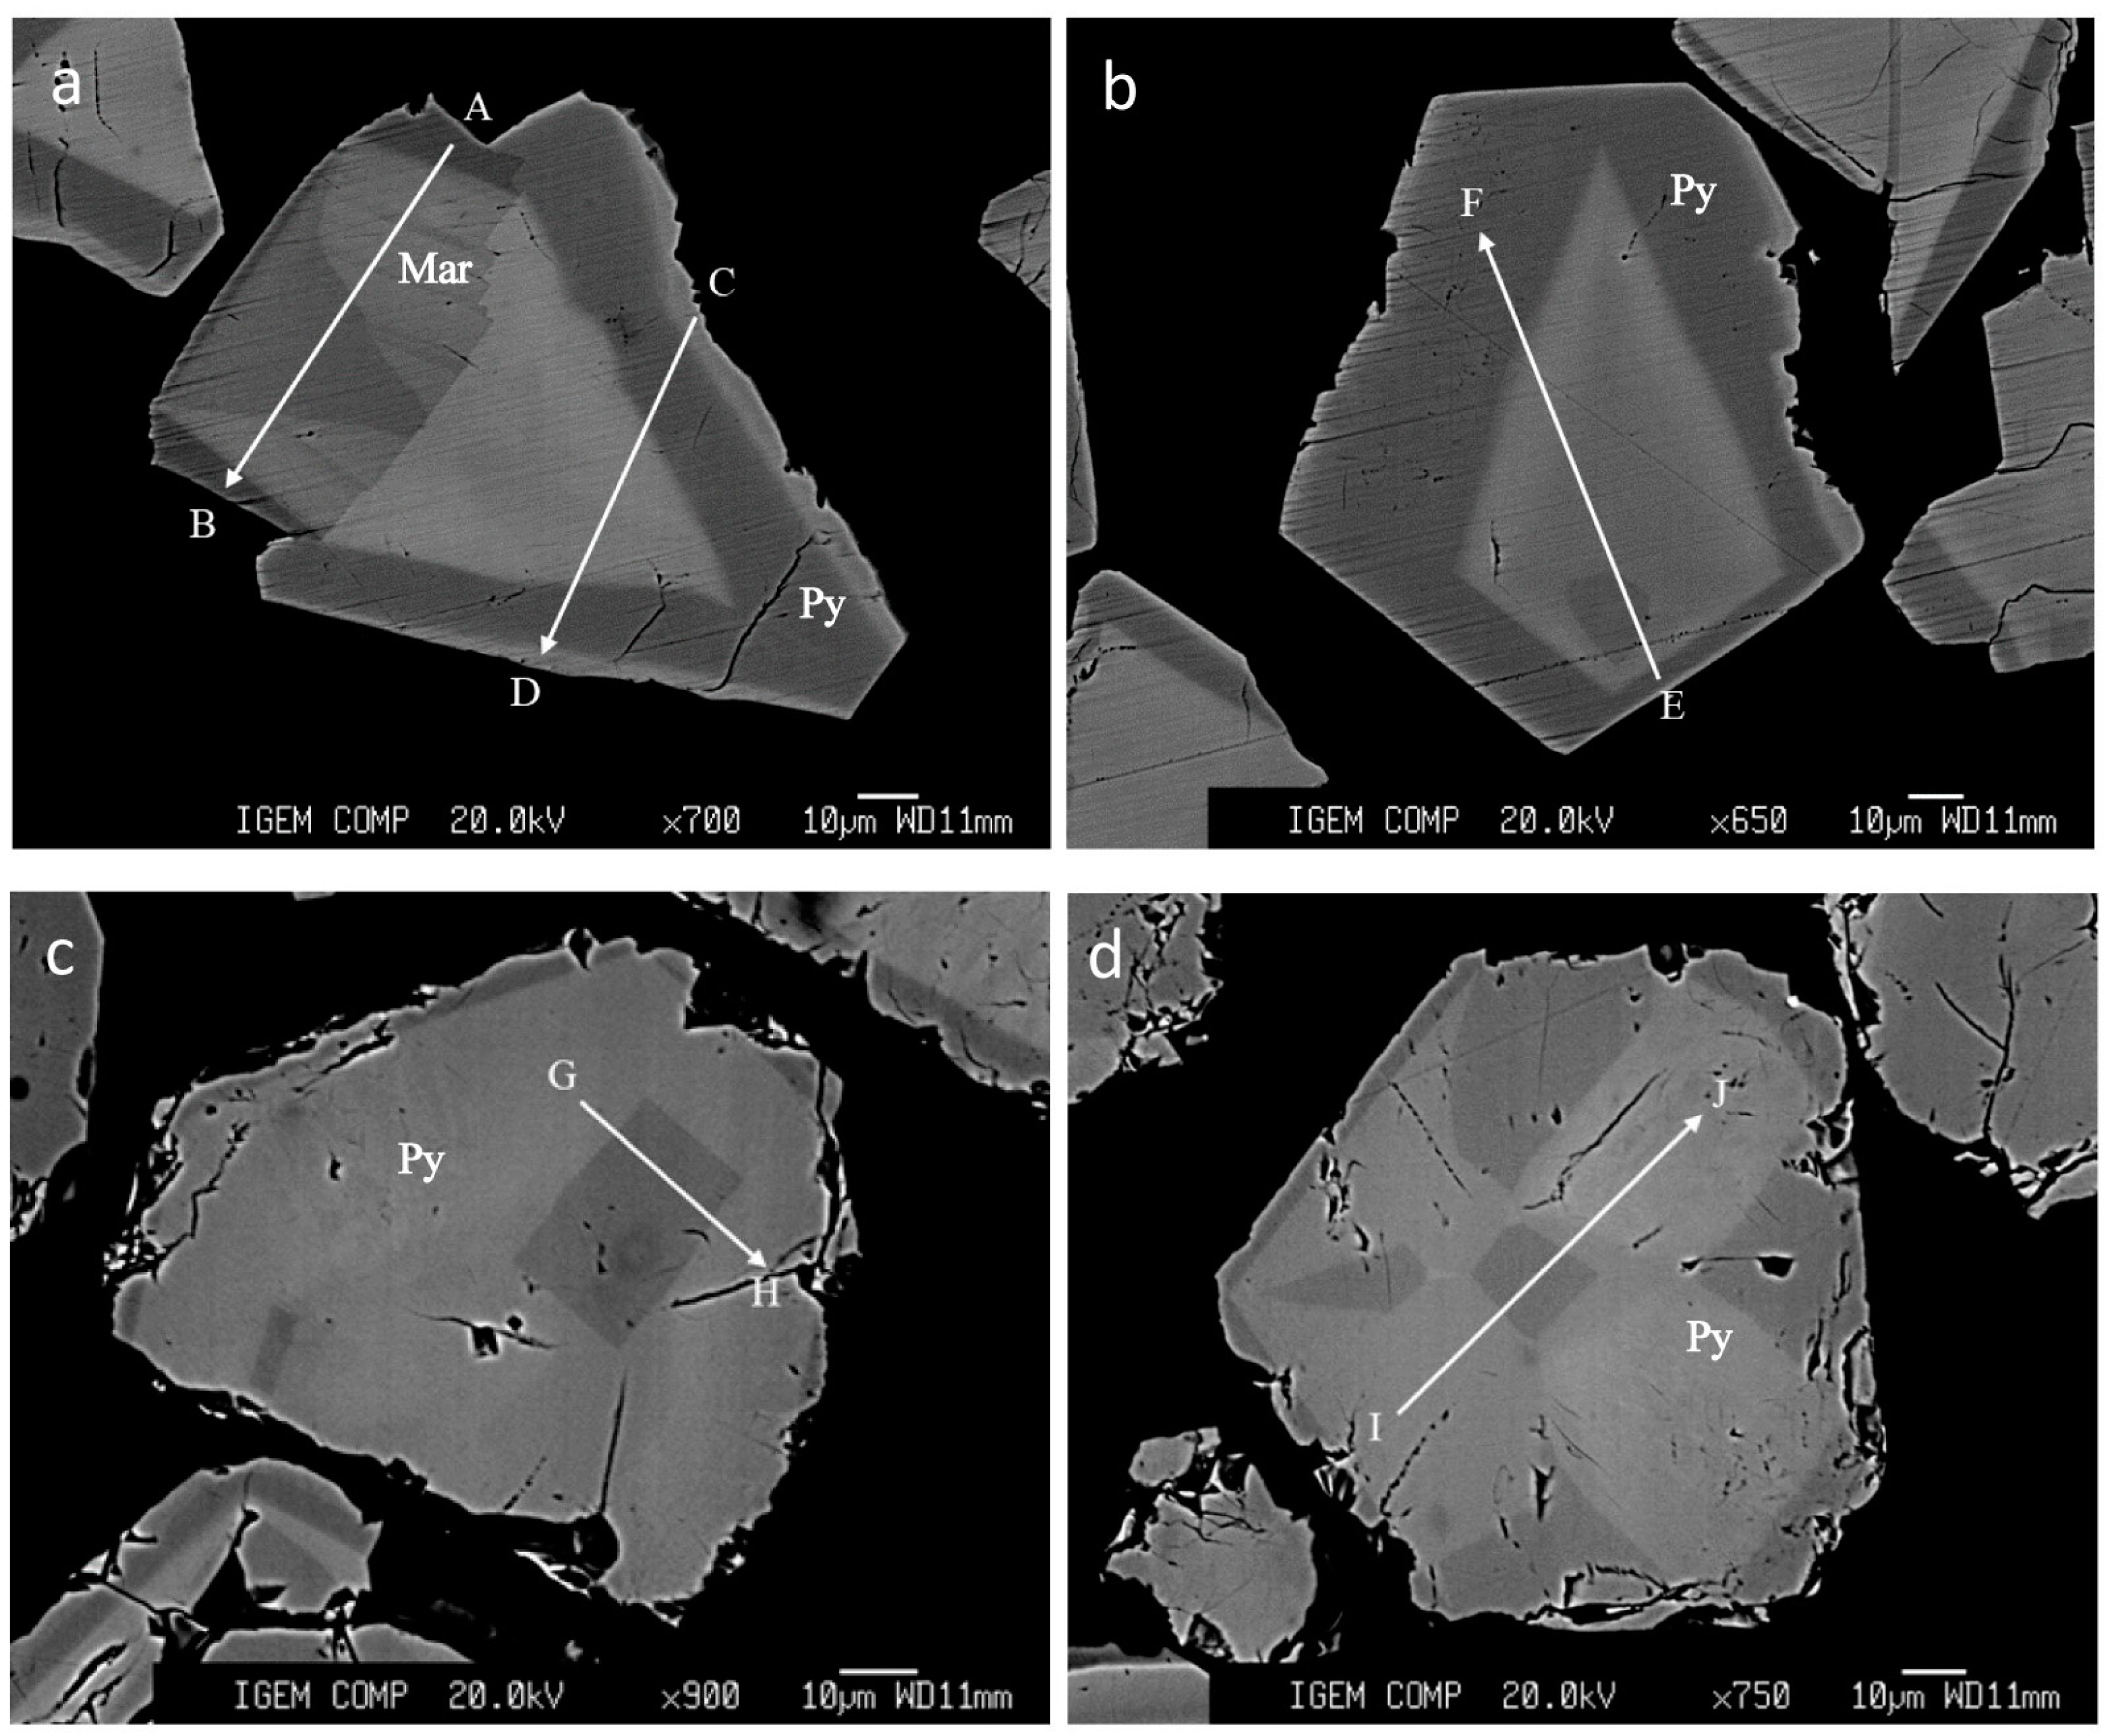
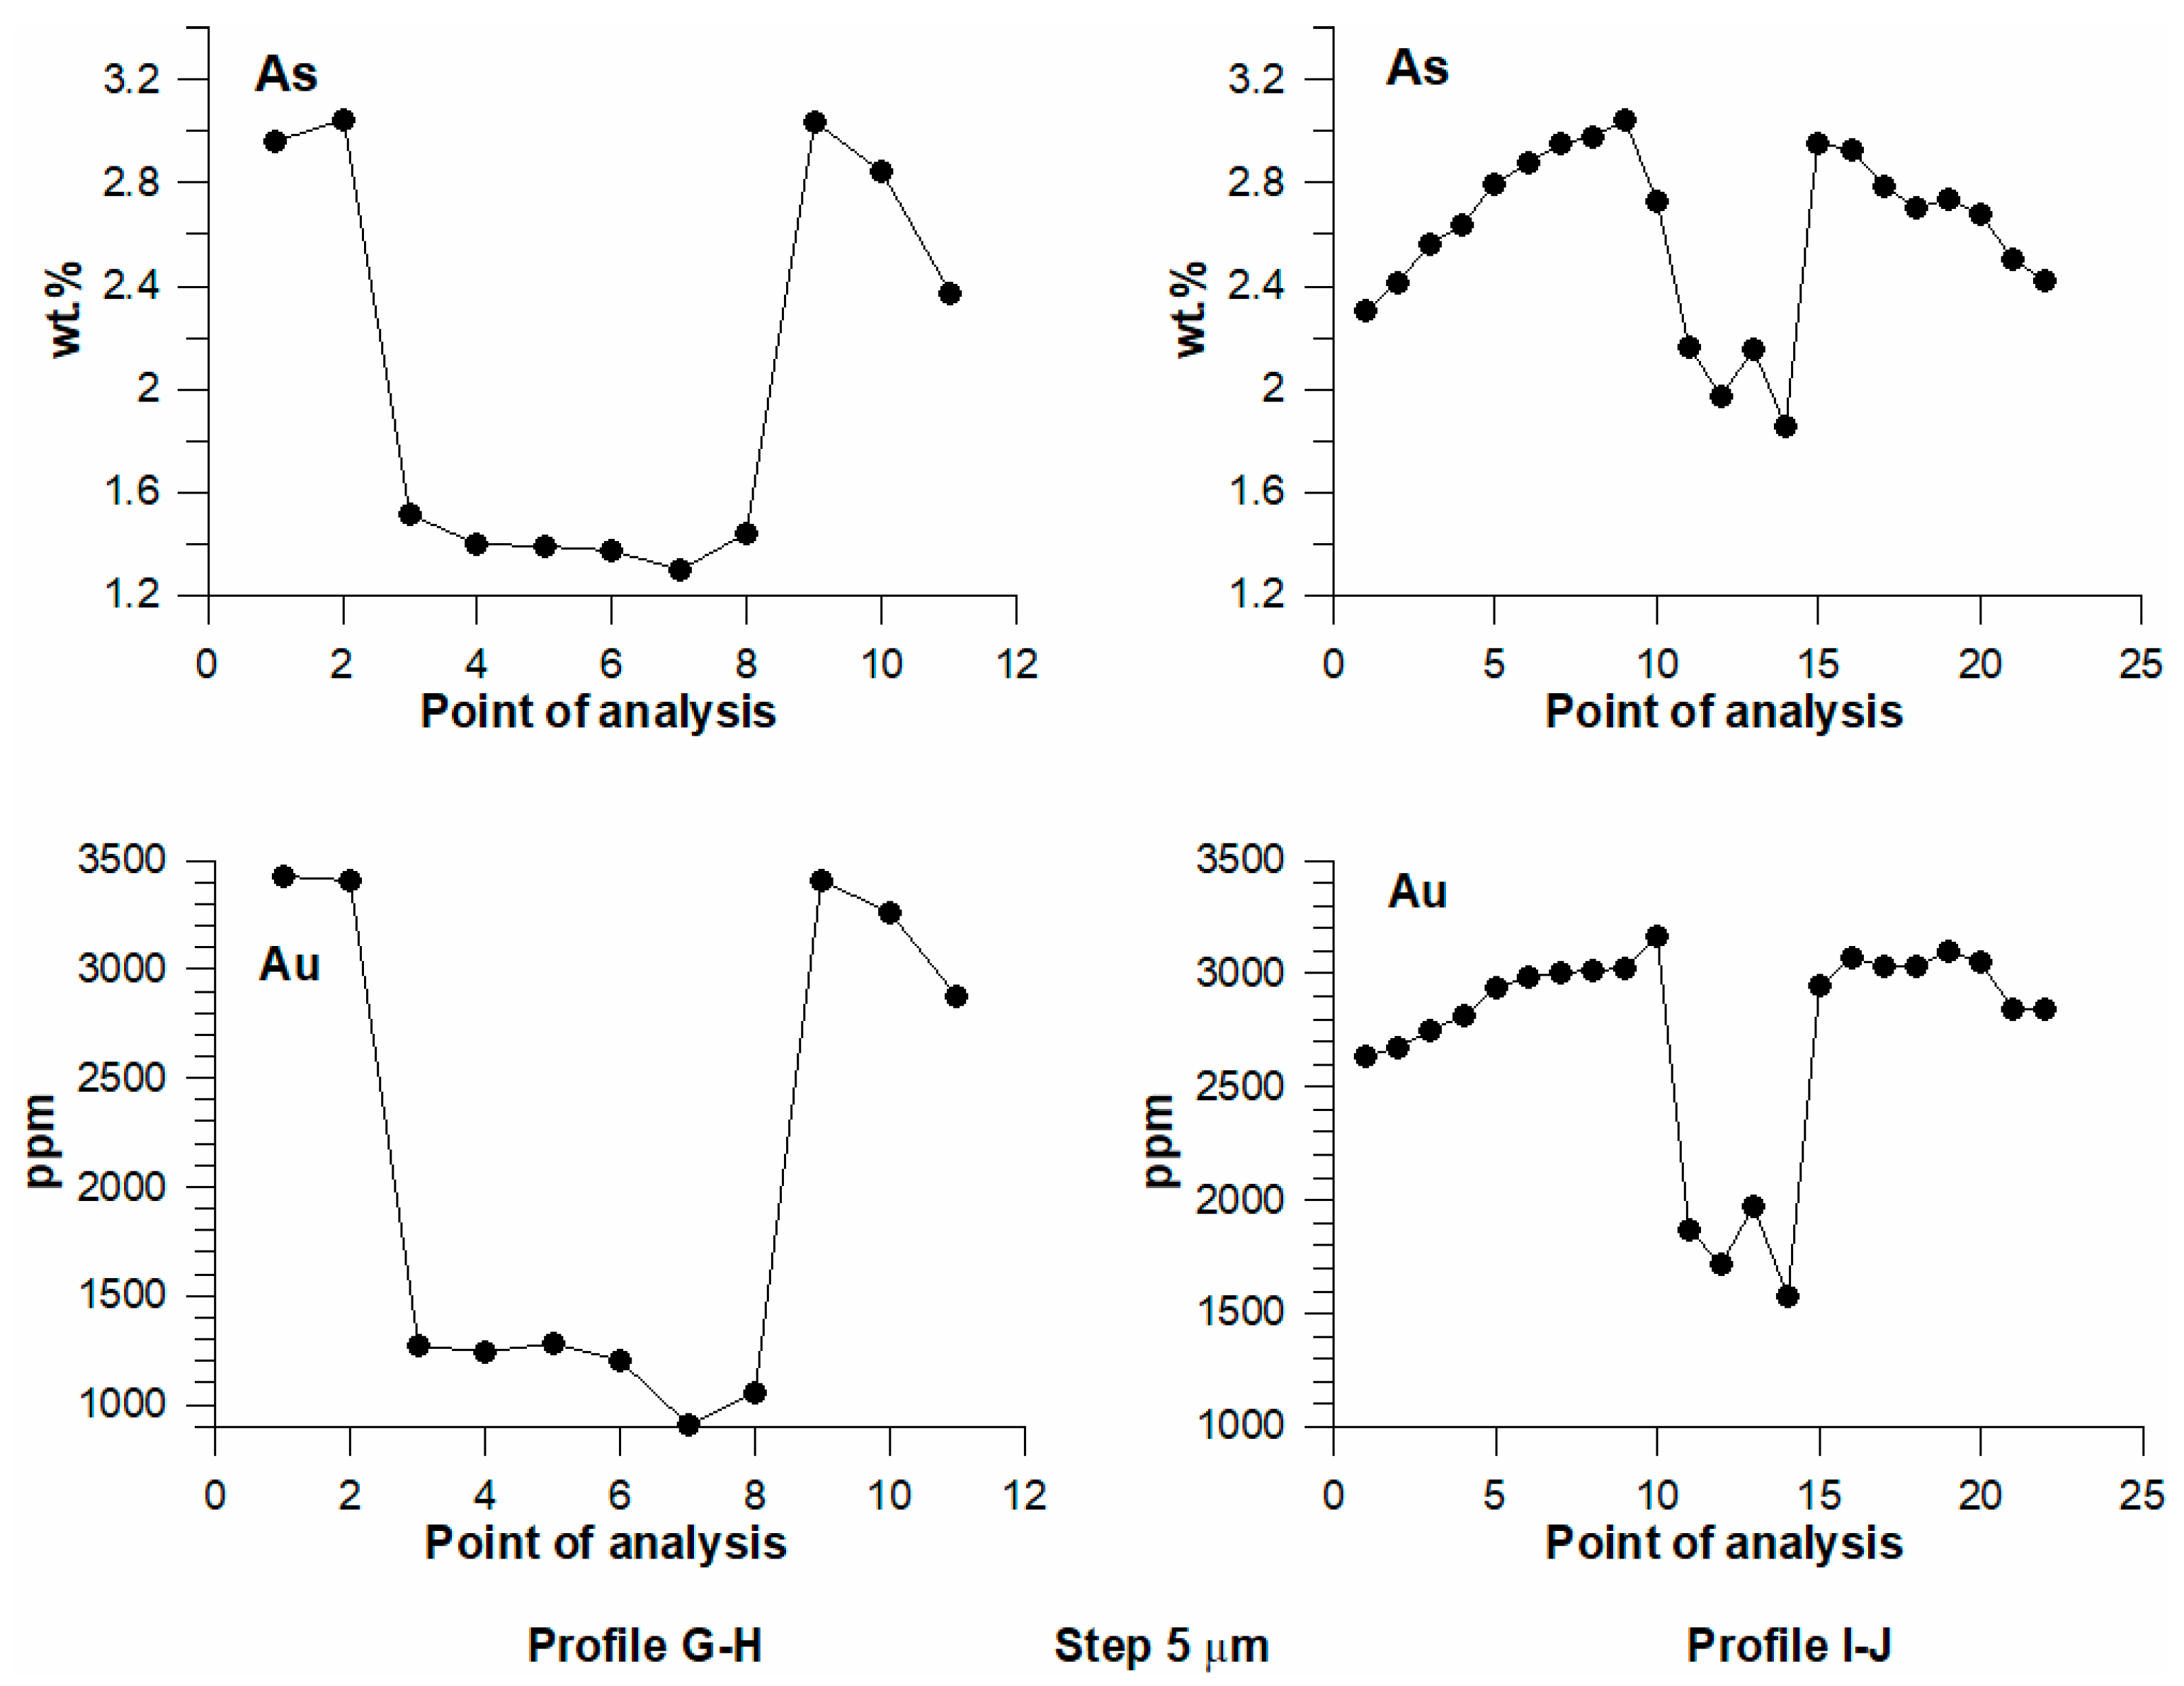
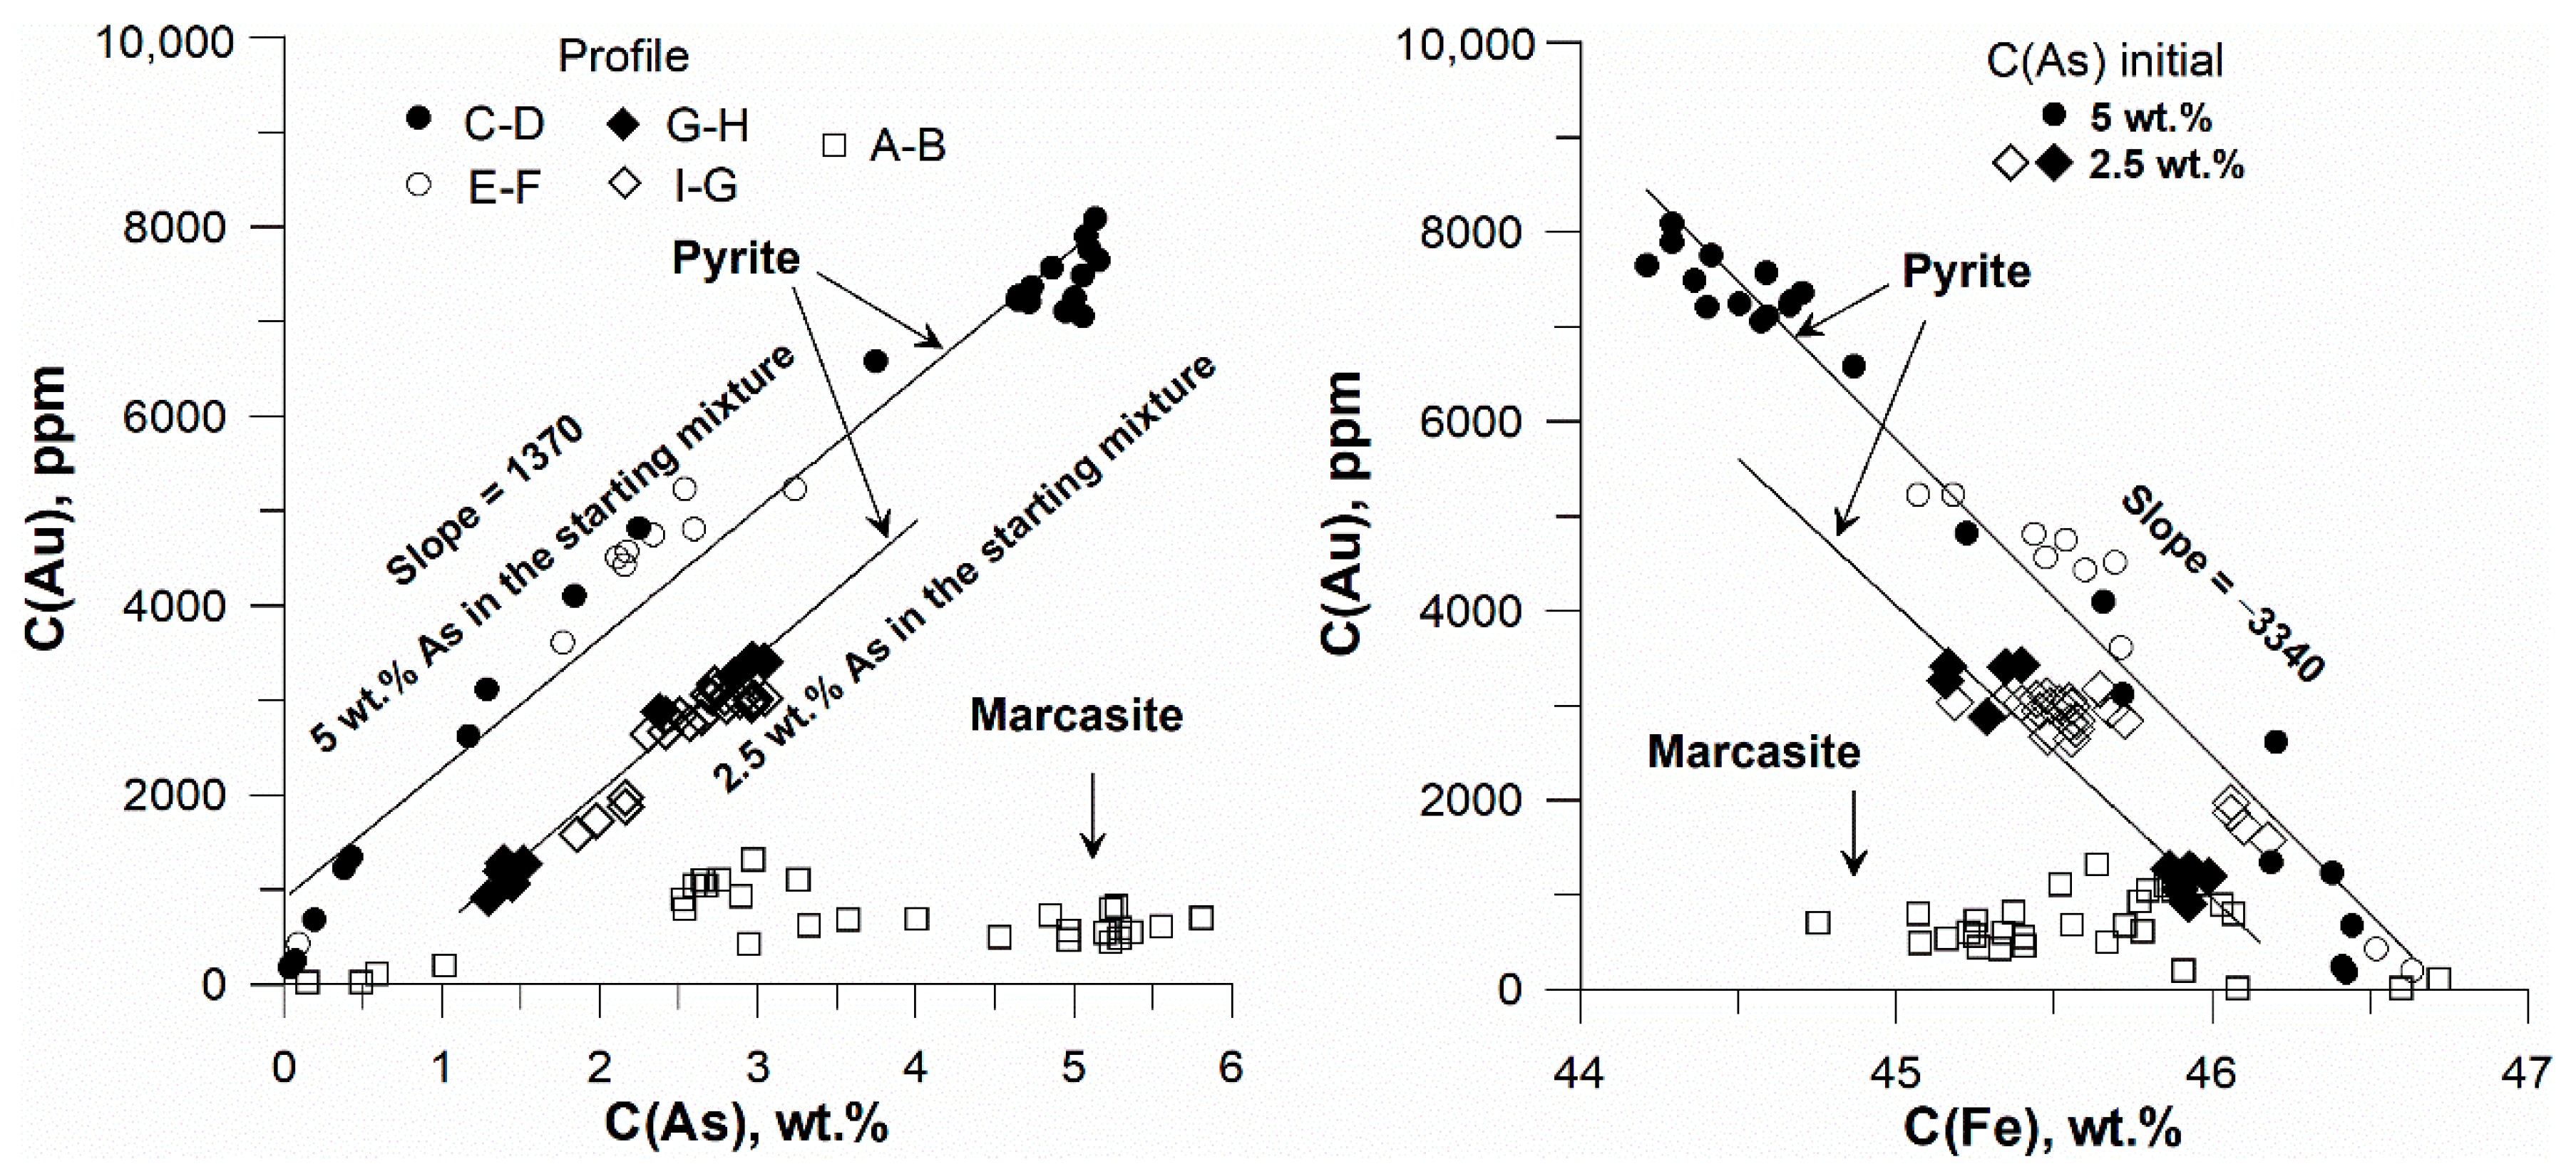
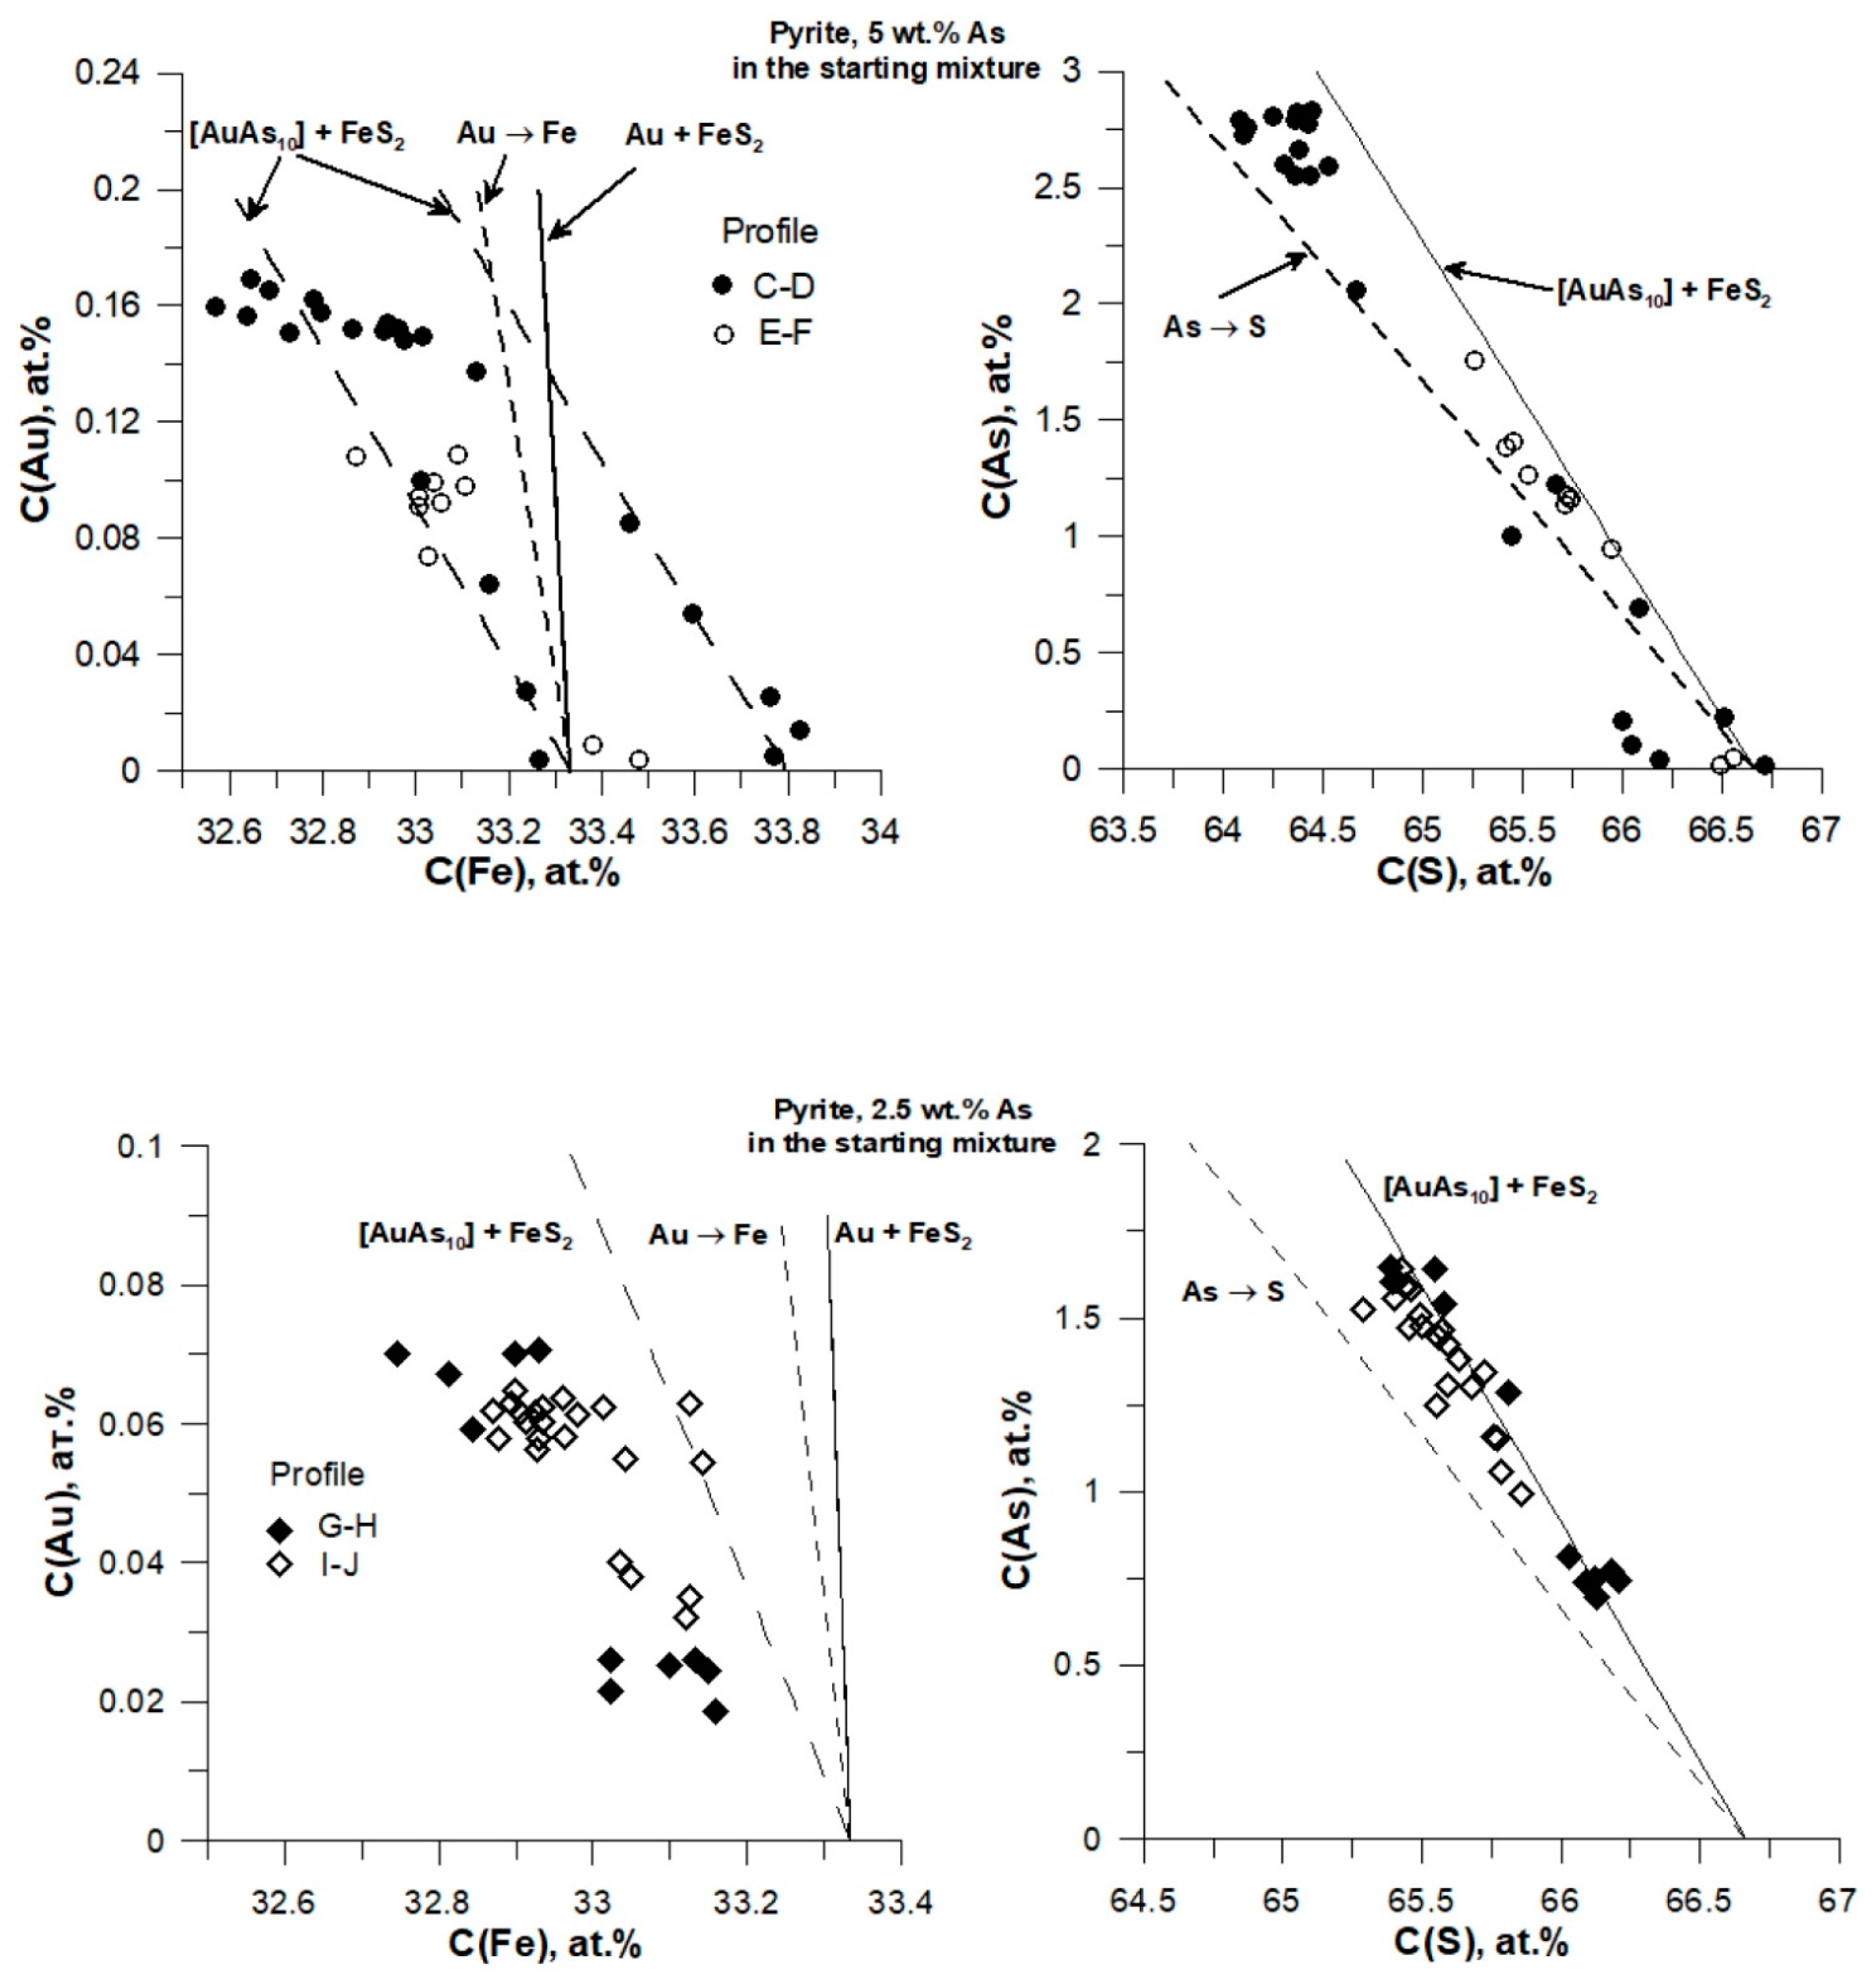
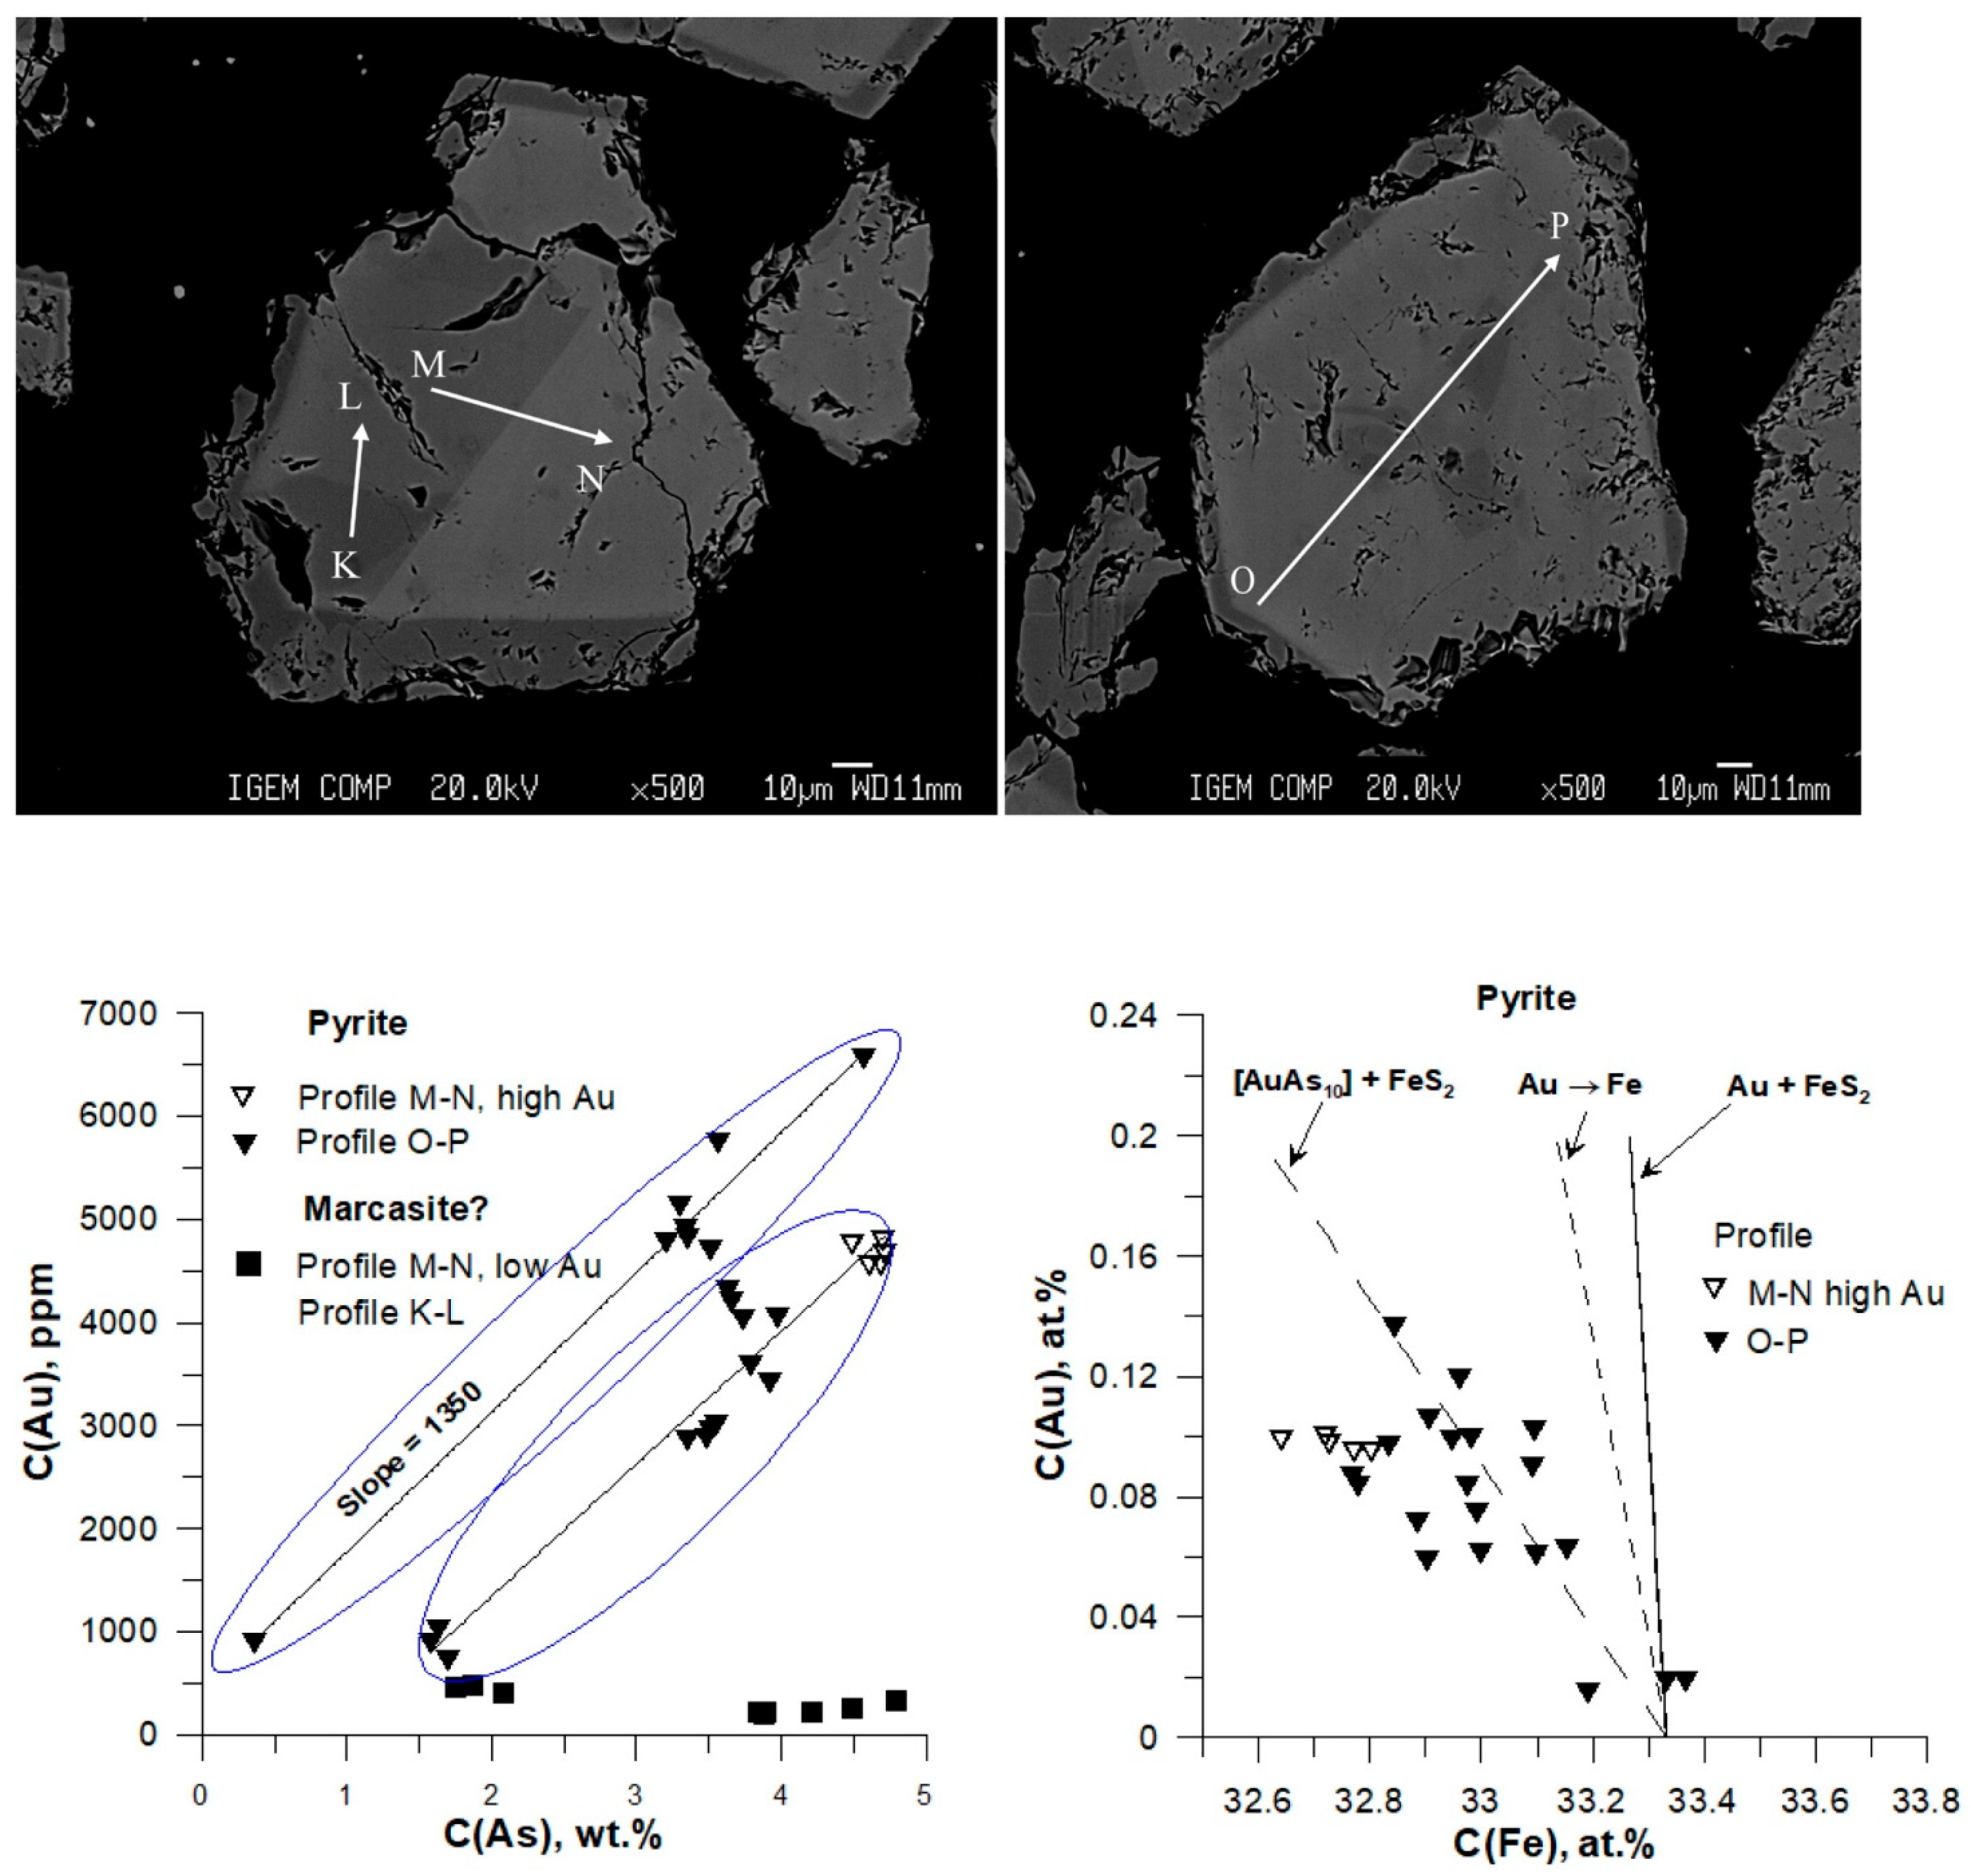
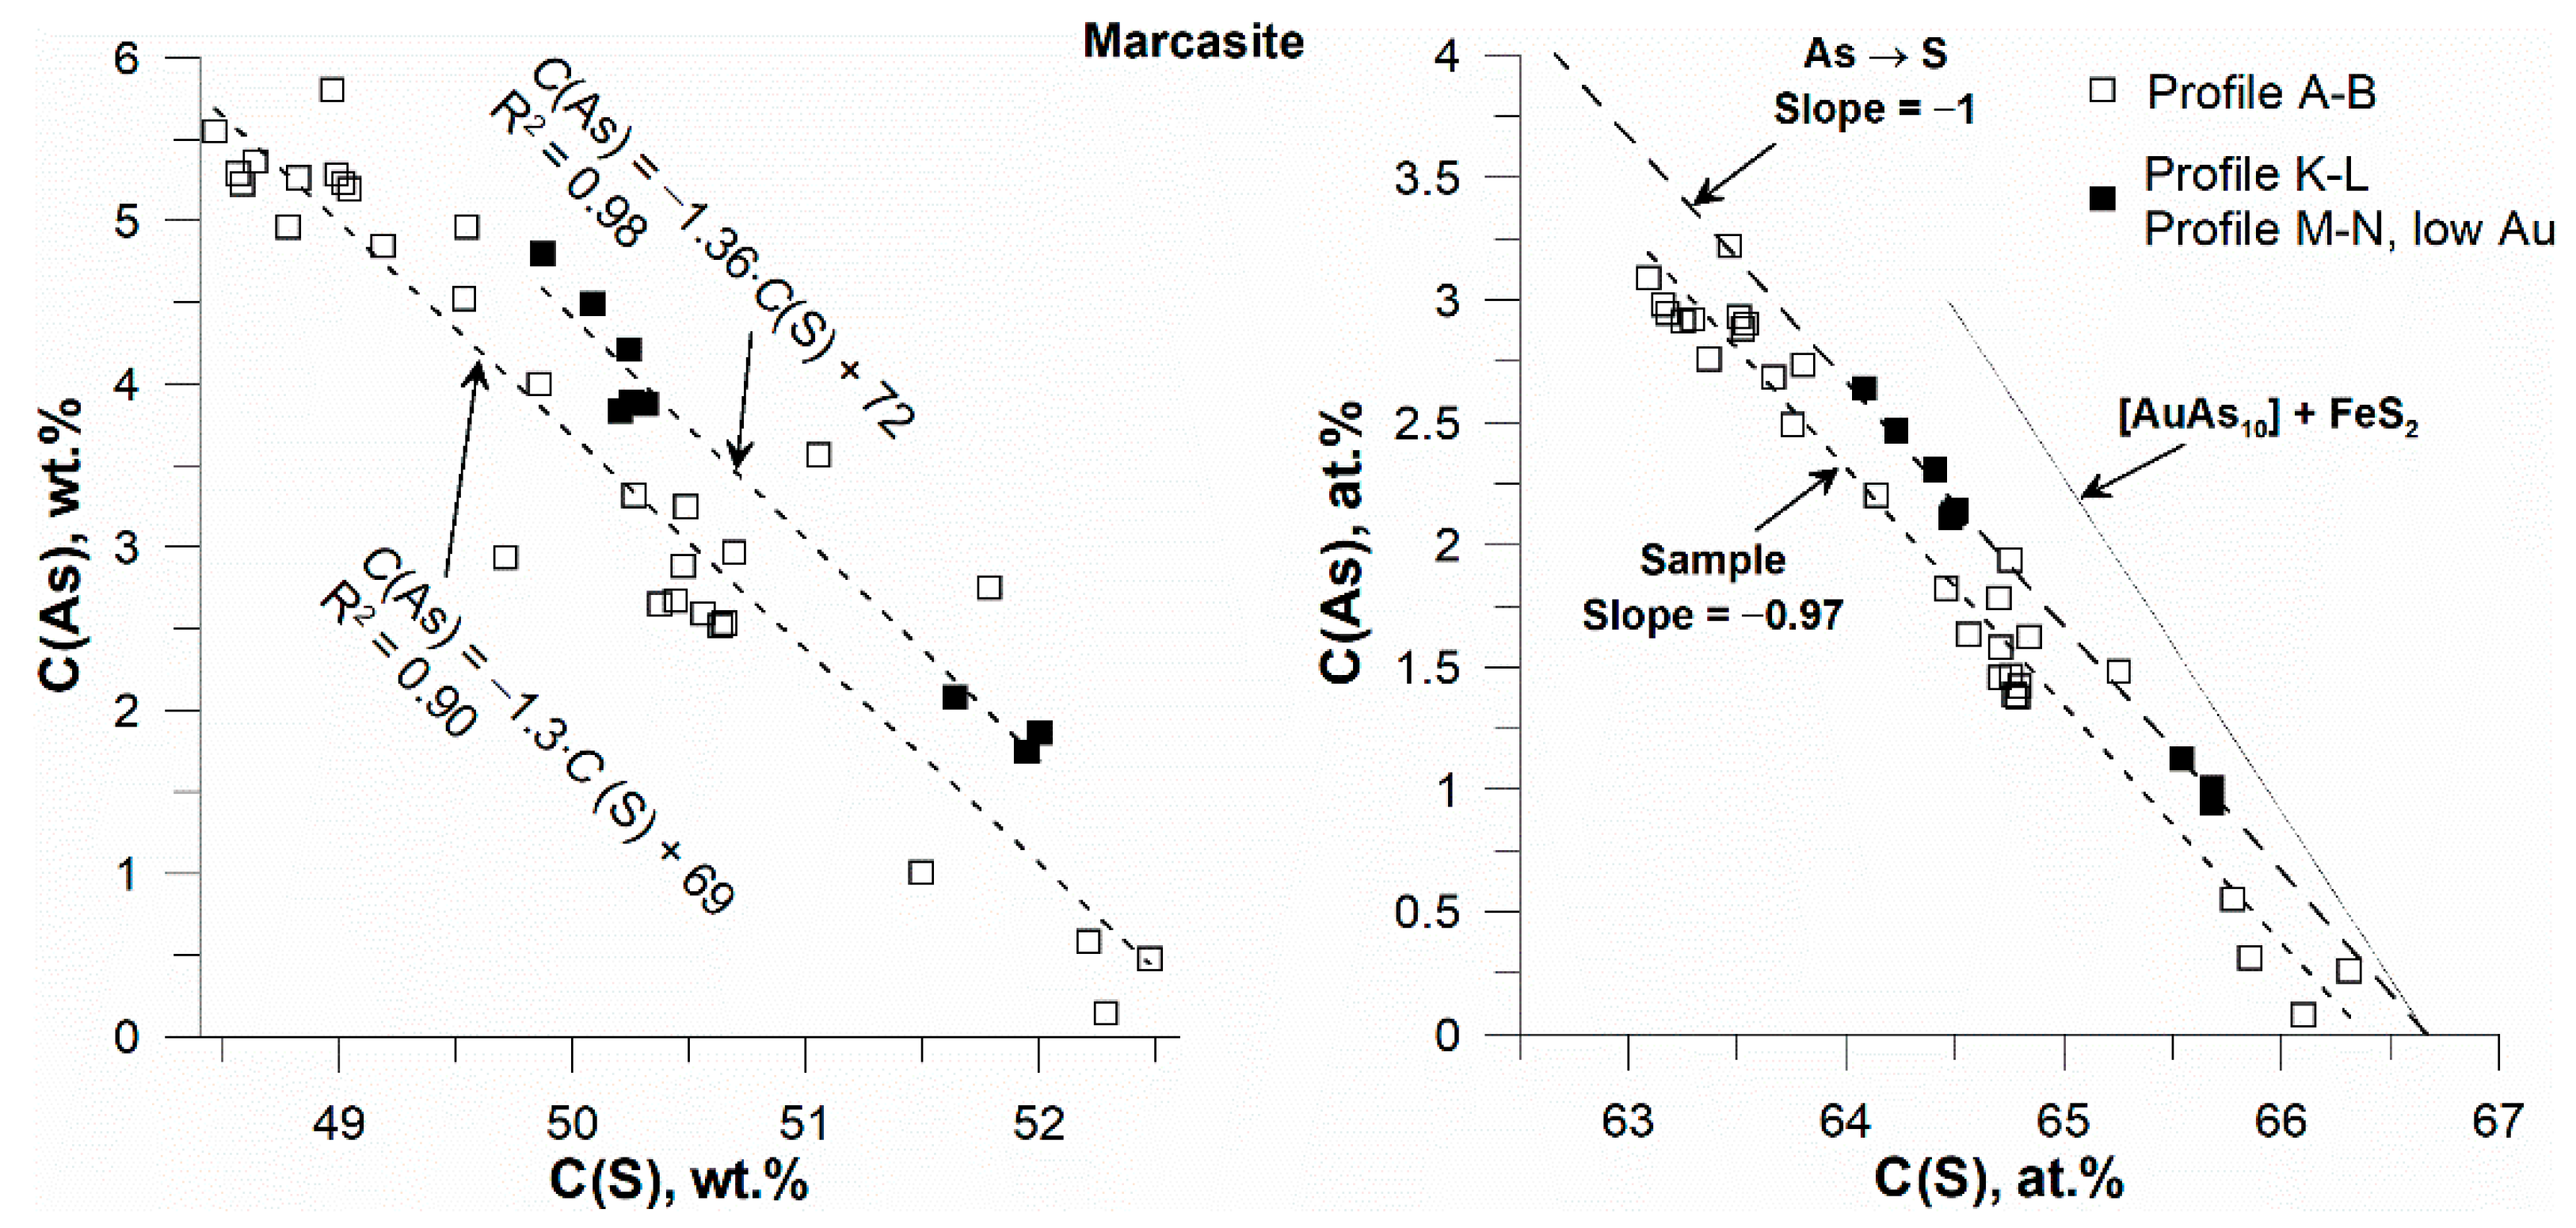
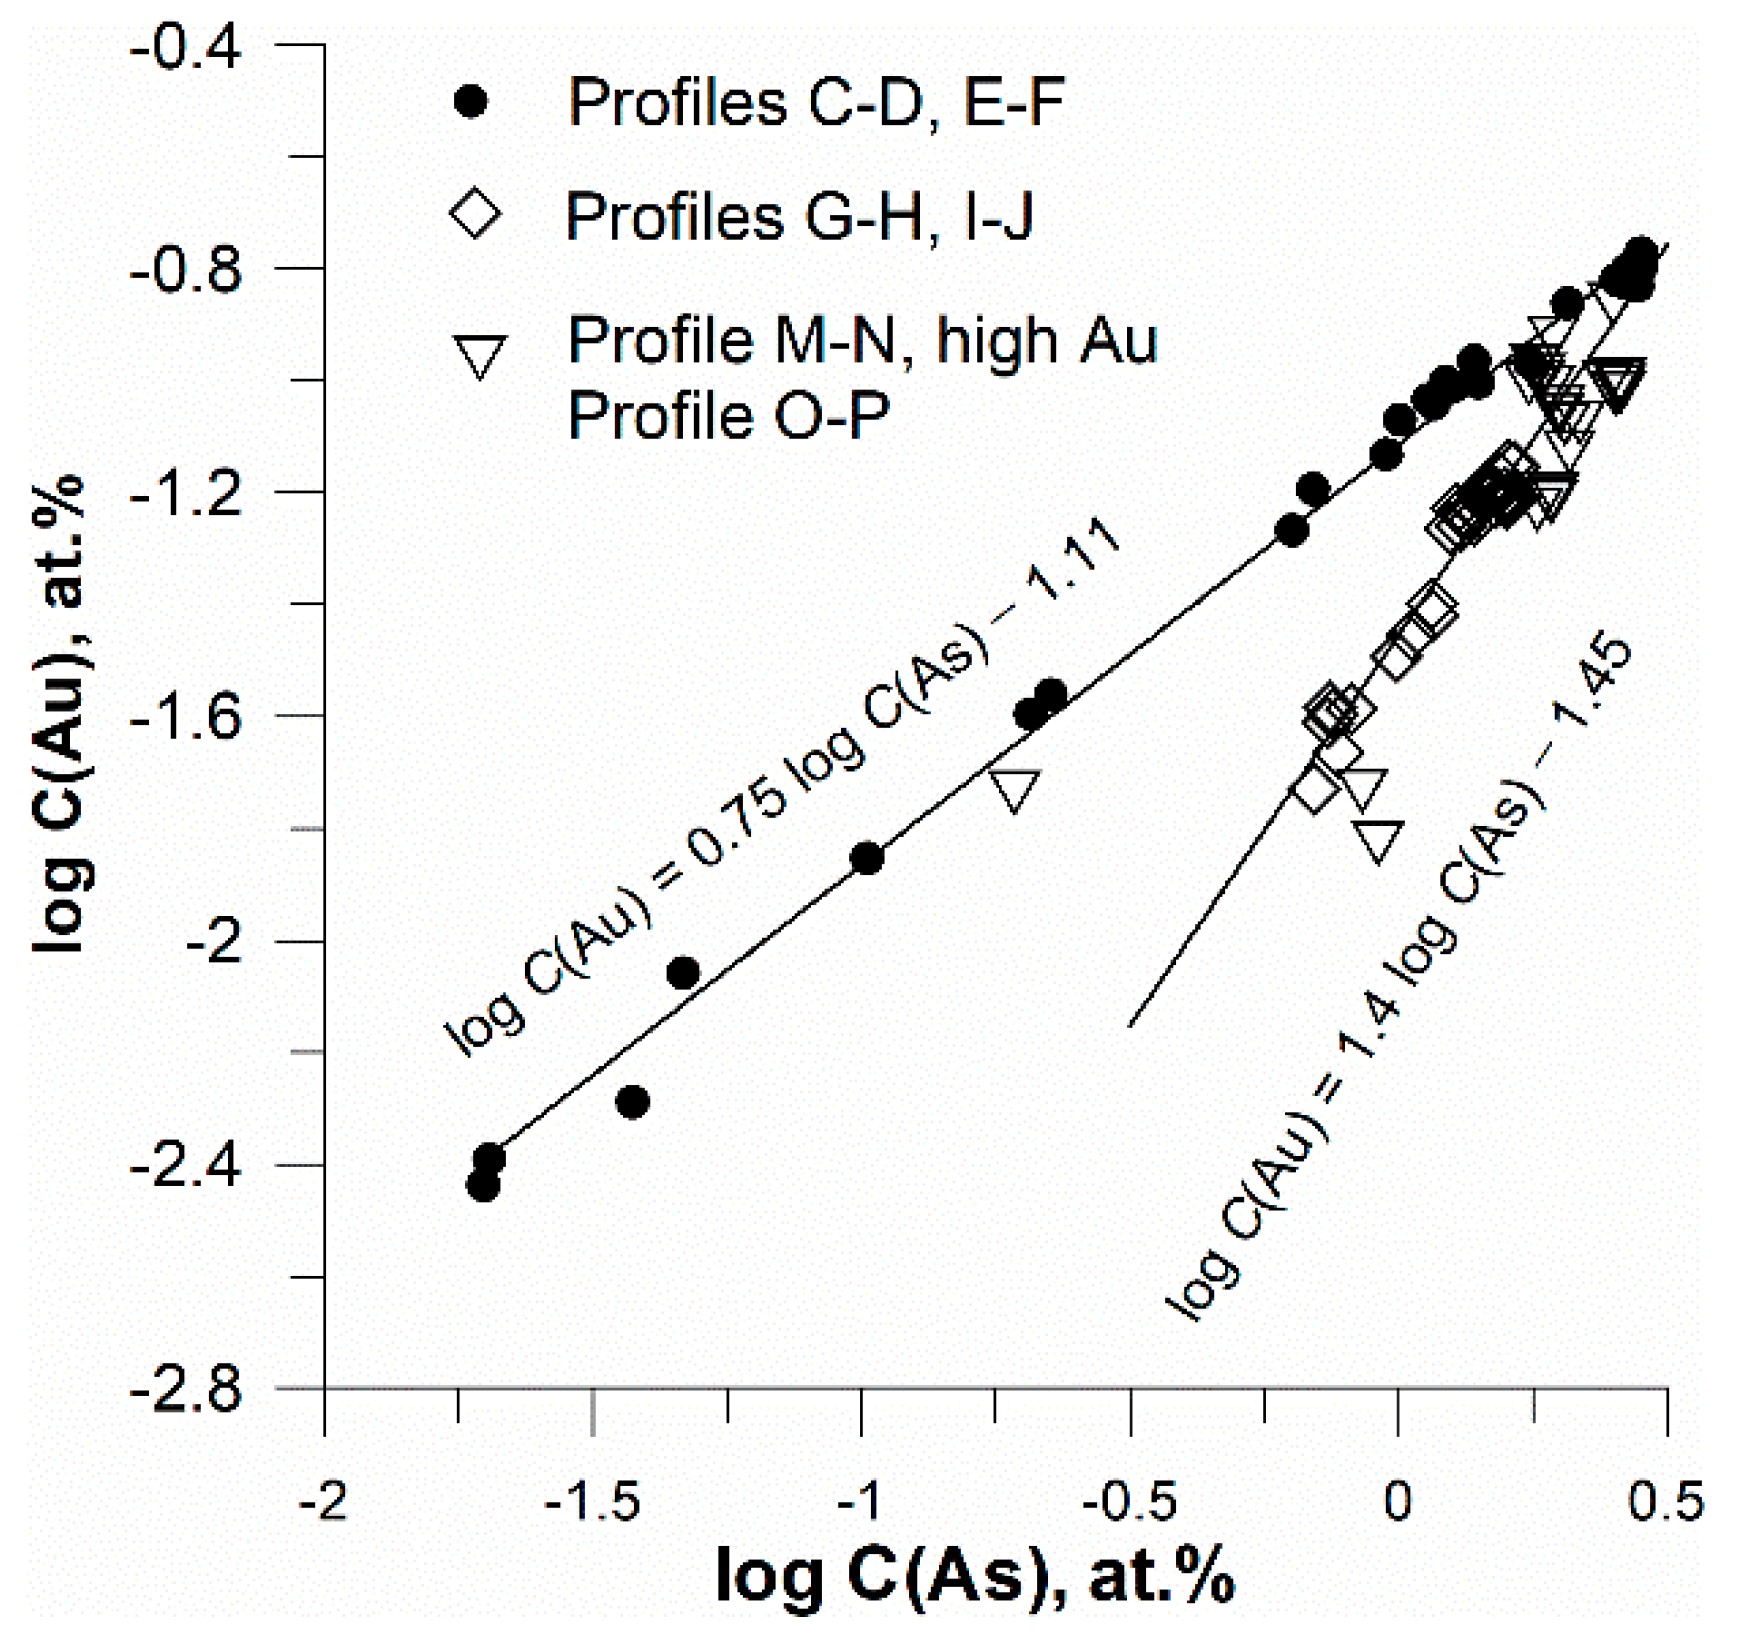

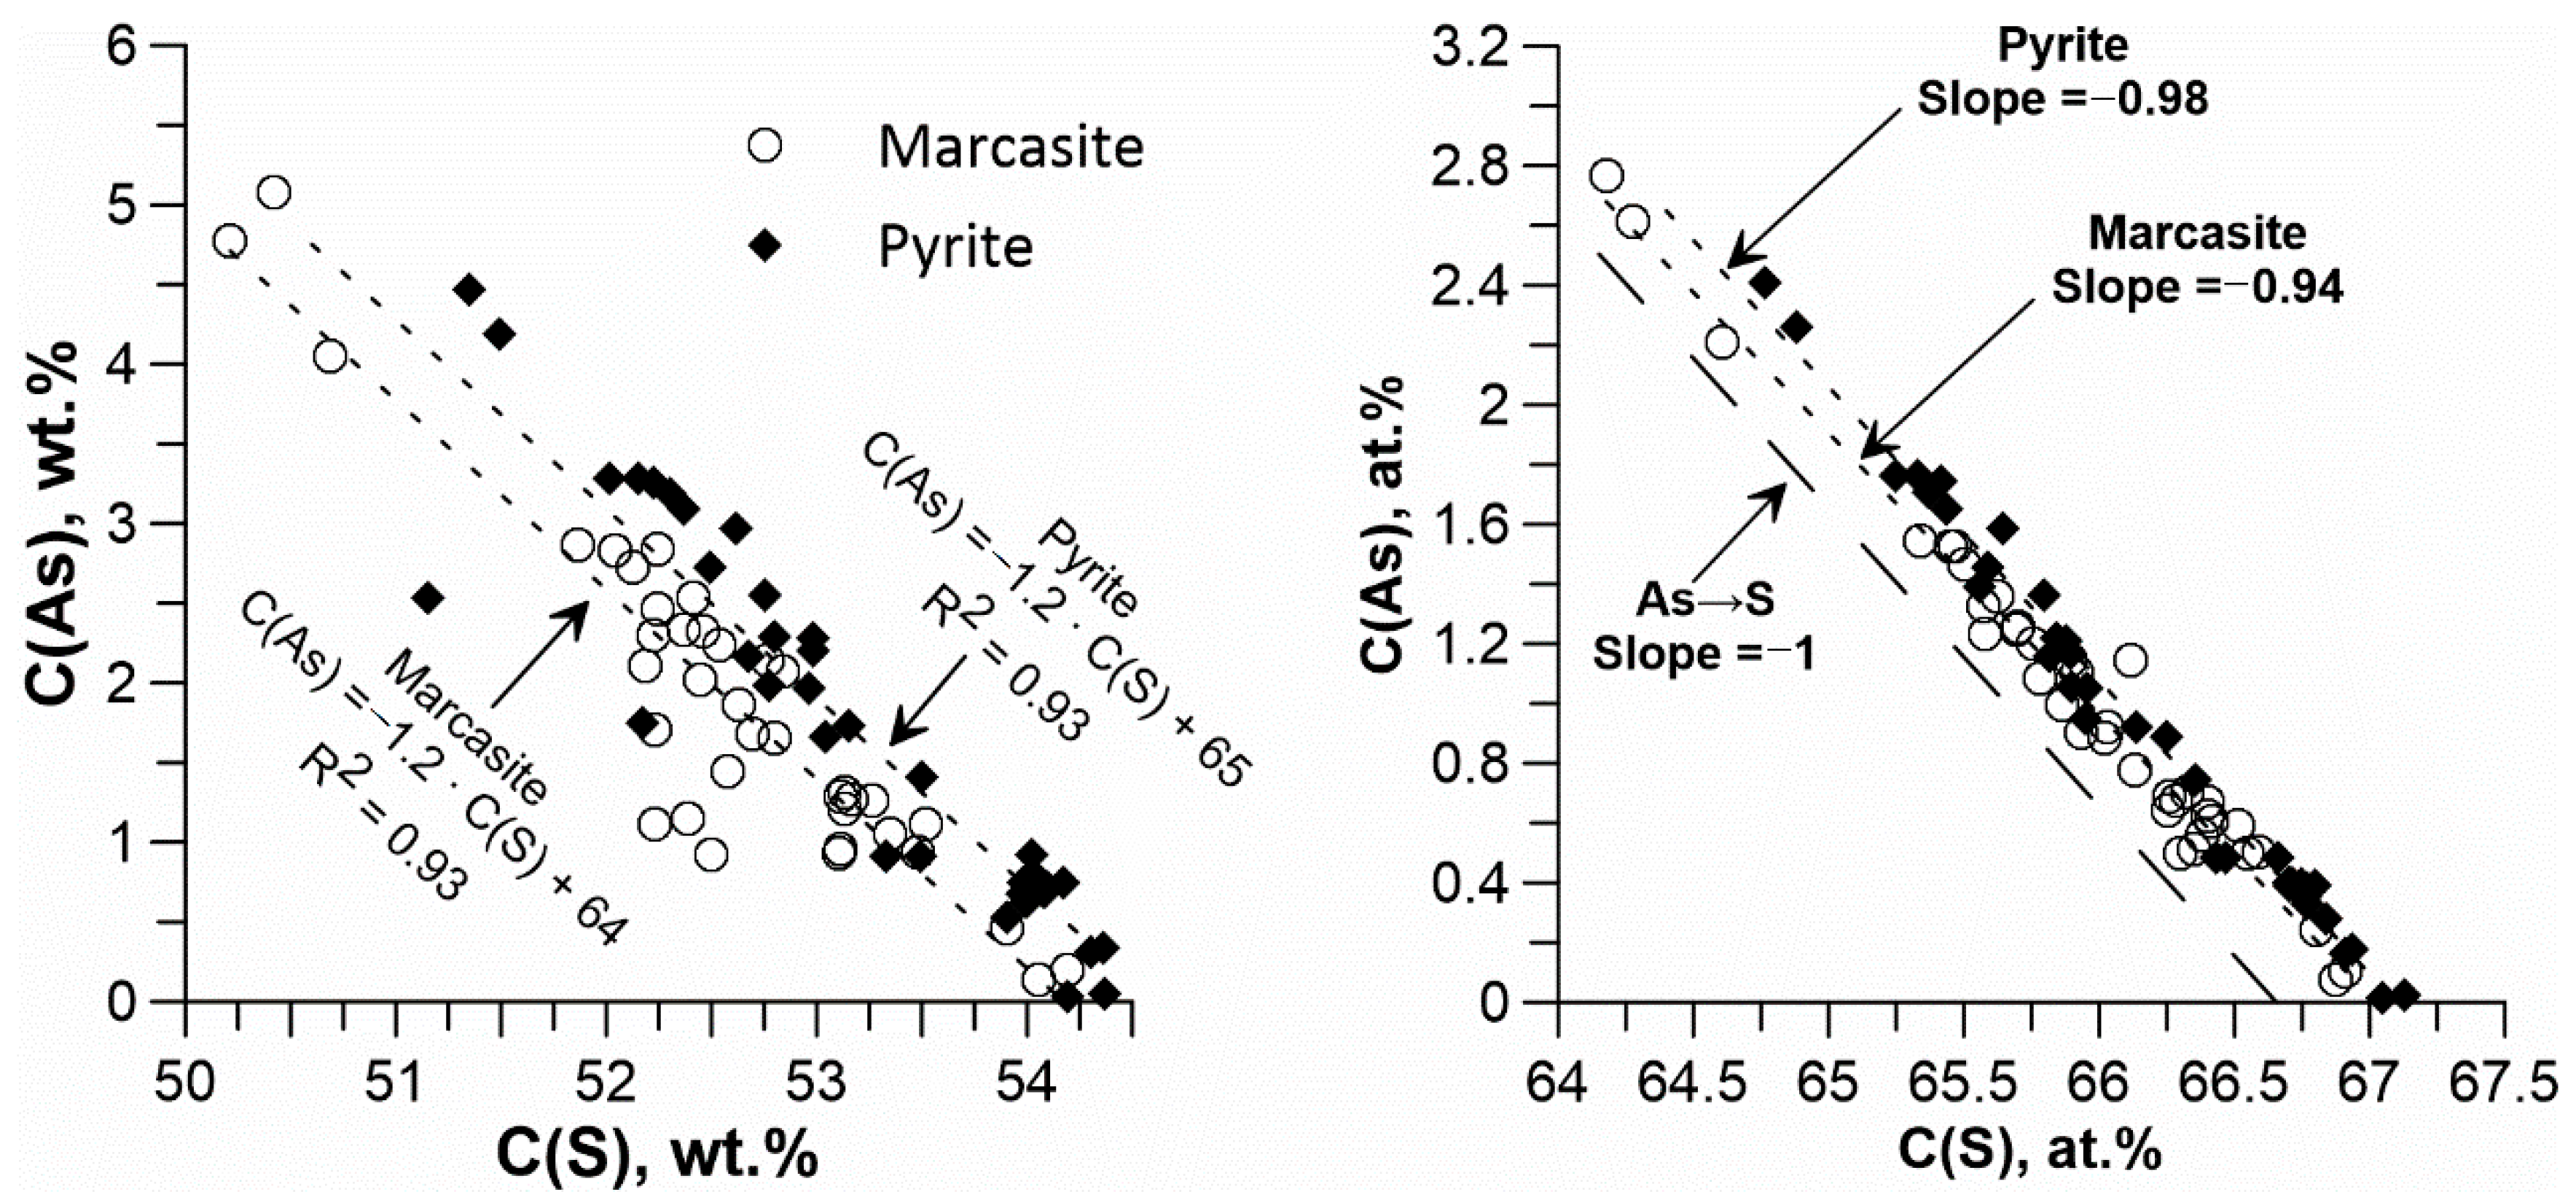


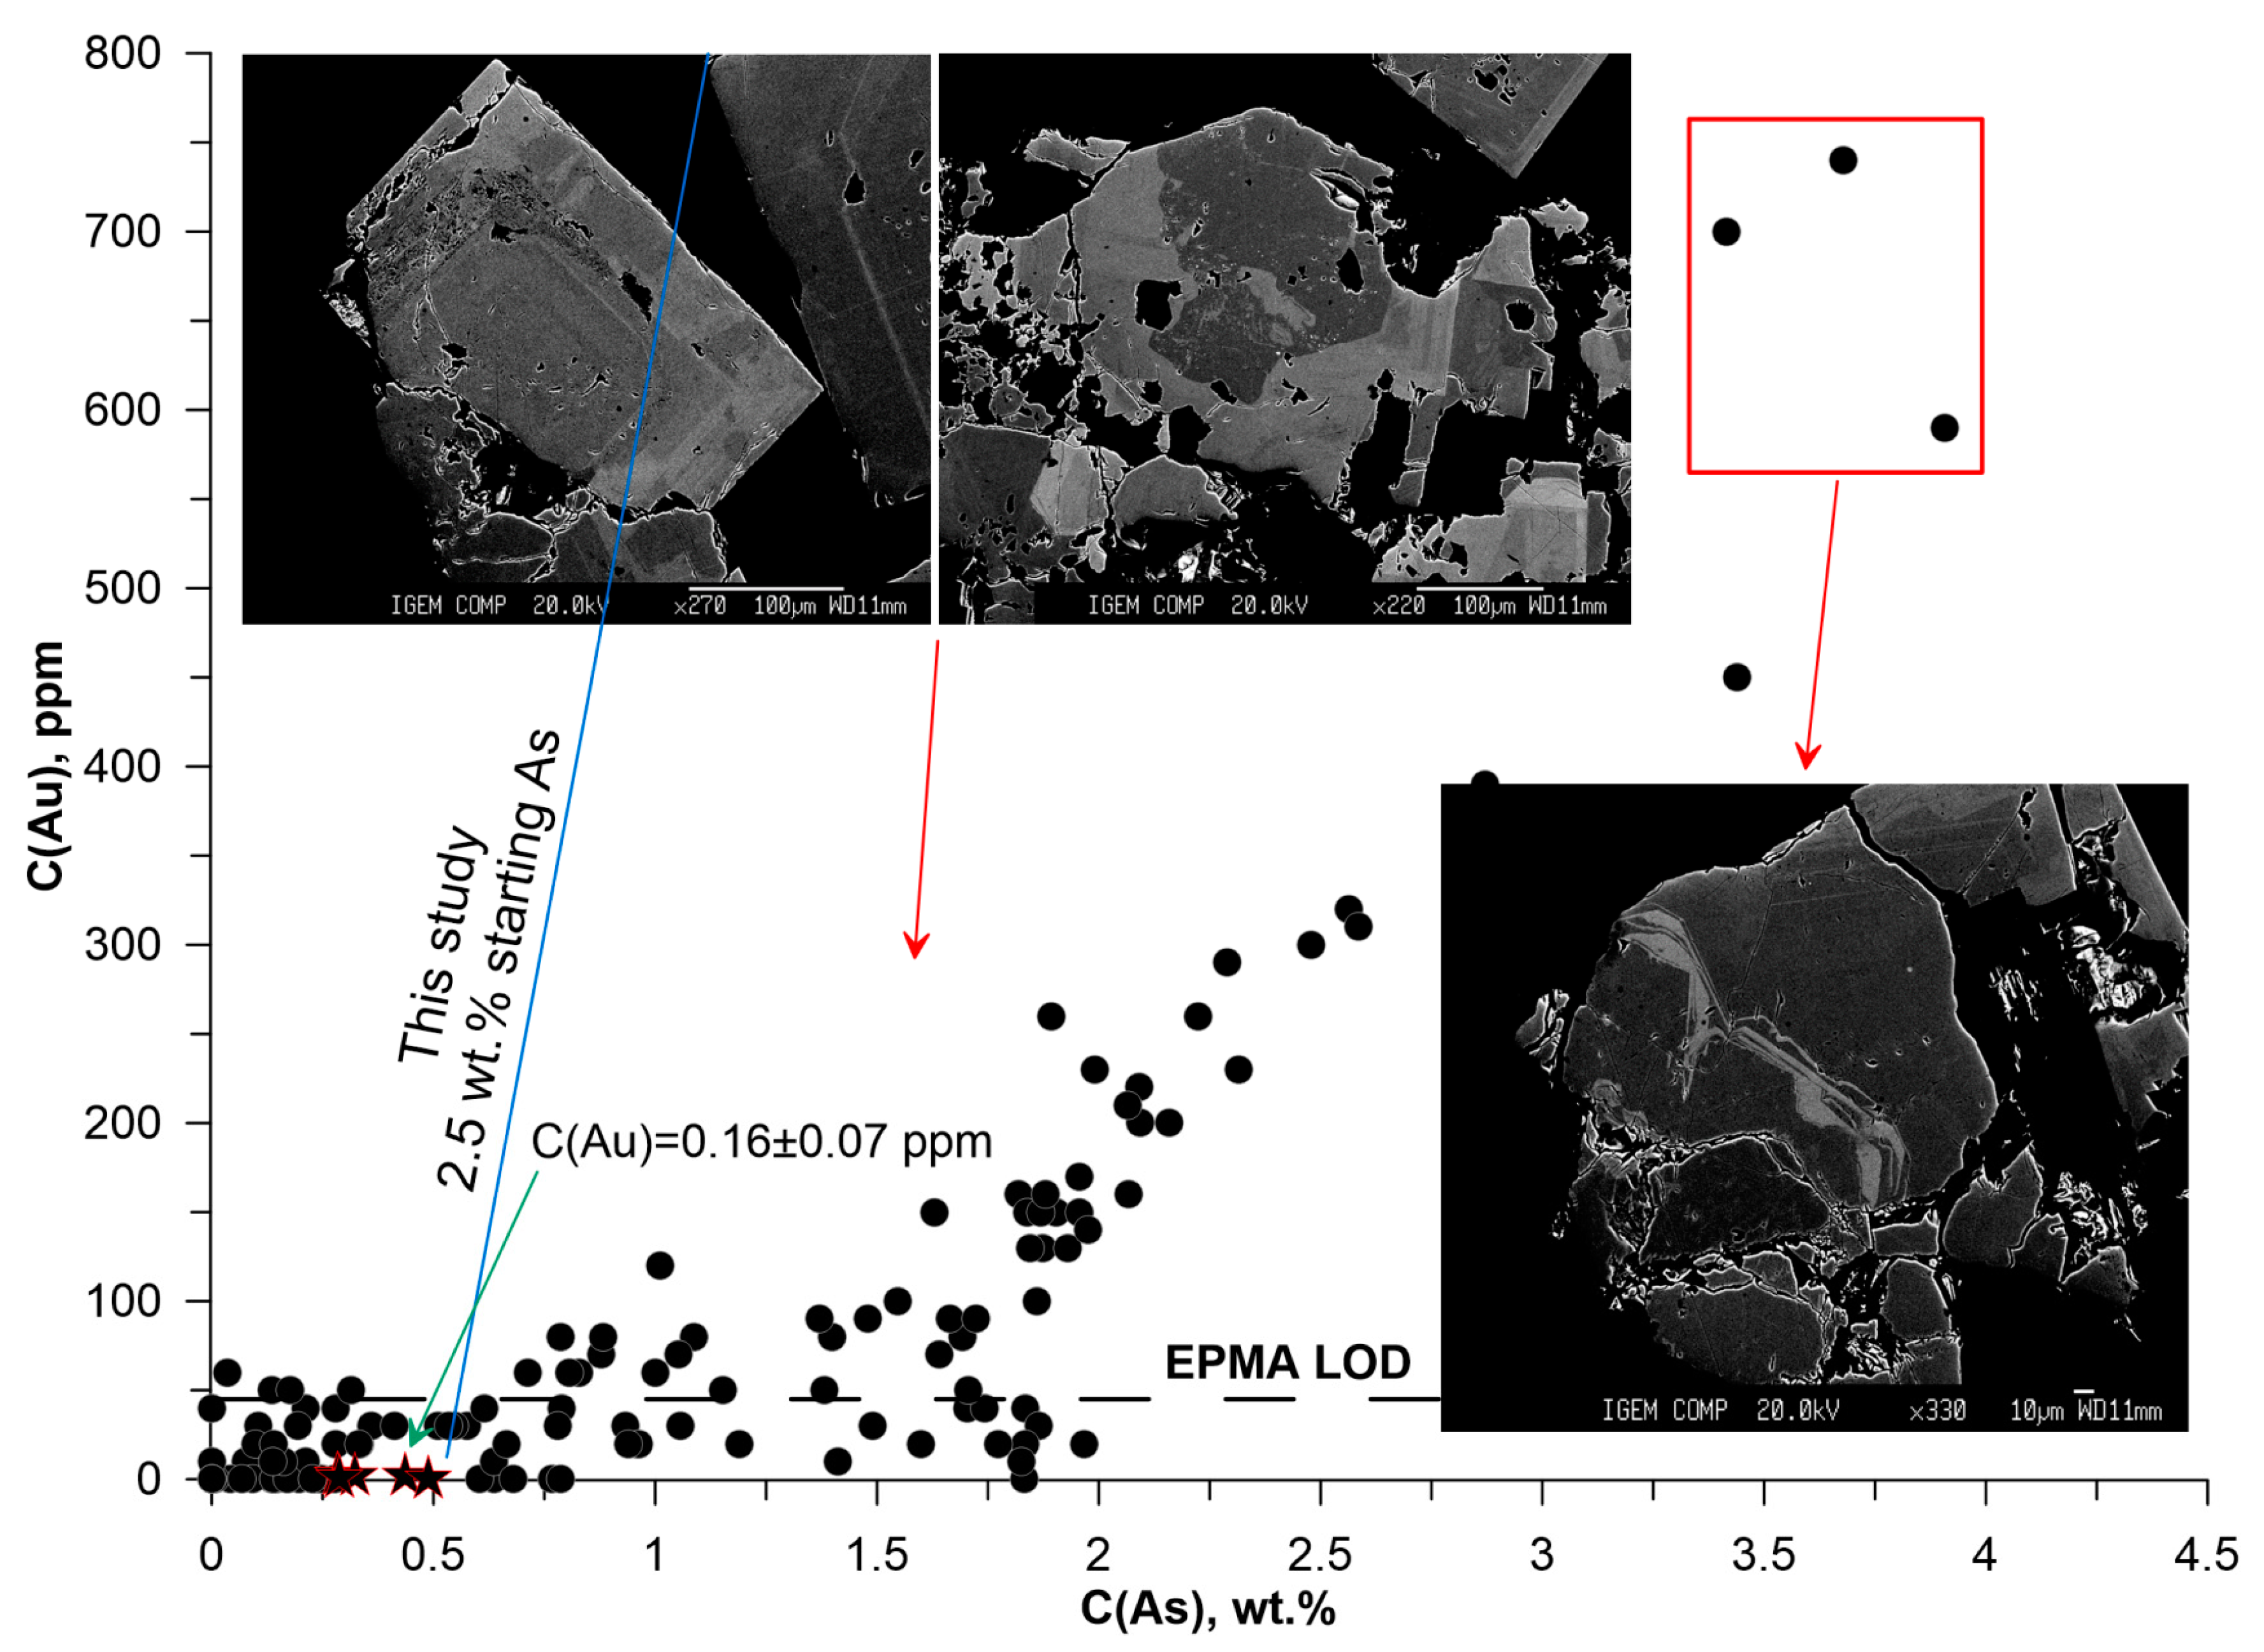
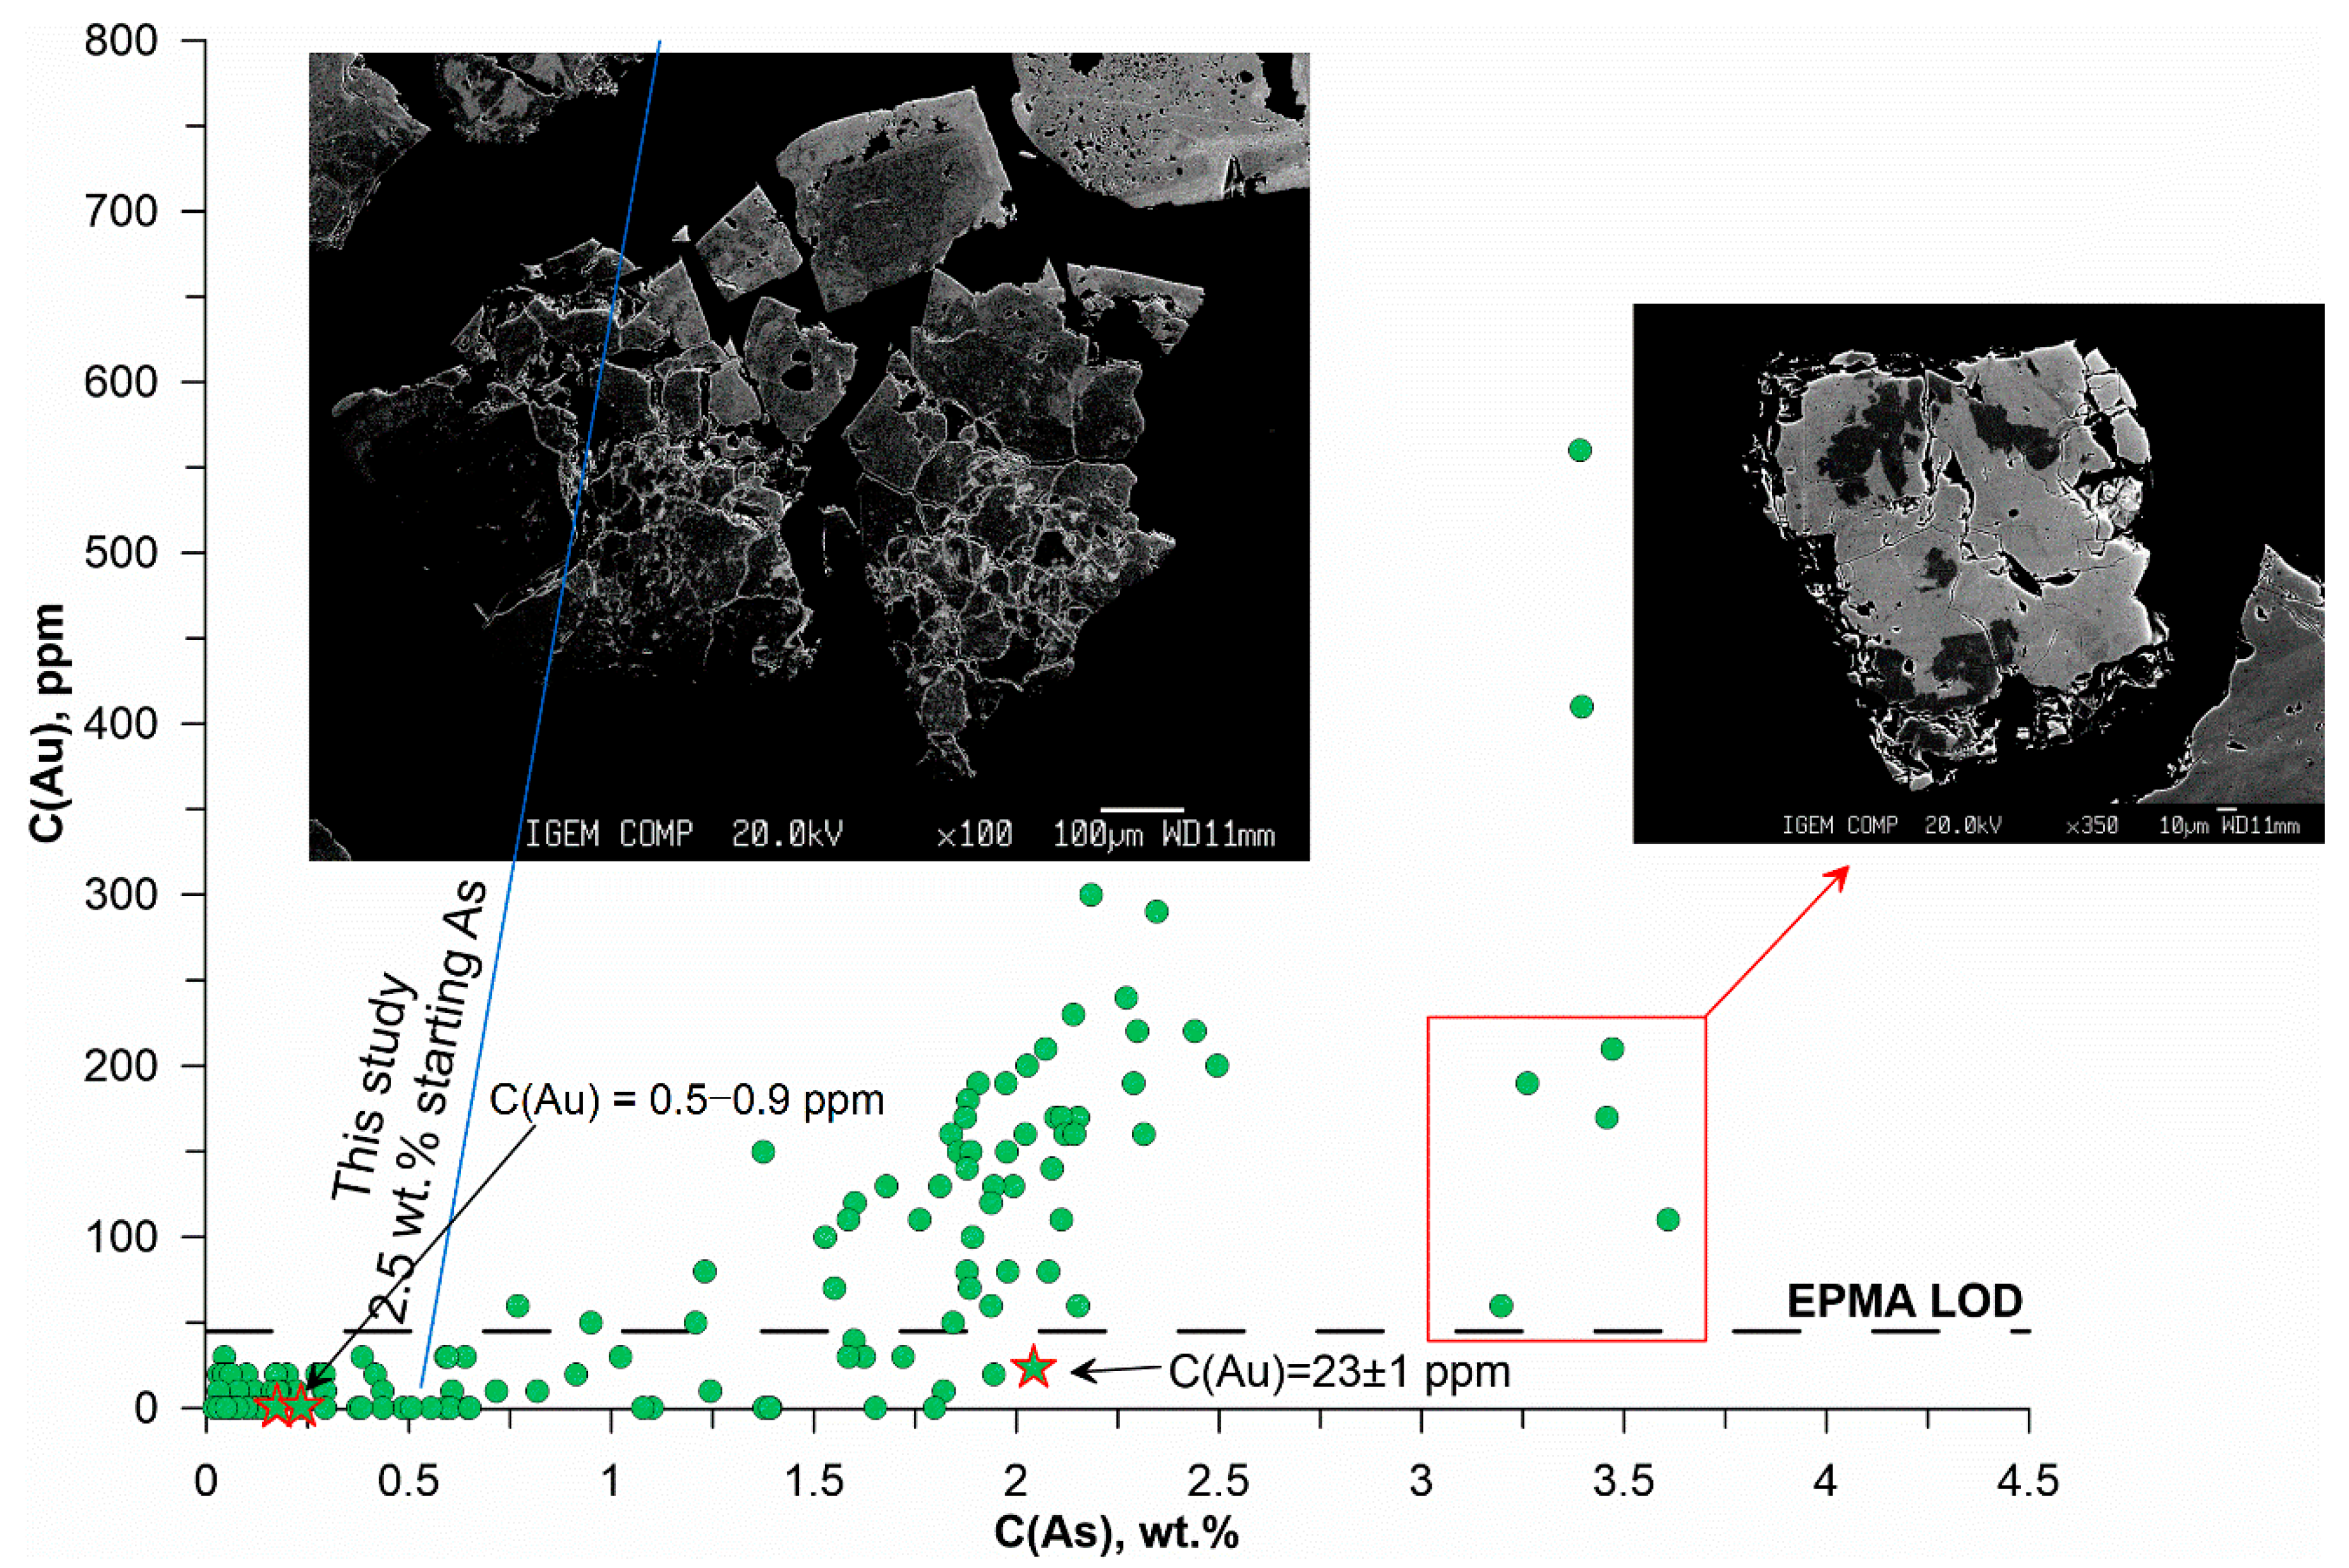

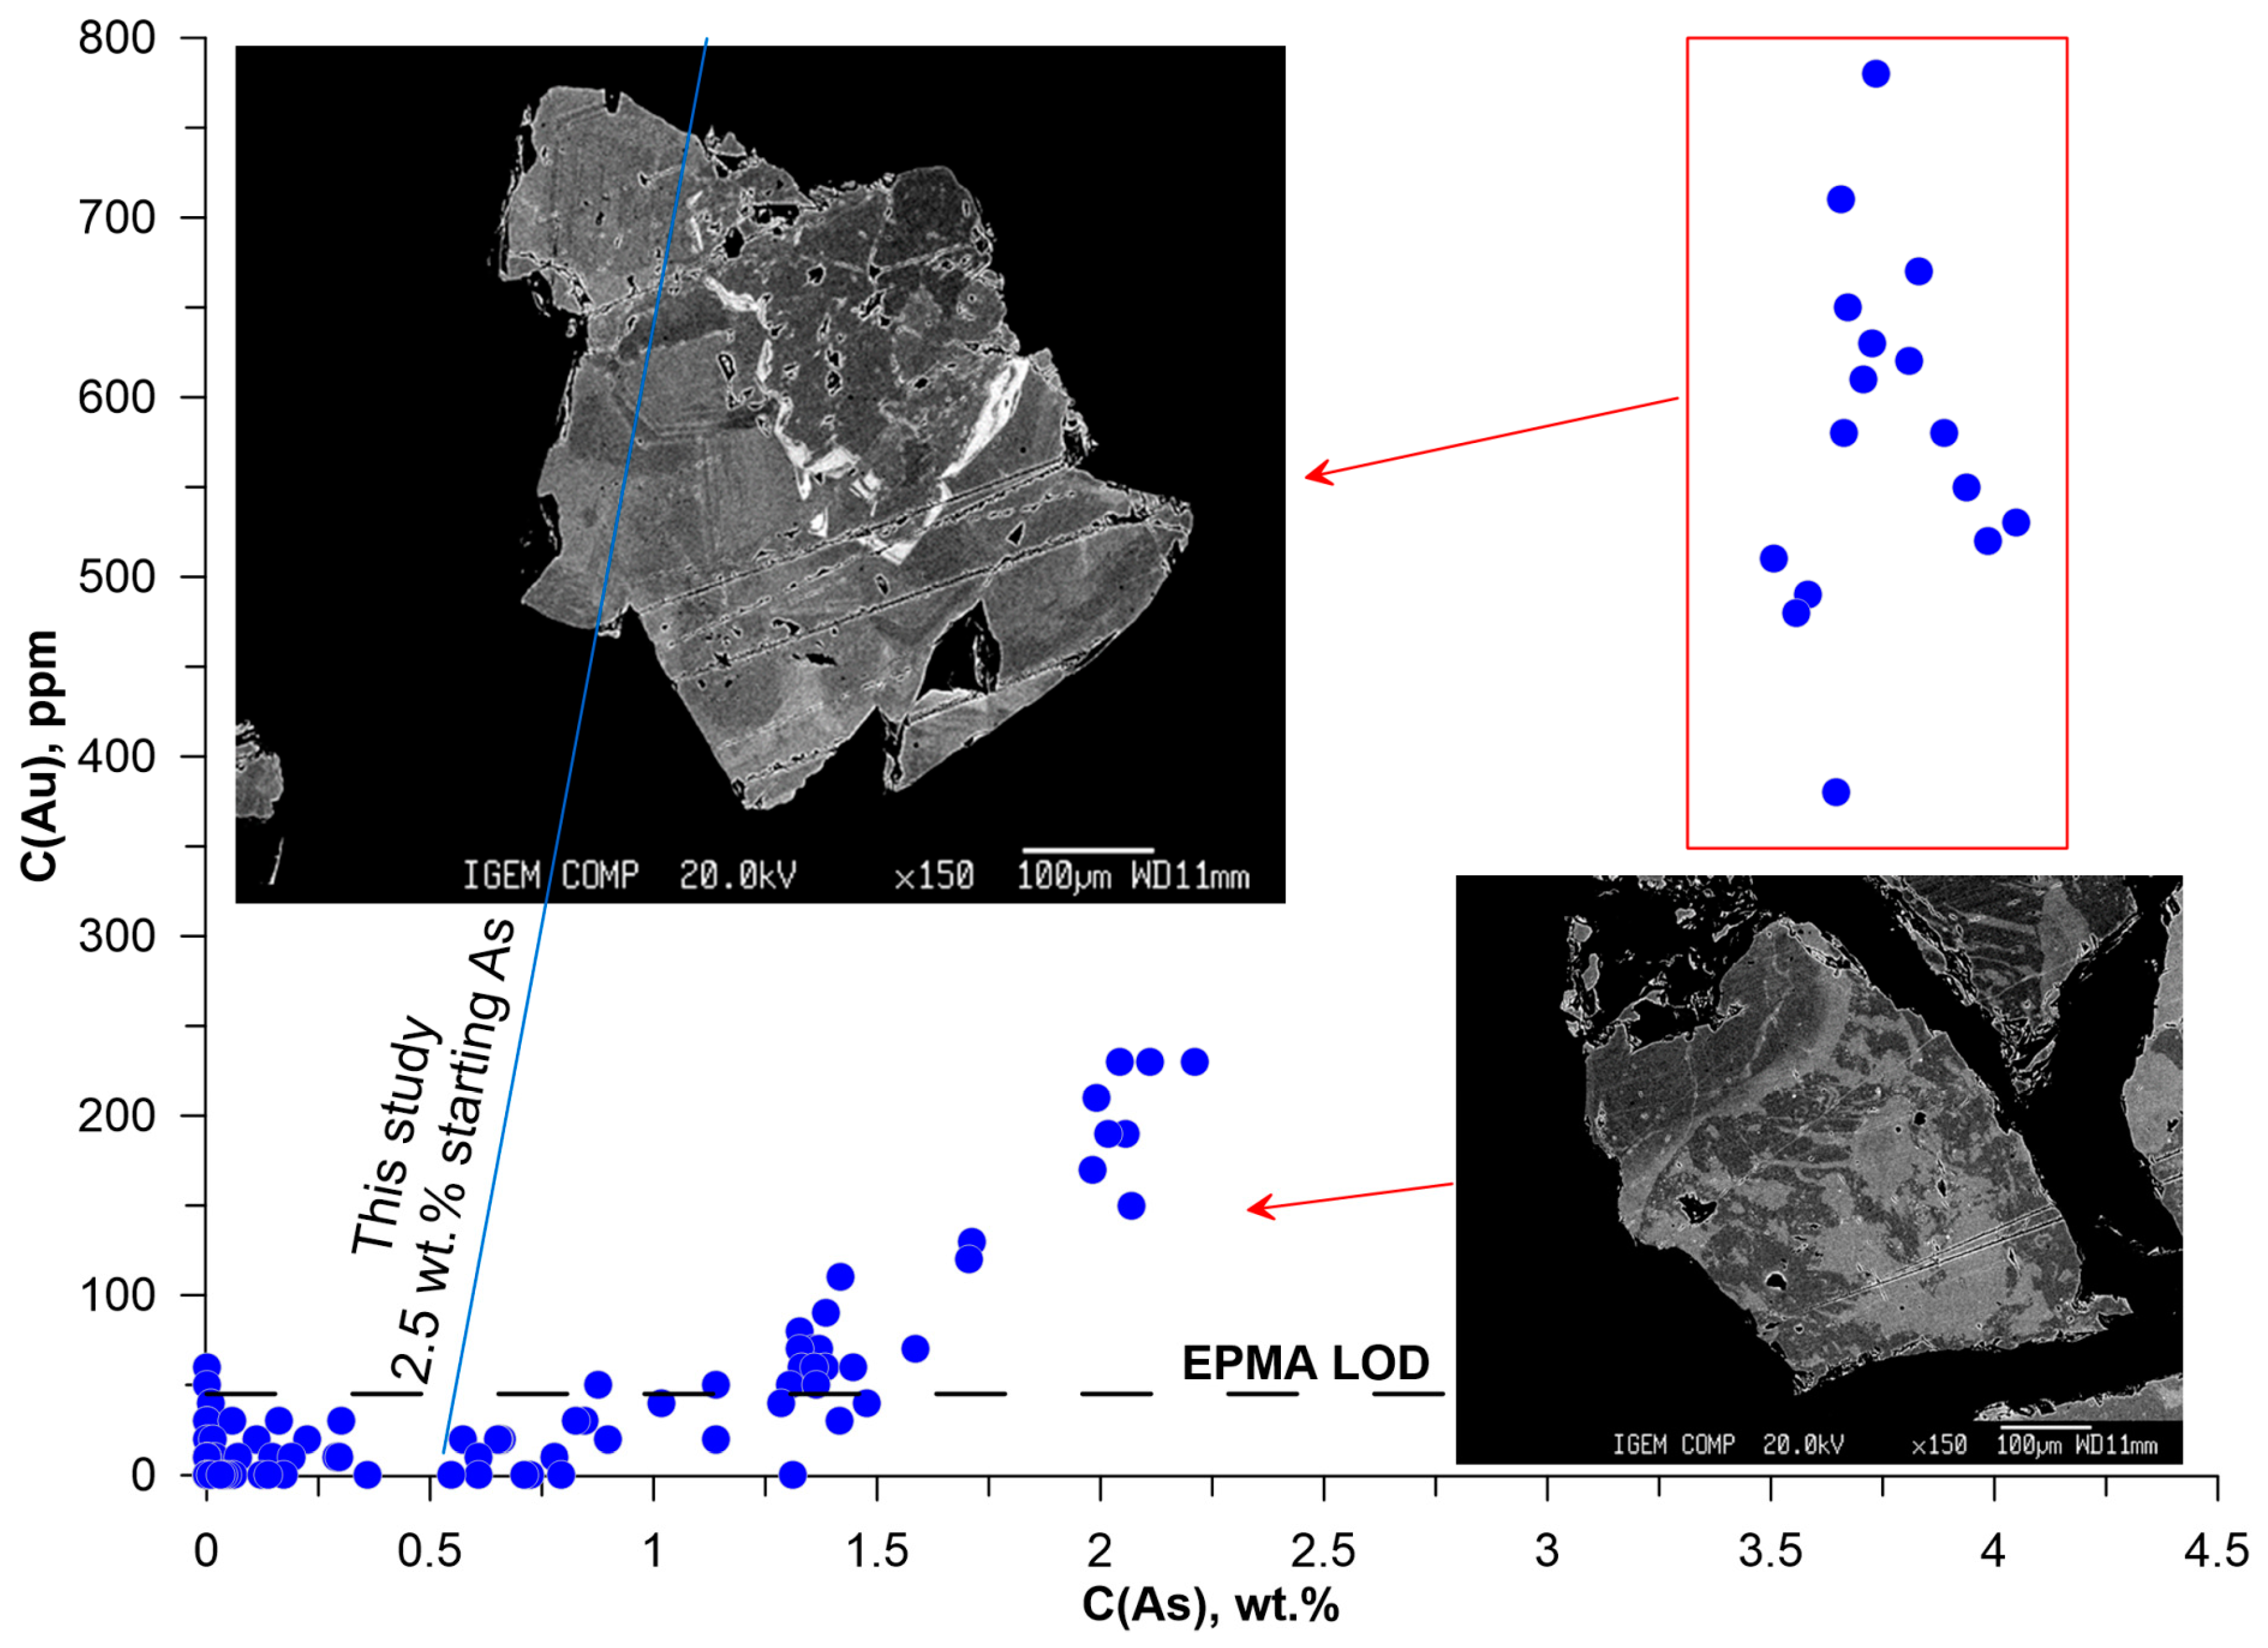
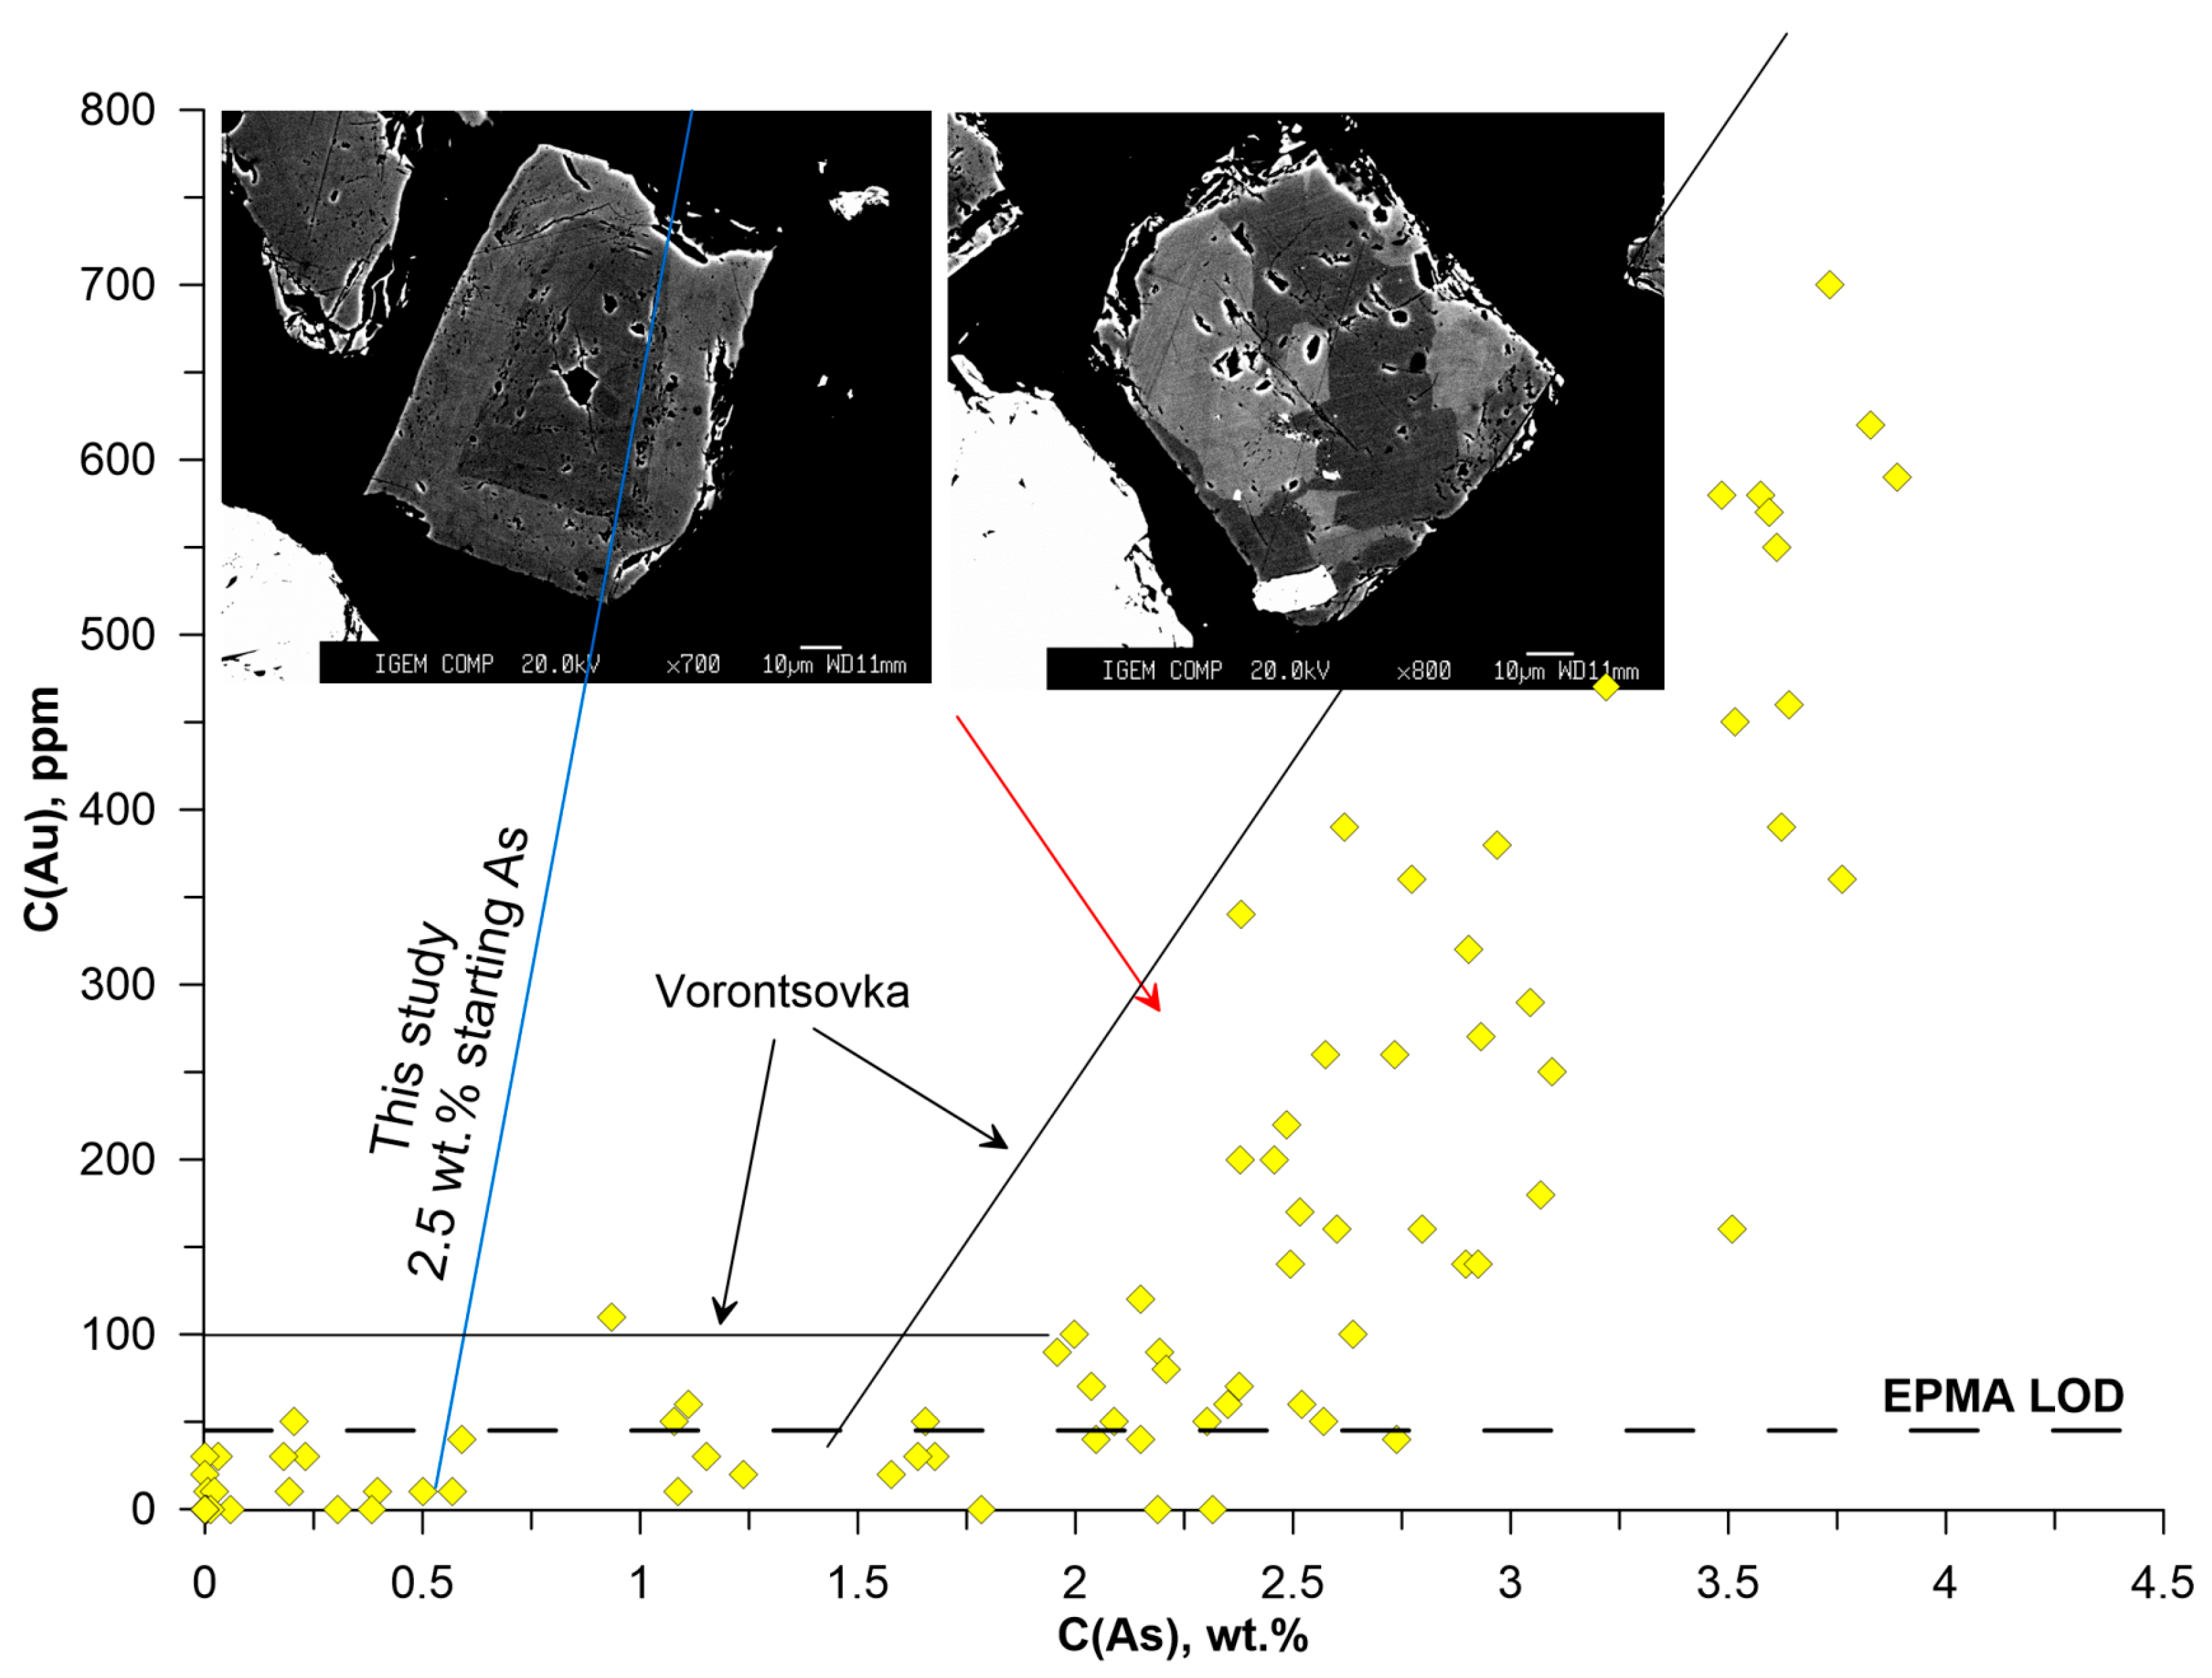
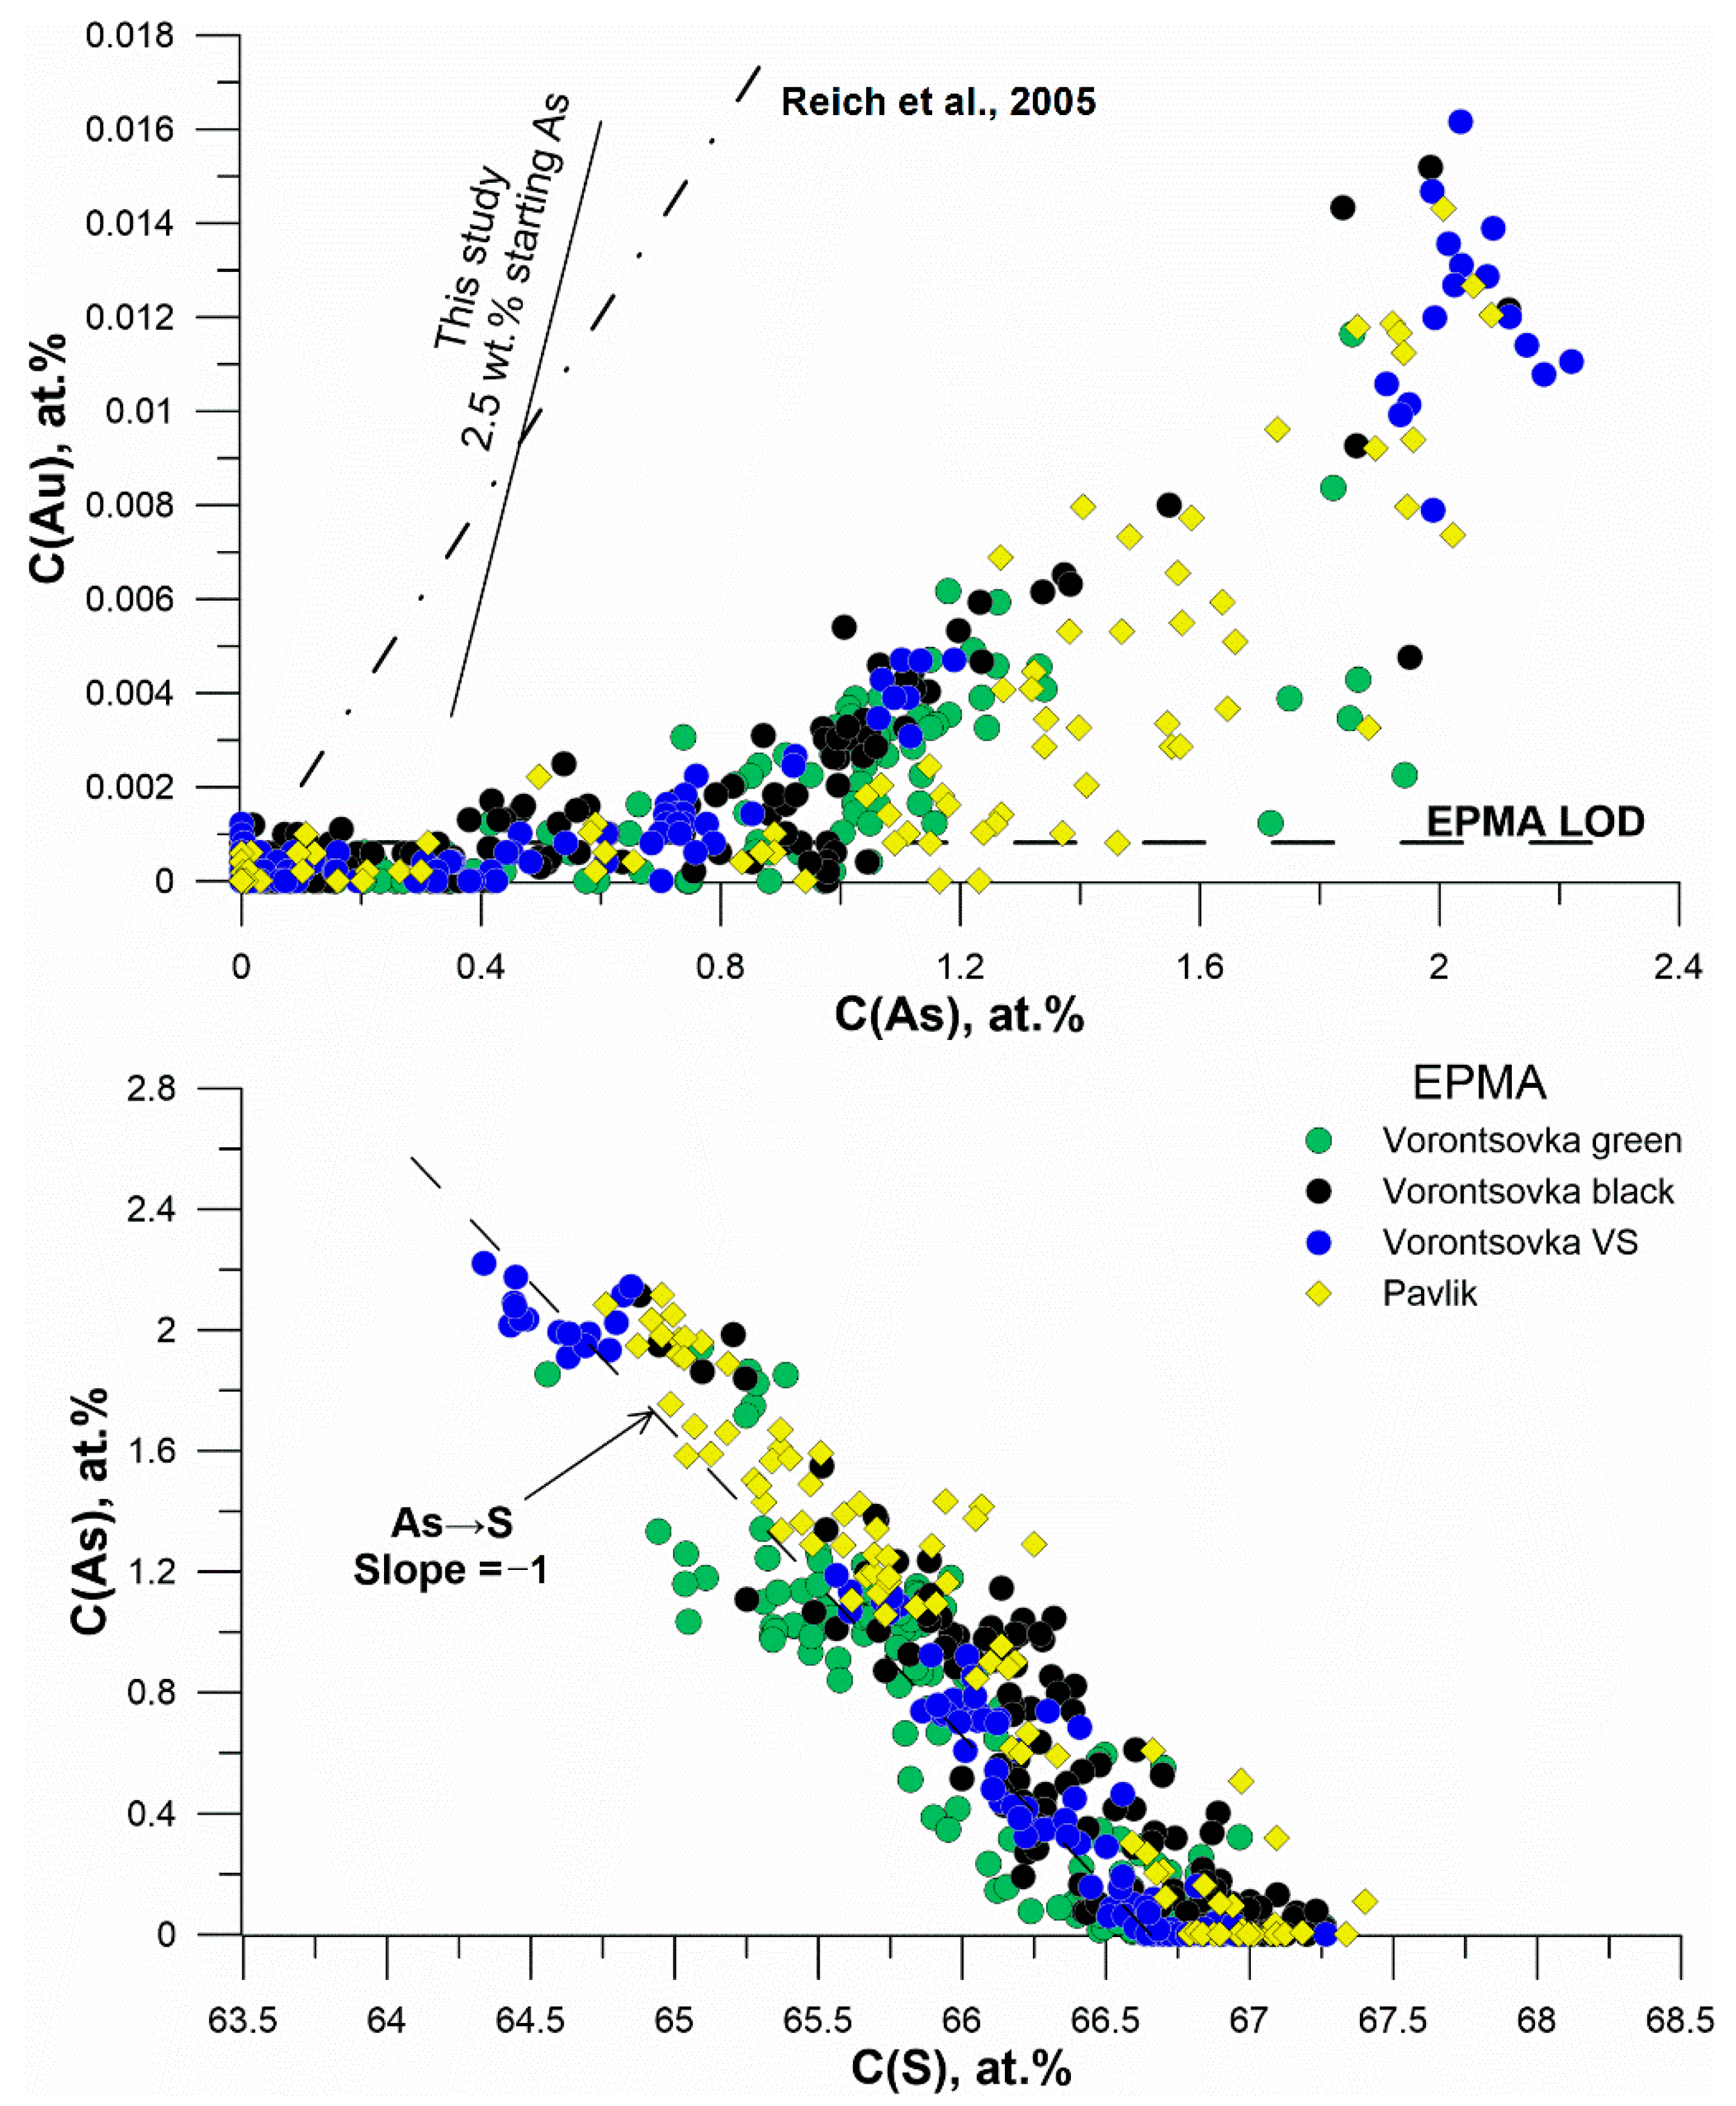
Disclaimer/Publisher’s Note: The statements, opinions and data contained in all publications are solely those of the individual author(s) and contributor(s) and not of MDPI and/or the editor(s). MDPI and/or the editor(s) disclaim responsibility for any injury to people or property resulting from any ideas, methods, instructions or products referred to in the content. |
© 2024 by the authors. Licensee MDPI, Basel, Switzerland. This article is an open access article distributed under the terms and conditions of the Creative Commons Attribution (CC BY) license (https://creativecommons.org/licenses/by/4.0/).