

Geochemical Record of Late Quaternary Paleodepositional Environment from Lacustrine Sediments of Soda Lake, Carrizo Plain, California


Abstract
1. Introduction
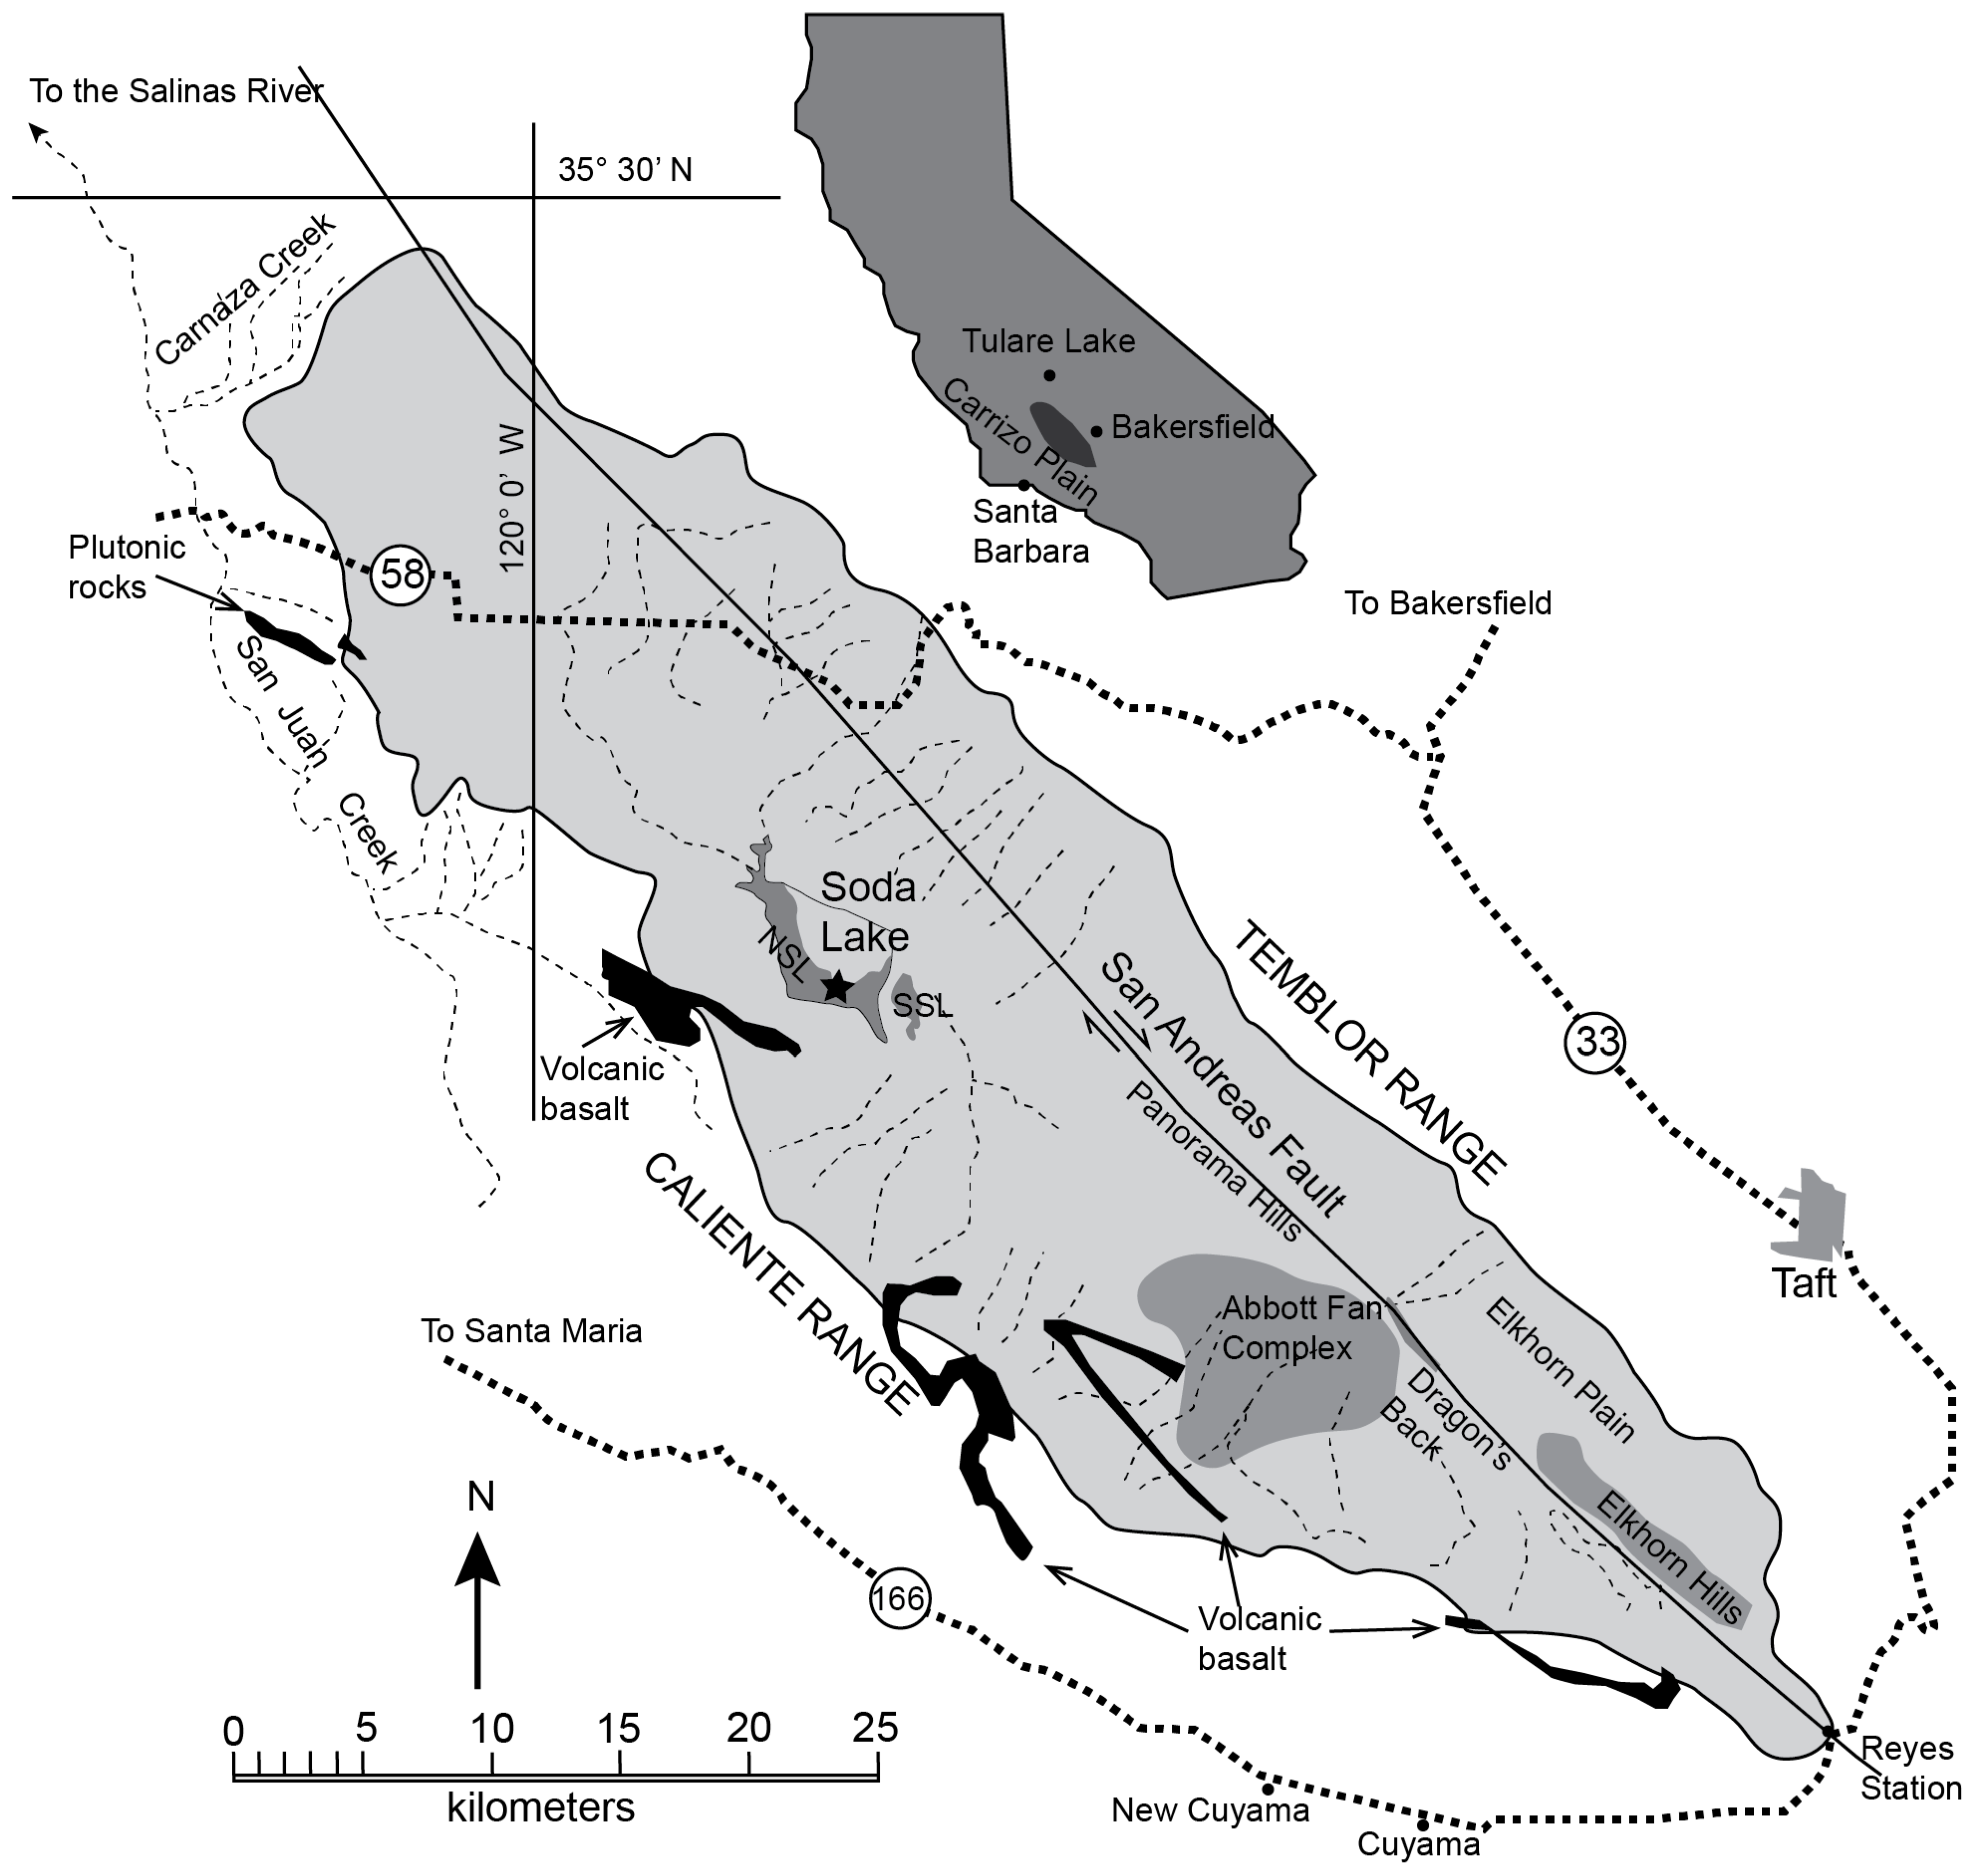
2. Geologic Setting and Background
3. Materials and Methods
3.1. Sample Collection and Lithology Characteristics
3.2. Laboratory Investigation
4. Results
4.1. Distribution of and Variability in Major, Trace, and REE Elements
4.2. Paleoenvironment Proxies
5. Discussion
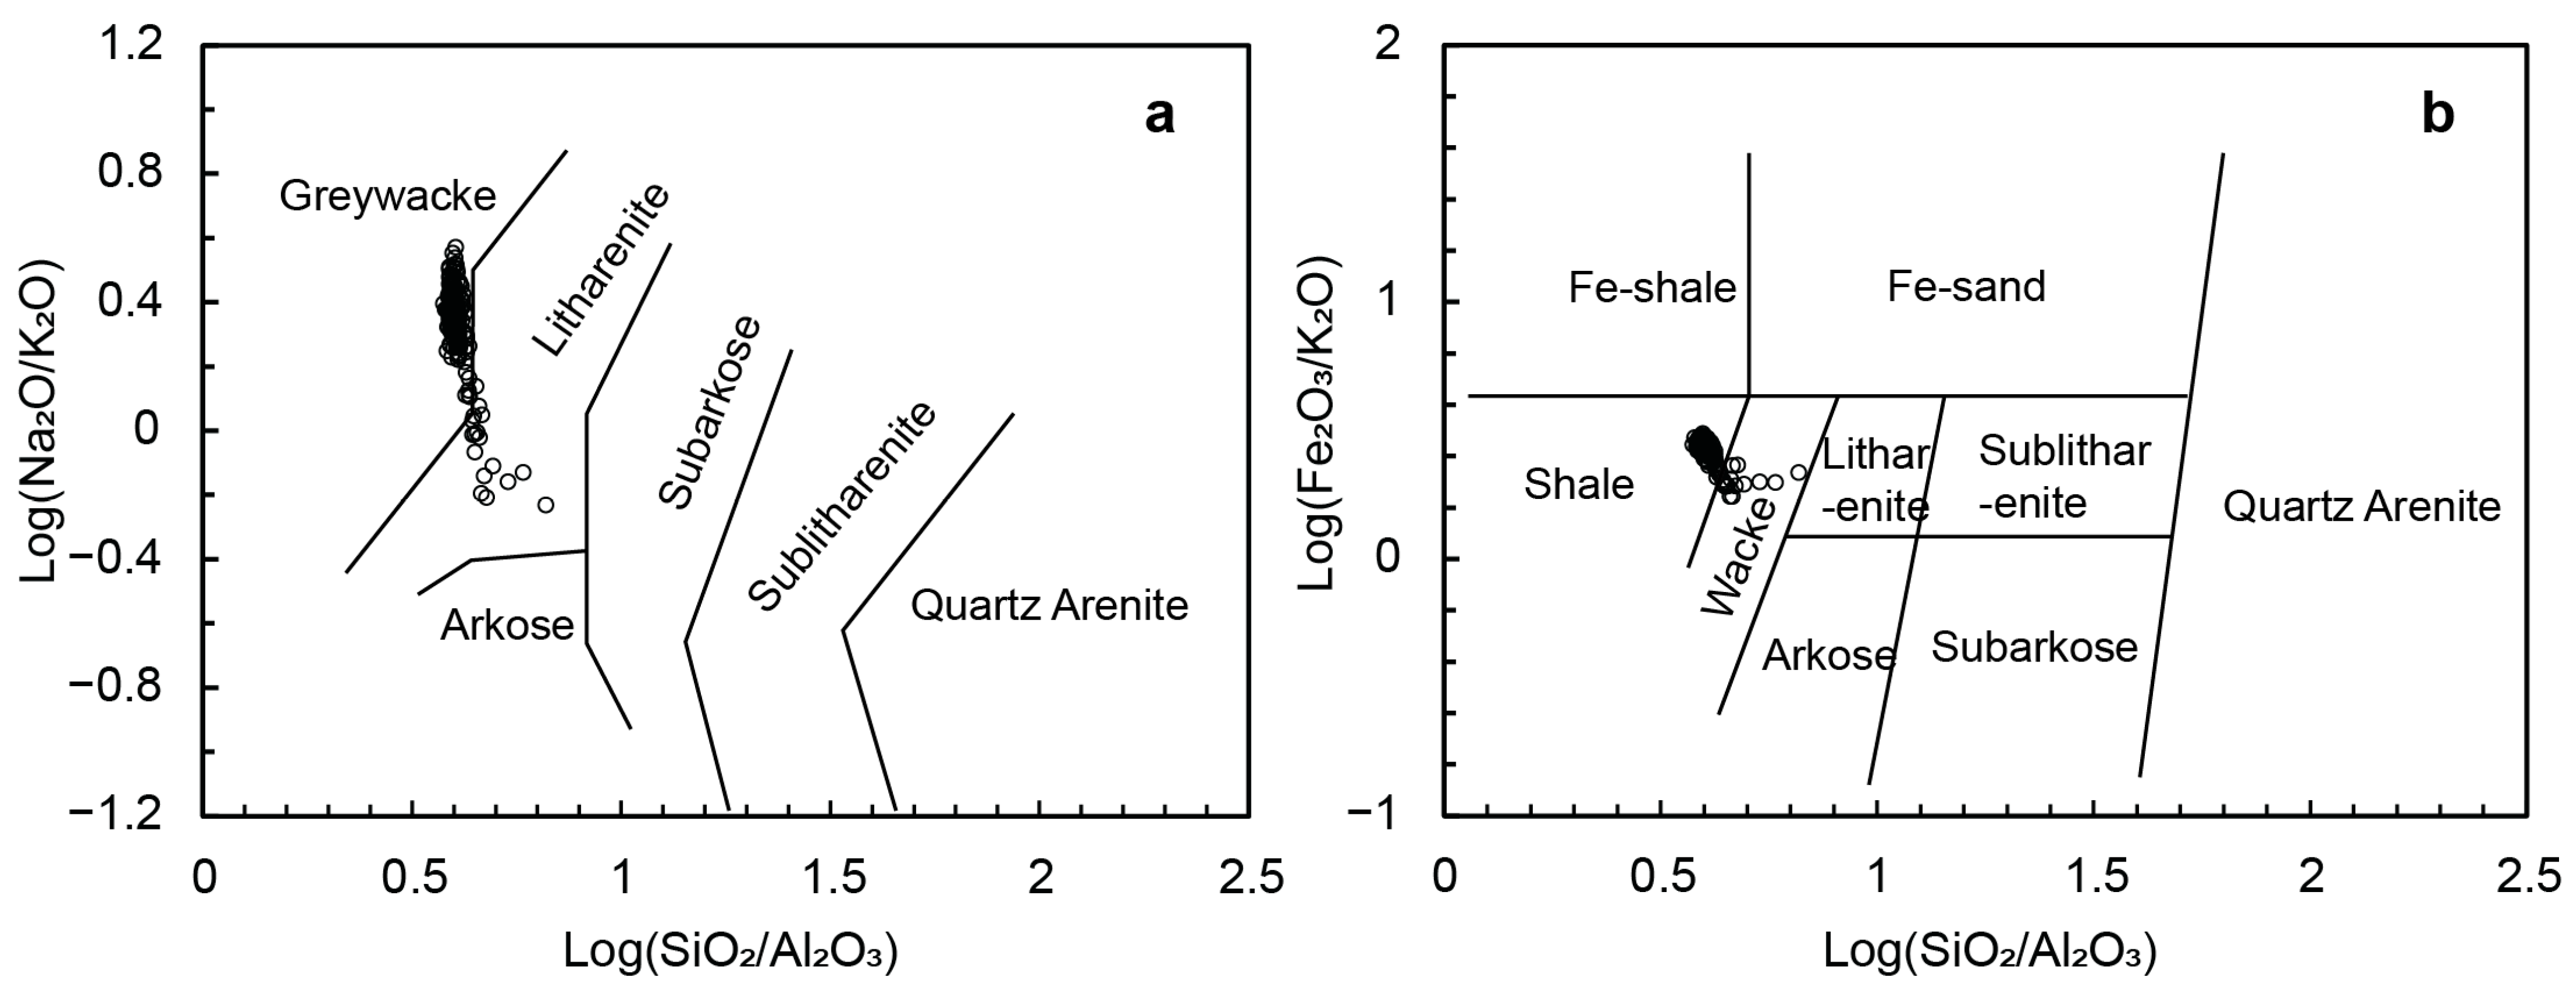
5.1. Sediment Provenance and Weathering Conditions
5.2. Paleoclimate
5.3. Paleosalinity and Paleoproductivity
5.4. Paleoredox Environment and Lake Water Depth
5.5. Evolution of the Paleosedimentary Environment
6. Conclusions
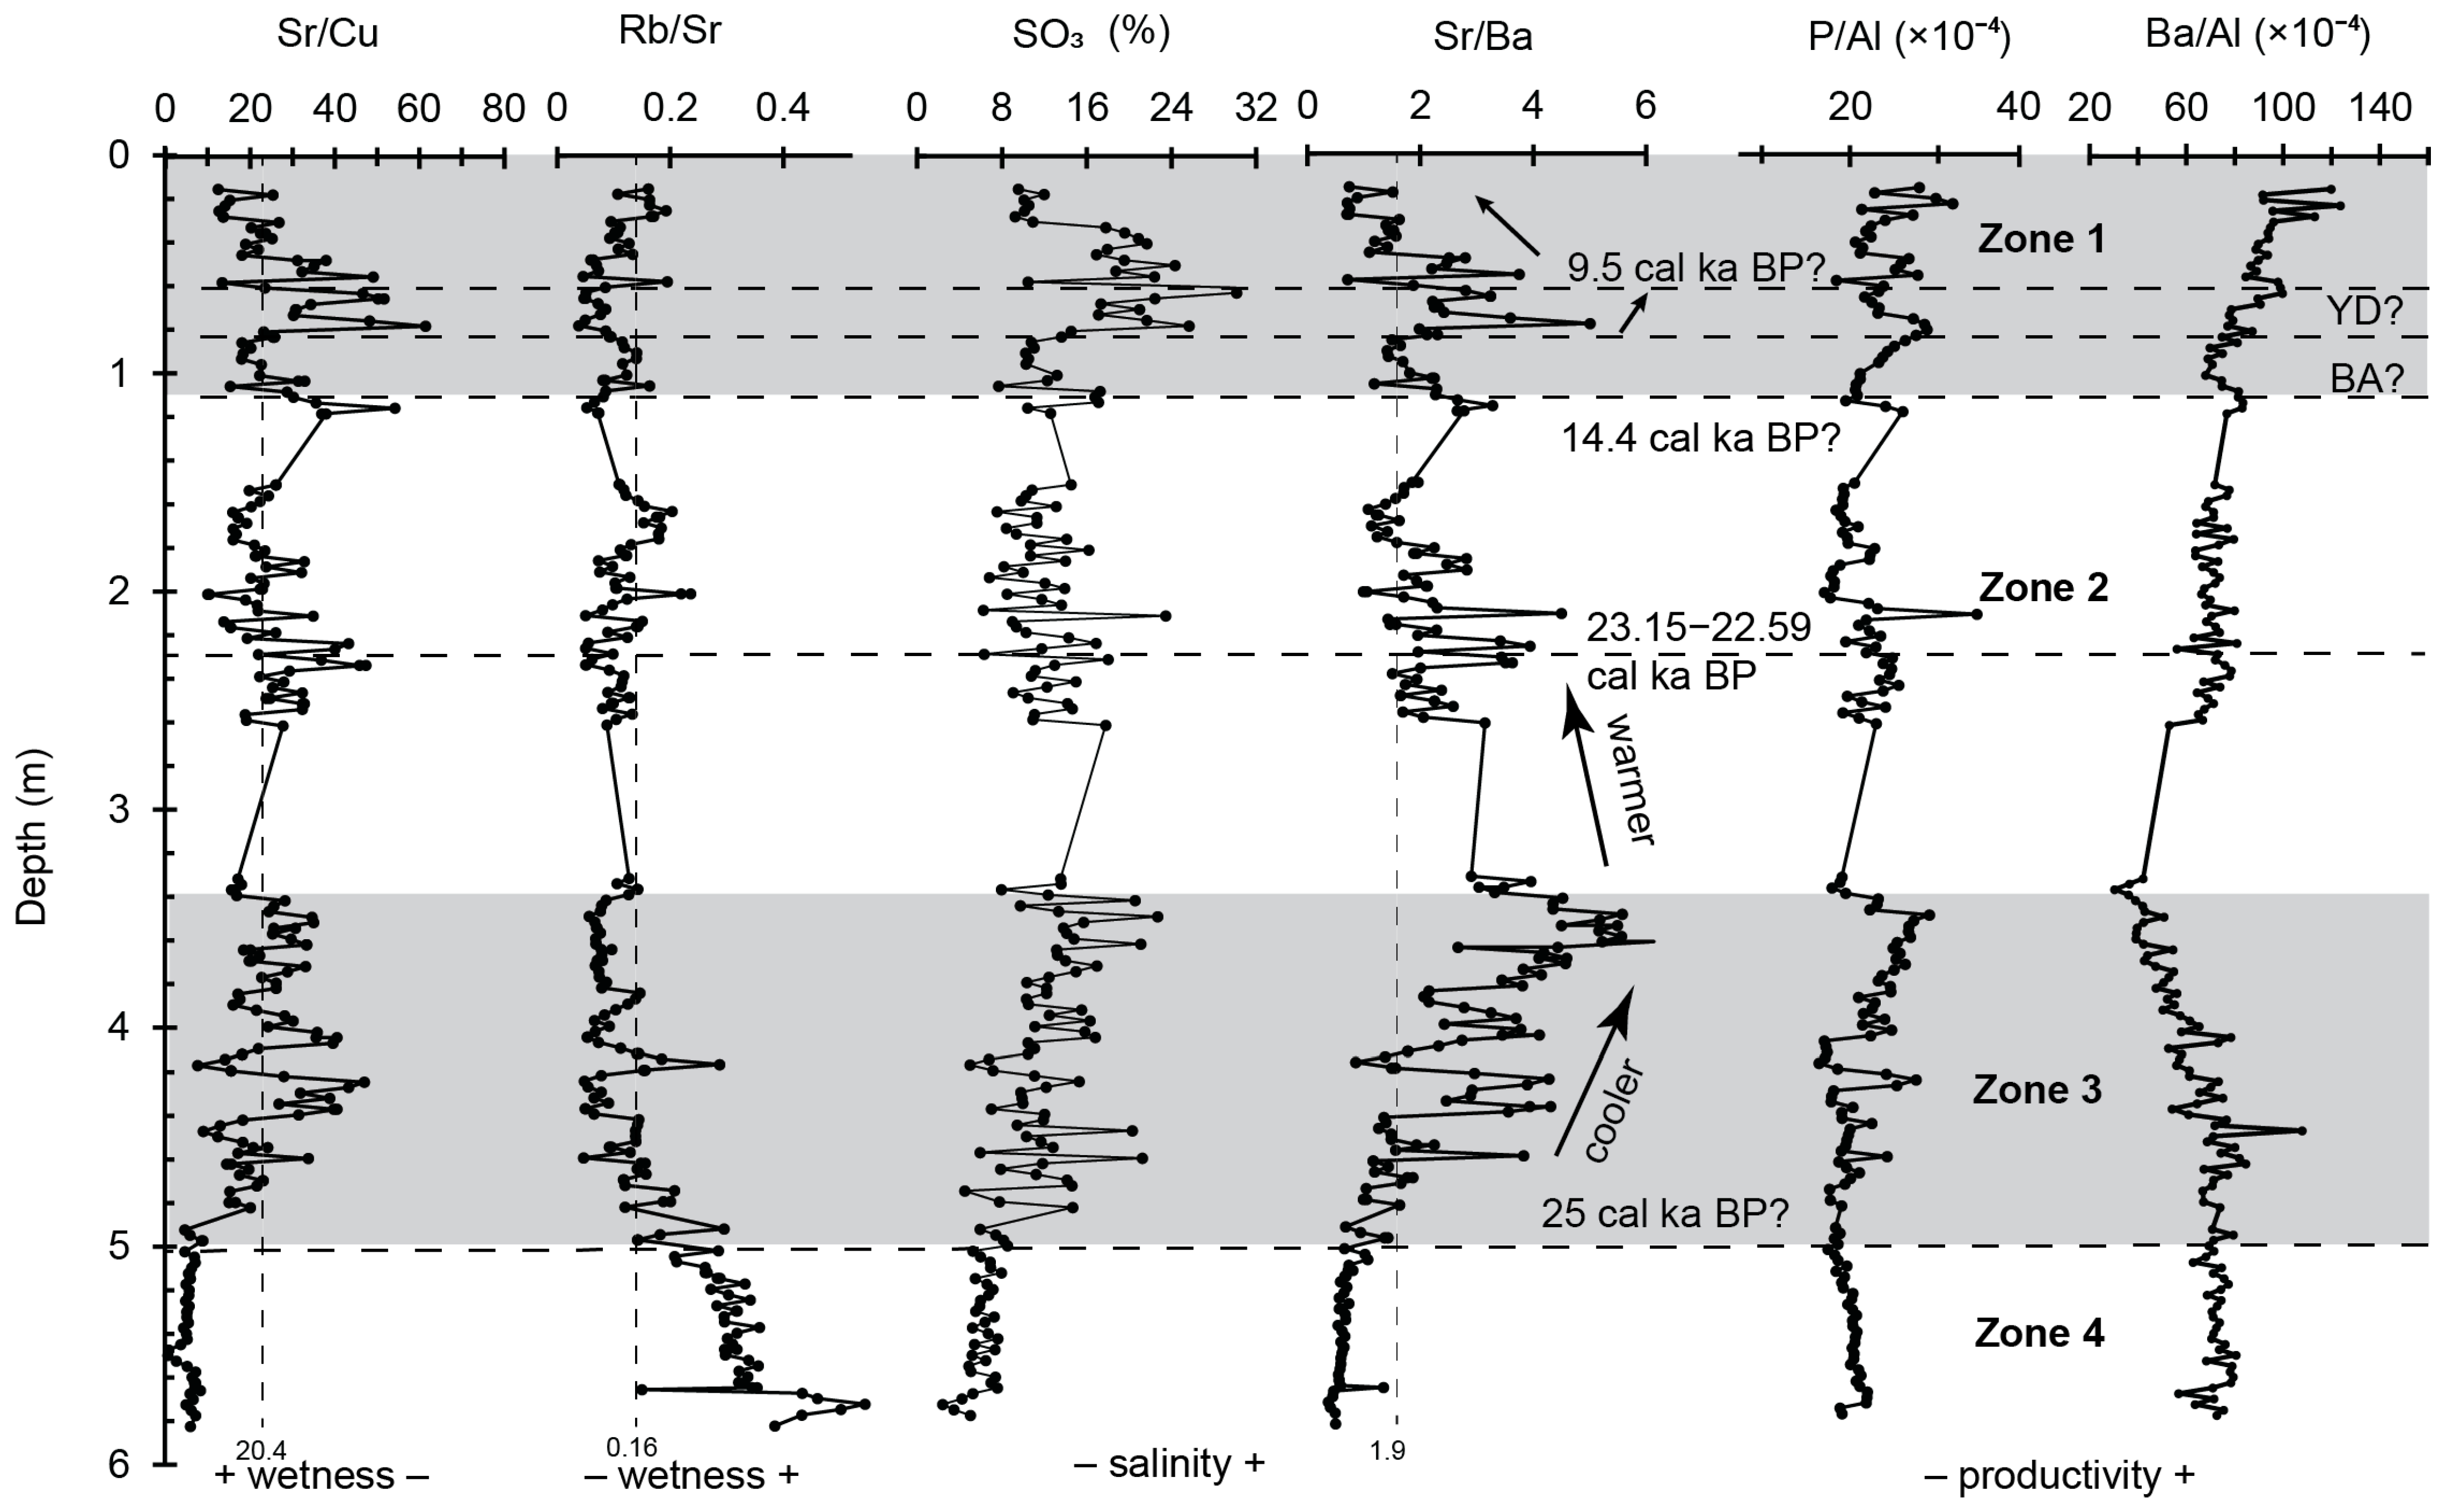
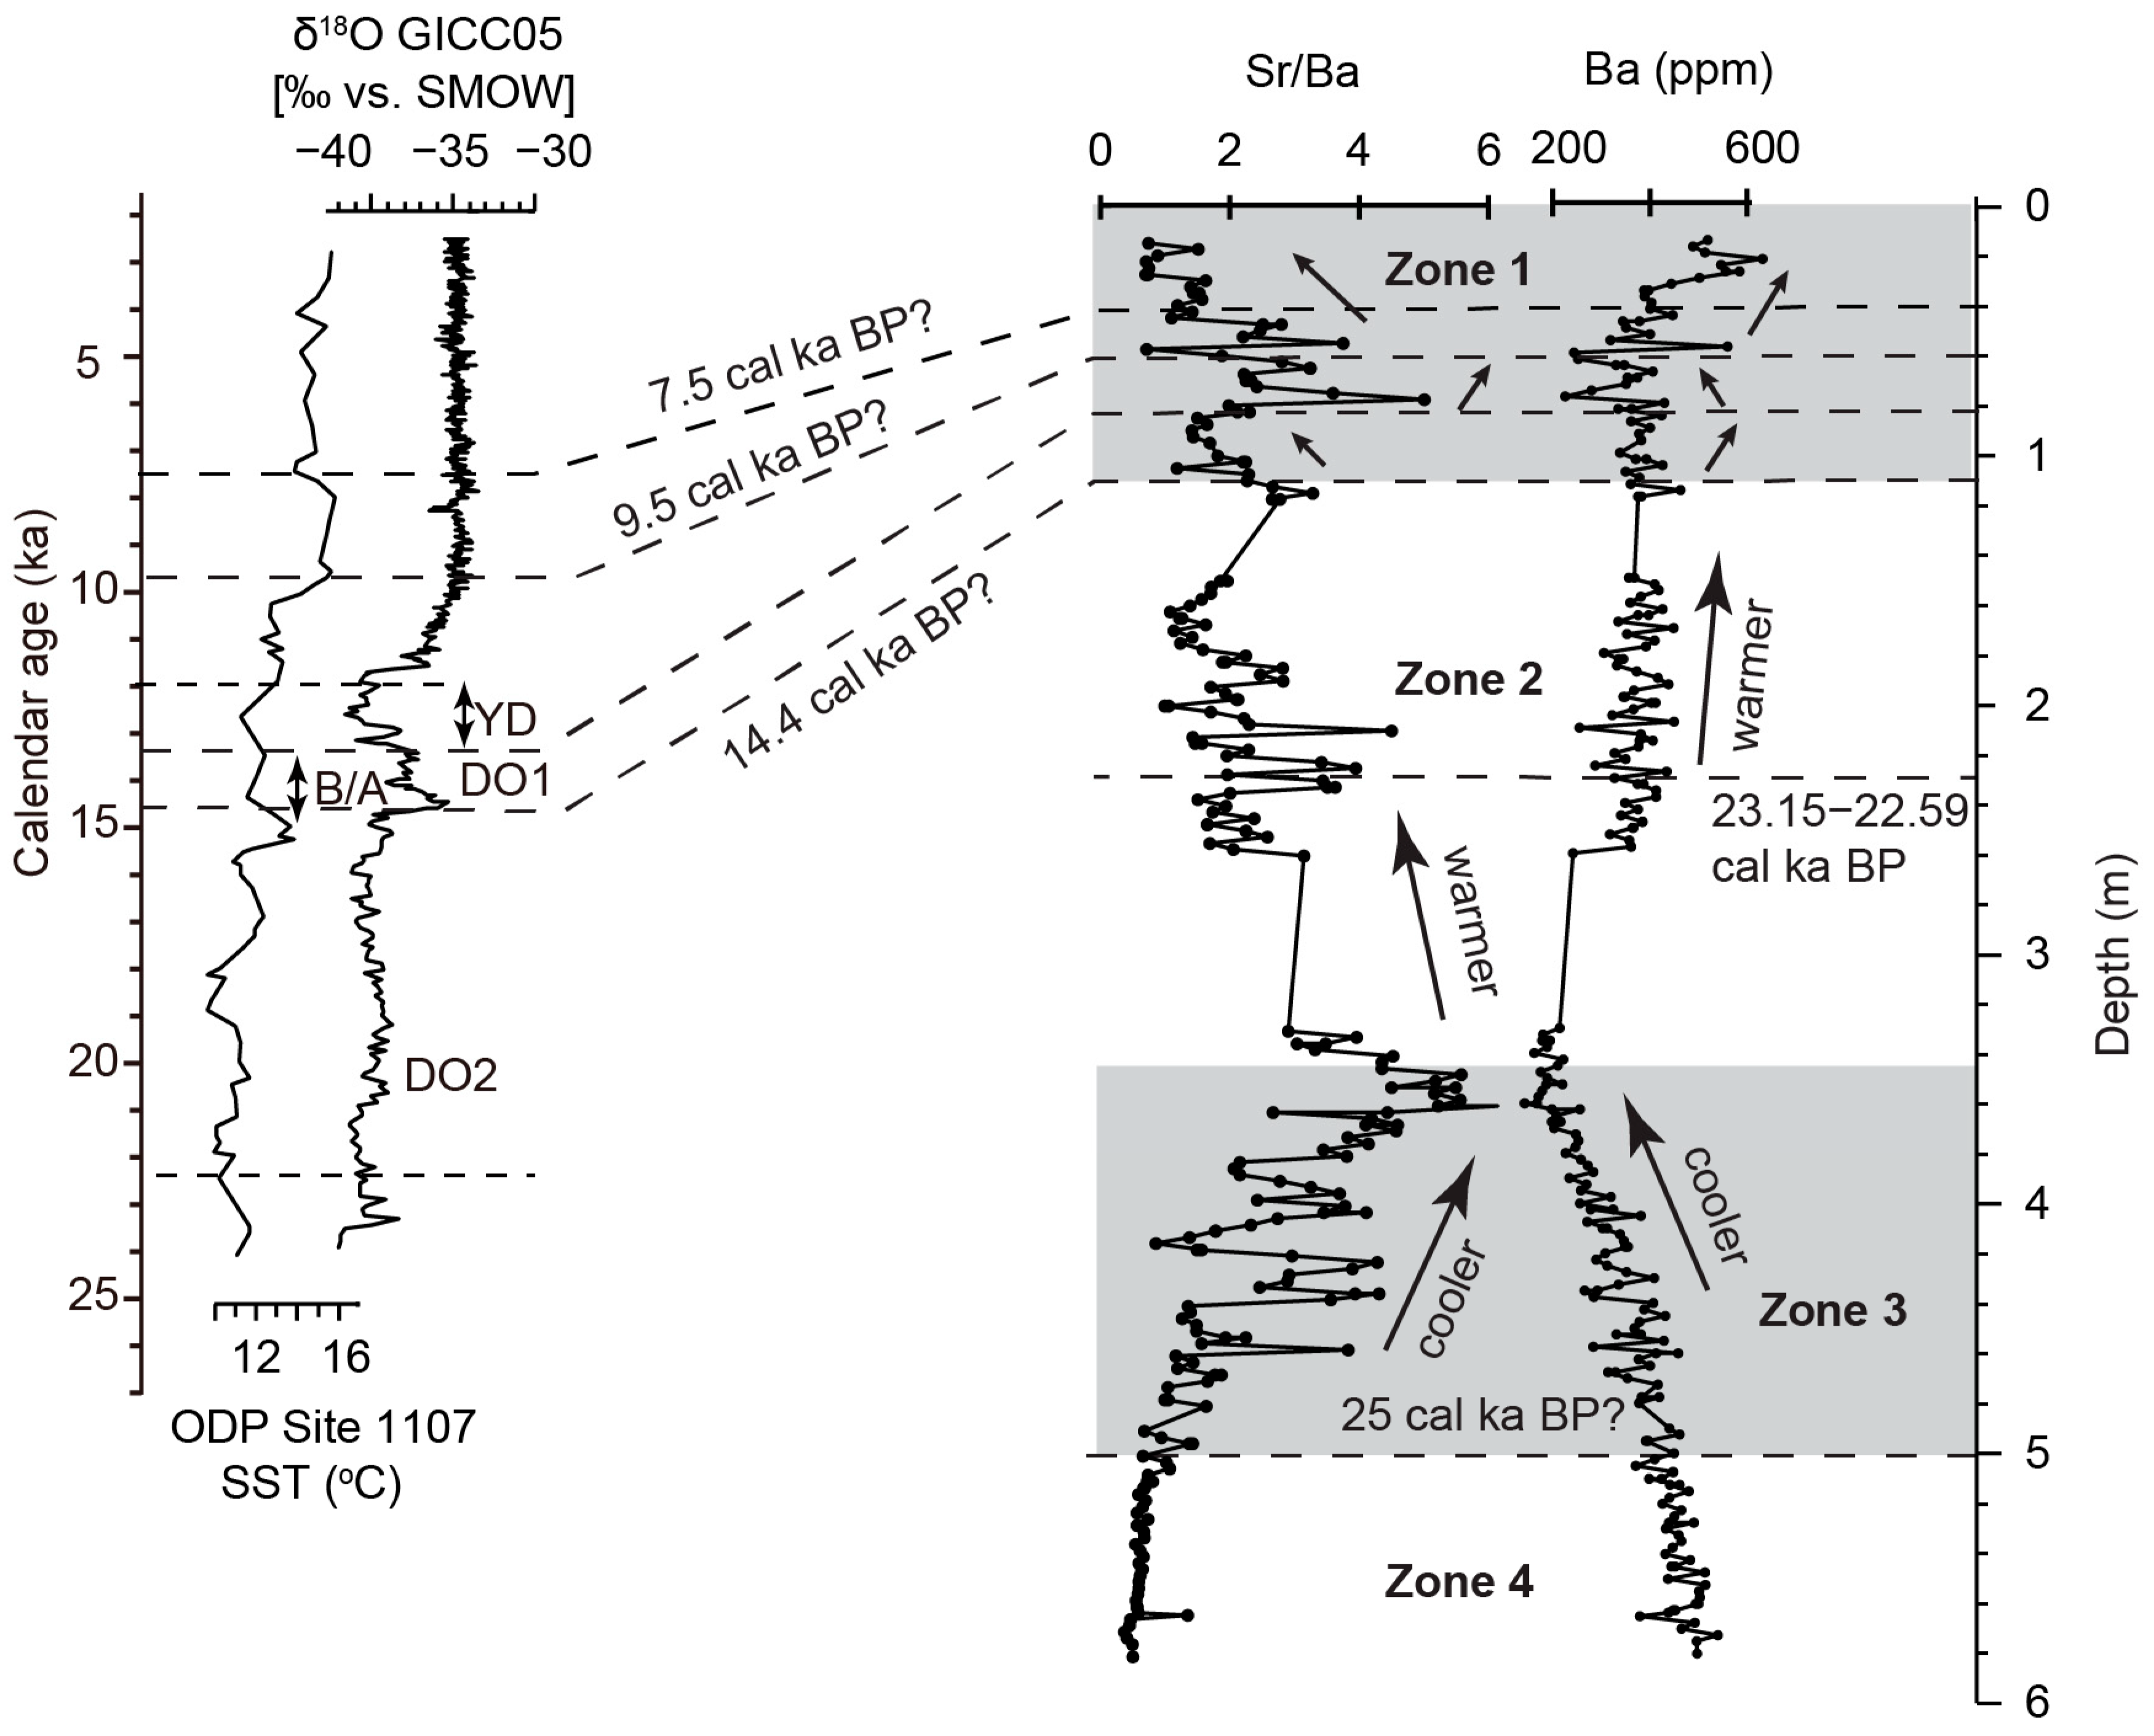
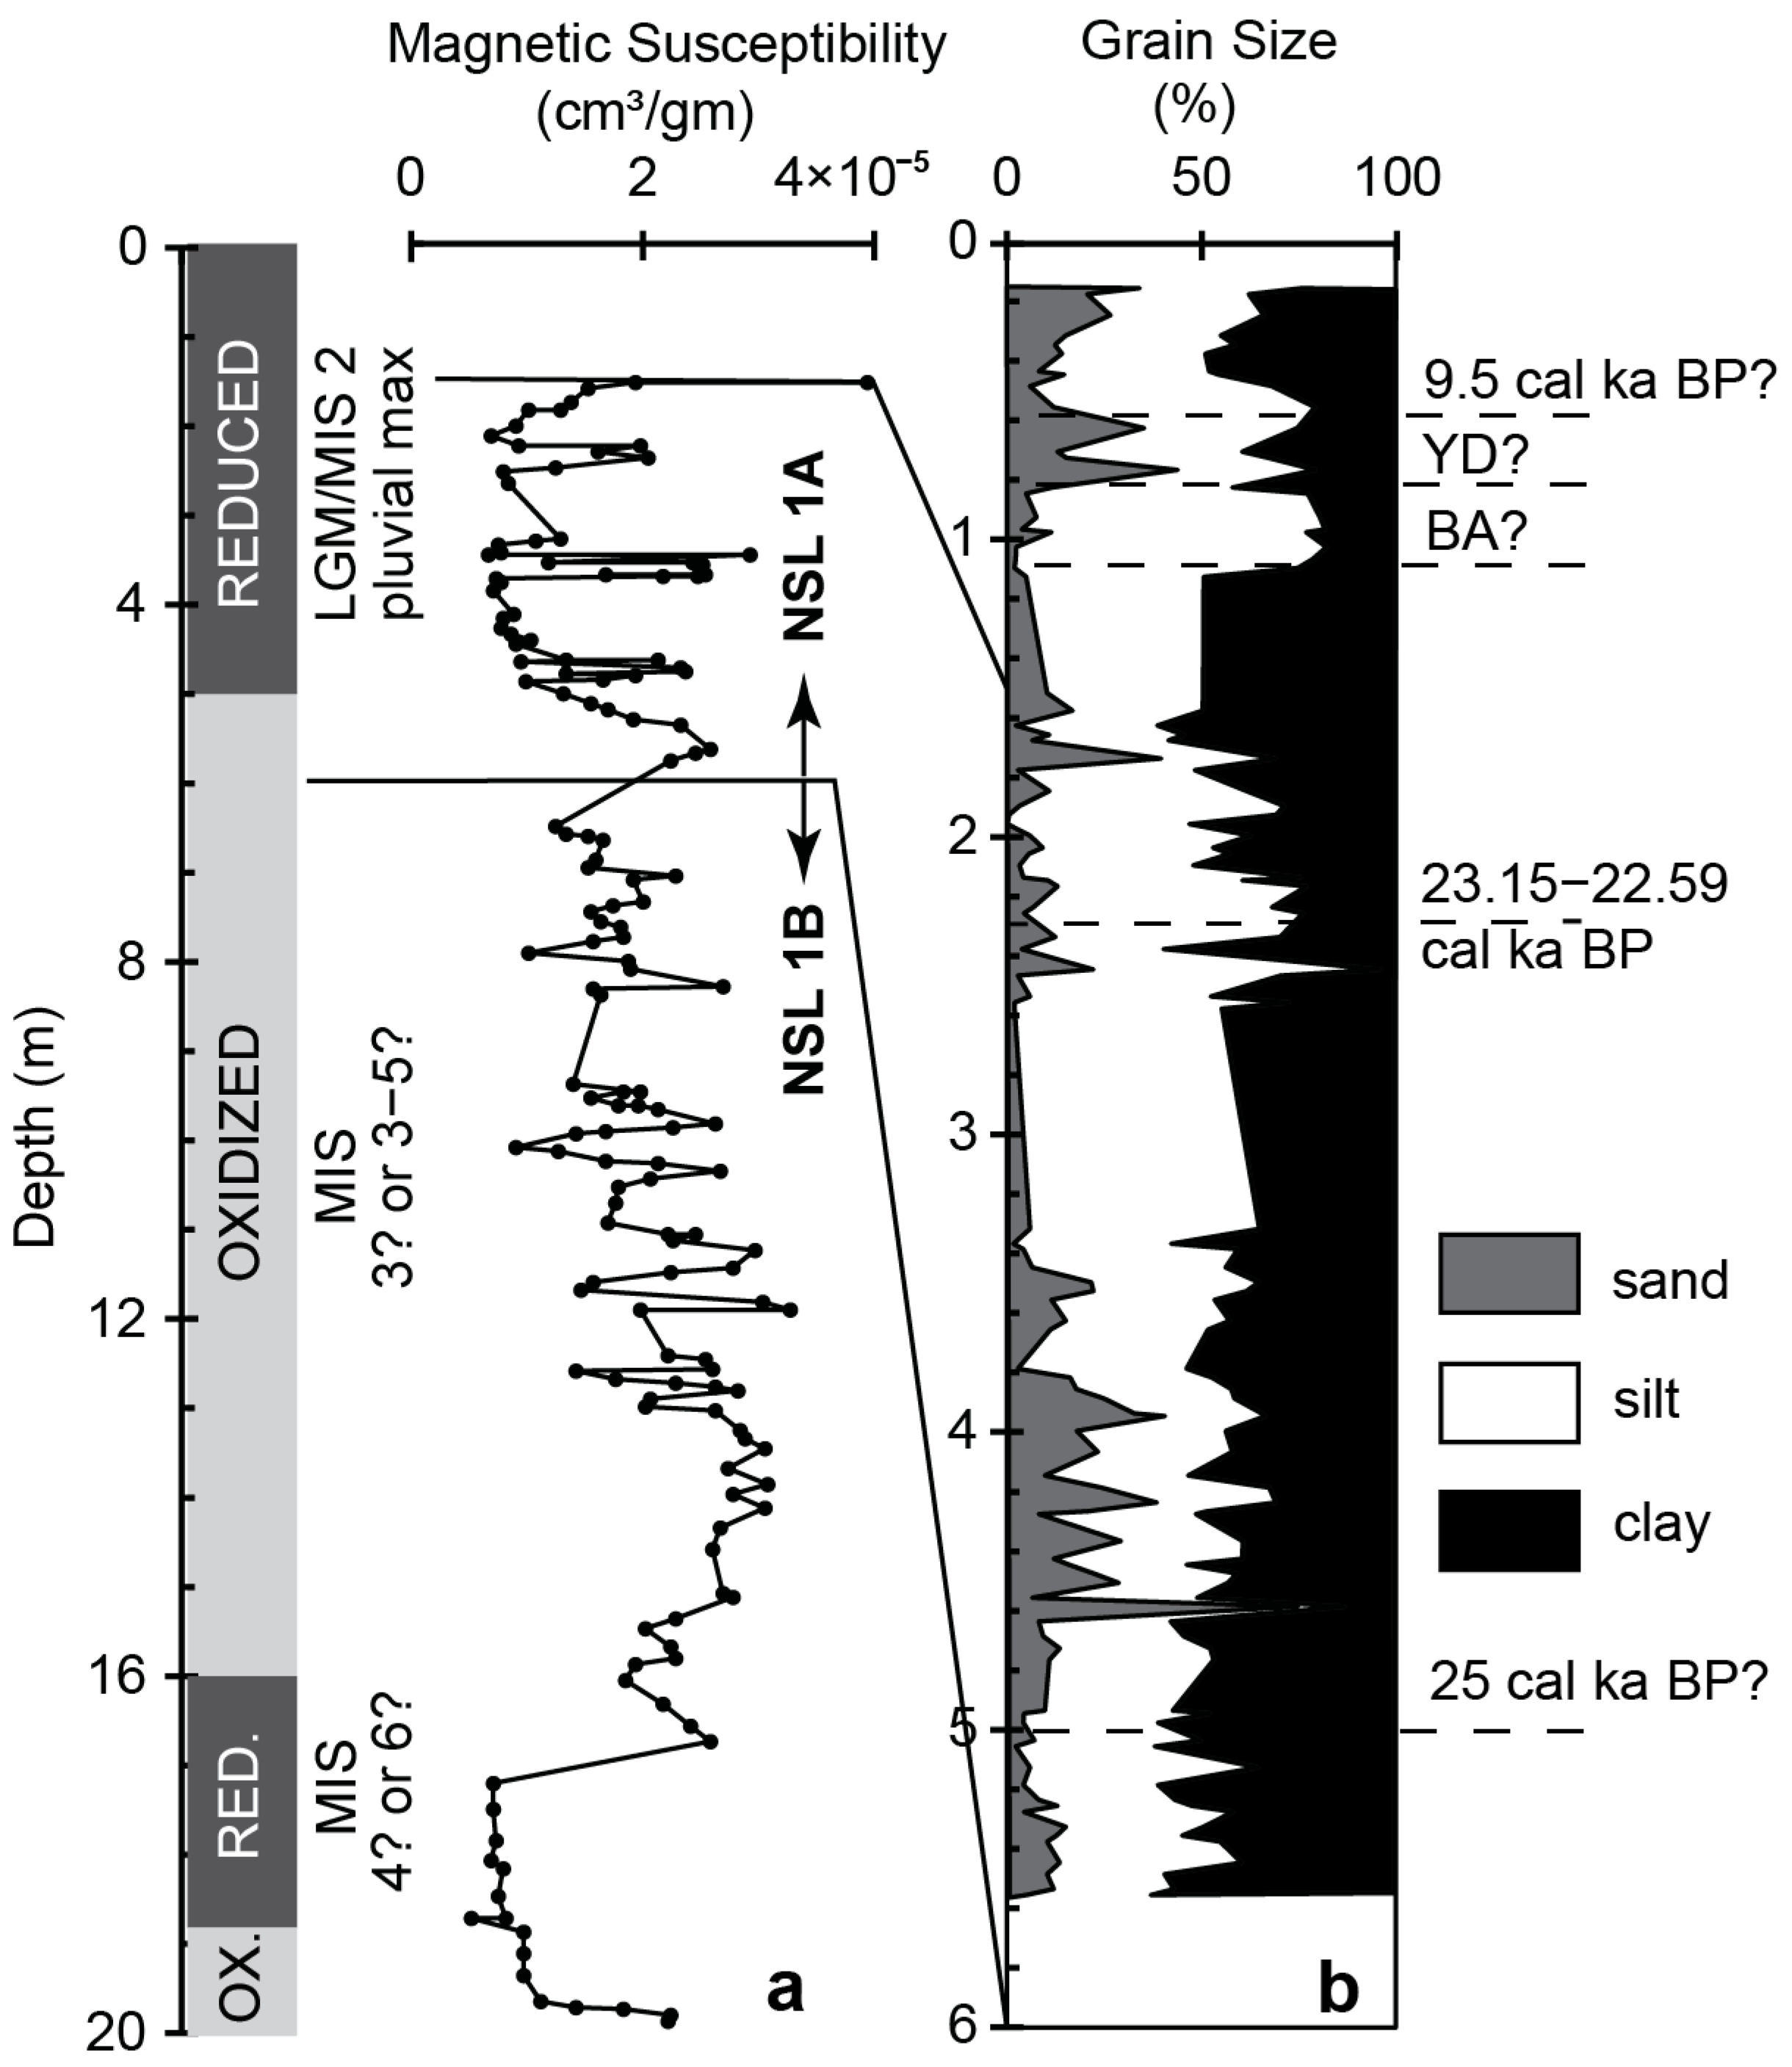
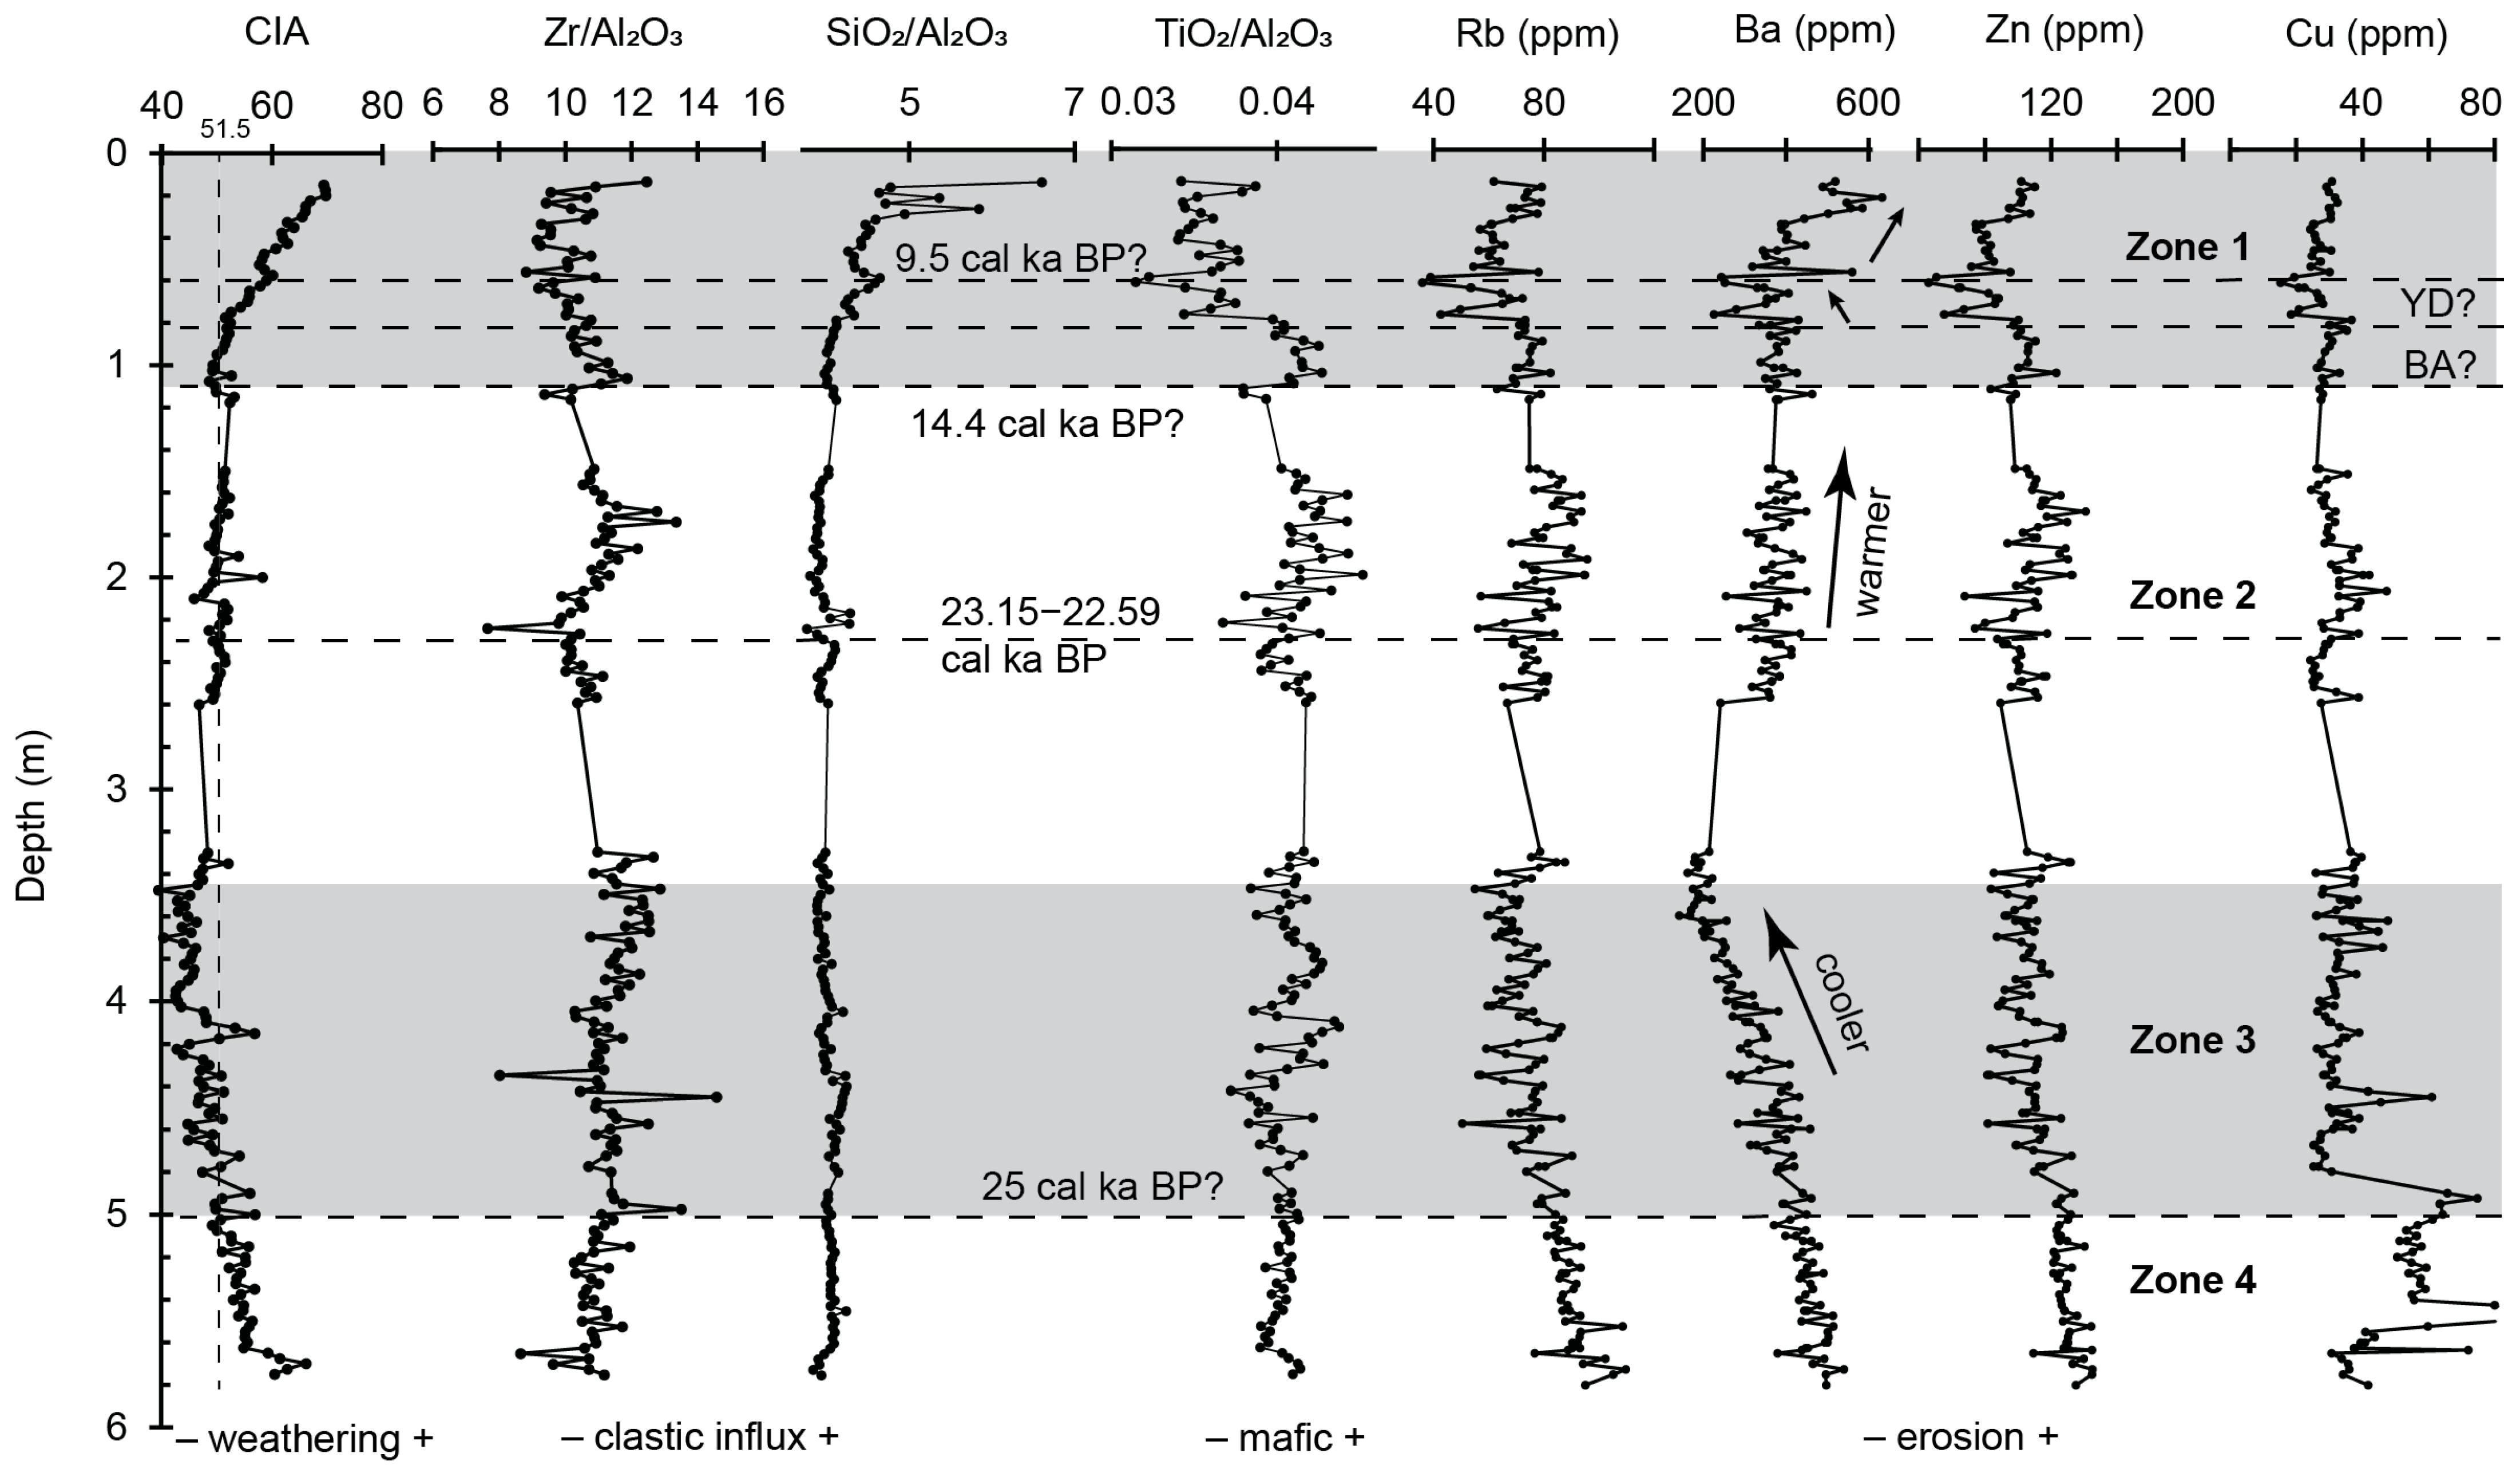
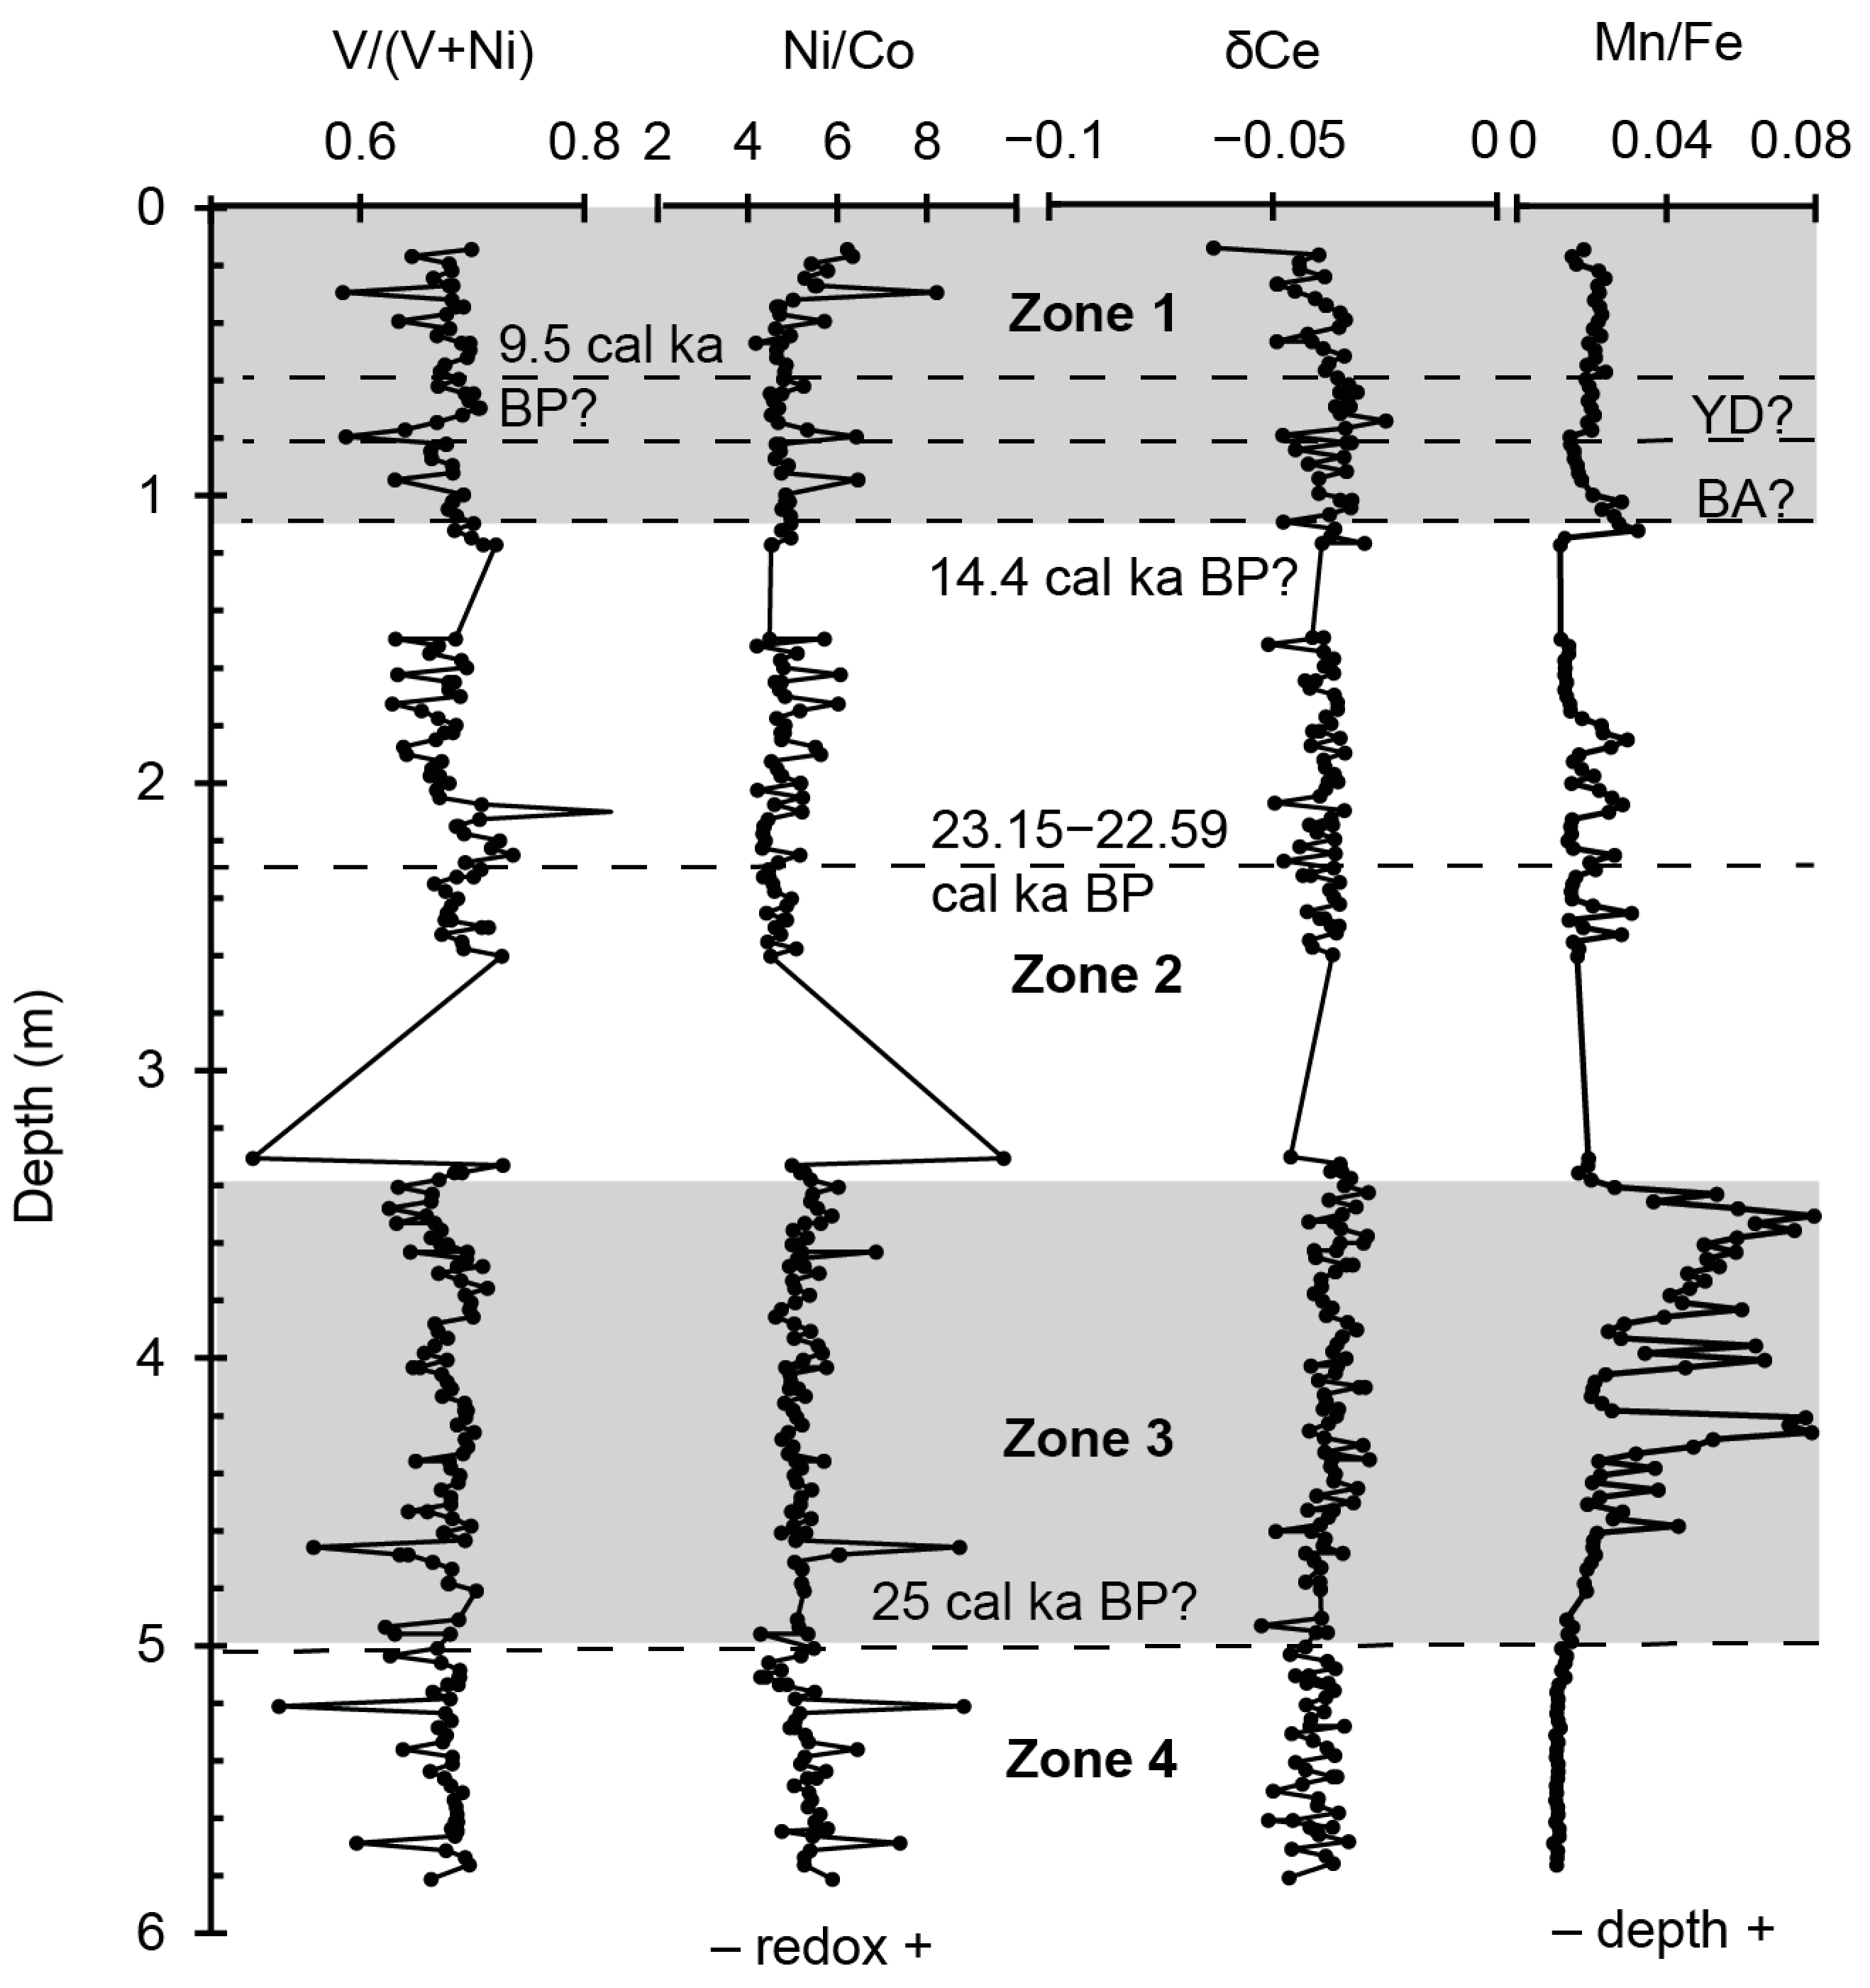
- Zone 4 (5.0–5.8 m) of the sediment core indicates stable hydroclimatic conditions with low and constant sand and silt content, suggesting a warm and relatively humid environment. This zone corresponds to the regional glacial megadrought (27.6–25.7 cal ka BP), showing moderate weathering, low salinities, and a relatively fresh, shallow, unstratified lake water environment.
- Zone 3 (3.35–5.0 m) represents the early half of the LGM interval and a high lake stand. Characterized by increasing sand and silt content, rising salinity, and reduced wetness and trace element abundances, this zone reflects low weathering conditions, leading to decreased erosion and trace element inflow into the lake. The elevated sand content suggests postflood events due to the northerly migration of westerly storm tracks.
- Zone 2 (1.075–3.35 m) reveals nuanced changes and demonstrates a gradual decrease in salinity and a relatively higher CIA, indicating a slowly warming climate. The lower section (2–3.35 m) represents the latter half of the LGM interval and shows a stable high lake stand, evident from low sand content and constant detrital trace metal abundances. The upper section (1.075–2 m) corresponds to Heinrich Stadial 1 (17.5–15 cal ka BP), a generally cooler period in the Northern Hemisphere.
- Zone 1 (0.15–1.075 m) spans the Lateglacial to Holocene transition as well as Early and Middle Holocene, marked by significant hydrologic and ecologic variability including rapid warming during the BA to rapid cooling associated with the YD. Around 9.5 cal ka BP, an intermediate stand occurred at a depth of 0.825 m, indicating reduced precipitation-related runoff and a shift to a shallow, low-energy lake environment due to weakening hydroclimatic dynamics. Further up core, lake records indicate a warmer Early and Middle Holocene climate.
Supplementary Materials
Author Contributions
Funding
Data Availability Statement
Acknowledgments
Conflicts of Interest
References
- Oster, J.L.; Ibarra, D.E.; Winnick, M.J.; Maher, K. Steering of westerly storms over western North America at the Last Glacial Maximum. Nat. Geosci. 2015, 8, 201–205. [Google Scholar] [CrossRef]
- Seager, R.; Vecchi, G.A. Greenhouse warming and the 21st-century hydroclimate of southwestern North America. Proc. Natl. Acad. Sci. USA 2010, 107, 21277–21282. [Google Scholar] [CrossRef] [PubMed]
- Ding, Z.L.; Yang, S.L.; Sun, J.M.; Liu, T.S. Iron geochemistry of loess and red clay deposits in the Chinese Loess Plateau and implications for long-term Asian monsoon evolution in the last 7.0 Ma. Earth Planet. Sci. Lett. 2001, 185, 99–109. [Google Scholar] [CrossRef]
- Gallet, S.; Jahn, B.-M.; Torii, M. Geochemical characterization of the Luochuan loess-paleosol sequence, China, and paleoclimatic implications. Chem. Geol. 1996, 133, 67–88. [Google Scholar] [CrossRef]
- Shilling, A.S.; Colcord, D.E.; Karty, J.; Hansen, A.; Freeman, K.H.; Njau, J.K.; Stanistreet, I.G.; Stollhofen, H.; Schick, K.D.; Toth, N.; et al. Biogeochemical evidence from OGCP Core 2A sediments for environmental changes preceding deposition of Tuff IB and climate transitions in Upper Bed I of the Olduvai Basin. Palaeogeogr. Palaeoclimatol. Palaeoecol. 2020, 555, 109824. [Google Scholar] [CrossRef]
- Wang, C.; Bendle, J.A.; Zhang, H.; Yang, Y.; Liu, D.; Huang, J.; Cui, J.; Xie, S. Holocene temperature and hydrological changes reconstructed by bacterial 3-hydroxy fatty acids in a stalagmite from central China. Quat. Sci. Rev. 2018, 192, 97–105. [Google Scholar] [CrossRef]
- Anderson, R.S. Holocene forest development and paleoclimates within the central Sierra Nevada, California. J. Ecol. 1990, 78, 470–489. [Google Scholar] [CrossRef]
- Anderson, R.S.; Smith, S.J. Late Wisconsin paleoecologic record from Swamp Lake, Yosemite National Park, California. Quat. Res. 1992, 38, 91–102. [Google Scholar]
- Anderson, R.S.; Smith, S.J. Paleoclimatic interpretations of meadow sediment and pollen stratigraphies from California. Geology 1994, 22, 723–726. [Google Scholar] [CrossRef]
- Brunelle, A.; Anderson, R.S. Sedimentary charcoal as an indicator of late Holocene drought in the Sierra Nevada, California, and its relevance to the future. Holocene 2003, 13, 21–28. [Google Scholar] [CrossRef]
- Koehler, P.A.; Anderson, R.S. Thirty thousand years of vegetation changes in the Alabama Hills, Owens Valley, California. Quat. Res. 1995, 43, 238–248. [Google Scholar] [CrossRef]
- Mensing, S.A. Late-glacial and early Holocene vegetation and climate change near Owens Lake, eastern California. Quat. Res. 2001, 55, 57–65. [Google Scholar] [CrossRef]
- Oster, J.L.; Montañez, I.P.; Sharp, W.D.; Cooper, K.M. Late Pleistocene California droughts during deglaciation and Arctic warming. Earth Planet. Sci. Lett. 2009, 288, 434–443. [Google Scholar] [CrossRef]
- Bird, B.W.; Kirby, M.E. An alpine lacustrine record of early Holocene North American Monsoon dynamics from Dry Lake, southern California (USA). J. Paleolimnol. 2006, 35, 179–192. [Google Scholar] [CrossRef]
- Filippelli, G.M.; Souch, C. Effects of climate and landscape development on the terrestrial phosphorus cycle. Geology 1999, 27, 171–174. [Google Scholar] [CrossRef]
- Filippelli, G.M.; Carnahan, J.W.; Derry, L.A.; Kurtz, A. Terrestrial paleorecords of Ge/Si cycling derived from lake diatoms. Chem. Geol. 2000, 168, 9–26. [Google Scholar] [CrossRef]
- Kirby, M.E.; Lund, S.P.; Poulsen, C.J. Hydrologic variability and the onset of modern El Niño-Southern Oscillation: A 19250-year record from Lake Elsinore, southern California. J. Quat. Sci. 2005, 20, 239–254. [Google Scholar] [CrossRef]
- Kirby, M.E.; Lund, S.P.; Anderson, M.A.; Bird, B.W. Insolation forcing of Holocene climate change in Southern California: A sediment study from Lake Elsinore. J. Paleolimnol. 2007, 38, 395–417. [Google Scholar] [CrossRef]
- Kirby, M.E.; Feakins, S.J.; Bonuso, N.; Fantozzi, J.M.; Hiner, C.A. Latest Pleistocene to Holocene hydroclimates from Lake Elsinore, California. Quat. Sci. Rev. 2013, 76, 1–15. [Google Scholar] [CrossRef]
- Kirby, M.E.; Heusser, L.; Scholz, C.; Ramezan, R.; Anderson, M.A.; Markle, B.; Rhodes, E.; Glover, K.C.; Fantozzi, J.; Hiner, C.; et al. A late Wisconsin (32–10k cal a BP) history of pluvials, droughts, and vegetation in the Pacific southwest United States (Lake Elsinore, CA). J. Quat. Sci. 2018, 33, 238–254. [Google Scholar] [CrossRef]
- Davis, O.K. Rapid climatic change in coastal southern California inferred from pollen analysis of San Joaquin Marsh. Quat. Res. 1992, 37, 89–100. [Google Scholar] [CrossRef]
- Blunt, A.; Negrini, R.M. Lake levels for the past 19,000 years from the TL05-4 cores, Tulare Lake, California, USA: Geophysical and geochemical proxies. Quat. Int. 2015, 387, 122–130. [Google Scholar] [CrossRef]
- Negrini, R.M.; Wigand, P.E.; Draucker, S.; Gobalet, K.; Gardner, J.K.; Sutton, M.Q.; Yohe, R.M. The Rambla highstand shoreline and the Holocene lake level history of Tulare Lake, California, USA. Quat. Sci. Rev. 2006, 25, 1599–1618. [Google Scholar] [CrossRef]
- Bacon, S.N.; Burke, R.M.; Pezzopane, S.K.; Jayko, A.S. Last glacial maximum and Holocene lake levels of Owens Lake, eastern California, USA. Quat. Sci. Rev. 2006, 25, 1264–1282. [Google Scholar] [CrossRef]
- Kirby, M.E.; Knell, E.J.; Anderson, W.T.; Lachniet, M.S.; Palermo, J.; Eeg, H.; Hiner, C.A. Evidence for insolation and Pacific forcing of late glacial through Holocene climate in the Central Mojave Desert (Silver Lake, CA). Quat. Res. 2015, 84, 174–186. [Google Scholar] [CrossRef]
- Wells, S.G.; Brown, W.J.; Enzel, Y.; Anderson, R.Y.; McFadden, L.D. Late Quaternary geology and paleohydrology of pluvial Lake Mojave, Southern California. In Paleoenvironments and Paleohydrology of the Mojave and Southern Great Basin Deserts; Enzel, Y., Lancaster, N., Eds.; Geological Society of America: Boulder, CO, USA, 2003; Volume 368, pp. 79–114. [Google Scholar]
- Anderson, L.A.; Berkelhammer, M.; Barron, J.A.; Steinman, B.A.; Finney, B.P.; Abbott, M.B. Lake oxygen isotopes as recorders of North American Rocky Mountain hydroclimate: Holocene patterns and variability at multidecadal to millennial timescales. Glob. Planet. Change 2016, 137, 131–148. [Google Scholar] [CrossRef]
- Benson, L. Records of millennial-scale climate change from the Great Basin of the western United States. In Mechanisms of Global Climate Change at Millennial Time Scales; Clark, P.U., Webb, R.S., Keigwin, L.D., Eds.; American Geophysical Union: Washington, DC, USA, 1999; Volume 112, pp. 203–225. [Google Scholar]
- Birks, H.H.; Birks, H.J.B. Multi-proxy studies in palaeolimnology. Veg. Hist. Archaeobot. 2006, 15, 235–251. [Google Scholar] [CrossRef]
- Kirby, M.E.; Lund, S.P.; Bird, B.W. Mid-Wisconsin sediment record from Baldwin Lake reveals hemispheric climate dynamics (Southern CA, USA). Palaeogeogr. Palaeoclimatol. Palaeoecol. 2006, 241, 267–283. [Google Scholar] [CrossRef]
- Kirby, M.E.; Zimmerman, S.R.H.; Patterson, W.P.; Rivera, J.J. A 9170-year record of decadal-to-multi-centennial scale pluvial episodes from the coastal Southwest United States: A role for atmospheric rivers? Quat. Sci. Rev. 2012, 46, 57–65. [Google Scholar] [CrossRef]
- Noble, P.J.; Ball, G.I.; Zimmerman, S.H.; Maloney, J.; Smith, S.B.; Kent, G.; Driscoll, N. Holocene paleoclimate history of Fallen Leaf Lake, Ca., from geochemistry and sedimentology of well-dated sediment cores. Quat. Sci. Rev. 2016, 131, 193–210. [Google Scholar] [CrossRef]
- Reheis, M.C.; Miller, D.M.; McGeehin, J.P.; Redwine, J.R.; Oviatt, C.G.; Bright, J. Directly dated MIS3 lake-level record from Lake Manix, Mojave Desert, California, USA. Quat. Res. 2015, 83, 187–203. [Google Scholar] [CrossRef]
- Street, J.H.; Anderson, R.S.; Paytan, A. An organic geochemical record of Sierra Nevada climates since the LGM from Swamp Lake, Yosemite. Quat. Sci. Rev. 2012, 40, 89–106. [Google Scholar] [CrossRef]
- Glover, K.C.; Chaney, A.; Kirby, M.E.; Patterson, W.P.; MacDonald, G.M. Southern California vegetation, wildfire, and erosion had nonlinear responses to climatic forcing during marine isotope stages 5–2 (120–15 ka). Paleoceanogr. Paleoclimatol. 2020, 35, e2019PA003628. [Google Scholar] [CrossRef]
- Rhodes, D.D.; Negrini, R.M.; Arrowsmith, J.R.; Wigand, P.E.; Forman, S.L.; Palacios-Fest, M.R.; Davis, O.K. Geomorphic and sedimentologic evidence for pluvial Lake Carrizo, San Luis Obispo County, California. In From Saline to Freshwater: The Diversity of Western Lakes in Space and Time; Starratt, S.T., Rosen, M.R., Eds.; Geological Society of America: Boulder, CO, USA, 2021; Volume 536, pp. 289–317. [Google Scholar]
- Stephenson, R.K. Lithostratigraphic Record of North Soda Lake, Carrizo Plain, San Luis Obispo County, California: Implications for Late Pleistocene Paleoclimate in a Closed Hypersaline Lake Basin. Master’s Thesis, California State University of Bakersfield, Bakersfield, CA, USA, 2013. [Google Scholar]
- Eigenbrode, J.L. Sedimentological, Carbon-Isotopic, and Molecular Records of Late Holocene Climate in the Sediments of Soda Lake, Carrizo Plain, California. Master’s Thesis, Indiana University, Bloomington, IN, USA, 1999. [Google Scholar]
- Hill, M.L.; Dibblee, T.W. San Andreas, Garlock, and Big Pine faults, California: A study of the character, history, and tectonic significance of their displacements. Geol. Soc. Am. Bull. 1953, 64, 443–458. [Google Scholar] [CrossRef]
- Dibblee, T.W. Displacements on the San Andreas rift zone and related structures in Carrizo Plain and vicinity. In Guidebook: Geology of Carrizo Plains and San Andreas Fault; Hackell, O., Dibblee, T.W., Jr., Hudson, F.S., White, G.H., Simonson, R.R., Fletcher, G.L., Wells, R.J., Graff, L.B., Hall, C.A., Jr., Christiensen, E.W., Eds.; San Joaquin Geological Society: Bakersfield, CA, USA; Pacific Section, AAPG: Bakersfield, CA, USA; SEPM: Tulsa, OK, USA, 1962; pp. 5–12. [Google Scholar]
- Crowell, J.C. San Andreas Fault in Southern California: A Guide to San Andreas Fault from Mexico to Carrizo Plain; Division of Mines and Geology: Sacramento, CA, USA, 1975; 272p. [Google Scholar]
- Galehouse, J.S. Provenance and Paleocurrents of the Paso Robles Formation, California. Geol. Soc. Am. Bull. 1967, 78, 951–958. [Google Scholar] [CrossRef]
- Rosen, M.R. The importance of groundwater in playas: A review of playa classifications and the sedimentology and hydrology of playas. In Paleoclimate and Basin Evolution of Playa Systems; Rosen, M., Ed.; Geology Society of America: Boulder, CO, USA, 1994; Volume 289, pp. 1–18. [Google Scholar]
- Rodriguez, A. Paleoenvironmental Study Based on North Soda Lake Sediments, San Luis Obispo County, California: Results of Mineralogical, Grain Size, and Geochemical Analyses. Master’s Thesis, California State University of Bakersfield, Bakersfield, CA, USA, 2020. [Google Scholar]
- Watanabe, M. Sample preparation for X-ray fluorescence analysis IV. Fusion bead method—Part 1 basic principals. Rigaku J. 2015, 12, 12–17. [Google Scholar]
- Henderson, P. General geochemical properties and abundances of the rare earth elements. In Developments in Geochemistry; Henderson, P., Ed.; Department of Mineralogy, British Museum (Natural History): London, UK, 1984; Volume 2, pp. 1–32. [Google Scholar]
- Boynton, W.V. Cosmochemistry of the rare earth elements: Meteorite Studies. In Developments in Geochemistry; Henderson, P., Ed.; Department of Mineralogy, British Museum (Natural History): London, UK, 1984; Volume 2, pp. 63–114. [Google Scholar]
- Pettijohn, F.J.; Potter, P.E.; Siever, R. Sand and Sandstone; Springer: New York, NY, USA, 1987; 553p. [Google Scholar]
- Herron, M.M. Geochemical Classification of Terrigenous Sands and Shales from Core or Log Data. J. Sediment. Res. 1988, 58, 820–829. [Google Scholar]
- Fedo, C.M.; Nesbitt, H.W.; Young, G.M. Unraveling the effects of K metasomatism in sedimentary rocks and paleosols with implications for paleo-weathering conditions and provenance. Geology 1995, 23, 921–924. [Google Scholar] [CrossRef]
- Nesbitt, H.W.; Young, G.M. Early Proterozoic Climates and Plate Motions Inferred from Major Element Chemistry of Lutites. Nature 1982, 299, 715–717. [Google Scholar] [CrossRef]
- McLennan, S.M.; Hemming, S.; McDaniel, D.K.; Hanson, G.N. Geochemical approaches to sedimentation, provenance, and tectonics. In Processes Controlling the Composition of Clastic Sediments; Johnsson, M.J., Basu, A., Eds.; Geological Society of America: Boulder, CO, USA, 1993; Volume 284, pp. 21–40. [Google Scholar]
- Jeong, G.Y.; Choi, J.H.; Lim, H.S.; Seong, C.; Yi, S.B. Deposition and weathering of Asian dust in Paleolithic sites, Korea. Quat. Sci. Rev. 2013, 78, 283–300. [Google Scholar] [CrossRef]
- Chang, H.; An, Z.S.; Wu, F.; Jin, Z.D.; Liu, W.G.; Song, Y.G. A Rb/Sr record of the weathering response to environmental changes in westerly winds across the Tarim Basin in the late Miocene to the early Pleistocene. Palaeogeogr. Palaeoclimatol. Palaeoecol. 2013, 386, 364–373. [Google Scholar] [CrossRef]
- Zou, C.; Mao, L.; Tan, Z.; Zhou, L.; Liu, L. Geochemistry of major and trace elements in sediments from the Lubei Plain, China: Constraints for paleoclimate, paleosalinity, and paleoredox environment. J. Asian Earth Sci. X 2021, 6, 100071. [Google Scholar] [CrossRef]
- Lerman, A. Lakes: Chemistry, Geology, Physics; Springer Press: Berlin/Heidelberg, Germany, 1978; 366p. [Google Scholar]
- Meng, Q.T.; Liu, Z.J.; Bruch, A.A.; Liu, R.; Hu, F. Palaeoclimatic evolution during Eocene and its influence on oil shale mineralization, Fushun basin, China. J. Asian Earth Sci. 2012, 45, 95–105. [Google Scholar] [CrossRef]
- Cao, H.S.; Guo, W.; Shan, X.L.; Ma, L.; Sun, P.C. Paleolimnological environments and organic accumulation of the Nenjiang Formation in the southeastern Songliao Basin, China. Oil Shale 2015, 32, 5–24. [Google Scholar] [CrossRef]
- Wang, Z.W.; Wang, J.; Fu, X.G.; Zhan, W.Z.; Armstrong-Altrin, J.S.; Yu, F.; Feng, X.L.; Song, C.Y.; Zeng, S.Q. Geochemistry of the Upper Triassic black mudstones in the Qiangtang Basin, Tibet: Implications for paleoenvironment, provenance, and tectonic setting. J. Asian Earth Sci. 2018, 160, 118–135. [Google Scholar] [CrossRef]
- Wang, Z.W.; Yu, F.; Wang, J.; Fu, X.G.; Chen, W.B.; Zeng, S.Q.; Song, C.Y. Palaeoenvironment evolution and organic matter accumulation of the Upper Triassic mudstones from the eastern Qiangtang Basin (Tibet), eastern Tethys. Mar. Pet. Geol. 2021, 130, 105133. [Google Scholar] [CrossRef]
- Janz, T.; Vennemann, T.W. Isotopic composition (O, C, Sr, and Nd) and trace element ratios (Sr/Ca, Mg/Ca) of Miocene marine and brackish ostracods from North Alpine foreland deposits (Germany and Austria) as indicators for paleoclimate. Palaeogeogr. Palaeoclimatol. Palaeoecol. 2005, 255, 216–247. [Google Scholar] [CrossRef]
- Wang, Z.W.; Fu, X.G.; Feng, X.L.; Song, C.Y.; Wang, D.; Chen, W.B.; Zeng, S.Q. Geochemical features of the black shales from the Wuyu Basin, southern Tibet: Implications for palaeoenvironment and palaeoclimate. Geol. J. 2017, 52, 282–297. [Google Scholar] [CrossRef]
- Zhang, S.H.; Liu, C.Y.; Liang, H.; Wang, J.Q.; Bai, J.K.; Yang, M.H.; Liu, G.H.; Huang, H.X.; Guan, Y.C. Paleoenvironmental conditions, organic matter accumulation, and unconventional hydrocarbon potential for the Permian Lucaogou Formation organic-rich rocks in Santanghu Basin, NW China. Int. J. Coal Geol. 2018, 185, 44–60. [Google Scholar] [CrossRef]
- Cao, J.; Wu, M.; Chen, Y.; Hu, K.; Bian, L.Z.; Wang, L.G.; Zhang, Y. Trace and rare earth element geochemistry of Jurassic mudstones in the northern Qaidam Basin, northwest China. Geochemistry 2012, 72, 245–252. [Google Scholar] [CrossRef]
- Shen, J.; Schoepfer, S.D.; Feng, Q.L.; Zhou, L.; Yu, J.X.; Song, H.Y.; Wei, H.Y.; Algeo, T.J. Marine productivity changes during the end–Permian crisis and Early Triassic recovery. Earth Sci. Rev. 2015, 149, 136–162. [Google Scholar] [CrossRef]
- Algeo, T.J.; Henderson, C.M.; Tong, J.N.; Feng, Q.L.; Yin, H.F.; Tyson, R.V. Plankton and productivity during the Permian-Triassic boundary crisis: An analysis of organic carbon fluxes. Glob. Planet. Change 2013, 105, 52–67. [Google Scholar] [CrossRef]
- Schoepfer, S.D.; Shen, J.; Wei, H.Y.; Tyson, R.V.; Ingall, E.; Algeo, T.J. Total organic carbon, organic phosphorus, and biogenic barium fluxes as proxies for paleomarine productivity. Earth Sci. Rev. 2015, 149, 23–52. [Google Scholar] [CrossRef]
- Dymond, J.; Suess, E.; Lyle, M. Barium in Deep-Sea Sediment: A Geochemical Proxy for Paleoproductivity. Paleoceanography 1992, 7, 163–181. [Google Scholar] [CrossRef]
- Jones, B.F.; Bowser, C.J. The mineralogy and related chemistry of lake sediments. In Lakes—Chemistry, Geology, Physics; Lerman, A., Ed.; Springer: New York, NY, USA, 1978; pp. 179–235. [Google Scholar]
- Davison, W. Iron and manganese in lakes. Earth-Sci. Rev. 1993, 34, 119–163. [Google Scholar] [CrossRef]
- Jones, B.; Manning, D.A.C. Comparison of geochemical indices used for the interpretation of palaeoredox conditions in ancient mudstones. Chem. Geol. 1994, 111, 111–129. [Google Scholar] [CrossRef]
- Arthur, M.A.; Sageman, B.B. Marine black shales: Depositional mechanisms and environments of ancient deposits. Annu. Rev. Earth Planet. Sci. 1994, 22, 499–551. [Google Scholar] [CrossRef]
- Pattan, J.N.; Masuzawa, T.; Borole, D.V.; Parthiban, G.; Jauhari, P.; Yamamoto, M. Biological productivity, terrigenous influence and noncrustal elements supply to the Central Indian Ocean Basin: Paleoceanography during the past ~ 1 Ma. J. Earth Syst Sci. 2005, 114, 63–74. [Google Scholar] [CrossRef]
- Rollinson, H.R. Using Geochemical Data: Evaluation, Presentation, Interpretation; Routledge: Abingdon, UK, 1993; 384p. [Google Scholar]
- Tanaka, K.; Akagawa, F.; Yamamoto, K.; Tani, Y.; Kawabe, I.; Kawai, T. Rare earth element geochemistry of Lake Baikal sediment: Its implication for geochemical response to climate change during the Last Glacial/Interglacial transition. Quat. Sci. Rev. 2007, 26, 1362–1368. [Google Scholar] [CrossRef]
- Cullers, R.; Chaudhuri, S.; Kilbane, N.; Koch, R. Rare-earths in size fractions and sedimentary rocks of Pennsylvanian-Permian age from the mid-continent of the U.S.A. Geochim. Cosmochim. Acta 1979, 43, 1285–1301. [Google Scholar] [CrossRef]
- Condie, K.C. Another look at rare earth elements in shales. Geochim. Cosmochim. Acta 1991, 55, 2527–2531. [Google Scholar] [CrossRef]
- McLennan, S.M.; Taylor, S.R. Sedimentary rocks and crustal evolution: Tectonic setting and secular trends. J. Geol. 1991, 99, 1–21. [Google Scholar] [CrossRef]
- Garzanti, E.; Resentini, A. Provenance control on chemical indices of weathering (Taiwan river sands). Sed. Geol. 2016, 336, 81–95. [Google Scholar] [CrossRef]
- Dinis, P.A.; Garzanti, E.; Hahn, A.; Vermeesch, P.; Cabral-Pinto, M. Weathering indices as climate proxies. A step forward based on Congo and SW African river muds. Earth-Sci. Rev. 2020, 201, 103039. [Google Scholar] [CrossRef]
- Pye, K.; Krinsley, D.H. Diagenetic carbonate and evaporite minerals in Rotliegend aeolian sandstones of the southern North Sea: Their nature and relationship to secondary porosity. Clay Miner. 1986, 21, 443–457. [Google Scholar] [CrossRef]
- Werne, J.P.; Sageman, B.B.; Lyons, T.; Hollander, D.J. An integrated assessment of a “type euxinic” deposit: Evidence for multiple controls on black shale deposition in the Middle Devonian Oatka Creek Formation. Am. J. Sci. 2002, 302, 110–143. [Google Scholar] [CrossRef]
- Haug, G.H.; Gunther, D.; Peterson, L.C.; Sigman, D.M.; Hughen, K.A.; Aeschlimann, B. Climate and the collapse of Maya civilization. Science 2003, 299, 1731–1735. [Google Scholar] [CrossRef] [PubMed]
- Roy, P.D.; Caballero, M.; Lozano, R.; Ortega, B.; Lozano, S.; Pi, T.; Israde, I.; Morton, O. Geochemical record of Late Quaternary paleoclimate from lacustrine sediments of paleo-lake San Felipe, western Sonora Desert, Mexico. J. S. Am. Earth Sci. 2010, 29, 586–596. [Google Scholar] [CrossRef]
- Andersson, P.O.D.; Worden, R.H.; Hodgson, D.M.; Flint, S. Provenance evolution and chemostratigraphy of a Paleozoic submarine fan-complex: Tanqua Karoo Basin, South Africa. Mar. Petrol. Geol. 2004, 21, 555–577. [Google Scholar] [CrossRef]
- Chen, J.; Wang, Y.J.; Ji, J.F.; Lu, H.Y. The Rb/Sr value of the Luochuan loess section in Shaanxi and its climatic stratigraphic significance. Quat. Sci. 1999, 4, 350–356. (In Chinese) [Google Scholar]
- Huang, R.; Zhu, C.; Zheng, C.G.; Ma, C.M. The distribution characteristics of Rb and Sr in the strata of the Zhongba site in the Three Gorges of the Yangtze River and its paleoclimate evolution. Quat. Sci. 2004, 5, 53–58. (In Chinese) [Google Scholar]
- Pang, J.L.; Huang, C.C.; Zhang, Z.P. Rb and Sr composition of loess profile in Qishan, Shaanxi and high-resolution climate change. Acta Sedimentol. Sin. 2001, 19, 637–641. (In Chinese) [Google Scholar]
- Shen, H.Y.; Jia, Y.L.; Li, X.S.; Wu, J.L.; Wei, L.; Wang, P.L. The composition of Rb, Sr and environmental changes of lake sediments of different sizes in Huangqihai, Inner Mongolia. Acta Geogr. Sin. 2006, 61, 1208–1217. (In Chinese) [Google Scholar]
- Izumida, H.; Yoshimura, T.; Suzuki, A.; Nakashima, R.; Ishimura, T.; Yasuhara, M.; Inamura, A.; Shikazono, N.; Kawahata, H. Biological and water chemistry controls on Sr/Ca, Ba/Ca, Mg/Ca, and δ18O profiles in freshwater pearl mussel Hyriopsis sp. Palaeogeogr. Palaeoclimatol. Palaeoecol. 2011, 309, 298–308. [Google Scholar] [CrossRef]
- Poulain, C.; Gillikin, D.P.; Thébault, J.; Munaron, J.M.; Bohn, M.; Robert, R.; Paulet, Y.-M.; Lorrain, A. An evaluation of Mg/Ca, Sr/Ca, and Ba/Ca ratios as environmental proxies in aragonite bivalve shells. Chem. Geol. 2015, 396, 42–50. [Google Scholar] [CrossRef]
- Tyrrell, T. The relative influences of nitrogen and phosphorus on oceanic primary production. Nature 1999, 400, 525–531. [Google Scholar] [CrossRef]
- Benitez-Nelson, C.R. The biogeochemical cycling of phosphorus in marine systems. Earth Sci. Rev. 2000, 51, 109–135. [Google Scholar] [CrossRef]
- Dymond, J.; Collier, R. Particulate barium fluxes and their relationships to biological productivity. Deep Sea Res. Part II 1996, 43, 1283–1308. [Google Scholar] [CrossRef]
- Pyle, K.M.; Hendry, K.R.; Sherrell, R.M.; Meredith, M.P.; Venables, H.; Lagerström, M.; Morte-Rodenas, A. Coastal barium cycling at the West Antarctic Peninsula. Deep Sea Res. Part II 2017, 139, 120–131. [Google Scholar] [CrossRef]
- Dean, W.E.; Gardner, J.V.; Piper, D.Z. Inorganic geochemical indicators of glacial-interglacial changes in productivity and anoxia on the California continental margin. Geochem. Cosmochim. Acta 1997, 61, 4507–4518. [Google Scholar] [CrossRef]
- Qadrouh, A.N.; Alajmi, M.S.; Alotaibi, A.M.; Baioumy, H.; Almalki, M.A.; Alyousif, M.M.; Salim, A.M.A.; Bin Rogaib, A.M. Mineralogical and geochemical imprints to determine the provenance, depositional environment, and tectonic setting of the Early Silurian source rock of the Qusaiba shale, Saudi Arabia. Mar. Petrol. Geol. 2021, 130, 105131. [Google Scholar] [CrossRef]
- Hatch, J.R.; Leventhal, J.S. Relationship between inferred redox potential of the depositional environment and geochemistry of the Upper Pennsylvanian (Missourian) Stark shale member of the Dennis limestone, Wabaunsee country, Kansas, USA. Chem. Geol. 1992, 99, 65–82. [Google Scholar] [CrossRef]
- Tribovillard, N.; Algeo, T.J.; Lyons, T.; Riboulleau, A. Trace metals as paleoredox and paleoproductivity proxies: An update. Chem. Geol. 2006, 232, 12–32. [Google Scholar] [CrossRef]
- Heusser, L.E.; Kirby, M.E.; Nichols, J.E. Pollen-based evidence of extreme drought during the last Glacial (32.6–9.0 ka) in coastal southern California. J. Quat. Sci. 2015, 26, 243–253. [Google Scholar] [CrossRef]
- Clark, P.U.; Shakun, J.D.; Baker, P.A.; Williams, J.W. Global climate evolution during the last deglaciation. Proc. Natl. Acad. Sci. USA 2012, 109, E1134–E1142. [Google Scholar] [CrossRef]
- Enzel, Y.; Wells, S.G.; Lancaster, N. Late Pleistocene lakes along the Mojave River, southwest California. In Paleoenvironments and Paleohydrology of the Mojave and Southern Great Basin Deserts; Enzel, Y., Wells, S.G., Lancaster, N., Eds.; Geological Society of America: Boulder, CO, USA, 2003; Volume 368, pp. 61–77. [Google Scholar]
- Kindler, P.; Guillevic, M.; Baumgartner, M.; Schwander, J.; Landais, A.; Leuenberger, M. Temperature reconstruction from 10 to 120 kyr b2k from the NGRIP ice core. Clim. Past 2014, 10, 887–902. [Google Scholar] [CrossRef]
- Seki, O.; Ishiwatari, R.; Matsumoto, K. Millennial climate oscillations in NE Pacific surface waters over the past 82,000 years: Fresh insights from alkenones. Geophys. Res. Lett. 2002, 29, 2144. [Google Scholar] [CrossRef]
- Svensson, A.; Andersen, K.K.; Bigler, M.; Clausen, H.B.; Dahl-Jensen, D.; Davies, S.M.; Johnsen, S.J.; Muscheler, R.; Parrenin, F.; Rasmussen, S.O.; et al. A 60,000-year Greenland stratigraphic ice core chronology. Clim. Past 2008, 4, 47–57. [Google Scholar] [CrossRef]
- Barron, J.A.; Bukry, D.; Field, D.B.; Finney, B. Response of diatoms and silicoflagellates to climate change and warming in the California Current during the past 250 years and the recent rise of the toxic diatom Pseudo-nitzschia australis. Quat. Int. 2013, 310, 140–154. [Google Scholar] [CrossRef]
- McGann, M. Late Quaternary pollen record from the central California continental margin. Quat. Int. 2015, 387, 46–57. [Google Scholar] [CrossRef]


| Element | Max | Min | Average | Factor (Max/Min) |
|---|---|---|---|---|
| SiO2 | 54.26 | 21.59 | 40.11 | 2.51 |
| SO3 | 39.40 | 2.38 | 11.92 | 16.55 |
| Al2O3 | 13.82 | 4.65 | 9.86 | 2.97 |
| CaO | 21.32 | 1.13 | 8.17 | 18.83 |
| MgO | 8.65 | 2.42 | 5.31 | 3.58 |
| Fe2O3 | 7.38 | 1.75 | 4.80 | 4.22 |
| Na2O | 6.24 | 1.12 | 3.96 | 5.58 |
| K2O | 2.54 | 1.00 | 1.83 | 2.54 |
| TiO2 | 0.57 | 0.15 | 0.40 | 3.87 |
| P2O5 | 0.40 | 0.14 | 0.27 | 2.93 |
| MnO | 0.33 | 0.03 | 0.09 | 13.38 |
| LOI | 18.29 | 6.92 | 13.55 | 2.64 |
| Element | Max | Min | Average | Factor (Max/Min) |
|---|---|---|---|---|
| Sr | 1519.62 | 172.75 | 666.80 | 8.80 |
| Ba | 632.53 | 141.50 | 366.54 | 4.47 |
| Mo | 1240.22 | 0.82 | 162.77 | 1506.28 |
| V | 158.67 | 52.58 | 109.10 | 3.02 |
| Zn | 144.96 | 45.99 | 107.31 | 3.15 |
| Cr | 125.21 | 33.31 | 85.23 | 3.76 |
| Rb | 109.72 | 35.83 | 75.82 | 3.06 |
| Zr | 97.90 | 31.52 | 61.91 | 3.11 |
| Ni | 111.58 | 24.08 | 52.50 | 4.63 |
| Li | 70.99 | 24.37 | 51.83 | 2.91 |
| B | 158.53 | 8.84 | 50.53 | 17.93 |
| Cu | 547.73 | 15.16 | 40.74 | 36.12 |
| Y | 25.69 | 8.60 | 18.98 | 2.99 |
| Ga | 21.70 | 7.00 | 15.10 | 3.10 |
| Sc | 16.81 | 4.84 | 10.89 | 3.47 |
| Co | 15.09 | 4.95 | 10.19 | 3.05 |
| Nb | 13.93 | 4.63 | 10.17 | 3.01 |
| As | 25.50 | 3.08 | 8.49 | 8.29 |
| Cs | 5.86 | 1.79 | 4.21 | 3.27 |
| Cd | 11.20 | 0.70 | 3.23 | 15.95 |
| Be | 2.31 | 0.77 | 1.62 | 3.00 |
| Ge | 1.35 | 0.51 | 0.91 | 2.62 |
| Element | Max | Min | Average | Factor (Max/Min) |
|---|---|---|---|---|
| La | 126.50 | 40.50 | 83.39 | 3.12 |
| Ce | 90.60 | 29.40 | 59.87 | 3.08 |
| Pr | 71.50 | 22.80 | 46.83 | 3.14 |
| Nd | 53.30 | 16.90 | 35.51 | 3.15 |
| Sm | 30.90 | 10.20 | 20.94 | 3.03 |
| Eu | 15.90 | 5.00 | 10.66 | 3.18 |
| Gd | 19.40 | 6.40 | 13.37 | 3.03 |
| Tb | 17.70 | 5.60 | 11.94 | 3.16 |
| Dy | 13.40 | 4.40 | 9.01 | 3.05 |
| Ho | 12.80 | 4.10 | 8.66 | 3.12 |
| Er | 11.70 | 3.80 | 7.97 | 3.08 |
| Tm | 11.40 | 3.70 | 7.93 | 3.08 |
| Yb | 11.00 | 3.60 | 7.56 | 3.06 |
| Lu | 10.30 | 3.50 | 7.16 | 2.94 |
| La/Yb | 12.20 | 9.70 | 11.03 | 1.26 |
| Eu/Eu* | 0.69 | 0.60 | 0.64 | 1.14 |
| Zones | TiO2/Al2O3 | Lan/Ybn | Eu/Eu* | CIA | SiO2/Al2O3 | Zr/Al2O3 × 10−4 | Sr/Cu | Rb/Sr |
|---|---|---|---|---|---|---|---|---|
| 1 | 0.036 | 10.69 | 0.656 | 60.18 | 4.60 | 10.10 | 28.16 | 0.102 |
| 2 | 0.041 | 11.26 | 0.631 | 50.35 | 3.97 | 10.80 | 24.58 | 0.114 |
| 3 | 0.041 | 10.96 | 0.630 | 46.77 | 4.02 | 11.47 | 23.41 | 0.112 |
| 4 | 0.040 | 11.01 | 0.642 | 55.18 | 4.04 | 10.81 | 5.35 | 0.327 |
| Zones | SO3 (%) | Sr/Ba | P/Al × 10−4 | Ba/Al × 10−4 | Mn/Fe | V/(V + Ni) | Ni/Co | δCe |
|---|---|---|---|---|---|---|---|---|
| 1 | 18.05 | 1.95 | 24.72 | 92.41 | 0.020 | 0.672 | 5.21 | −0.039 |
| 2 | 11.92 | 2.14 | 21.52 | 69.79 | 0.018 | 0.683 | 4.91 | −0.039 |
| 3 | 12.20 | 2.85 | 21.67 | 61.09 | 0.039 | 0.675 | 5.27 | −0.037 |
| 4 | 5.99 | 0.65 | 20.08 | 72.41 | 0.011 | 0.670 | 5.43 | −0.041 |
Disclaimer/Publisher’s Note: The statements, opinions and data contained in all publications are solely those of the individual author(s) and contributor(s) and not of MDPI and/or the editor(s). MDPI and/or the editor(s) disclaim responsibility for any injury to people or property resulting from any ideas, methods, instructions or products referred to in the content. |
© 2024 by the authors. Licensee MDPI, Basel, Switzerland. This article is an open access article distributed under the terms and conditions of the Creative Commons Attribution (CC BY) license (https://creativecommons.org/licenses/by/4.0/).
Share and Cite
Rodriguez, A.; Guo, J.; O’Sullivan, K.; Krugh, W. Geochemical Record of Late Quaternary Paleodepositional Environment from Lacustrine Sediments of Soda Lake, Carrizo Plain, California. Minerals 2024, 14, 211. https://doi.org/10.3390/min14030211
Rodriguez A, Guo J, O’Sullivan K, Krugh W. Geochemical Record of Late Quaternary Paleodepositional Environment from Lacustrine Sediments of Soda Lake, Carrizo Plain, California. Minerals. 2024; 14(3):211. https://doi.org/10.3390/min14030211
Chicago/Turabian StyleRodriguez, Alejandro, Junhua Guo, Katie O’Sullivan, and William Krugh. 2024. "Geochemical Record of Late Quaternary Paleodepositional Environment from Lacustrine Sediments of Soda Lake, Carrizo Plain, California" Minerals 14, no. 3: 211. https://doi.org/10.3390/min14030211
APA StyleRodriguez, A., Guo, J., O’Sullivan, K., & Krugh, W. (2024). Geochemical Record of Late Quaternary Paleodepositional Environment from Lacustrine Sediments of Soda Lake, Carrizo Plain, California. Minerals, 14(3), 211. https://doi.org/10.3390/min14030211