

Dissolution Characteristics and Microstructure of Waste Pisha Sandstone Minerals in Alkaline Solutions
 , and
, and
Abstract
:1. Introduction
2. Materials and Method
2.1. Materials
2.2. Experiment Method
2.3. Characterization
3. Results and Discussion
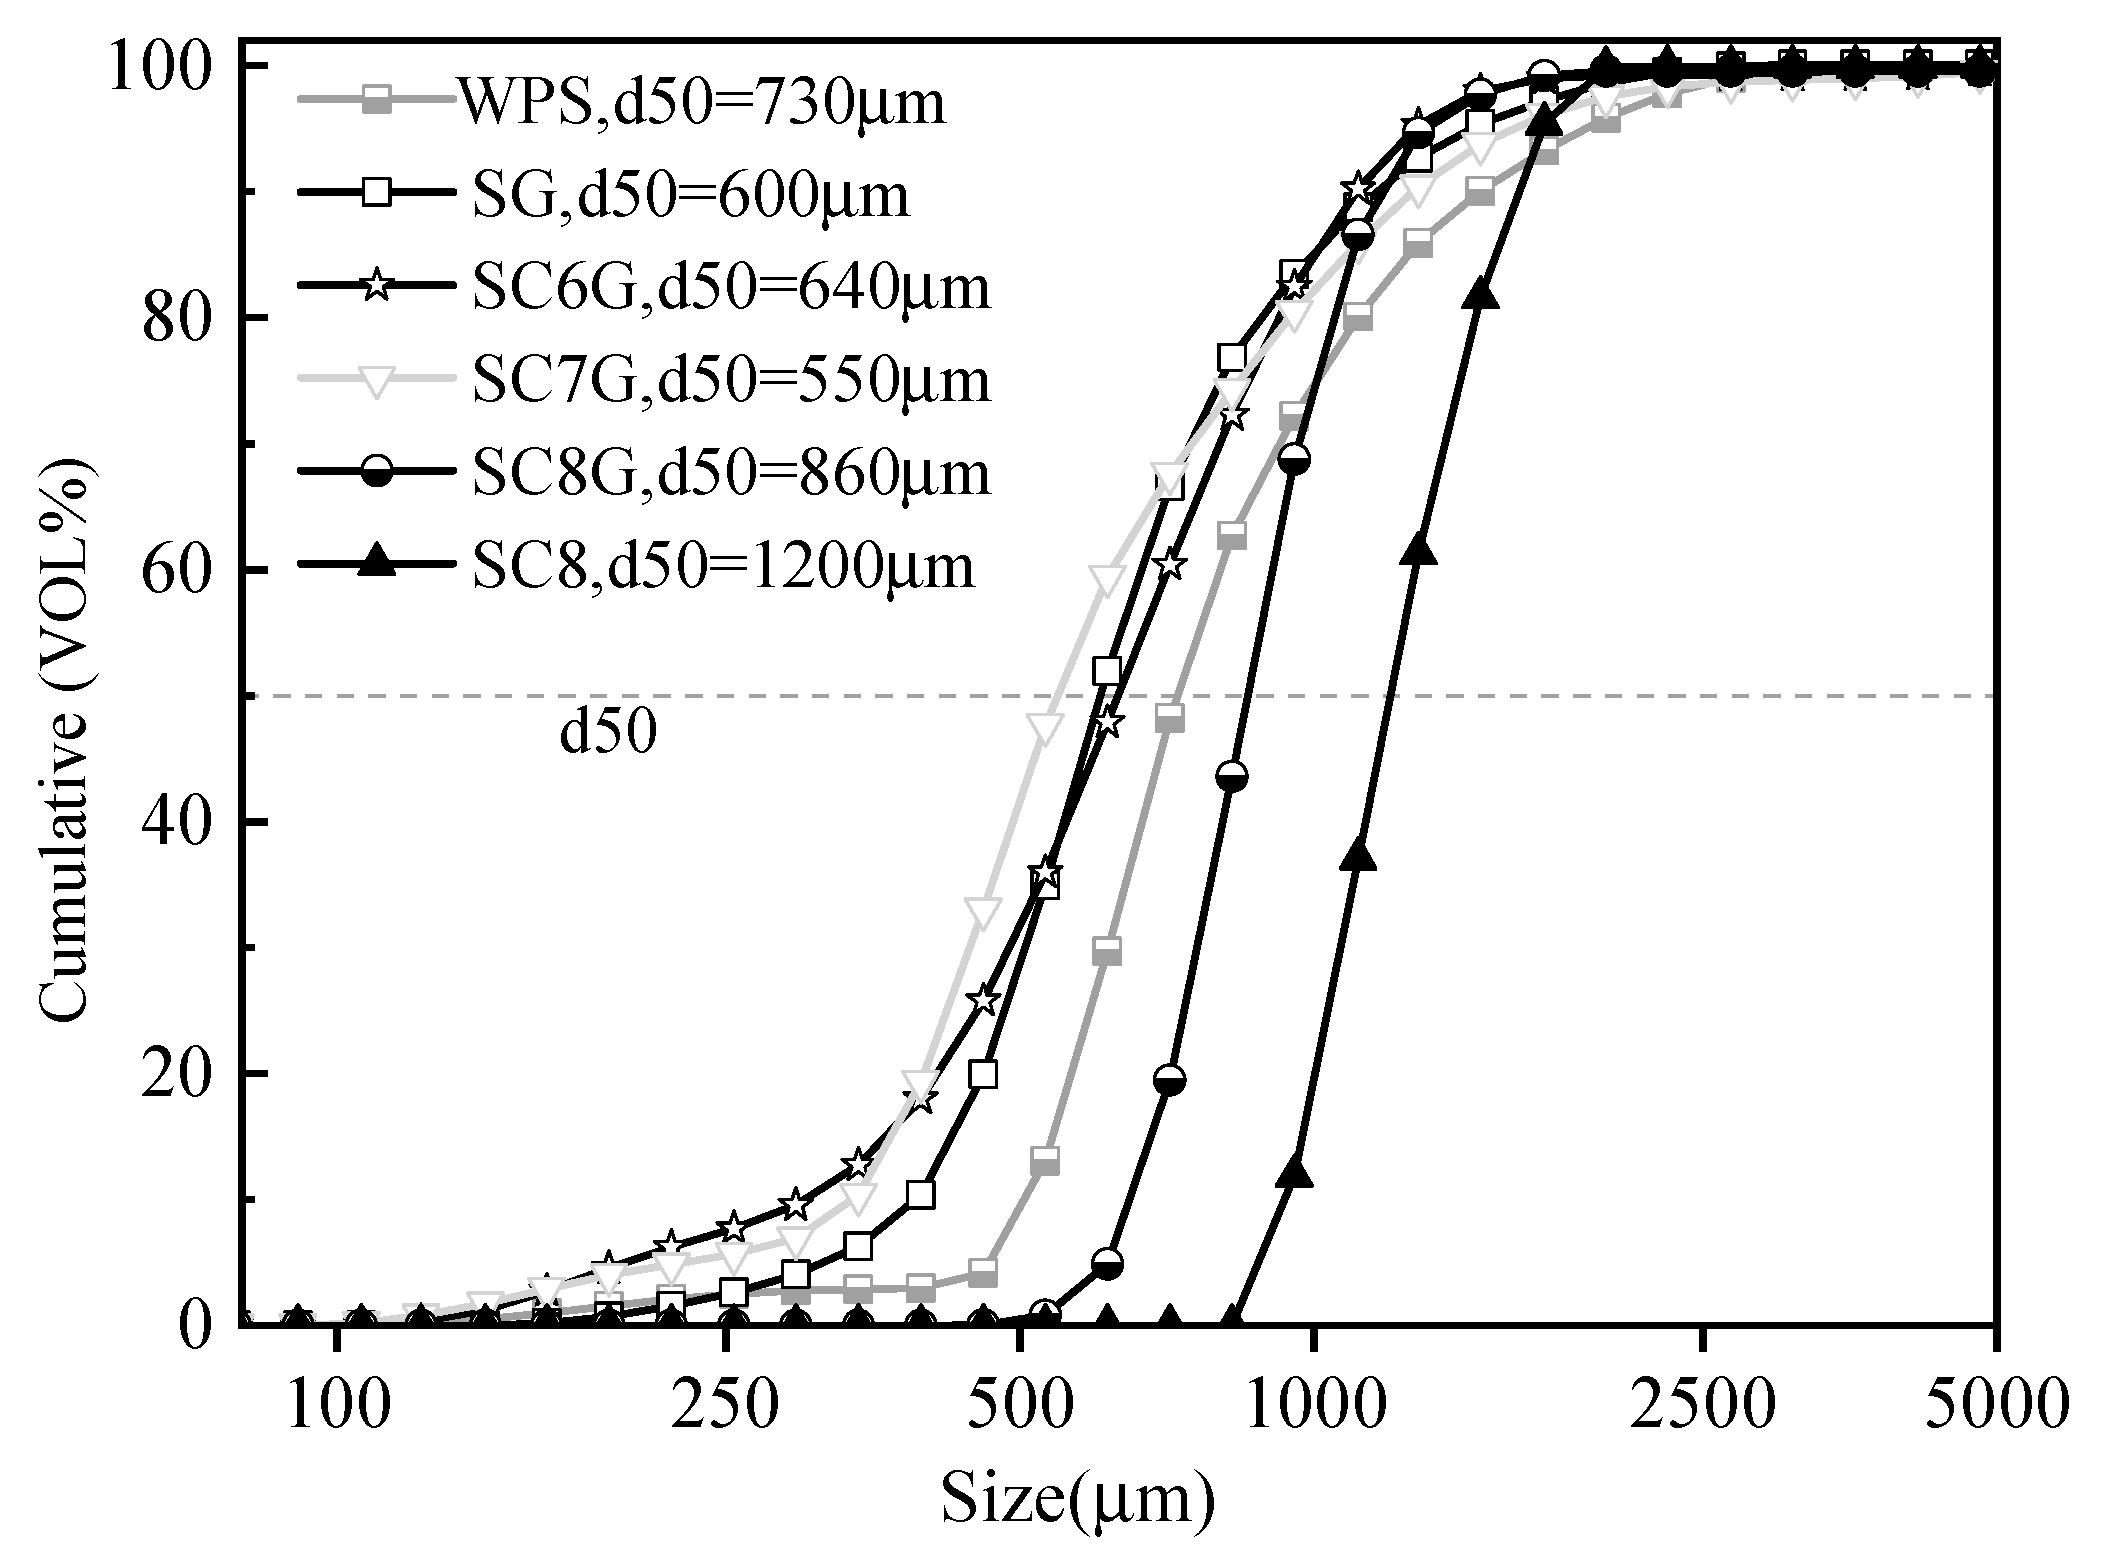
3.1. Material Properties
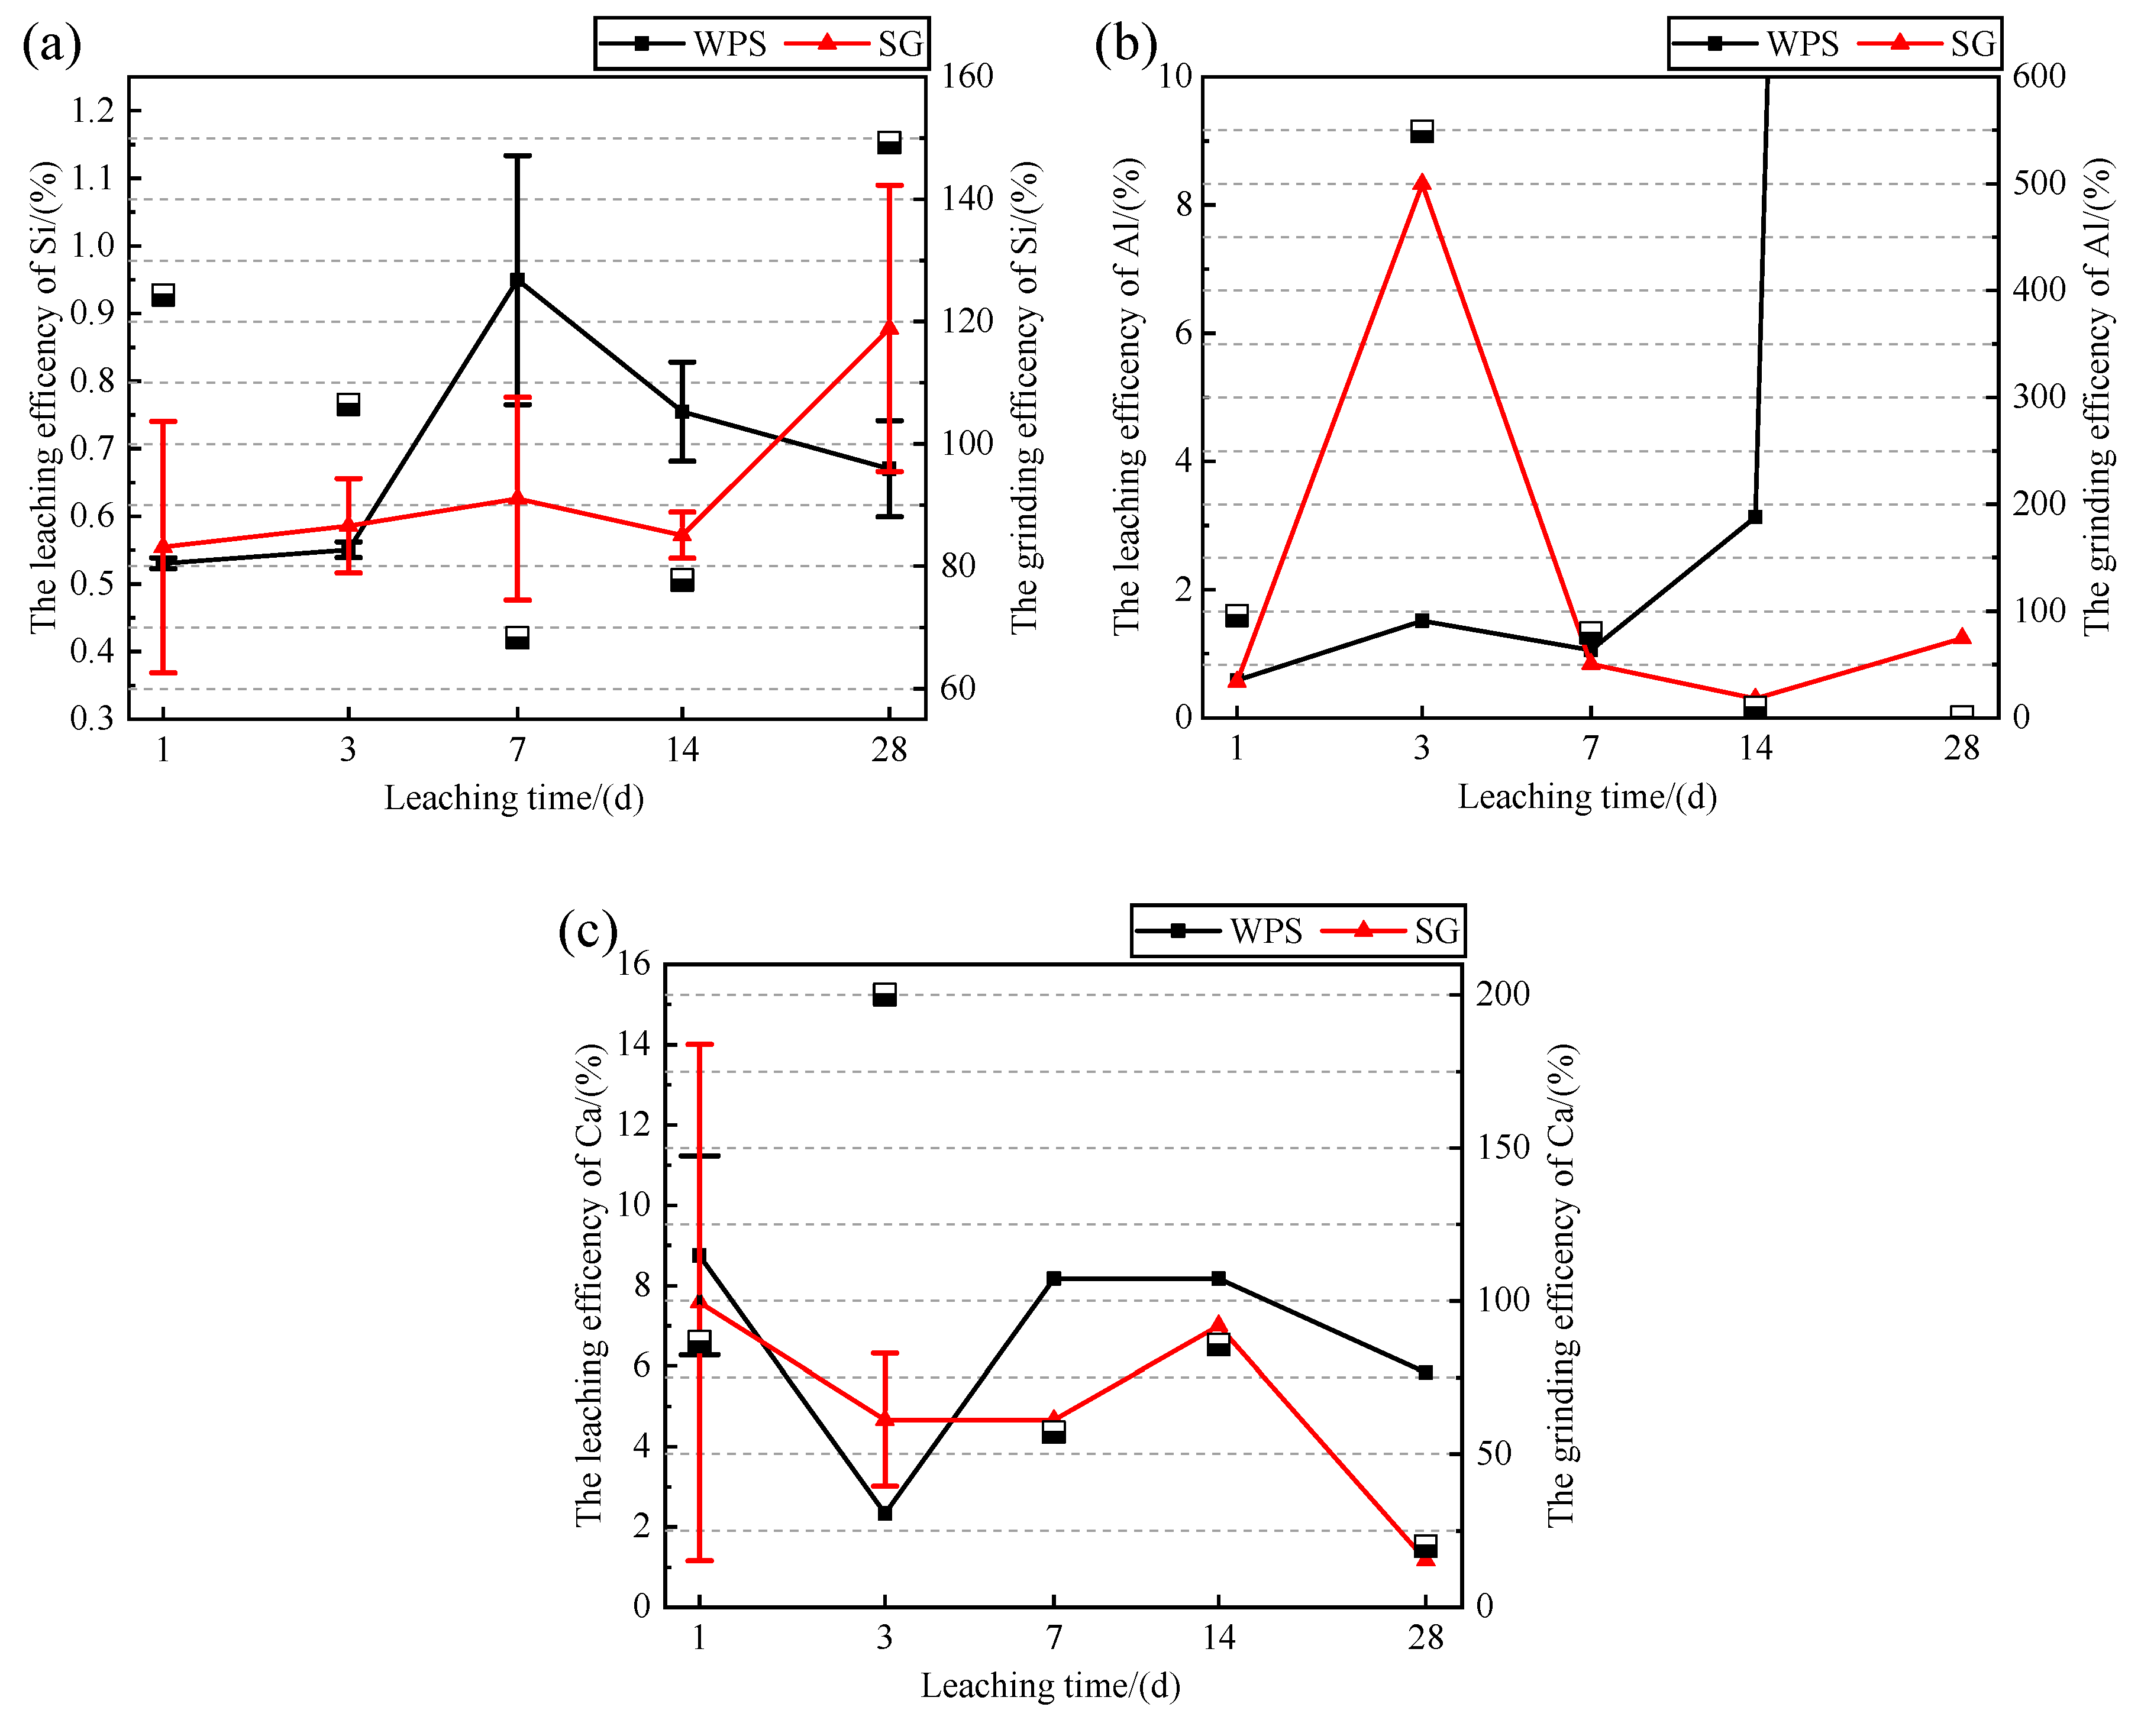
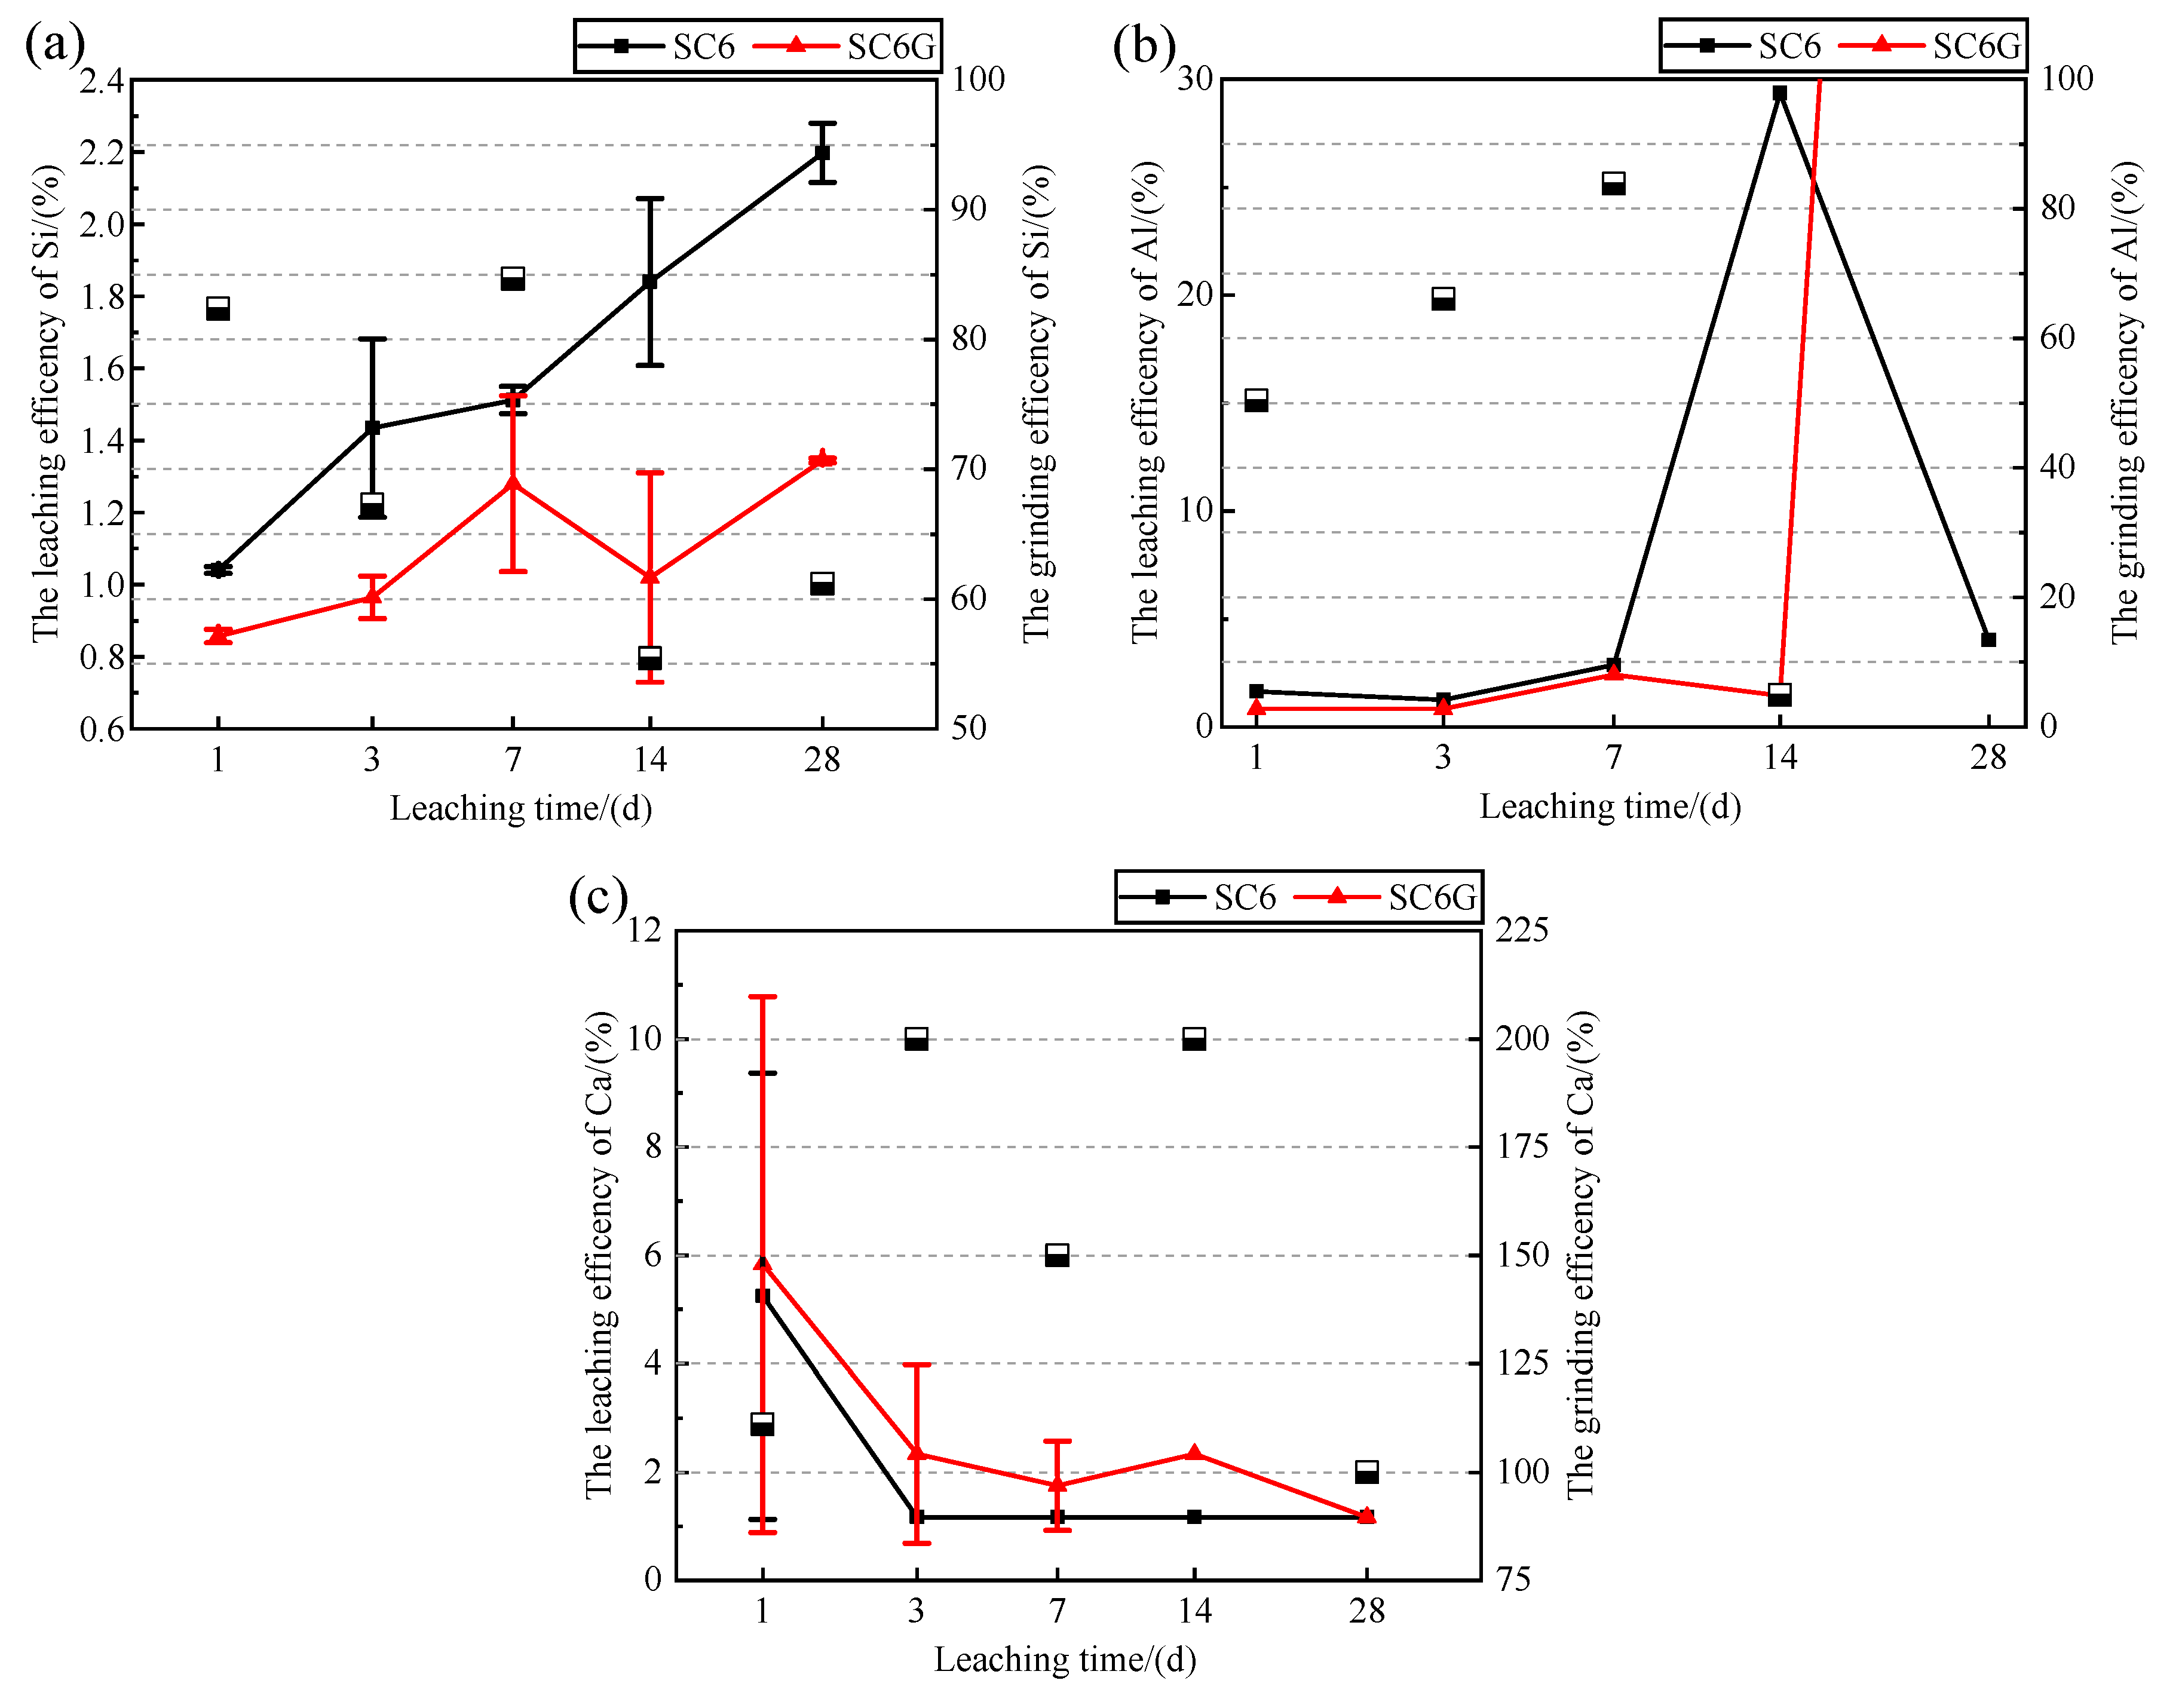
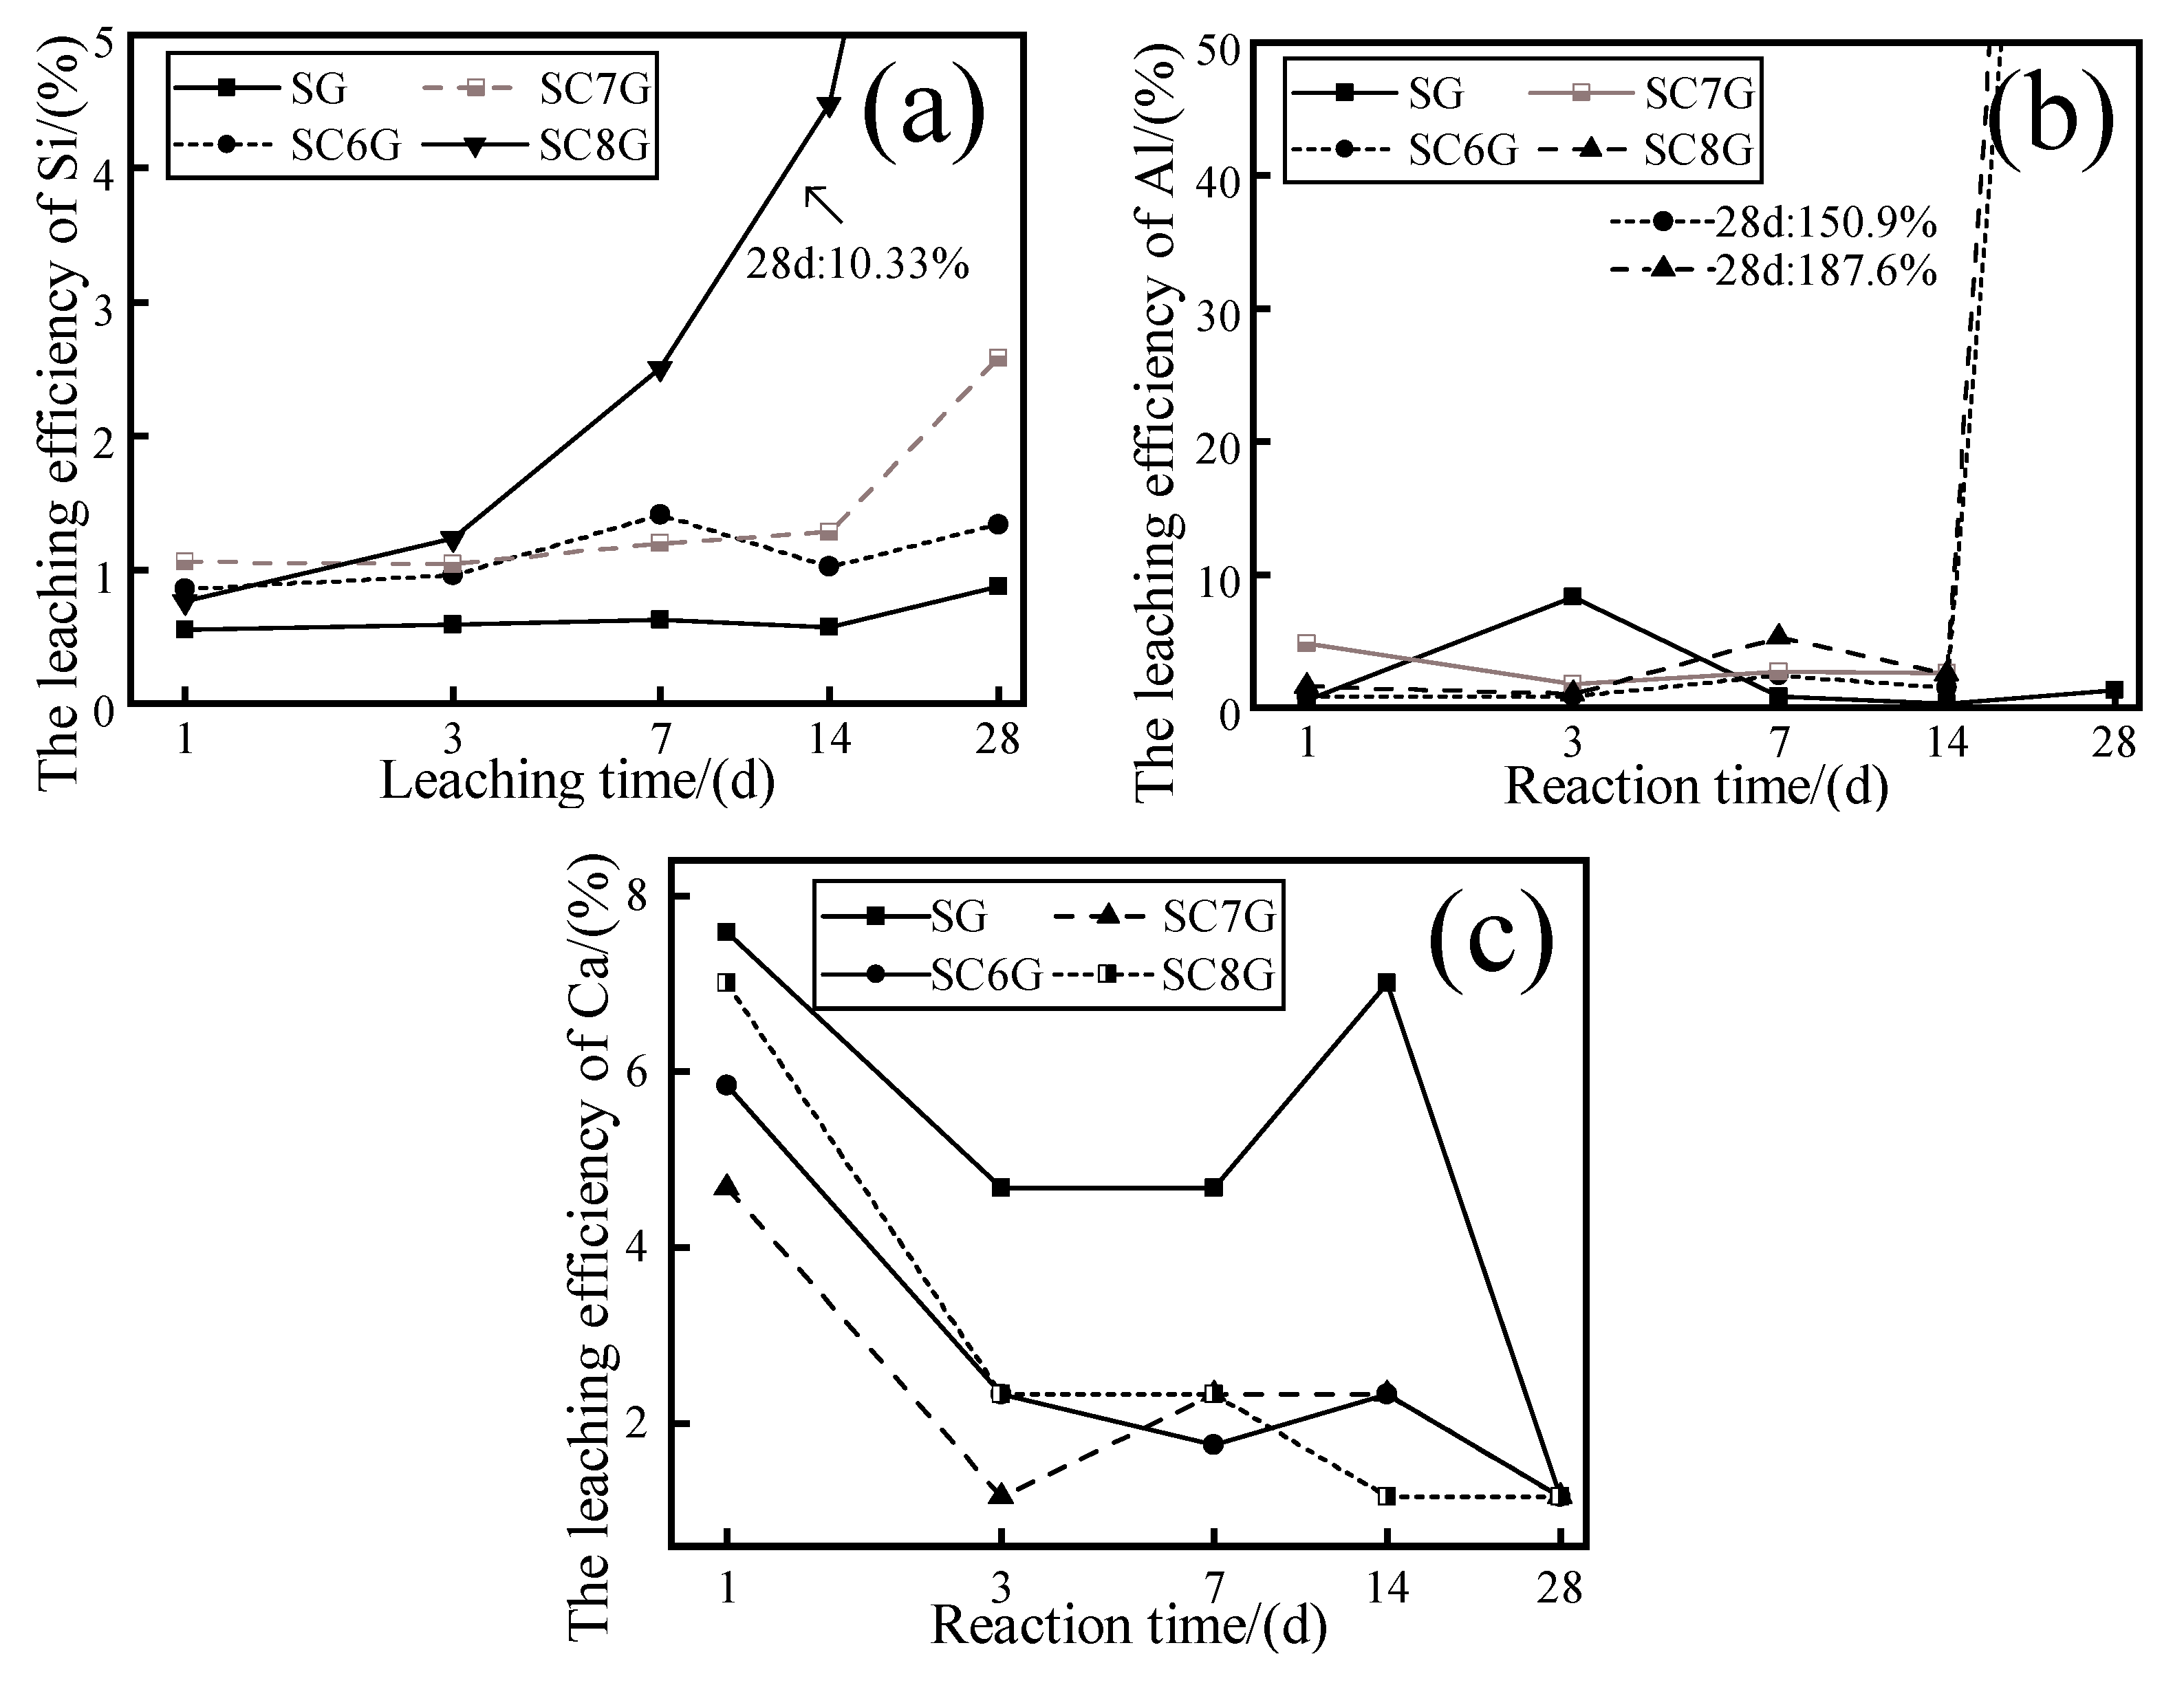
3.2. Effect of Mechanochemical Activation on the Dissolution of Si, Al, and Ca
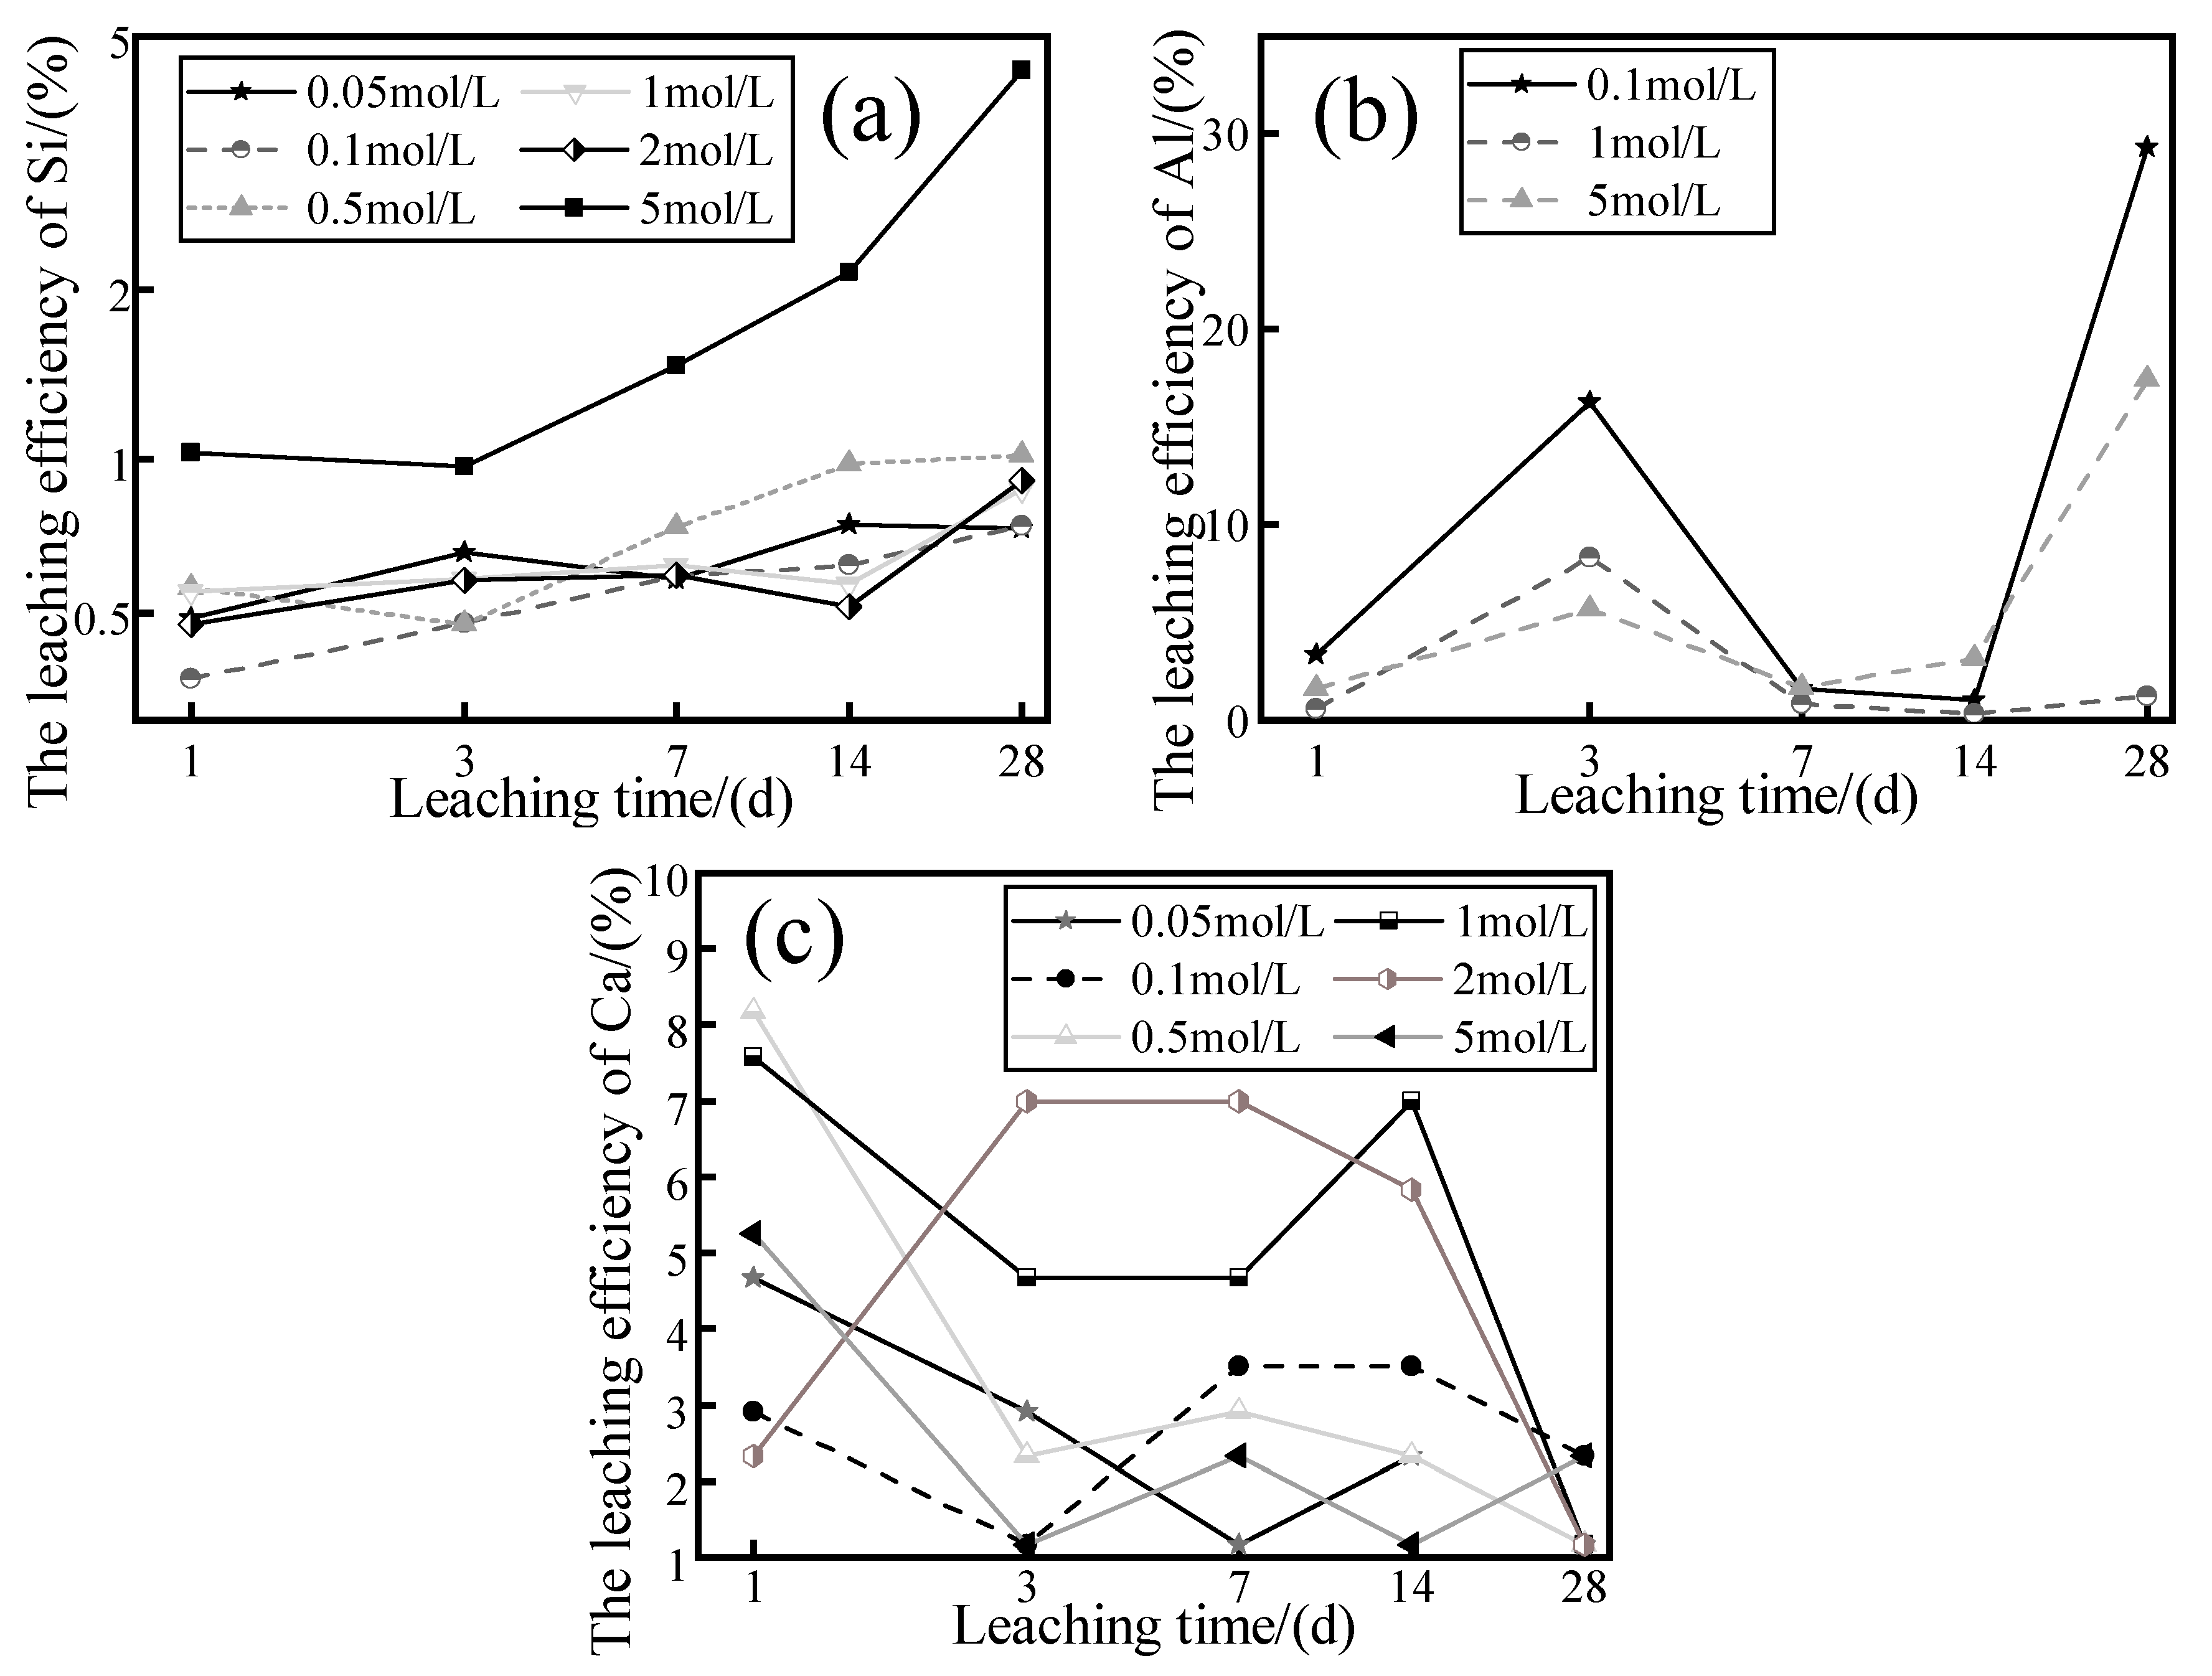
3.3. Effect of NaOH Concentration on the Dissolution of Si, Al, and Ca
3.4. Effect of Thermal Activation on the Dissolution of Si, Al, and Ca
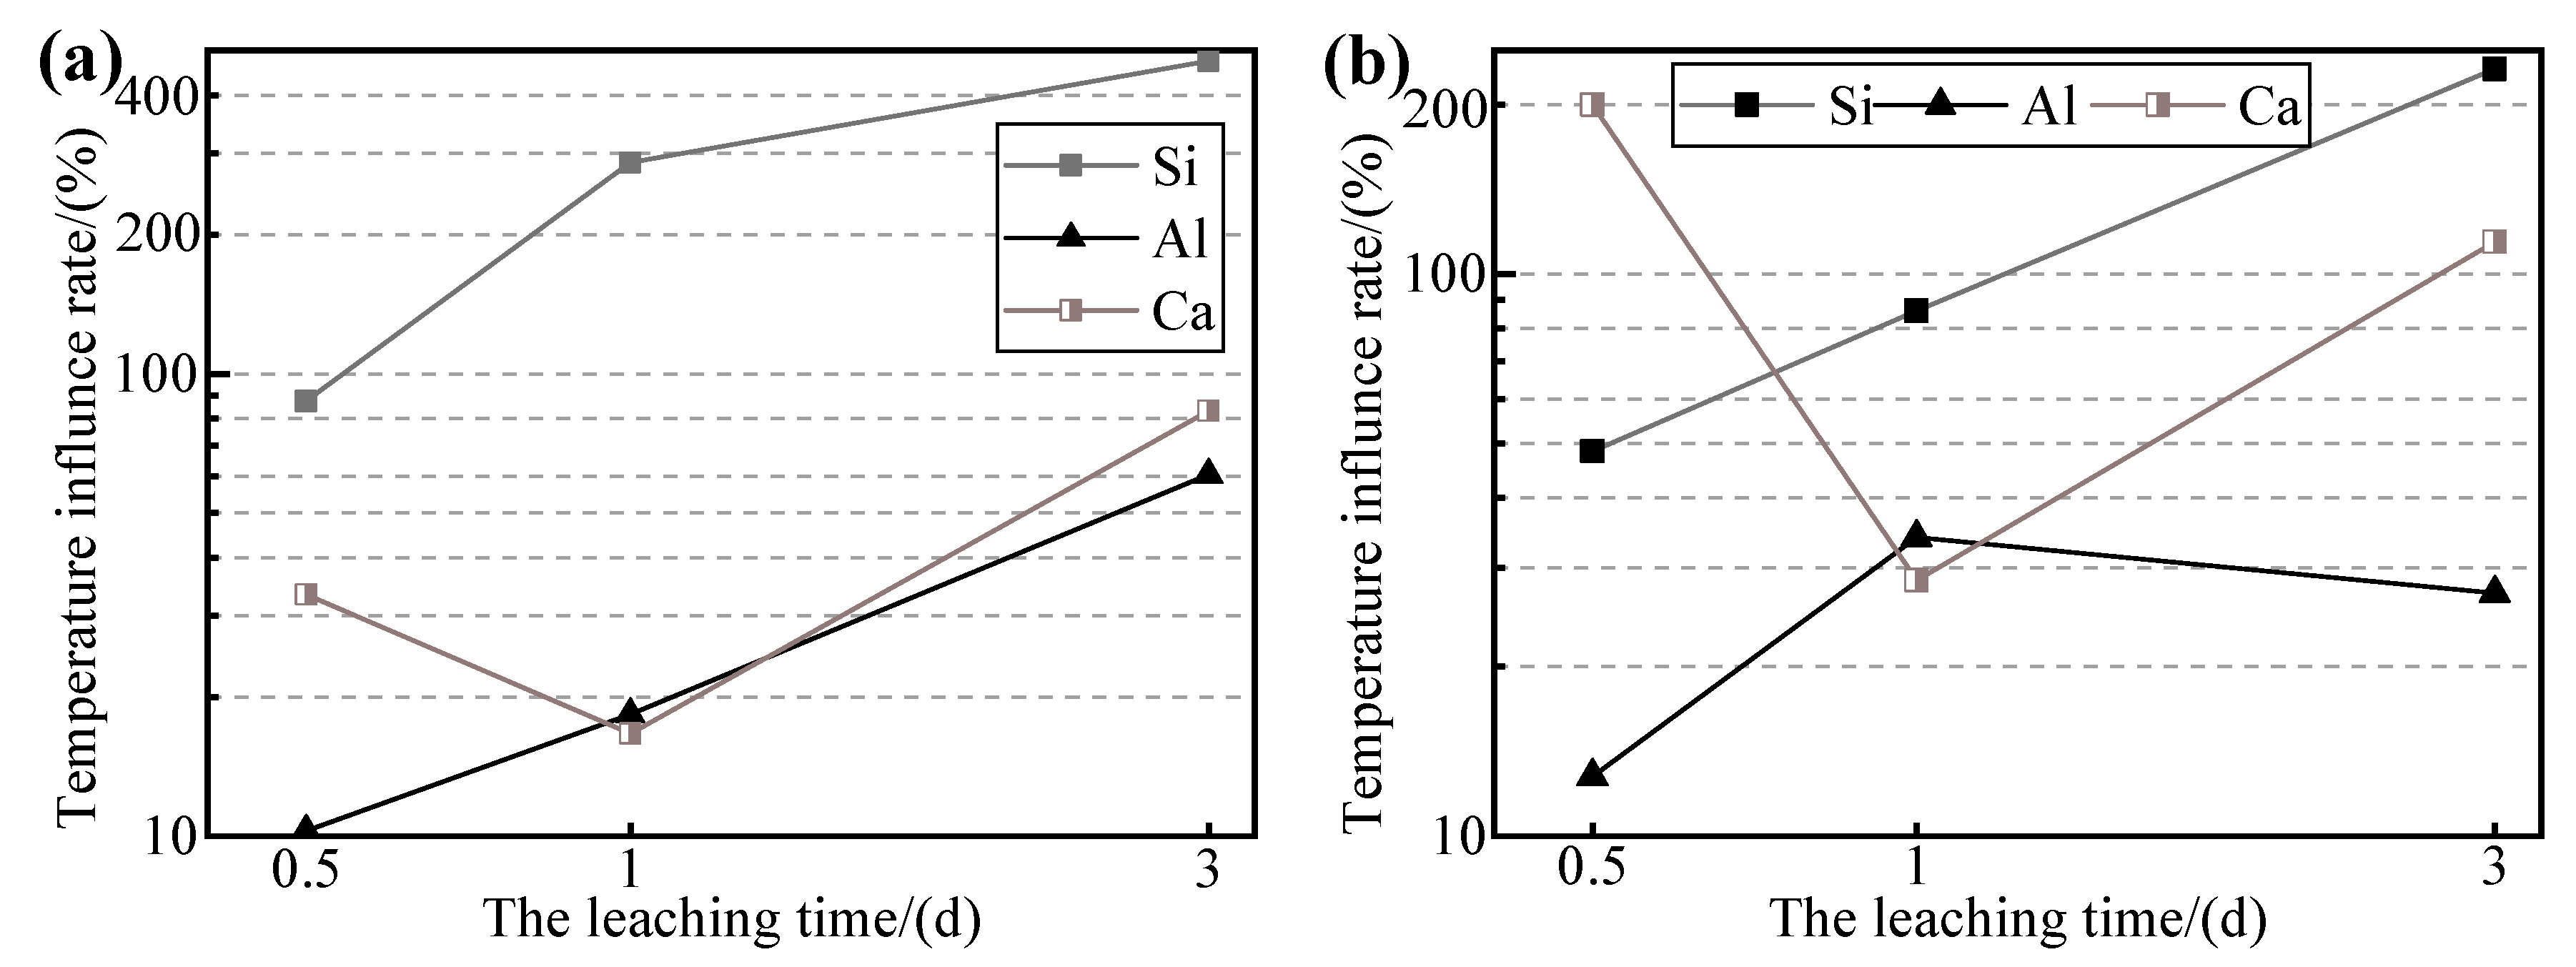
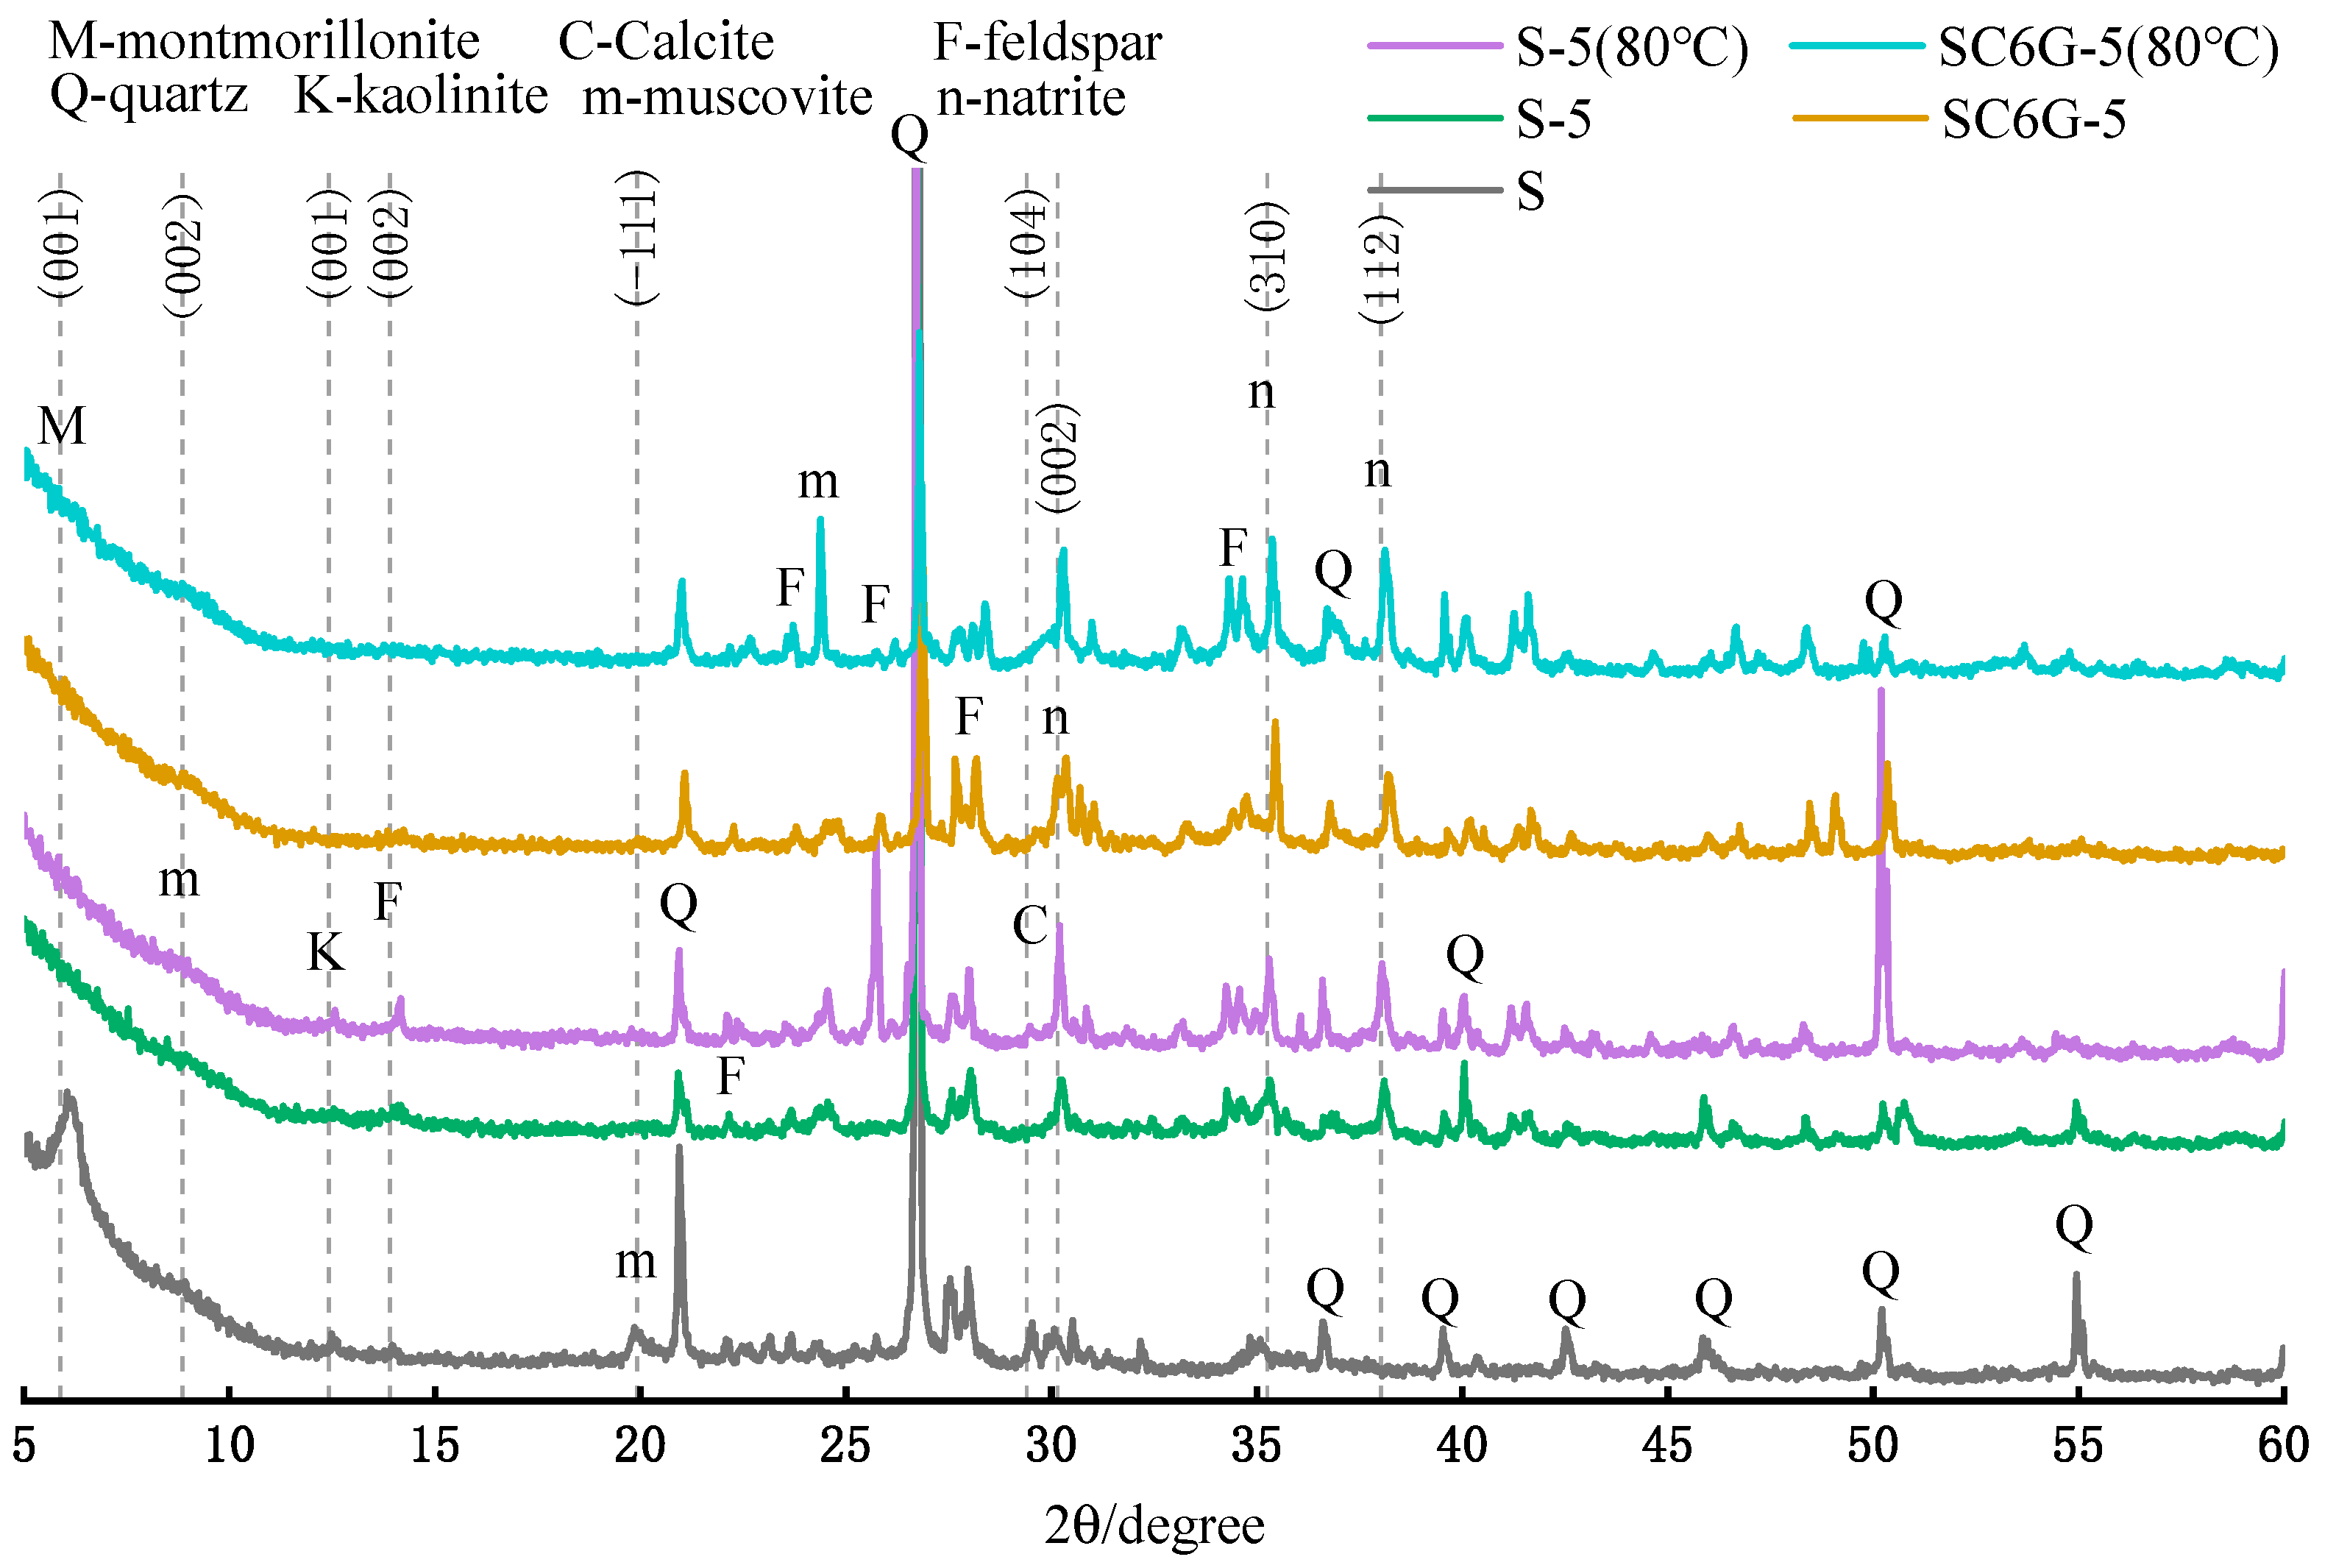
3.5. Effect of Curing Temperature on the Dissolution of Si, Al, and Ca
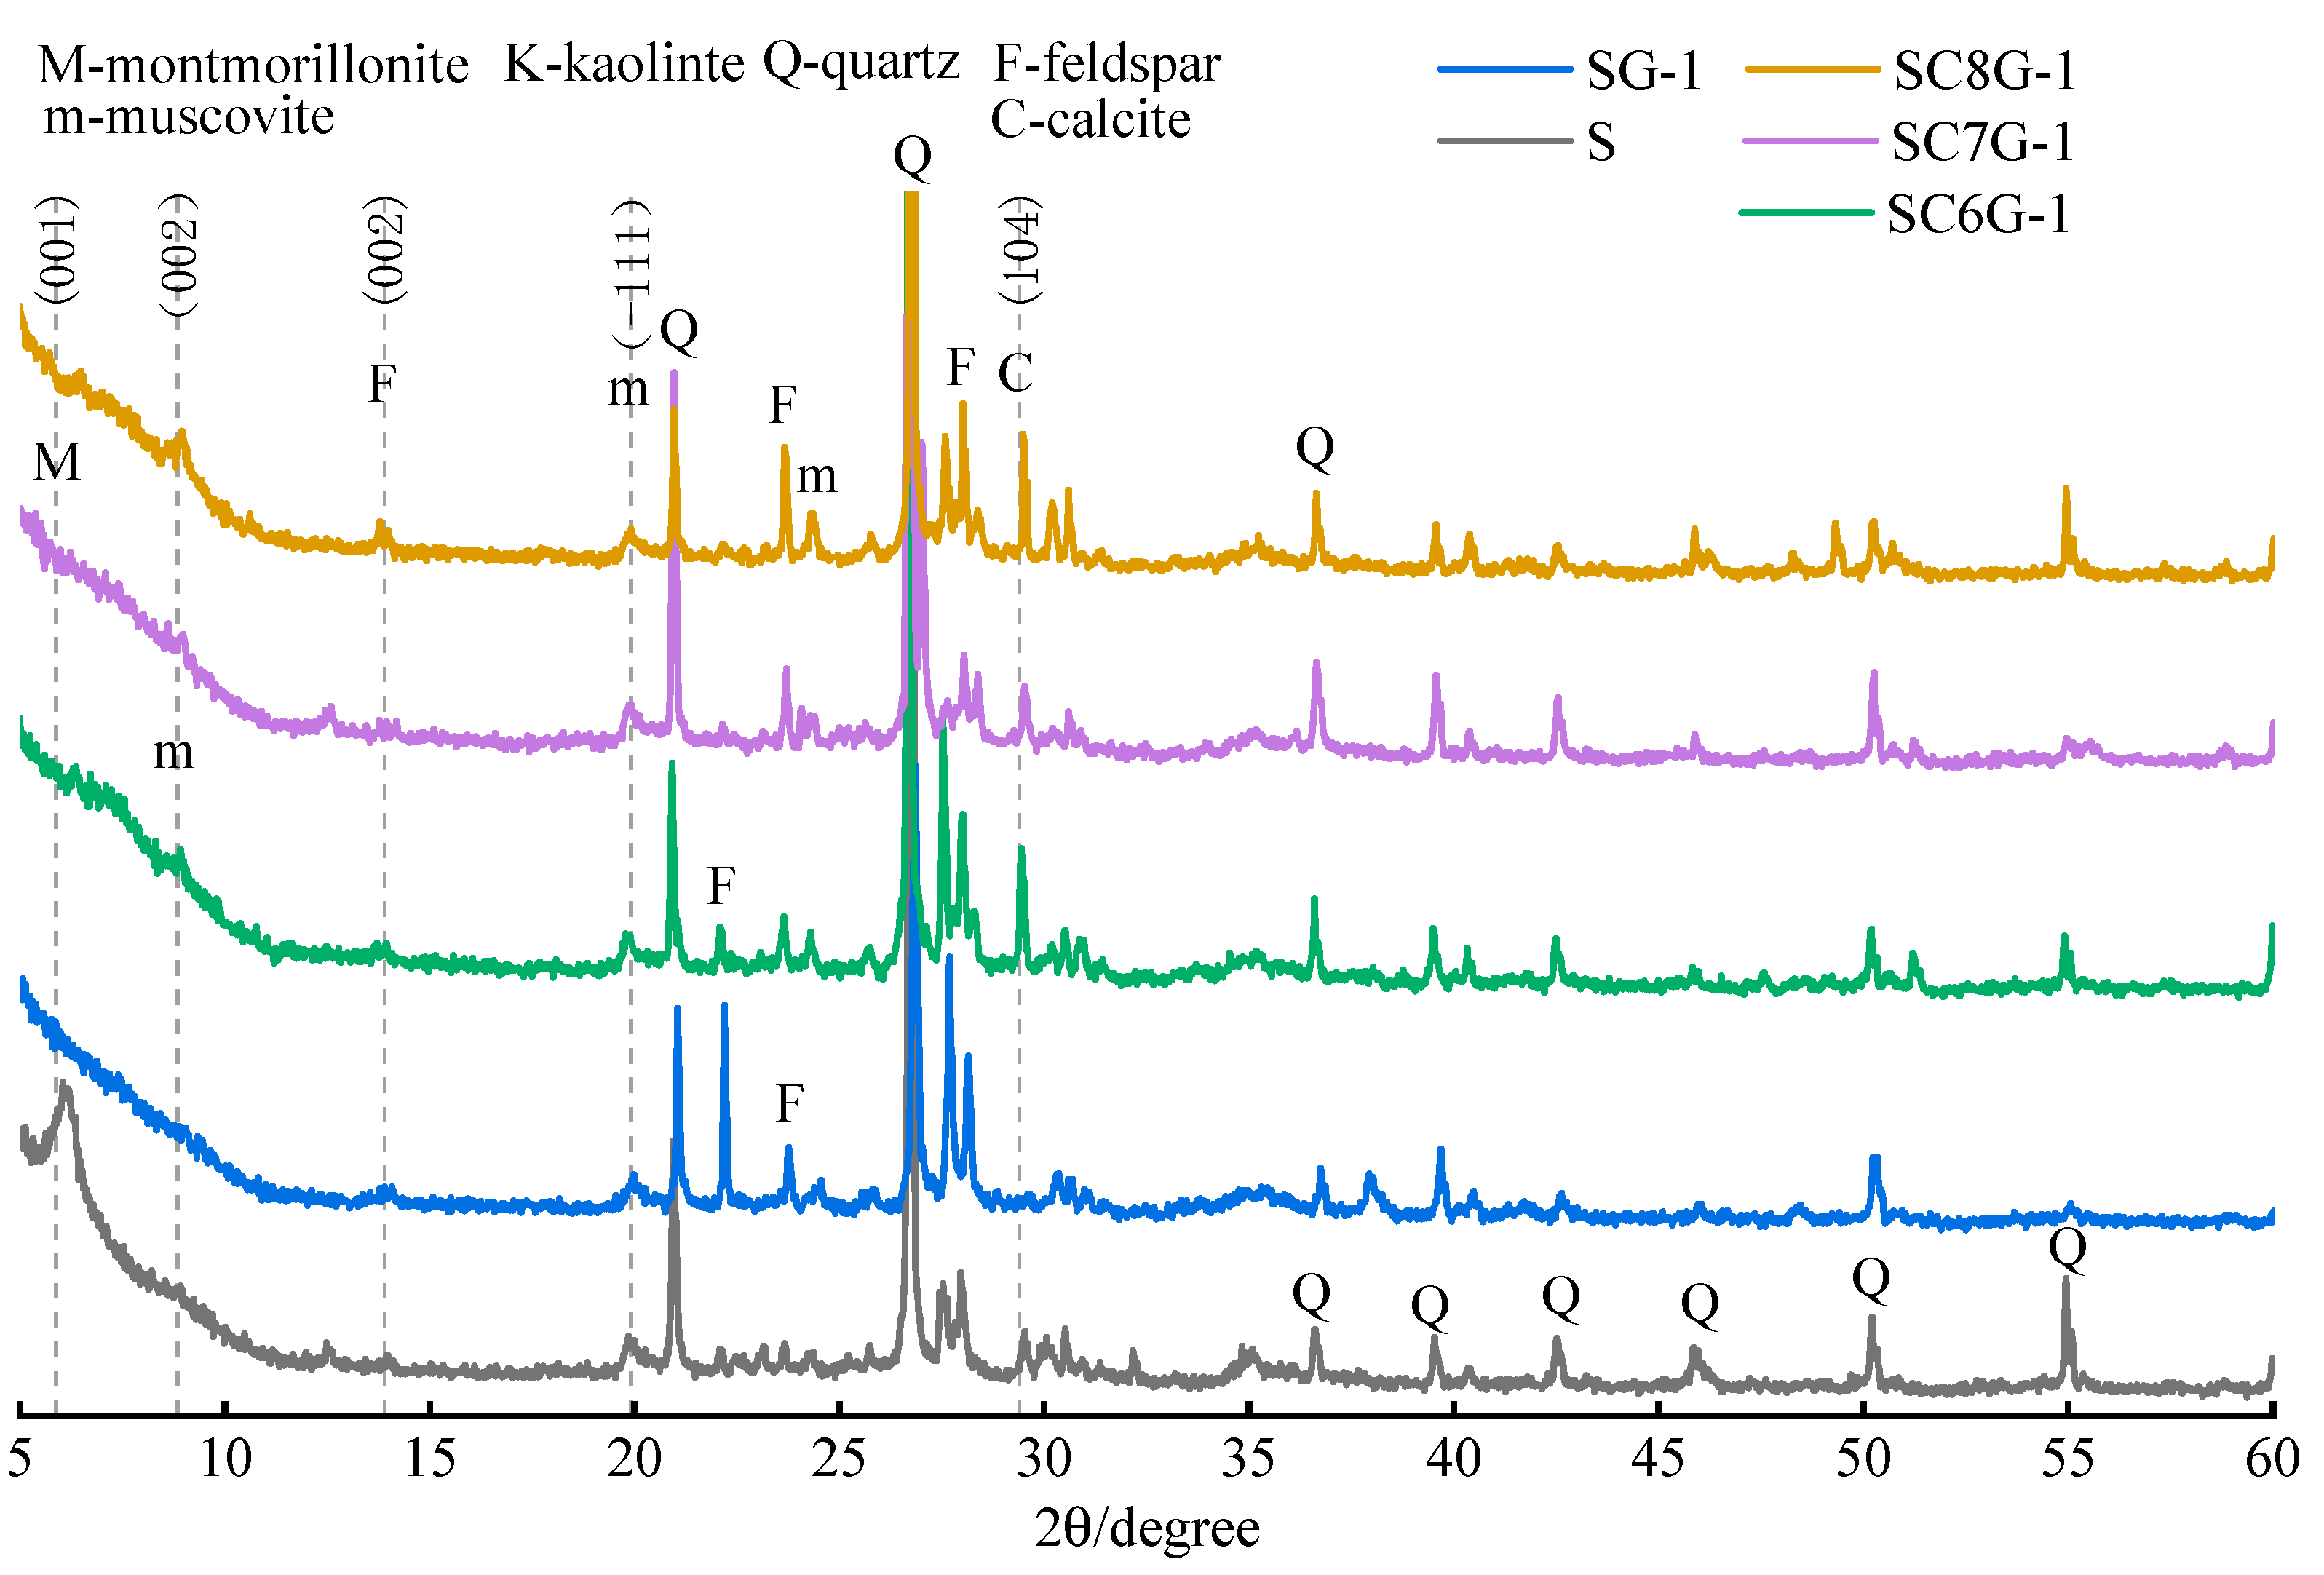
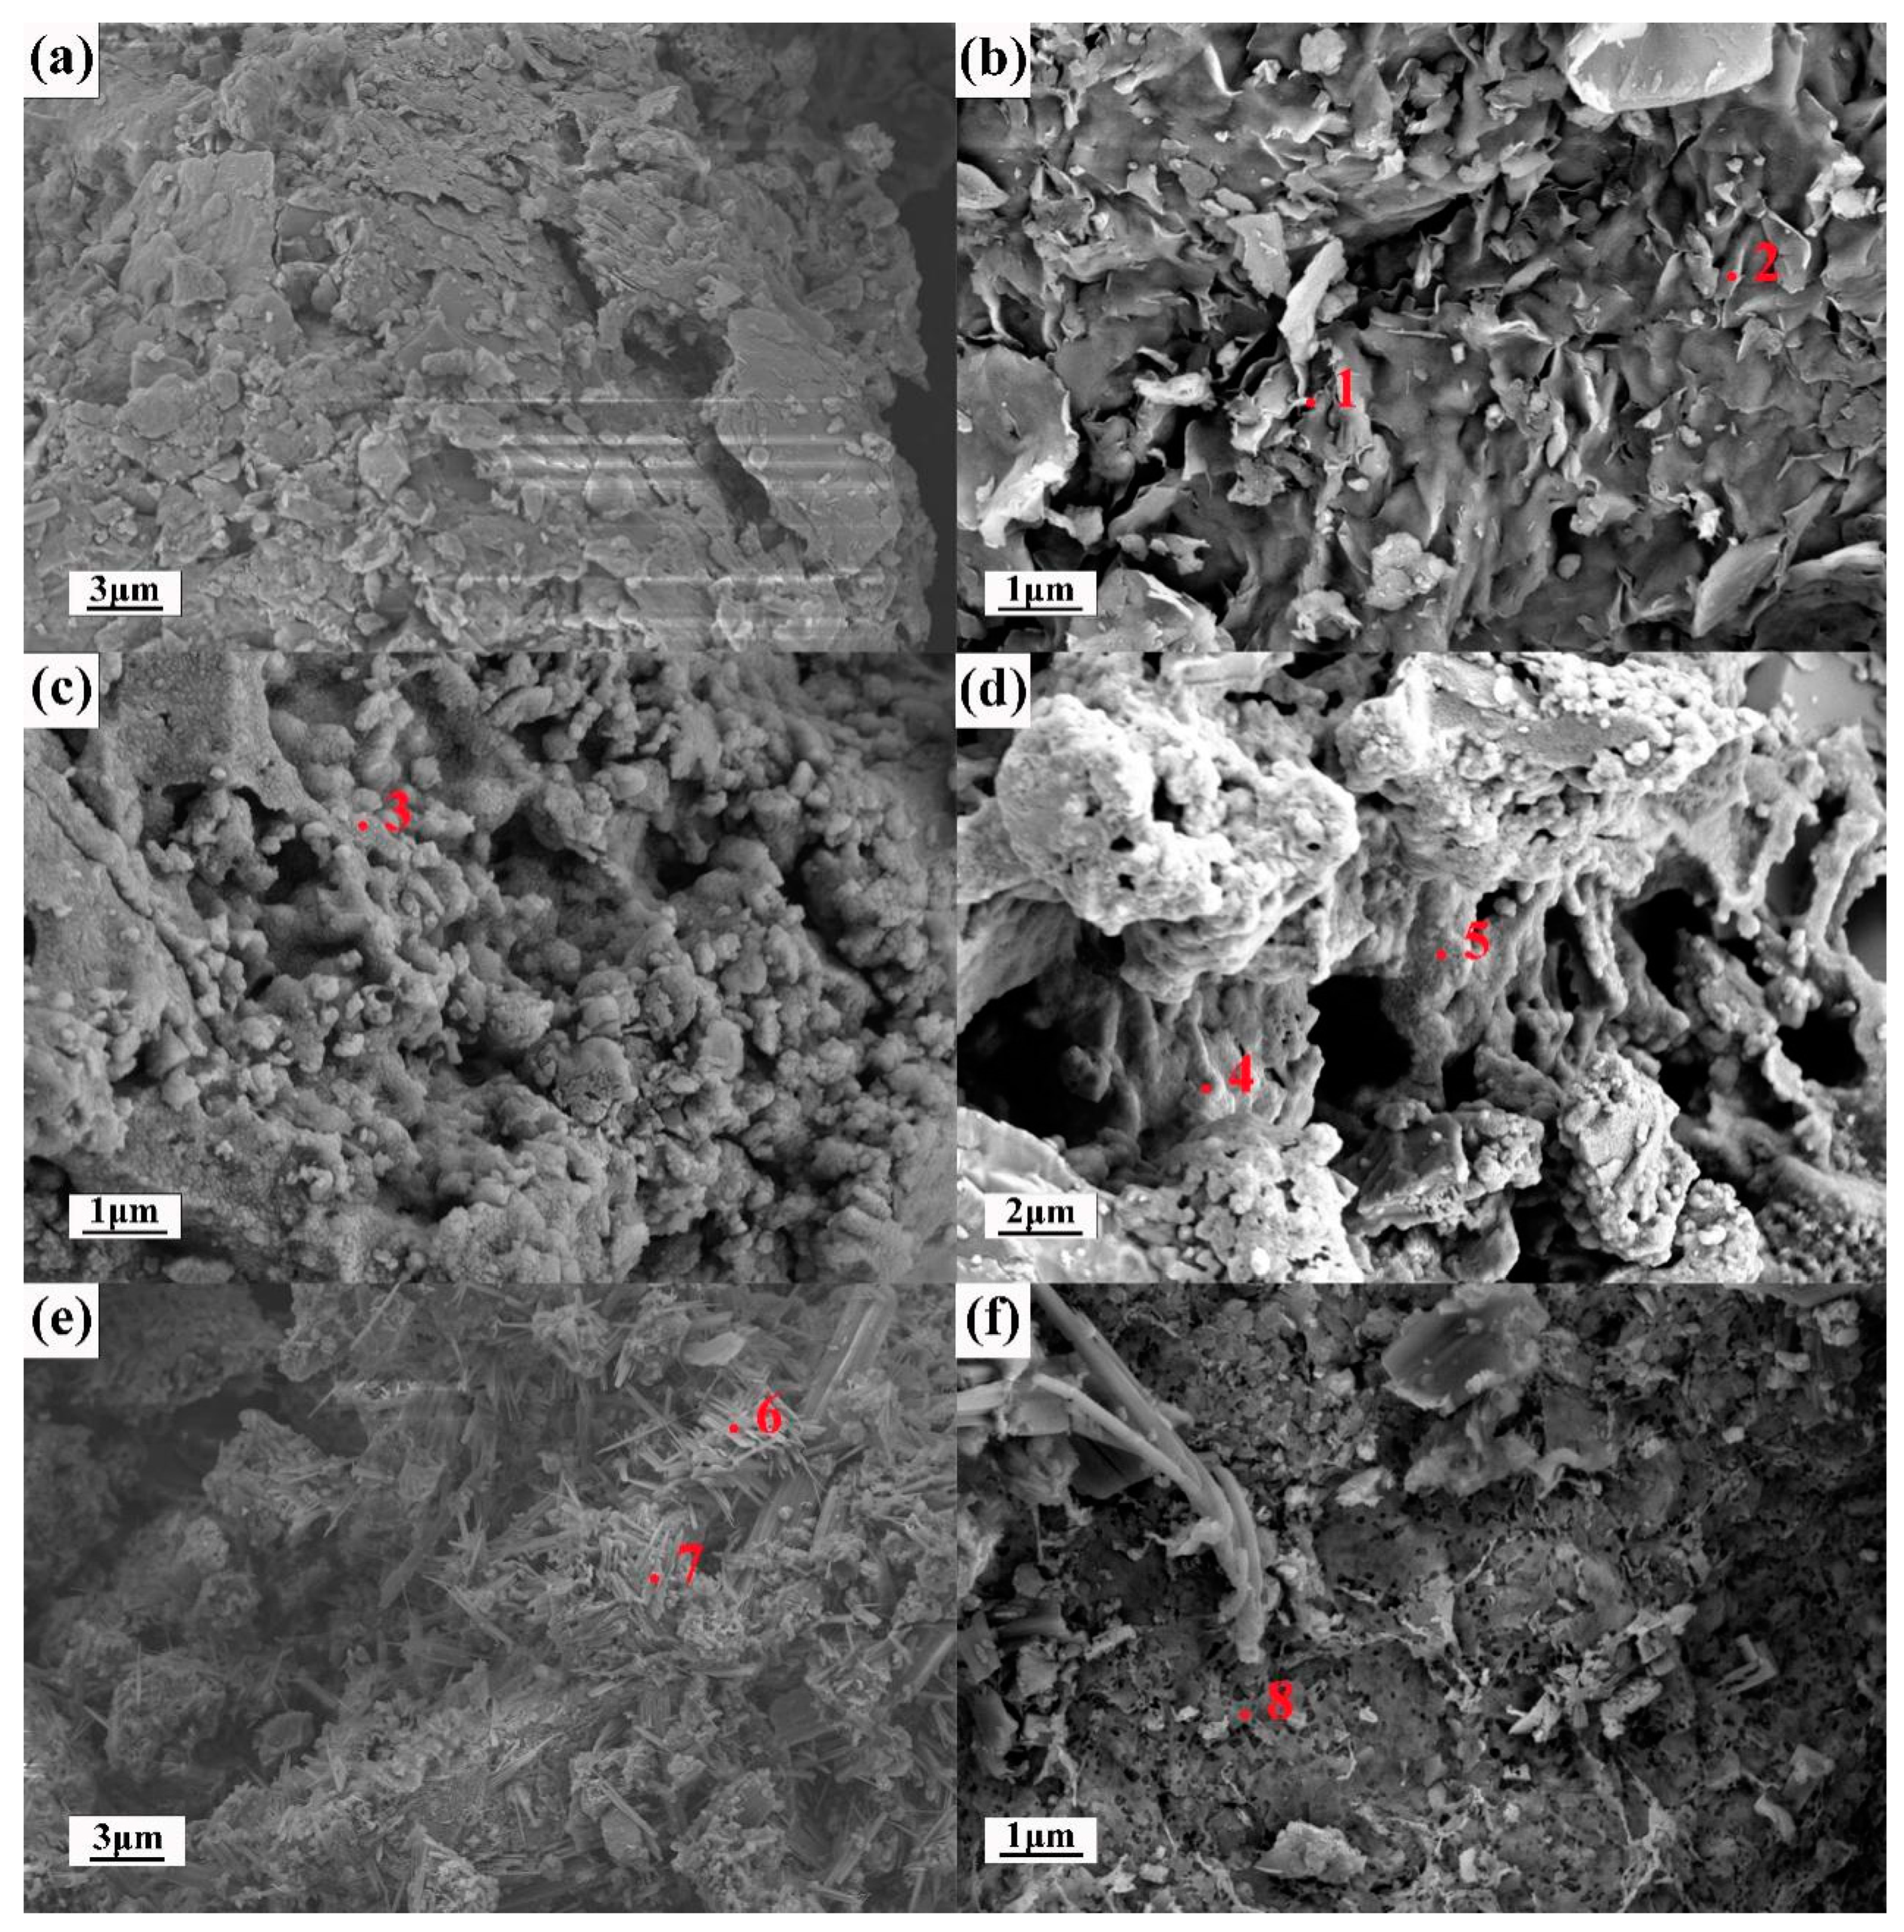
3.6. Microstructure of Residue after Leaching
4. Conclusions
- (1)
- Mechanochemical activation reduced the particle size of the WPS. Mechanochemical activation increases the ion concentration of Si in the leachate after 28 days, and this concentration is affected by the ion concentration of Ca in the leachate. The residual Si in the leachate is limited by the insufficient amount of Ca in the leachate to participate in the precipitation of the newborn minerals and is consumed. In the modification stage of WPS, the mechanochemically activated sample should be mixed with mineral admixtures available as a calcium source to make the interaction more adequate.
- (2)
- WPS can dissolve more ions in higher concentrations of a NaOH solution. When the concentration of the NaOH solution is 5 M, there is a negative effect that the crystallinity of the mineral will be reduced and more ions will be leached out, while these residual ions in the leachate are not consumed to participate generation of new substances. In addition, excess alkali will be carbonized after drying to produce sodium carbonate crystals, which can lead to porosity on the surface of the modified specimens. When the concentration of NaOH solution is 0.5 and 1 M, the amount of Al and Ca ions leached is well enhanced and can be consumed with sufficient participation in the generation of new substances as well as having a better mineral crystallinity compared to other concentrations. Therefore, in the modification stage of WPS, the concentration of alkaline solution should not be too high, around 1 M is sufficient.
- (3)
- The crystallinity of feldspar-like minerals and mica-like minerals in the thermally activated WPS was significantly increased after leaching. Before leaching, the crystallinity of the minerals gradually decreased with the increase in the temperature of thermal activation. However, after leaching, the difference in the crystallinity of the minerals of the samples subjected to different thermal activation temperatures was not significant. This may be due to the fact that the increase in the thermal activation temperature can convert more minerals in WPS to glassy or amorphous forms, which makes ions easier to leach in the alkaline solution. However, the Si in the leachate is limited by the amount of Ca or other substances, resulting in a portion of Si not being able to further develop and reorganize to generate new substances. Therefore, the higher the thermally activated temperature of the WPS the more mineral admixtures with available Ca should be added in the modification stage.
- (4)
- The increase in the curing temperature will promote the interaction between WPS and the alkaline solution. Higher curing temperatures can greatly increase the ion leaching efficiency of Si in a short period of time, and its effect is better than thermal activation. At the same time, it also promotes the generation of newborn minerals and increases the crystallinity of minerals in WPS after leaching. Therefore, higher curing temperatures of modified WPS specimens will facilitate the development of specimens.
Author Contributions
Funding
Data Availability Statement
Conflicts of Interest
References
- Song, T.; Liu, L.; Wang, Y.; Liu, N.; Yu, M. Characteristics and genesis of the bleached Pisha sandstone in Ordos Basin. Oil Gas Geol. 2014, 35, 679–684. (In Chinese) [Google Scholar]
- Li, C.; Song, L.; Cao, Y.; Zhao, S.; Liu, H.; Yang, C.; Cheng, H.; Jia, D. Investigating the Mechanical Property and Enhanced Mechanism of Modified Pisha Sandstone Geopolymer via Ion Exchange Solidification. Gels 2022, 8, 300. [Google Scholar] [CrossRef]
- Li, C.; Dong, J.; Zhao, S.; Liu, H.; Yao, W.; Wang, L. Development of low cost supplementary cementitious materials utilizing thermally activated Pisha sandstone. Constr. Build. Mater. 2018, 174, 484–495. [Google Scholar] [CrossRef]
- Li, C.; Zhang, T.; Wang, L. Mechanical properties and microstructure of alkali activated Pisha sandstone geopolymer composites. Constr. Build. Mater. 2014, 68, 233–239. [Google Scholar] [CrossRef]
- Ye, H.; Shi, J.; Li, X.; Hou, H.; Shi, Y.; Cheng, Y. The Effect of Soft Rock Lithology upon Its Anti-erodibility. Acta Geosci. Sin. 2006, 27, 145–150. (In Chinese) [Google Scholar]
- Wang, L.; Li, C.; Dong, J. Study on Distribution and Lithologic Characters of Feldspathic Sandstone. Yellow River 2013, 35, 91–93. (In Chinese) [Google Scholar]
- Li, C.; Song, L.; Wang, L. Mineral composition and anti-erodibility of Pisha sandstone. Sci. Soil Water Conserv. 2015, 13, 11–16. (In Chinese) [Google Scholar]
- Shi, Y.; Ye, H.; Hou, H.; Bi, Z. The internal cause of the erosion in Pisha sandstone area in Southern inner Mongolia. Acta Geosci. Sin. 2004, 25, 659–664. (In Chinese) [Google Scholar]
- Yang, J.; Fang, D.; Bi, C.; Qiao, W.; Li, G.; Li, W. Action of Seabuckthorn in Freeze-thaw and Weathering Erosion of Small Watershed in Soft Rock Area. J. Soil Water Conserv. 2002, 4, 41–44. (In Chinese) [Google Scholar]
- Wang, Y.; Wu, Y.; Kou, Q.; Min, D.; Chang, Y.; Zhang, R. Definition of arsenic rock zone borderline and its classification. Sci. Soil Water Conserv. 2007, 5, 14–18. (In Chinese) [Google Scholar]
- Bi, C.; Wang, F.; Li, X. Field Test of Seabuckthorn Plant Flexible Dam in Arsenic Sandstone Area. Soil Water Conserv. China 2022, 4, 46–52. (In Chinese) [Google Scholar]
- Xiao, P.; Yao, W.; Liu, H. Research Progress and Harnessing Method of Soil and Water Loss in Pisha sandstone Region. Yellow River 2014, 36, 92–94. (In Chinese) [Google Scholar] [CrossRef]
- Gao, Z.; Yang, S. Existing Problems of Silt Arresters on the Loess Plateau. Bull. Soil Water Conserv. 1999, 6, 16–19. (In Chinese) [Google Scholar]
- Li, C.; Wang, L.; Yang, D.; Zhang, T.; Han, J.; Dong, J. Characters of Montmorillonite of Pisha sandstone. Yellow River 2016, 38, 11–14. (In Chinese) [Google Scholar]
- Li, C.; Wang, L.; Zhang, T.; Dong, J. Development of building material utilizing a low pozzolanic activity mineral. Constr. Build. Mater. 2016, 121, 300–309. [Google Scholar] [CrossRef]
- Li, C.; Zhang, T.; Wang, L. Effect of dosage of fly ash and NaOH on the properties of alkali activated Pisha sandstone-based mortar. ACI Mater. J. 2016, 113, 173–183. [Google Scholar]
- Li, C.; Zhang, T.; Wang, L. Pozzolanic activity of Pisha sandstone and mechanical properties of alkali-activated Pisha sandstone materials. J. Chin. Ceram. Soc. 2015, 43, 1090–1098. (In Chinese) [Google Scholar]
- Yang, D.; Zhang, T.; Han, J.; Dong, J.; Li, C.; Wang, L. Study of Building Check Dam by Using Modified Pisha sandstone. Yellow River 2016, 38, 42–45. (In Chinese) [Google Scholar]
- Petrus, H.T.B.M.; Olvianas, M.; Shafiyurrahman, M.F.; Pratama, I.G.A.A.N.; Jenie, S.N.A.; Astuti, W.; Nurpratama, M.I.; Ekaputri, J.J.; Anggara, F. Circular Economy of Coal Fly Ash and Silica Geothermal for Green Geopolymer: Characteristic and Kinetic Study. Gels 2022, 8, 233. [Google Scholar] [CrossRef]
- Sofi, M.; van Deventer, J.; Mendis, P.; Lukey, G. Engineering properties of inorganic polymer concretes (IPCs). Cem. Concr. Res. 2007, 37, 251–257. [Google Scholar] [CrossRef]
- Kljajević, L.; Nenadović, M.; Ivanović, M.; Bučevac, D.; Mirković, M.; Nikolić, N.M.; Nenadović, S. Heat Treatment of Geopolymer Samples Obtained by Varying Concentration of Sodium Hydroxide as Constituent of Alkali Activator. Gels 2022, 8, 333. [Google Scholar] [CrossRef] [PubMed]
- Yao, G.; Cui, T.; Zhang, J.; Wang, J.; Lyu, X. Effects of mechanical grinding on pozzolanic activity and hydration properties of quartz. Adv. Powder Technol. 2020, 31, 4500–4509. [Google Scholar] [CrossRef]
- Yao, G.; Wang, Z.; Yao, J.; Cong, X.; Anning, C.; Lyu, X. Pozzolanic activity and hydration properties of feldspar after mechanical activation. Powder Technol. 2021, 383, 167–174. [Google Scholar] [CrossRef]
- Vizcayno, C.; de Gutiérrez, R.M.; Castello, R.; Rodriguez, E.; Guerrero, C. Pozzolan obtained by mechanochemical and thermal treatments of kaolin. Appl. Clay Sci. 2010, 49, 405–413. [Google Scholar] [CrossRef]
- Luukkonen, T.; Abdollahnejad, Z.; Yliniemi, J.; Kinnunen, P.; Illikainen, M. One-part alkali-activated materials: A review. Cem. Concr. Res. 2018, 103, 21–34. [Google Scholar] [CrossRef]
- Topolska, J.; Puzio, B.; Borkiewicz, O.; Sordy, J.; Manecki, M. Solubility Product of Vanadinite Pb5(VO4)3Cl at 25 °C—A Comprehensive Approach to Incongruent Dissolution Modeling. Minerals 2021, 11, 135. [Google Scholar] [CrossRef]
- Yang, F.; Li, Q.; Wang, D.; Zhou, C.; Zheng, S. Interfacial Structure Change and Selective Dissolution of Columbite–(Fe) Mineral during HF Acid Leaching. Minerals 2021, 11, 146. [Google Scholar] [CrossRef]
- Yuan, J.; Ma, H.; Luo, Z.; Ma, X.; Guo, Q. Synthesis of KAlSiO4 by Hydrothermal Processing on Biotite Syenite and Dissolution Reaction Kinetics. Minerals 2020, 11, 36. [Google Scholar] [CrossRef]
- House, W.A.; Orr, D.R. Investigation of the pH dependence of the kinetics of quartz dissolution at 25 °C. J. Chem. Soc. Faraday Trans. 1992, 88, 233–241. [Google Scholar] [CrossRef]
- Gitari, W.M.; Fatoba, O.O.; Petrik, L.F.; Vadapalli, V.R. Leaching characteristics of selected South African fly ashes: Effect of pH on the release of major and trace species. J. Environ. Sci. Heal. Part A 2009, 44, 206–220. [Google Scholar] [CrossRef] [PubMed]
- Terry, B. The acid decomposition of silicate minerals part II. Hydrometallurgical applications. Hydrometallurgy 1983, 10, 151–171. [Google Scholar] [CrossRef]
- Terry, B. Specific chemical rate constants for the acid dissolution of oxides and silicates. Hydrometallurgy 1983, 11, 315–344. [Google Scholar] [CrossRef]
- Crundwell, F.K. The mechanism of dissolution of minerals in acidic and alkaline solutions: Part II Application of a new theory to silicates, aluminosilicates and quartz. Hydrometallurgy 2014, 149, 265–275. [Google Scholar] [CrossRef]
- Souri, A.; Kazemi-Kamyab, H.; Snellings, R.; Naghizadeh, R.; Golestani-Fard, F.; Scrivener, K. Pozzolanic activity of mechanochemically and thermally activated kaolins in cement. Cem. Concr. Res. 2015, 77, 47–59. [Google Scholar] [CrossRef]
- Fernandez, R.; Martirena, F.; Scrivener, K.L. The origin of the pozzolanic activity of calcined clay minerals: A comparison between kaolinite, illite and montmorillonite. Cem. Concr. Res. 2011, 41, 113–122. [Google Scholar] [CrossRef]
- Song, T.; Tian, Z.; Liu, L.; Wang, S.; Wang, J. Dissolution of Acetic Acid Solution of Alkali Feldspar and Study on Its Numerical Simulation. Mineral Petrol. 2017, 37, 1–5. (In Chinese) [Google Scholar]
- Crundwell, F.K. The mechanism of dissolution of minerals in acidic and alkaline solutions: Part I—A new theory of non-oxidation dissolution. Hydrometallurgy 2014, 149, 252–264. [Google Scholar] [CrossRef]
- Skrobian, M.; Havlik, T.; Ukasik, M. Effect of NaCl concentration and particle size on chalcopyrite leaching in cupric chloride solution. Hydrometallurgy 2005, 77, 109–114. [Google Scholar] [CrossRef]
- Faraji, F.; Alizadeh, A.; Rashchi, F.; Mostoufi, N. Kinetics of leaching: A review. Rev. Chem. Eng. 2020, 38, 113–148. [Google Scholar] [CrossRef]
- Lin, P.; Zeng, L.; He, D.; Ding, Y. Reaction and Its Kinetics of Montmorillonite, Quartz with Alkaline Solution. Chem. Eng. Oil Gas 2002, 31, 144–149. (In Chinese) [Google Scholar]
- Bocullo, V.; Vitola, L.; Vaiciukyniene, D.; Kantautas, A.; Bajare, D. The influence of the SiO2/Na2O ratio on the low calcium alkali activated binder based on fly ash. Mater. Chem. Phys. 2021, 258, 123846. [Google Scholar] [CrossRef]


| Series | Activation of WPS | Density/(kg·m−3) | Series | Activation of WPS | Density/(kg·m−3) |
|---|---|---|---|---|---|
| WPS | -- | 2530 | SG * | Grinding | 2670 |
| SC6 † | 600 °C | 2523 | SC6G ‡ | 600 °C and Grinding | 2720 |
| SC7 | 700 °C | 2536 | SC7G | 700 °C and Grinding | 2710 |
| SC8 | 800 °C | 2525 | SC8G | 800 °C and Grinding | 2725 |
| Solid Type | Concentration of Alkaline Solutions/(mol/L) | Curing Age/(days) | |||||||
|---|---|---|---|---|---|---|---|---|---|
| 0 | 0.05 | 0.1 | 0.5 | 1.0 | 2.0 | 5.0 | 20 °C | 80 °C | |
| WPS | Si, Ca | Si, Ca | Si, Ca, Al | Si, Ca | Si, Ca, Al | Si, Ca | Si, Ca, Al | 1, 3, 7, 14, 28 | 0.5, 1, 3 |
| SG | / | Si, Ca | Si, Ca, Al | Si, Ca | Si, Ca, Al | Si, Ca | Si, Ca, Al | 1, 3, 7, 14, 28 | / |
| SC6 | / | Si, Ca | Si, Ca, Al | Si, Ca | Si, Ca, Al | Si, Ca | Si, Ca, Al | 1, 3, 7, 14, 28 | / |
| SC6G | / | Si, Ca | Si, Ca, Al | Si, Ca | Si, Ca, Al | Si, Ca | Si, Ca, Al | 1, 3, 7, 14, 28 | 0.5, 1, 3 |
| SC7G | / | / | / | / | Si, Ca, Al | / | Si, Ca, Al | 1, 3, 7, 14, 28 | / |
| SC8G | / | / | / | / | Si, Ca, Al | / | Si, Ca, Al | 1, 3, 7, 14, 28 | / |
| Conc of Si (mg/L) | 0 | 0.5 | 1 | 2 | 3 | 4 | 5 |
|---|---|---|---|---|---|---|---|
| Absorbance (L/(g·cm)) | 0 | 0.2265 | 0.4581 | 0.9155 | 1.3715 | 1.8668 | 2.2869 |
| Conc of Al (μg/L) | 0 | 25 | 50 | 75 | 100 |
|---|---|---|---|---|---|
| Absorbance (L/(g·cm)) | 0 | 0.09196 | 0.15598 | 0.20917 | 0.27388 |
| Sample | SiO2 | Al2O3 | CaO | Na2O | K2O | MgO | Fe203 | TiO2 | P2O5 | Other |
|---|---|---|---|---|---|---|---|---|---|---|
| WPS | 61.50 | 17.96 | 5.75 | 1.35 | 2.67 | 4.36 | 5.16 | 0.83 | 0.19 | 0.23 |
| SC6 | 62.27 | 17.90 | 5.01 | 1.56 | 3.07 | 4.07 | 4.90 | 0.77 | 0.21 | 0.24 |
| SC8 | 61.63 | 18.03 | 5.43 | 1.62 | 3.09 | 4.04 | 4.91 | 0.76 | 0.21 | 0.28 |
| Plot | Element | ||||||
|---|---|---|---|---|---|---|---|
| C | O | Na | Mg | Al | Si | Ca | |
| 1 | 3.85 | 60.55 | 0.08 | 2.63 | 8.92 | 22.87 | 1.11 |
| 2 | 6.26 | 59.8 | 0.04 | 2.53 | 8.56 | 21.39 | 1.42 |
| 3 | 8.4 | 51.43 | 22.61 | 2.57 | 2.18 | 11.78 | 1.04 |
| 4 | 5.96 | 37.13 | 15.78 | 2.5 | 3.42 | 33.42 | 1.79 |
| 5 | 4.93 | 41.14 | 23.45 | 1.77 | 7.11 | 20.2 | 1.39 |
| 6 | 18.28 | 45.76 | 32.29 | 0.67 | 0.52 | 0.97 | 1.51 |
| 7 | 10.97 | 41.87 | 29.89 | 0.75 | 3.53 | 11.89 | 1.1 |
| 8 | 3.43 | 56.83 | 2.05 | 6.92 | 7.28 | 21.36 | 2.13 |
Disclaimer/Publisher’s Note: The statements, opinions and data contained in all publications are solely those of the individual author(s) and contributor(s) and not of MDPI and/or the editor(s). MDPI and/or the editor(s) disclaim responsibility for any injury to people or property resulting from any ideas, methods, instructions or products referred to in the content. |
© 2023 by the authors. Licensee MDPI, Basel, Switzerland. This article is an open access article distributed under the terms and conditions of the Creative Commons Attribution (CC BY) license (https://creativecommons.org/licenses/by/4.0/).
Share and Cite
Li, C.; Cheng, H.; Cao, Y.; Ding, C.; Jia, D.; Zhao, S.; Yang, C. Dissolution Characteristics and Microstructure of Waste Pisha Sandstone Minerals in Alkaline Solutions. Minerals 2023, 13, 378. https://doi.org/10.3390/min13030378
Li C, Cheng H, Cao Y, Ding C, Jia D, Zhao S, Yang C. Dissolution Characteristics and Microstructure of Waste Pisha Sandstone Minerals in Alkaline Solutions. Minerals. 2023; 13(3):378. https://doi.org/10.3390/min13030378
Chicago/Turabian StyleLi, Changming, Haifeng Cheng, Yali Cao, Cong Ding, Dongyang Jia, Shunbo Zhao, and Chen Yang. 2023. "Dissolution Characteristics and Microstructure of Waste Pisha Sandstone Minerals in Alkaline Solutions" Minerals 13, no. 3: 378. https://doi.org/10.3390/min13030378
APA StyleLi, C., Cheng, H., Cao, Y., Ding, C., Jia, D., Zhao, S., & Yang, C. (2023). Dissolution Characteristics and Microstructure of Waste Pisha Sandstone Minerals in Alkaline Solutions. Minerals, 13(3), 378. https://doi.org/10.3390/min13030378