Abstract
This article presents the dynamic process of the three-phase contact (TPC) formation by colliding bubbles onto muscovite and talc surfaces in water and two types of solutions including cationic CTAC surfactant (cetyltrimethyl ammoniumchloride) and anionic NaOL surfactant (sodium oleate). The TPC formation process was observed through the high-speed camera between bubbles and layered silicate minerals (hydrophilic muscovite and hydrophobic talc). It was found that the rupture of the liquid film between the bubbles and the mineral surface is a prerequisite for TPC formation. In the case of muscovite, TPC was formed only with cationic CTAC, and as the surfactant concentration increased, the time needed for TPC formation was shortened. Due to electrostatic repulsion, TPC did not occur in water and NaOL. However, for talc, TPC occurred both in water and in surfactant solutions. In contrast to muscovite, the time of TPC formation on the talc surface was prolonged with the increase in the surfactant concentration. It was concluded that hydrophobic attraction and electrostatic attraction between mineral surfaces and bubbles can significantly promote the localized foam film rupture, which was the main reason for the TPC appearance in water and surfactants. For the hydrophilic muscovite, CTAC adsorption improved the surface hydrophobicity; I3/I1 in fluorescence spectroscopy increased, and the micro-polarity faded, making TPC formation need more time. However, for the natural hydrophobic talc, the increasing surfactant adsorption decreased I3/I1 values and enhanced the local micro-polarity, causing the extension of time for TPC. Therefore, TPC formation for different minerals resulted from different reasons.
1. Introduction
In the froth flotation beneficiation method, the interaction between mineral particles and bubbles is a primary process for collecting valuable components. In order to attach the bubbles onto the particle surfaces in a short time, three consecutive steps have to be performed: (1) liquid film thinning between the bubble and mineral surfaces to its critical thickness, (2) foam film rupturing and initial three-phase contact (TPC) nucleus occurring, and (3) initial TPC expanding to a stable wetting perimeter [1,2,3]. The adhesion and stability of mineral–bubble aggregates in a pulp system may be affected by the formation of TPC during their collisions [4]. Generally, the more hydrophobic the mineral surface, the more unstable the liquid film, the more prone it is to rupture, and the more likely it is that TPC will form. In the case of hydrophobic minerals, although the repulsion force was presented in pulp according to the DLVO theory (Derjaguin–Landau–Verwey–Overbeek theory), the liquid film was still very easy to break. This phenomenon has been explained by Deryagin et al. [5] through the nucleation mechanism.
The interaction process of bubbles and minerals is usually divided into the following three stages [6]: (1) collision-rebound, (2) adhesion, and (3) desorption. When the bubble approaches the mineral surface to a certain distance, the collision-rebound process occurs, but the bubble does not necessarily adhere to the mineral surface. The breakage of the liquid film and the formation of TPC is a prerequisite condition for the stable adhesion [1,7,8]. The rate of the bubble rise in aqueous solution was affected by many factors, including the bubble size, liquid/gas phase viscosity and density, surfactant adsorption, and liquid/gas interface properties [9,10,11,12]. In the surfactant solution, the surface-active substance (SAS) was adsorbed on the surface of the bubbles to form an adsorbed layer, which reduced the fluidity and increased the viscous resistance. The existence of viscous resistance in the continuous medium caused the uneven adsorption formed on the surface of rising bubbles; that is, a dynamic adsorption layer (DAL) happened [13].
Muscovite and talc, as typical hydrophilic and hydrophobic silicate minerals, are both 2:1 structures, with an octahedral layer sandwiched between two tetrahedral layers [14,15]. Different types of surfactants are usually applied in their flotation separation from gangue minerals, taking the role of collectors including cationic, anionic, and mixed cationic/anionic surfactants [16,17]. For muscovite, its natural floatability is not good enough due to its hydrophilicity and negative charges on the muscovite surface. Thus, cationic surfactant collectors are mainly utilized in the flotation. Xie Zhen [18] investigated the adsorption morphology of dodecyltrimethylammonium chloride (DTAC) and cetyltrimethylammonium chloride (CTAC) on the muscovite surface and the interaction force between the solid/liquid interface through the atomic force microscope (AFM). Longhua Xu [16] found that the combined collector of cationic dodecylamine (DDA) and anionic sodium oleate (NaOL) could improve the muscovite flotation recovery, compared with their single collectors. However, in the case of natural hydrophobic talc, it is floated without any collector, making it usually depressed in reverse flotation [19,20,21]. Carboxymethyl cellulose (CMC) has been confirmed as an effective depressant for talc floatability and is favorable to its separation from chalcopyrite [22].
In this study, it was found that the conclusion that the increase in time for TPC was bad for mineral flotation was only applicable for hydrophilic minerals [23], while it cannot be established for hydrophobic minerals. Besides, the time of TPC has not be disassembled to analyze the detailed reasons, and the changes in collision-rebound time and drainage time have also not been explained clearly. The present research work was primarily aimed to study the kinetics of the three-phase contact formation by colliding bubbles onto the muscovite and the talc surface in water and solutions of two types of surfactants, cationic CTAC (cetyltrimethyl ammoniumchloride) and anionic NaOL (sodium oleate). Bubble deformation in water and surfactants was also studied to get the bubble changes during their rising process. In addition, the three-phase contact formation mechanism was analyzed, and the collision-rebound process in different solutions with different mineral surfaces was detailed for better explanation of macroscopic phenomenon in froth flotation.
2. Materials and Methods
2.1. Samples and Chemicals
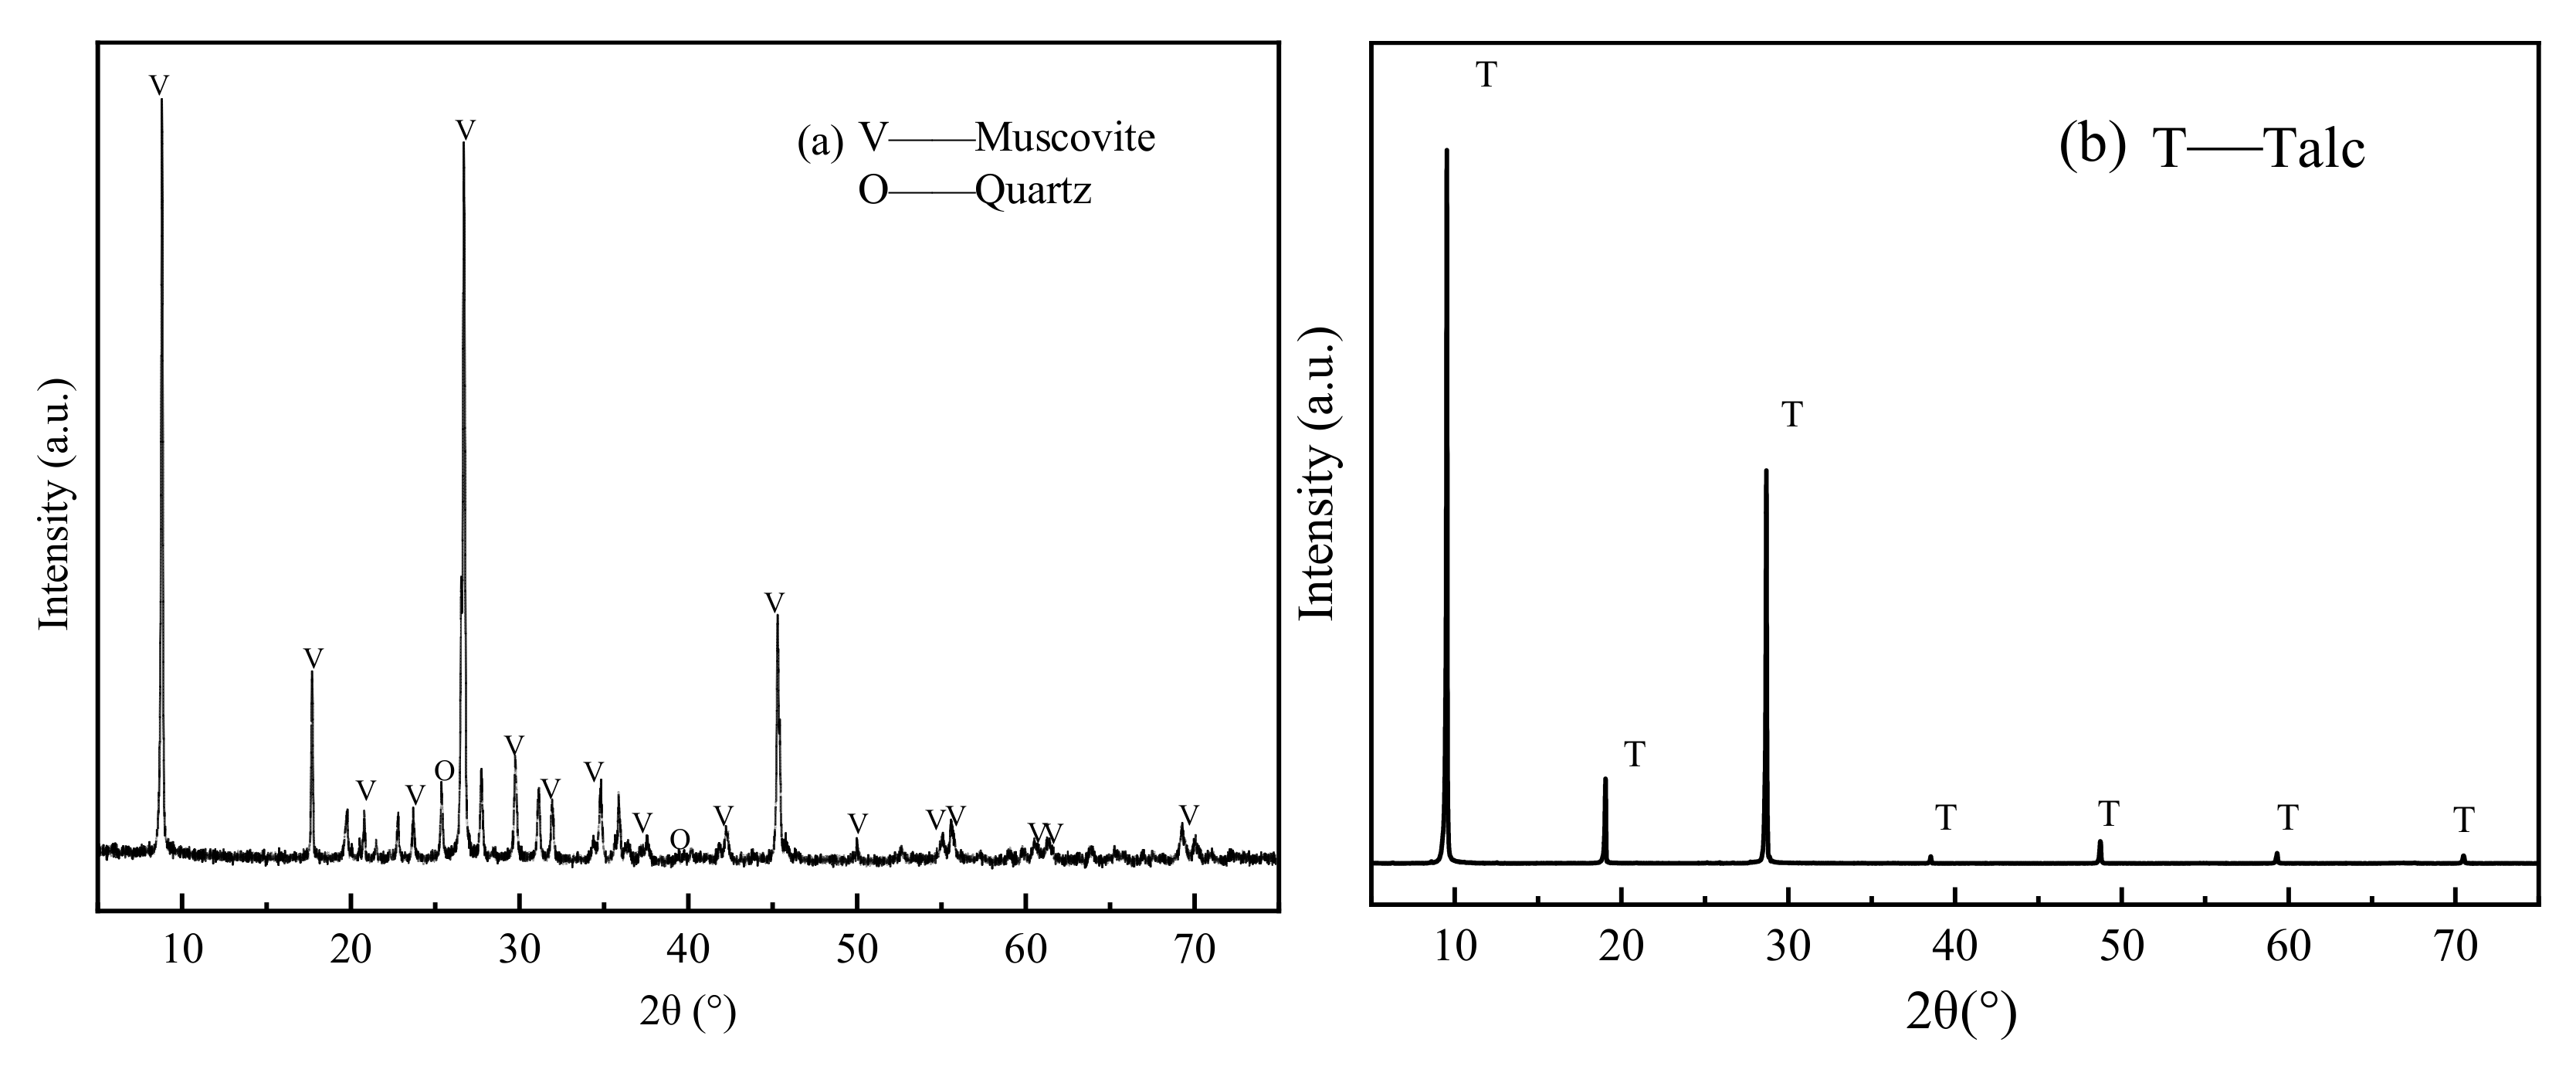
Samples of muscovite and talc required in this research were purchased from TED PELLA Co., Ltd., Pella, CA, USA and Kuandian, Dandong, China, respectively. The muscovite was a kind of high-purity V1 flake, while the talc samples were freshly cleaved into sheets for the measurements of three-phase contact line formation as it has perfect cleavages along basal planes. Chemical composition and X-ray diffractometry (XRD) were executed to examine the purity of muscovite and talc minerals. The results given in Table 1 and Figure 1 demonstrate that the purity of samples was good enough to be applied in this investigation.

Table 1.
Chemical composition of mineral samples (mass fraction, %).
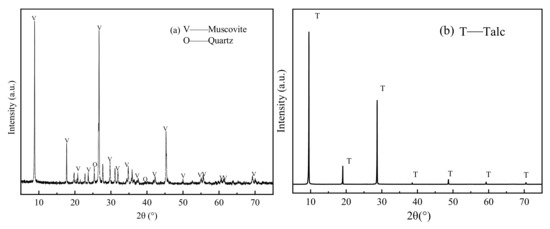
Figure 1.
XRD patterns of muscovite and talc samples: (a) muscovite; (b) talc.
Different surfactants including cationic cetyltrimethyl ammoniumchloride (CTAC) and anionic sodium oleate (NaOL) of chemical purity were purchased from Sinopharm Chemical Reagent Co., Ltd., Shanghai, China. Both of these reagents are the typical collectors in the flotation of layered silicate muscovite and talc minerals. Absolute ethanol of analytical grade from Damao Chemical Reagent Factory, Tianjin, China was utilized to clean the mineral surfaces. Ultrapure water was used throughout the study.
2.2. Methods
2.2.1. Experimental Apparatus
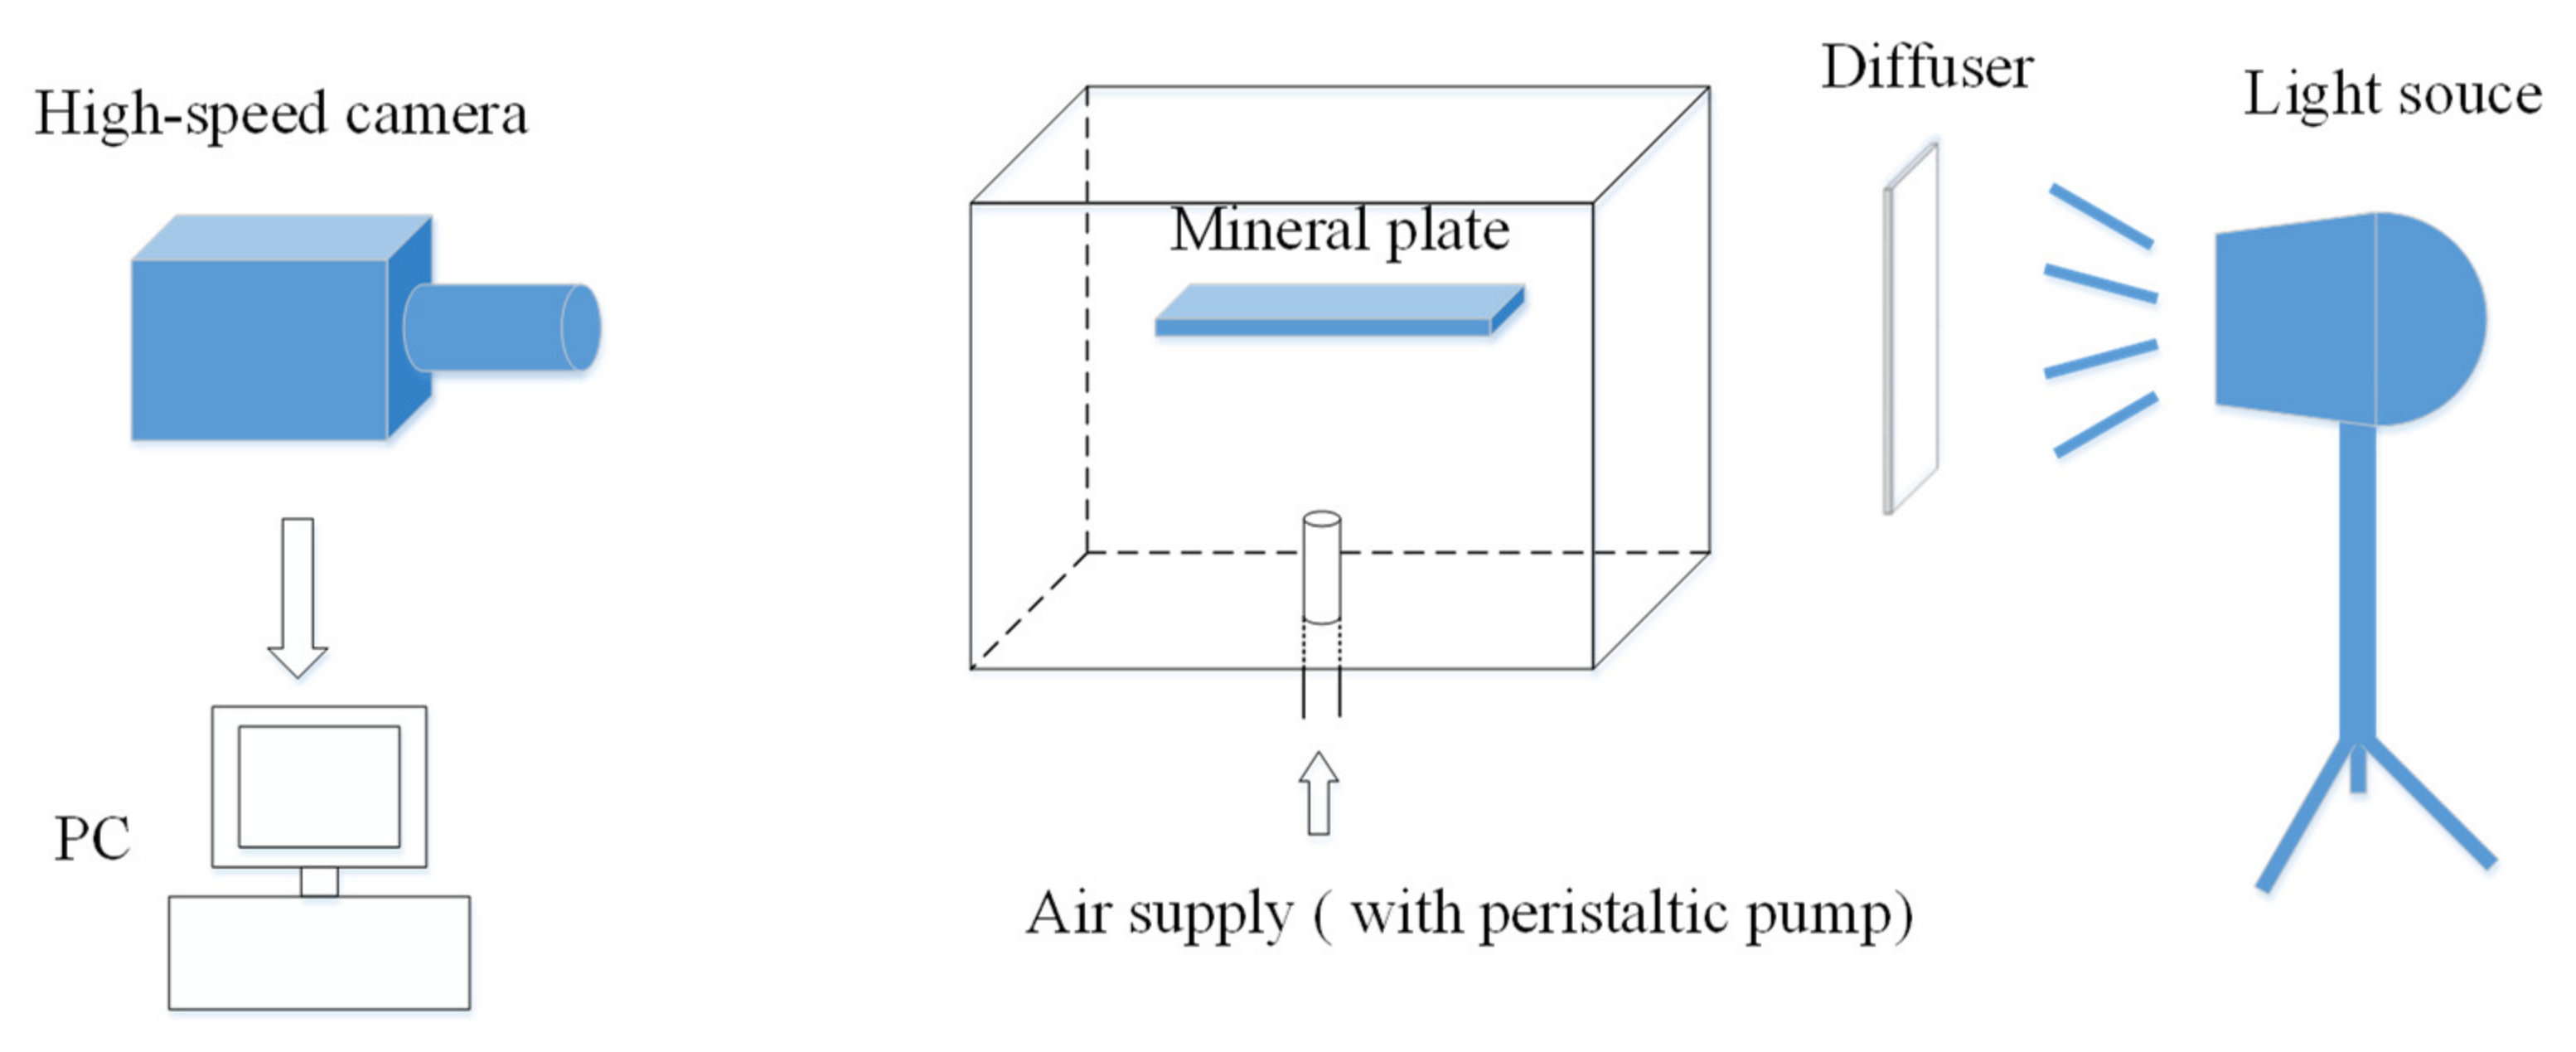
The self-made apparatus (shown in Figure 2) was used to observe the collision-rebound process between bubbles and minerals and the formation of the three-phase contact line. It mainly consists of the following parts: (1) A square glass tank with an internal cross-sectional area of 120 mm × 60 mm; (2) a capillary with an inner diameter of 0.2 mm was employed to generate some single bubbles; (3) a small peristaltic pump for precise control of inflation; (4) a high-speed camera (Y3M, Integrated Design Tools, Collerville, IA, USA) with a microscope lens (Olympus SZ61); (5) a light source and its diffuser to ensure sufficient and uniform light distribution; (6) a computer with image-processing software (Image J) installed.
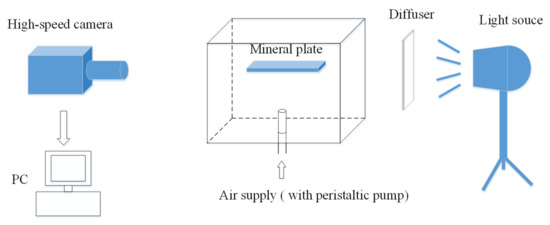
Figure 2.
Schematic diagram of the experimental apparatus for observing the collision-rebound process between bubbles and minerals.
2.2.2. Measurements of Bubble Deformation
Using the self-made device shown in Figure 2, the deformation of bubbles was observed. The high-speed photo was recorded with every rising single bubble in the deionized water and CTAC and NaOL solutions separately at the rate of 2000 frames/s. (The interval between two photos was 0.5 ms). A consistent rate of rise from the peristaltic pump was achieved to produce a single bubble, and the ascending bubble then was not affected by the newly generated one. Finally, deformation of the bubbles under different conditions was computed by the Image J software. The bubbles in aqueous solution were approximately ellipses, and (x, y) is supposed as its centroid coordinate; then, the aspect ratio () is:
where AR is the bubble aspect ratio, and and are the major and minor axes of the ellipse, respectively.
If , the bubble can be regarded as the sphere, otherwise it will be considered as the ellipse. The larger the AR, the flatter the bubbles will be. The bubble velocity can be calculated as:
where yi is the ordinate value of the bubble in frame i; Δt is the interval time between two photos, namely, Δt = 0.5 ms.
2.2.3. Stability Assessment of Bubble at the Gas/Liquid Interface
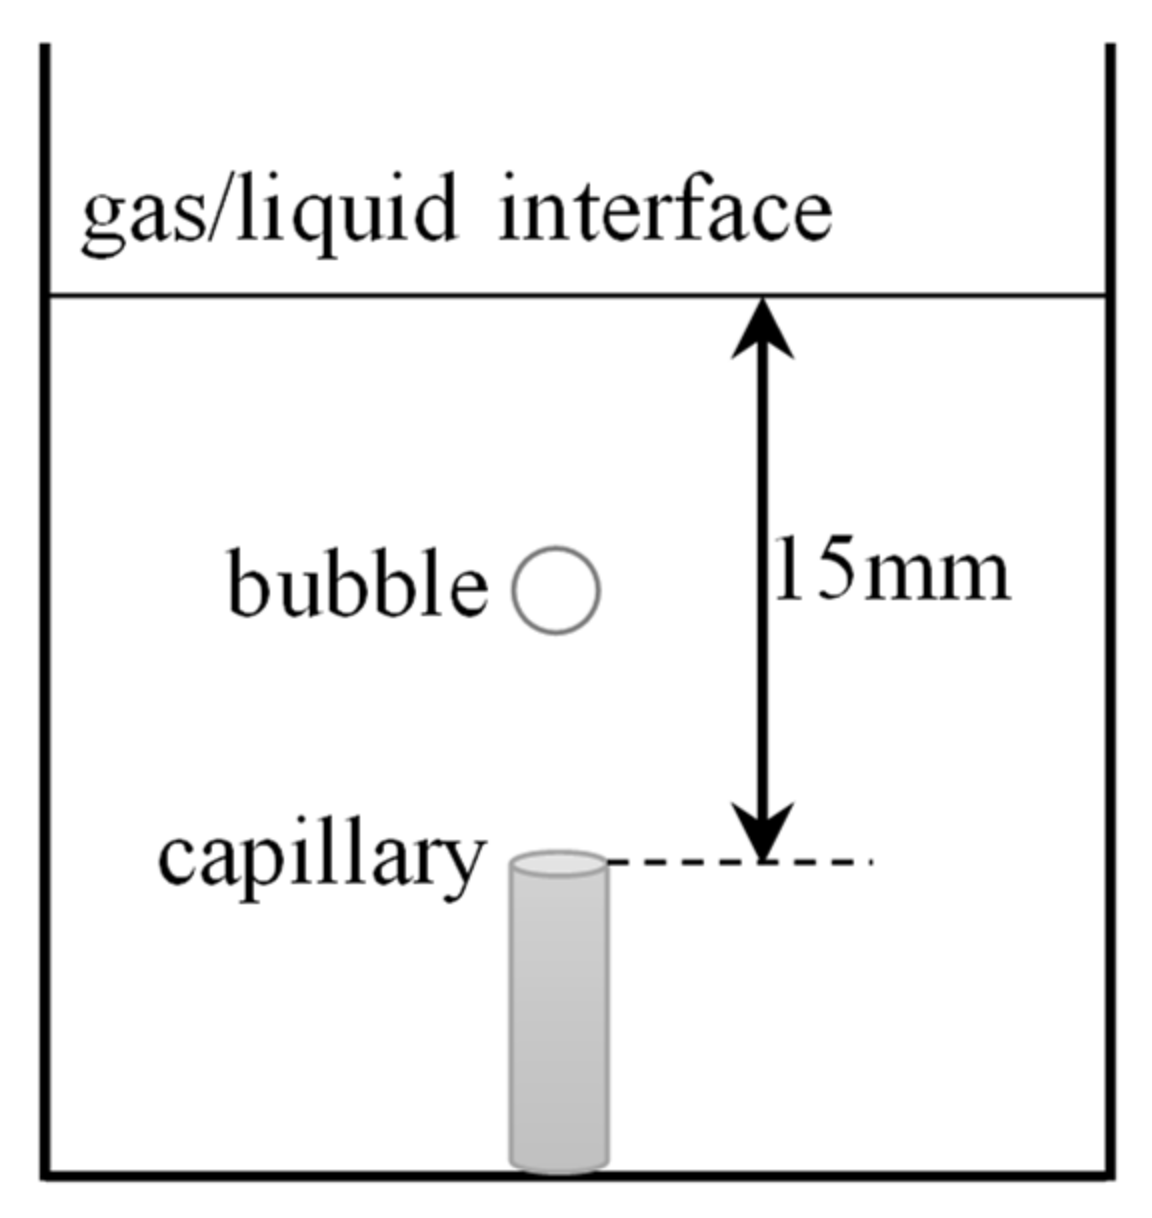
In order to explore the bubble stability at the gas/liquid interface in different surfactant solutions and the effect dynamic adsorption on the bubble surface, the bubble rupture time was studied, and the liquid level was fixed at 15 mm shown in Figure 3. After separation from the capillary orifice, the bubble will move upward immediately to approach and touch the liquid surface, and then it will rebound to the solution. Finally, the bubble remains under the liquid level for a period of time until it breaks and disappears after several collisions and rebounds. The time when the bubble first touches the liquid surface was defined as the initial time (t = 0). The time span from the first collision-rebound to the kinetic energy dissipation (static state) was the collision-rebound time tB. The interval from the static state to its burst is called the drainage time tD. Then, the bubble rupture time tP can be calculated as:

Figure 3.
Schematic diagram of the bubble burst time under liquid level at 15 mm.
The measurements were conducted over 10 times with the same procedure and conditions, and the average was reported as a final value.
2.2.4. Three-Phase Contact Formation
The formation process of the three-phase contact (TPC) line was performed in the self-made apparatus shown in Figure 2. The freshly cleaved muscovite and talc sheets were fixed by a pair of tweezers and immersed into the prepared surfactant solution 15 mm away from the capillary opening. Switch on the small peristaltic pump to produce the bubble as soon as possible (avoid contamination of fresh mineral surfaces), meanwhile turn on the high-speed camera to record the bubble movement path, its collision-rebound with the mineral flake, and the formation process of TPC line. All of these procedures should be finished in 30 s. Afterwards, the muscovite and talc sheets were washed with absolute ethanol and ultrapure water, respectively, and desiccated. The used surface was removed by a tape to make the new fresh surface exposed for the next measurement. Each test was conducted over 10 times, and the averages of tB, tD, and tTPC were reported as the final values.
2.2.5. Fluorescence Spectrum Analysis
The pyrene fluorescence spectrum of muscovite and talc reacted with or without the collector was measured by Hitachi F-7000 Fluorescence. Of a 1 × 10⁻⁵ mol/L pyrene ethanol solution, 0.3 mL, a certain concentration of surfactant solution, and 0.2 g pure mineral samples were successively added into a 50 mL conical flask and then diluted to the scale line by adding ultra-pure water. After that, the flask was shaken in the thermostatic oscillator for 24 h, and some pulp mixture was taken and transferred into the quartz cuvette for fluorescence spectrum analysis. The fluorescence excitation wavelength was 335 nm, while the emission wavelength was 350~500 nm. The scanning speed was set at 1200 nm/min. The excitation slit and the emission slit were controlled at 10 nm and 2.5 nm, respectively.
3. Results and Discussion
3.1. Bubble Deformation and Stability Analysis in Surfactant Solutions
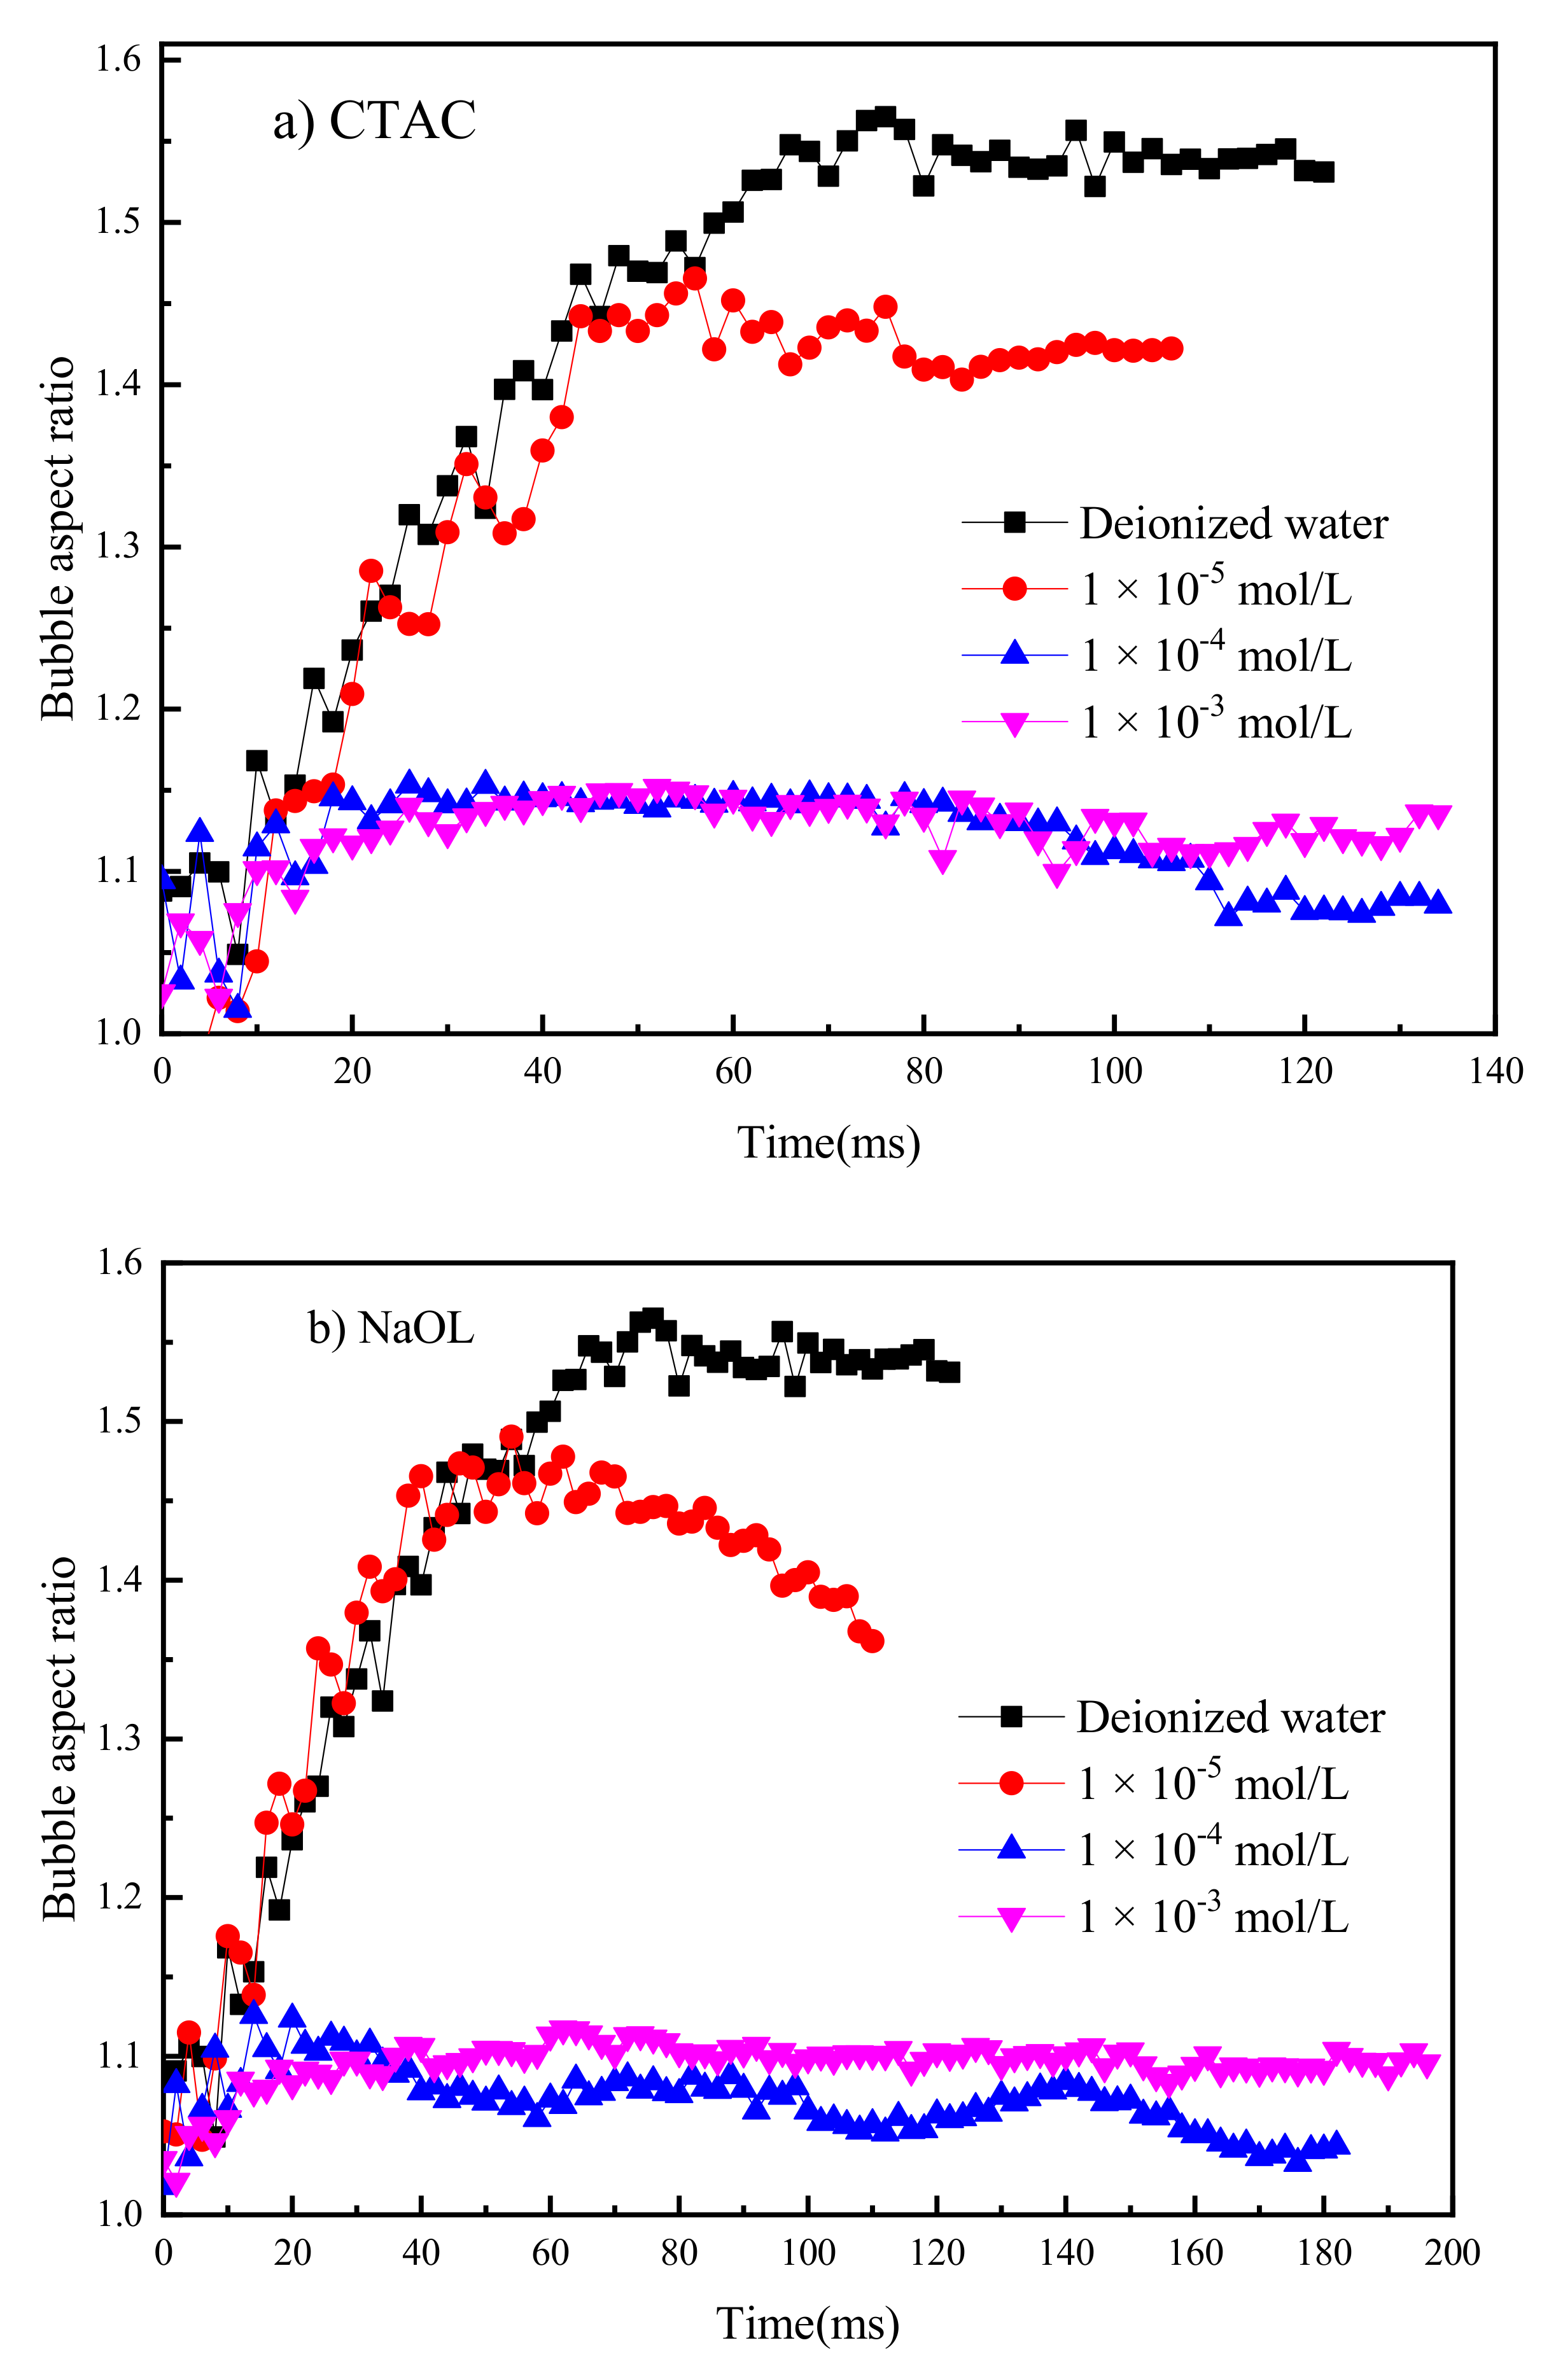
The shape and stability of bubbles were affected by different surfactant systems. As mentioned earlier, the aspect ratio of bubbles indicates the deformation degree of bubbles. From Figure 4, it was found that the concentration had a significant impact on the bubble deformation when no mineral particles were introduced into the system. The aspect ratio of bubbles increased at first, and then tended to be stable with the rising process of bubbles. Increasing the concentration of surfactant can reduce the deformation degree of the bubble and shorten the time to reach the stable state. Additionally, at the same concentration, the aspect ratio of bubbles in NaOL was the smallest, which is closer to the sphere, that is, the stability of bubbles in NaOL solution was better. When the bubble rose to the liquid/gas interface, its contact with the air made the bubble break in both deionized water and surfactant solutions. However, the higher the surfactant solution, the longer the time needed for the bubble to burst. This means at the liquid/gas interface, the surfactant is conducive to make the bubble more stable. The phenomenon in Figure 4 may be conjectured and deduced that when the bubble is generated (has not separated from the capillary yet), the surfactant has been adsorbed on the bubble surface. When the bubble departs from the capillary and rises in solutions, some adsorbed surfactant molecules will slide to the bottom of the bubble under the inertia action, making the adsorbed reagent distribute unevenly on the bubble surface. This caused the Marangoni effect, which reduced the bubble surface fluidity and made the bubble deformed during the rising process [23]. However, when the bubble closed to the liquid/gas interface, the lagging surfactant molecule would move again to the top of the bubble under the action of the surface-tension gradient, tending to recover its distribution on the bubble surface.
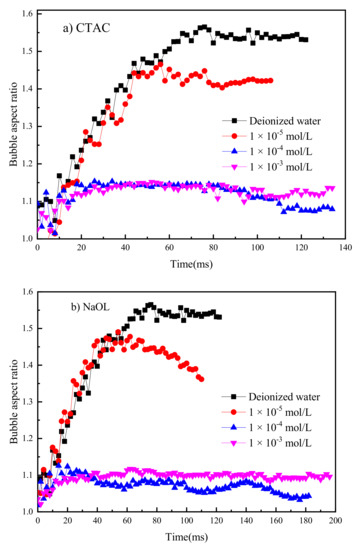
Figure 4.
Bubble aspect-ratio change with time in different surfactant solutions. (a) CTAC; (b) DDA.
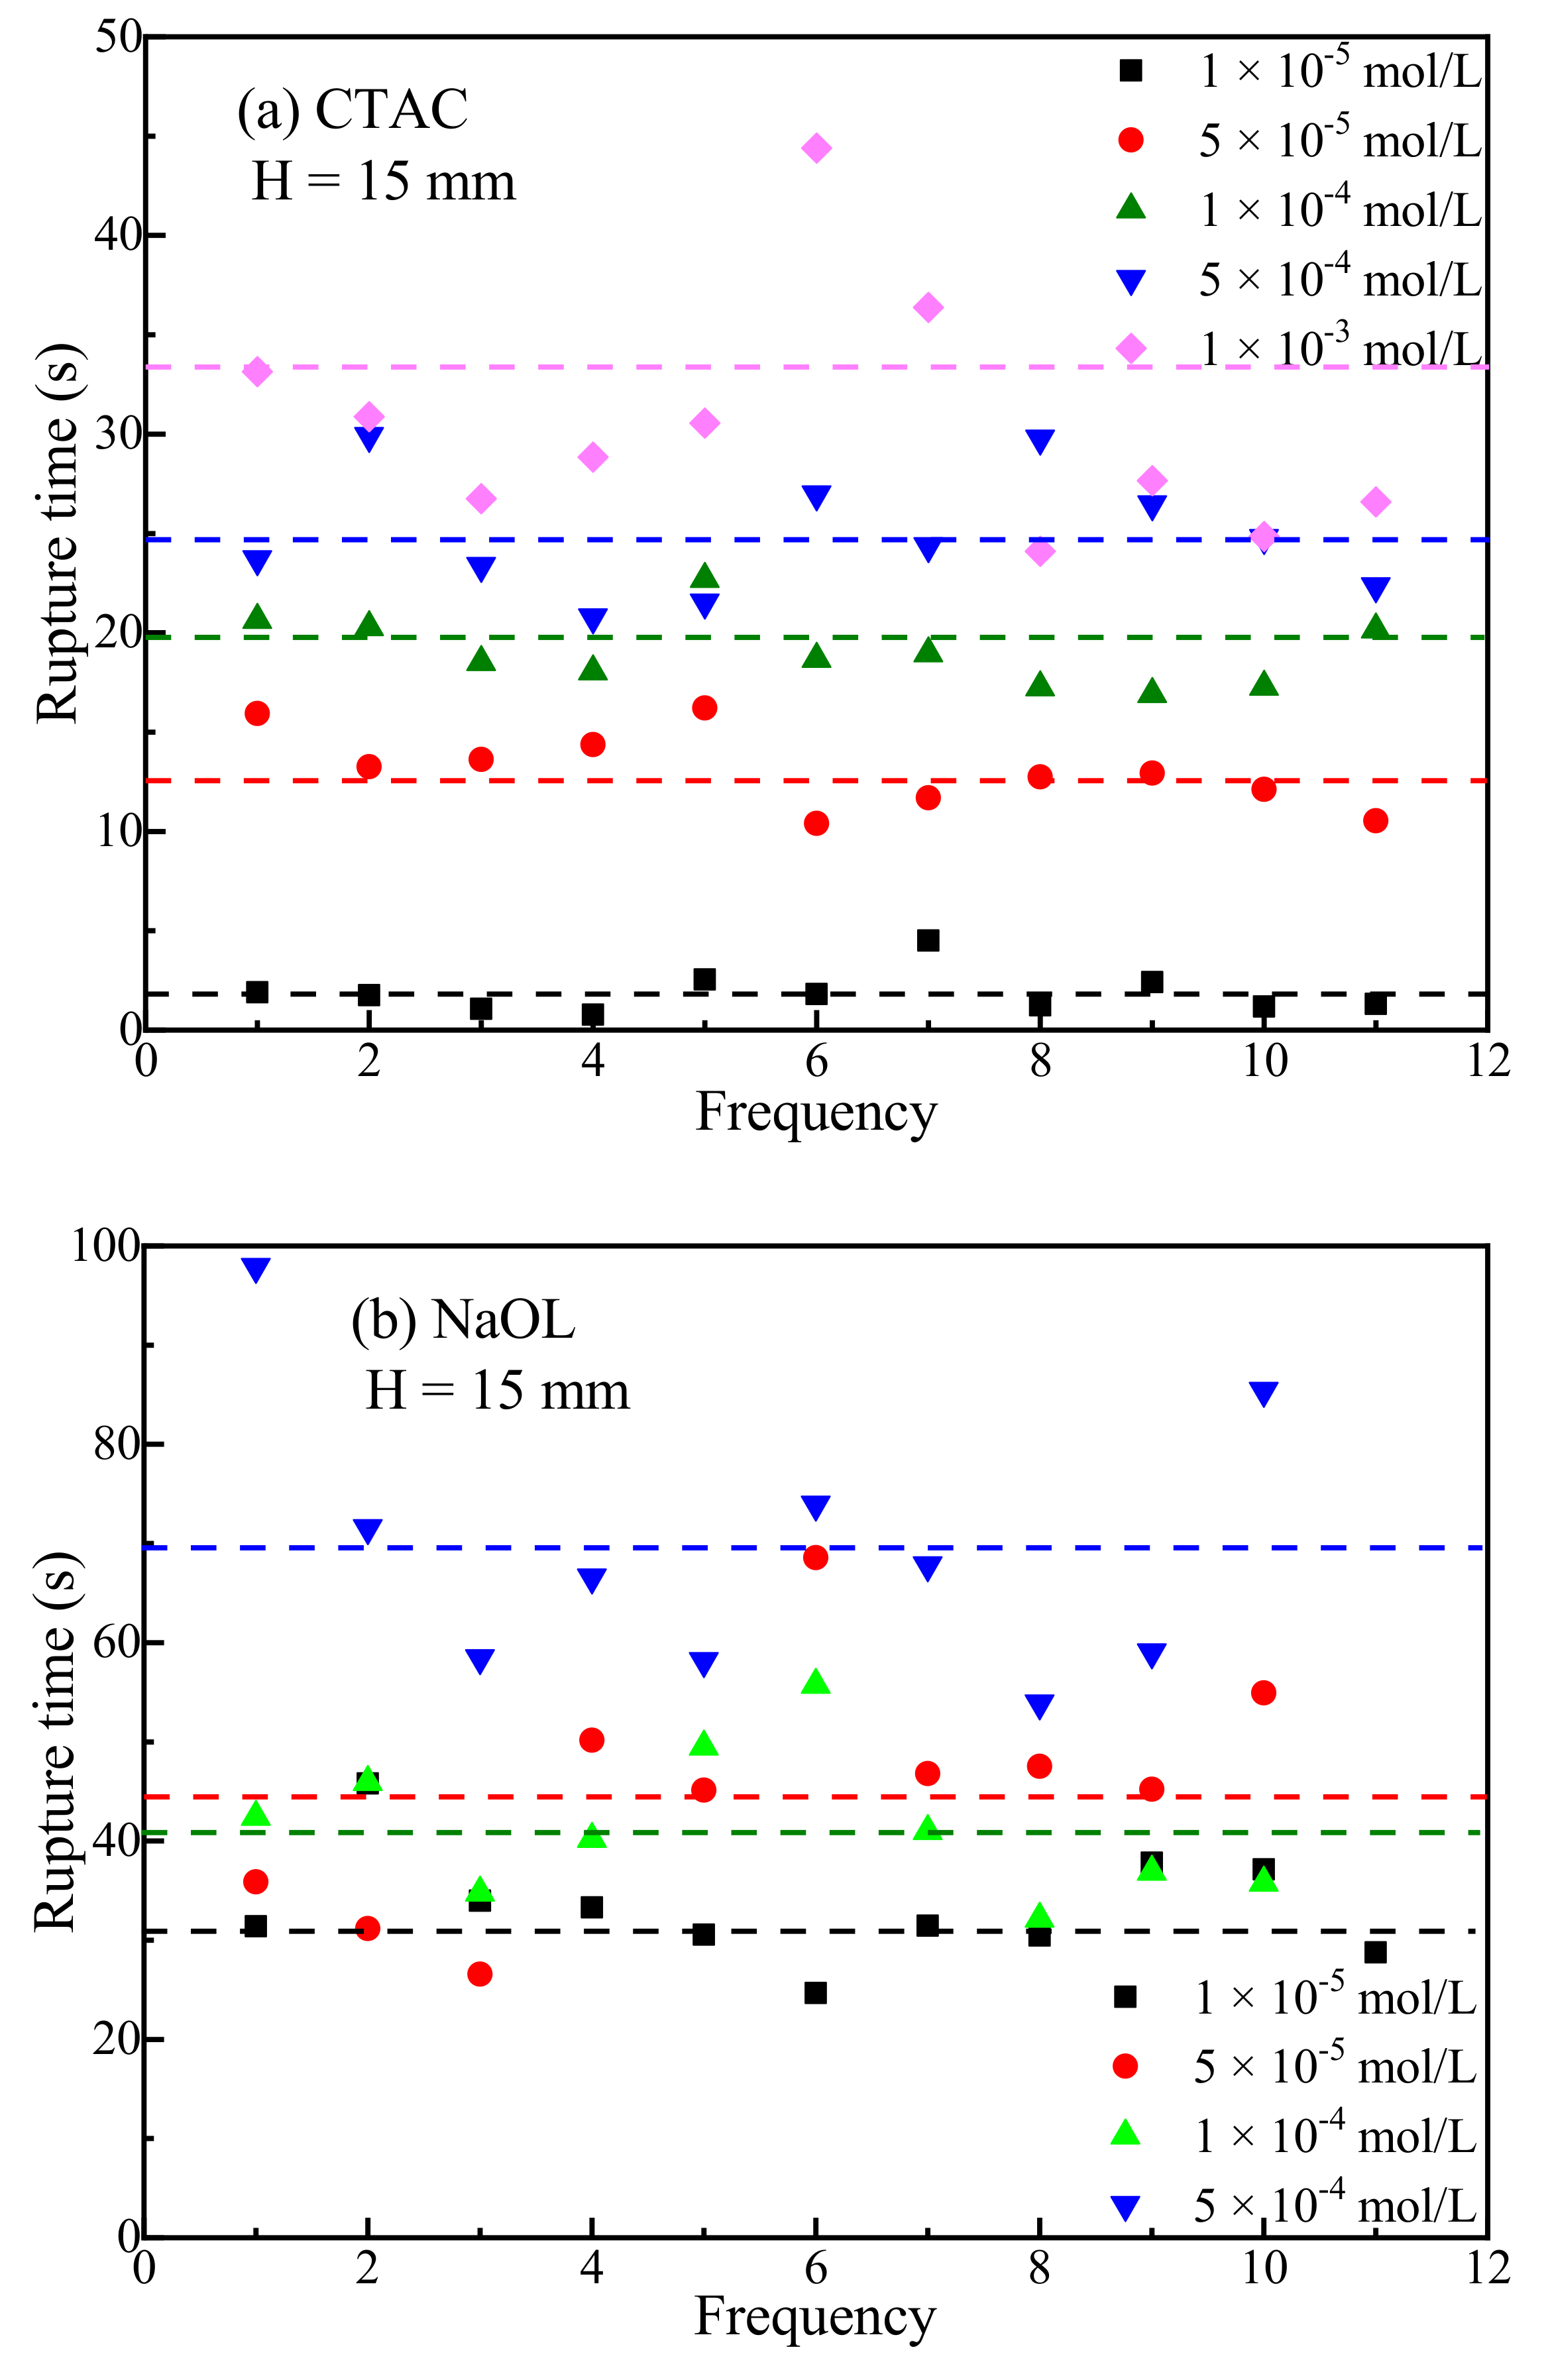
The bubble stability in this study means its rupture time. The longer it takes for the bubble to rupture, the more stable the bubble. That is to say, the time of the bubble existence corresponds to its stability. The bubble rupture time in the CTAC and NaOL solutions was also investigated and repeated some times. The result at different times is shown in Figure 5 in which the liquid level was fixed at 15 mm. It can be seen that there is a great relationship between the type and concentration of the surfactant and the bubble burst time. In the same solution, the rupture time was prolonged with the increase in its concentration, and the bubble became more stable. It was also found that the deviation become greater at a higher concentration where the bubble was more susceptible to be disturbed by the liquid level. The average values in Figure 5 have been calculated in Table 2. For the CTAC solution, the rupture time extended from 1.866 s to 30.376 s. However, 33.220 s was required for NaOL at 1 × 10⁻⁵ mol/L. Therefore, the bubbles in the NaOL solution were far more stable than those in the CTAC solution.
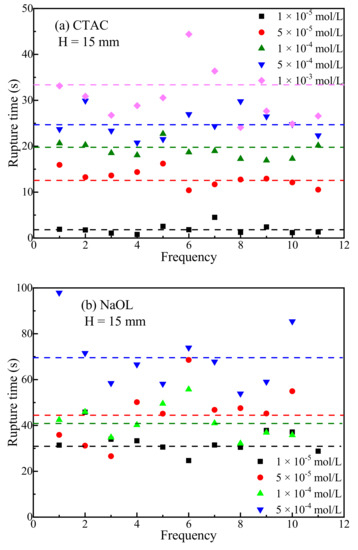
Figure 5.
Bubble rupture time in (a) CTAC and (b) NaOL solutions with different concentrations.
Table 2.
Bubble rupture time in different surfactant solutions at H = 15 mm (s).
It took 972 ms for the bubble to burst in deionized water, but, in surfactant solutions, the rupture time was much longer than that in water, indicating that the surfactant can make the bubble stronger due to the surfactant adsorption on the bubble surface. This can be explained from the surface-tension gradients action on the liquid surface [9], which resulted from the bubble movement and solution surface deformation (extension). It was the surface-tension gradient that stopped the bubble rupturing owing to the formation of a stable foam film. In the surfactant solution, the direction of the surface-tension gradients was opposite to that of the liquid flow from the thin liquid layer. These surface-tension gradients, which had a tendency to restore uniform adsorption coverage at the deformed liquid/gas interface, resulted in the surfactant molecules motion together with adjoining liquid layers and slowing down the film thinning.
3.2. Three-Phase Contact Formation
Similar to Figure 3, the liquid level was replaced by the mineral flakes, which were immersed in solutions and fixed at 15 mm away from the capillary orifice. Before the measurements, all of the flakes were freshly cleaved to better observe the formation of TPC with mineral surfaces.
3.2.1. TPC on Muscovite Surface
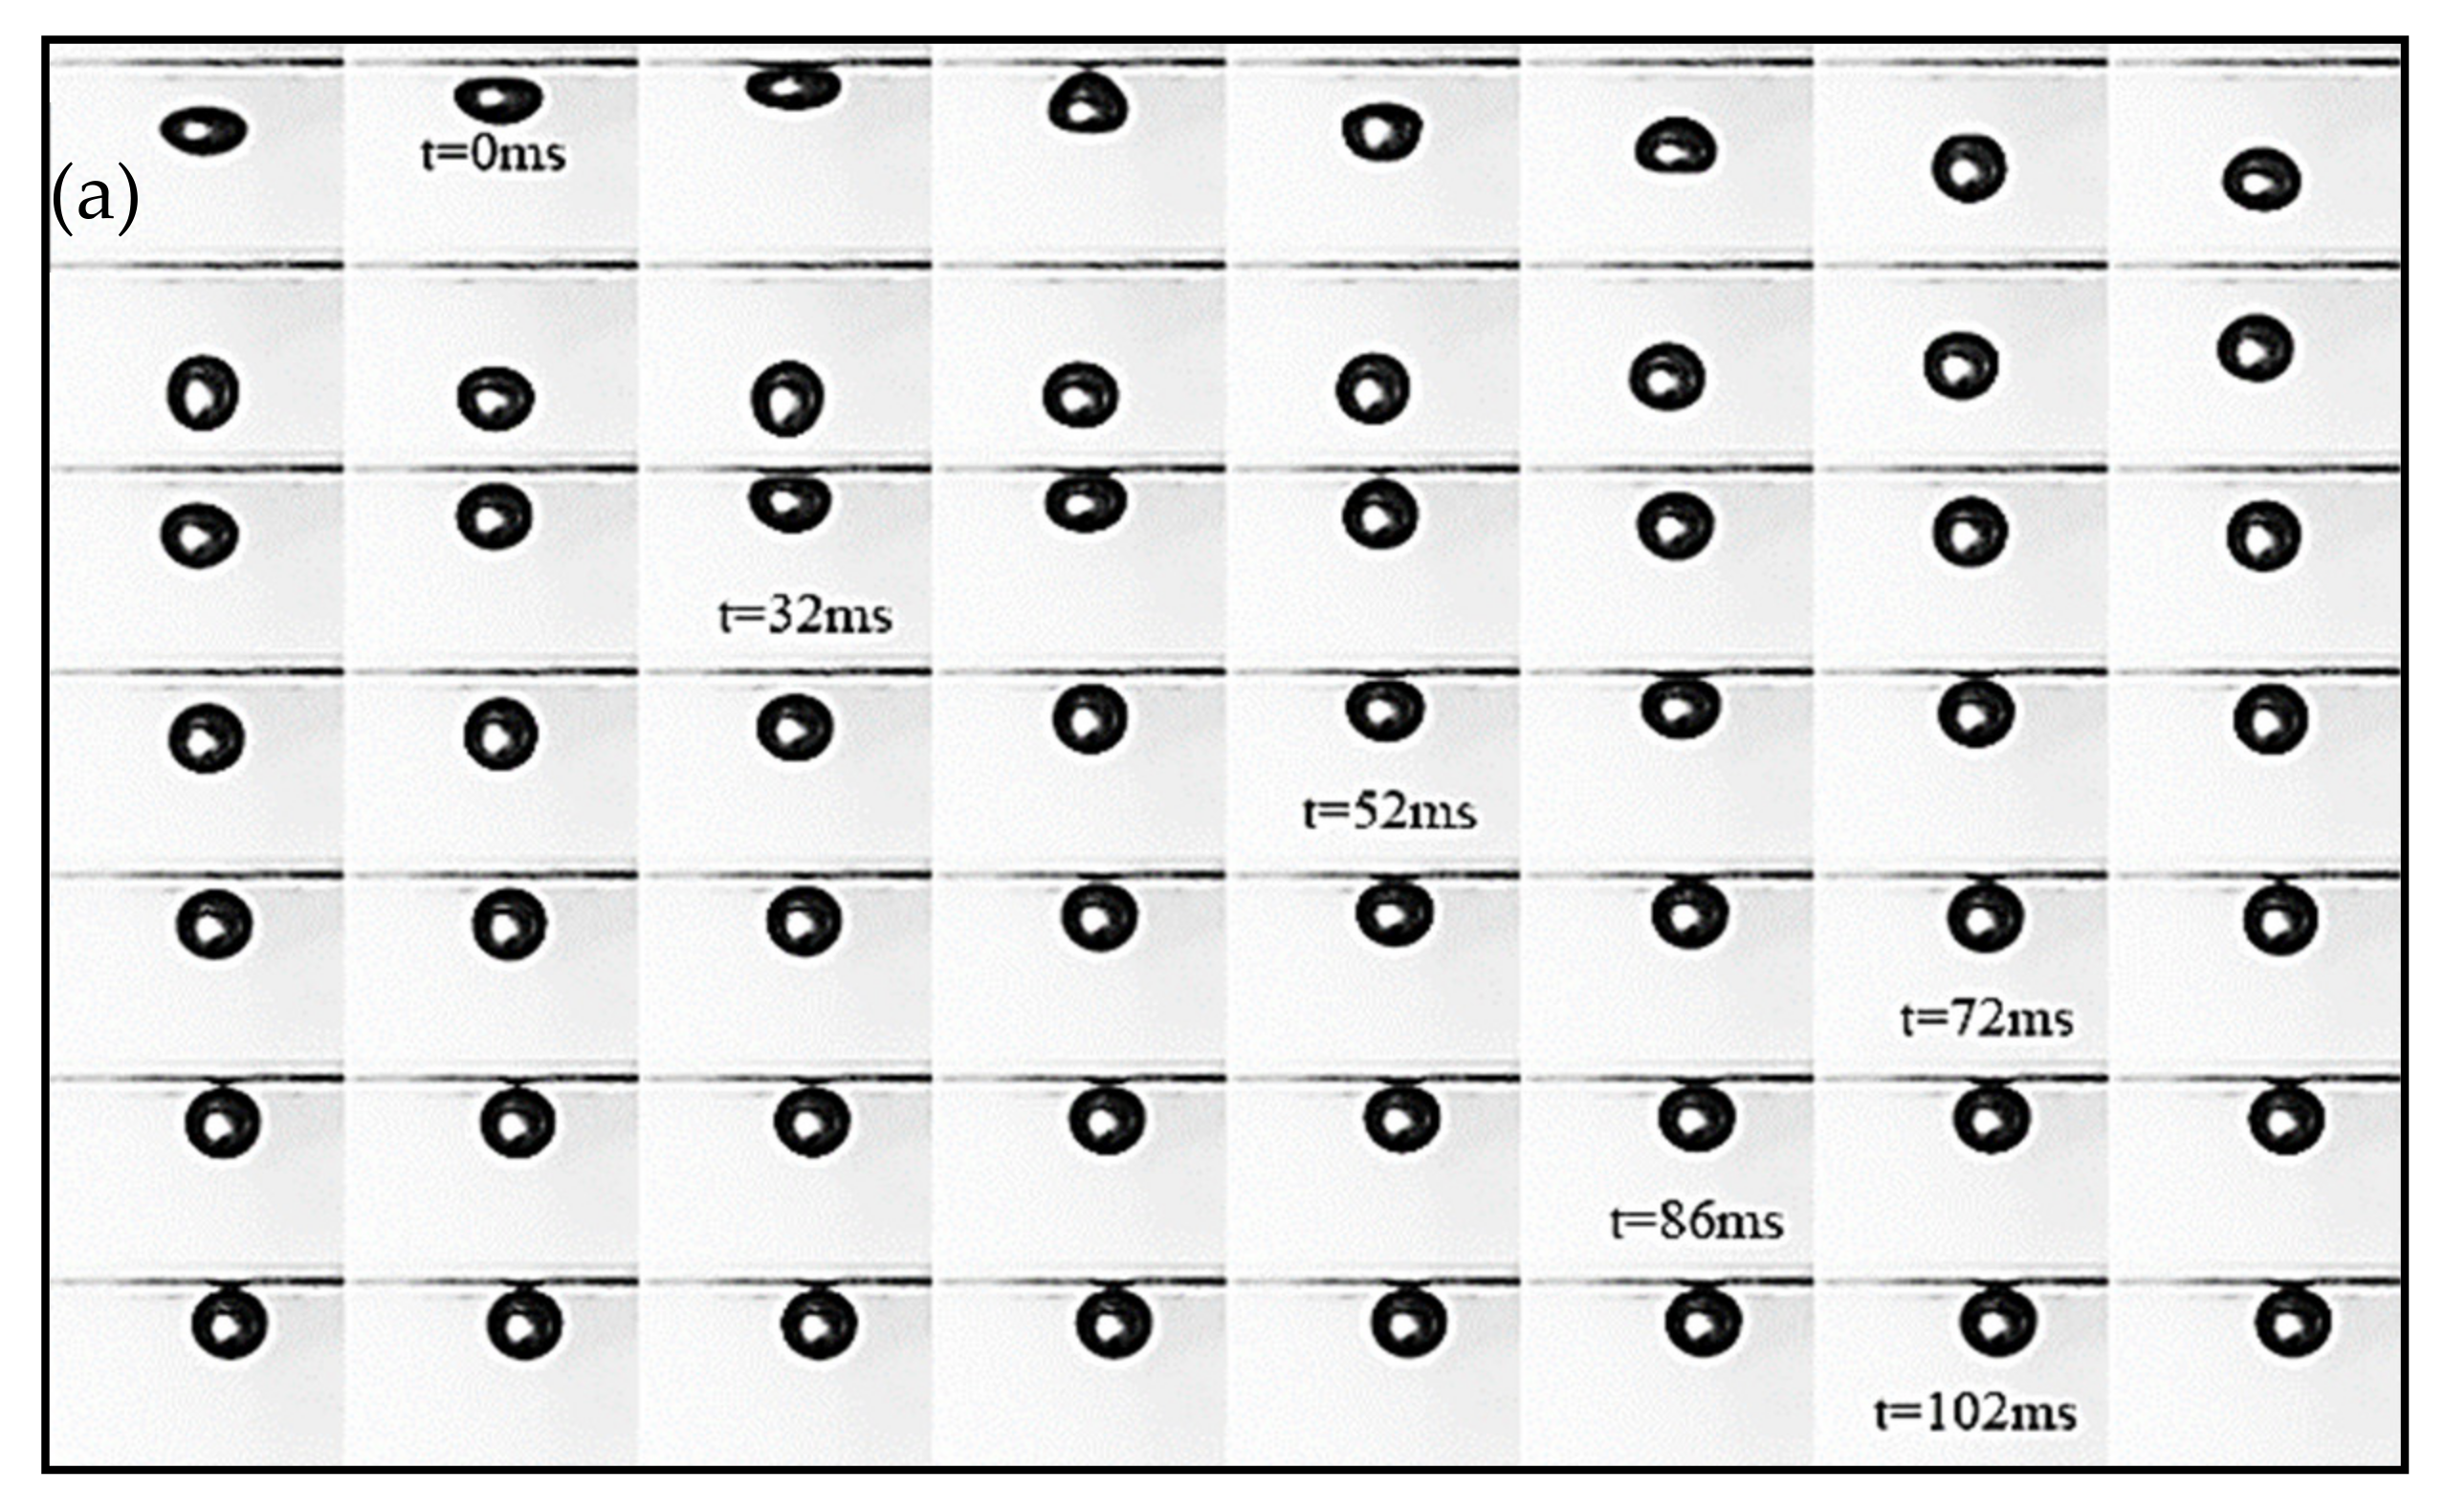
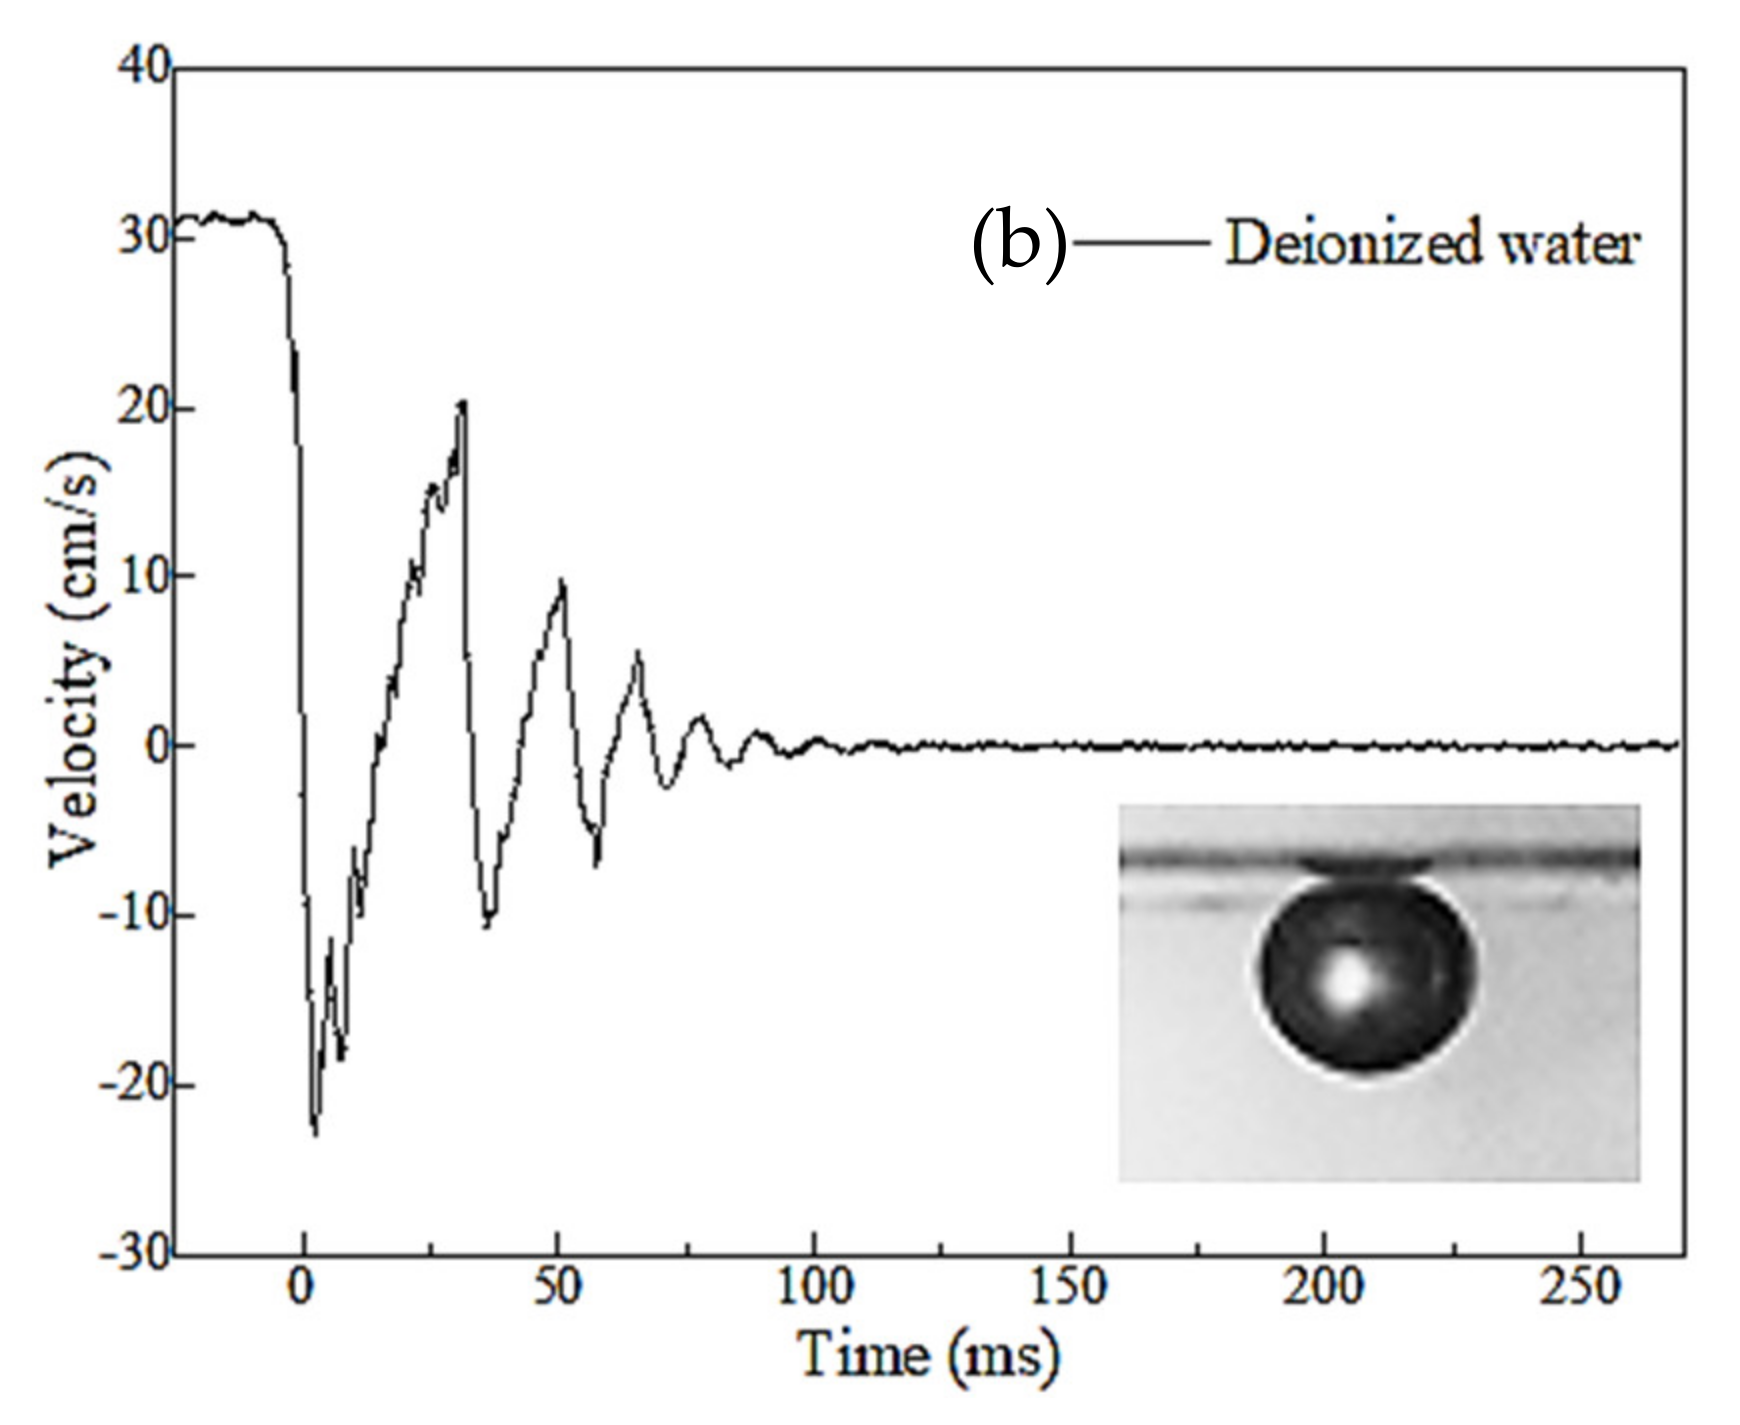
The collision-rebound process between bubbles and the muscovite surface in deionized water was recorded in Figure 6a. The interval between the two photos was 2 ms, and the initial time (t = 0) was when the bubble first touched the mineral. It can be concluded that the bubble rebounded and collided again for four times until the kinetic energy was dissipated. The four contact times were as follows: t = 0 ms, t = 32 ms, t = 52 ms, and t = 72 ms; obviously each time the interval decreased sequentially. After that, the bubble no longer left the muscovite surface but slightly deformed due to its non-zero velocity. When t > 102 ms, the bubble stopped moving and stabilized on the muscovite surface. Figure 6b shows the change in bubble velocity during this process. Corresponding to Figure 6a, it is shown that the bubble velocity and time interval after each collision-rebound decreased in sequence, and the bubble rebound distance also decreased in sequence. As the rebound distance and the bubble velocity decreased, the kinetic energy of the bubble was exhausted gradually. At this time, the bubble would not adhere to the muscovite surface and just kept stable there. This means that no drainage process existed, and the liquid film was not squeezed out. As a result, the extremely stable liquid film hinders the bubble adhesion onto the muscovite surface, and no TPC line formed in water finally [24,25]. The reason for this phenomenon was that both of the bubbles in deionized water (Zeta potential was about −60 mV) [26,27] and muscovite [28,29] surfaces were negatively charged. There was electrostatic repulsion to prevent the formation of TPC lines.
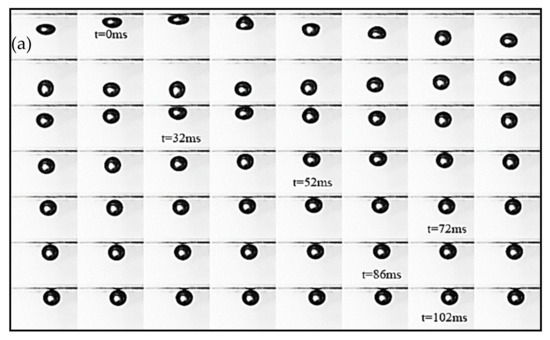
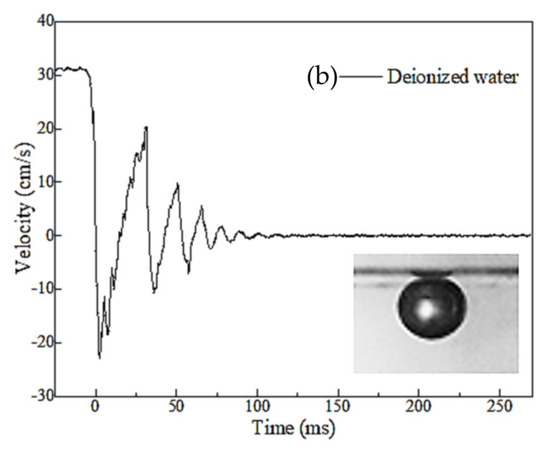
Figure 6.
Collision-rebound process (a) and velocity variation (b) of the bubble with muscovite surface in deionized water.
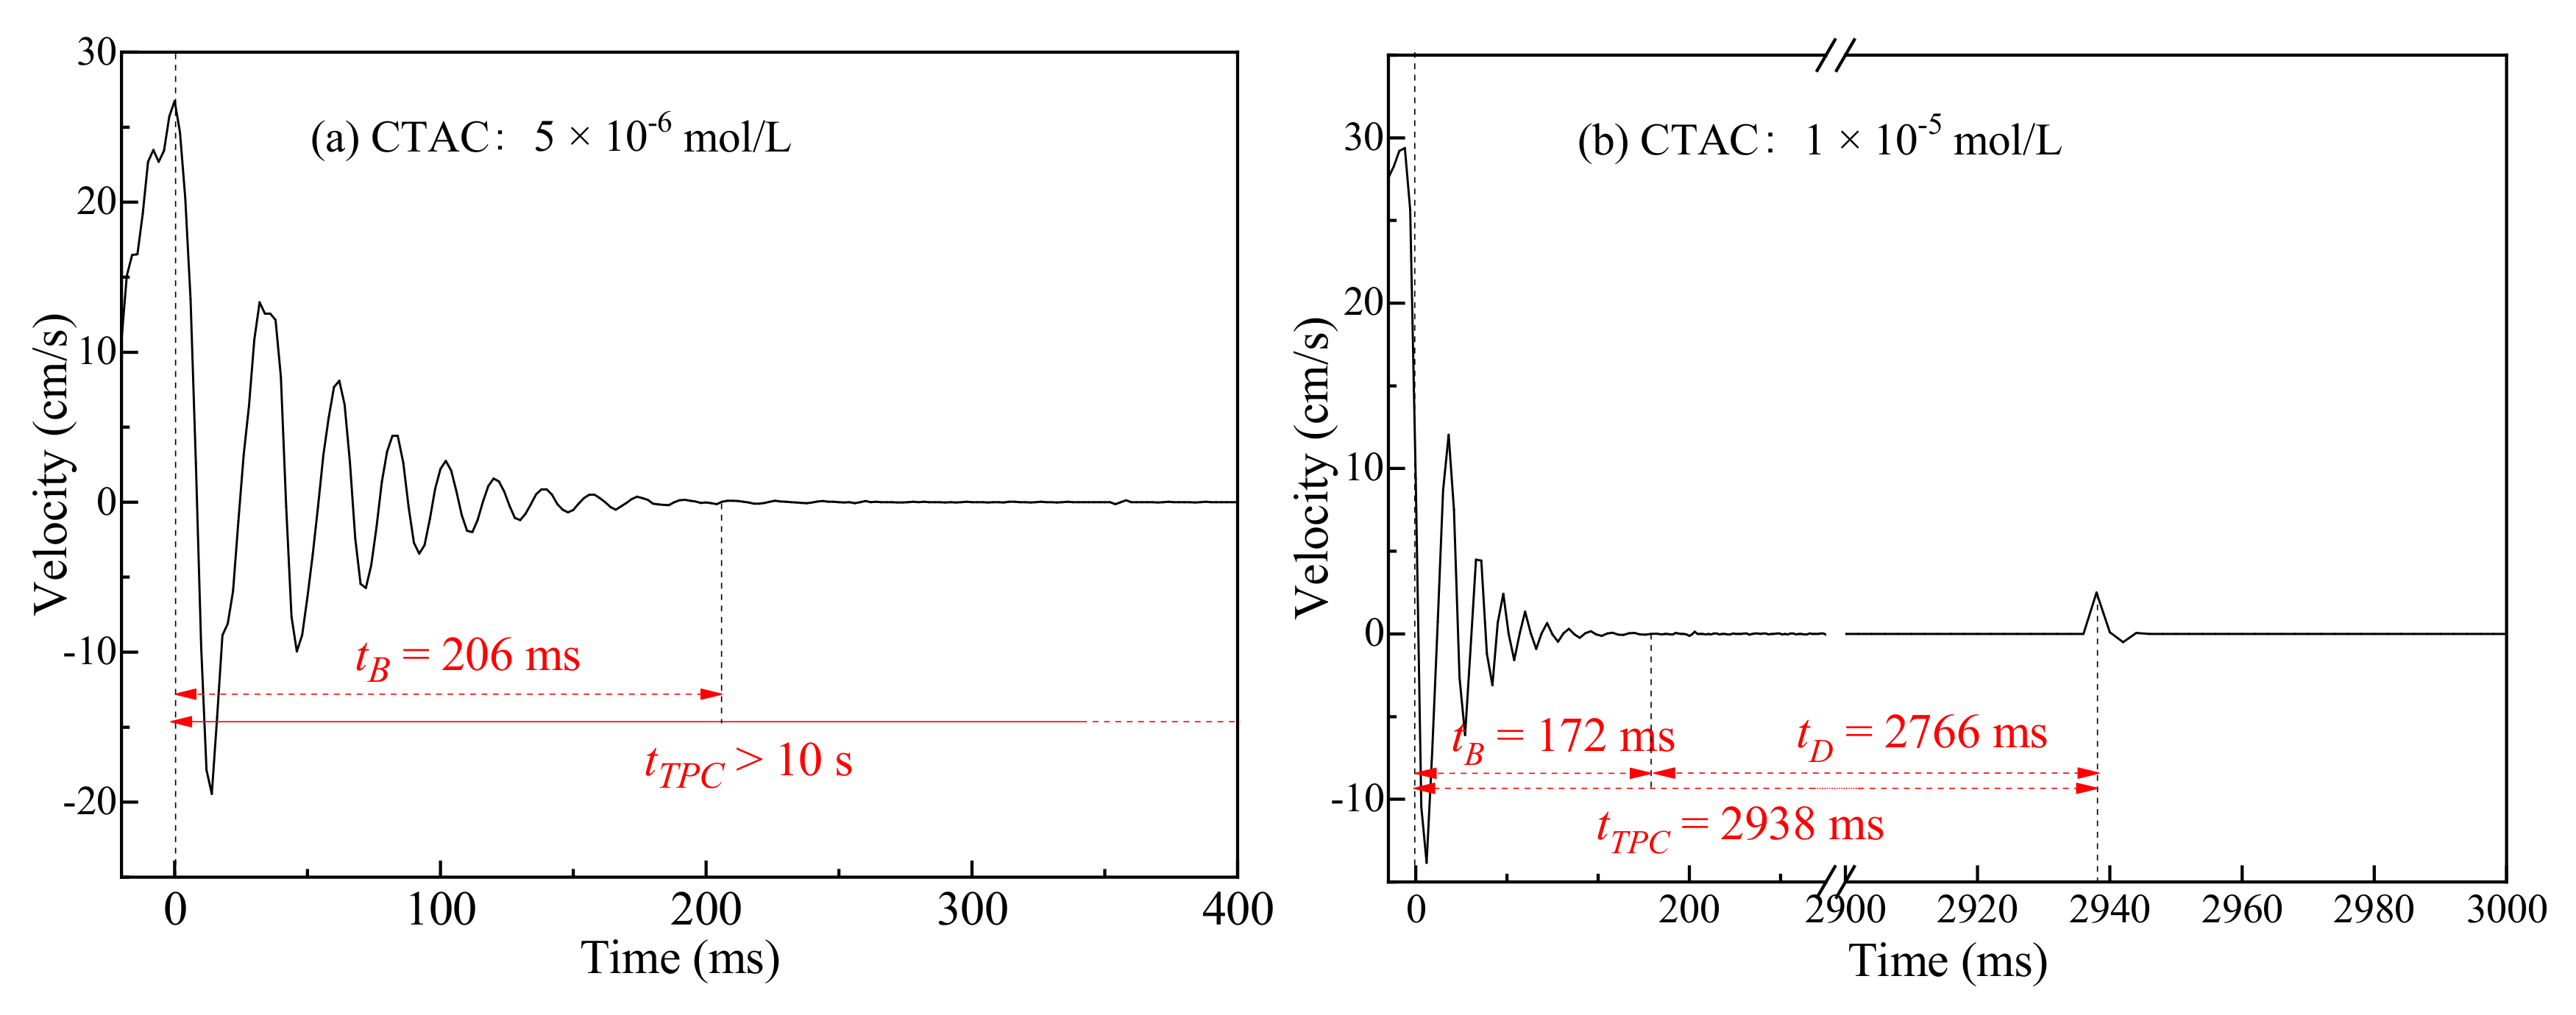
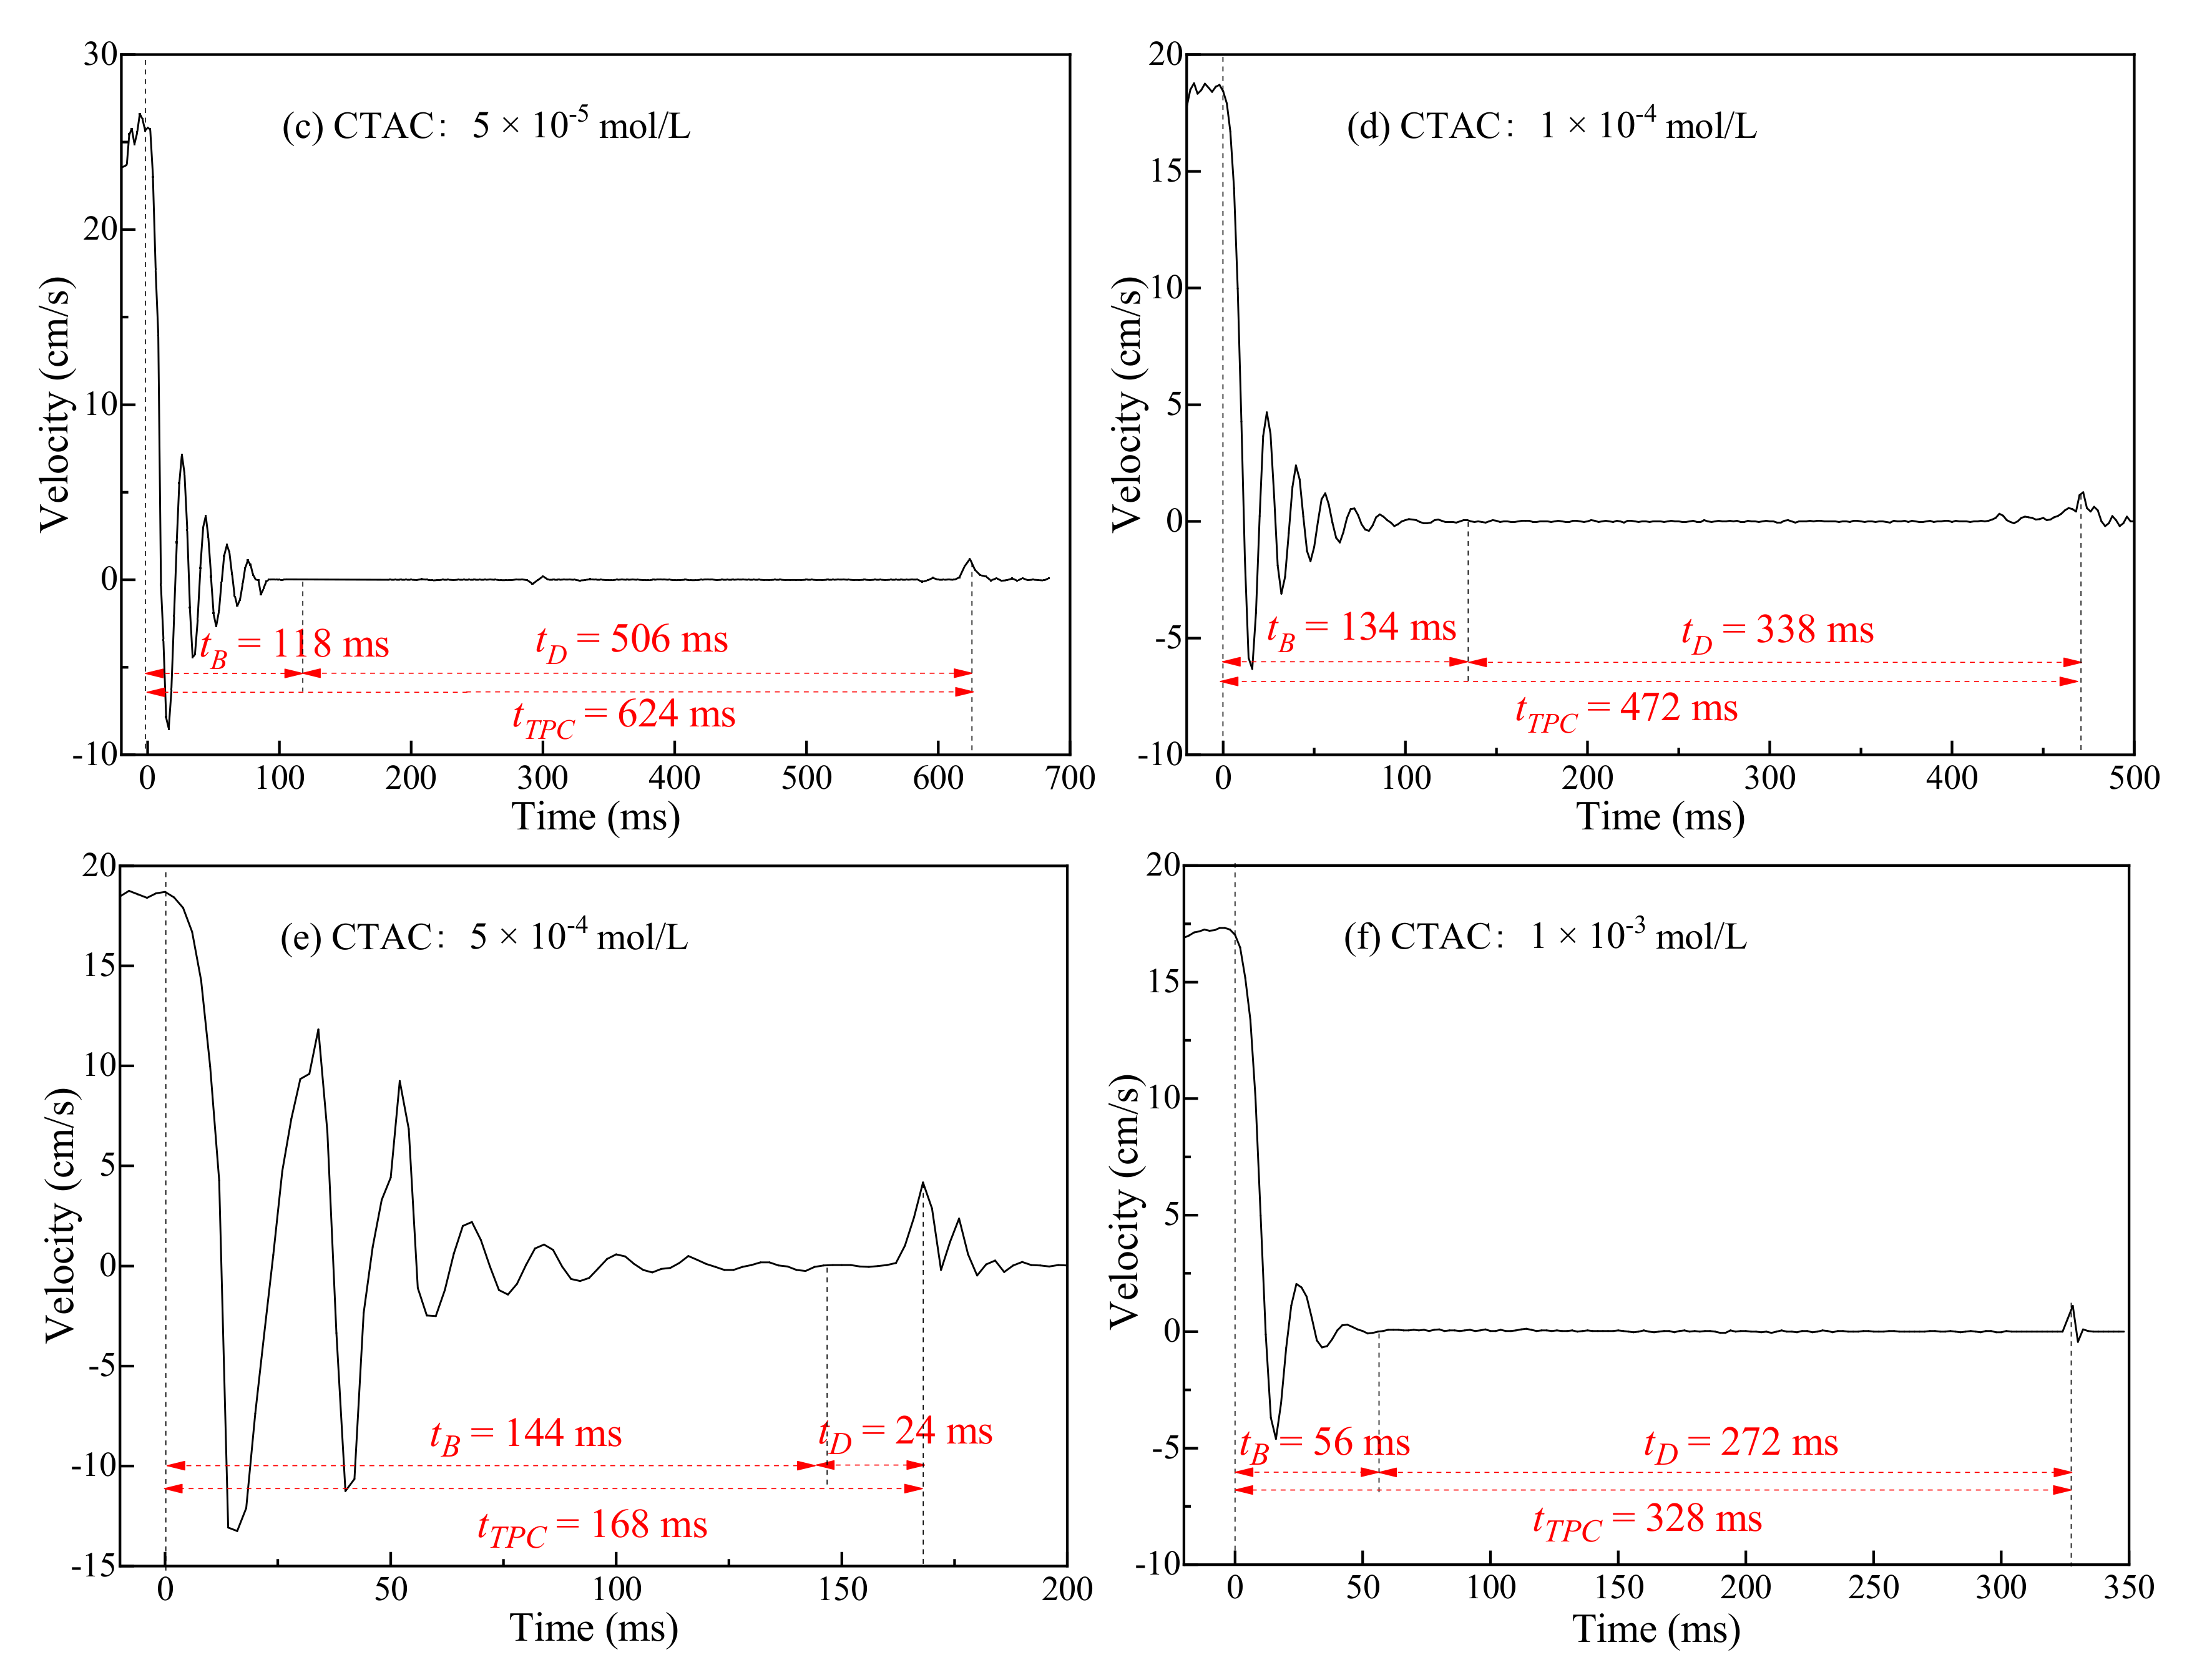
In the cationic CTAC solution, the bubble velocity during the collision-rebound process with the surface was studied in Figure 7. Different from that in water, there was a non-zero velocity after a period of inactivity, indicating that the bubble was adhered on the muscovite surface, and there were TPC lines formed under all concentrations. As shown in the results, the rebound intensity was associated with its concentration. When the concentration was 5 × 10⁻⁶ mol/L (Figure 7a), the bubble experienced eight collision-rebound changes, and the velocity sequentially decreased until it no longer varied to be stable. As the concentration ascended, the number of collision-rebound changes become less and less. While at 1 × 10⁻³ mol/L (Figure 7f), only two changes were found through the whole rising motion. The results showed that the time tB was shortened as the concentration of surfactants increased. This means that the kinetic energy dissipation happened faster in concentrated surfactant solutions. This is principally because the surfactant with high concentration can distribute more evenly on the bubble surface and hinders its fluidity. At this condition, the generated bubble does not move in a short time after the separation with the capillary, and the time tB is shortened finally.
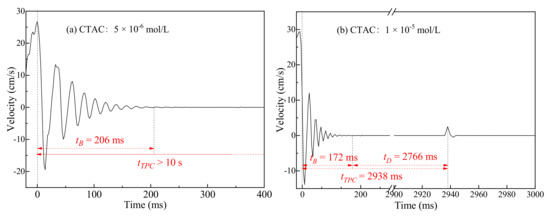
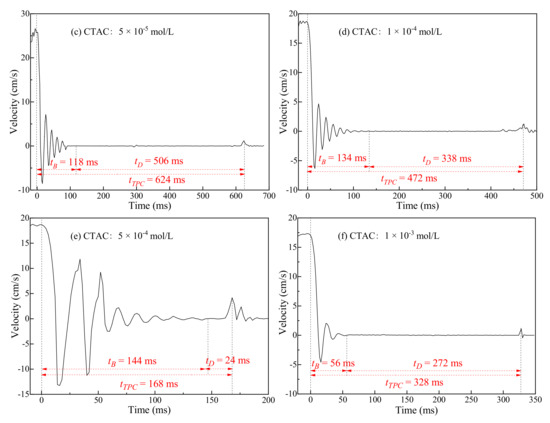
Figure 7.
Bubble velocity variation during collision-rebound process with muscovite surface in CTAC solution with different concentrations. (a) 5 × 10⁻⁶ mol/L; (b) 1 × 10⁻⁵ mol/L; (c) 5 × 10⁻⁵ mol/L; (d) 1 × 10⁻⁴ mol/L; (e) 5 × 10⁻⁴ mol/L; (f) 1 × 10⁻³ mol/L.
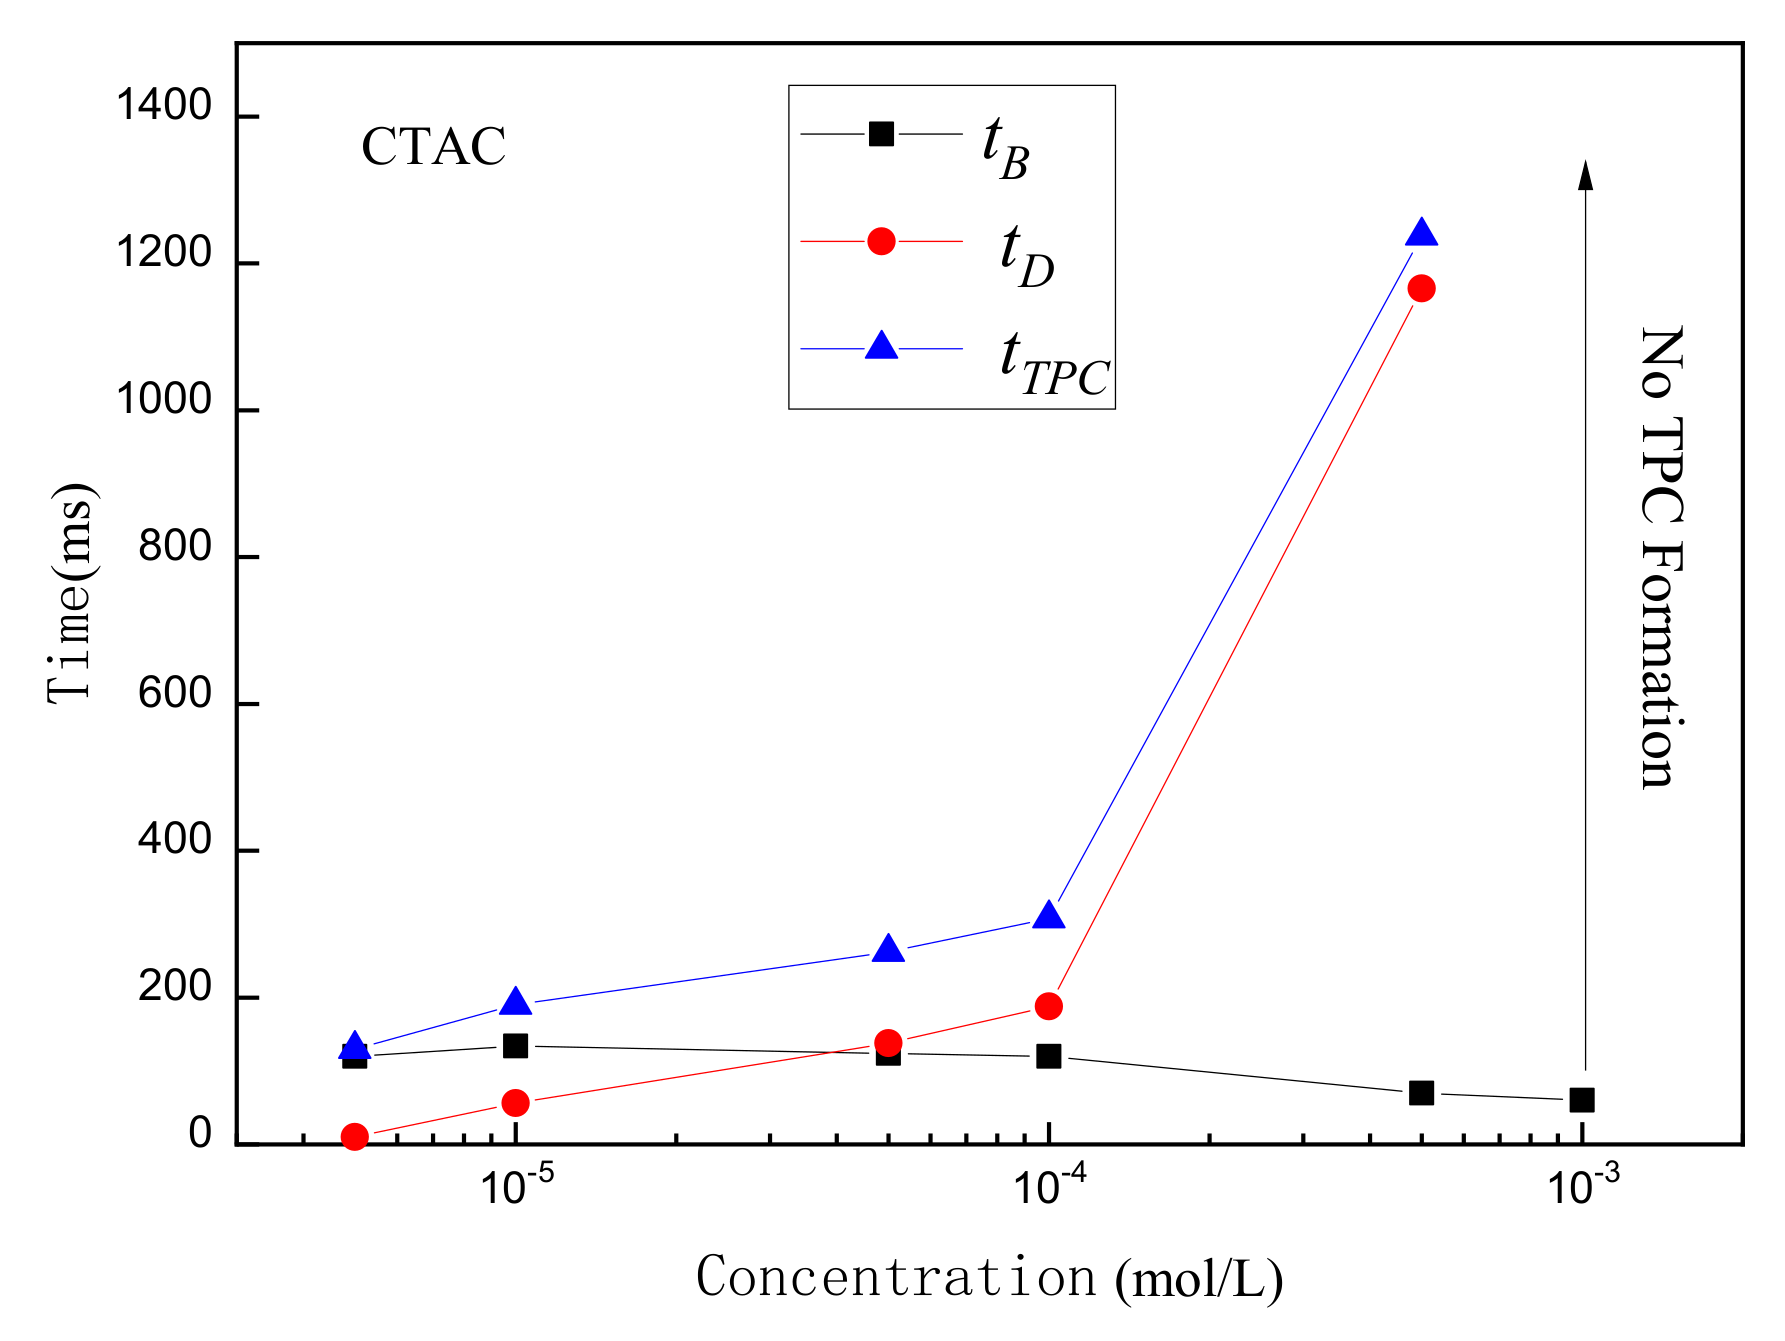
It was defined that the collision-rebound time was the time span from the first collision-rebound to the static state, and the drainage time was the difference value between and . The corresponding values are also shown in Figure 7. At 5 × 10⁻⁶ mol/L, even exceeded 10 s and then dropped sharply as the concentration, which consisted with the conclusion that the longer time for TPC formation of hydrophilic muscovite would deteriorate the flotation result [25]. From Figure 7, the concentration increases also shortened values, which depended on the initial velocity of the first collision. At lower concentration (Figure 7a,b), the adsorption rate was slow, and the change of hydrophobicity was not very clear, making TPC formed for more time. However, at the higher concentration, hydrophobicity can be improved in a short time, benefitting the TPC formation. From Figure 8, we can see that compared with , the change range of is smaller, and the change trend in is consistent with that of . In addition, at concentrations below 5 × 10⁻⁴ mol/L, was much longer than , making the time of TPC line formation mainly decided by the drainage time of the bubbles. For hydrophilic muscovite, the TPC formation was mainly affected by the hydrophobicity of the mineral surface.
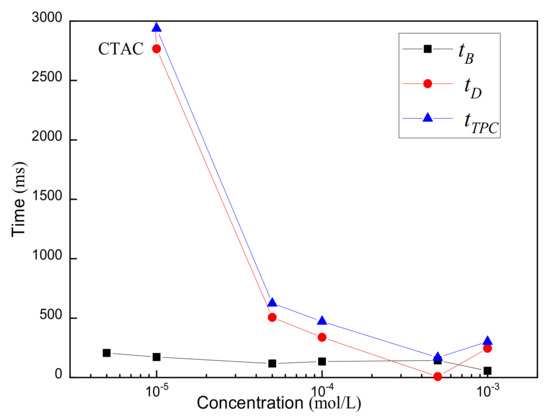
Figure 8.
The and of muscovite in different CTAC concentrations.
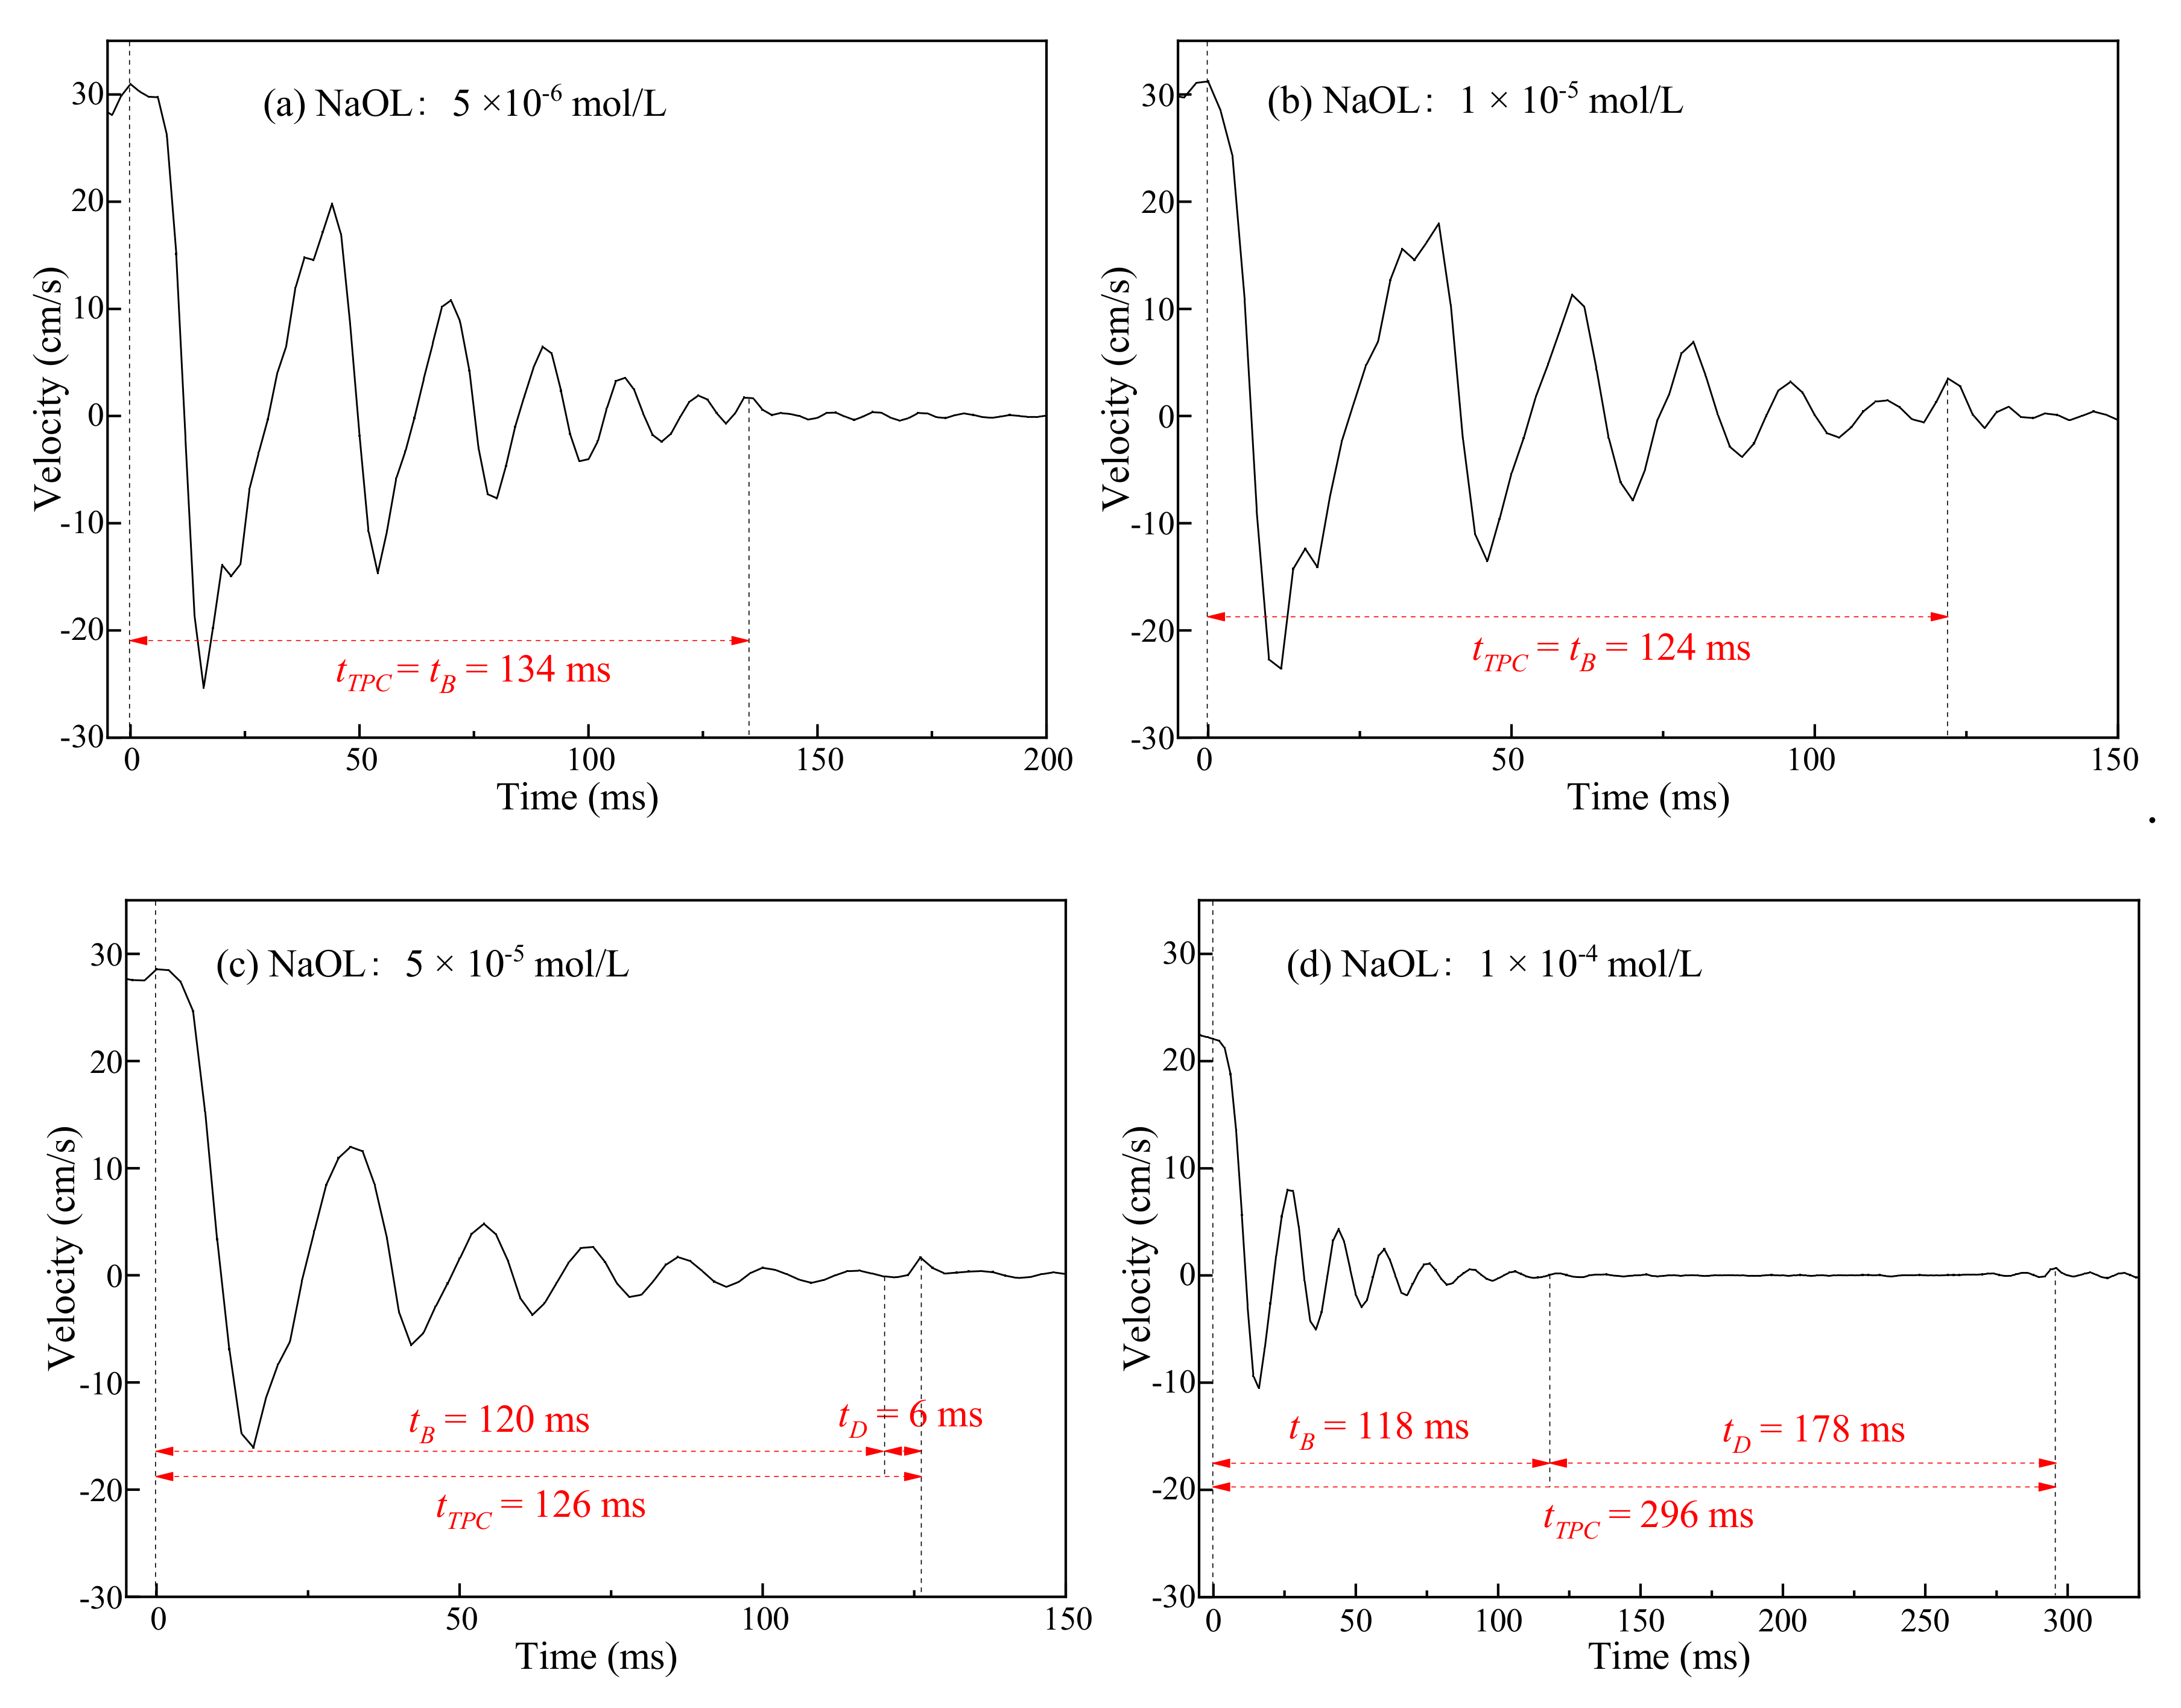
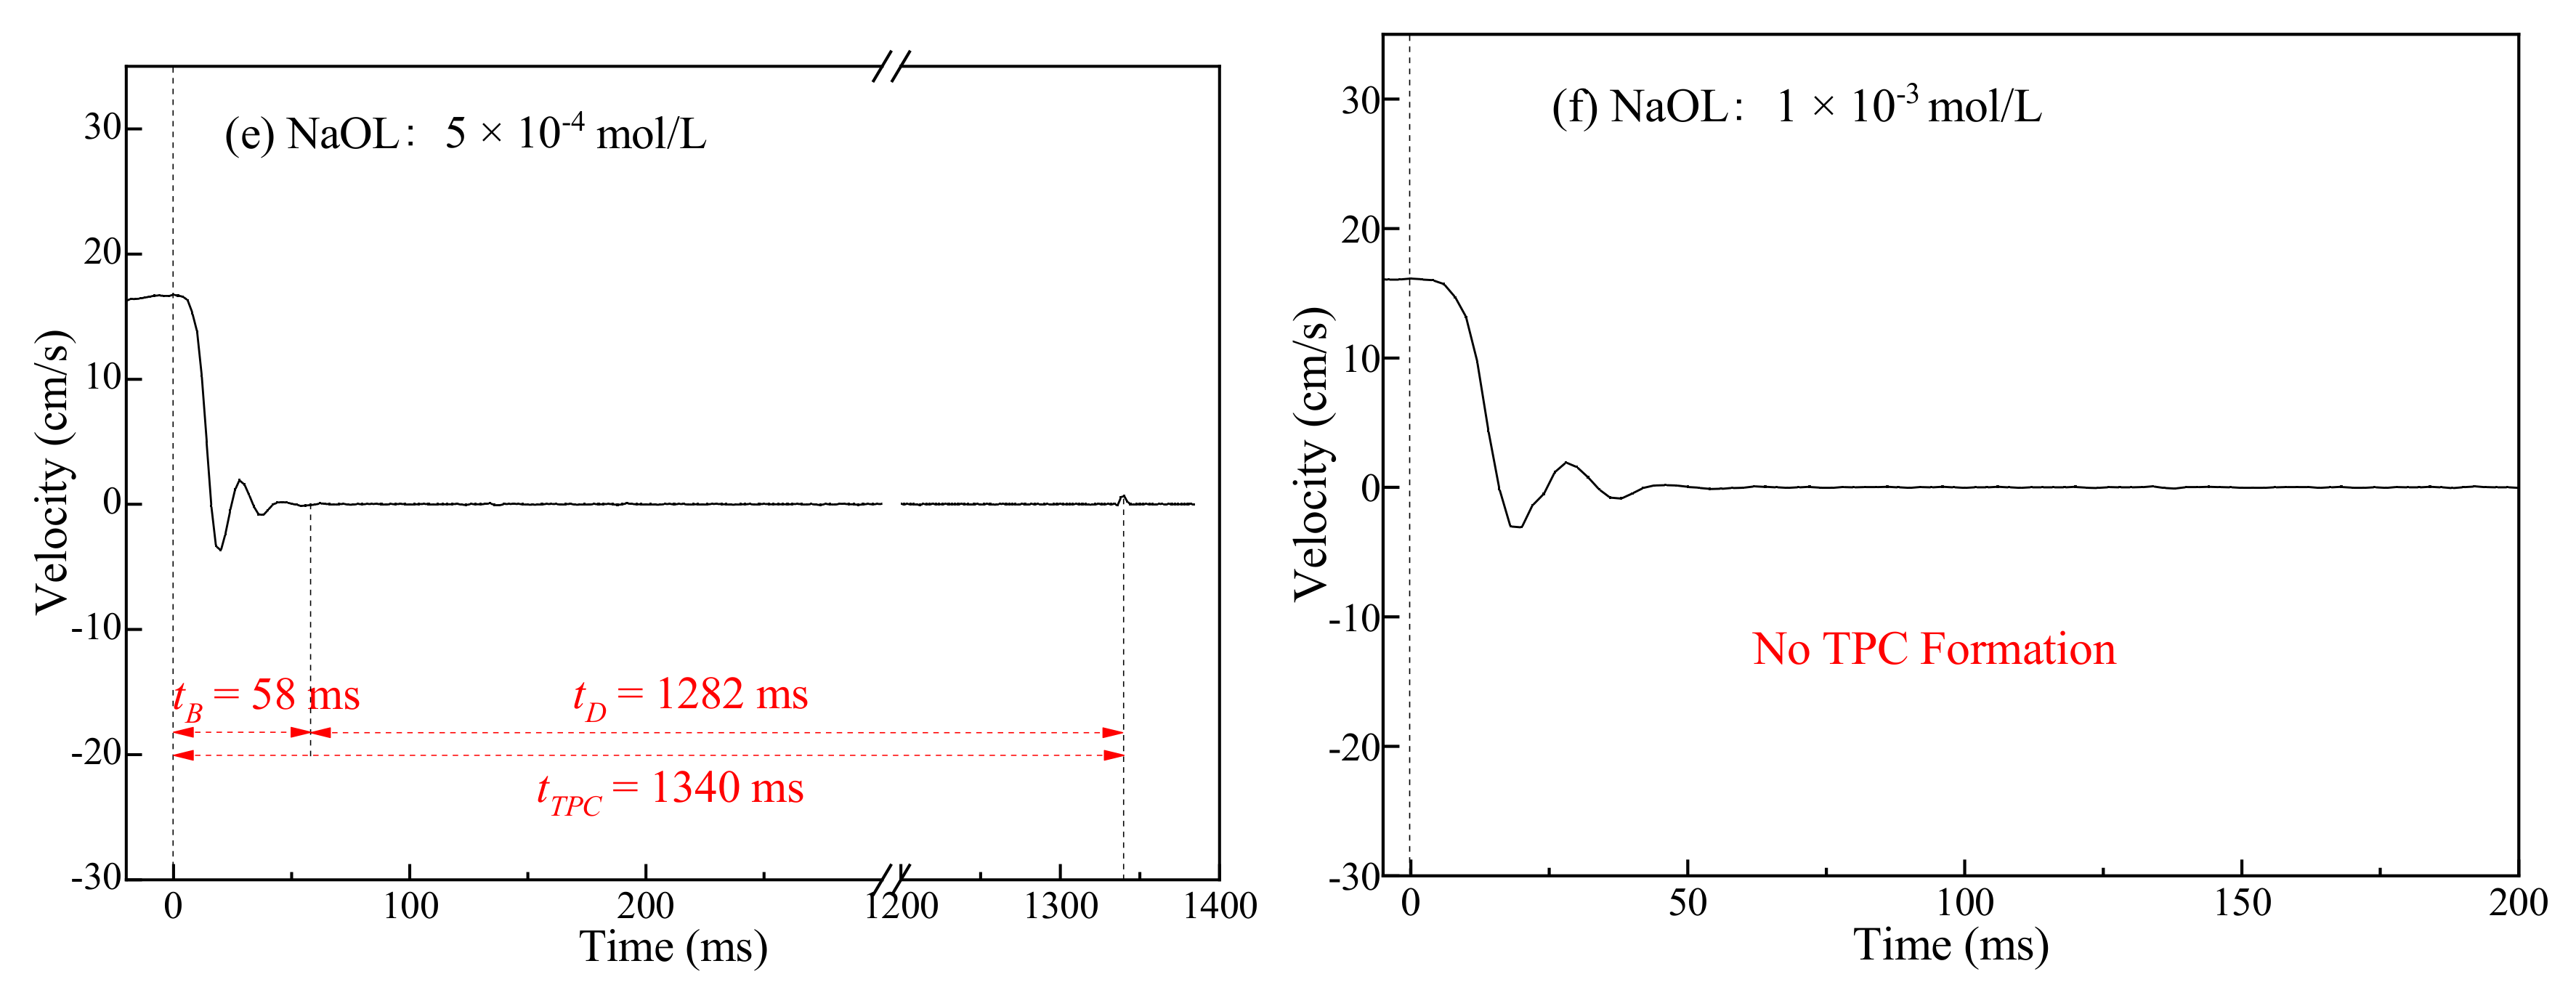
The result of a velocity variation in the anionic NaOL solution was investigated in Figure 9 where there was no TPC line formed at any of the concentrations, as was the case with deionized water. The bubbles were not adhered to the muscovite surface in the NaOL solution. For this reason, the time of TPC and the drainage time were both zero ( = = 0). The increase in concentration made the collision-rebound time cut down from 126 ms to 27 ms, and values in NaOL were smaller than those in CTAC at the same concentration. When the concentration increased from 1 × 10⁻⁵ mol/L (Figure 9a) to 1 × 10⁻³ mol/L (Figure 9d), the number of collision-rebounds reduced from six to one, and the velocity at the same time also tended to drop dramatically. Therefore, the ability to form a TPC line depends on the type of surfactant. In the deionized water and the anionic NaOL solution, no TPC was observed, but in the cationic CTAC surfactant, a TPC line occurred successfully, and the time required was shortened as the concentration increased.
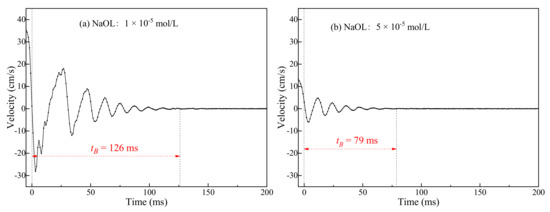
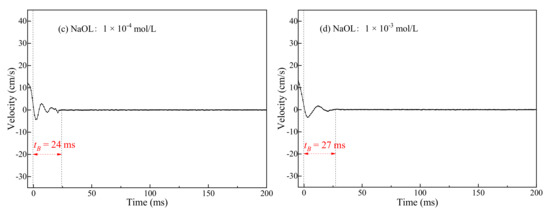
Figure 9.
Bubble velocity variation during the collision-rebound process with the muscovite surface in the NaOL solution with different concentrations. (a) 1 × 10⁻⁵ mol/L; (b) 5 × 10⁻⁵ mol/L; (c) 1 × 10⁻⁴ mol/L; (d) 1 × 10⁻³ mol/L.
3.2.2. TPC on Talc Surface
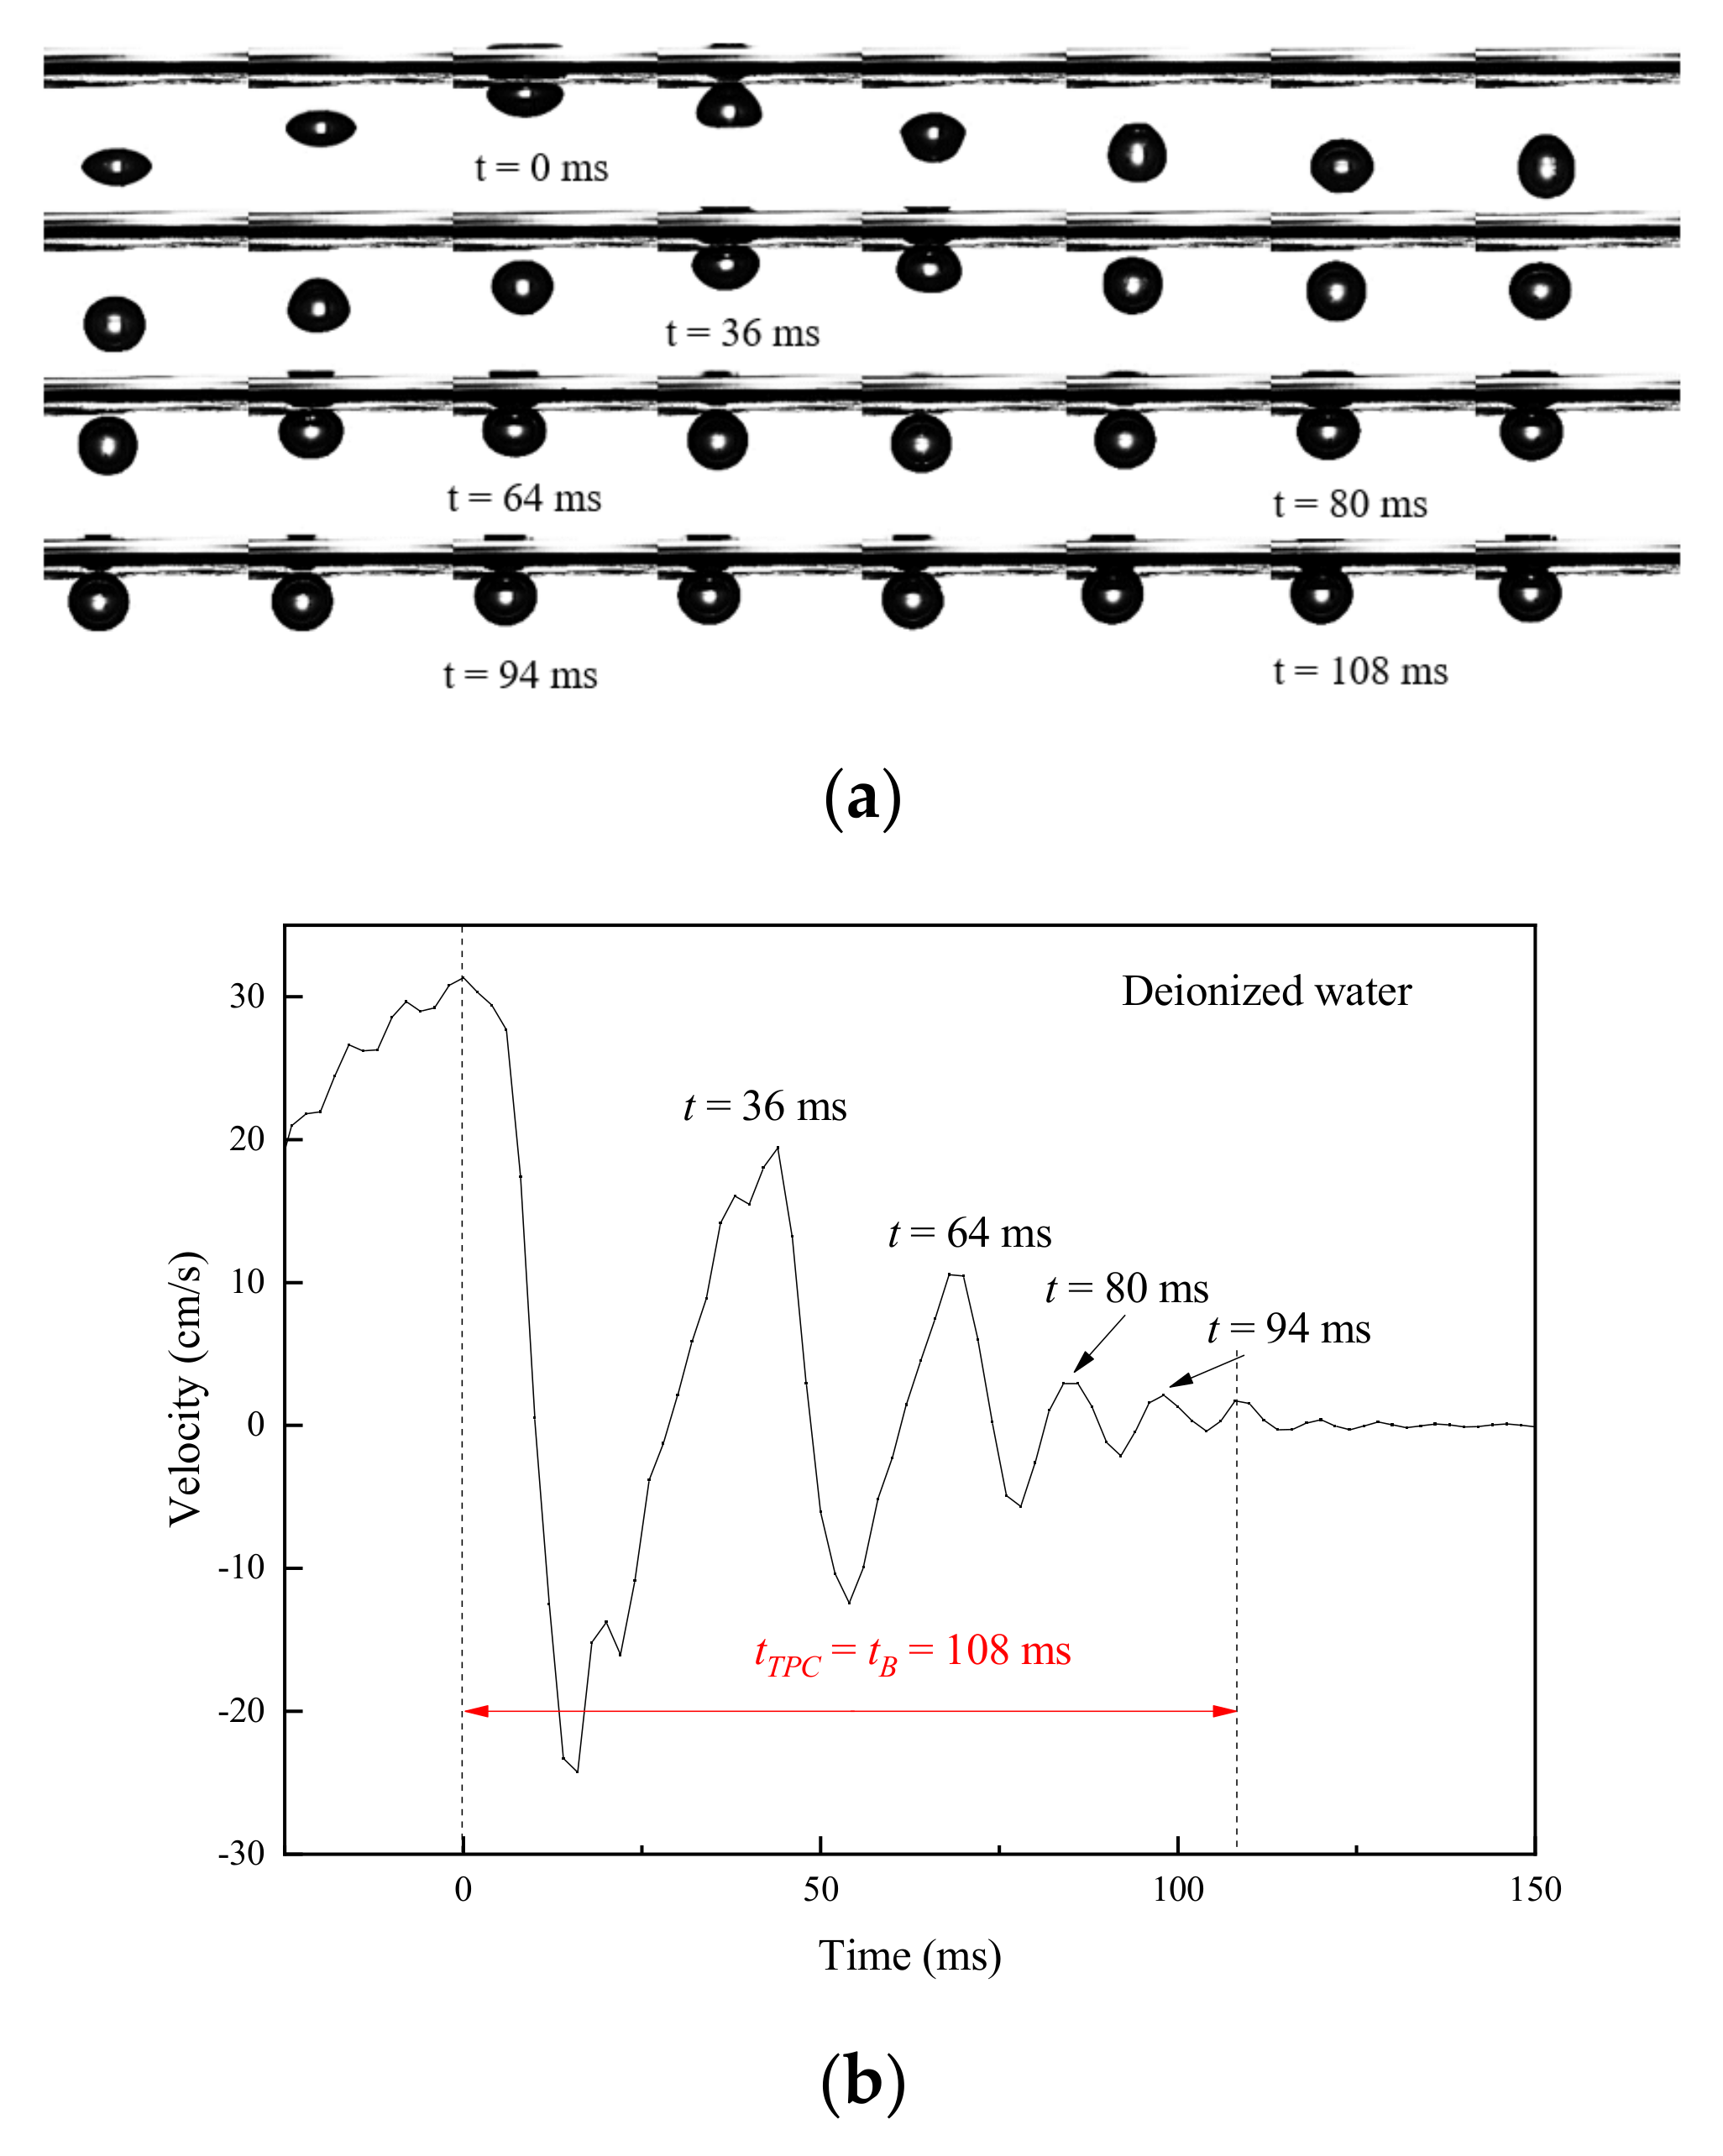
In addition to hydrophilic muscovite, the collision-rebound process of the bubble with the hydrophobic talc was also necessary to be studied. The result in the deionized water is shown in Figure 10a where the interval time between two photos was 4 ms. During the rising movement, the bubble experienced five collision-rebounce processes on the talc surface: t = 0 ms, t = 36 ms, t = 64 ms, t = 80 ms, and t = 94 ms. Similar to muscovite, the time interval in the solution with talc after each collision-rebound also decreased in sequence, indicating that the bubble’s rebound distance also reduced in turn. Finally, the bubble was adhered to the talc surface, and the TPC line formed at t = 108 ms. The velocity consistent with the collision-rebound process was revealed in Figure 10b, from which it can be concluded that the bubble kept colliding and rebounding before it adhered to the talc surface and made the TPC line form, signifying that tD = 0 and = = 108 ms.
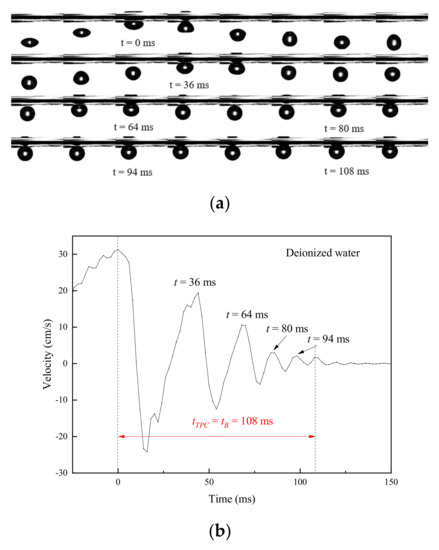
Figure 10.
Collision-rebound process (a) and velocity variation (b) of the bubble with talc surface in deionized water.
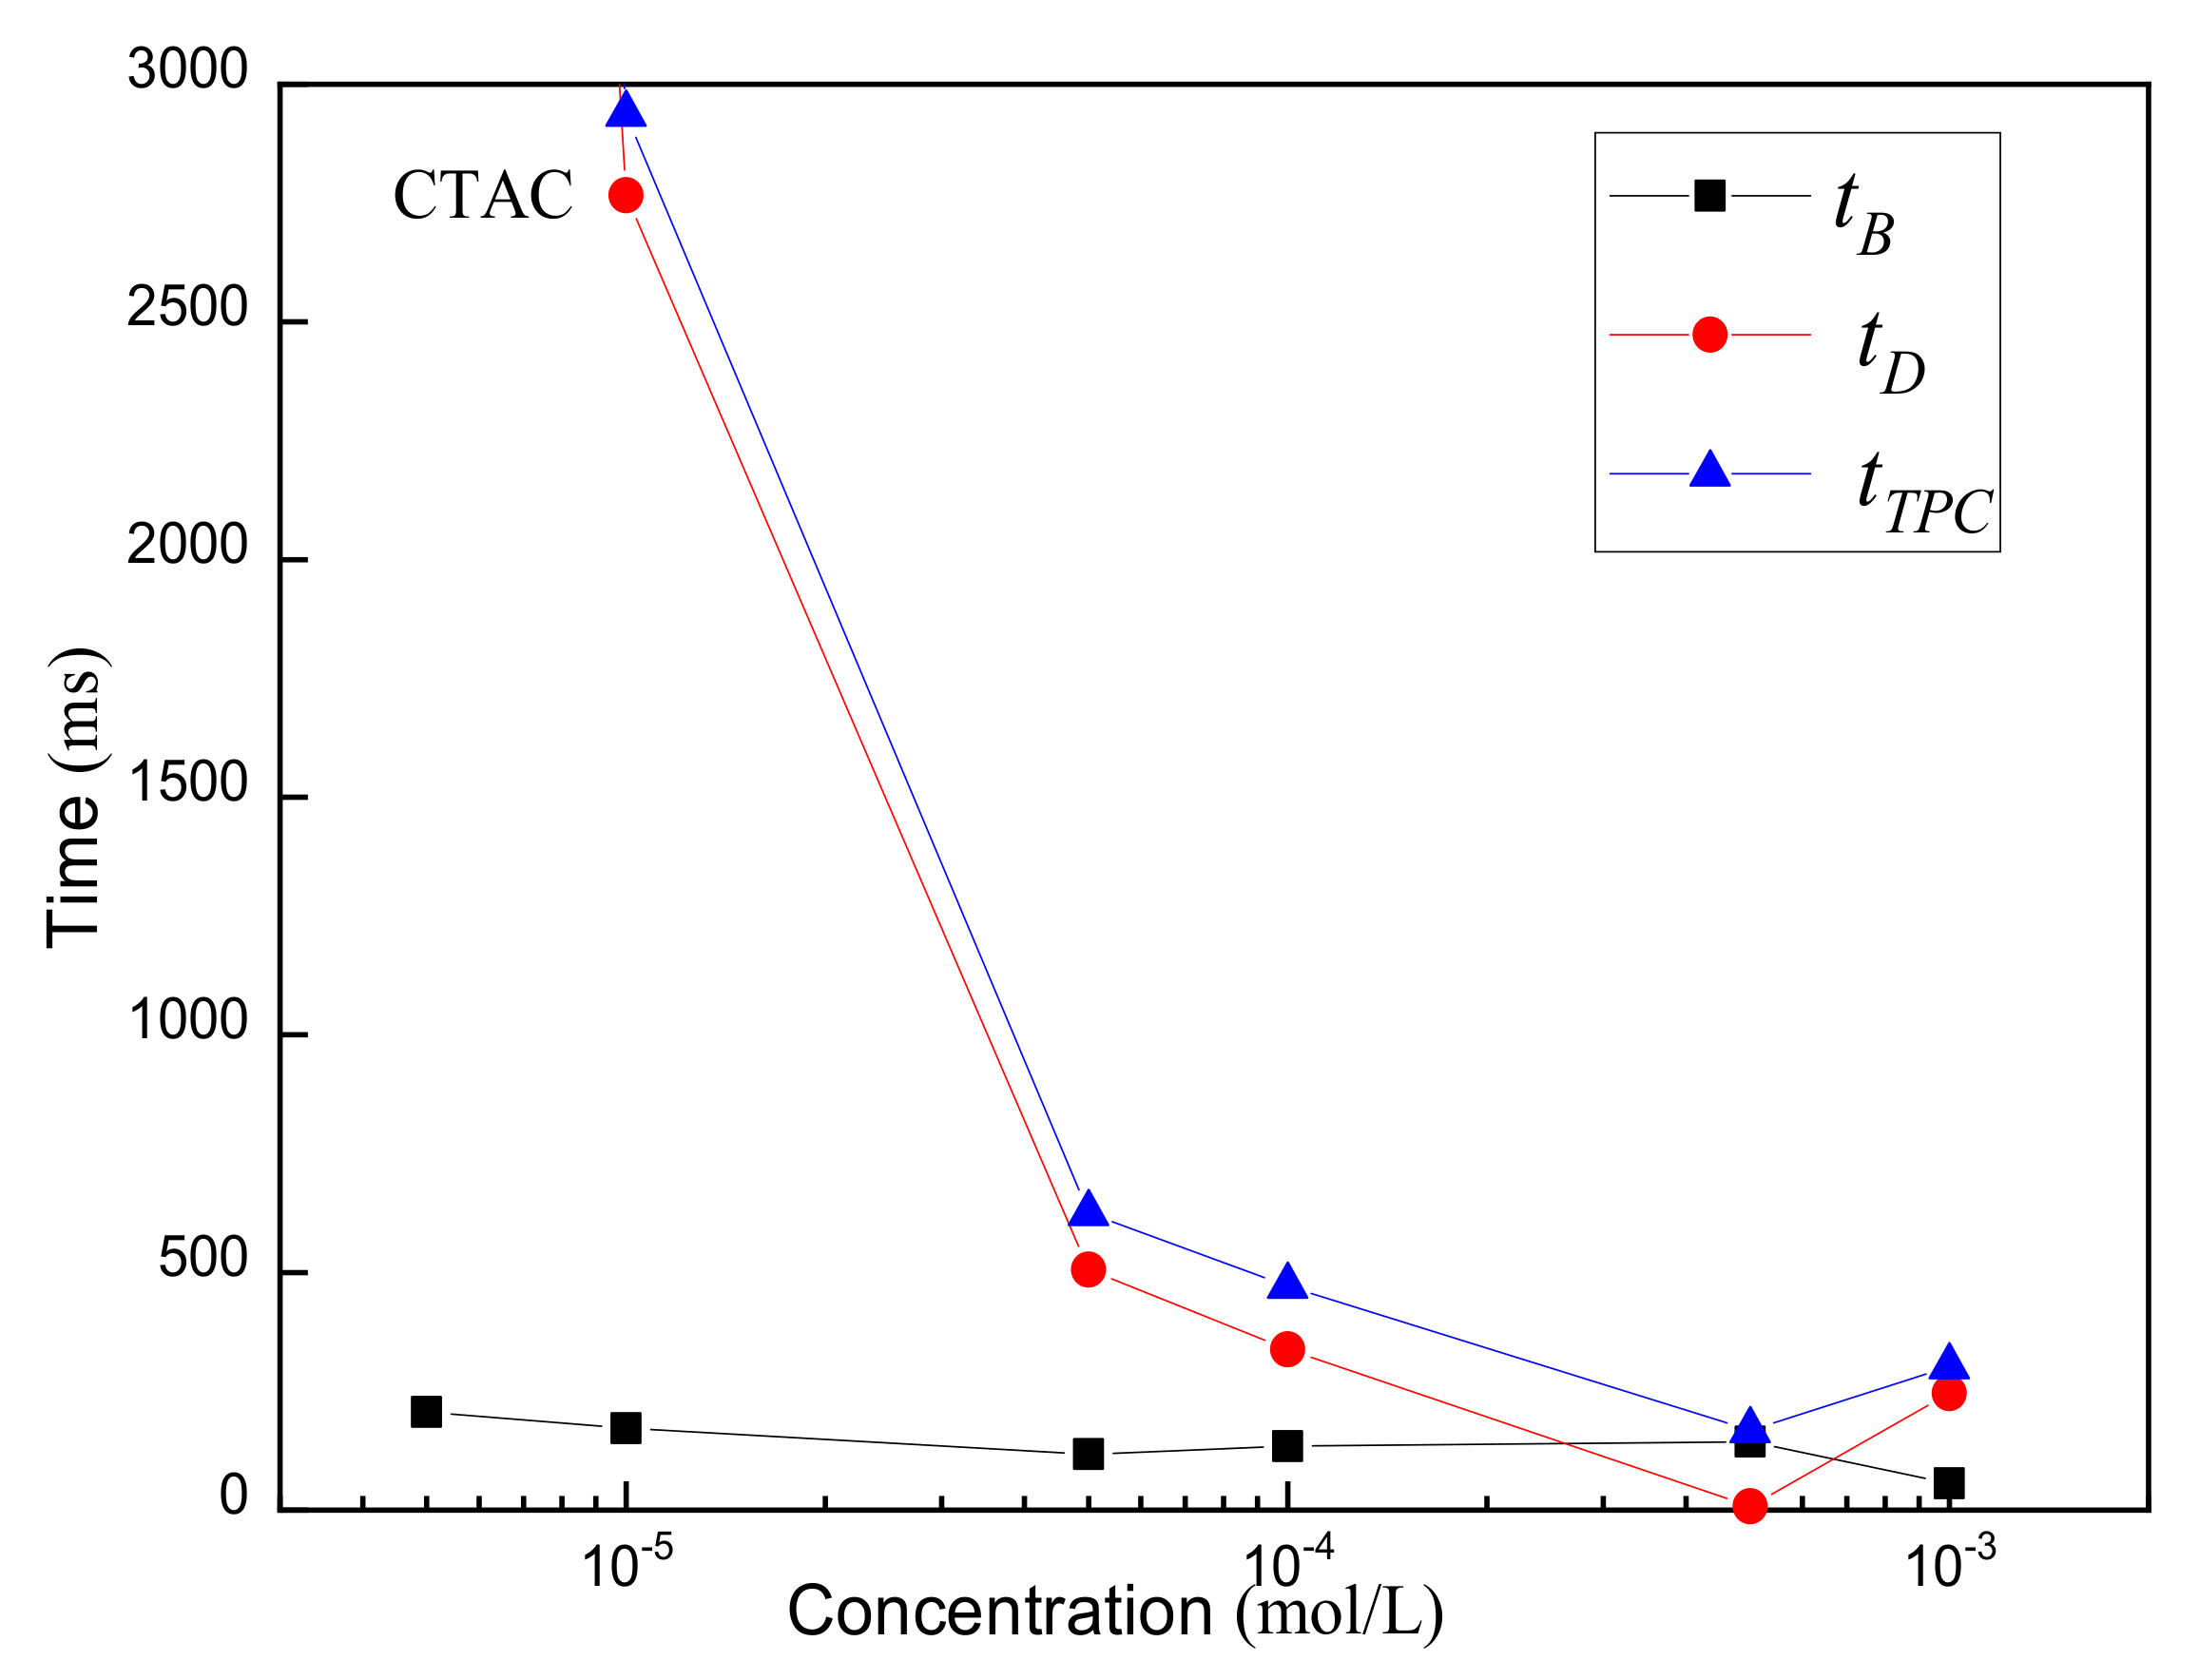
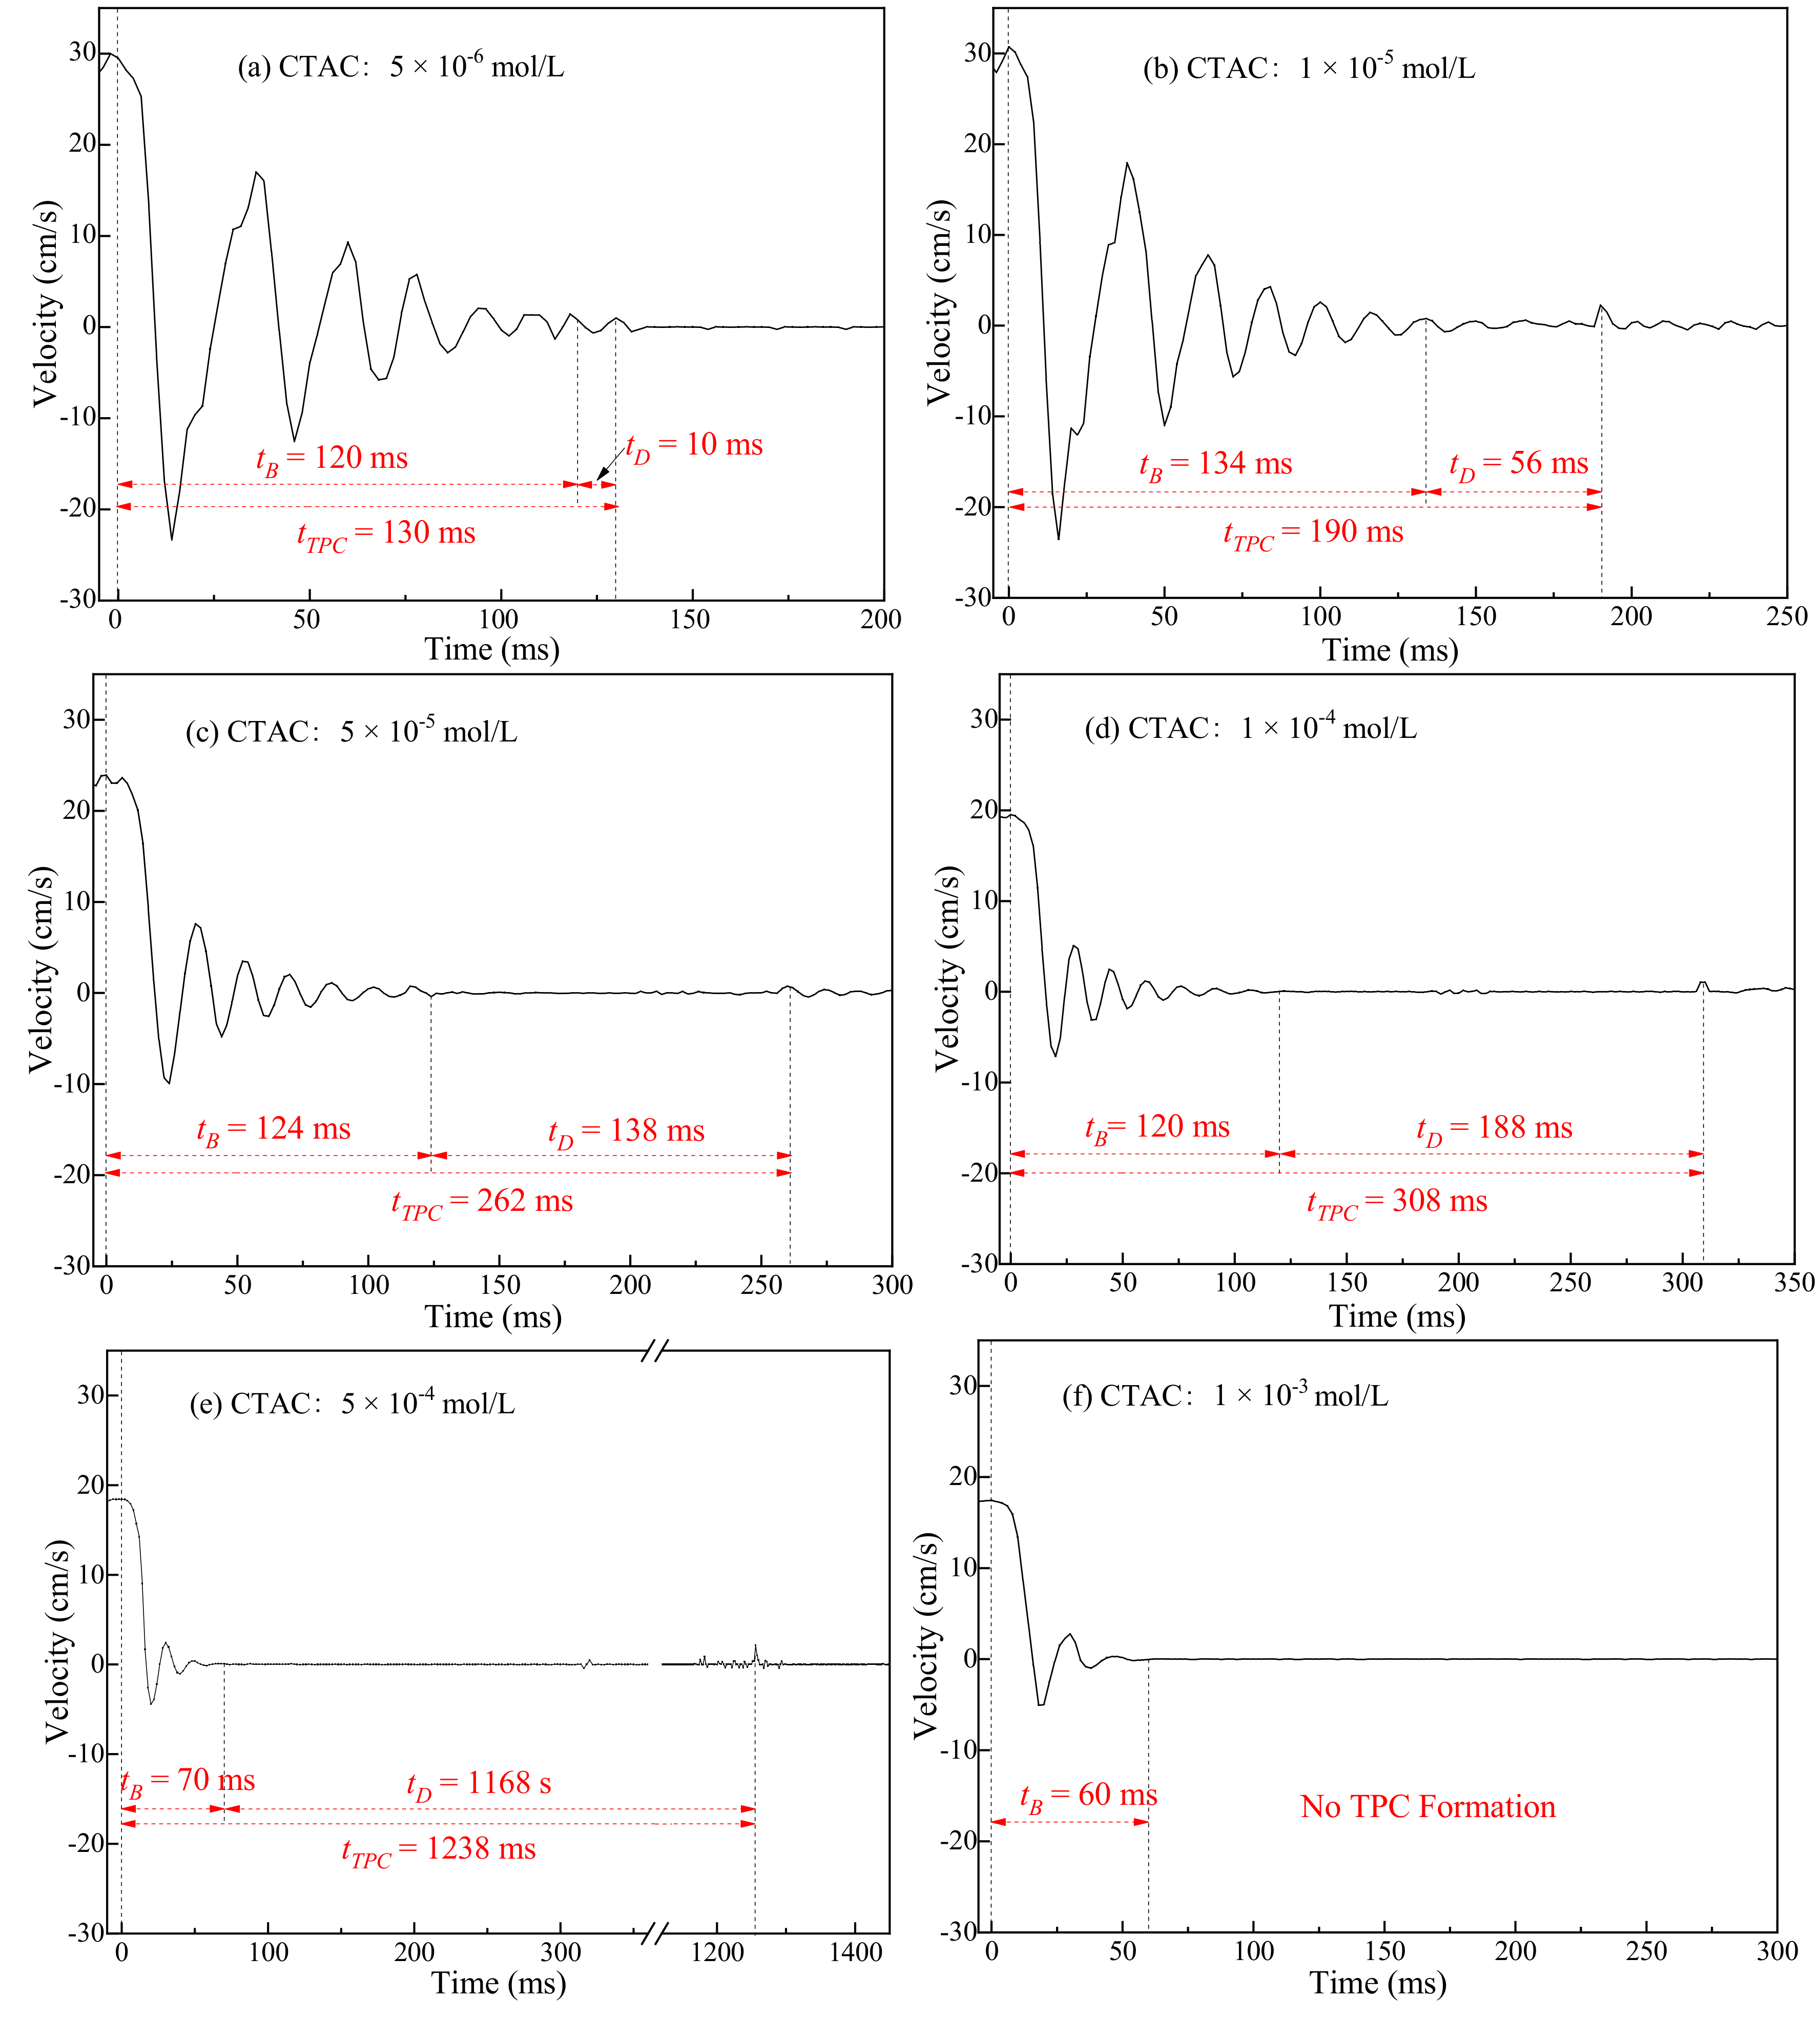
Besides deionized water, the bubble velocity during the collision-rebound process with the talc surface in the CTAC solution with different concentrations was also studied in Figure 11. According to the result, the motion rule with the talc surface was different from that in Figure 7. The higher concentrations resulted in smaller collision-rebound cycles and shorter tB, but longer tD and [30], as shown in Figure 12. This explained that the higher concentration of CTAC could hamper the TPC formation, and even no TPC occurred at 1 × 10⁻³ mol/L, indicating that the hydrophobicity was not the main reason for TPC formation of hydrophobic talc. This is because there was a local foam film between the bubble and the talc, making the bubble stability become the major reason. For concentrations below 5 × 10⁻⁵ mol/L, tB > tD, indicating that the effect of the bubble rebound process on the TPC line was greater than the liquid film burst time. While tB and tD showed opposite changes, tTPC extended with increasing CTAC concentration. Different phenomena between hydrophobic talc and hydrophilic muscovite showed that TPC can be formed due to different reasons.
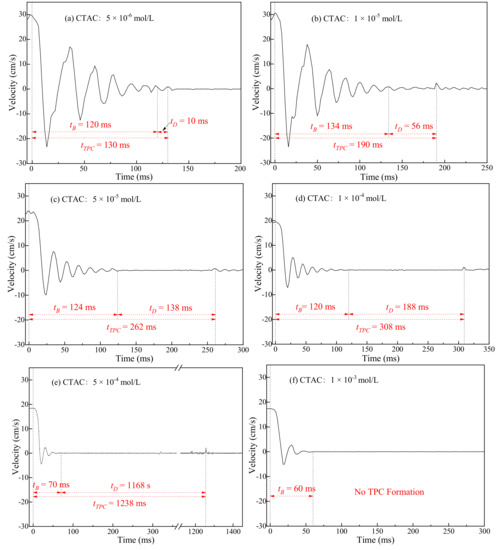
Figure 11.
Bubble velocity variation during collision-rebound process with talc surface in CTAC solution with different concentrations. (a) 5 × 10⁻⁶ mol/L; (b) 1 × 10⁻⁵ mol/L; (c) 5 × 10⁻⁵ mol/L; (d) 1 × 10⁻⁴ mol/L; (e) 5 × 10⁻⁴ mol/L; (f) 1 × 10⁻³ mol/L.
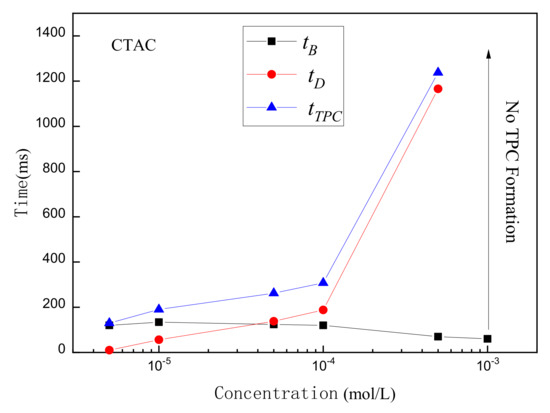
Figure 12.
The and of talc in different CTAC concentrations.
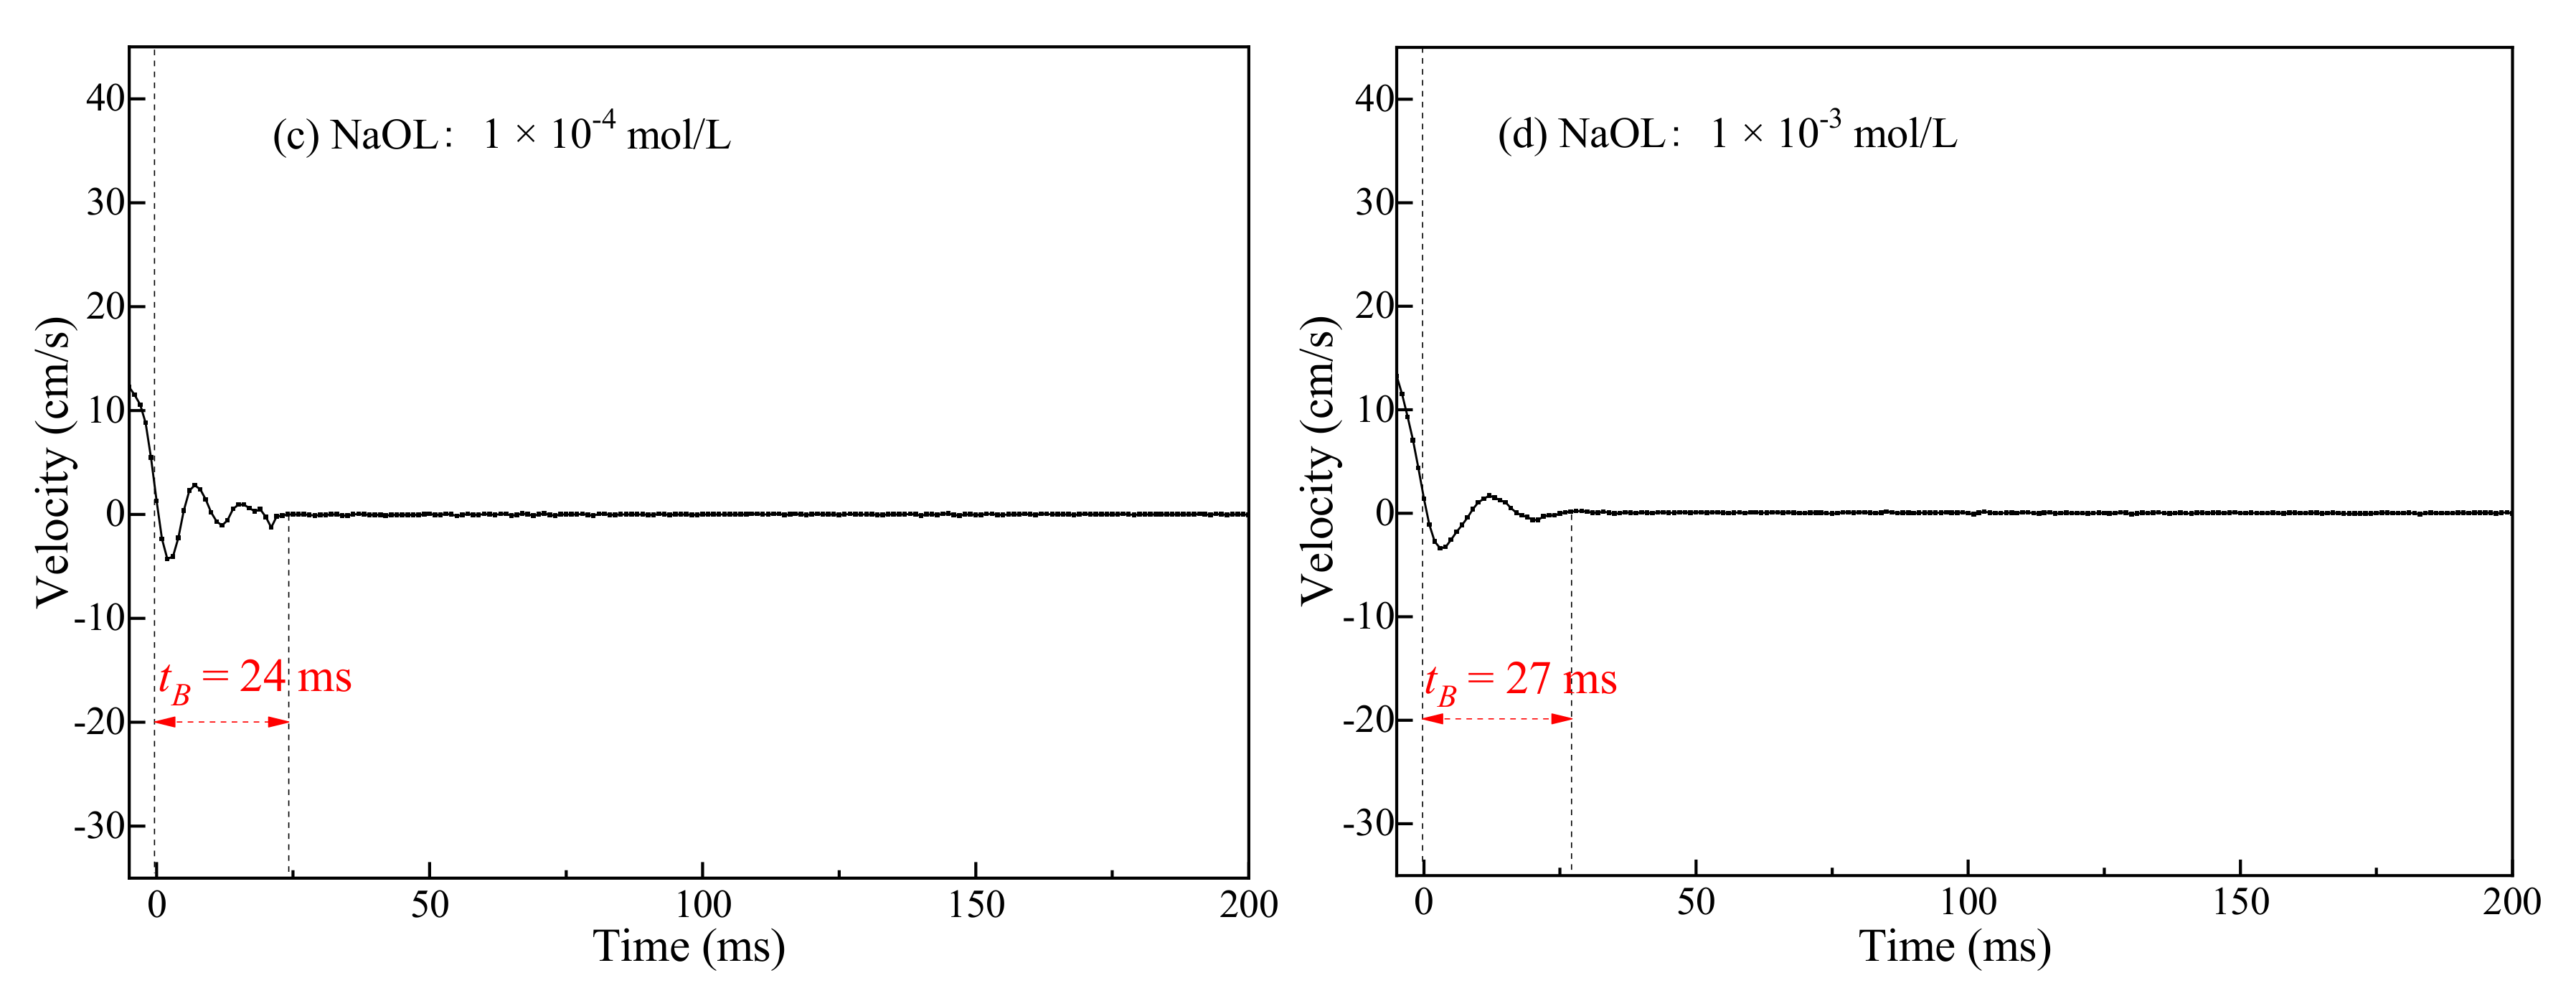
Figure 13 shows the relevant velocity changes for NaOL solution. Unlike muscovite, which had no TPC at all NaOL concentrations, the TPC phenomenon appeared at almost all concentrations on the talc surface, similar to that of the CTAC solution in Figure 11. After the bubble collided with the talc, the rising rate decreased to zero immediately and then rebounded to the solution. When the rebound velocity decreased to zero, the bubble rose up and collided with the talc again. Its kinetic energy was finally exhausted and maintained stably below the talc surface. After a rest period, there was a small positive velocity, indicating that the bubbles adhered to the talc and that the TPC had occurred. When the concentration was lower than 5 × 10⁻⁵ mol/L, tD was zero or negligible, making tTPC = tB. The TPC time required for CTAC was slightly longer than that for the same concentration of NaOL. For the anionic surfactant, even though there was electrostatic repulsion between the bubbles and the talc surface, the TPC still can be formed. This further demonstrated that the main reason for TPC formation was different for different minerals.
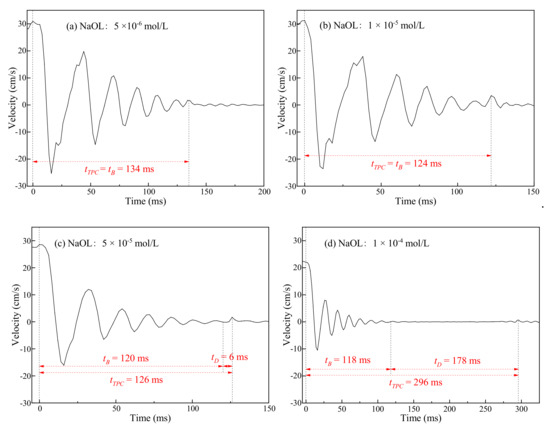
Figure 13.
Bubble velocity variation during collision-rebound process with talc surface in NaOL solution with different concentrations. (a) 5 × 10⁻⁶ mol/L; (b) 1 × 10⁻⁵ mol/L; (c) 5 × 10⁻⁵ mol/L; (d) 1 × 10⁻⁴ mol/L; (e) 5 × 10⁻⁴ mol/L; (f) 1 × 10⁻³ mol/L.3.2.3. Mechanism Analysis of TPC Formation.
From the above experimental results, it can be seen that TPC formation was linked to the type of surfactants and the hydrophilicity/hydrophobicity of the mineral. Moreover, the TPC formation rules in hydrophilic muscovite and hydrophobic talc were also different.
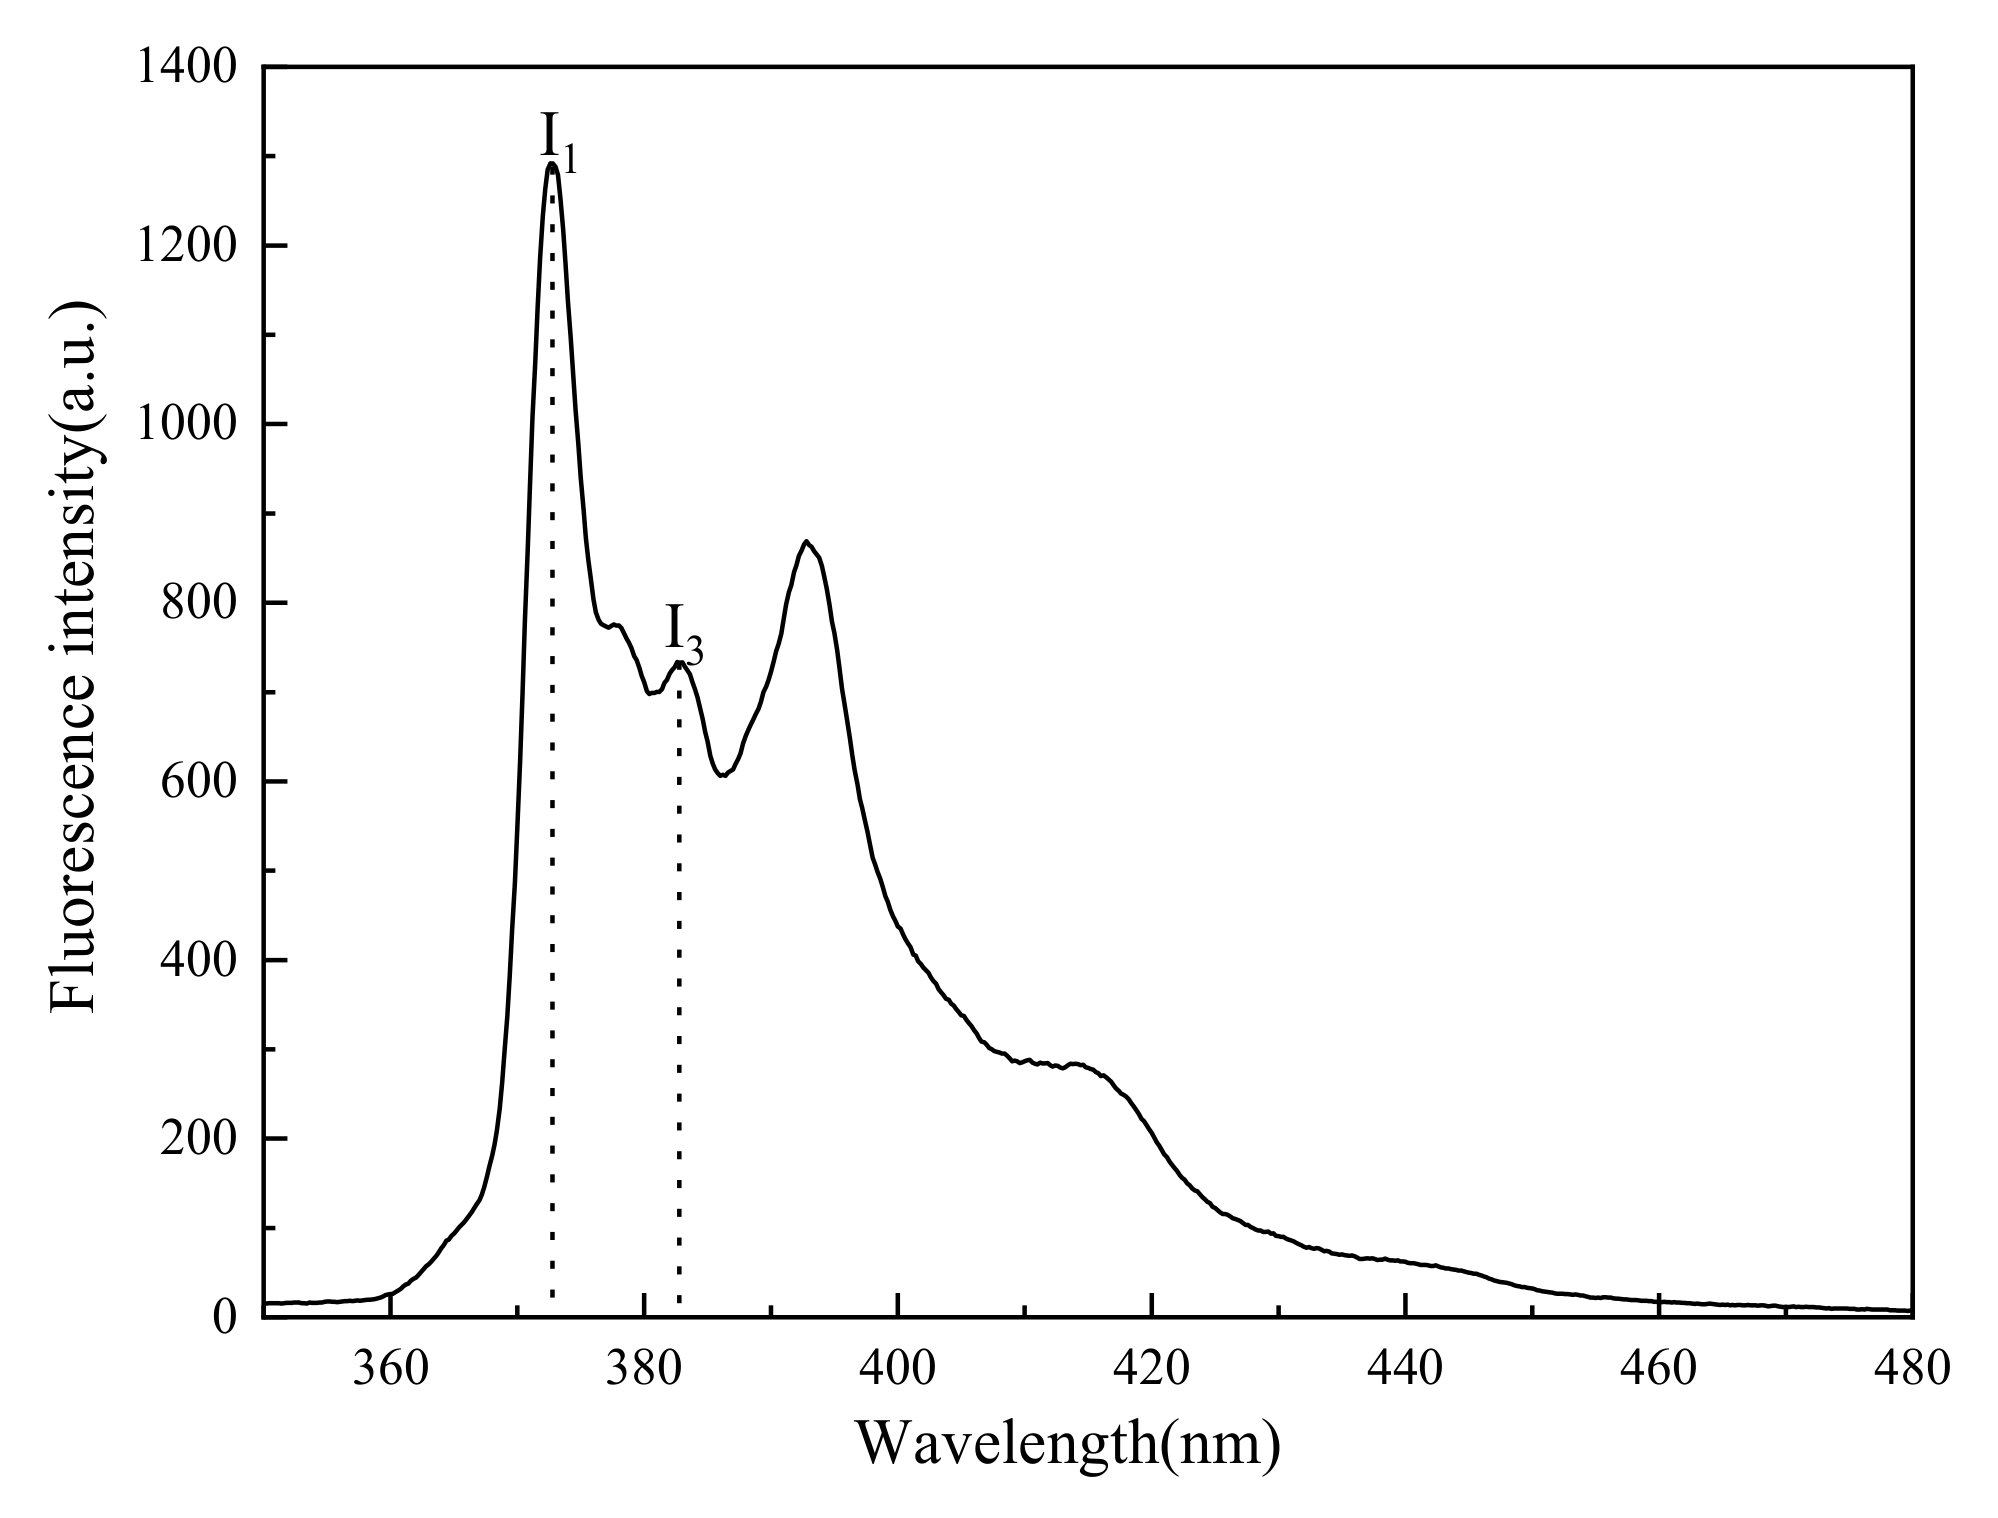
Pyrene was an organic molecule that is slightly soluble in water and can be solubilized in surfactant micelles or surfactants adsorbed on mineral surfaces. Pyrene is usually employed to observe the change in the micro-polarity in suspensions, such as pulp, because there is nearly no fluorescence signal for many flotation reagents, and some indicator substances are then needed to be introduced to facilitate the micro-polarity analysis. Until now, pyrene has been used widely for the adsorption mechanism analysis of flotation reagents [31,32,33]. It can generate a monomer emission spectrum after excitation at a 335 nm wavelength, which was a structure spectrum with five sharp peaks, as shown in Figure 14. The ratio of the intensity of the third peak (I3) to the first peak (I1) could reflect the change in the polarity of its environment [34]. The larger the I3/I1, the weaker the polarity, that is, the more hydrophobic the environment. In the aqueous solution, I3/I1 was about 0.5 ~ 0.6, while in micelles, it was 0.8 ~ 0.9, and it was greater than 1 in non-polar solvents [35]. Therefore, we chose pyrene as a fluorescent probe to detect the surface “micro-polarity” changes in the muscovite and the talc in different concentrations of surfactant solutions.
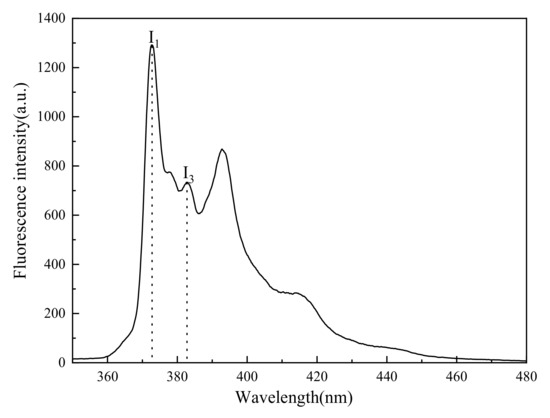
Figure 14.
Fluorescence spectra of pyrene in deionized water.
For typical hydrophilic silicate muscovite, its natural contact angle is about 7° [36,37]. According to the results, TPC was formed in the CTAC solution, and the time required decreased with the increasing concentration, whereas no TPC appeared in the NaOL solution. In deionized water, the negative charge on the muscovite surface repels the negative charge on the bubble surface to prevent the liquid film from rupturing, leading to no TPC formation in water (shown in Figure 6). In the anionic NaOL solution, the surfactant adsorption on the bubble surface made it more electronegative, increasing the electrostatic repulsion of bubbles and muscovite. However, in the cationic CTAC solution, the repulsive force became attractive due to CTAC adsorption on the bubble surface, and the electrostatic attraction became stronger as the concentration increases, and TPC was easily formed.
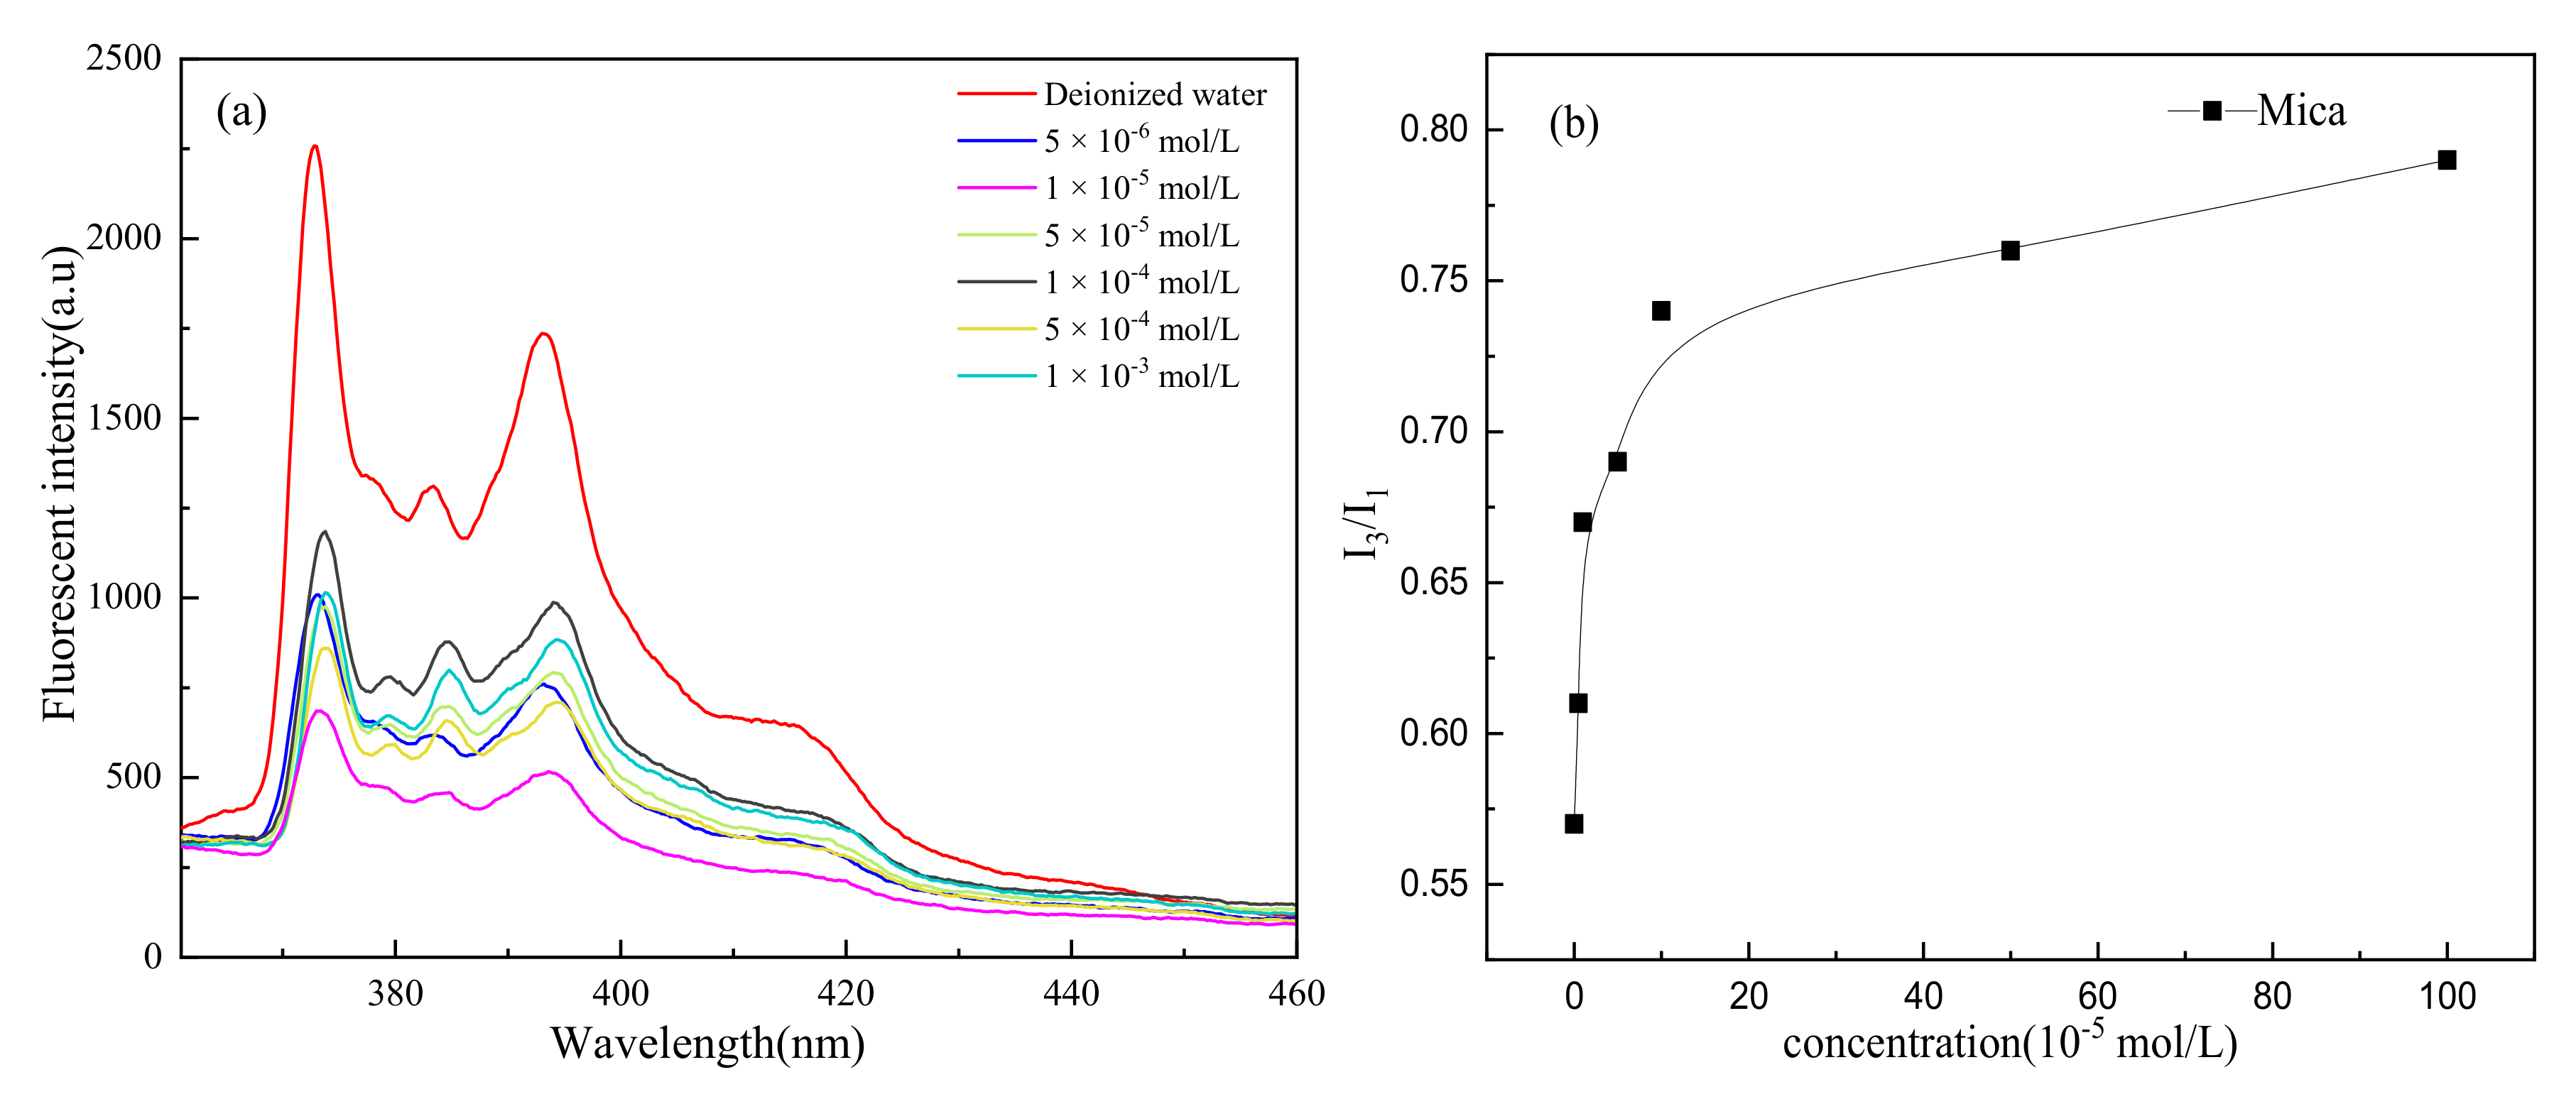
Furthermore, the surfactant was also adsorbed on the muscovite surface, resulting in a larger contact angle and dramatically improved hydrophobicity, and increasing concentrations made these changes more pronounced. As shown in Figure 15, when no surfactant was added, the value of I3/I1 was about 0.57, which was consistent with the value in water. Pyrene was in a polar environment, and the surface of muscovite was hydrophilic. When the surfactant concentration increased to 1 × 10⁻⁵ mol/L, I3/I1 was about 0.8, indicating that the surfactant formed a semi-micelle adsorption on the mineral surface, and the mineral surface was the most hydrophobic at this time. On the whole, the value I3/I1 increased with the increase in the surfactant concentration. The surfactant was adsorbed on the surface of muscovite, causing its surface polarity to become smaller, and the hydrophobicity of the muscovite surface was greatly enhanced. The combined action of hydrophobic attraction and electrostatic attraction promoted the thinning of the hydration film between the bubbles and the mineral surface and shortened the formation time of the TPC.
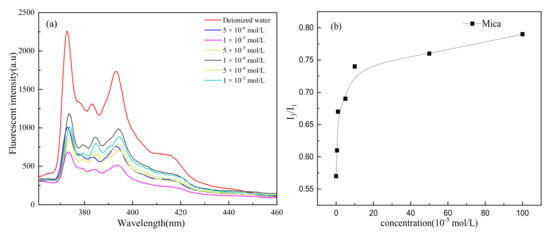
Figure 15.
CTAC solutions of different concentrations. (a) Pyrene fluorescence spectra of muscovite. (b) I3/I1 values of probe pyrene on muscovite surface.
For hydrophobic silicate talc, it had natural floatability, and the contact angle was very large without adding any surfactants. Therefore, according to the characteristic that the pyrene fluorescent probe was very sensitive to environmental changes, the change in micro polarity after introducing the surfactant collectors into the talc pulp can be observed to explain the TPC-formation mechanism onto the talc surface.
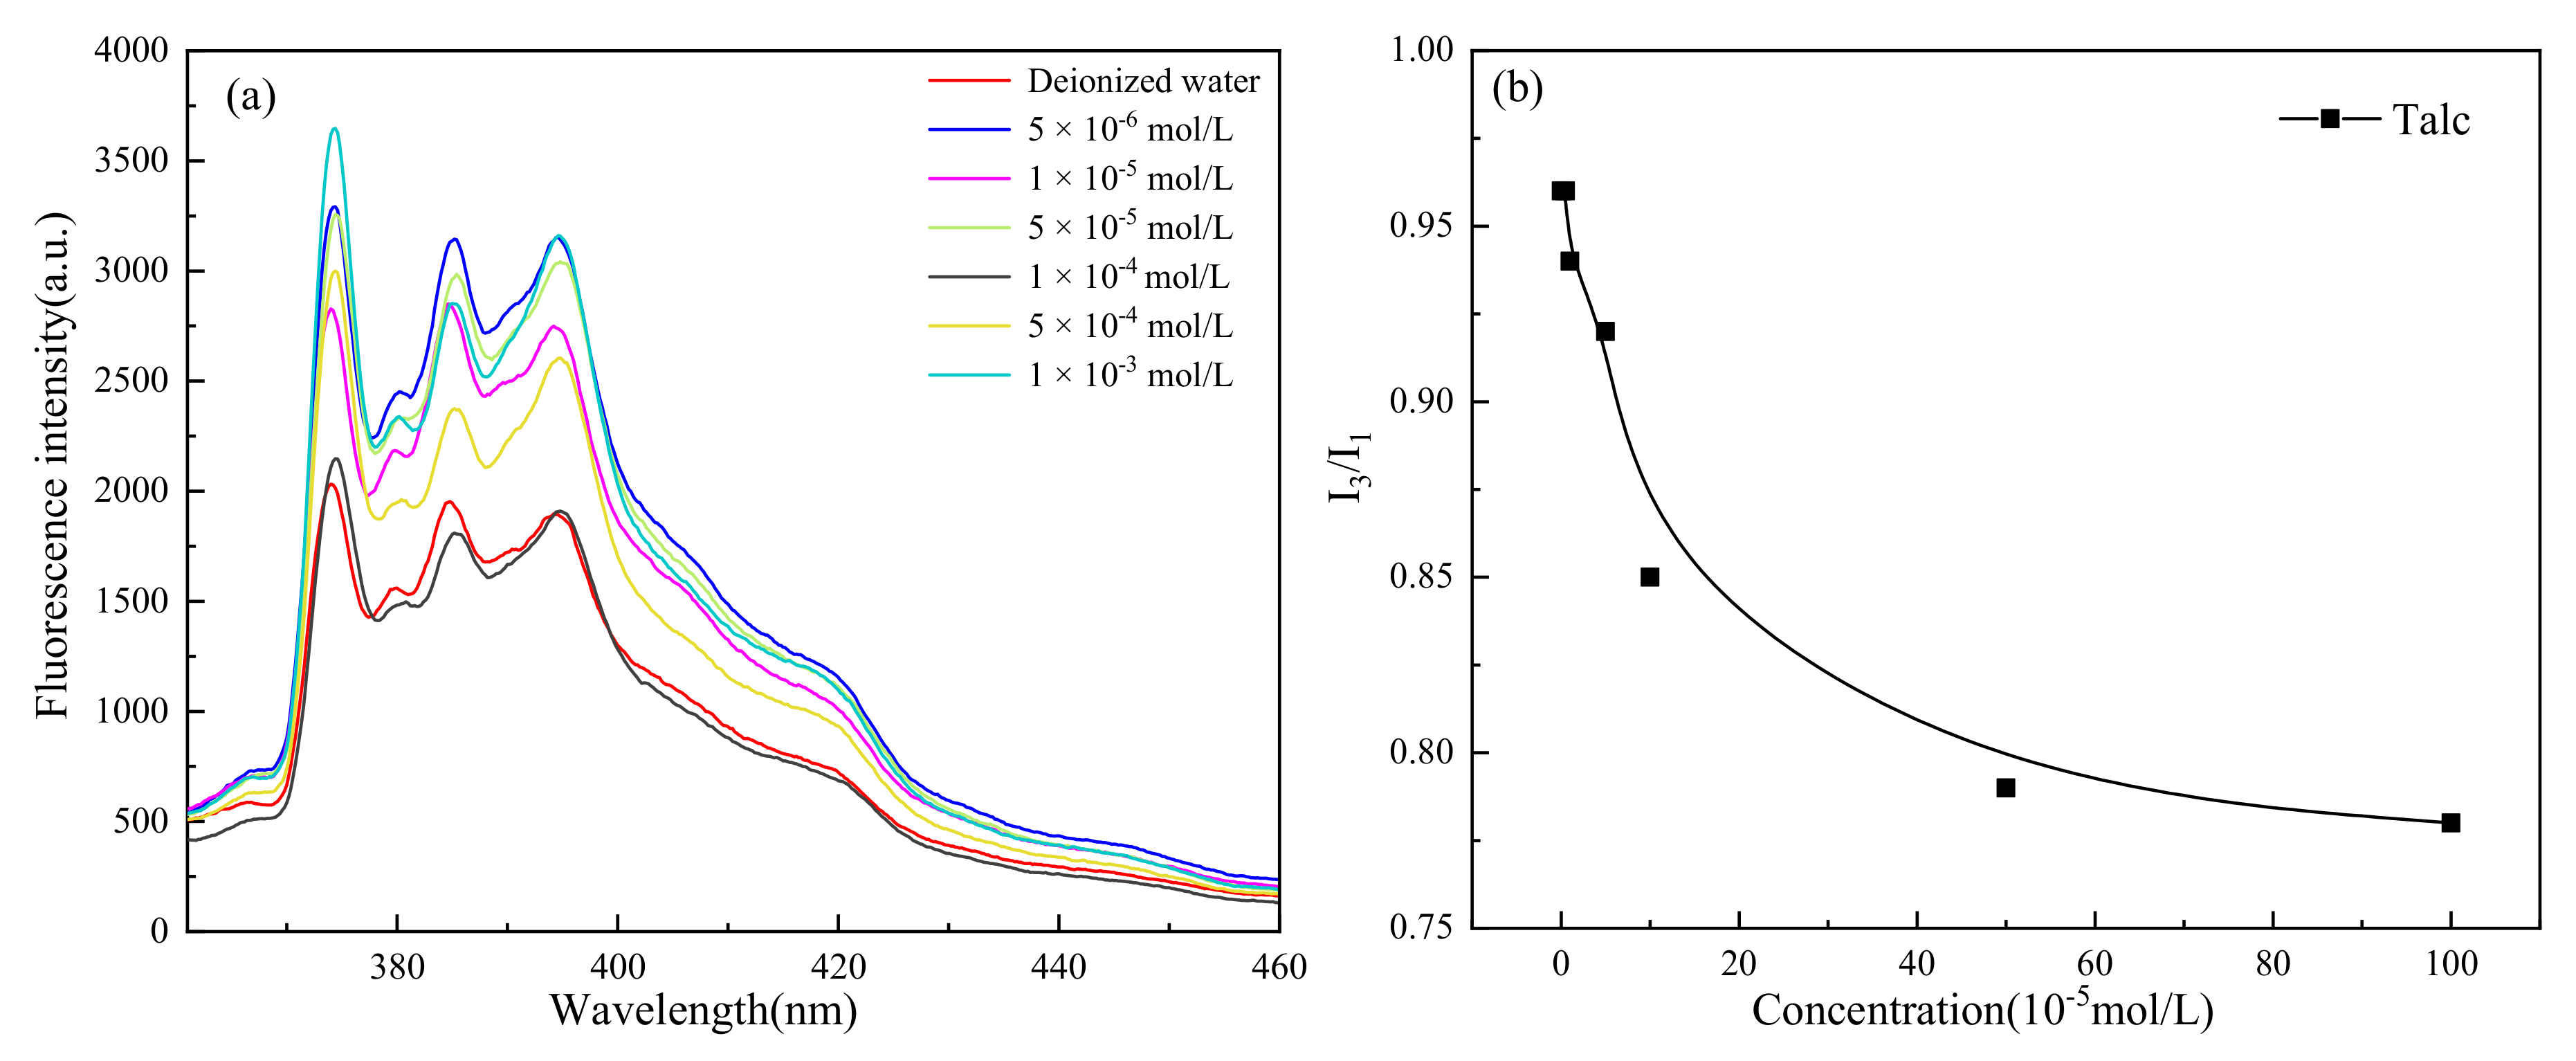
The TPC formed whether in the deionized water or in different types of surfactant solutions, and the increasing surfactant concentration made the liquid film between the bubbles and the talc more stable. As shown in Figure 16, when no surfactant was introduced, the value of I3/I1 on the talc surface was about 1, which was close to the non-polar environment. Therefore, the talc surface had strong hydrophobicity and good natural floatability. The surfactant at low concentrations had little effect on its surface polarity. However, at higher concentrations, the surface polarity decreased. At 1 × 10⁻³ mol/L of CTAC, I3/I1 was only 0.75 at which the surface hydrophobicity was weakened compared with lower concentration. However, the talc surface still showed hydrophobicity, so the TPC can formed even at higher surfactant concentrations. However, due to the hydrophobic attraction decrease and the effect of surfactants to stabilize the hydration film between bubbles and mineral surfaces, the time for TPC formation was prolonged as the surfactant concentration increased. It was exactly this hydrophobic attraction that improved the TPC formation as the leading role.
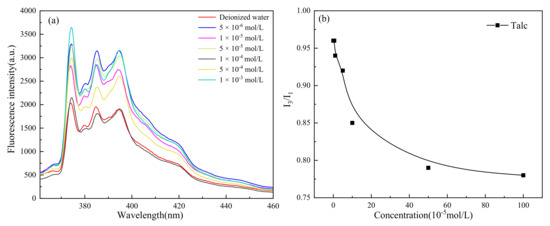
Figure 16.
CTAC solutions of different concentrations. (a) Pyrene fluorescence spectra of talc. (b) I3/I1 values of probe pyrene on talc surface.
3.3. Discussion
Based on the analysis of this research, the formation and its mechanism of the three-phase contact onto a hydrophilic muscovite surface and a hydrophobic talc surface were studied in detail. Compared with the existing and common results, it was found that different main reasons were used for explaining the TPC formation. For the hydrophilic muscovite, the hydrophobic attraction and the electrostatic attraction are the main factors to make the TPC occur in the cationic surfactant system, while in the anionic environment, no obvious TPC formed because of the electrostatic repulsion. However, for the hydrophobic talc, TPC can be formed whether in the cationic or the anionic system. According to this phenomenon, we found that the change in micro polarity was the most important reason to cause the different results for the talc and the mica.
It has been shown that there is a close relationship between the flotation efficiency or the flotation recovery and the bubble attachment onto the mineral particle surface. However, the research level is still not very high about the specific mechanism or effects of the flotation bubble [38,39,40]. The application and use of the study on the three-phase contact formation (tTPC) can exactly interpret the bubble movement rules and reflect its effect on the flotation kinetics, which are defined as the inversed first-order rate constant (1/κ) in which the time of three-phase contact formation (tTPC) corresponds to the time from the first collision of the bubble to its attachment on the mineral surface [41]. According to the findings of the TPC study, it proved that the bubble movement can become the helpful tool to predict the flotation response and the kinetics of different flotation systems. As a result, although the flotation is a highly complex process including many sub-processes, the bubble collision and attachment behavior and the drainage process of the liquid film seem to be crucial factors for the final flotation results.
4. Conclusions
This research work systematically studied the dynamic process of the three-phase contact formation by colliding bubbles onto muscovite and talc surfaces in water and solutions of two surfactants, cationic CTAC (cetyltrimethyl ammoniumchloride) and anionic NaOL (sodium oleate). The deformation and stability of bubbles and the interaction process between bubbles and layered silicate minerals (i.e., hydrophilic muscovite and hydrophobic talc) were investigated through the high-speed camera. The following major conclusions were drawn from the detailed study:
- The increasing concentration of CTAC reduced the aspect ratio (AR) of the rising bubble, making it closer to the sphere.
- Bubbles may rebound and collide with the liquid level several times until they dissipate the kinetic energy and burst after a period of time. Due to the surface-tension gradient effect, the bubbles in NaOL were much more stable than those in CTAC, and the film thinning became slower.
- The rupture of the liquid film between the bubbles and the mineral surface was a necessary condition for TPC formation. For hydrophilic muscovite, the TPC was formed in CTAC due to the hydrophobic attraction and electrostatic attraction, and the increasing concentration can shorten its formation time. However, it did not appear in water and NaOL due to electrostatic repulsion between the bubbles and the muscovite surface.
- Unlike muscovite, TPC was formed on the talc surface, either in deionized water or surfactants. Talc was a naturally hydrophobic mineral. When TPC was formed, the hydrophobic attraction played a major role and promoted the thinning and breaking of the hydration film between the bubbles and the talc. However, the multi-layer adsorption of high-concentration surfactants actually reduced its hydrophobicity with the result that the I3/I1 value decreased and the local micro-polarity enhanced. The hydrophobic attraction was weakened, and the TPC formation time was prolonged.
- The main reason for TPC formation was different for different minerals. Micro polarity changes on the mineral surface can be explained for different phenomena of TPC results via fluorescence spectrum analysis.
Author Contributions
Conceptualization, X.L. and H.J.; methodology, H.J.; software, J.X.; validation, G.X.; formal analysis, Y.G., J.X., M.L. and G.X.; investigation, Y.G., J.X., M.L. and G.X.; writing—original draft preparation, Y.G. and M.L.; writing—review and editing, X.L. and G.X.; funding acquisition, H.J. All authors have read and agreed to the published version of the manuscript.
Funding
The authors of this study proudly acknowledged the financial supports from the National Key Scientific Research Project (2018YFC1901601 and 2018YFC1901602) and the National Natural Science Foundation of China (U1704252).
Conflicts of Interest
The authors declare no conflict of interest.
References
- Albijanic, B.; Ozdemir, O.; Nguyen, A.; Bradshaw, D. A review of induction and attachment times of wetting thin films between air bubbles and particles and its relevance in the separation of particles by flotation. Adv. Colloid Interface Sci. 2010, 159, 1–21. [Google Scholar] [CrossRef]
- Zawala, J.; Drzymala, J.; Malysa, K. An investigation into the mechanism of the three-phase contact formation at fluorite surface by colliding bubble. Int. J. Miner. Process. 2008, 88, 72–79. [Google Scholar] [CrossRef]
- Wang, S.; Guo, J.; Tang, L.; He, H.; Tao, X. Effect of surface roughness of Chinese sub-bituminous coal on the kinetics of three-phase contact formation. Fuel 2018, 216, 531–537. [Google Scholar] [CrossRef]
- Kowalczuk, P.B.; Zawala, J.; Drzymala, J.; Malysa, K. Influence of hexylamine on kinetics of flotation and bubble attachment to the quartz surface. Sep. Sci. Technol. 2016, 51, 2681–2690. [Google Scholar] [CrossRef]
- Deryagin, B.V.; Gutop, Y.V. Theory of the breakdown (rupture) of free films. Kolloidn. Zh. 1962, 24, 370–374. [Google Scholar]
- Anfruns, J.F.; Kitchener, J.A. Rate of capture of small particles in flotation. Trans. I. MM. 1977, 86, c9–c15. [Google Scholar]
- Firouzi, M.; Nguyen, A.V.; Hashemabadi, S.H. The effect of microhydrodynamics on bubble–particle collision interaction. Miner. Eng. 2011, 24, 973–986. [Google Scholar] [CrossRef]
- Niecikowska, A.; Krasowska, M.; Ralston, J.; Malysa, K. Role of Surface Charge and Hydrophobicity in the Three-Phase Contact Formation and Wetting Film Stability under Dynamic Conditions. J. Phys. Chem. C 2012, 116, 3071–3078. [Google Scholar] [CrossRef]
- Malysa, K.; Krasowska, M.; Krzan, M. Influence of surface active substances on bubble motion and collision with various interfaces. Adv. Colloid Interface Sci. 2005, 114–115, 205–225. [Google Scholar] [CrossRef]
- Frumkin, A.; Vg, L. On surfactants an interfacial motion. Zh. Fiz. Khim. 1947, 21, 1183–1204. [Google Scholar]
- Dukhin, S.S.; Kretzschmar, G.; Miller, R. Dynamic of Adsorption at Liquid Interfaces; Elsevier: Amsterdam, The Netherlands, 1995. [Google Scholar]
- Malysa, K.; Zawała, J.; Krzan, M.; Krasowska, M. Bubbles rising in solutions; local and terminal velocities, shape variations and collisions with free surface. In Bubble and Drop Interfaces; CRC Press: Boca Raton, FL, USA, 2011; pp. 251–300. [Google Scholar]
- Dukhin, S.S.; Miller, R.; Loglio, G. Physico-chemical hydrodynamics of rising bubble. Stud. Interface Sci. 1998, 6, 367–432. [Google Scholar]
- Mierczynska-Vasilev, A.; Beattie, D.A. The effect of impurities and cleavage characteristics on talc hydrophobicity and polymer adsorption. Int. J. Miner. Process. 2013, 118, 34–42. [Google Scholar] [CrossRef]
- Khraisheh, M.; Holland, C.; Creany, C.; Harris, P.; Parolis, L. Effect of molecular weight and concentration on the adsorption of CMC onto talc at different ionic strengths. Int. J. Miner. Process. 2004, 75, 197–206. [Google Scholar] [CrossRef]
- Xu, L.; Wu, H.; Dong, F.; Wang, L.; Wang, Z.; Xiao, J. Flotation and adsorption of mixed cationic/anionic collectors on muscovite mica. Miner. Eng. 2013, 41, 41–45. [Google Scholar] [CrossRef]
- Wang, L.; Sun, W.; Hu, Y.-H.; Xu, L.-H. Adsorption mechanism of mixed anionic/cationic collectors in Muscovite – Quartz flotation system. Miner. Eng. 2014, 64, 44–50. [Google Scholar] [CrossRef]
- Xie, Z.; Jiang, H.; Sun, Z.C.; Yang, Q.H. Direct AFM measurements of morphology and interaction force at solid-liquid interfaces between DTAC/CTAC and mica. J. Cent. South Univ. 2016, 23, 2182–2190. [Google Scholar] [CrossRef]
- Pan, G.; Shi, Q.; Zhang, G.; Huang, G. Selective depression of talc in chalcopyrite flotation by xanthan gum: Flotation response and adsorption mechanism. Colloids Surf. A Physicochem. Eng. Asp. 2020, 600, 124902. [Google Scholar] [CrossRef]
- Peng, B.; Peng, J.; Zhang, W.; Ning, X.; Guo, Y.; Zhang, W. Use of locust bean gum in flotation separation of chalcopyrite and talc. Miner. Eng. 2018, 122, 79–83. [Google Scholar]
- Tang, X.; Chen, Y.; Liu, K.; Peng, Q.; Zeng, G.; Ao, M.; Li, Z. Reverse flotation separation of talc from molybdenite without addition of depressant: Effect of surface oxidation by thermal pre-treatment. Colloids Surfaces A: Physicochem. Eng. Asp. 2020, 594, 124671. [Google Scholar] [CrossRef]
- Liu, C.; Zhang, W.; Song, S.; Li, H. A novel method to improve carboxymethyl cellulose performance in the flotation of talc. Miner. Eng. 2018, 131, 23–27. [Google Scholar] [CrossRef]
- Yang, L.; Zhao, Y.; Yang, J.; Li, Y. Visualized study on the interaction between single bubbles and curved solid surface in flotation separation process. Water Ence Technol. 2014, 70, 627–633. [Google Scholar] [CrossRef]
- Krasowska, M.; Zawała, J.; Malysa, K. Air at hydrophobic surfaces and kinetics of three phase contact formation. Adv. Colloid Interface Sci. 2009, 147–148, 155–169. [Google Scholar] [CrossRef]
- Zawala, J.; Kosior, D.; Malysa, K. Formation and influence of the dynamic adsorption layer on kinetics of the rising bubble collisions with solution/gas and solution/solid interfaces. Adv. Colloid Interface Sci. 2015, 222, 765–778. [Google Scholar] [CrossRef]
- Elmahdy, A.M.; Mirnezami, M.; Finch, J. Zeta potential of air bubbles in presence of frothers. Int. J. Miner. Process. 2008, 89, 40–43. [Google Scholar] [CrossRef]
- Yang, C.; Dabros, T.; Li, D.; Czarnecki, J.; Masliyah, J.H. Measurement of the Zeta Potential of Gas Bubbles in Aqueous Solutions by Microelectrophoresis Method. J. Colloid Interface Sci. 2001, 243, 128–135. [Google Scholar] [CrossRef]
- Morga, M.; Adamczyk, Z. Monolayers of cationic polyelectrolytes on mica – Electrokinetic studies. J. Colloid Interface Sci. 2013, 407, 196–204. [Google Scholar] [CrossRef]
- Zembala, M.; Adamczyk, Z. Measurements of Streaming Potential for Mica Covered by Colloid Particles. Langmuir 1999, 16, 1593–1601. [Google Scholar] [CrossRef]
- Kowalczuk, P.B.; Zawala, J.; Kosior, D.; Drzymala, J.; Malysa, K. Three-Phase Contact Formation and Flotation of Highly Hydrophobic Polytetrafluoroethylene in the Presence of Increased Dose of Frothers. Ind. Eng. Chem. Res. 2016, 55, 839–843. [Google Scholar] [CrossRef]
- Jiang, H.; Gao, Y.; Yang, Q.; Khoso, S.A.; Liu, G.; Xu, L.; Hu, Y. Adsorption behaviors and mechanisms of dodecyltrimethyl ammonium chloride and cetyltrimethyl ammonium chloride on illite flotation. Powder Technol. 2018, 331, 218–225. [Google Scholar] [CrossRef]
- Sowmiya, M.; Tiwari, A.K.; Saha, S.K. Fluorescent probe studies of micro-polarity, premicellar and micellar aggregation of non-ionic Brij surfactants. J. Colloid Interface Sci. 2010, 344, 97–104. [Google Scholar] [CrossRef]
- Chandar, P.; Somasundaran, P.; Turro, N.J. Fluorescence probe studies on the structure of the adsorbed layer of dodecyl sulfate at the alumina—water interface. J. Colloid Interface Sci. 1987, 117, 31–46. [Google Scholar] [CrossRef]
- Misra, P.K.; Somasundaran, P. Fluorescence Probing of the Surfactant Assemblies in Solutions and at Solid-Liquid Interfaces. In Interfacial Processes and Molecular Aggregation of Surfactants; Narayanan, R., Ed.; Springer: Berlin, Germany, 2008; pp. 143–188. [Google Scholar]
- Jiang, H.; Xu, L.-H.; Hu, Y.-H.; Wang, D.-Z.; Li, C.-K.; Meng, W.; Wang, X.-J. Flotation and adsorption of quaternary ammonium cationic collectors on diaspore and kaolinite. Trans. Nonferrous Met. Soc. China 2011, 21, 2528–2534. [Google Scholar] [CrossRef]
- Jiang, H.; Gao, Y.; Khoso, S.A.; Ji, W.; Hu, Y. A new approach for characterization of hydrophobization mechanisms of surfactants on muscovite surface. Sep. Purif. Technol. 2019, 209, 936–945. [Google Scholar] [CrossRef]
- Jiang, H.; Gao, Y.; Khoso, S.; Ahmed, J.; Wanying, H. Interpretation of Hydrophobization Behavior of Dodecylamine on Muscovite and Talc Surface through Dynamic Wettability and AFM Analysis. Minerals 2018, 8, 391. [Google Scholar] [CrossRef] [Green Version]
- Albijanic, B.; Ozdemir, O.; Hampton, M.A.; Nguyen, P.T.; Nguyen, A.V.; Bradshawb, D. Fundamental Aspects of Bubble-particle Attachment Mechanism in Flotation Separation. Miner. Eng. 2014, 65, 187–195. [Google Scholar] [CrossRef]
- Yoon, R.H.; Yordan, J.L. Induction Time Measurement for the Quartz Amine Flotation System. J. Colloid Interface Sci. 1991, 141, 374–383. [Google Scholar] [CrossRef]
- Subasinghe, G.; Albijanic, B. Influence of the propagation of three phase contact line on flotation recovery. Miner. Eng. 2014, 57, 43–49. [Google Scholar] [CrossRef]
- Kowalczuk, P.B.; Zawala, J. A relationship between time of three-phase contact formation and flotation kinetics of naturally hydrophobic solids. Colloids Surf. A Physicochem. Eng. Asp. 2016, 506, 371–377. [Google Scholar]

Publisher’s Note: MDPI stays neutral with regard to jurisdictional claims in published maps and institutional affiliations. |
© 2022 by the authors. Licensee MDPI, Basel, Switzerland. This article is an open access article distributed under the terms and conditions of the Creative Commons Attribution (CC BY) license (https://creativecommons.org/licenses/by/4.0/).