1. Introduction
As a high-quality clean energy, shale gas has attracted much attention in recent years. Many countries and regions represented by North America have successfully realized the exploration and large-scale production of shale gas. China has also realized the effective development of shale gas resources, and the output has continued to grow rapidly, opening up a new energy market and optimizing the energy consumption structure [
1,
2,
3]. Shale gas has great potential in unconventional oil and gas in China. According to the evaluation results of oil and gas resources in the 13th Five-Year Plan, the accumulated proven shale gas resources in Sichuan Basin are 44.03 × 10¹² m
3, with the proven rate less than 4%, and the exploration degree is still low [
4,
5]. Up to 2015, four shale gas-rich areas, namely Fuling, Changning-Weiyuan, Zhaotong and Fushun-Yongchuan, have been discovered in the Wufeng-Longmaxi Formation of Sichuan Basin in the south, three national shale gas demonstration areas, namely Fuling in Chongqing, Changning-Weiyuan in Sichuan and Zhaotong in northern Yunnan and Guizhou, have been built, and industrial development has been successfully realized [
6,
7,
8,
9]. The main shale gas-producing horizon is the marine shale series from the Longmaxi Formation of the Lower Silurian to the Wufeng Formation of the Upper Ordovician [
10,
11].
Electrical prospecting has the advantages of low cost and high efficiency, and can play a key role in basin structure evaluation and deep target detection [
12]. Moreover, this method has been effectively applied to the exploration of organic-rich shale strata in Sichuan Basin, and the effect is remarkable [
13,
14]. At the same time, the time-frequency electromagnetic method is applied to the study of electromagnetic characteristics and polarization mechanism of organic-rich shale, and the organic-rich shale series is delineated [
15,
16]. A wide-area electromagnetic method is used to find the distribution range of organic-rich mud shale from the Wufeng Formation of the Upper Ordovician to the Longmaxi Formation of the Lower Silurian in the target layer of eastern Chongqing [
17]. The controlled source electromagnetic method has been applied and popularized in shale gas reservoir evaluation and fracturing monitoring in the Fuling area of Sichuan Basin [
18].
Of course, the first step of exploration is to master the petrophysical response characteristics of shale gas reservoirs. Marine organic-rich shale usually has the response characteristics of low resistance and high polarization, and pyrite is the main reason for the high polarization of shale [
19,
20]. At the same time, the complex resistivity of shale is also affected by salinity, total organic carbon (TOC), mineral composition, pore structure, formation temperature and pressure, etc. [
21,
22,
23]. Other test and research results show that the resistivity and polarizability of shale IP parameters are related to the TOC, pyrite content and brittleness index of shale, which provide the physical basis for shale gas exploration and evaluation [
24,
25]. In recent years, more and more research has been conducted on the complex resistivity characteristics of shale, and some important achievements and consensus have been achieved. However, the induced polarization response mechanism of oil and gas still needs to be further studied. The anisotropy of the earth’s internal media exists objectively and cannot be ignored. A large number of petrophysical experiments show that shale reservoirs have strong anisotropy and complex geophysical responses, which cannot be ignored in the interpretation of electromagnetic exploration data, due to the influence of the sedimentary environment (stress change, mineral composition, etc.), hydrocarbon maturity, fractures and other factors [
26,
27,
28]. The complex resistivity anisotropy of shale lays a foundation for the study of the relationship between IP parameters and reservoir parameters, and also provides the physical basis for shale gas electromagnetic exploration and data interpretation [
29,
30].
Based on the black shale of a shale gas well in southern Sichuan, this paper measured the complex resistivity of shale under different temperature and pressure conditions, revealed the anisotropic response characteristics, influencing factors and laws of shale complex resistivity, established the evaluation model of resistivity, polarizability and porosity and permeability parameters, and analyzed and discussed the electrical anisotropy characteristics of reservoir shale, which provided the physical basis for shale gas reservoir evaluation and fracturing monitoring by electrical exploration.
2. Collection and Preparation of Rock Samples
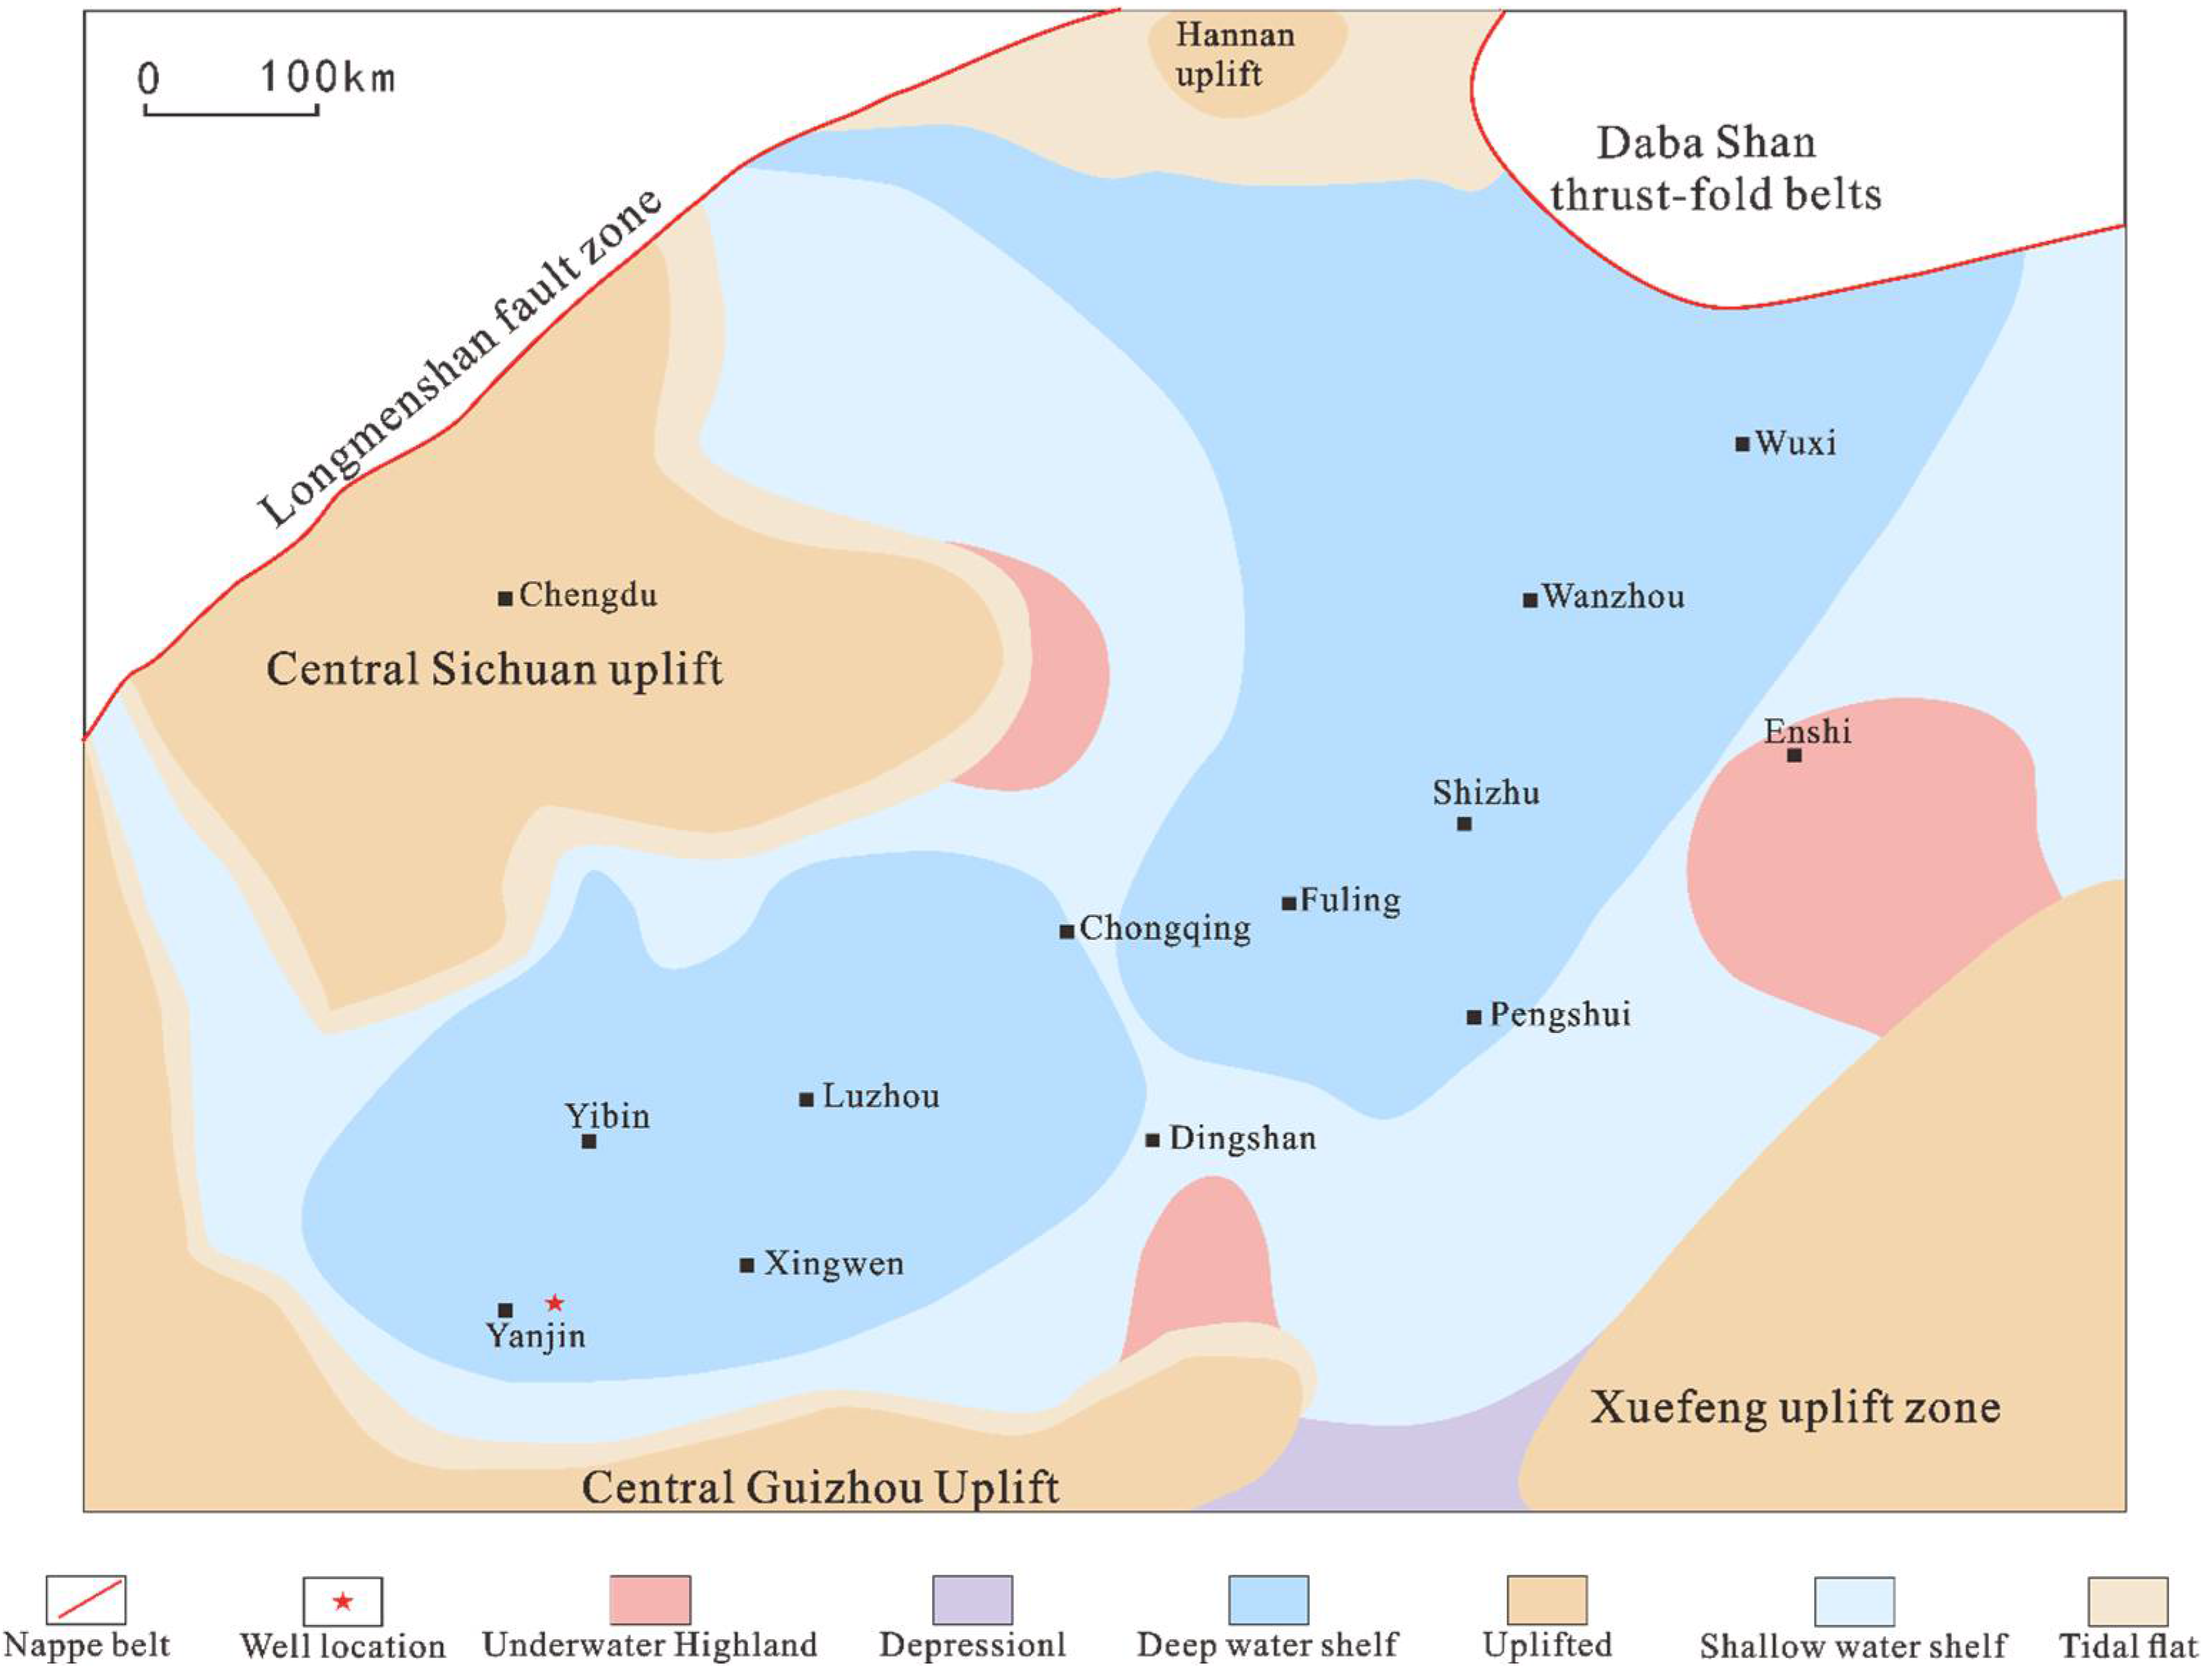
The research block is located in Gongxian County and Junlian County, Yibin City, Sichuan Province, next to Changning shale gas block, and the structural block is located in the southern edge of the low and steep fold belt in Tai ‘ao, Sichuan Province. It mainly deposits marine and continental sedimentary assemblages, and marine black shale is the main gas source rock in the exploration area. The target strata of this study are the Wufeng Formation of the Upper Ordovician and the Longmaxi Formation of the Lower Silurian, which mainly develop shallow water-land shelf facies and deep water-land shelf facies, with large thickness, high organic carbon abundance and good preservation. The location of sampling wells is shown in
Figure 1.
The shale samples are from a shale gas well in southern Sichuan Basin; information on rock samples is shown in
Table 1. The target horizon of the study area is the southern marine shale, and the main source rock strata are the Silurian Longmaxi Formation and the Ordovician Wufeng Formation, all of which are black shale with high TOC content and rich brittle minerals, so they are favorable dessert areas for shale gas exploration and development. According to the geological and geophysical data of the exploration area, the target shale of the Longmaxi Formation and Wufeng Formation has a resistivity range of 30–50 Ω·m, which belongs to a low resistivity layer.
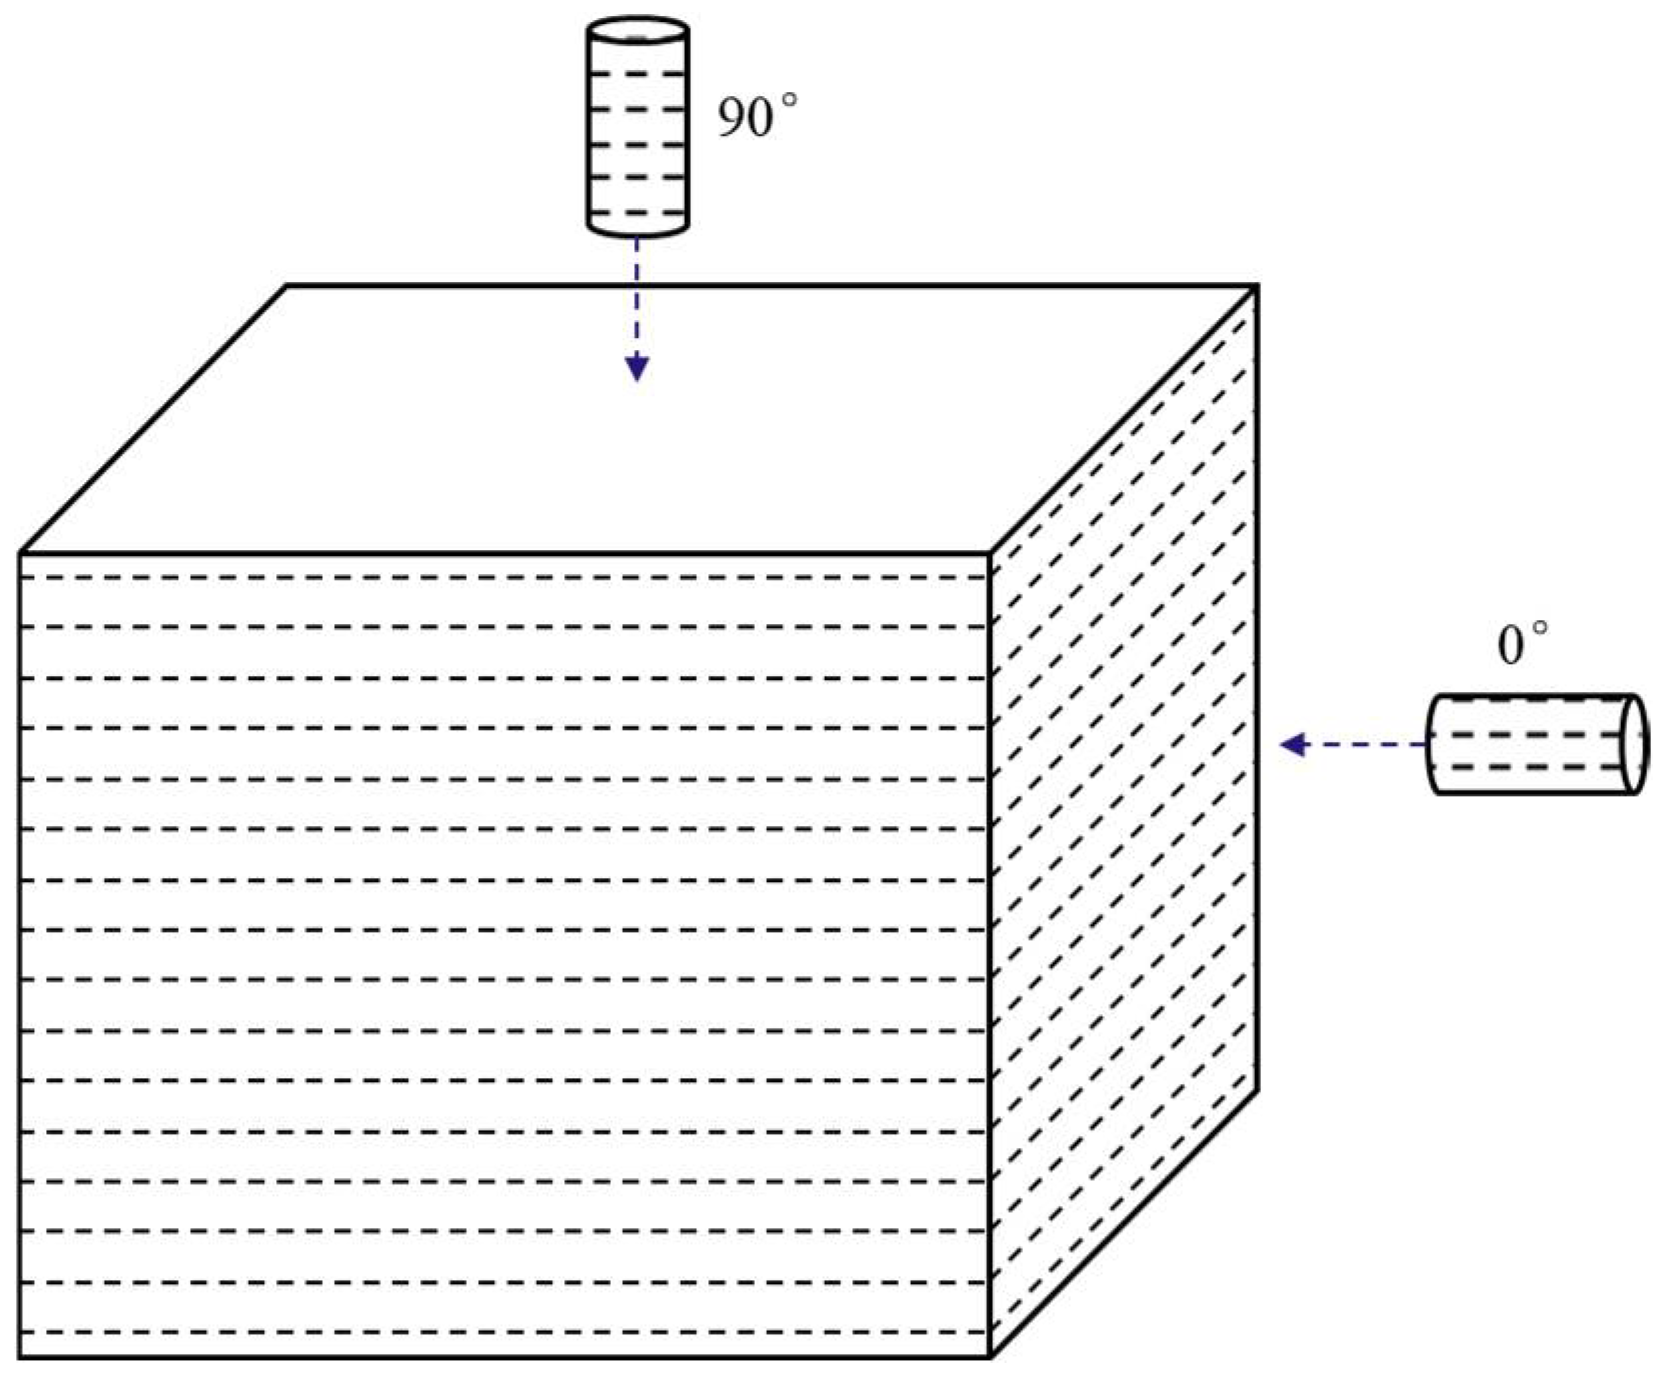
In the sample number, H represents that the drilling direction of the rock sample is horizontal (bedding direction), and V represents that the drilling direction of the rock sample is a vertical bedding direction. The coring direction and schematic diagram are shown in
Figure 2.
3. Complex Resistivity Experiment and Parameter Inversion of Shale
3.1. Complex Resistivity Test Method
In the experiment, Autolab1000 is combined with impedance analyzer 1260A, and the frequency range of complex resistivity is expanded by using the low frequency characteristic of 1260A. This time, the quadrupole method is used for observation. The measurement principle is shown in
Figure 3, and the measurement frequency is 0.01 Hz~10 Hz. The experimental measurement temperature and pressure conditions are shown in
Table 2.
3.2. Complex Resistivity Model
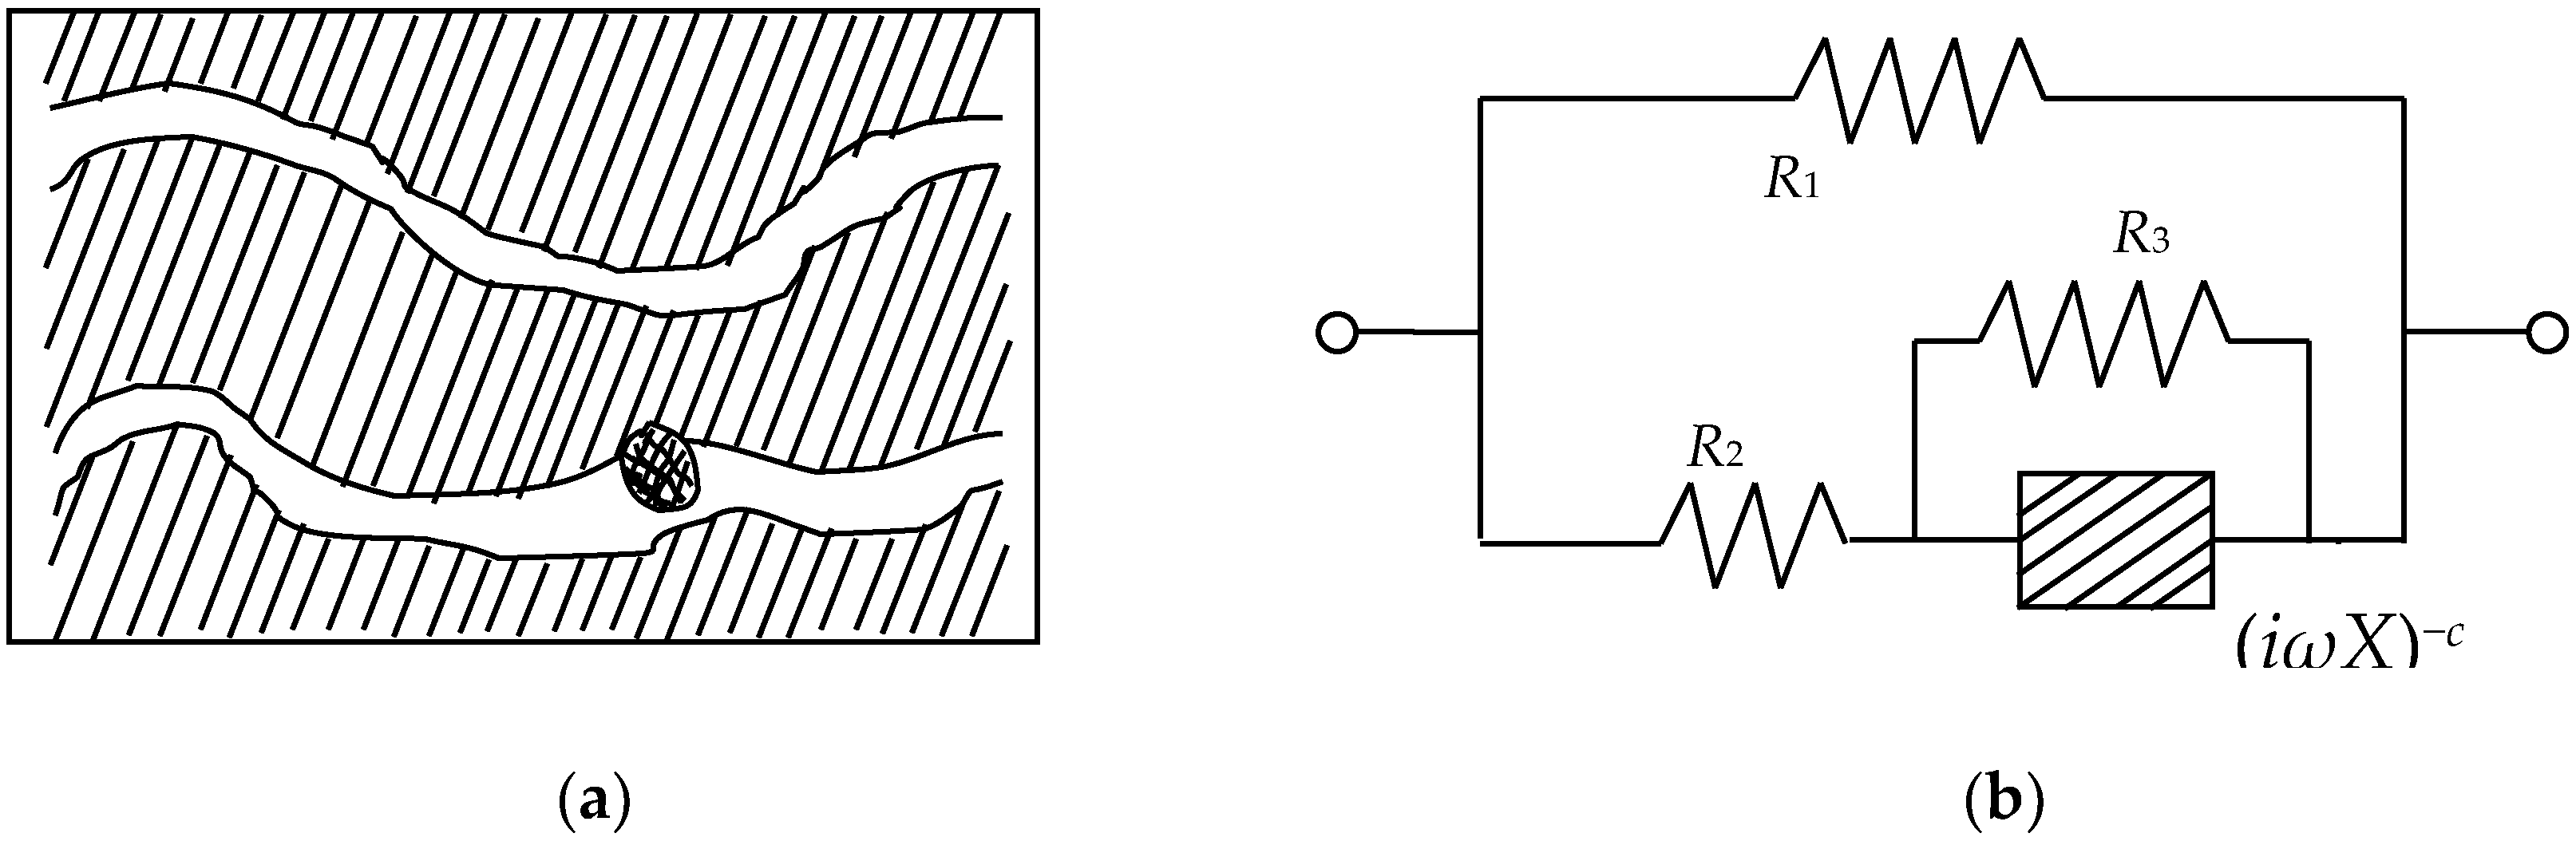
For mineralized rocks, its basic structural unit can be simplified to the structure shown in
Figure 4a, and its equivalent circuit is shown in
Figure 4b.
The structural unit includes pore channels blocked by electronically conductive mineral particles and unblocked pore channels. R
1 in the equivalent circuit diagram represents the resistance of the solution in the unblocked pore channels, R
2 represents the sum of the resistance of the solution in the blocked pore channels and the resistance of the electronic conductor. The parallel combination of complex impedance (iωX)
−c and R
3 represents the interface impedance between the electronic conductor and the ionic solution. The expression of the equivalent circuit complex impedance under this model is:
Therefore, by combining Equations (1) and (2), Equation (1) can be simplified as:
This is called Cole-Cole impedance expression; Z(0) represents the impedance at zero-frequency, m is the polarizability, τ is the time constant, and c is the frequency correlation coefficient, which is called the Cole-Cole parameter. The unit of Z(0) is Ω, the unit of τ is s, and m and c are dimensionless. K.S.Cole and R.H.Cole first proposed the above model to describe the spectrum characteristics of complex dielectric constant, so it is called the Cole-Cole model. Pelton et al. borrowed a similar equivalent circuit to study the IP effect of rocks and carried out experimental measurements on rock and ore samples, describing the spectrum characteristics of the complex resistivity of rocks [
31]. The Cole-Cole expression of complex resistivity can be obtained according to Equation (3):
where ρ
0 is the zero-frequency resistivity, and m, τ and c are the polarizability, time constant and frequency correlation coefficient, respectively.
4. Results Are Discussed with Analysis
4.1. Porosity Measurement Results
In the experiment, the porosity and permeability are measured by the FYHK-2A rock overburden porosity and permeability testing system.
Porosity and permeability are important factors affecting the complex resistivity of rock samples. After the preparation of columnar shale samples, first wash oil, wash salt and dry, and then measure porosity and permeability. The measurement results of porosity and permeability are shown in
Table 3.
4.2. Complex Resistivity Test Results
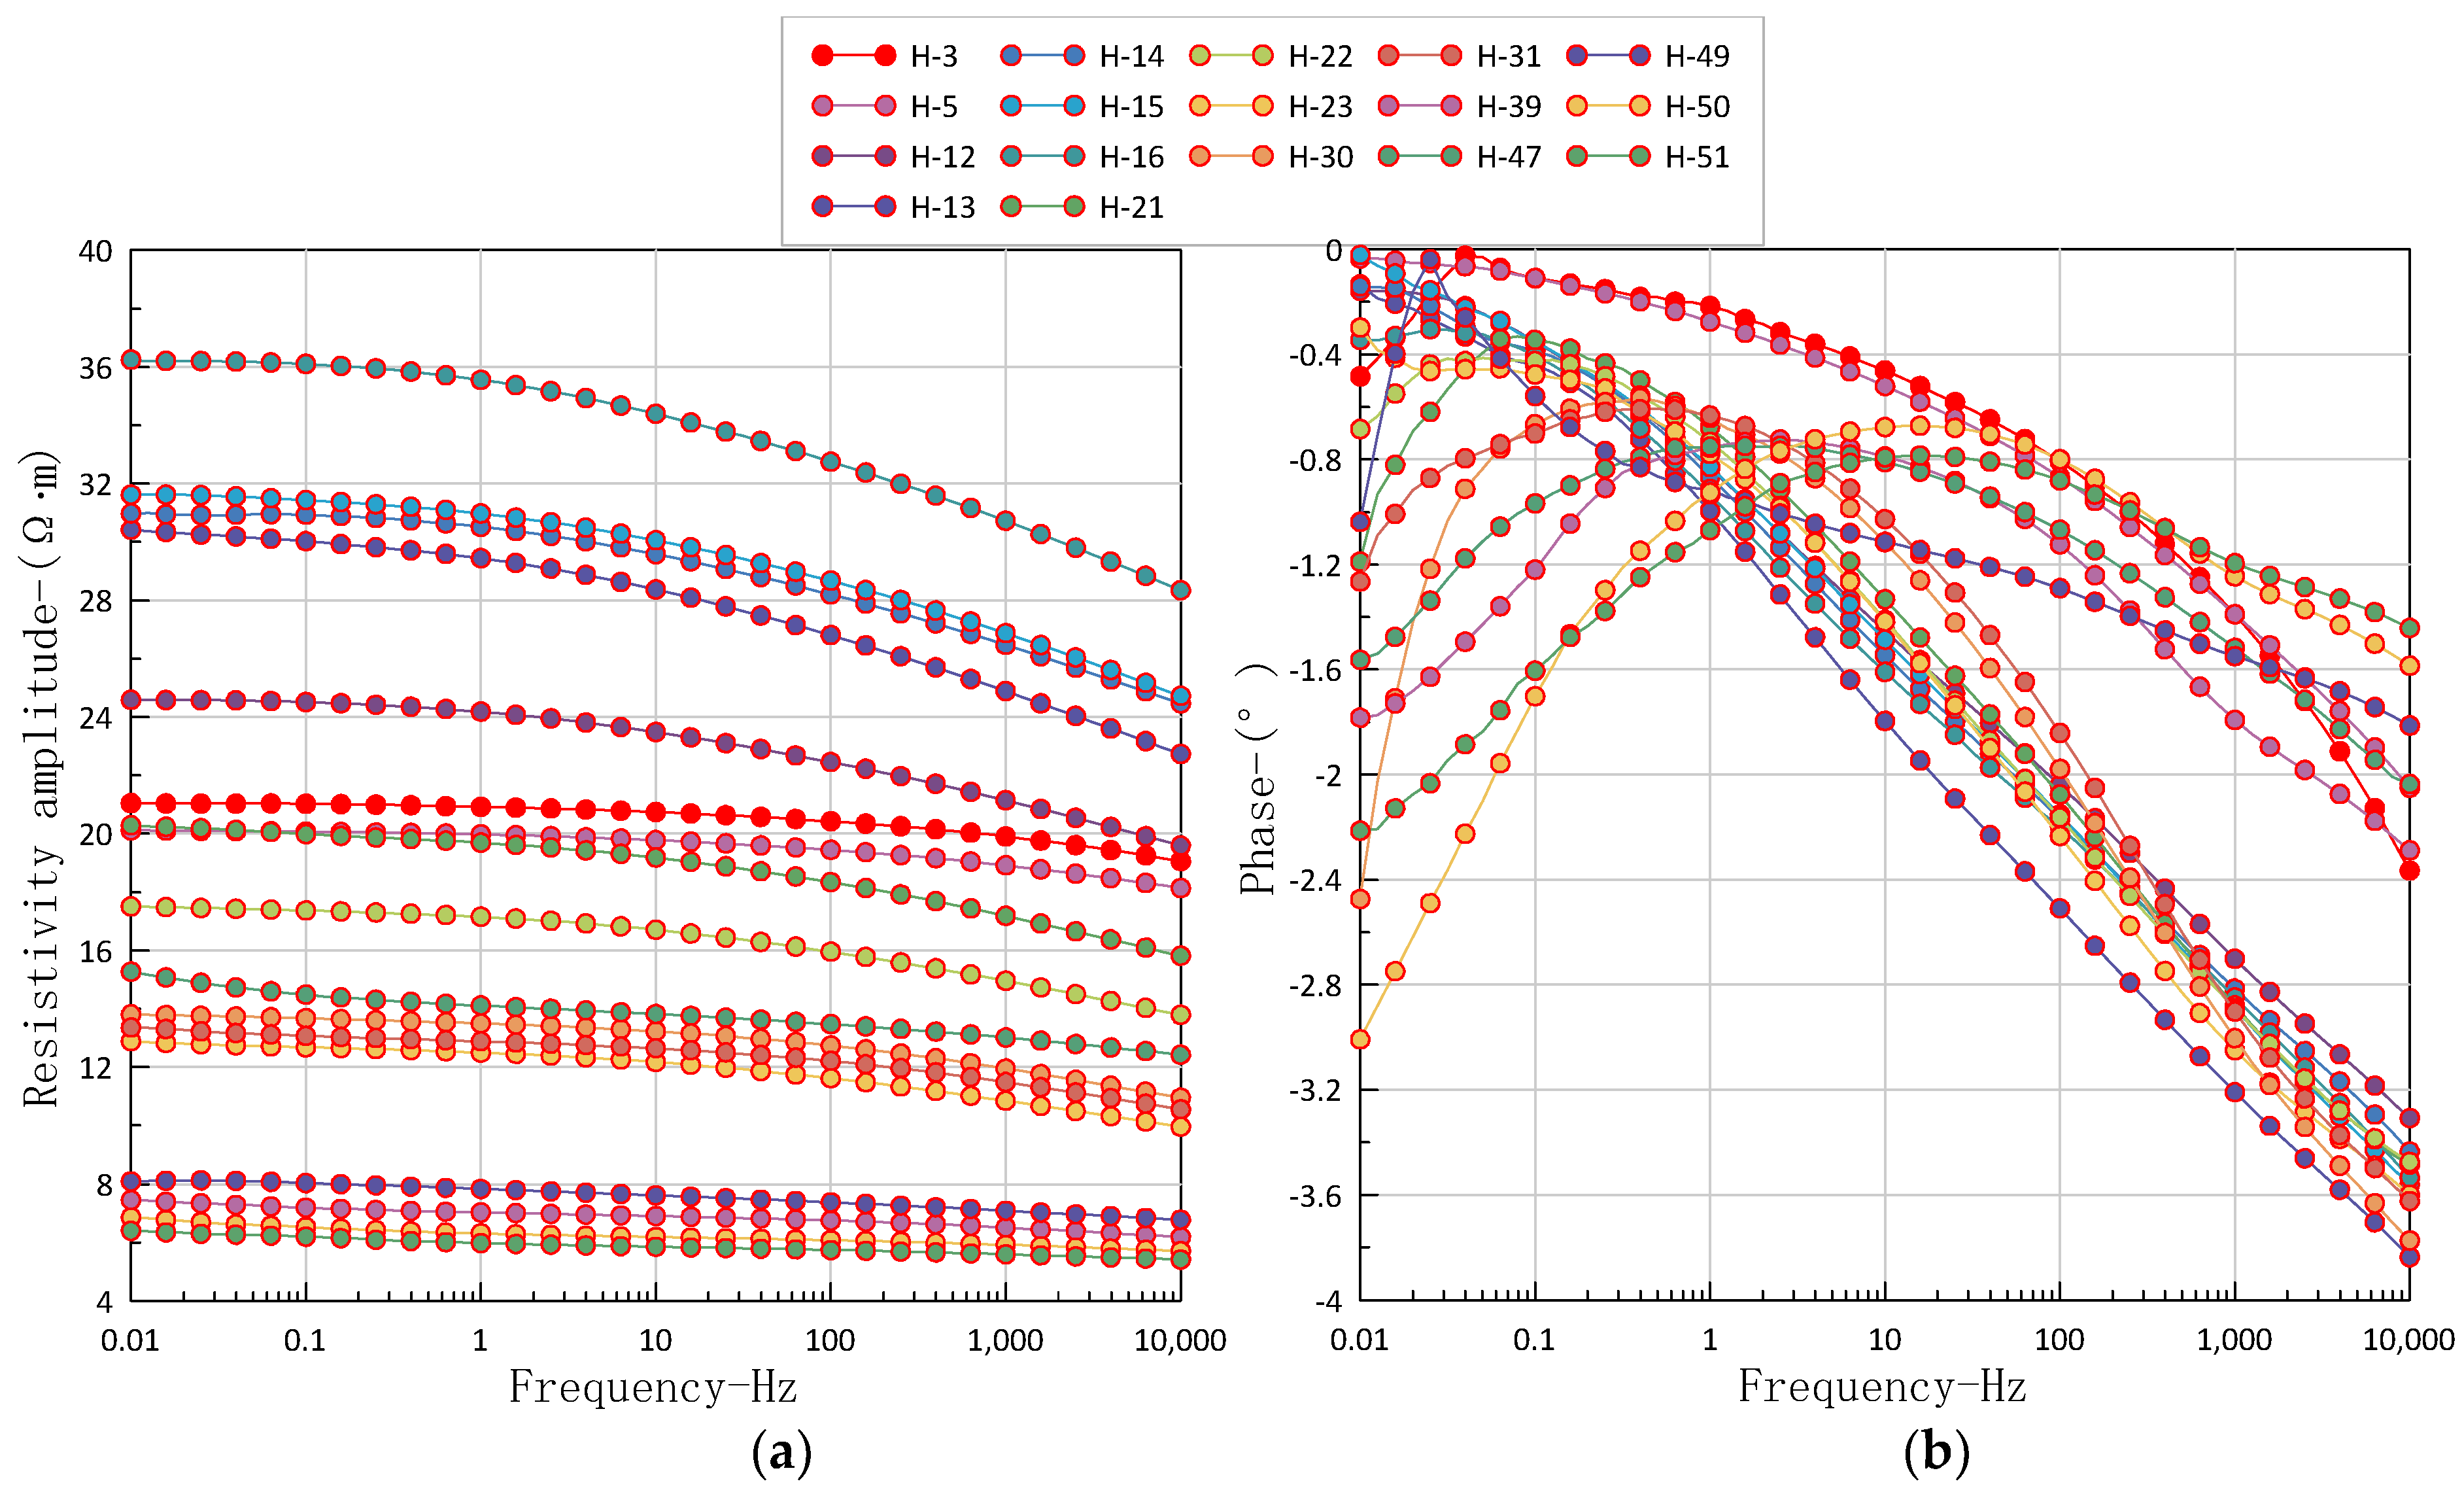
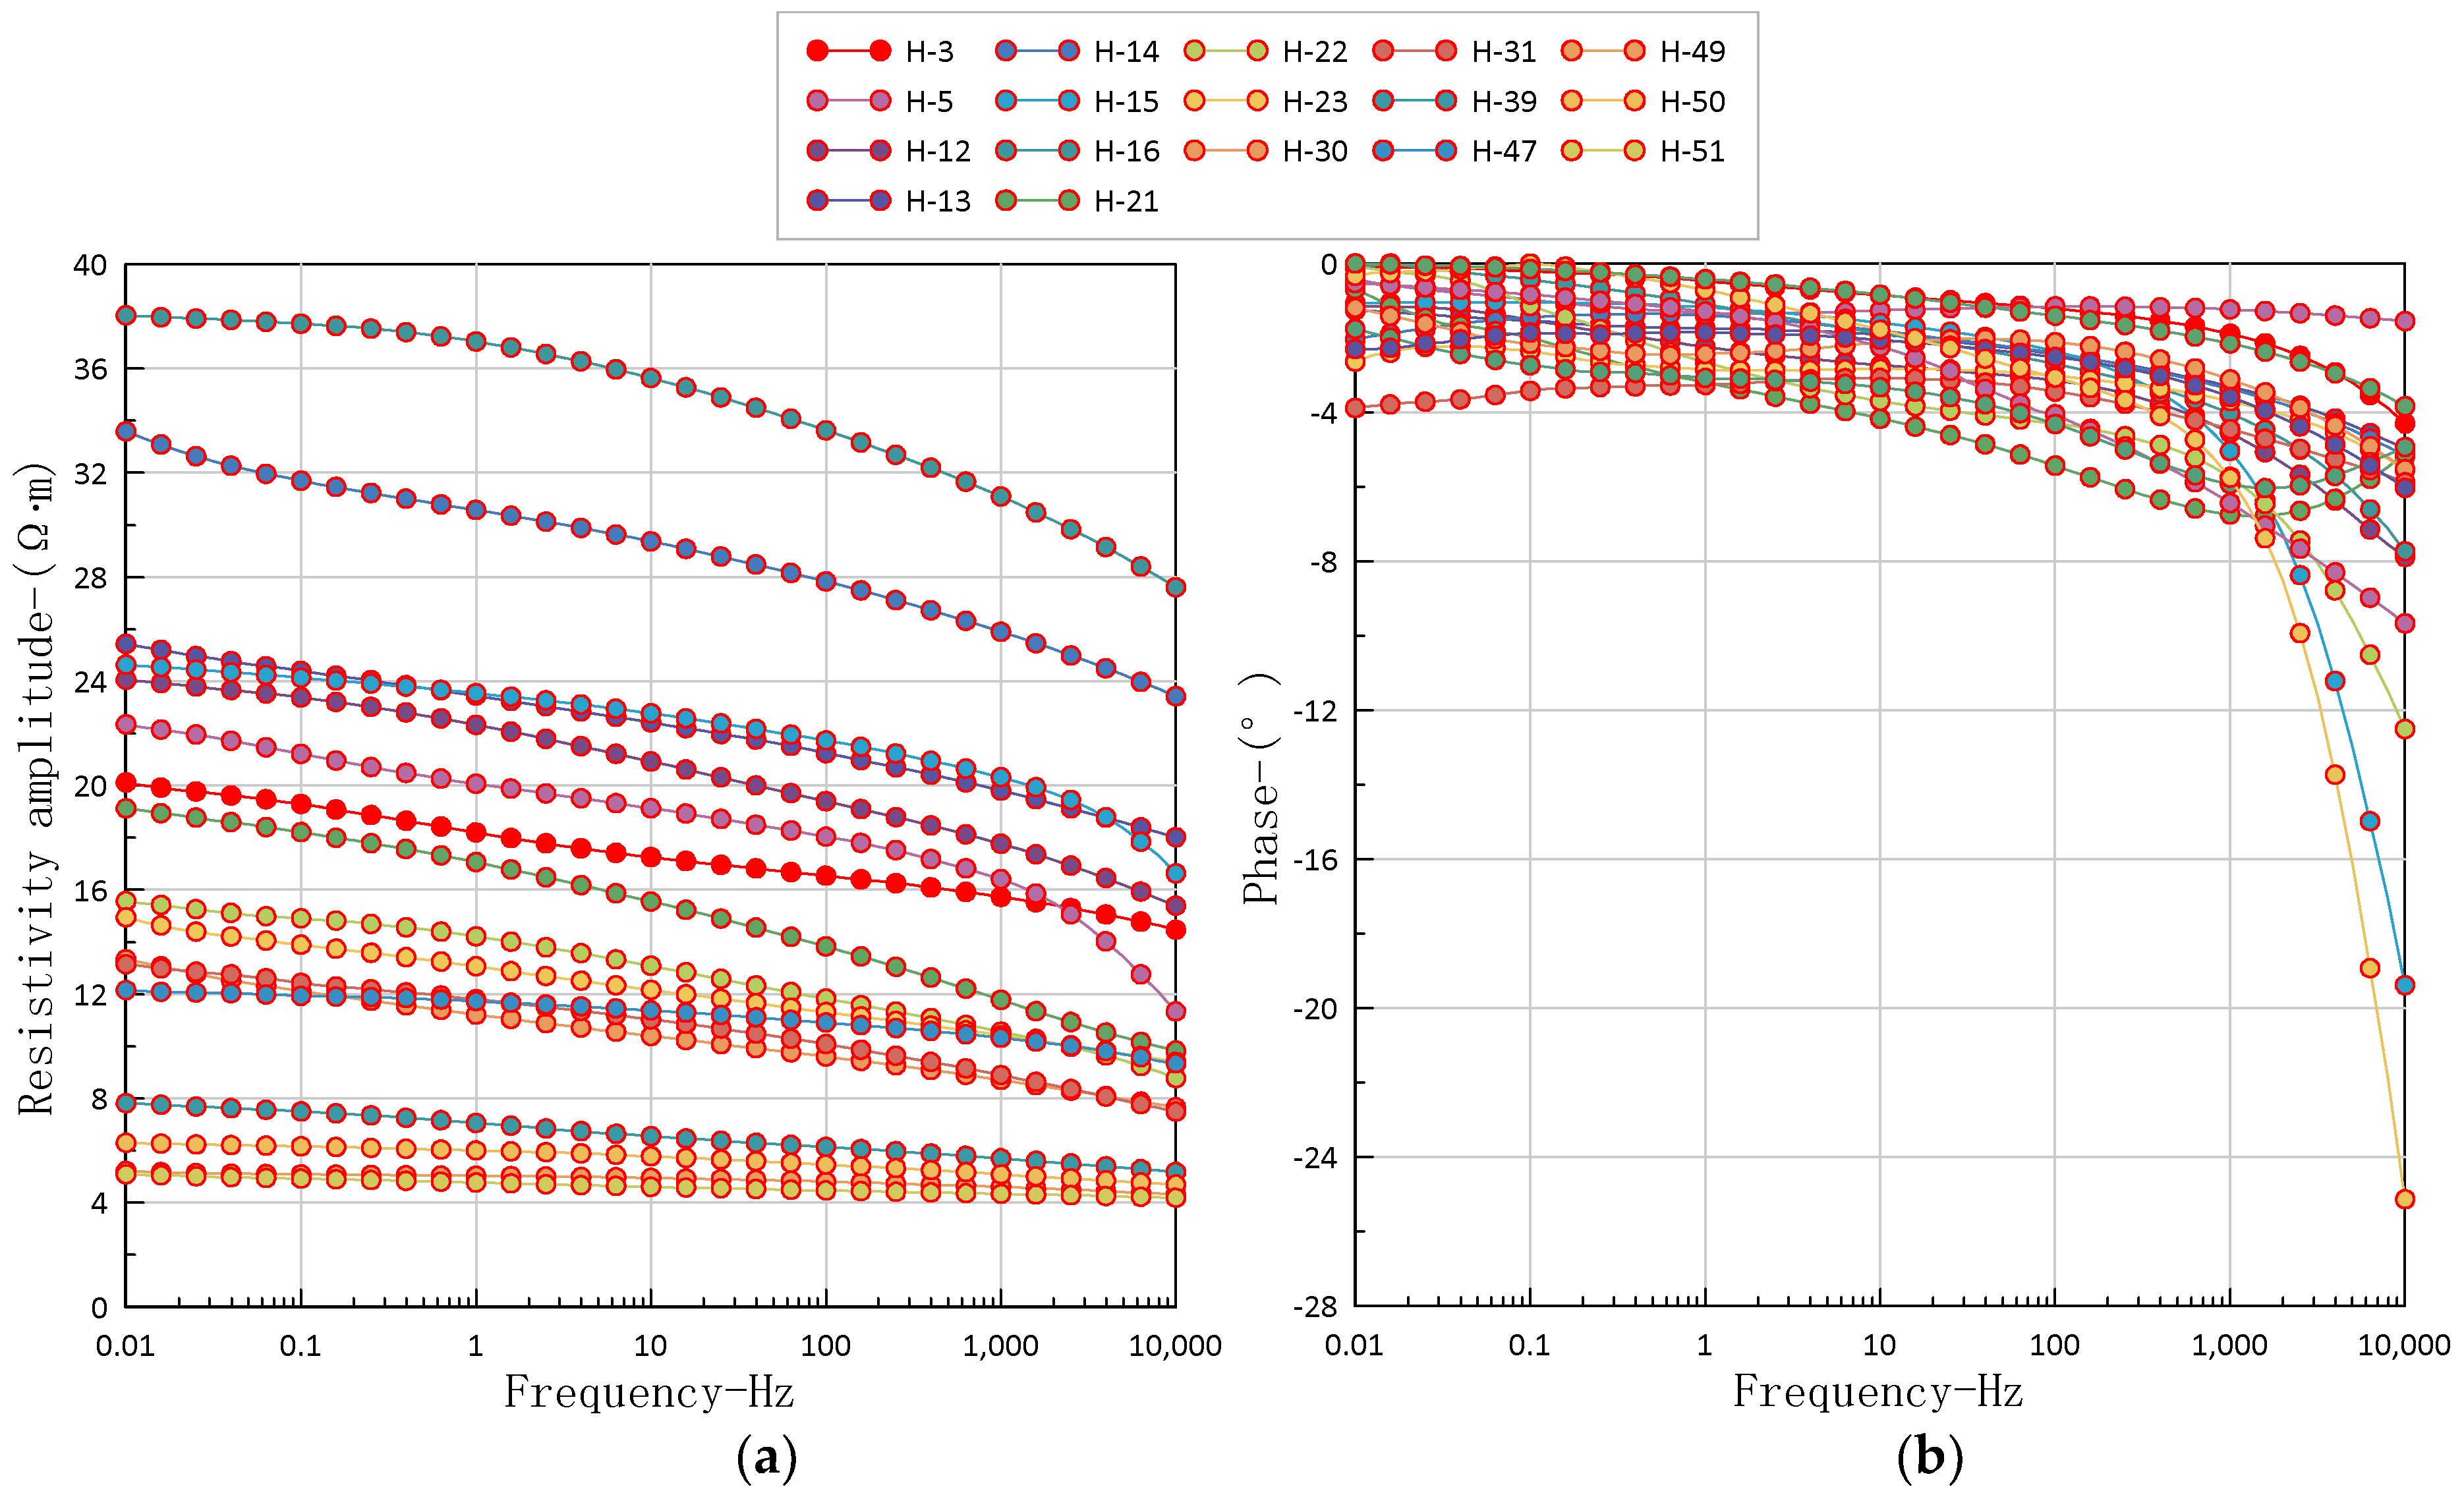
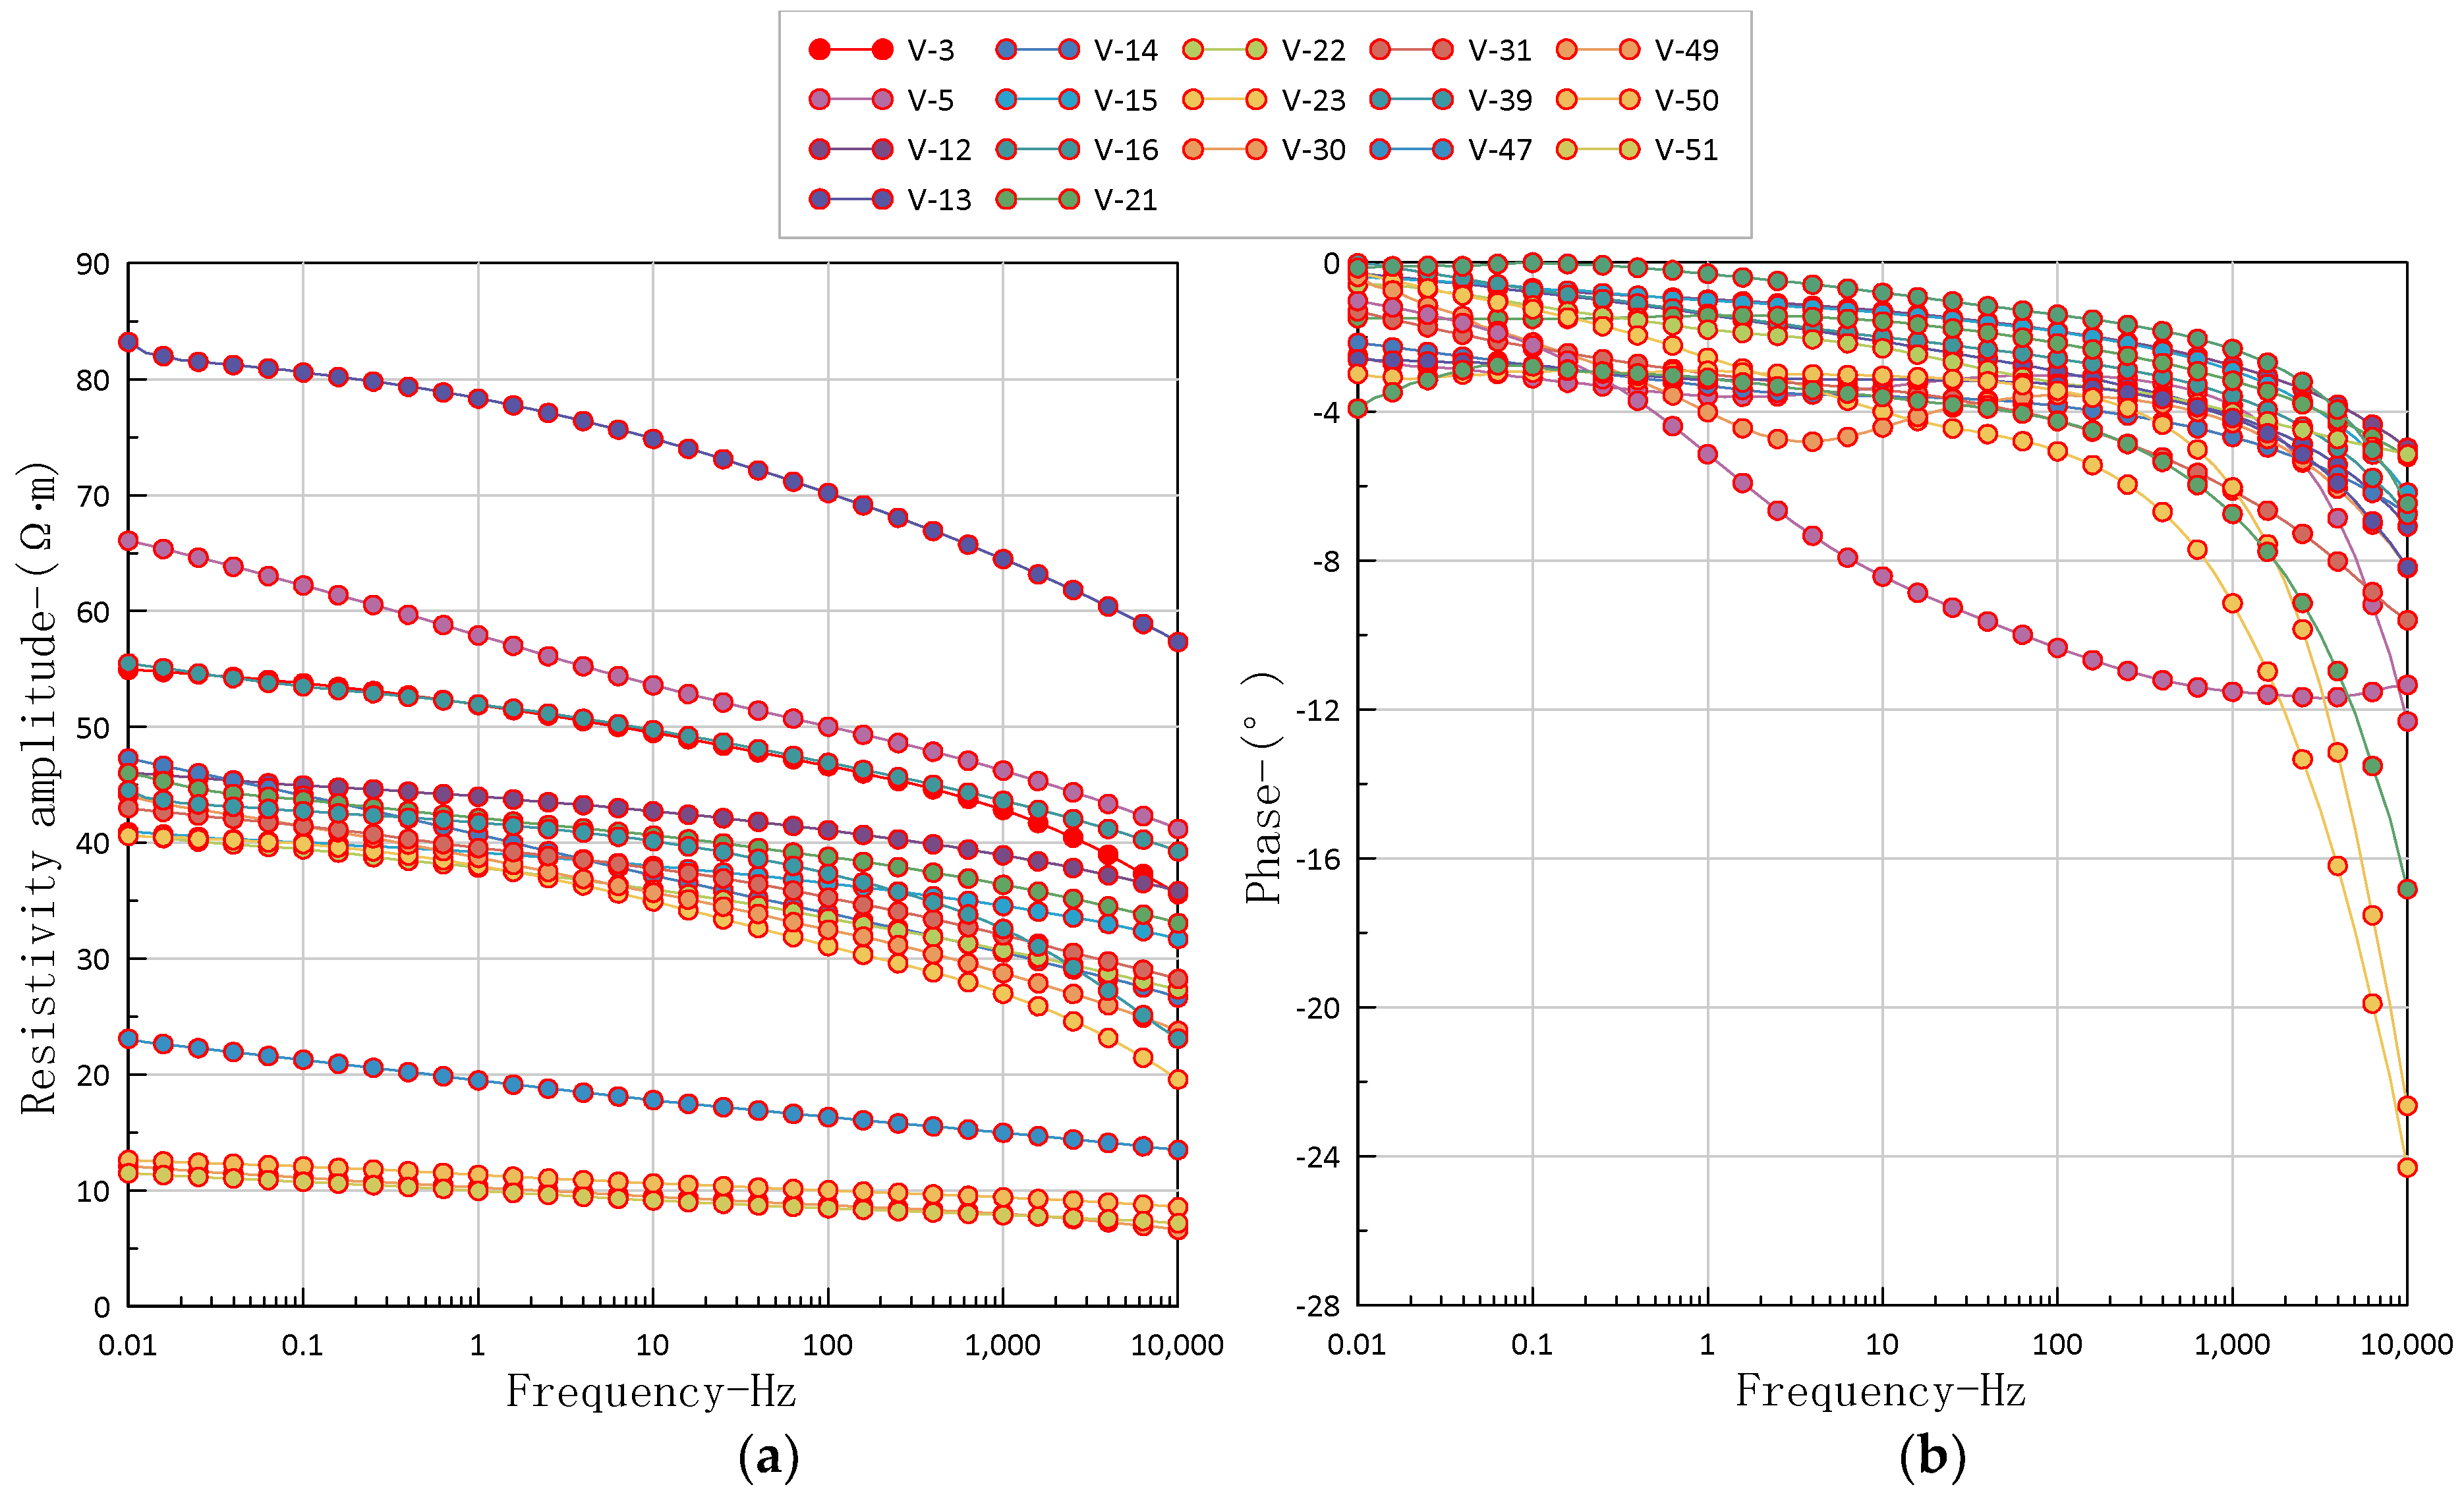
The complex resistivity of 34 shales was measured under the conditions of normal temperature and pressure, and then under high temperature and pressure. The amplitude and phase of resistivity are shown in
Figure 5,
Figure 6,
Figure 7 and
Figure 8.
The measurement results show that the amplitude of resistivity increases monotonically with the decrease of frequency, and the amplitude of phase changes complicatedly with the decrease of frequency. It can be seen that shale shows different degrees of induced polarization effect; especially with the increase in depth, the shale has high TOC and pyrite content in the gas-producing horizon, and its IP characteristics are more intense. On the whole, the resistivity amplitude of the rock samples in the H direction is smaller than that of the rock samples in the V direction. Of course, the shale resistivity will also be affected by factors such as fractures.
4.3. IP Parameter Inversion Result
According to the Cole-Cole model, the induced polarization parameters are extracted by inversion, and the results are shown in
Table 4 and
Table 5. Two induced polarization parameters, the zero-frequency resistivity and polarizability, are emphatically analyzed and studied. According to the inversion results, the resistivity in the vertical bedding direction (V direction) is larger than that in the bedding direction (H direction). In addition, the resistivity of shale under high temperature and pressure is lower than that under normal temperature and pressure, while the polarizability under high temperature and pressure is higher than that under normal temperature and pressure.
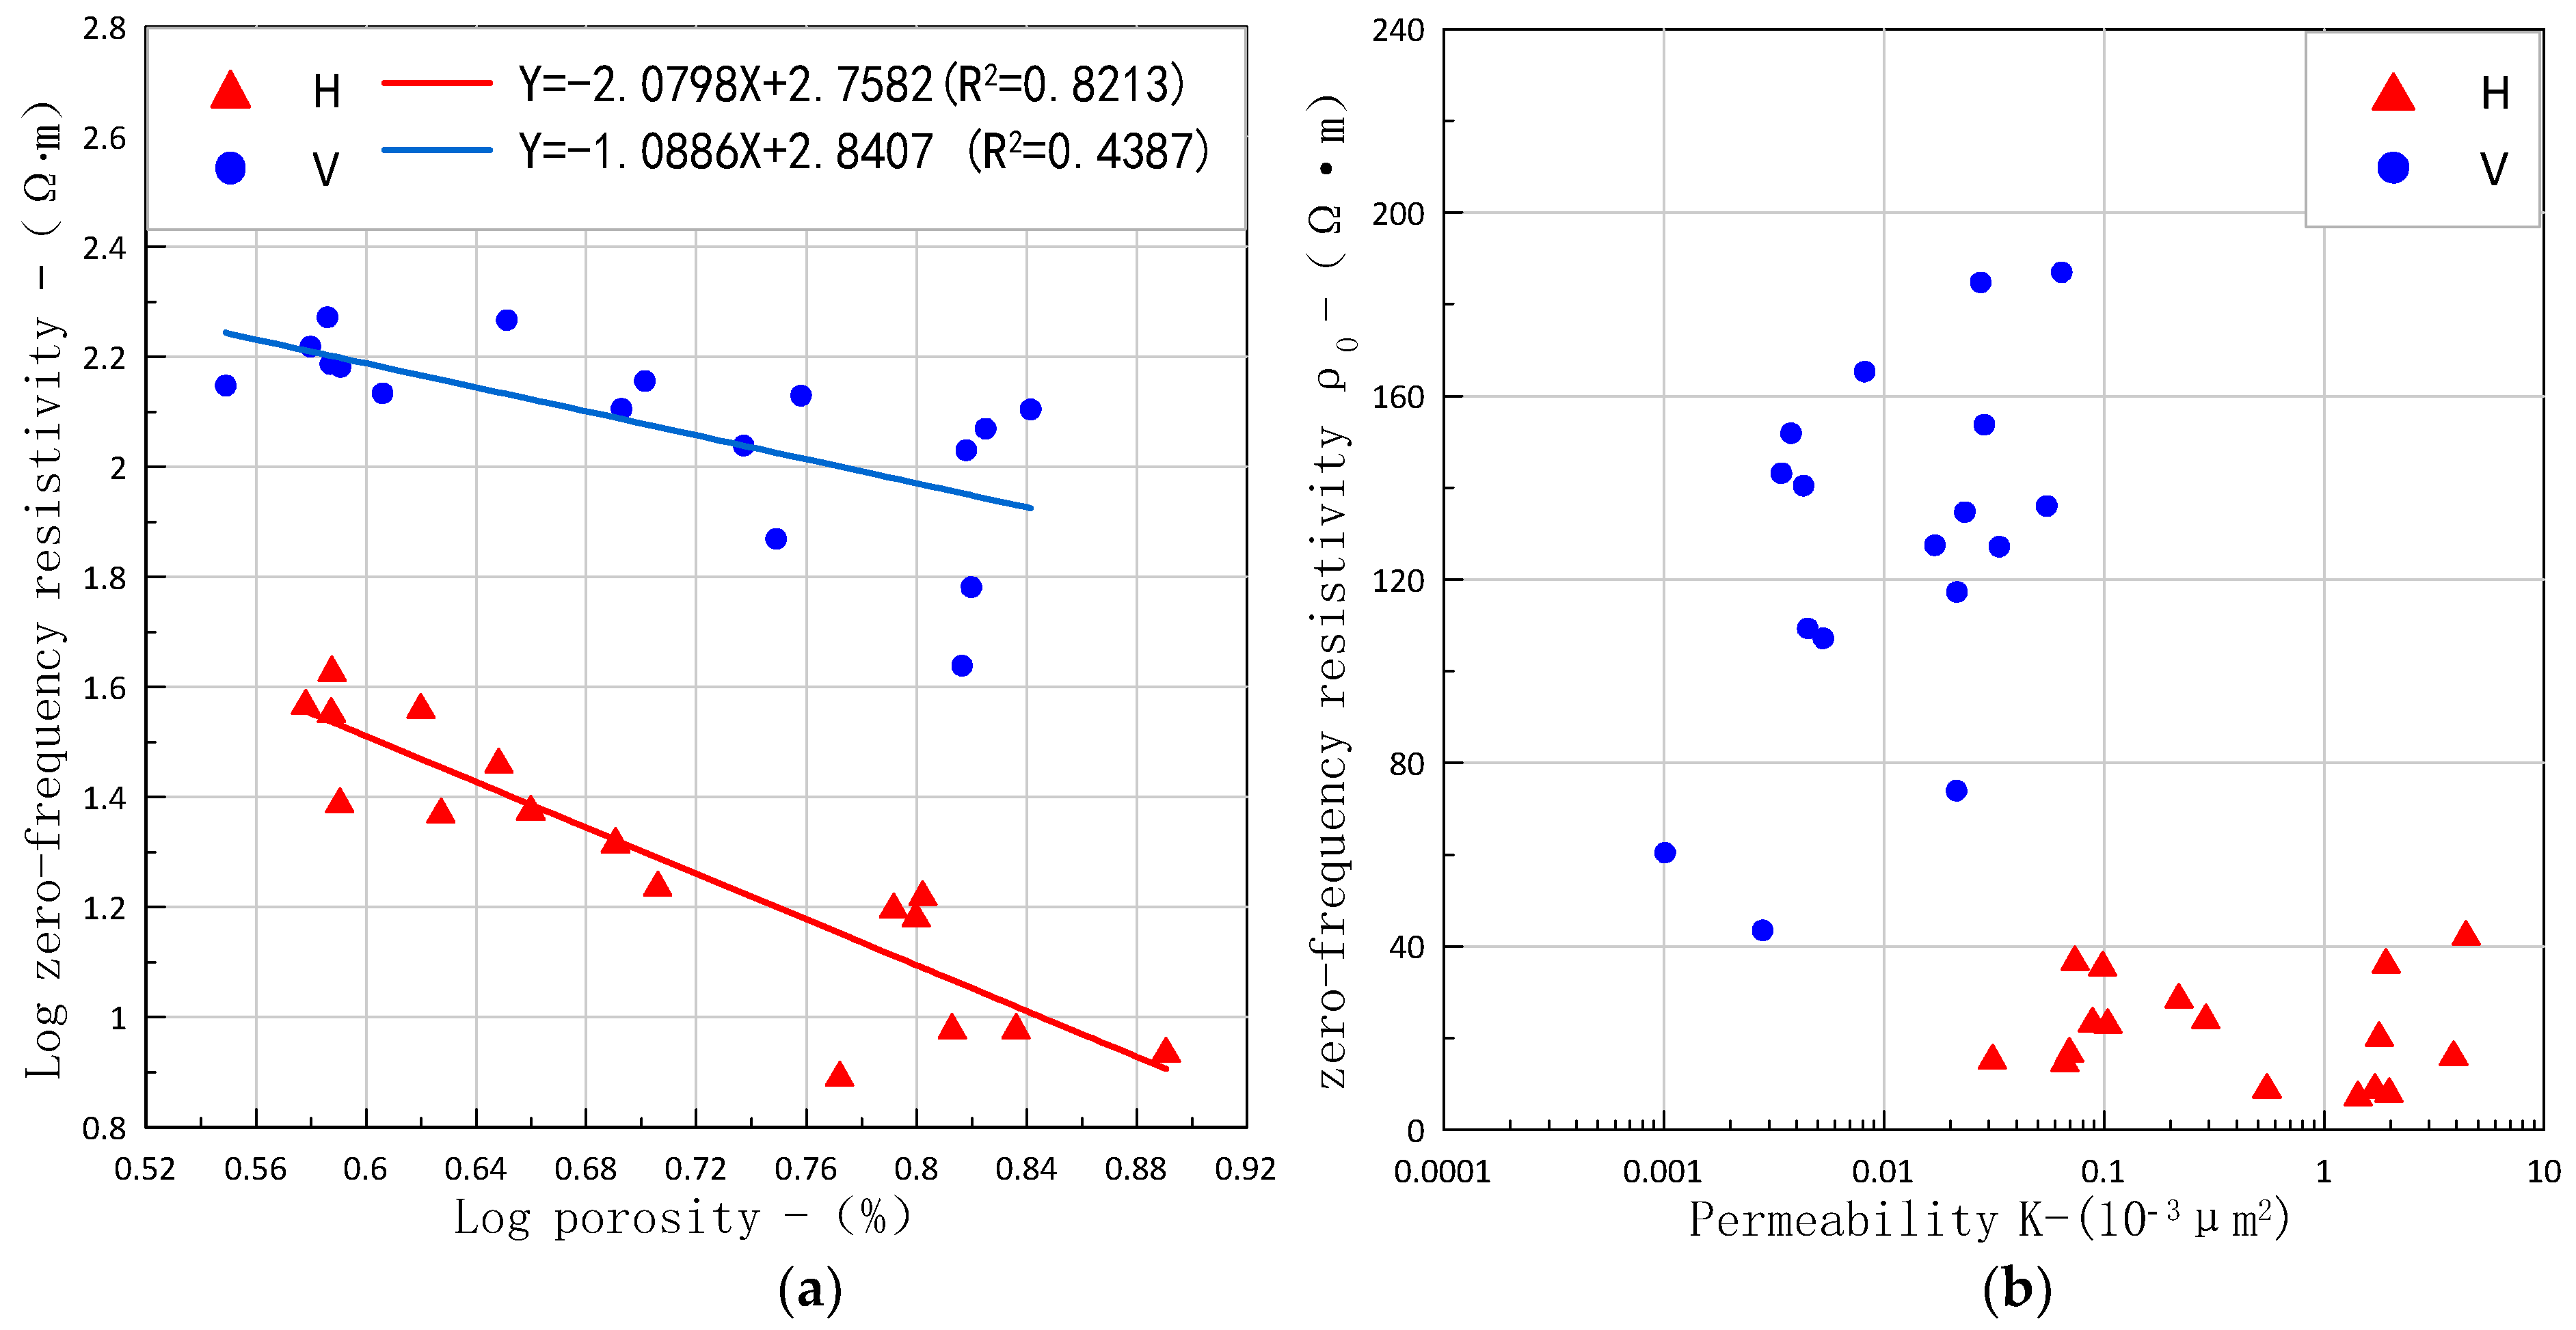
Figure 9 is the intersection diagram of zero-frequency resistivity, porosity and permeability at normal temperature and pressure. The resistivity decreases with the increase of porosity, but the shale porosity in H and V directions shows little difference. The horizontal permeability is higher than the vertical permeability, and the resistivity in the horizontal direction is lower than 40 Ω·m as a whole. In the zero-frequency resistivity and permeability diagram, the V direction data are in the upper left corner, with an average value of zero-frequency resistivity of 127.25 Ω·m and an average value of permeability of 0.019 × 10
−3 μm
2. H direction data are in the lower right corner, with an average zero-frequency resistivity of 22.21 Ω·m and an average permeability of 1.099 × 10
−3 μm
2. Generally, the average resistivity decreases with the increase in permeability. Therefore, the resistivity and permeability parameters of shale have strong directionality, which cannot be ignored in the process of reservoir evaluation.
4.4. Anisotropic Feature Analysis
4.4.1. Anisotropy Coefficient
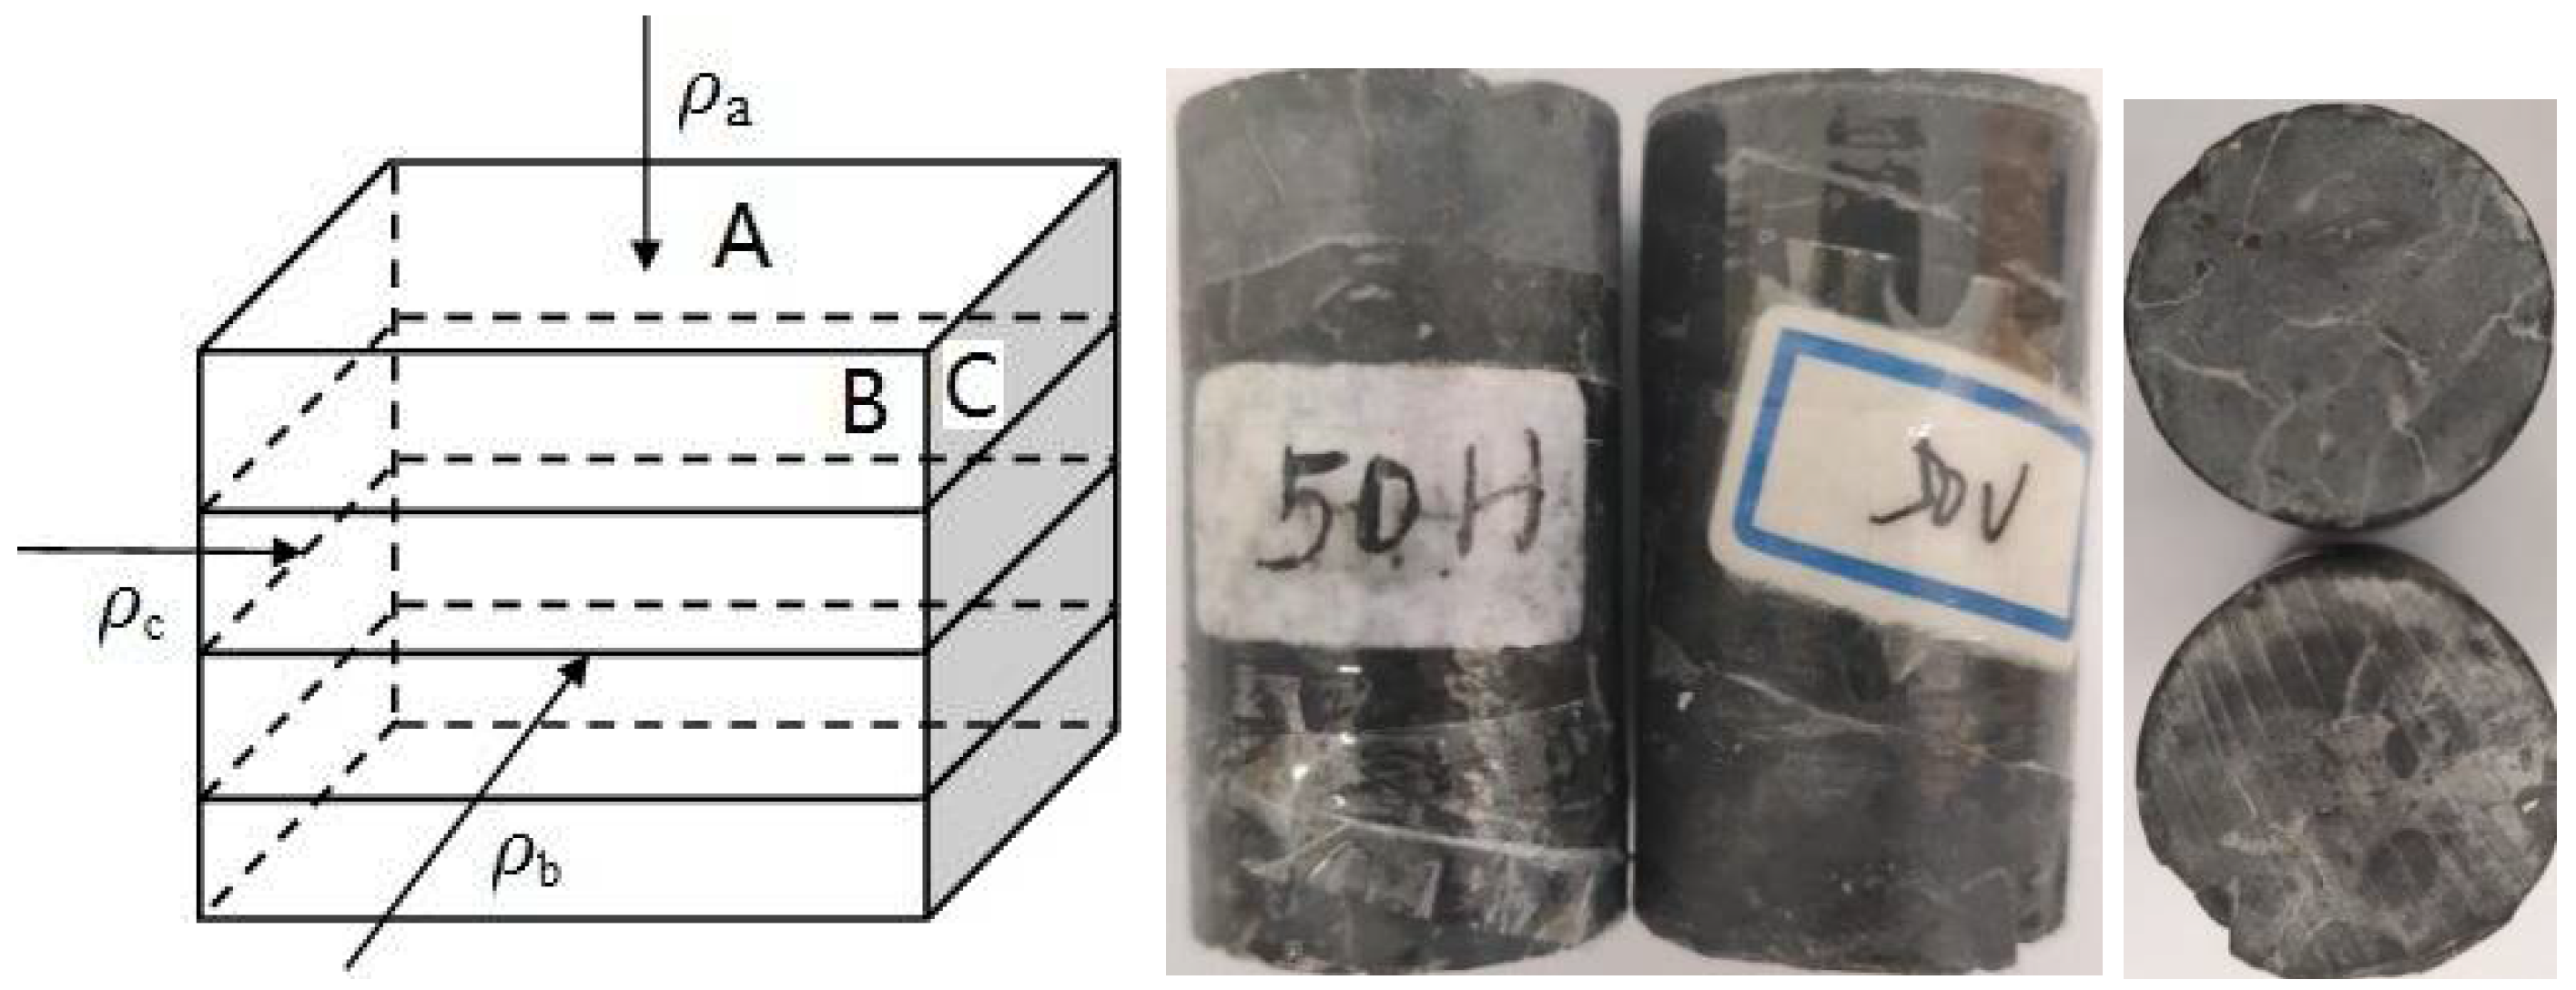
The heterogeneity and anisotropy of rock are common phenomena, and are also important components of petrophysical research at present. The resistivity measurement direction of the sample includes two directions, a vertical bedding direction (direction perpendicular to plane A) and a bedding direction (direction perpendicular to plane B and C); the schematic diagram of resistivity measurement directions in different directions and the real samples of coring rock samples are shown in
Figure 10. In the research process of this paper, the vertical bedding direction (ρ
a direction) and the bedding direction (ρ
b or ρ
c) are considered in the coring direction.
The electrical anisotropy of rock can be described by the anisotropy coefficient:
where ρ
n is the resistivity in the vertical direction and ρ
t is the resistivity in the horizontal direction. Therefore, according to the schematic diagram of
Figure 10, the anisotropy coefficient of shale can be defined as:
ρa—resistivity in vertical bedding direction, ρb, ρc—resistivity along bedding direction.
4.4.2. Analysis of Heterogeneity of Porosity and Permeability of Shale
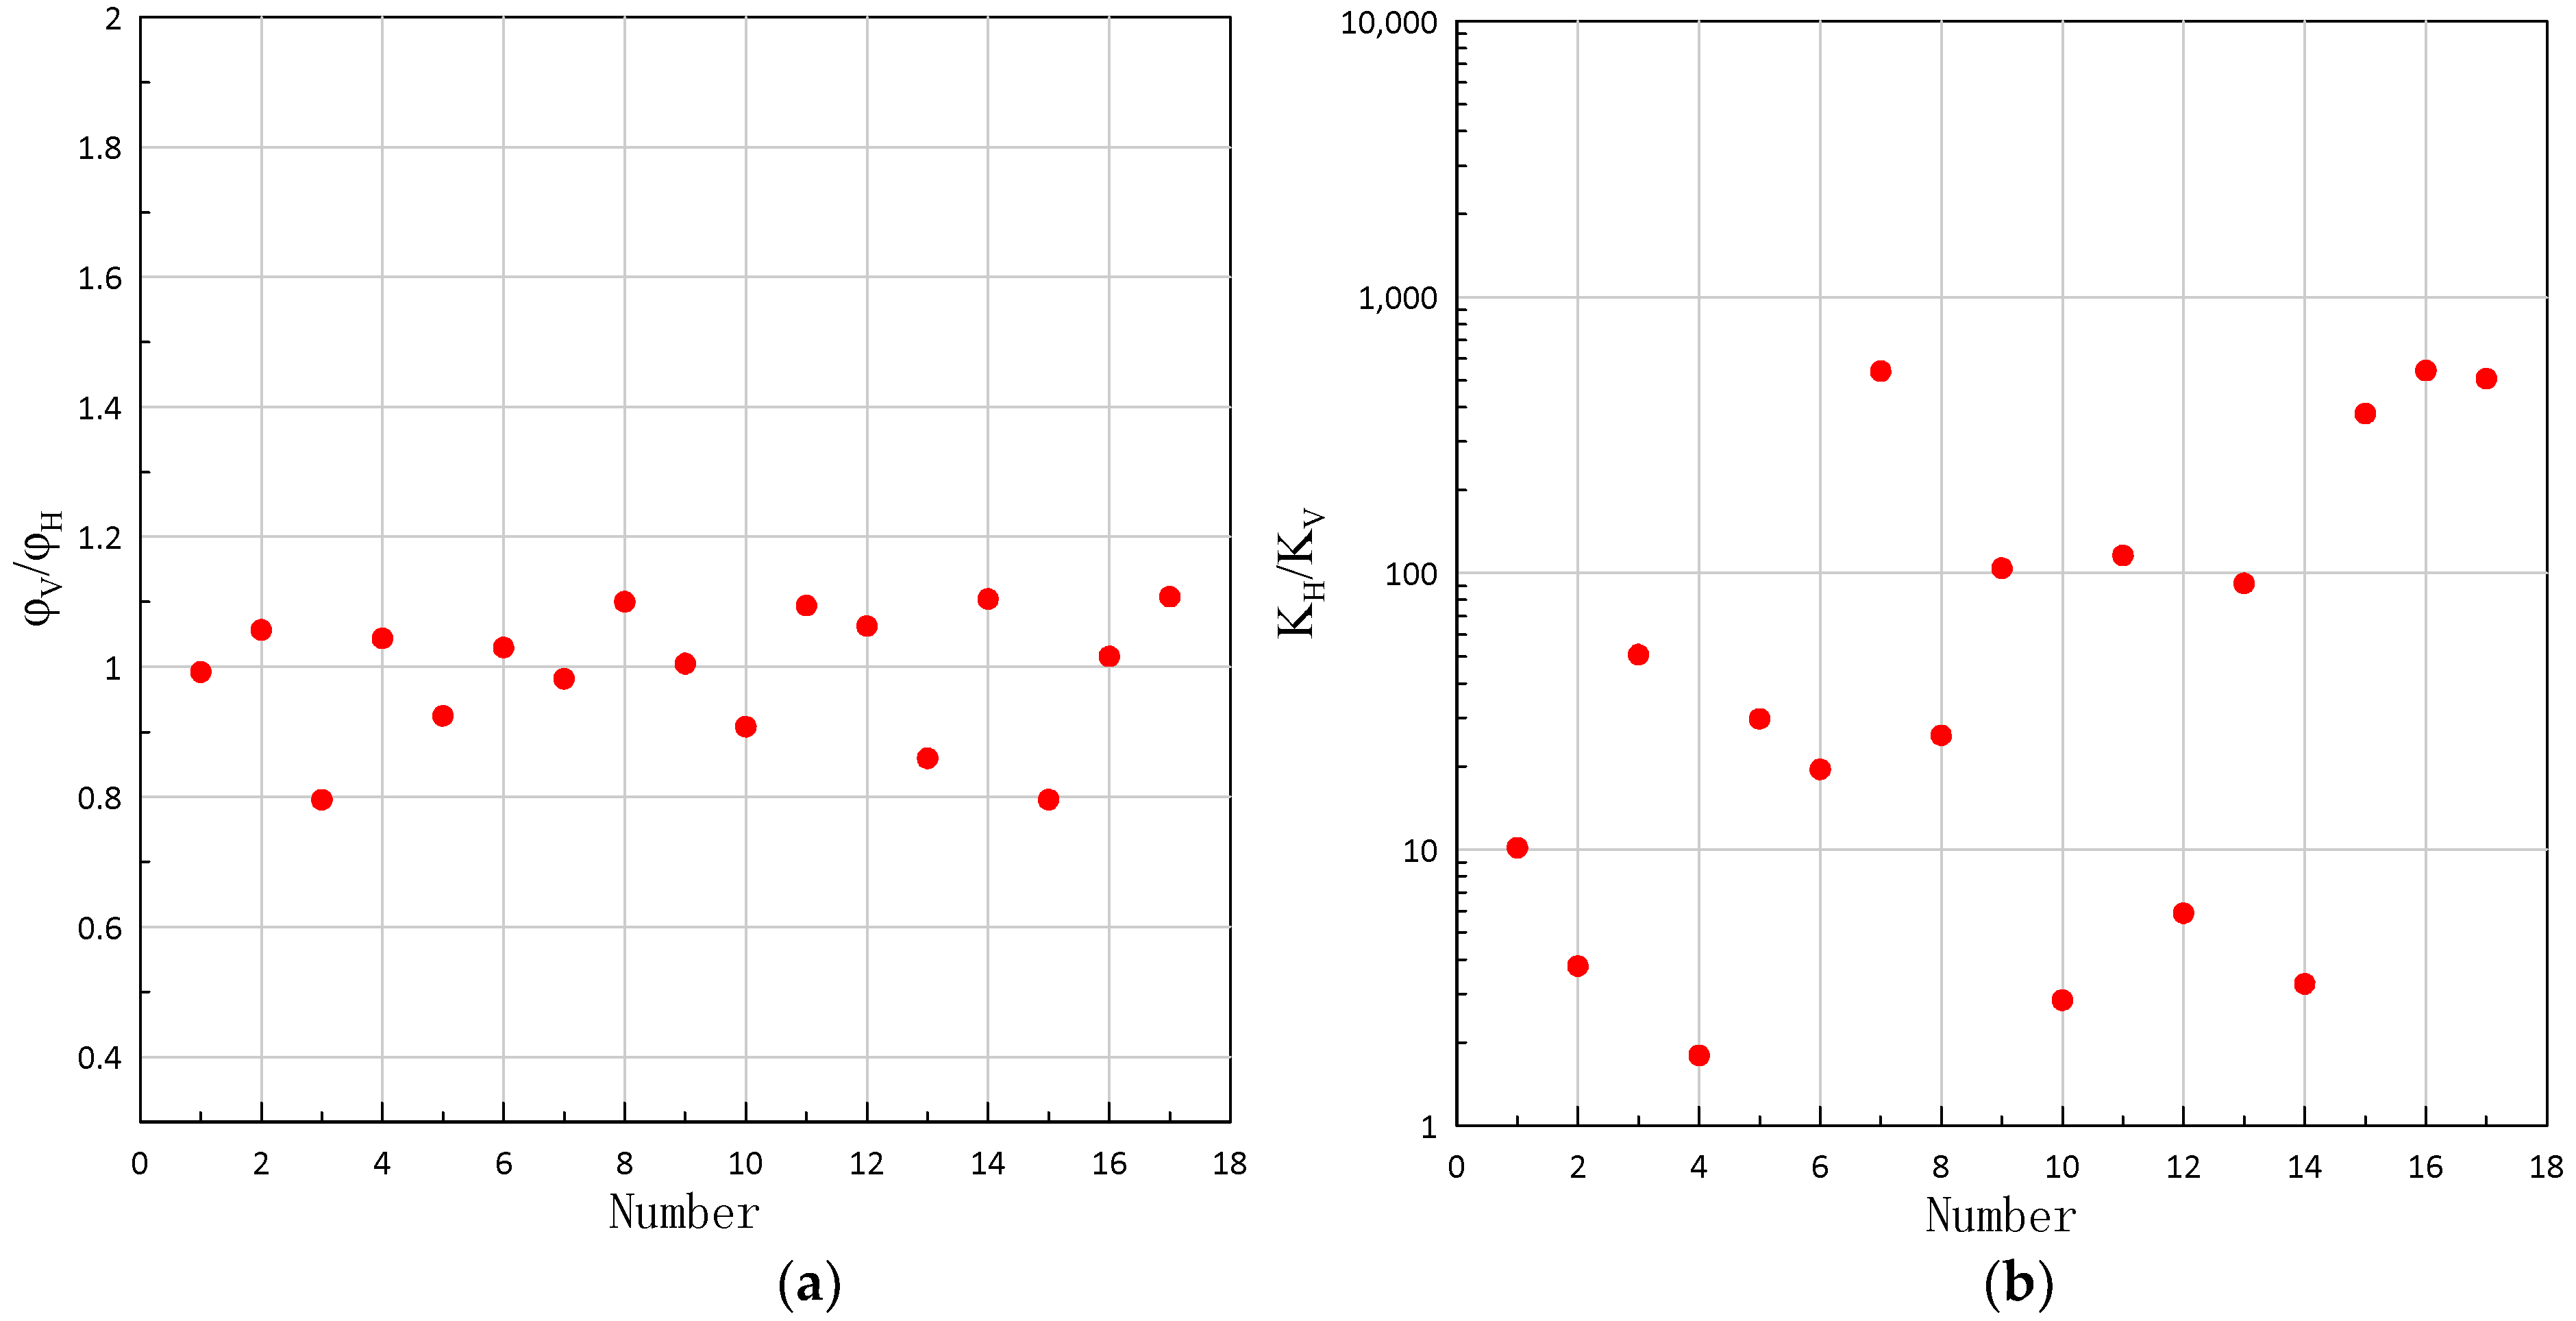
Porosity and permeability parameters are two important parameters for shale gas reservoir evaluation. The results in
Figure 11 show that the porosity in the V and H directions of reservoir shale is basically the same, and the average ratio of the two directions is 0.988, close to 1. However, the average ratio of the permeability along the bedding direction to the vertical bedding direction reaches 35, indicating that the permeability is directional.
4.4.3. Influence of Temperature and Pressure on Electrical Anisotropy Coefficient of Shale
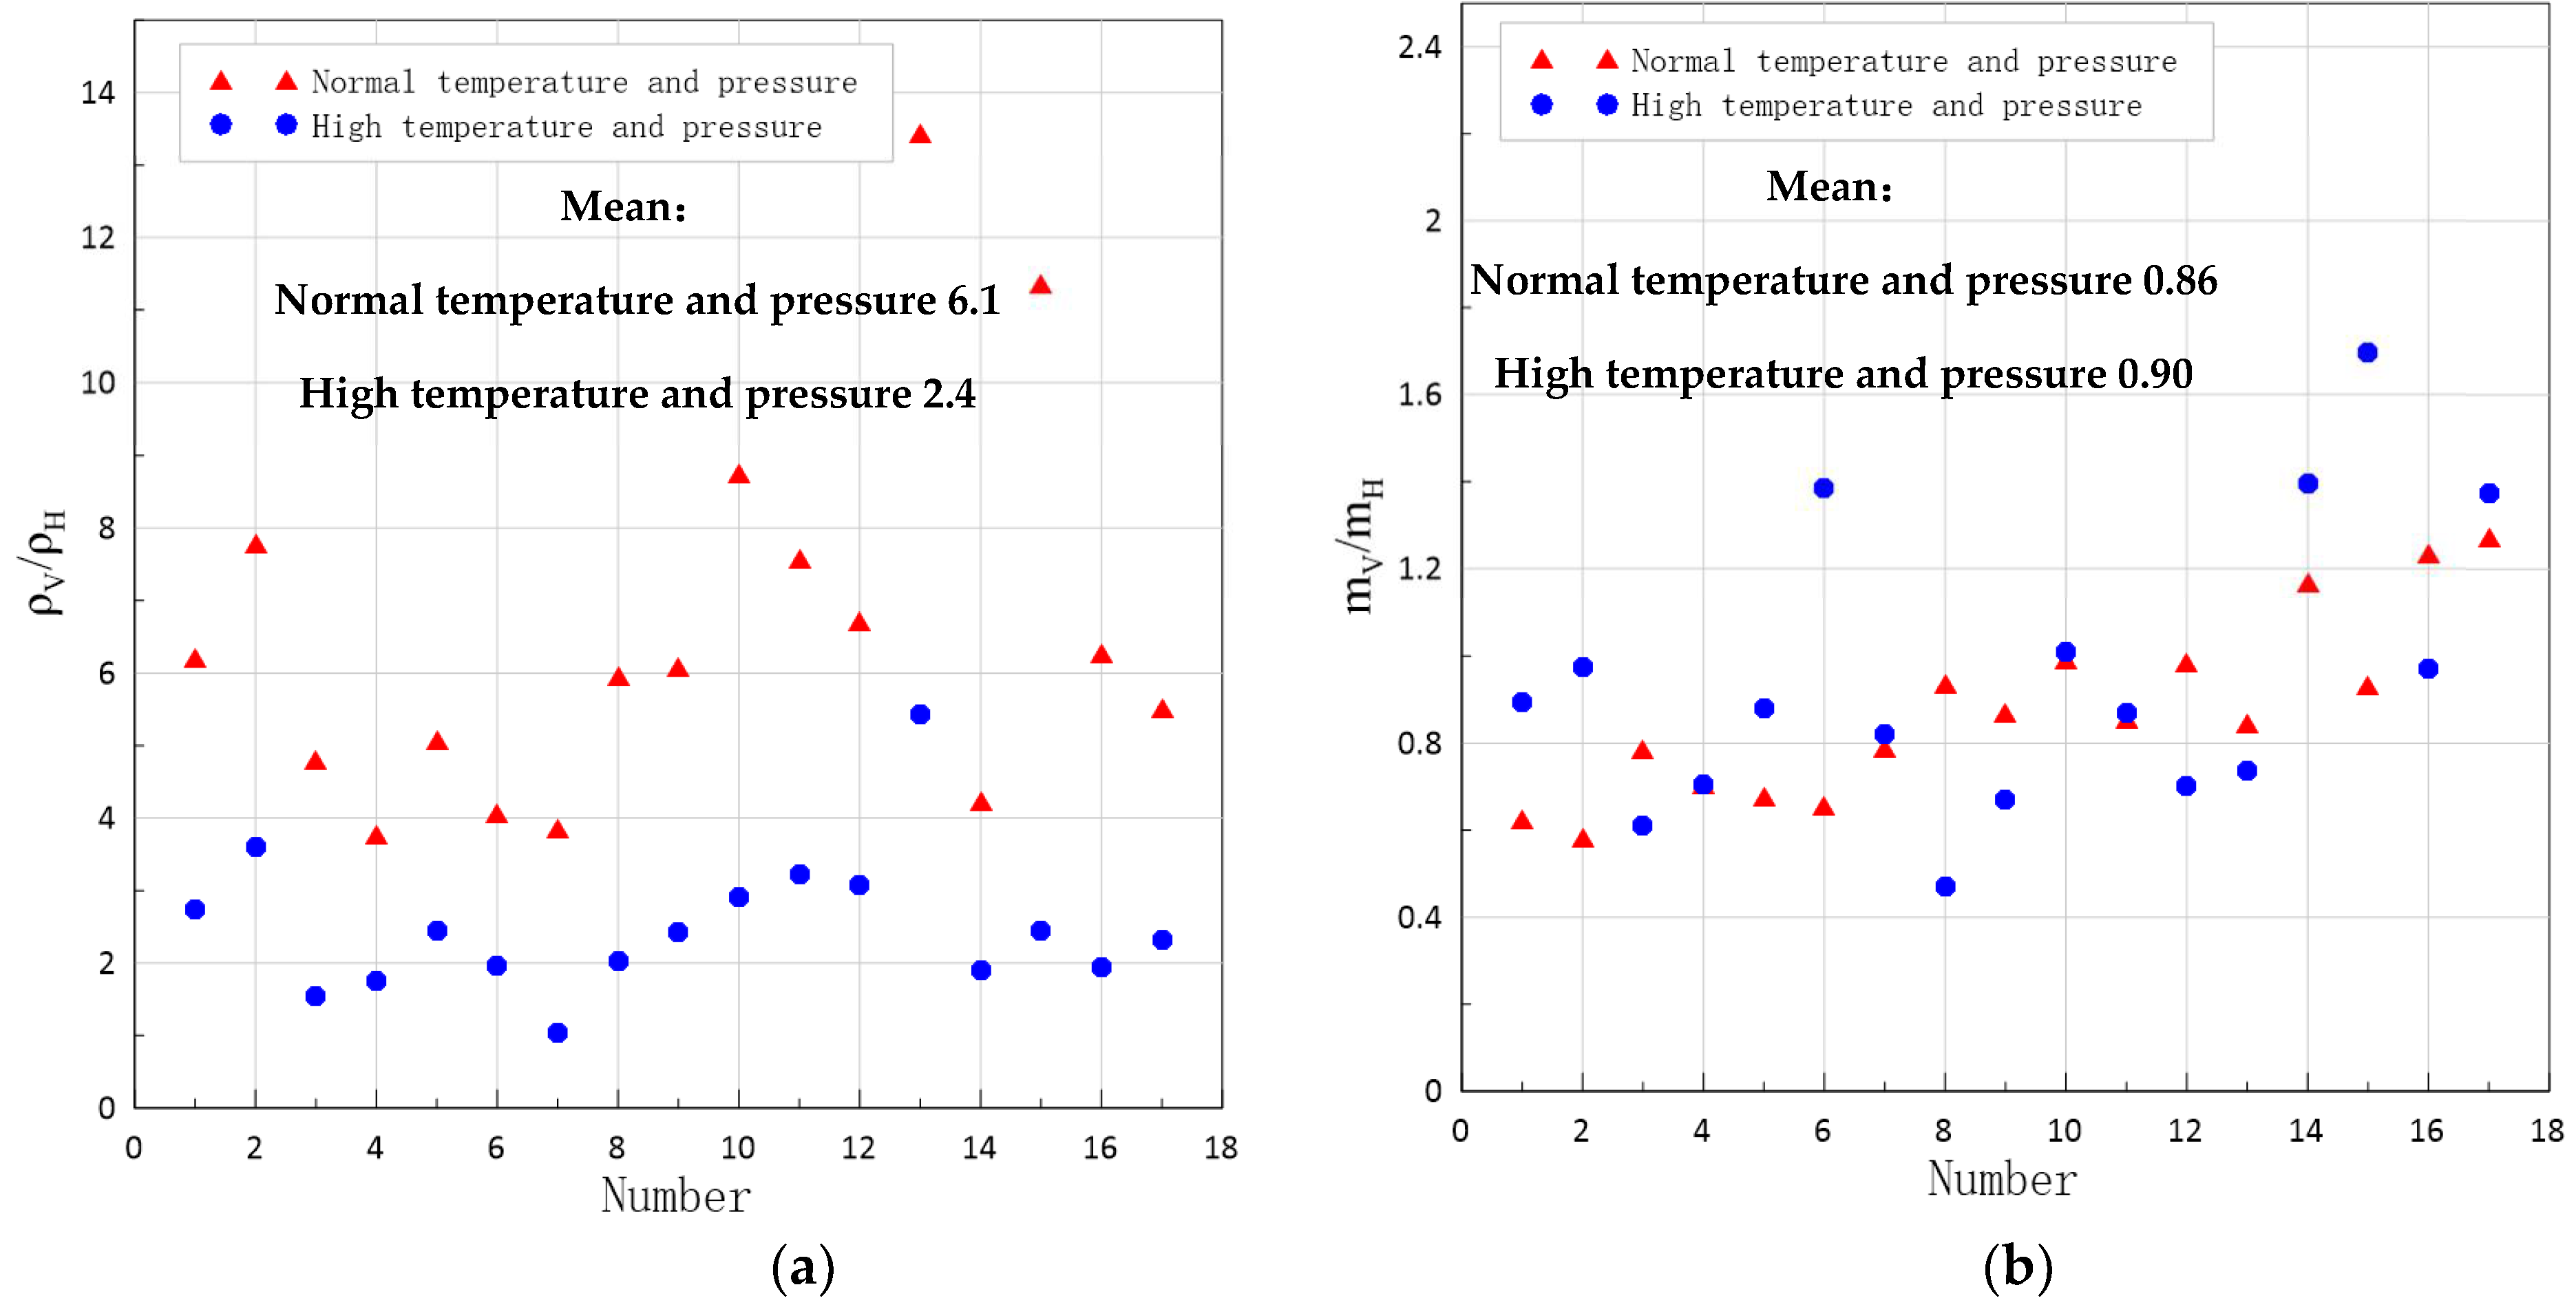
Under different temperature and pressure conditions, the distribution of complex resistivity anisotropy coefficients of shale is shown in
Figure 12, and the complex resistivity parameters of shale from Wufeng Formation to Longmaxi Formation in southern Sichuan show strong anisotropy. The average resistivity anisotropy coefficient is 6.1 at normal temperature and pressure and 2.4 at high temperature and pressure. Therefore, it shows that the pores or fractures of shale are closed under the conditions of high temperature and pressure, which weaken its resistivity anisotropy. The average anisotropy coefficient of shale polarizability is 0.86 at normal temperature and pressure and 0.90 at high temperature and pressure, which is slightly increased, but both are close to 1.0, indicating that the anisotropy of polarizability is relatively weak.
4.4.4. Influence of Electrical Anisotropy of Shale on Actual Exploration
The electrical anisotropy of underground media is objective and universal. In recent years, the phenomenon of anisotropy has been paid more and more attention, and it has many applications in prospecting, the petroleum industry and so on. For example, through the study of resistivity anisotropy, it can be linked with the development direction of underground faults and the dominant position of in situ stress accumulation in order to understand the underground situation. Shale gas reservoirs usually have good stratification and obvious anisotropy, so it is feasible to apply resistivity anisotropy to shale gas reservoir exploration.
With the emphasis of oil and gas exploration and development in China gradually shifting to unconventional and steep structures in front of the mountain, the evaluation of reservoir anisotropy is particularly important. Anisotropy refers to some physical parameters of rock, such as acoustic velocity, electrical conductivity, permeability, etc. Its numerical value is directional; that is, the results measured in different directions are different. The grain structure arrangement in the rock, external temperature and pressure are the main reasons for the anisotropy, and its structural scale can range from a few microns to tens of kilometers.
The resistivity anisotropy system of shale is mainly related to the layered structure of shale, with good connectivity of pores parallel to the layered structure and poor connectivity of pores perpendicular to the layered structure. Saturated shale takes pore fluid as the main conductive body, so the resistivity decreases with the pore size increasing. Because of the layered structure of shale, the distribution of fluid channels in rocks has obvious directionality and demonstrates obvious anisotropy of the pore structure. Pressure and temperature also have influence on the resistivity of the sample, compressing and closing pores, thus increasing rock resistivity. Temperature rise will reduce the resistivity of fluid, thus reducing the resistivity of rock. There is a noticeable difference between the geoelectric field generated by the anisotropic medium and the geoelectric field generated by the isotropic medium, which leads to a great deviation in the interpretation of the observed data and even makes it difficult to explain them. Therefore, electrical anisotropy is one of the physical properties that must be considered in geological structure and natural energy exploration, and it is also one of the factors that affect the detection results. It is of great significance to find out the internal situation of underground structures and solve some puzzles in field exploration.
5. Conclusions and Cognition
The shale resistivity of the Nanwufeng Formation and Longmaxi Formation is obviously anisotropic.
Through testing and analyzing the complex resistivity, porosity and permeability of shale in the Wufeng Formation and Longmaxi Formation in southern Sichuan in two orthogonal directions (vertical bedding V and along bedding H), the following conclusions and understandings are obtained:
(1) In the middle and low measurement frequency band, the cores in shale gas wells show different degrees of induced polarization characteristics. The amplitude and phase curve of shale complex resistivity in two directions are basically the same, but the amplitude of complex resistivity is obviously anisotropic, and the amplitude of complex resistivity in V direction is significantly larger than that in H direction.
(2) There is a small difference between the porosity in H direction and V direction of shale, but the permeability in H direction is much larger than that in V direction, which indicates that the permeability parameters have obvious directionality and show strong anisotropy, which is different from the porosity.
(3) The resistivity parameters of shale show strong anisotropy. The average resistivity anisotropy coefficient is 6.1 under normal temperature and pressure and 2.4 under high temperature and pressure, while the average polarization anisotropy coefficient is 0.86 under normal temperature and pressure and 0.90 under high temperature and pressure, indicating that the resistivity has strong anisotropy and the polarization is relatively weak. In addition, the pores and fractures of shale contract under conditions of high formation pressure, which leads to the weakening of conductivity in H direction, the decrease in the resistivity anisotropy coefficient and the slight increase in the polarization anisotropy coefficient. Therefore, in the process of shale gas reservoir exploitation, the influence of reservoir pressure sensitivity and anisotropy on productivity cannot be ignored.
(4) The horizontal layered structure of shale reservoir leads to the strong heterogeneity and anisotropy of shale, and the fracture system has the characteristics of strong pressure sensitivity and anisotropy, which make the process of shale gas development and reservoir reconstruction extremely complicated. Therefore, the study of shale gas reservoir permeability anisotropy and shale electrical anisotropy has important guiding significance for improving the exploration and development effect of shale gas reservoirs.
Based on the shale complex resistivity experiment, this study has formed a set of testing methods and analysis techniques for electrical anisotropy of shale reservoirs. Combined with the analysis of two important reservoir parameters, porosity and permeability, it is found that shale resistivity and permeability parameters have strong anisotropy, which should be paid attention to in the process of reservoir evaluation. At the same time, the research results are helpful to understand the anisotropic characteristics of complex resistivity of shale gas reservoirs in southern Sichuan, and lay a foundation for shale gas reservoir evaluation and fracturing monitoring by electrical exploration.
Author Contributions
Conceptualization, K.X. and L.Y.; methodology, K.X.; validation, L.Y., G.T. and Y.L.; investigation, K.X.; resources, G.Y.; writing—original draft preparation, K.X.; writing—review and editing, L.Y. All authors have read and agreed to the published version of the manuscript.
Funding
This research was funded by the National Natural Science Foundation of China (Grant No. 42174083, 42030805 and 41874119).
Acknowledgments
We thank the department of geophysical and geochemical prospecting, BGP, CNPC, for supplying rock samples.
Conflicts of Interest
The authors declare that there are no conflict of interest.
References
- Curtis, J.B.; Montgomery, S.L. Recoverable natural gas resource of the united states: Summary of recent estimates. AAPG Bull. 2002, 86, 1671–1678. [Google Scholar] [CrossRef]
- Loucks, R.G.; Ruppel, S.C. Mississippian Barnett Shale: Lithofacies and depositional setting of a deep-water shale-gas succession in the Fort Worth Basin, Texas. AAPG Bull. 2007, 91, 579–601. [Google Scholar] [CrossRef]
- Zou, C.; Zhao, Q.; Cong, L.; Wang, H.; Shi, Z.; Wu, J.; Pan, S. Development progress, potential and prospect of shale gas in China. Nat. Gas Ind. 2021, 41, 1–14. [Google Scholar] [CrossRef]
- Zhang, J.; Nie, H.; Xu, B.; Jiang, S.; Zhang, P.; Wang, Z. Geological condition of shale gas accumulation in Sichuan basin. Nat. Gas Ind. 2008, 28, 151–156. [Google Scholar]
- Li, G.; Yuan, B.; Zhu, H.; Yang, G.; Dai, X. Genesis of super-rich gas in the Sichuan Basin. Nat. Gas Ind. 2022, 42, 1–10. [Google Scholar] [CrossRef]
- Zhao, W.; Li, J.; Yang, T.; Wang, S.; Huang, J. Geological difference and its significance of marine shale gases in South China. Pet. Explor. Dev. 2016, 43, 499–510. [Google Scholar] [CrossRef]
- Potter, C.J. Paleozoic shale gas resources in the Sichuan Basin, China. AAPG Bull. 2018, 102, 987–1009. [Google Scholar] [CrossRef]
- Ma, X. Enrichment laws and scale effective development of shale gas in the southern Sichuan Basin. Nat. Gas Ind. 2018, 38, 1–10. [Google Scholar] [CrossRef]
- Liu, S.; Deng, B.; Sun, W.; Song, J.; Jiao, K.; Ye, Y.; Xie, G. May Sichuan Basin be a Super Petroliferous Basin? J. Xihua Univ. (Nat. Sci. Ed.) 2020, 39, 20–35. [Google Scholar] [CrossRef]
- Zhang, J.; Tao, J.; Li, Z.; Wang, X.; Li, X.; Jiang, S.; Wang, D.; Zhao, X. Prospect of deep shale gas resources in China. Nat. Gas Ind. 2021, 41, 15–28. [Google Scholar] [CrossRef]
- Nie, H.; Li, P.; Dang, W.; Ding, J.; Sun, C.; Liu, M.; Wang, J.; Du, W.; Zhang, P.; Li, D.; et al. Enrichment characteristics and exploration directions of deep shale gas of Ordovician-Silurian in the Sichuan Basin and its surrounding areas, China. Pet. Explor. Dev. 2022, 49, 648–659. [Google Scholar] [CrossRef]
- Liu, L.; Zhang, M.; Wang, P.; Zhang, S.; Qiao, J.; Yu, H.; Huang, J. Construction of geophysical-geological structural models for complex basins: Application of interpretation of gravity, magnetic, electric and seismic data to exploration in the Chuxiong basin. Chin. J. Geophys. 2018, 61, 4921–4933. [Google Scholar] [CrossRef]
- Zhang, C.; Liu, X.; He, L.; He, W.; Zhou, Y.; Zhu, Y.; Cui, Z.; Kuang, X. A study of exploration organic rich shales using Time-Frequency Electromagnetic Method (TFEM). Chin. J. Geophys. 2013, 56, 3173–3183. [Google Scholar] [CrossRef]
- Zhang, C.; Liu, X.; Zhou, H.; He, L.; He, W.; Zhou, Y.; Zhu, Y. A step forward study for the exploration of organic-rich shale by using time-frequency electromagnetic method (TFEM). Geophys. Prospect. Pet. 2015, 54, 627–634. [Google Scholar] [CrossRef]
- Zhou, Y.; Liu, X.; Zhang, C.; Zhu, Y. The TEEM technology for quick identification of ‘sweet spot’ of shale gas and its applications. Geophys. Geochem. Explor. 2015, 39, 60–63. [Google Scholar] [CrossRef]
- Ma, Y.; Zhang, C.; Tian, Y.; Ma, Y. Research on identification of organic-rich shales using seismic constrained time-frequency electromagnetic method. Prog. Geophys. 2016, 31, 2618–2626. [Google Scholar] [CrossRef]
- Meng, F.; Bao, S.; Chen, K.; Wang, P.; Li, L. The prediction of shale gas favorable area based on wide area electromagnetic method: A case study of Wushan area in northeast Chongqing. Geophys. Geochem. Explor. 2018, 42, 68–74. [Google Scholar] [CrossRef]
- Yan, L.; Chen, X.; Tang, H.; Xie, X.; Zhou, L.; Hu, W.; Wang, Z. Continuous TDEM for monitoring shale hydraulic fracturing. Appl. Geophys. 2018, 15, 26–34. [Google Scholar] [CrossRef]
- Xiang, K.; Hu, W.; Yan, L.; Zhang, H.; He, W.; Tang, X.; Liu, X. Complex resistivity dispersion characteristics of shale samples in Sichuan and Guizhou area. Oil Geophys. Prospect. 2014, 49, 1013–1019. [Google Scholar] [CrossRef]
- Yan, L.; Xiang, K.; Li, P.; Wang, Z. Study on the induced polarization model in the exploration for shale gas in southern China. SEG Tech. Program Expand. Abstr. 2014, 912–916. [Google Scholar] [CrossRef]
- Zhao, W. Reservoir of Electricity of Silurian Longmaxi Shale in South Sichuan Area. Master’s Thesis, Chengdu University of Technology, Chengdu, China, 2015. [Google Scholar]
- Huang, T.; Yu, G.; Wang, X.; Zhang, B.; He, Z.; Chen, J.; Zhu, H. Experiment research of the main influence factors of shale sample complex resistivity dispersion characteristics. Comput. Tech. Geophys. Geochem. Explor. 2016, 38, 167–174. [Google Scholar] [CrossRef]
- Sun, B.; Tang, X.; Xiang, K.; Dou, C. The Analysis and Measure on Complex Resistivity Parameters of Shaly Sands in High Temperature and High Pressuree. J. Eng. Geophys. 2016, 13, 277–284. [Google Scholar] [CrossRef]
- Wang, X.; Zhang, B.; He, Z.; He, L.; Yang, K.; Huang, T.; Luo, F.; Tang, J.; Gan, L. Electrical properties of Longmaxi organic-rich shale and its potential applications to shale gas exploration and exploitation. J. Nat. Gas Sci. Eng. 2016, 36, 573–585. [Google Scholar] [CrossRef]
- Xiang, K.; Yan, L.; Hu, H.; Hu, W.; Tang, X.; Liu, X. Relationship analysis between brittle index and electrical properties of marine shale in South China. Geophys. Prospect. Pet. 2016, 55, 894–903. [Google Scholar] [CrossRef]
- Liu, Z.; Sa, L.; Yang, X.; Li, X. The demand of shale gas exploration and development for geophysical technology. Oil Geophys. Prospect. 2011, 46, 810–819. [Google Scholar] [CrossRef]
- Wang, Y.; Yang, D.; Yin, C.; Gao, Y. Anisotropic geophysics and vector field. Chin. Sci. Bull. 2017, 62, 2594–2605. [Google Scholar] [CrossRef]
- Liu, Y.; Yin, C.; Cai, J.; Huang, W.; Ben, F.; Zhang, B.; Qi, Y.; Qiu, C.; Ren, X.; Huan, X.; et al. Review on research of electrical anisotropy in electromagnetic prospecting. Chin. J. Geophys. 2018, 61, 3468–3487. [Google Scholar] [CrossRef]
- Revil, A.; Woodruff, W.F.; Torres-Verdín, C.; Prasad, M. Complex conductivity tensor of anisotropic hydrocarbon-bearing shales and mudrocks. Geophysics 2013, 78, D403–D418. [Google Scholar] [CrossRef]
- Cheng, L.; Wang, Y.; Zhang, C. Anisotropy of complex resistivity of the shale in eastern Guizhou province and its correlations to reservoir parameters of shale gas. Chin. J. Geophys. 2021, 64, 3344–3357. [Google Scholar] [CrossRef]
- Pelton, W.H.; Ward, S.H.; Hallof, P.G.; Sill, W.R.; Nelson, P.H. Mineral Discrimination and Removal of Inductive Coupling with Multifrequency Ip. Geophysics 1978, 43, 588–609. [Google Scholar] [CrossRef]
Figure 1.
Sedimentary facies and shale distribution in the study area and its periphery.
Figure 1.
Sedimentary facies and shale distribution in the study area and its periphery.
Figure 2.
Schematic diagram of shale coring.
Figure 2.
Schematic diagram of shale coring.
Figure 3.
Schematic diagram of complex resistivity measurement.
Figure 3.
Schematic diagram of complex resistivity measurement.
Figure 4.
Schematic diagram of the basic structure of mineralized rocks and equivalent circuit. (a) Basic structure; (b) equivalent circuit.
Figure 4.
Schematic diagram of the basic structure of mineralized rocks and equivalent circuit. (a) Basic structure; (b) equivalent circuit.
Figure 5.
Amplitude and phase diagram of shale resistivity in H direction at normal temperature and pressure. (a) resistivity amplitude; (b) phase.
Figure 5.
Amplitude and phase diagram of shale resistivity in H direction at normal temperature and pressure. (a) resistivity amplitude; (b) phase.
Figure 6.
Amplitude and phase diagram of shale resistivity in V direction at normal temperature and pressure. (a) resistivity amplitude; (b) phase.
Figure 6.
Amplitude and phase diagram of shale resistivity in V direction at normal temperature and pressure. (a) resistivity amplitude; (b) phase.
Figure 7.
Amplitude and phase diagram of shale resistivity in H direction at high temperature and pressure. (a) resistivity amplitude; (b) phase.
Figure 7.
Amplitude and phase diagram of shale resistivity in H direction at high temperature and pressure. (a) resistivity amplitude; (b) phase.
Figure 8.
Amplitude and phase diagram of shale resistivity in V direction at high temperature and pressure. (a) resistivity amplitude; (b) phase.
Figure 8.
Amplitude and phase diagram of shale resistivity in V direction at high temperature and pressure. (a) resistivity amplitude; (b) phase.
Figure 9.
Intersection diagram of zero-frequency resistivity, porosity and permeability at normal temperature and pressure. (a) Zero-frequency resistivity and porosity; (b) zero-frequency resistivity and permeability.
Figure 9.
Intersection diagram of zero-frequency resistivity, porosity and permeability at normal temperature and pressure. (a) Zero-frequency resistivity and porosity; (b) zero-frequency resistivity and permeability.
Figure 10.
Schematic diagram of resistivity measurement orientation of rock sample and physical drawing of coring rock sample.
Figure 10.
Schematic diagram of resistivity measurement orientation of rock sample and physical drawing of coring rock sample.
Figure 11.
The heterogeneity of porosity and permeability. (a) Porosity; (b) permeability.
Figure 11.
The heterogeneity of porosity and permeability. (a) Porosity; (b) permeability.
Figure 12.
Anisotropy coefficient of resistivity and polarizability under normal temperature and pressure, high temperature and pressure. (a) resistivity; (b) polarizability.
Figure 12.
Anisotropy coefficient of resistivity and polarizability under normal temperature and pressure, high temperature and pressure. (a) resistivity; (b) polarizability.
Table 1.
Information on shale gas well rock samples.
Table 1.
Information on shale gas well rock samples.
| No. | Number | Depth (m) | No. | Number | Depth (m) |
|---|
| 1 | V-3 | 2385.46–2385.73 | 18 | H-22 | 2481.09–2481.39 |
| 2 | H-3 | 2385.46–2385.73 | 19 | V-23 | 2481.92–2482.22 |
| 3 | V-5 | 2388.16–2388.43 | 20 | H-23 | 2481.92–2482.22 |
| 4 | H-5 | 2388.16–2388.43 | 21 | V-30 | 2489.48–2489.77 |
| 5 | V-12 | 2469.77–2470.07 | 22 | H-30 | 2489.48–2489.77 |
| 6 | H-12 | 2469.77–2470.07 | 23 | V-31 | 2490.28–2490.55 |
| 7 | V-13 | 2471–2471.28 | 24 | H-31 | 2490.28–2490.55 |
| 8 | H-13 | 2471–2471.28 | 25 | V-39 | 2498.44–2498.75 |
| 9 | V-14 | 2472.19–2472.45 | 26 | H-39 | 2498.44–2498.75 |
| 10 | H-14 | 2472.19–2472.45 | 27 | V-47 | 2507.40–2507.67 |
| 11 | V-15 | 2472.93–2473.22 | 28 | H-47 | 2507.40–2507.67 |
| 12 | H-15 | 2472.93–2473.22 | 29 | V-49 | 2509.22–2509.50 |
| 13 | V-16 | 2473.72–2473.97 | 30 | H-49 | 2509.22–2509.50 |
| 14 | H-16 | 2473.72–2473.97 | 31 | V-50 | 2510.38–2510.65 |
| 15 | V-21 | 2480.34–2480.64 | 32 | H-50 | 2510.38–2510.65 |
| 16 | H-21 | 2480.34–2480.64 | 33 | V-51 | 2511.42–2511.69 |
| 17 | V-22 | 2481.09–2481.39 | 34 | H-51 | 2511.42–2511.69 |
Table 2.
Temperature and pressure of complex resistivity experiment.
Table 2.
Temperature and pressure of complex resistivity experiment.
| Measuring Condition | Temperature (°C) | Confining Pressure (MPa) | Pore Pressure (MPa) |
|---|
| normal temperature and pressure | 25 | 0 | 0 |
| stratigraphic conditions | 85 | 55 | 20 |
Table 3.
Measurement results of shale porosity and permeability.
Table 3.
Measurement results of shale porosity and permeability.
| No. | Number | Permeability (10−3 μm2) | Porosity (%) | No. | Number | Permeability (10−3 μm2) | Porosity (%) |
|---|
| 1 | V-3 | 0.029 | 3.9 | 18 | H-22 | 1.781 | 4.9 |
| 2 | H-3 | 0.29 | 3.9 | 19 | V-23 | 0.023 | 5.7 |
| 3 | V-5 | 0.028 | 4.5 | 20 | H-23 | 0.066 | 6.3 |
| 4 | H-5 | 0.104 | 4.2 | 21 | V-30 | 0.033 | 6.9 |
| 5 | V-12 | 0.004 | 3.5 | 22 | H-30 | 3.88 | 6.3 |
| 6 | H-12 | 0.219 | 4.4 | 23 | V-31 | 0.005 | 6.6 |
| 7 | V-13 | 0.055 | 4 | 24 | H-31 | 0.031 | 6.2 |
| 8 | H-13 | 0.099 | 3.9 | 25 | V-39 | 0.021 | 6.7 |
| 9 | V-14 | 0.064 | 3.9 | 26 | H-39 | 1.97 | 7.8 |
| 10 | H-14 | 1.91 | 4.2 | 27 | V-47 | 0.021 | 5.6 |
| 11 | V-15 | 0.004 | 3.9 | 28 | H-47 | 0.07 | 5.1 |
| 12 | H-15 | 0.074 | 3.8 | 29 | V-49 | 0.005 | 5.5 |
| 13 | V-16 | 0.008 | 3.8 | 30 | H-49 | 1.704 | 6.9 |
| 14 | H-16 | 4.41 | 3.9 | 31 | V-50 | 0.001 | 6.6 |
| 15 | V-21 | 0.003 | 5 | 32 | H-50 | 0.55 | 6.5 |
| 16 | H-21 | 0.089 | 4.6 | 33 | V-51 | 0.0028 | 6.6 |
| 17 | V-22 | 0.017 | 4.9 | 34 | H-51 | 1.43 | 5.9 |
Table 4.
Inversion results of core IP parameters under normal temperature and pressure.
Table 4.
Inversion results of core IP parameters under normal temperature and pressure.
| No. | Number | ρ0 (Ω·m) | m (%) | No. | Number | ρ0 (Ω·m) | m (%) |
|---|
| 1 | V-3 | 153.72 | 8.44 | 18 | H-22 | 20.96 | 17.16 |
| 2 | H-3 | 24.79 | 13.5 | 19 | V-23 | 134.7 | 17.42 |
| 3 | V-5 | 184.75 | 7.97 | 20 | H-23 | 15.38 | 17.57 |
| 4 | H-5 | 23.71 | 13.7 | 21 | V-30 | 127.14 | 14.62 |
| 5 | V-12 | 140.45 | 12.99 | 22 | H-30 | 16.79 | 17.08 |
| 6 | H-12 | 29.26 | 16.56 | 23 | V-31 | 107.18 | 16.33 |
| 7 | V-13 | 136.01 | 12.58 | 24 | H-31 | 15.97 | 16.56 |
| 8 | H-13 | 36.18 | 17.87 | 25 | V-39 | 117.28 | 13.16 |
| 9 | V-14 | 186.98 | 11.2 | 26 | H-39 | 8.73 | 15.55 |
| 10 | H-14 | 36.81 | 16.52 | 27 | V-47 | 73.98 | 17.99 |
| 11 | V-15 | 151.87 | 10.8 | 28 | H-47 | 17.47 | 15.41 |
| 12 | H-15 | 37.43 | 16.51 | 29 | V-49 | 109.32 | 15.25 |
| 13 | V-16 | 165.32 | 13.16 | 30 | H-49 | 9.63 | 16.36 |
| 14 | H-16 | 42.97 | 16.69 | 31 | V-50 | 60.45 | 20.19 |
| 15 | V-21 | 143.16 | 15.88 | 32 | H-50 | 9.63 | 16.36 |
| 16 | H-21 | 24.04 | 16.96 | 33 | V-51 | 43.52 | 18.2 |
| 17 | V-22 | 127.45 | 14.94 | 34 | H-51 | 7.9 | 14.32 |
Table 5.
Inversion results of core IP parameters under high temperature and pressure.
Table 5.
Inversion results of core IP parameters under high temperature and pressure.
| No. | Number | ρ0 (Ω·m) | m (%) | No. | Number | ρ0 (Ω·m) | m (%) |
|---|
| 1 | V-3 | 64.73 | 17.76 | 18 | H-22 | 19.86 | 28.37 |
| 2 | H-3 | 23.57 | 19.83 | 19 | V-23 | 52.61 | 26.03 |
| 3 | V-5 | 77.78 | 21.53 | 20 | H-23 | 18.14 | 25.76 |
| 4 | H-5 | 21.64 | 22.09 | 21 | V-30 | 53.96 | 24.74 |
| 5 | V-12 | 46.16 | 14.66 | 22 | H-30 | 16.75 | 28.46 |
| 6 | H-12 | 29.79 | 24 | 23 | V-31 | 50.74 | 19.13 |
| 7 | V-13 | 52.39 | 14.15 | 24 | H-31 | 16.48 | 27.23 |
| 8 | H-13 | 30.09 | 20.08 | 25 | V-39 | 52.08 | 18.08 |
| 9 | V-14 | 96.51 | 17.3 | 26 | H-39 | 9.61 | 24.61 |
| 10 | H-14 | 39.42 | 19.63 | 27 | V-47 | 27.46 | 24.21 |
| 11 | V-15 | 57.63 | 25.34 | 28 | H-47 | 14.4 | 17.34 |
| 12 | H-15 | 29.33 | 18.3 | 29 | V-49 | 14.87 | 26.25 |
| 13 | V-16 | 46.81 | 14.46 | 30 | H-49 | 6.1 | 15.46 |
| 14 | H-16 | 45.28 | 17.66 | 31 | V-50 | 14.77 | 19.49 |
| 15 | V-21 | 51.97 | 15.95 | 32 | H-50 | 7.64 | 20.05 |
| 16 | H-21 | 25.78 | 34.05 | 33 | V-51 | 13.79 | 23.29 |
| 17 | V-22 | 48.14 | 19.01 | 34 | H-51 | 5.94 | 16.94 |
| Publisher’s Note: MDPI stays neutral with regard to jurisdictional claims in published maps and institutional affiliations. |
© 2022 by the authors. Licensee MDPI, Basel, Switzerland. This article is an open access article distributed under the terms and conditions of the Creative Commons Attribution (CC BY) license (https://creativecommons.org/licenses/by/4.0/).


