1. Introduction
The submerged arc welding (SAW) process constitutes a complex interaction of physical, electrical, and chemical effects in the arc cavity, which is the main process reaction volume [
1,
2]. The main machine input selections are current, weld wire diameter, voltage, travel speed, current polarity, and electrode (weld wire) extension [
3,
4]. Even though all these parameters are important in SAW, the flux chemistry has an out-sized influence on the weld metal chemistry because it sets the oxidation potential in the arc cavity and in the weld pool [
3,
4,
5]. The oxygen potential, in turn, sets the element transfer between the molten flux (slag) and the weld pool (molten weld metal) [
5,
6,
7]. The oxygen potential furthermore sets the most important weld metal chemical parameter, namely the weld metal total oxygen content. Excessive weld metal total oxygen content, measured in parts per million of total oxygen (ppm O), forms too many oxide inclusions, which lowers the weld metal tensile strength and impact toughness. Targeted quantities of weld metal oxide inclusions are used to enhance materials properties by serving as nucleation sites for acicular ferrite formation. This preferred microstructure in the carbon steel weld metal ensures high impact toughness [
8]. The addition of CaF
2 into the flux formulation is used to control the weld metal ppm O and limit hydrogen pick-up into the weld metal. Although the weld pool and arc cavity are isolated from the atmosphere, oxygen is added into the weld pool via the dissociation of oxides in the flux. Oxides decompose in the arc plasma because of high temperatures in the order of 2000 °C to 2500 °C [
9,
10]. Oxygen is adsorbed onto the molten wire droplets in the arc plasma and is then transferred into the weld pool via the molten wire droplets [
11,
12]. This level of oxygen was measured to be as high as 2000 to 3000 ppm O [
11,
12]. In comparison, the aim weld metal total ppm O in carbon steel is 200 to 500 ppm O [
8]. The rank of oxide stability in the arc plasma was measured from least stable to most stable as MnO and SiO
2, MgO, Al
2O
3, TiO
2, Na
2O, K
2O, and CaO [
13]. To be noted is that Cr
2O
3 is not included in this stability sequence of oxides. Addition of CaF
2 to the flux results in the dilution of weakly stable oxides to decrease the total quantity of oxygen released in the arc cavity. Fluorides can also lower the influence of oxygen in the arc cavity by lowering the partial oxygen pressure (P
O2) in the arc cavity by forming fluorine based compounds via reactions similar to reaction (1) between SiO
2 and CaF
2 [
13,
14].
In addition to its role in lowering the weld metal total ppm O, the addition of CaF
2 into the flux is also used to set process physico-chemical properties of the slag to enhance its process application. For example, the slag viscosity and surface tension are also influenced by CaF
2 as F
− serves as network modifier anion [
15]. The empirically determined trend of flux basicity (BI) vs. ppm O in the weld metal is generally used to design fluxes to achieve the targeted weld metal total ppm O. The BI expression is shown in Equation (2) in mass% values, [
16].
To be noted is that some authors included the Cr
2O
3 component of the flux as an acidic compound, similar to Al
2O
3 in the above BI equation [
17]. Limited work is reported on the application of Cr
2O
3 in SAW flux to transfer chromium from the slag to the weld pool [
17]. This study showed that flux basicity plays an important role in the transfer of chromium from the slag to the weld pool. In low CaF
2 flux (0% to 8.7% CaF
2) containing Cr
2O
3-CaO-SiO
2-(MnO), the increased flux basicity was found to be the main chemical factor in setting chromium transfer to the weld pool. Increasing the basicity from 0.35 to 1.0 resulted in increased chromium transfer to the weld pool. The initial Cr
2O
3 content in the flux had a secondary effect on chromium transfer because flux with lower initial Cr
2O
3 content and higher basicity of 1.0, displayed higher chromium transfer to the weld metal than the flux with high initial Cr
2O
3 content and low basicity of 0.35. Fluxes of the same basicity (BI = 1.0) and differing initial Cr
2O
3 content at 10.2% and 18.3%, respectively, displayed the same extent of chromium transfer to form similar weld metal %Cr. The authors concluded that this effect was due to Cr
2O
3 activity in the slag being close to unity in both slag compositions. The authors also mentioned that the chromium loss indicated by the mass balance calculations were from the slag, rather than from the weld pool, because of Cr
2O
3 volatilisation at the high temperatures in the welding process [
17]. Interestingly, the weld metal total ppm O values attained were relatively high at 470 ppm O to 1450 ppm O.
The chemical behaviour of chromium, nickel, and molybdenum in the welding of low alloys steel was investigated by applying highly oxidising flux (40% SiO
2-MnO-CaO) with Cr and Mo alloying from the weld wire and Ni contained in the base plate steel [
18]. It was found that slag chemistry affected the extent of nickel and chromium loss. The base metal alloying element values were low at 1.65% Ni and 0.76% Cr. The solid weld wire contained 0% Ni and 1.25% Cr. The absolute element loss values were 0.3% Ni loss and 0.3% Cr loss from the weld metal, equivalent to 81% Ni yield and 61% Cr yield to the weld metal when the highly oxidising flux of 40% SiO
2-MnO-CaO was applied [
18]. The weld metal total ppm O remained within a relatively narrow band of 450–570 ppm O. In the same study, in welding tests with a more oxidising flux containing FeO, the element loss values for Ni and Cr were lower than the numbers mentioned above, and welding with a highly reducing basic flux of 40% SiO
2-MnO-CaF
2 showed the lowest element loss values for Ni and Cr [
18]. The weld metal total ppm O increased with increased FeO in the 40% SiO
2-MnO-FeO flux and ranged from 553–700 ppm O. In the 40% SiO
2-MnO-CaF
2 flux, the weld metal total ppm O ranged from 230–300 ppm O. These results appear to confirm that oxygen plays a role in chromium loss from the weld metal and/or slag since little to no chromium loss was observed when more reducing flux (CaF
2 containing flux) was used compared to more oxidising flux (FeO or MnO containing flux with no CaF
2 added). In comparison, higher chromium yield values were obtained when pre-alloyed powders were applied in SAW in cladding applications [
18]. In comparison, the application of pre-alloyed powder in SAW to form a Cr-Ni-Mo-Fe cladding layer onto steel substrate achieved nickel yield values of 57% to 78% and chromium yields values from 56% to 76%. The flux is only specified as “basic unalloyed” and therefore alloying was done completely via the pre-alloyed powder since the weld wire did not contain any Cr, Ni or Mo. The pre-alloyed powder consisted of iron-based alloy powders containing 27%–29% Cr, 5%–8% Ni, and 2%–4% Mo [
19].
Chromium and titanium have a high affinity for oxygen. Therefore, these elements are not easily transferred across the arc [
4]. Typically, chromium is added to the weld pool from the weld wire. Due to its toxicity, the formation chromium (VI) is one of the main concerns in welding with chromium containing consumables [
20]. The formation of chromium (VI) is associated with open arc welding methods such as SMAW (shielded metal arc welding) and GMAW (gas metal arc welding) because chromium is easily oxidised by oxygen in the air [
20,
21]. Because the arc is covered by slag in the SAW process, the oxidation of chromium is expected to be less severe compared to that in open arc processes. Fume particle sizes may range from 0.005 to 20 µm (micrometre), and the individual small fume particles may also agglomerate into large masses [
22,
23].
From the above literature discussion, it is clear that the chemical behaviour of chromium in SAW is not widely reported in the published literature. In our recent work, we applied aluminium powder to the SAW process [
24,
25,
26,
27,
28,
29,
30]. Therefore, more reducing conditions are maintained in the arc cavity and in the weld pool, compared to SAW without aluminium powder additions [
24,
25,
26,
27,
28,
29,
30]. Consequently, the chemical behaviour of chromium in the presence of aluminium powder is expected to be different from that typically applied in SAW, namely less reducing conditions. In this study, the behaviour of chromium added as unconstrained metal powder with aluminium to the SAW process is investigated, specifically the chemical behaviour of chromium in the slag. Furthermore, investigation of the chemical behaviour of chromium in the welding slag may provide insights into the mechanism of loss of chromium in SAW as applied with aluminium powder additions. The objective of this work is to investigate the speciation of chromium in post-weld slag samples from SAW tests made with unconstrained aluminium, chromium, copper and titanium metal powders and to explain the chemical behaviour of chromium in the SAW process with aluminium metal powder applied as de-oxidiser.
2. Materials and Methods
SAW welding tests were made as bead-on-plate runs onto steel plates of 350 mm length, 12 mm plate thickness, and 300 mm plate width. Weld heat input was 2.0 kJ/mm (500 A, 28 V, 42 cm/min) welded DCEP (direct current electrode positive) with 3.2 mm diameter wire. Structural steel grade EN 10025-2 was used as base plate material. The chemical analyses of the base plate and weld wire are summarised in
Table 1. Analysis method details were previously described in our prior publication [
31]. Weld tests were made with aluminium metal powder addition as de-oxidiser, in combination with alloying metal powders of chromium, copper, and titanium. Ten grams of each powder were added in different combinations as follows: Al and Cr in MP2; Al, Cr, and Cu in MP4; and Al, Cr, Cu, and Ti in MP5. Details on the weld metal mass balance and weld metal composition for each weld metal sample were reported previously for each metal powder combination used [
25,
27,
28]. The welding parameters as stated above were used in each welding test made with metal powder addition, and in the comparison welding test, the base case (BC) test, in which no metal powder was added [
32,
33].
Commercial agglomerated flux of composition in
Table 2 was used in the welding experiments, following a previous detailed study on a selection of commercial agglomerated fluxes [
32]. This is an aluminate basic flux (basicity index (BI) = 1.4) and was extensively analysed as reported previously [
32]. The main consideration in selection of this flux is its likely thermodynamic stability in the presence of aluminium powder as de-oxidiser element. The metal powders used as additions in the SAW tests were sourced as Al (99.7% Al, −1 mm) supplied by Sigma-Aldrich, Cr (99.0% Cr, −44 µm) as supplied by Alfa Aesar, Cu (99.8% Cu, −200 µm) supplied by Goodfellow and (99.5% Ti, −90 µm) supplied by PLS Technik GmbH & Co.
The post-weld slag bulk chemistry and mineralogy were analysed. Analysis method details on ICP-OES (inductively coupled plasma optical emission spectrometry) and XRD (X-ray diffraction) analyses of the post-weld slag samples were previously described in our prior publication [
31]. The speciation of chromium in the post-weld slag samples was investigated by SEM (scanning electron microscope). Three-dimensional (3D) samples were coated with gold before using a Zeiss crossbeam 540 FEG (field emission gun) SEM (scanning electron microscope) to gather BSE (backscattered electron images) images and perform EDX (energy dispersive X-ray) analyses. Similarly, polished sections were prepared from the post-weld slag samples for comparison EDX analyses in the two-dimensional (2D) samples to that of the three-dimensional (3D) slag samples.
3. Results
The post-weld slag bulk chemistry in
Table 3 illustrates significant chemistry changes in the MP2, MP4, and MP5 slags when compared to the base case (BC) slag. These changes are due to the addition of metal powder to the weld pool, as compared to the base case (BC) slag formed in the absence of metal powder additions [
25,
27,
28]. Mainly, MnO and SiO
2 decreased and Al
2O
3 increased in the MP2, MP4, and MP5 slags, relative to the BC slag analysis. The increase in Al
2O
3 is due to the use of aluminium metal powder as de-oxidiser metal in the weld pool and due to the aluminothermic reduction in MnO and SiO
2 [
24,
25,
26,
27,
28,
29,
30,
31]. The increased TiO
2 content is due to oxidation of added Ti powder as identified previously for Ti, Al, and Cu powder additions made in similar tests [
31]. Although Cu and Cr were analysed in MP2, MP4, and MP5 bulk slag, the analyses in
Table 3 are expressed in terms of CuO and CrO.
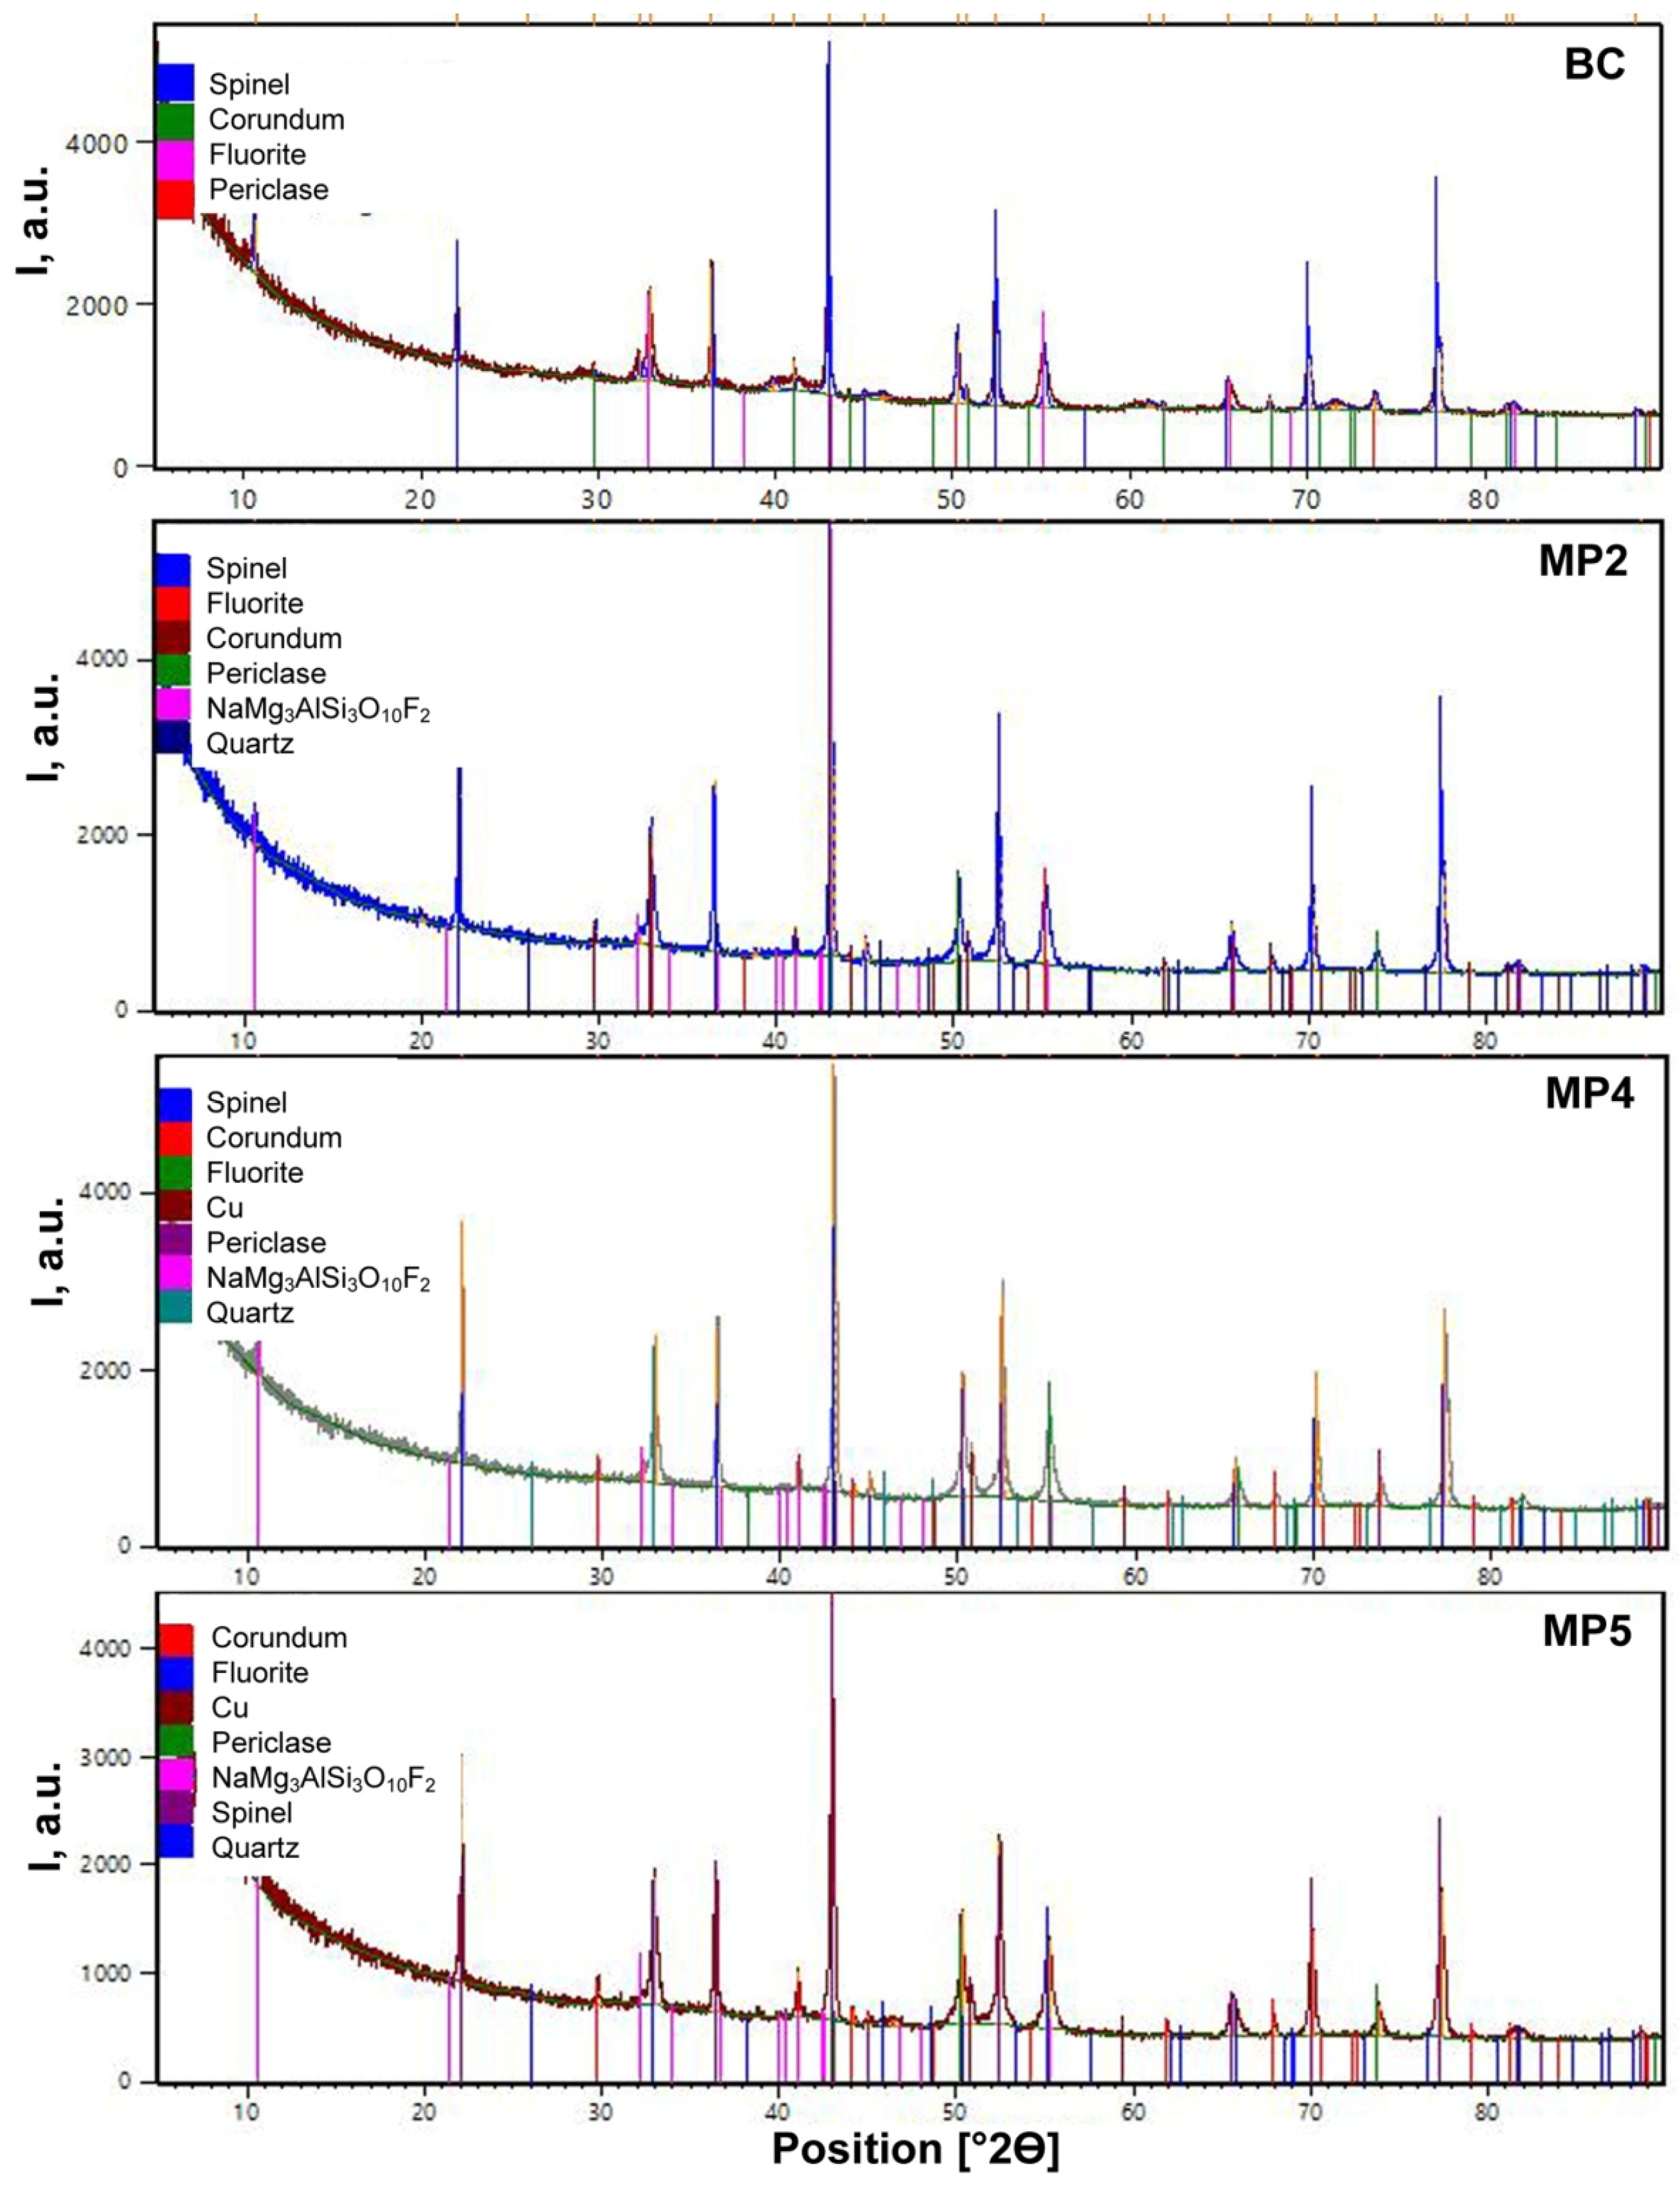
Figure 1 illustrates that the XRD analyses identified similar crystalline phases in all the post-weld slags, namely spinel (MgAl
2O
4), corundum (Al
2O
3), fluorite (CaF
2), periclase (MgO), quartz (SiO
2), and NaMg
3AlSi
3O
10F
2 oxy-fluoride phase. These XRD results are in agreement with our previous analysis of post-weld slags from SAW with added aluminium and titanium metal powders [
31]. Additionally,
Figure 1 shows that metallic copper was identified in the MP4 and MP5 slags. No metallic chromium was identified in the XRD patterns. The characteristic hump in the count rate values at low 2Θ values indicates the presence of an amorphous phase. It is clear that limited information is gained from the slag bulk chemistry and the XRD analyses in terms of the behaviour of chromium in the SAW process, and more specifically the behaviour of chromium in the slag. In the following section analyses by SEM-EDX with BSE (backscattered electron) images are used to investigate the process chemical behaviour of Cu and Cr and to verify the speciation of these elements in the slags.
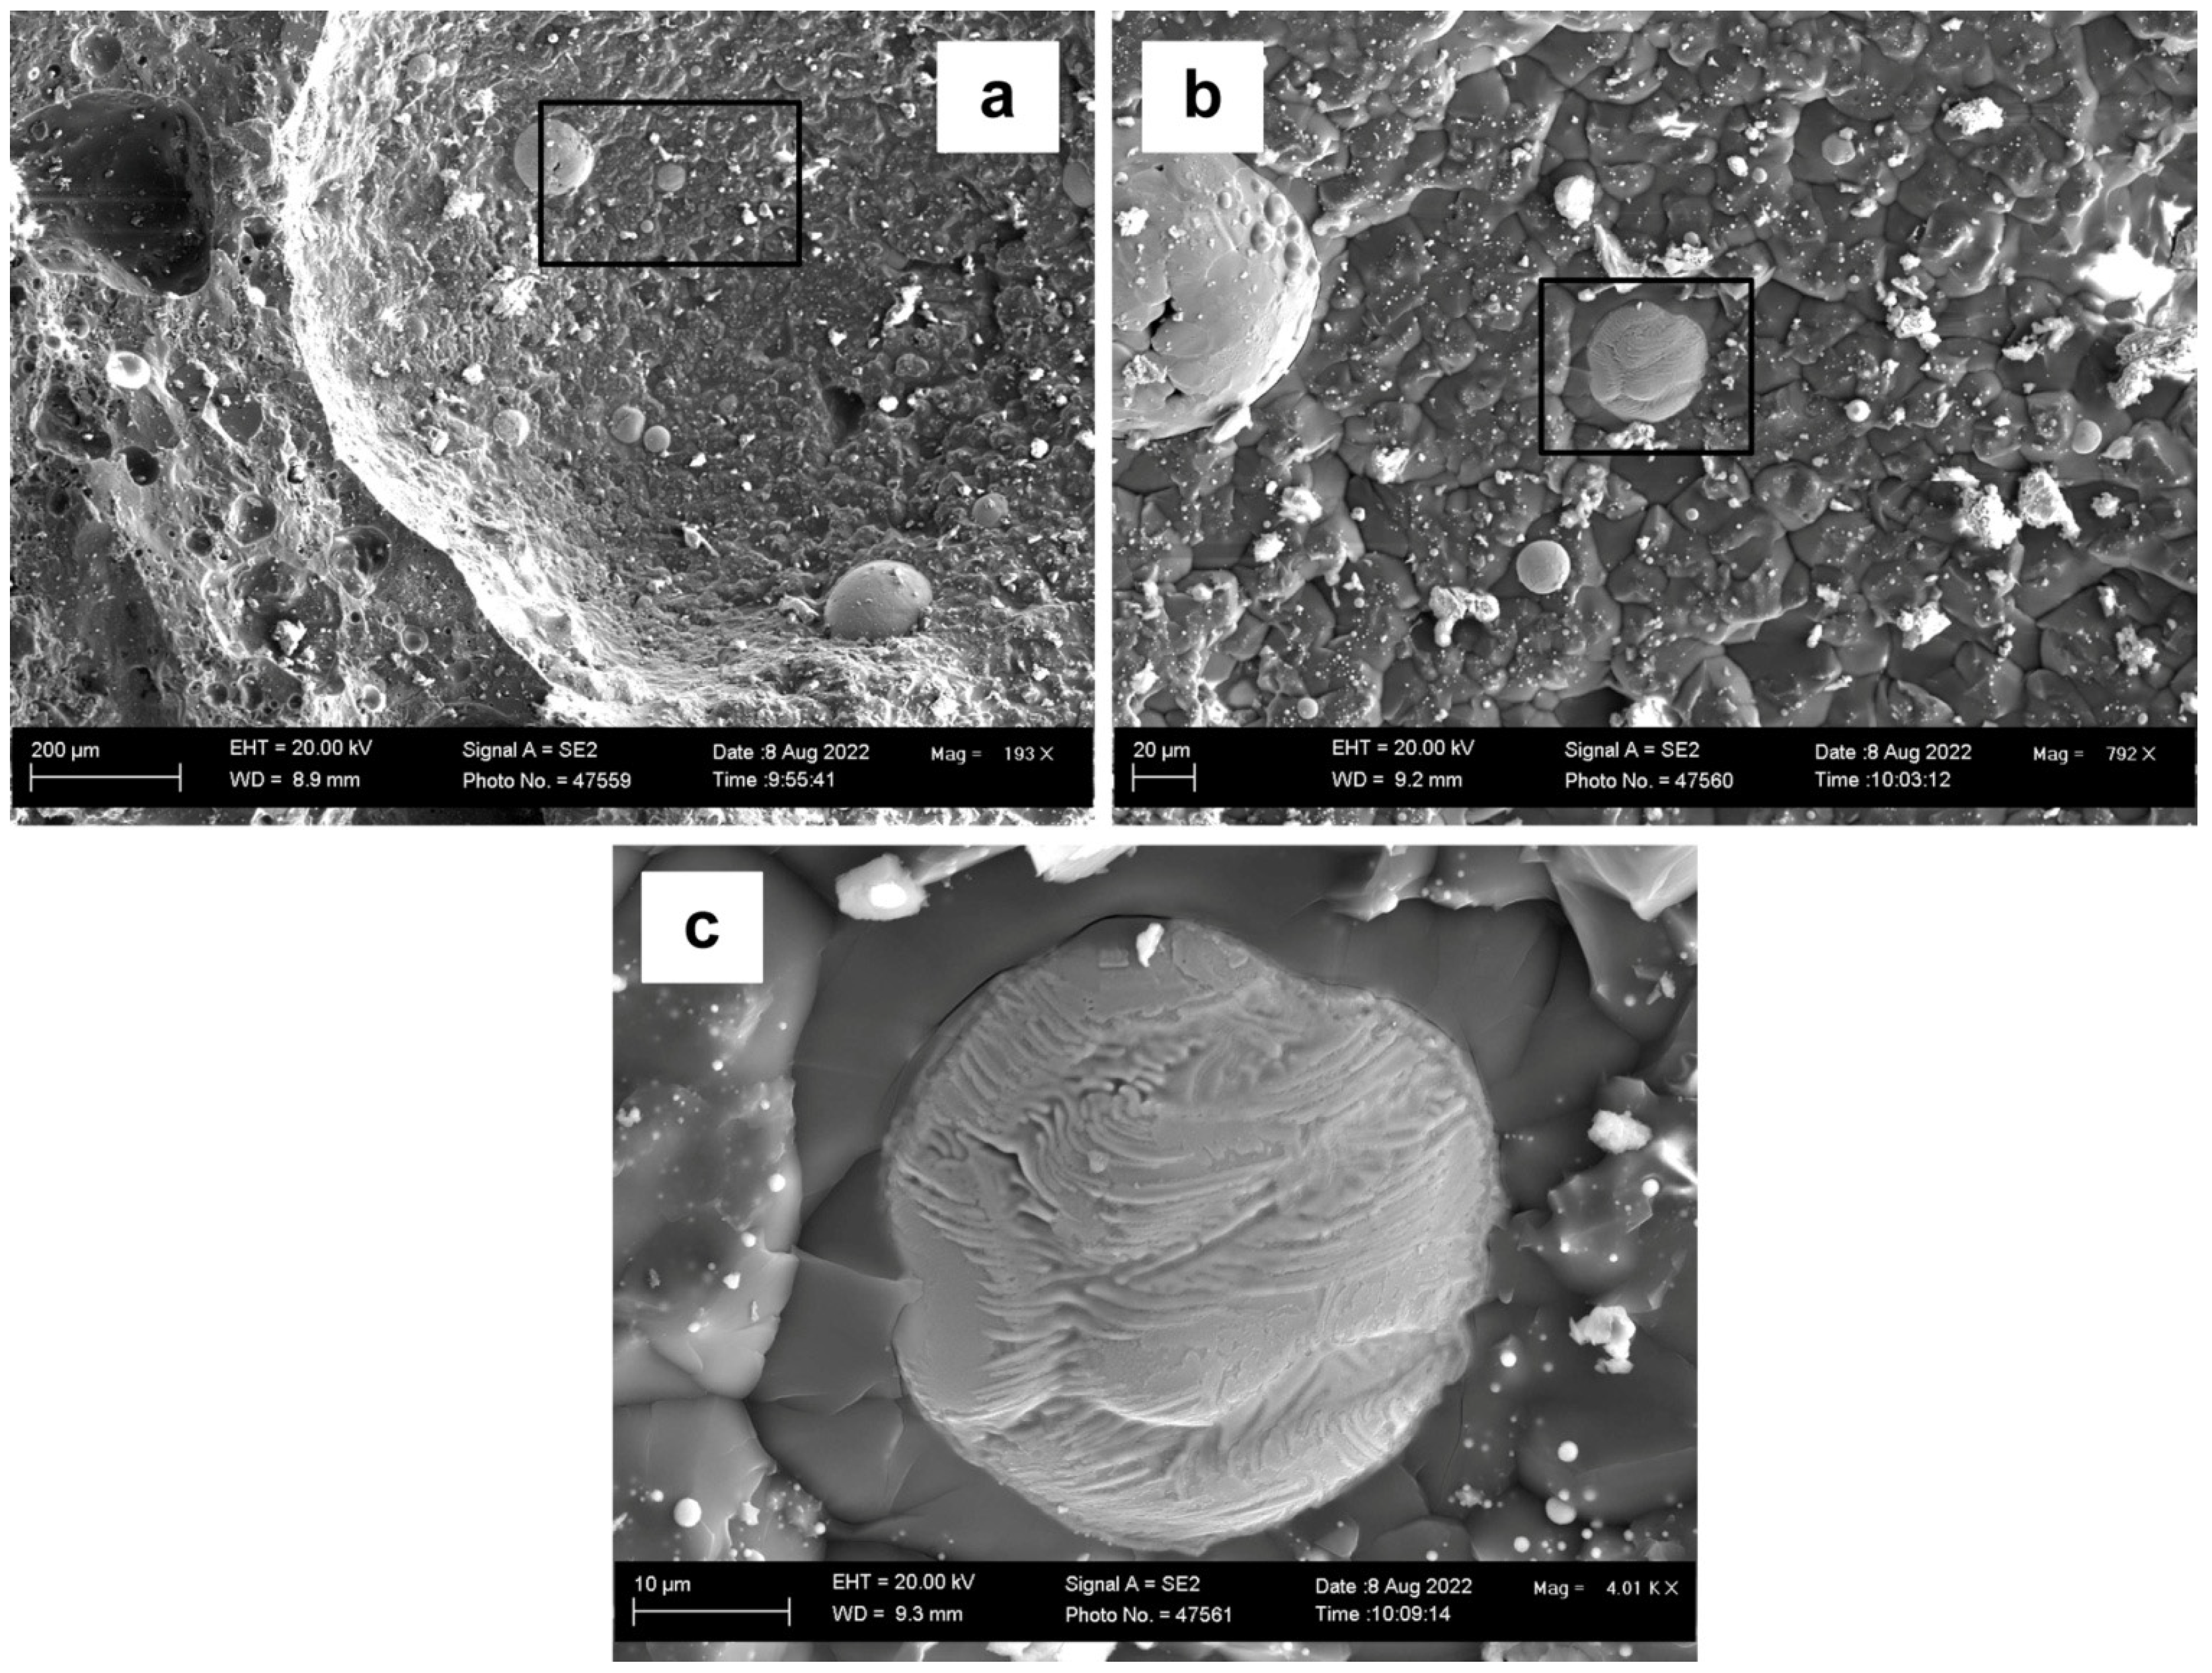
Figure 2 displays a BSE (backscattered electron) image of the 3D slag surface at increasing magnifications. This image is representative of several dome cavities observed in the slag sample. Once a two-dimensional polished section is made of the slag sample, these features are easily missed because the polished interface is made from a plane cut across the 3D features.
Figure 2a at low magnification shows several large droplets at the rim of the slag dome and inside the slag dome.
Figure 2b–d show the marked square areas at increased magnification. EDX maps of these areas show the element and phase distributions.
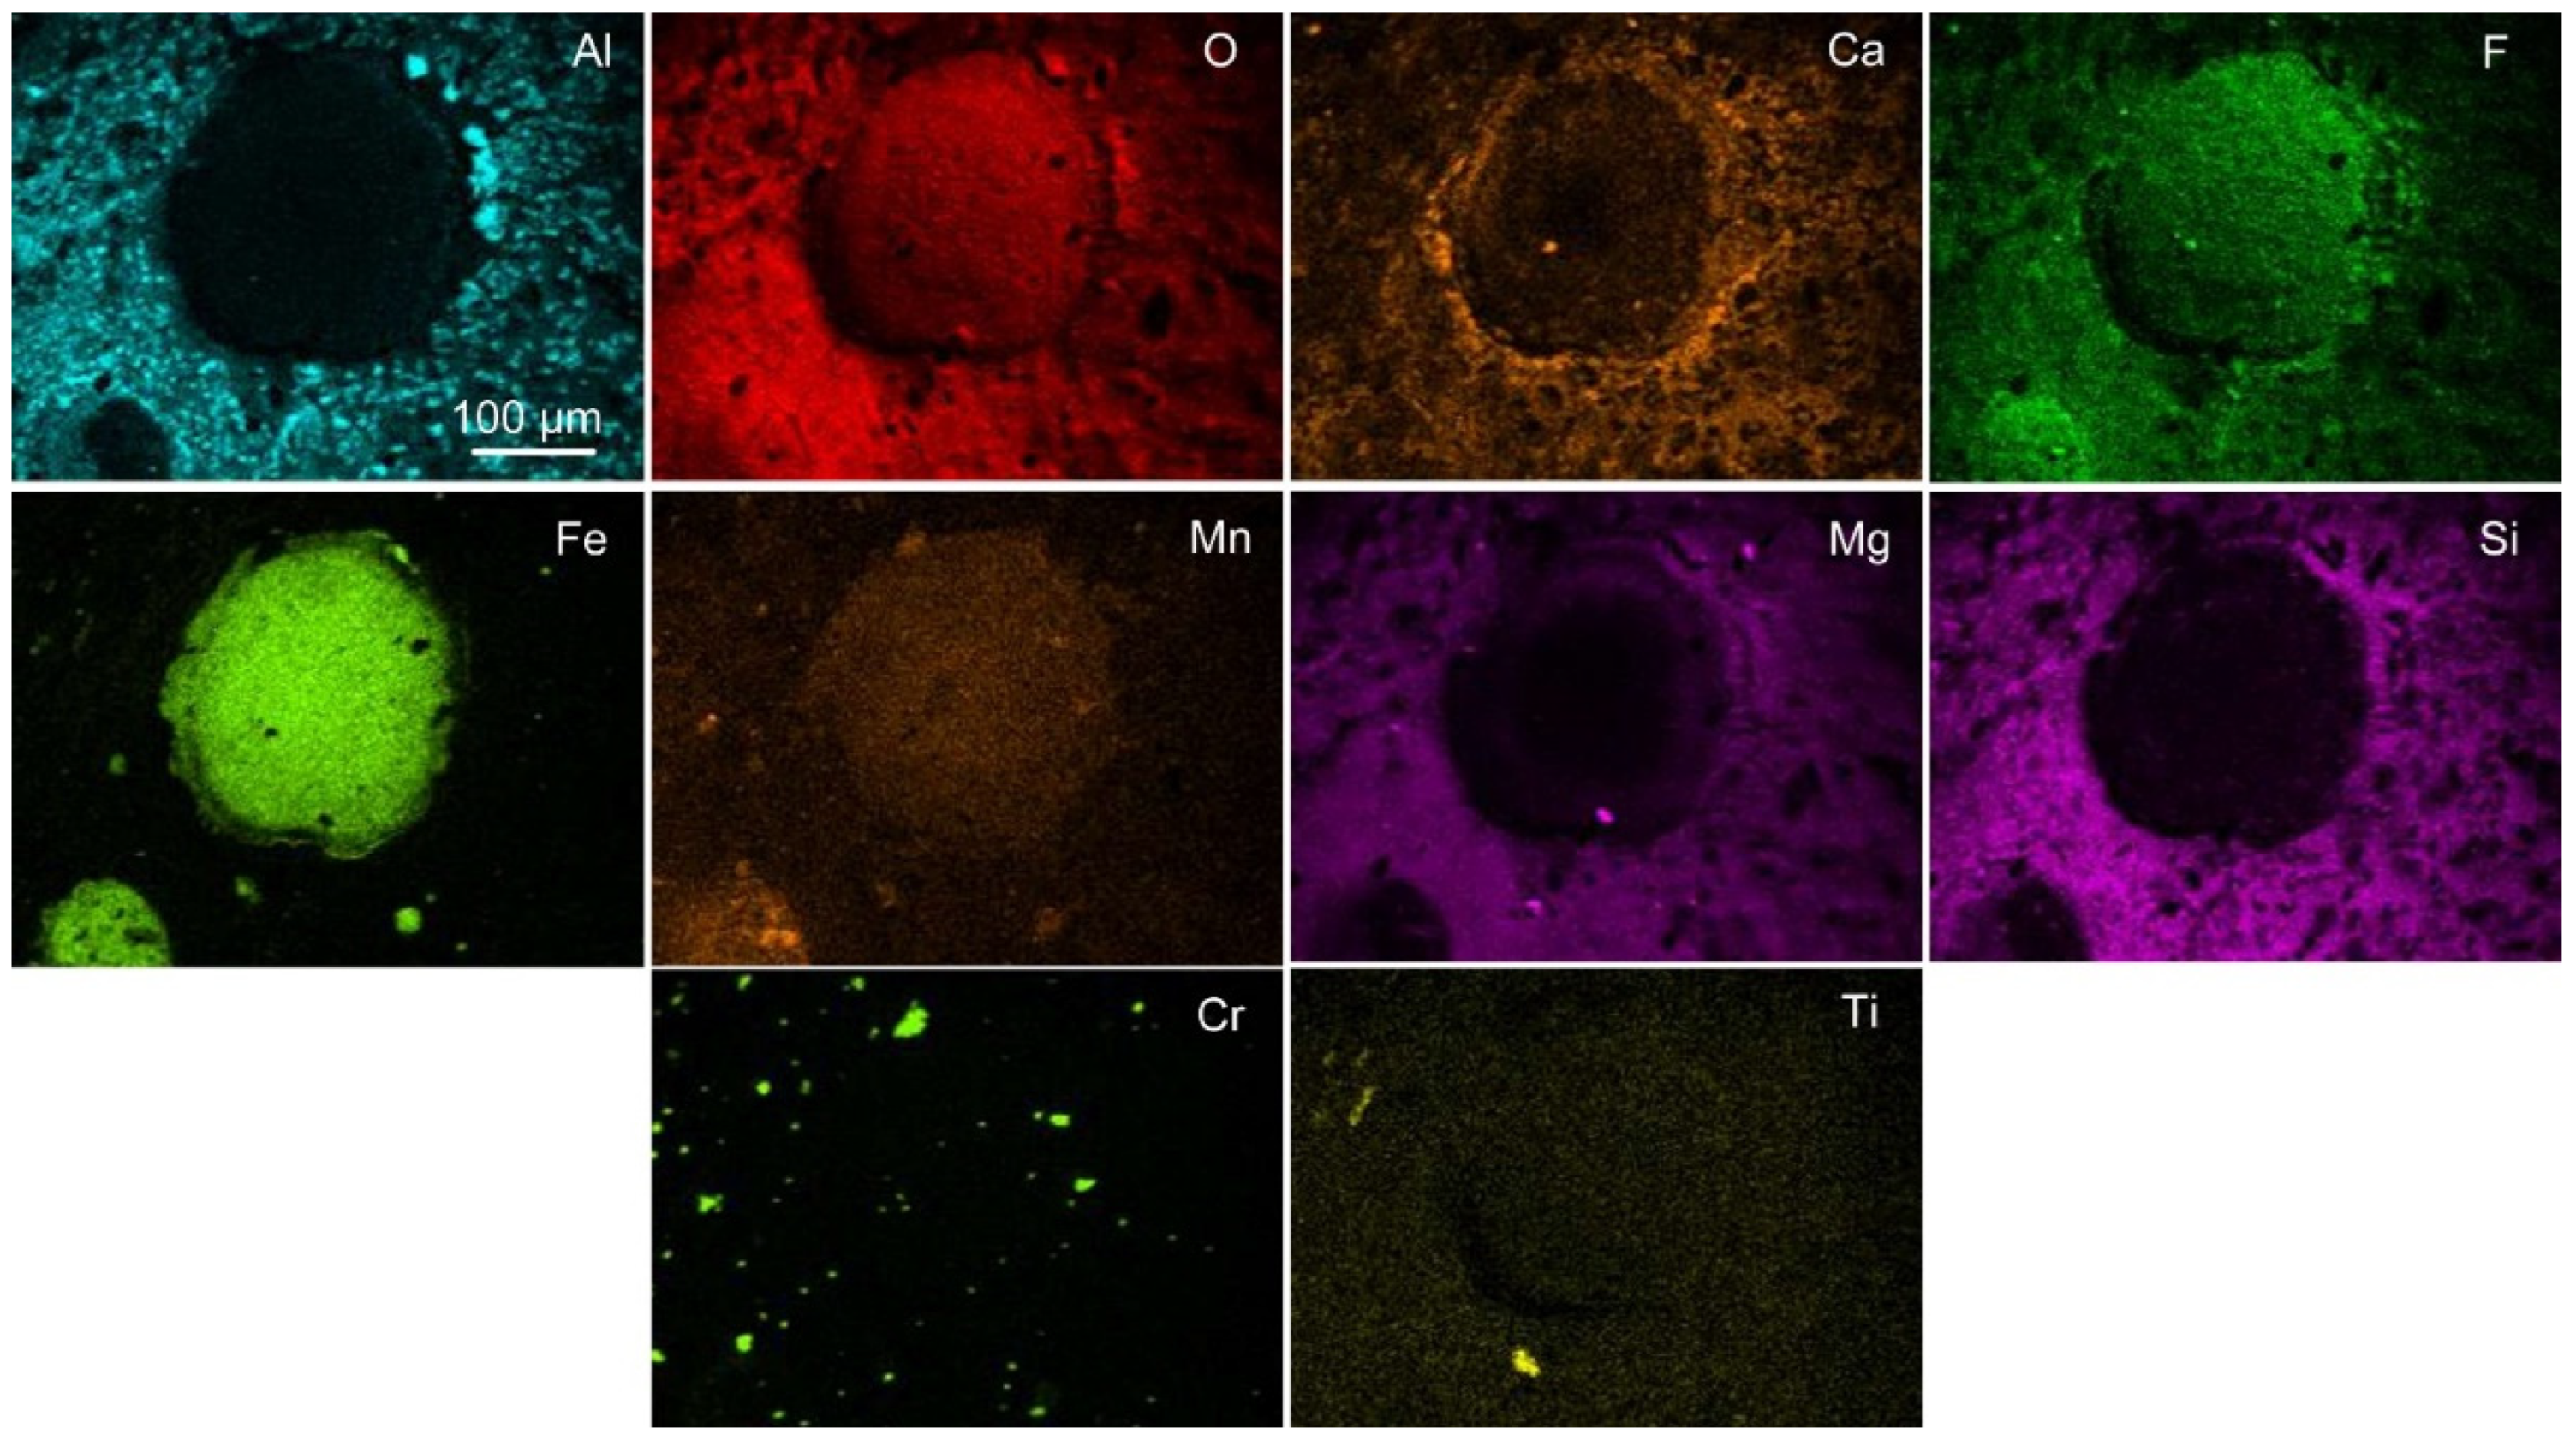
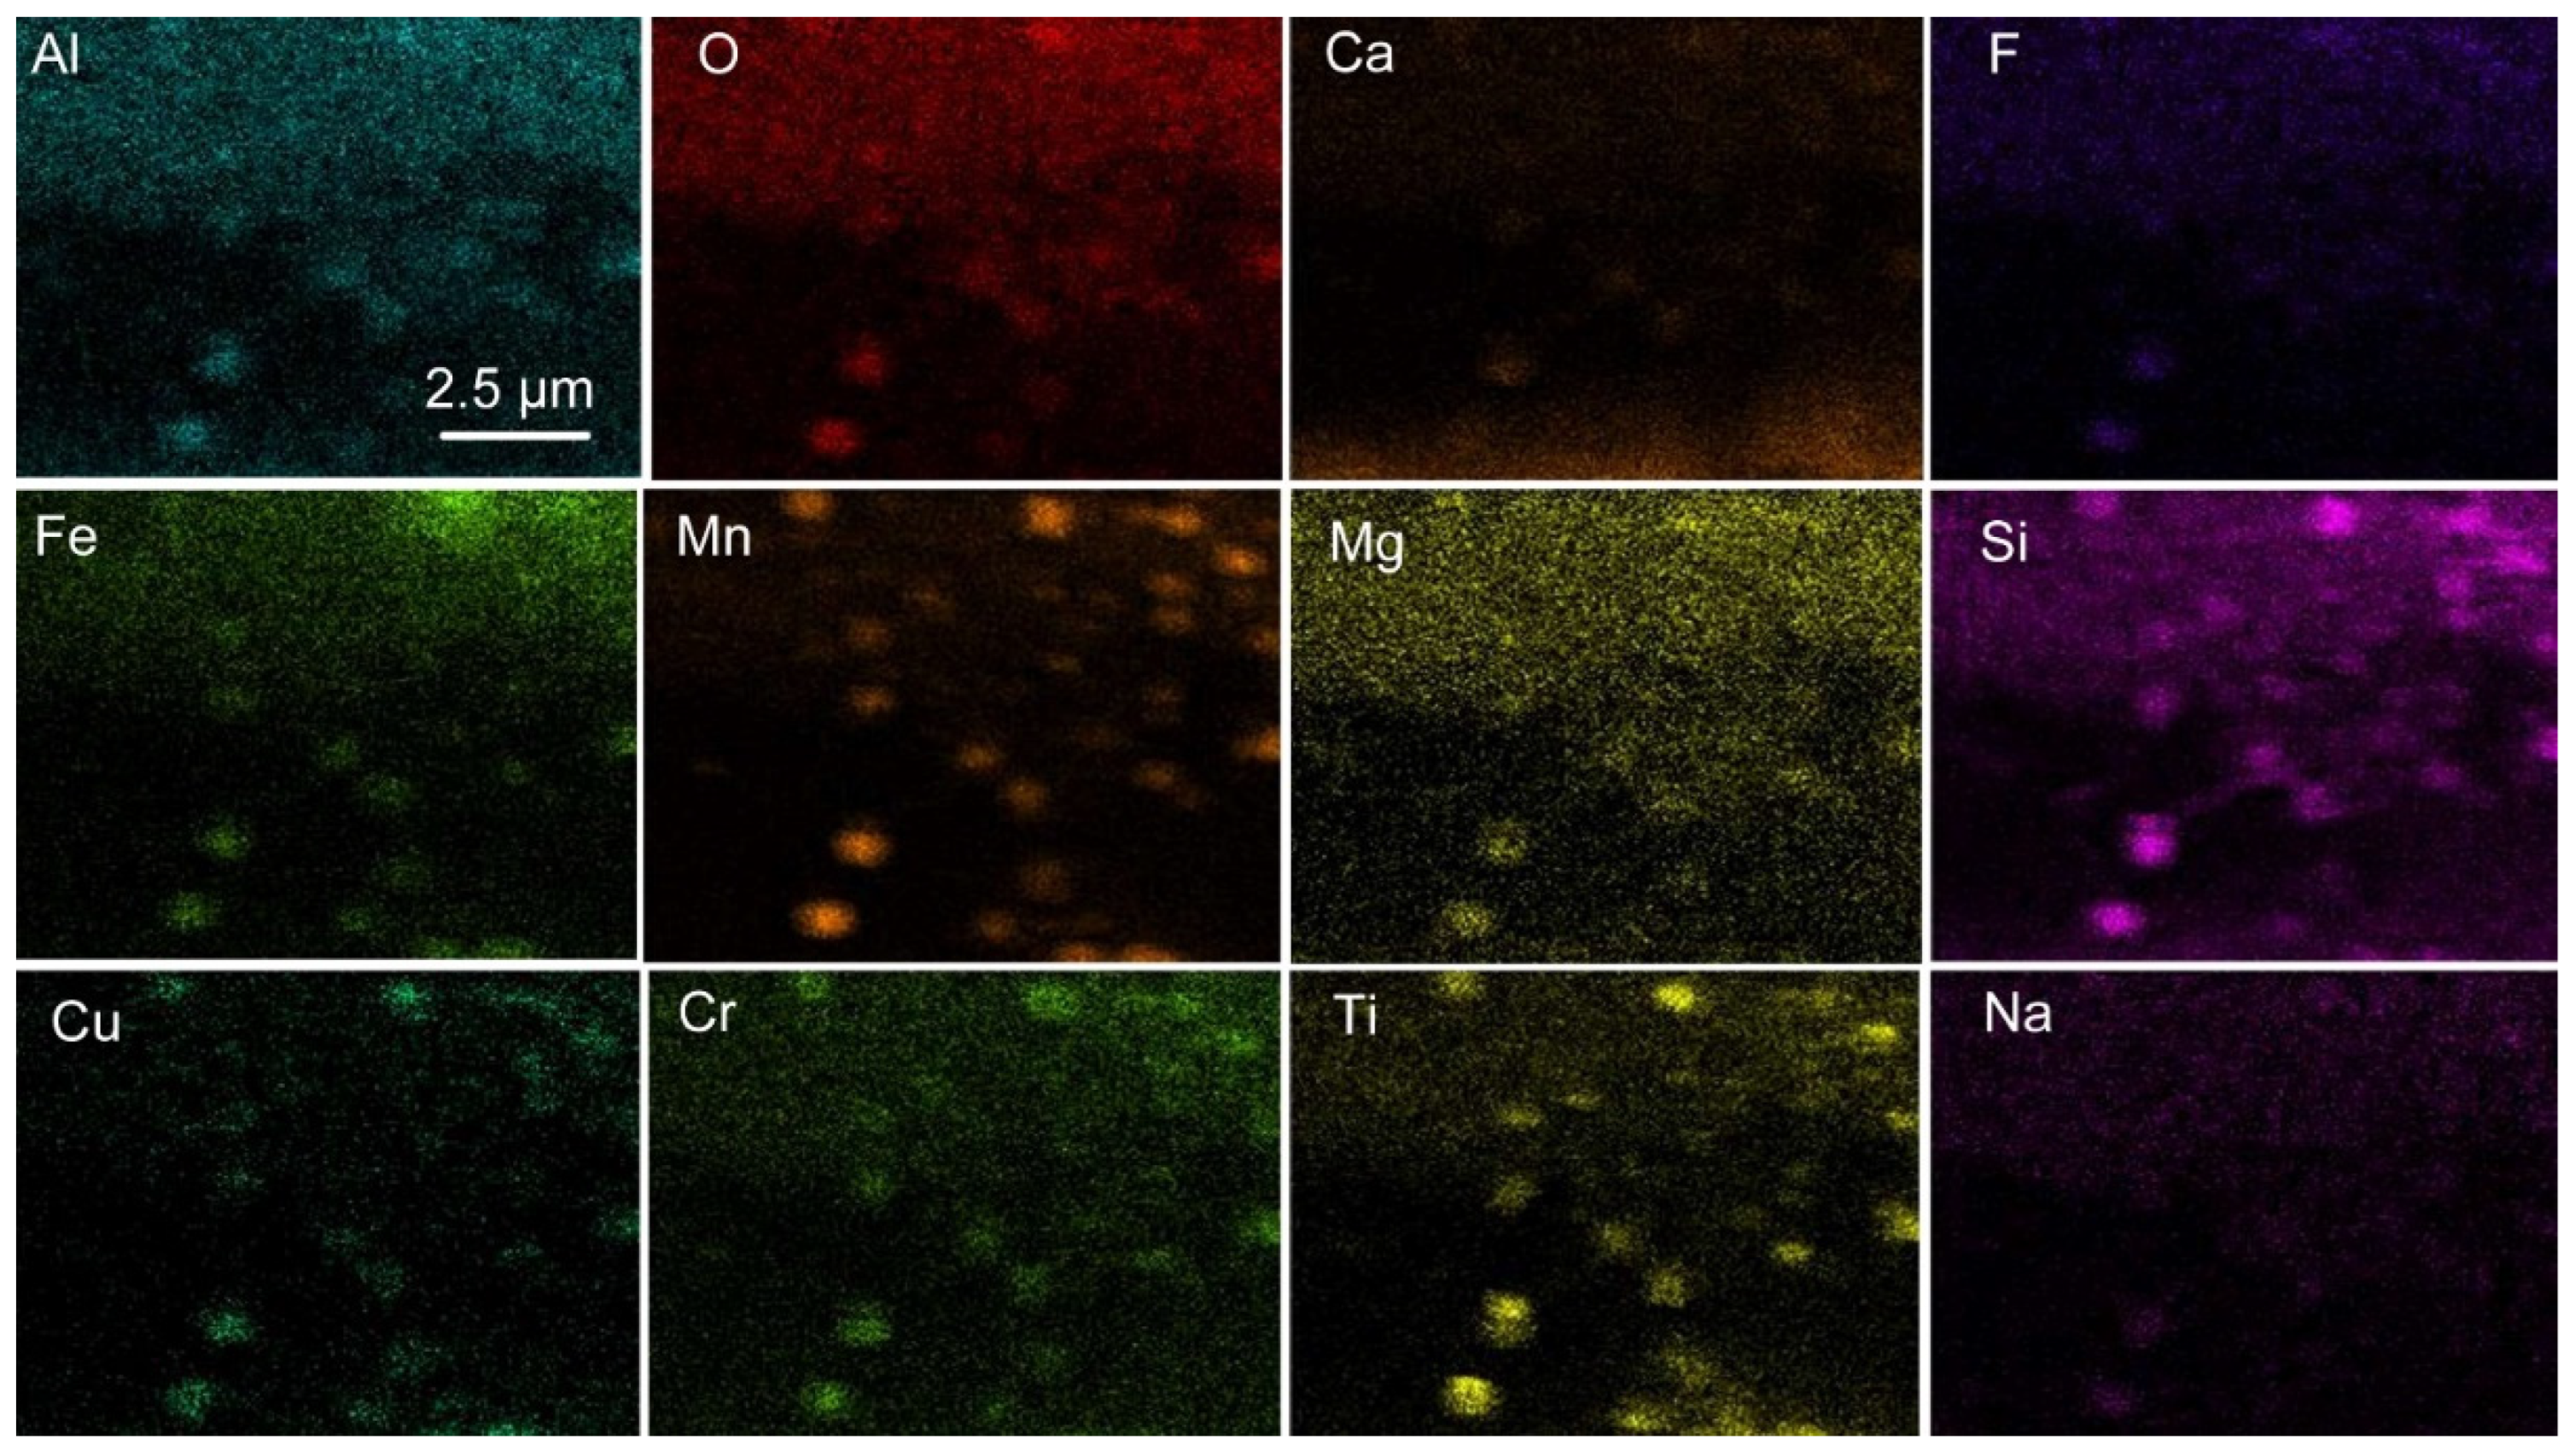
Figure 3 displays the EDX map of
Figure 2b, indicating that the circular area consists of Fe-Mn-O-F oxy-fluoride and the surrounding dome walls consist of an Al-Ca-Mg-Si-O-F oxy-fluoride matrix, with small areas of higher aluminium concentration in the matrix phase. Noticeable is that chromium is present as small specks throughout the analysed area. Although titanium is shown vaguely, there is less than 1 mass% titanium dioxide reported in this slag sample, see
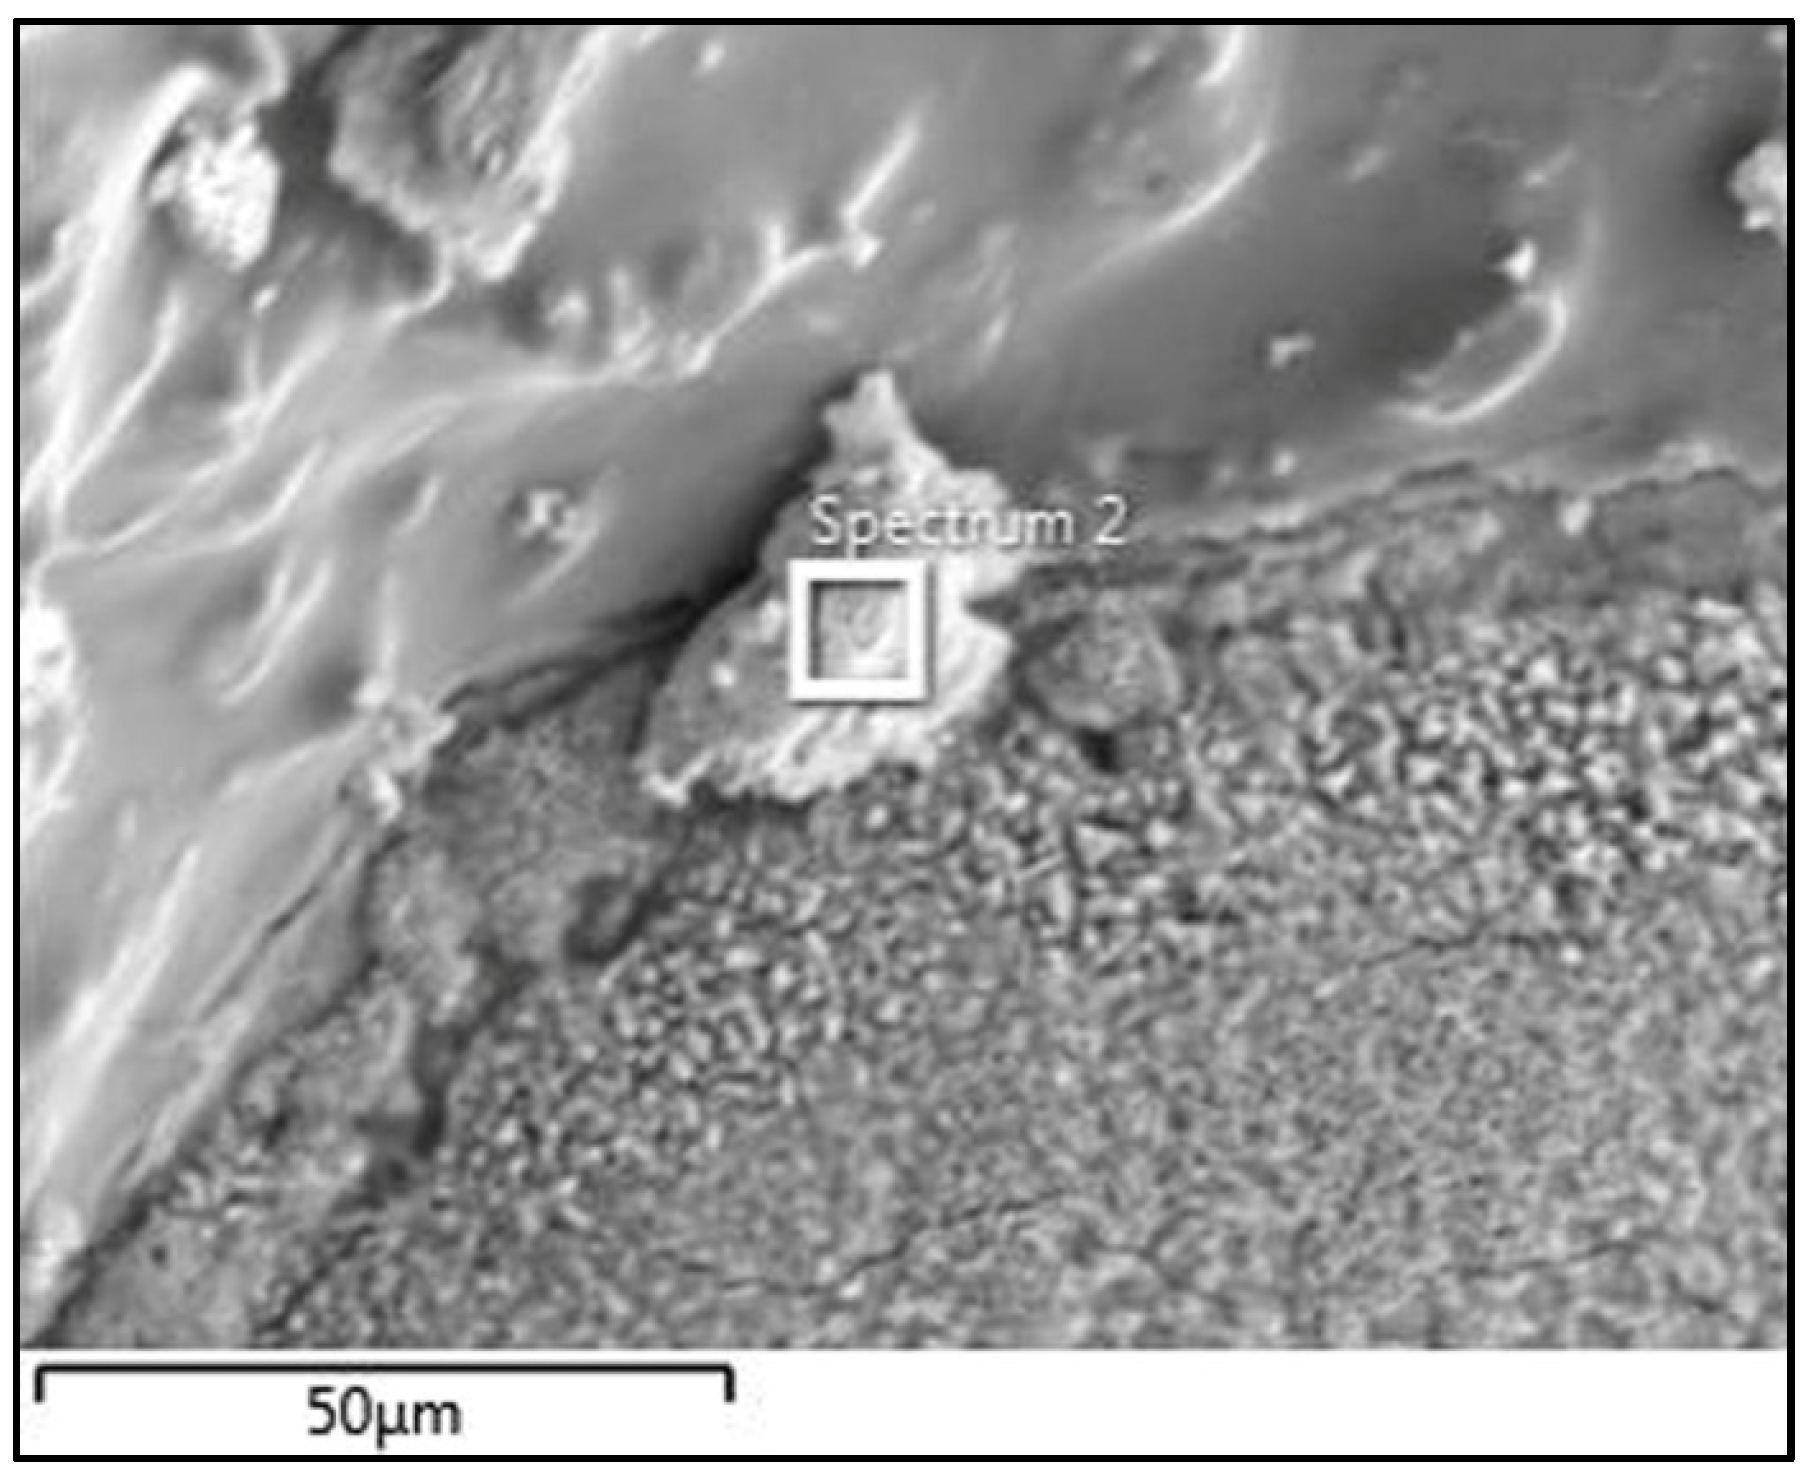
Table 3. The 20 µm sized porous particle in the marked square in
Figure 2c is shown to contain chromium and manganese in the EDX maps displayed in
Figure 4. EDS analysis of this particle, as displayed in
Figure 5, is shown in
Table 4. The analysis confirms that the particle contains mainly chromium, and it possibly also contains Mg, Mn, Na, and O. Interestingly, no F is seen in the EDX map or the EDS analysis of this chromium-rich particle.
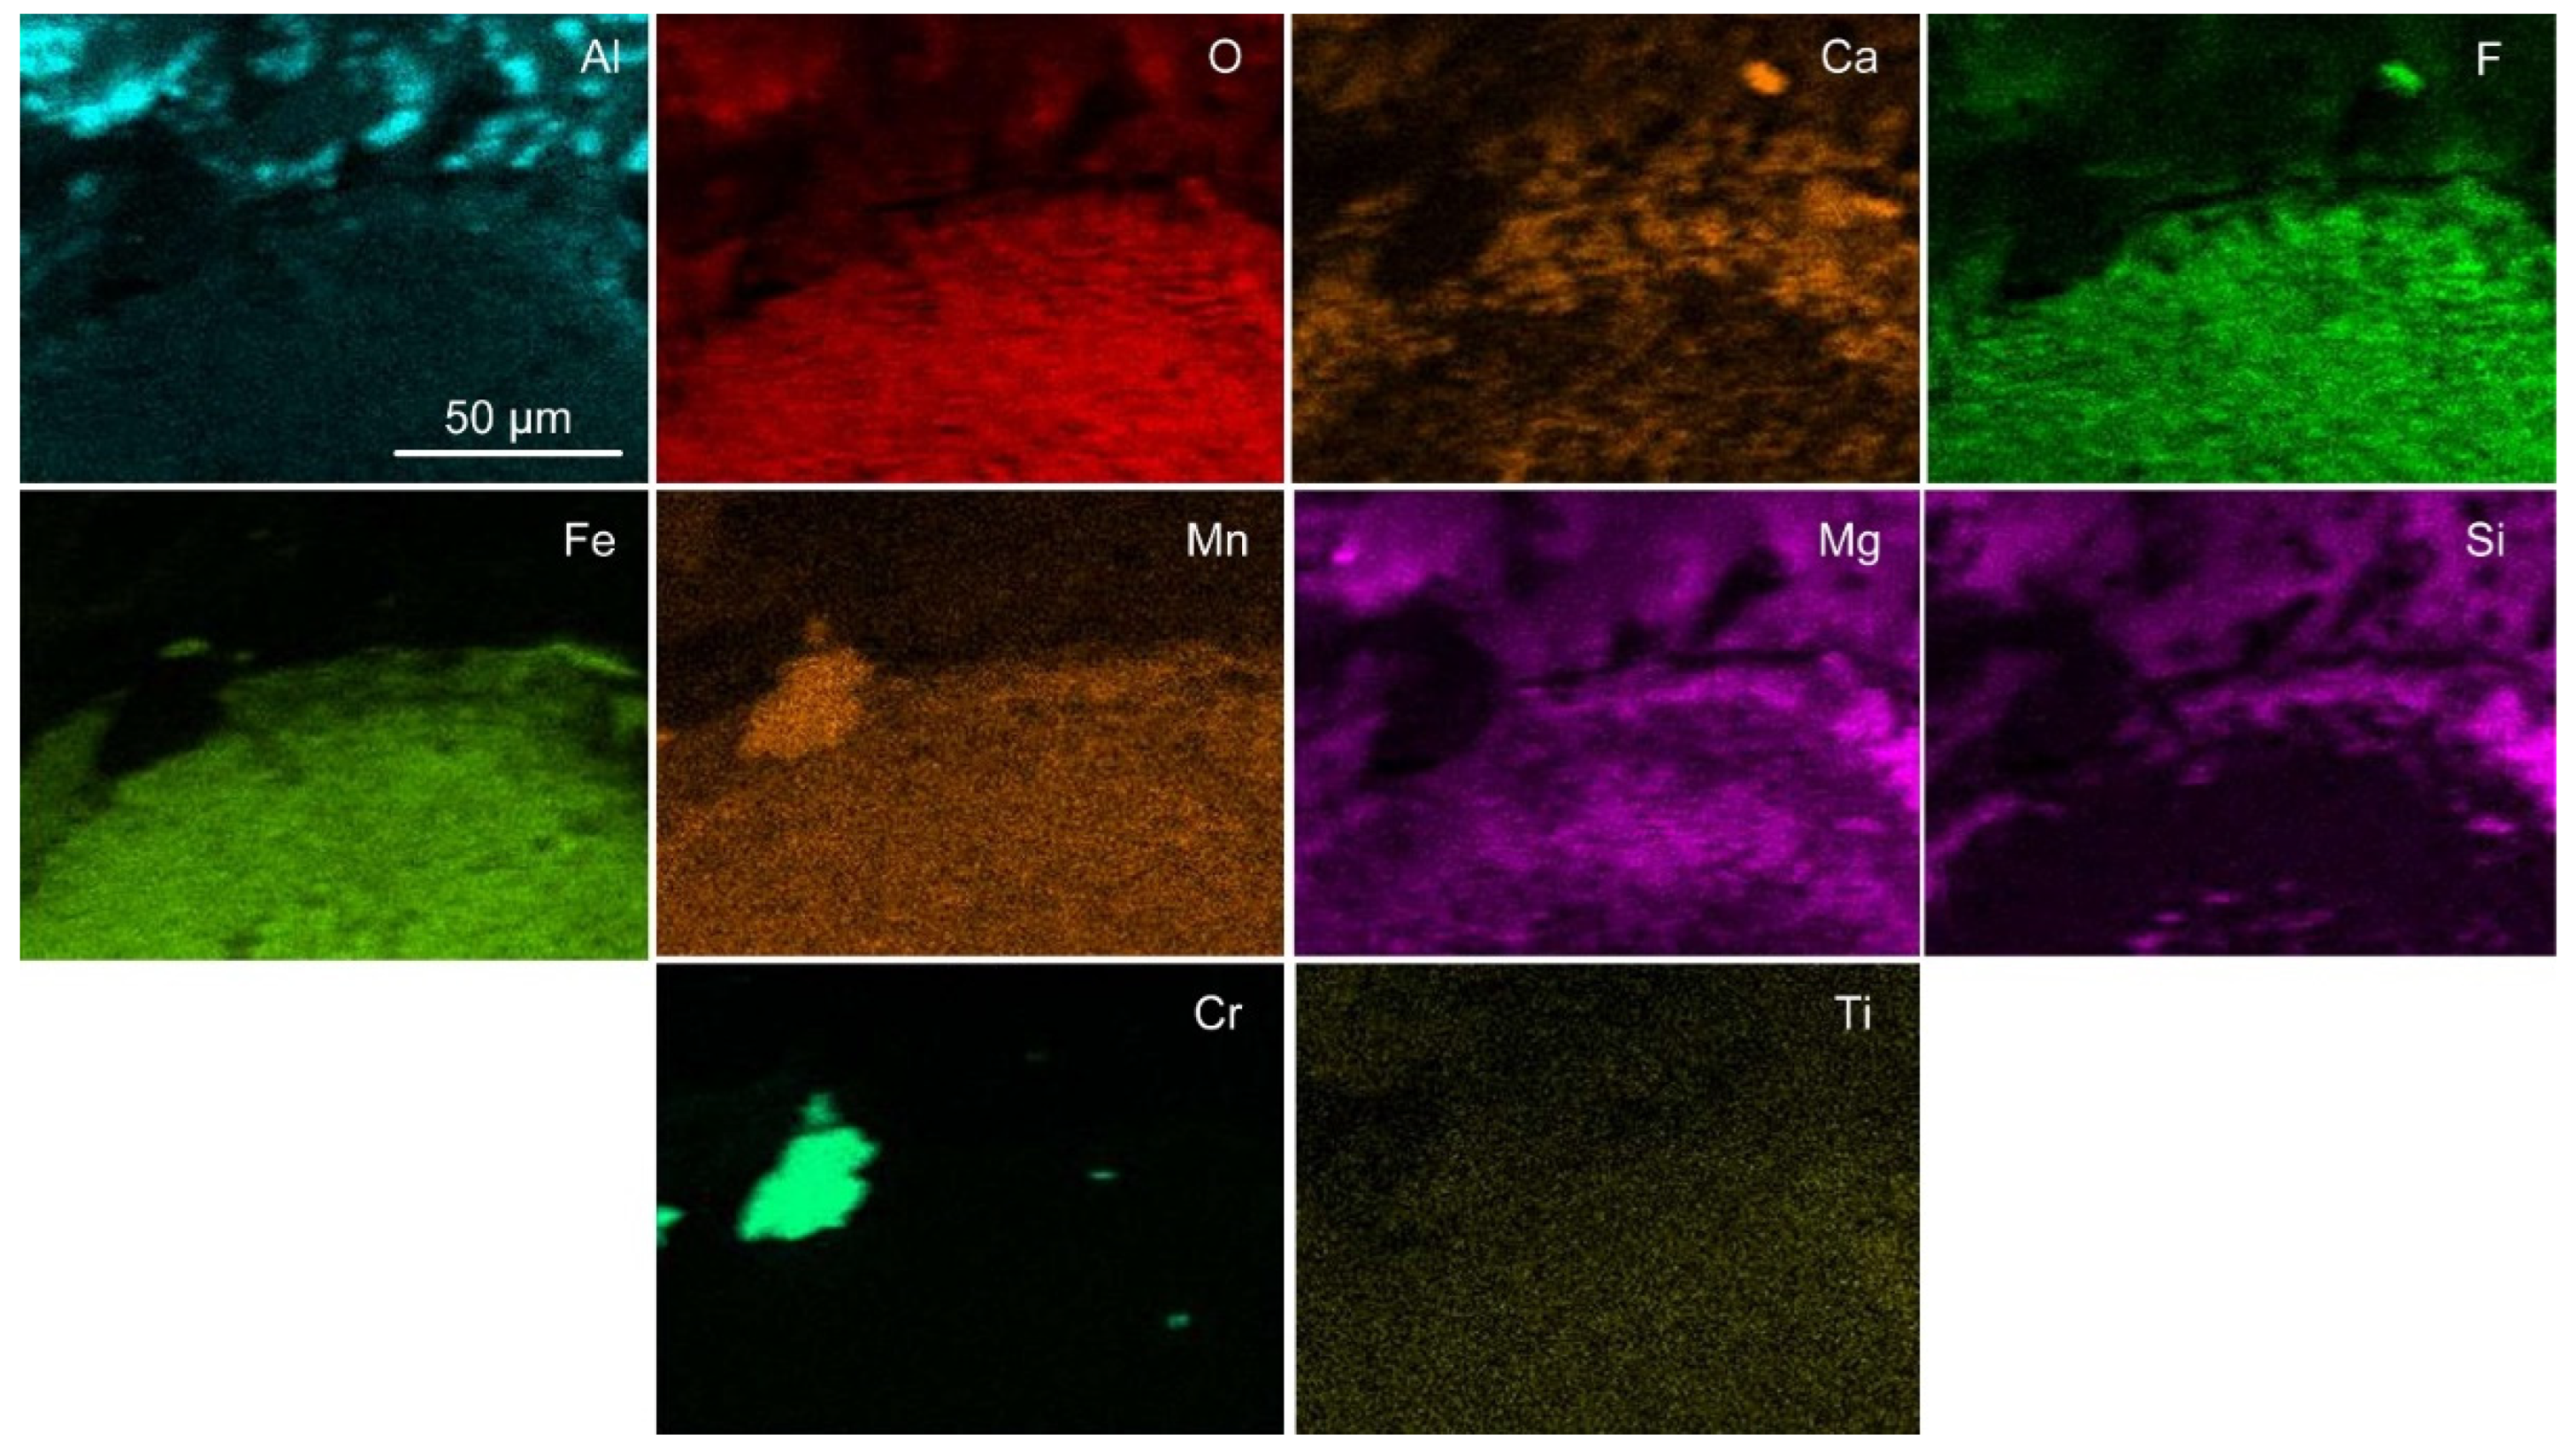
Figure 6 displays a BSE (backscattered electron) image of the 3D slag surface in MP4 post-weld slag at increasing magnifications. The domed shape with circular patches within is also observed, similar to the features in
Figure 2a in the MP2 post-weld slag. The EDX map of
Figure 6b as shown in
Figure 7 indicates similar element distribution to
Figure 3, except that Si is also incorporated in the circular area as Fe-Mn-Si-O-F oxy-fluoride with distinct chromium-rich spots scattered throughout. The surrounding dome walls consist of an Al-Ca-Mg-Si-Mn-Na-Ti-O-F oxy-fluoride matrix.
Figure 6c shows porous particles that appear similar to the chromium-rich particle in
Figure 5. The EDX map of
Figure 6c as displayed in
Figure 8 clearly shows that the porous particles are chromium rich and contain some Mn.
Figure 6e displays a high magnification BSE image of an area of the porous chromium-rich particle surface.
From the EDX map in
Figure 8, only one copper-rich sphere is observed at the top of the mapped area.
Figure 6d displays the higher magnification of the area (d) in the square marked at the edge of the circular area in
Figure 6c. It is seen that the edge of the circular area is not a distinct boundary, but instead contains a network of small spheres interconnected with nano-scale diameter strands as displayed at high magnification in
Figure 6f. The EDX map of
Figure 6f is displayed in
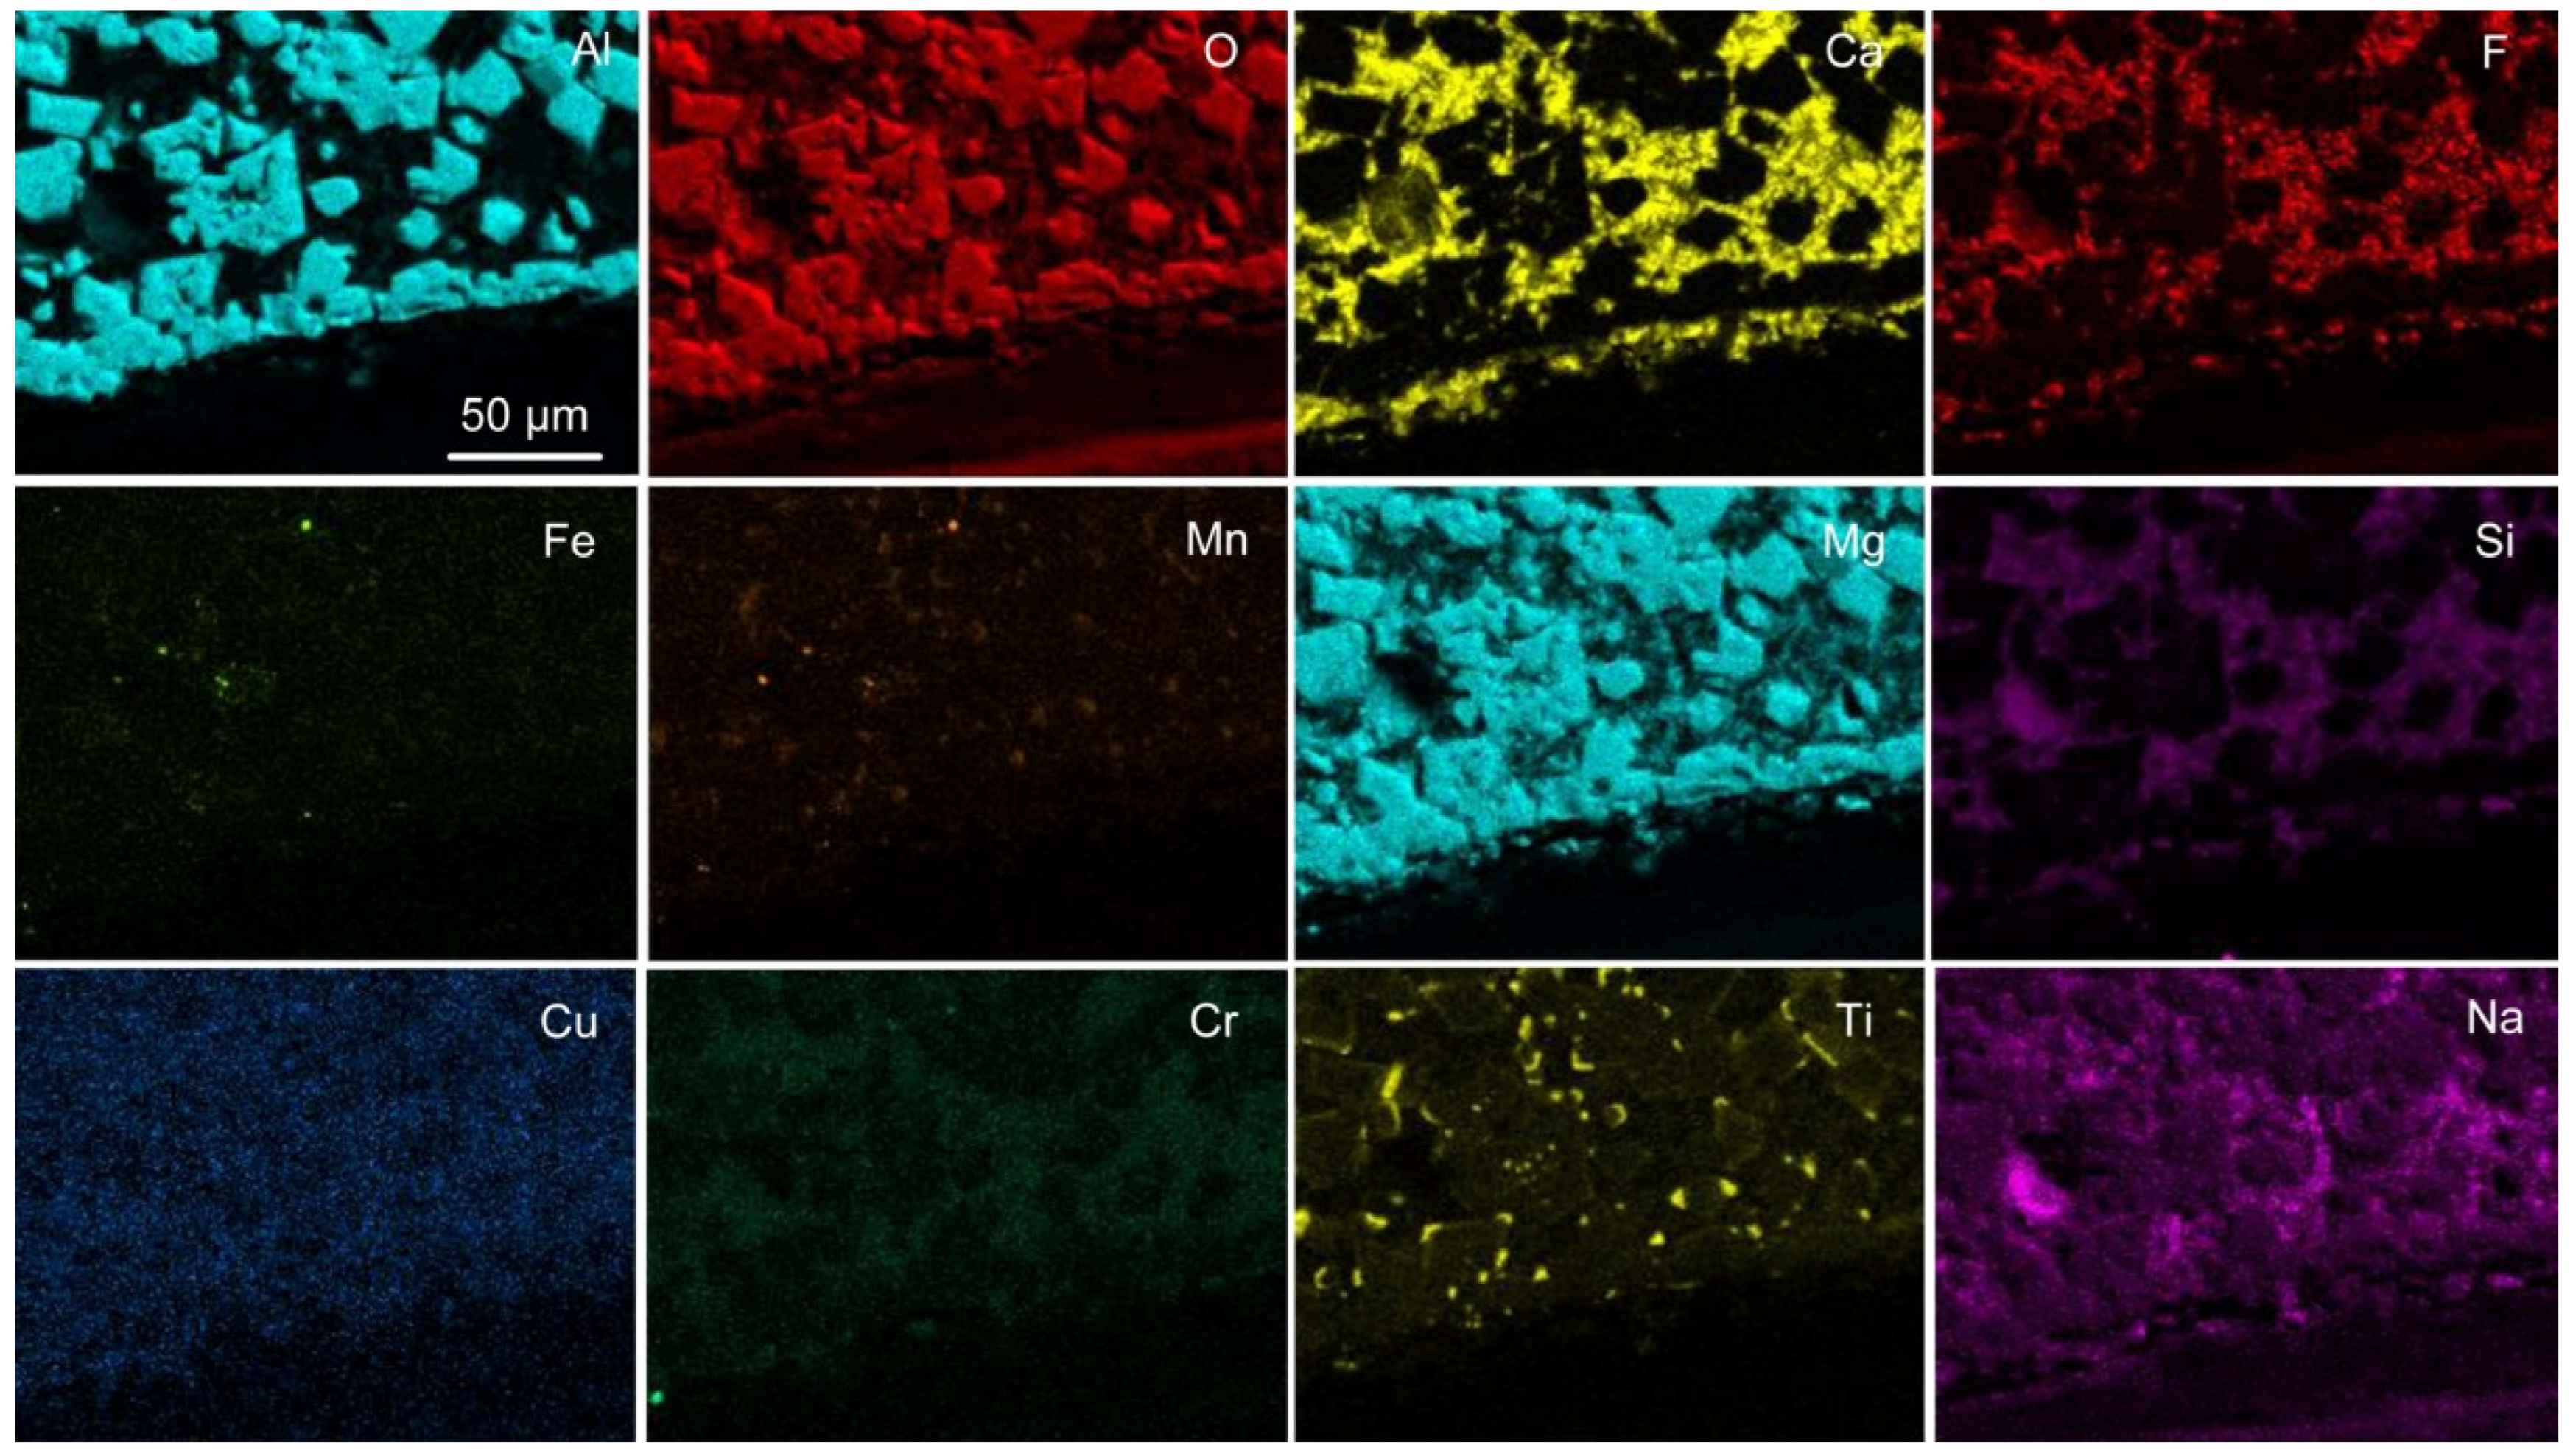
Figure 9, and it shows that the spheres are of the order of 0.5 µm consisting of Al-Ca-Fe-Mn-Mg-Si-Cu-Cr-Ti-O-F oxy-fluoride. The small size of the spheres and the smaller-sized connecting strands indicate that these features formed from vapour.
Figure 10 displays a BSE (backscattered electron) image of the 3D slag surface in MP5 post-weld slag with a domed shape feature, similar to the dome features in
Figure 2a and
Figure 6a in post-weld slags MP2 and MP4, respectively. The EDS map for
Figure 10b, an area inside the dome, shows Fe-Mn-O-F oxy-fluoride spheres embedded in the Al-Ca-Mg-Si-Na-Ti-O-F oxy-fluoride matrix (see
Figure 11). Chromium is scattered throughout the area as chromium-rich spots, similar to the appearance of chromium in
Figure 3 and
Figure 7 in post-weld slags MP2 and MP4, respectively. Here, in
Figure 11, the chromium is associated with copper in some spots.
Figure 12 shows the EDS map of the sphere in
Figure 10c. The element distribution confirms that the sphere consists of Fe-Mn-fluoride with a Ti halo. The presence of oxygen in this sphere is not clear from the EDS map.
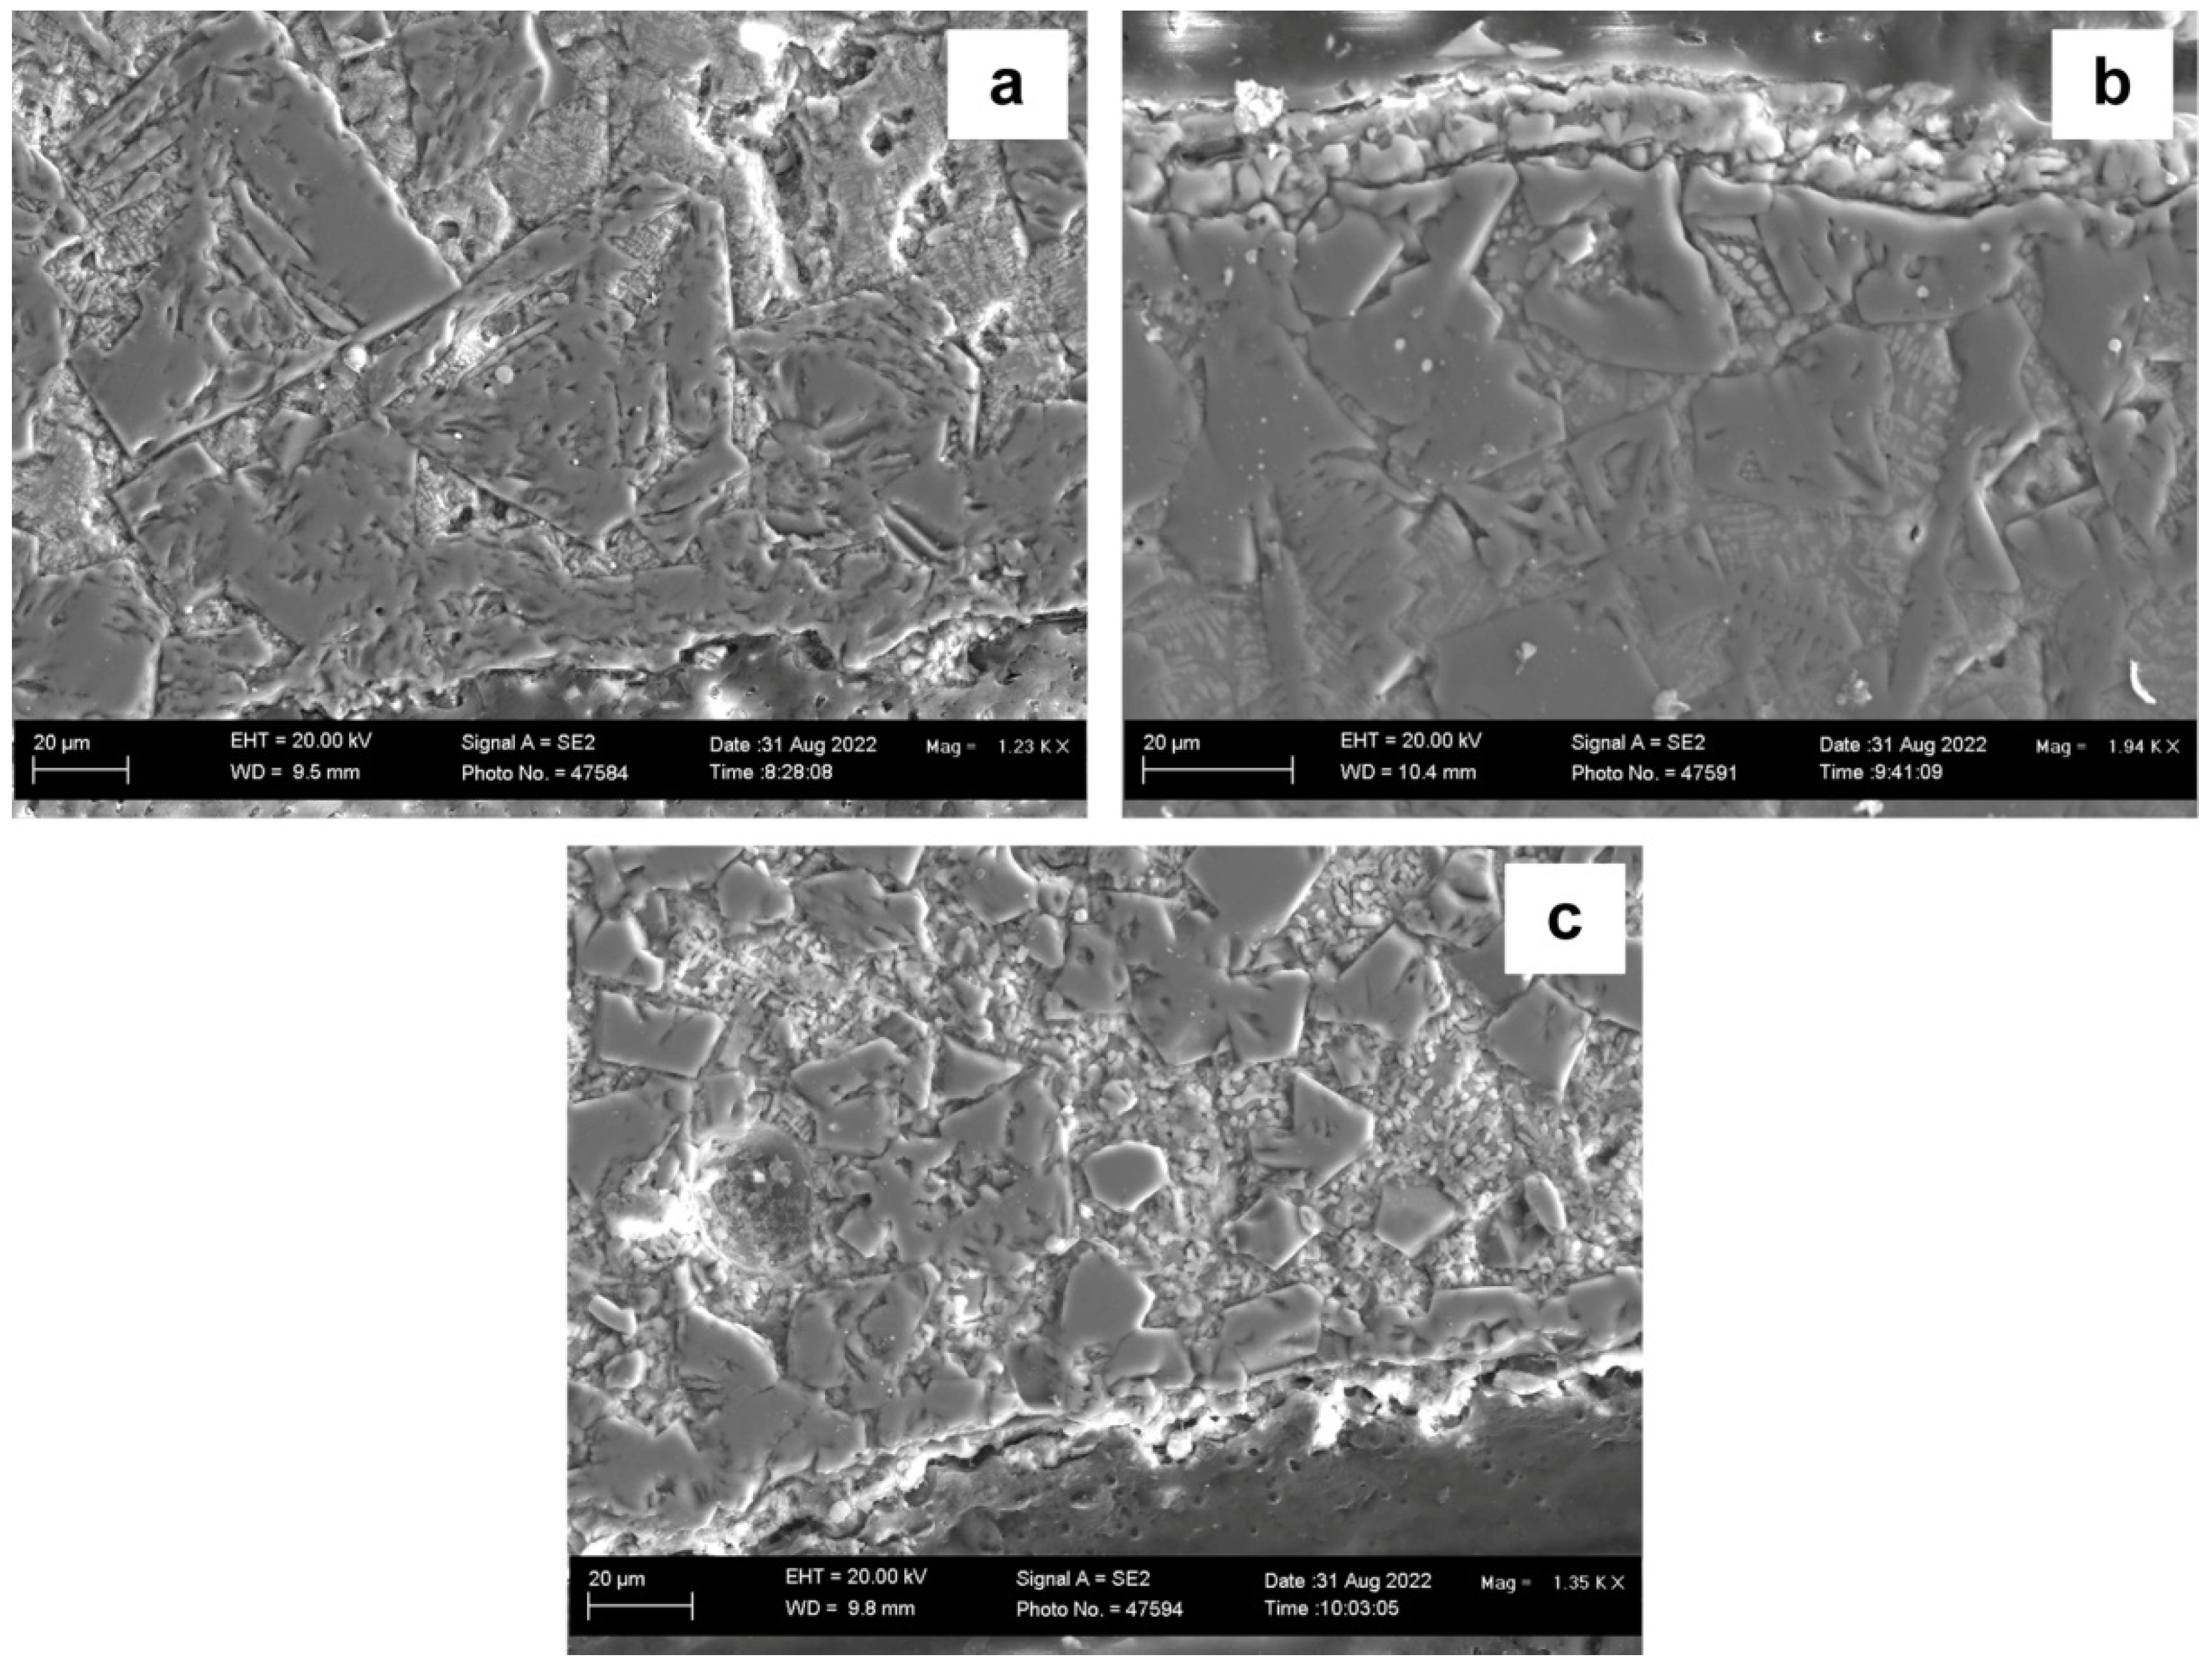
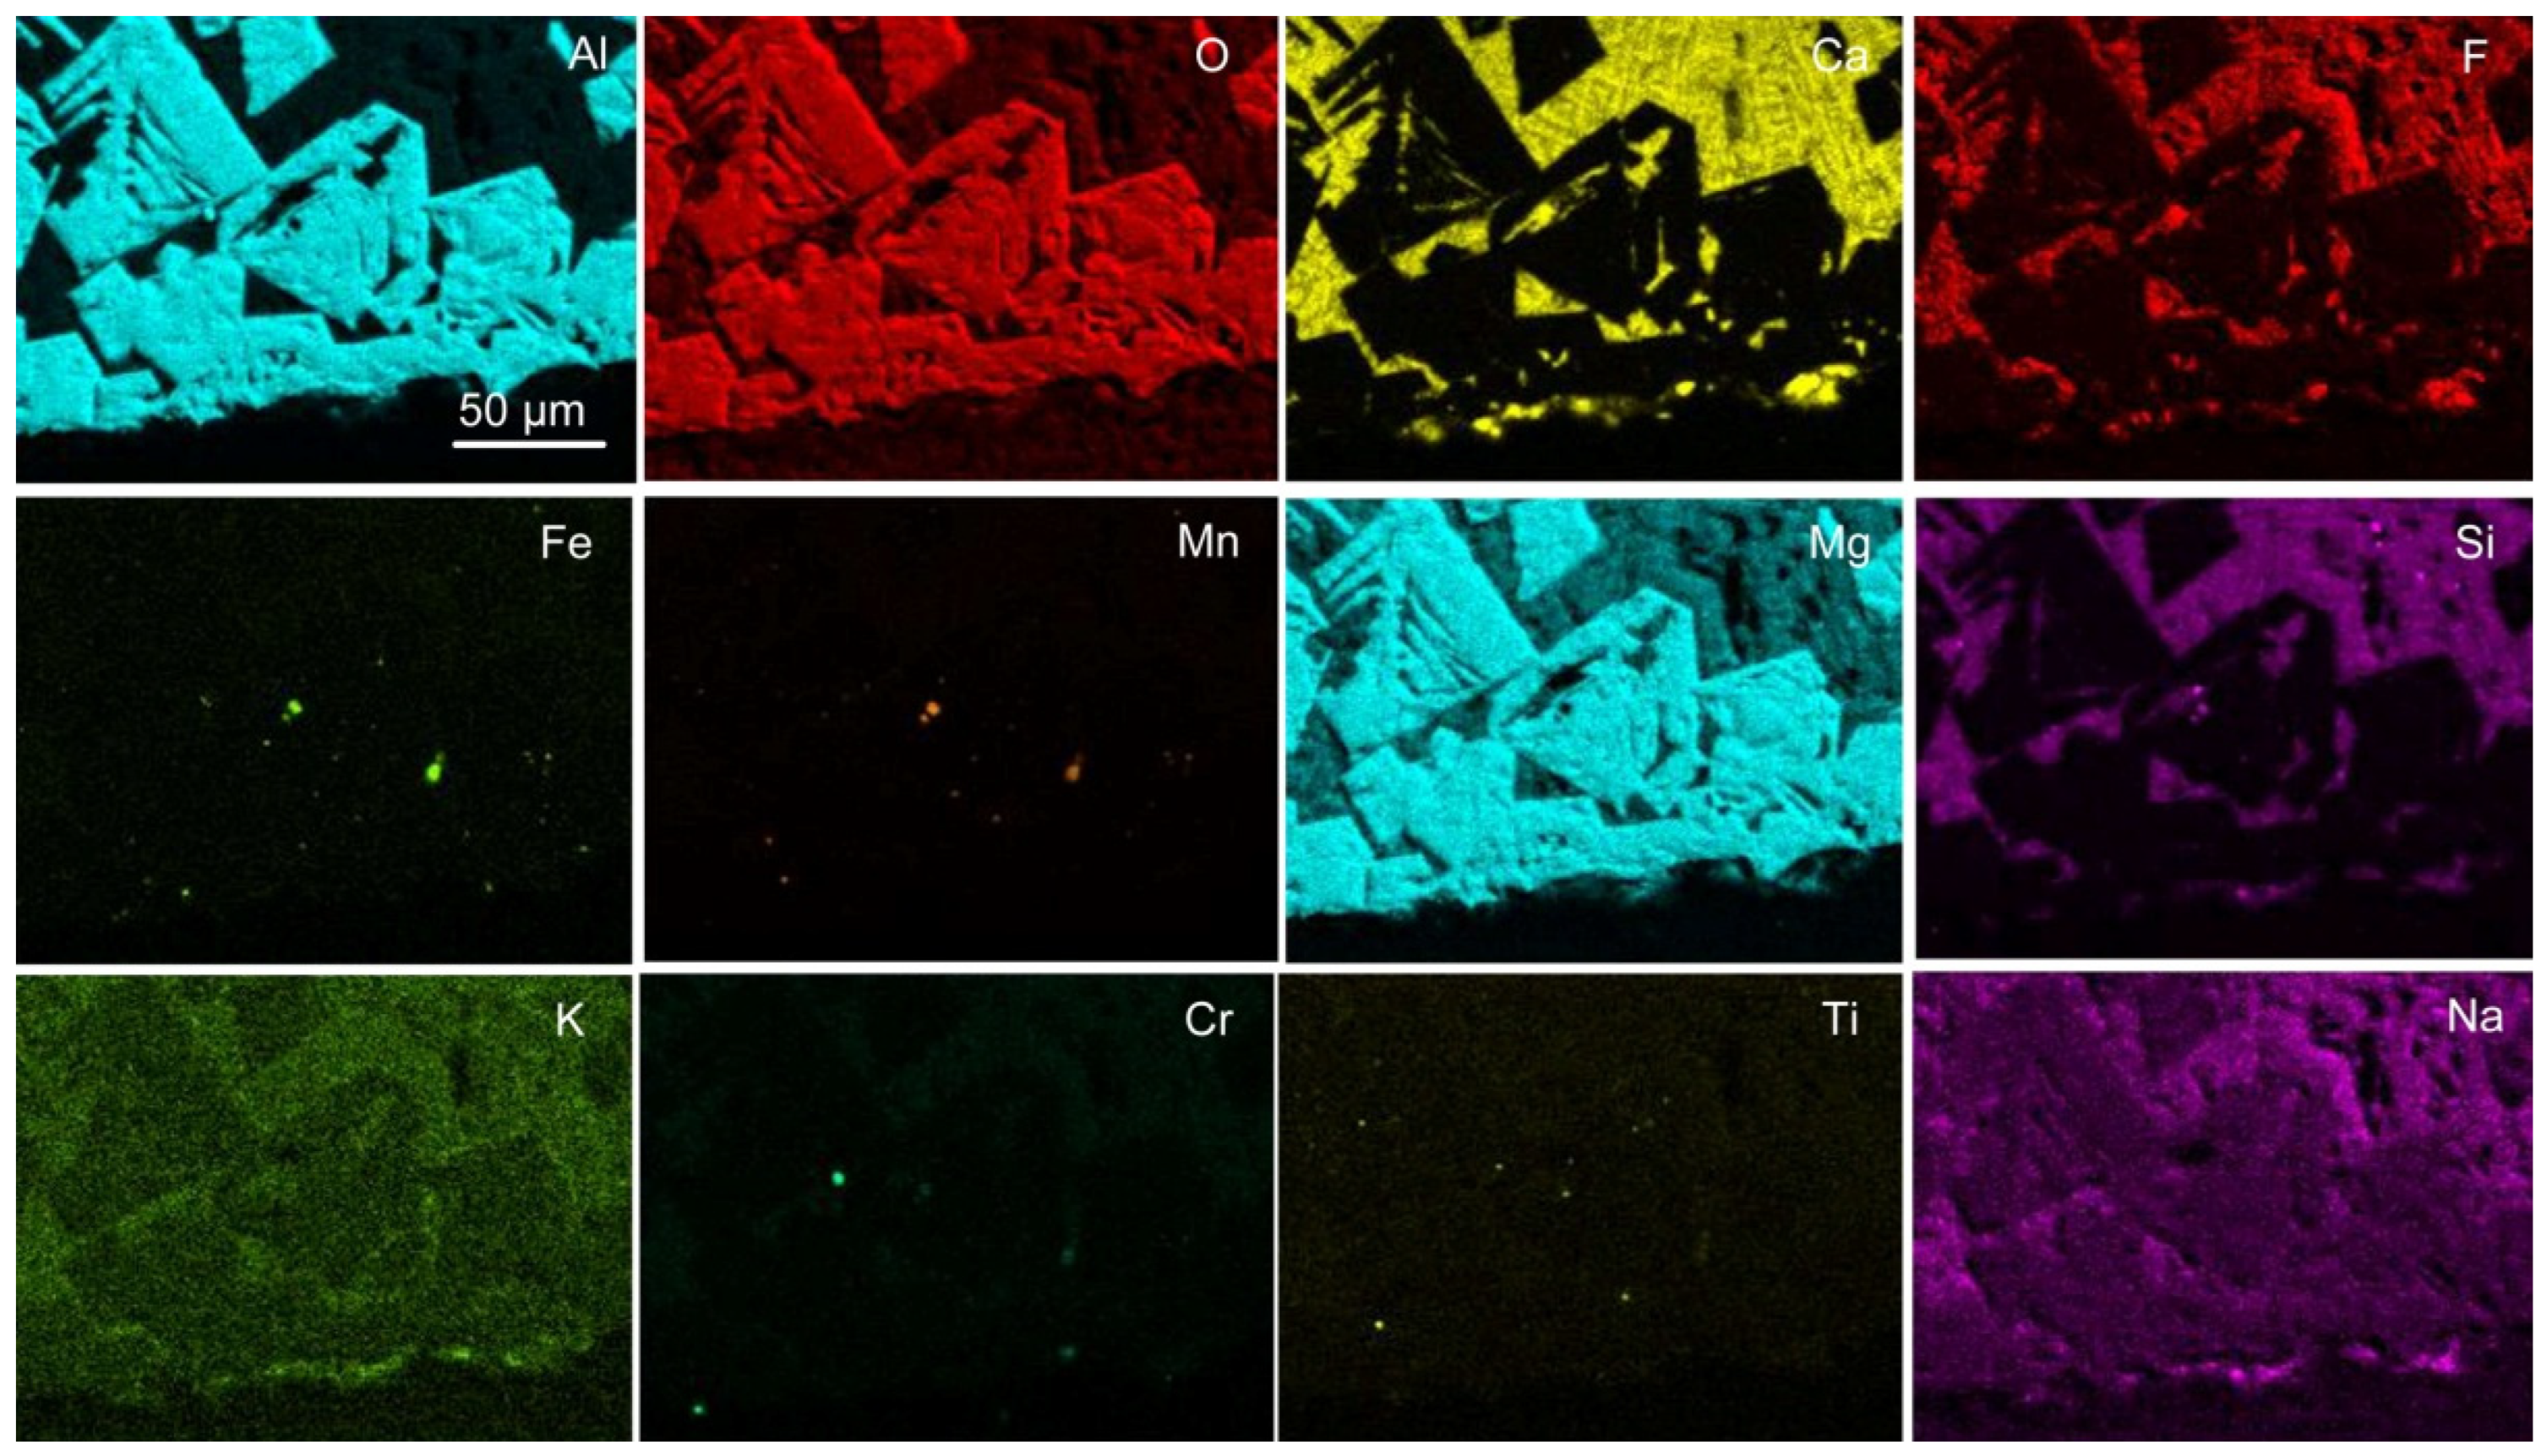
Two-dimensional samples of the post-weld slags were also prepared for comparison to the 3D samples as discussed above. The BSE images of the post-weld slags are shown in
Figure 13, and the corresponding EDS maps of each slag sample are shown in
Figure 14,
Figure 15 and
Figure 16. The areas in
Figure 13 were selected to be at the weld metal–slag interface to check for the presence of chromium close to this reaction interface. The phases present in each post-weld slag sample corresponds to the XRD analysis in
Figure 1 and similar slag samples analysed previously [
31]. Spinel crystals are embedded in the Al-Mg-Ca-Si-Ti-Mn-Fe-K-Na-O-F oxy-fluoride matrix. From the EDS map in
Figure 14 it appears that some Cr may be contained in the matrix oxy-fluoride. Tiny specks of metallic Al, Fe, Mn, Cr and Ti appear in
Figure 14. Similar phase chemistry is seen in
Figure 15 and
Figure 16, the EDS maps for the MP4 and MP5 slags. In addition, copper is present at low concentrations in the oxy-fluoride matrix phase in MP4 and MP5 slags and titanium appear at the edges of the spinel crystals as identified previously [
31].
Of importance is that the features seen in the 3D slag samples as displayed in the dome structures in
Figure 2,
Figure 3,
Figure 4,
Figure 5,
Figure 6,
Figure 7,
Figure 8,
Figure 9,
Figure 10,
Figure 11 and
Figure 12 are not seen in the 2D samples in
Figure 13,
Figure 14,
Figure 15 and
Figure 16. Therefore, the 3D features allow for enhanced interpretation of reactions in the SAW process as modified by the addition of Al-Cr-Cu-Ti unconstrained metal powders.
4. Discussion
The slag sample EDX maps confirm that the addition of aluminium metal powder as de-oxidiser functioned as intended because little chromium appears as oxidised chromium. Consequently, the distribution of chromium in the slag samples is low. Copper and titanium also have low distribution in the slags. Copper has low affinity for oxygen and is therefore expected to remain as metallic copper, as displayed in
Figure 8. However, it seems that copper may be incorporated into the oxy-fluoride matrix, as seen in
Figure 14 and
Figure 15. Titanium has a high affinity for oxygen and is easily oxidised, similar to chromium, but only some titanium was observed in the slag samples without extensive incorporation into the slag phases.
The chemical behaviour of chromium is to vaporise as chromium metal, not as chromium fluoride and not as distinct chromium oxides. In
Figure 4 the chromium metal is associated with manganese metal and the SEM analysis of this particle in
Table 4 indicates that oxygen and magnesium may also be present. The oxygen and magnesium in the analysis may be due to the fact that the size of the chromium-rich particle analysed is small at 20 µm. This small size of 20 µm is similar to the interaction volume of the SEM analysis technique so that the underlying material may also be analysed. Chromium presents in this agglomerated particle as shown in
Figure 2c and
Figure 6c.
Figure 6f displays the formation of vapour droplets of small size, about 0.5 µm, linked by nano-scale diameter strands. According to the EDX maps for
Figure 6f, as displayed in
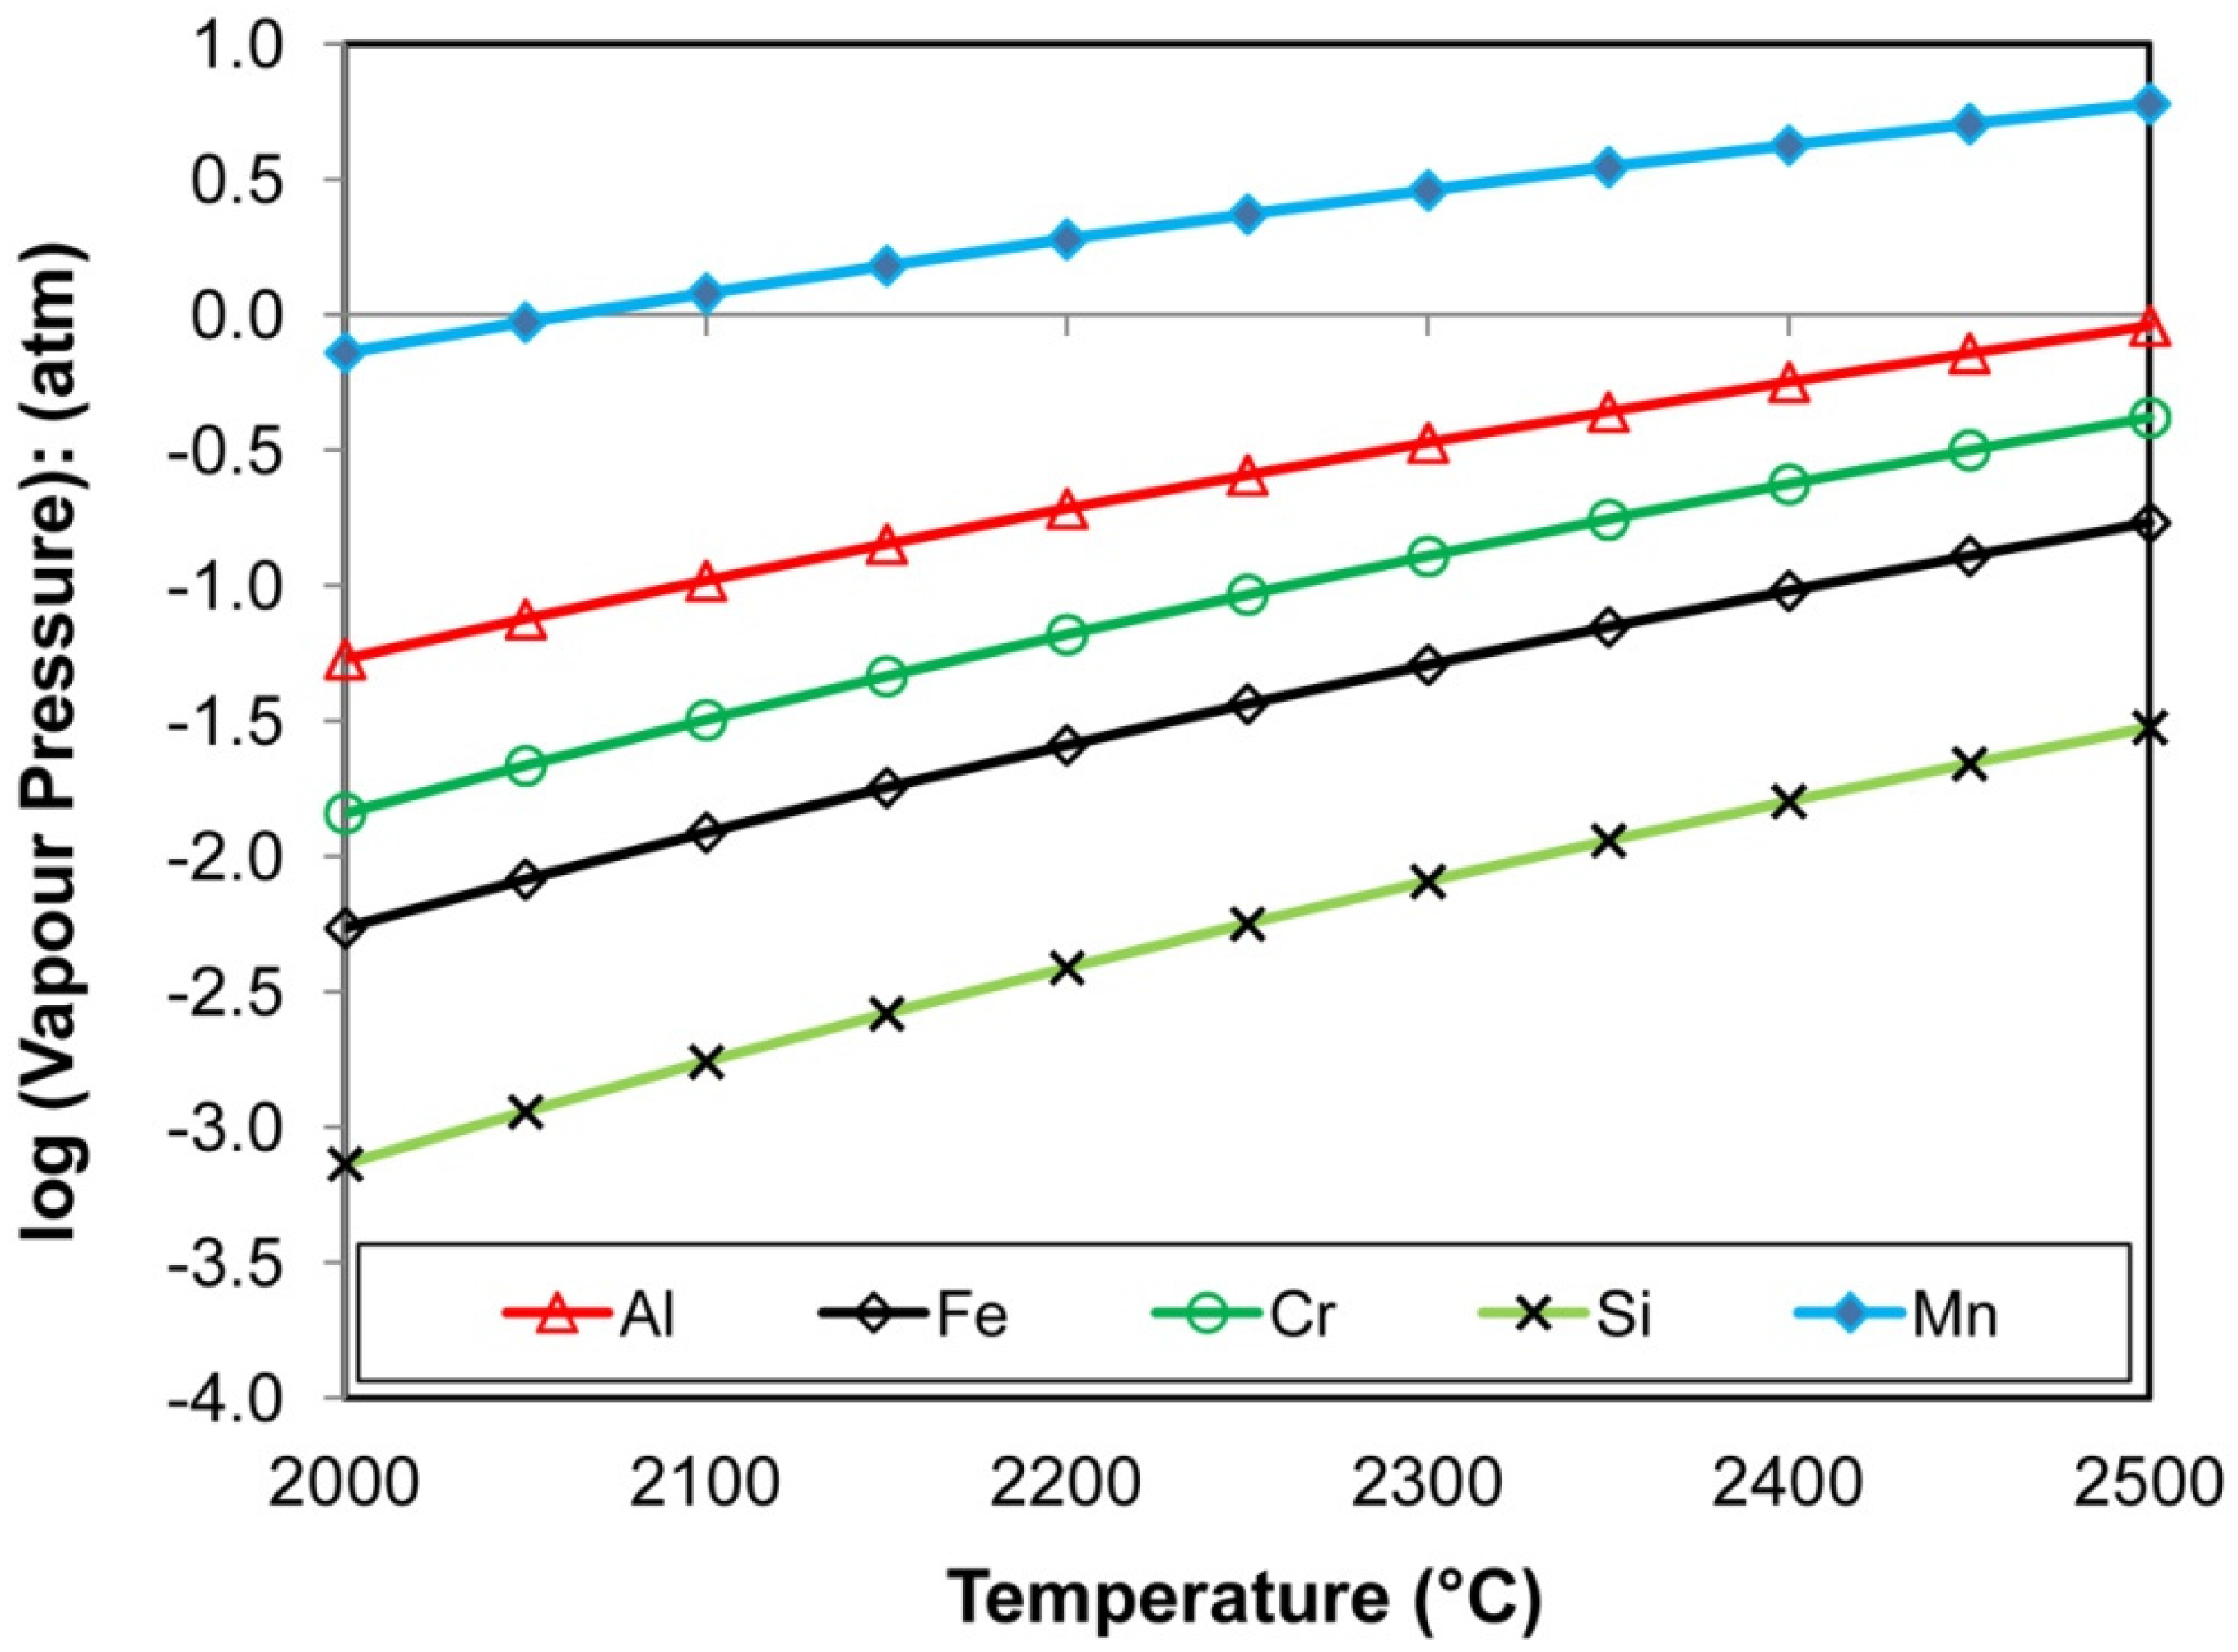
Figure 9, the vapour particles contain all of the elements present in the flux and those added as unconstrained metal powders to the process, namely the oxy-fluoride composition containing Al-Ca-Fe-Mn-Mg-Si-Cu-Cr-Ti-O-F. The vaporisation curves in
Figure 17 show that the order of ease of vaporisation is from highest to lowest: Mn, Al, Cr, Fe, and Si. The curves in
Figure 17 were calculated in the thermochemical software, FactSage 7.3 [
34,
35].
Predominance diagrams were calculated to investigate the chemical behaviour of chromium metal powder in the presence of aluminium metal powder in SAW. Calculations were made in FactSage 7.3 thermochemical software [
34,
35].
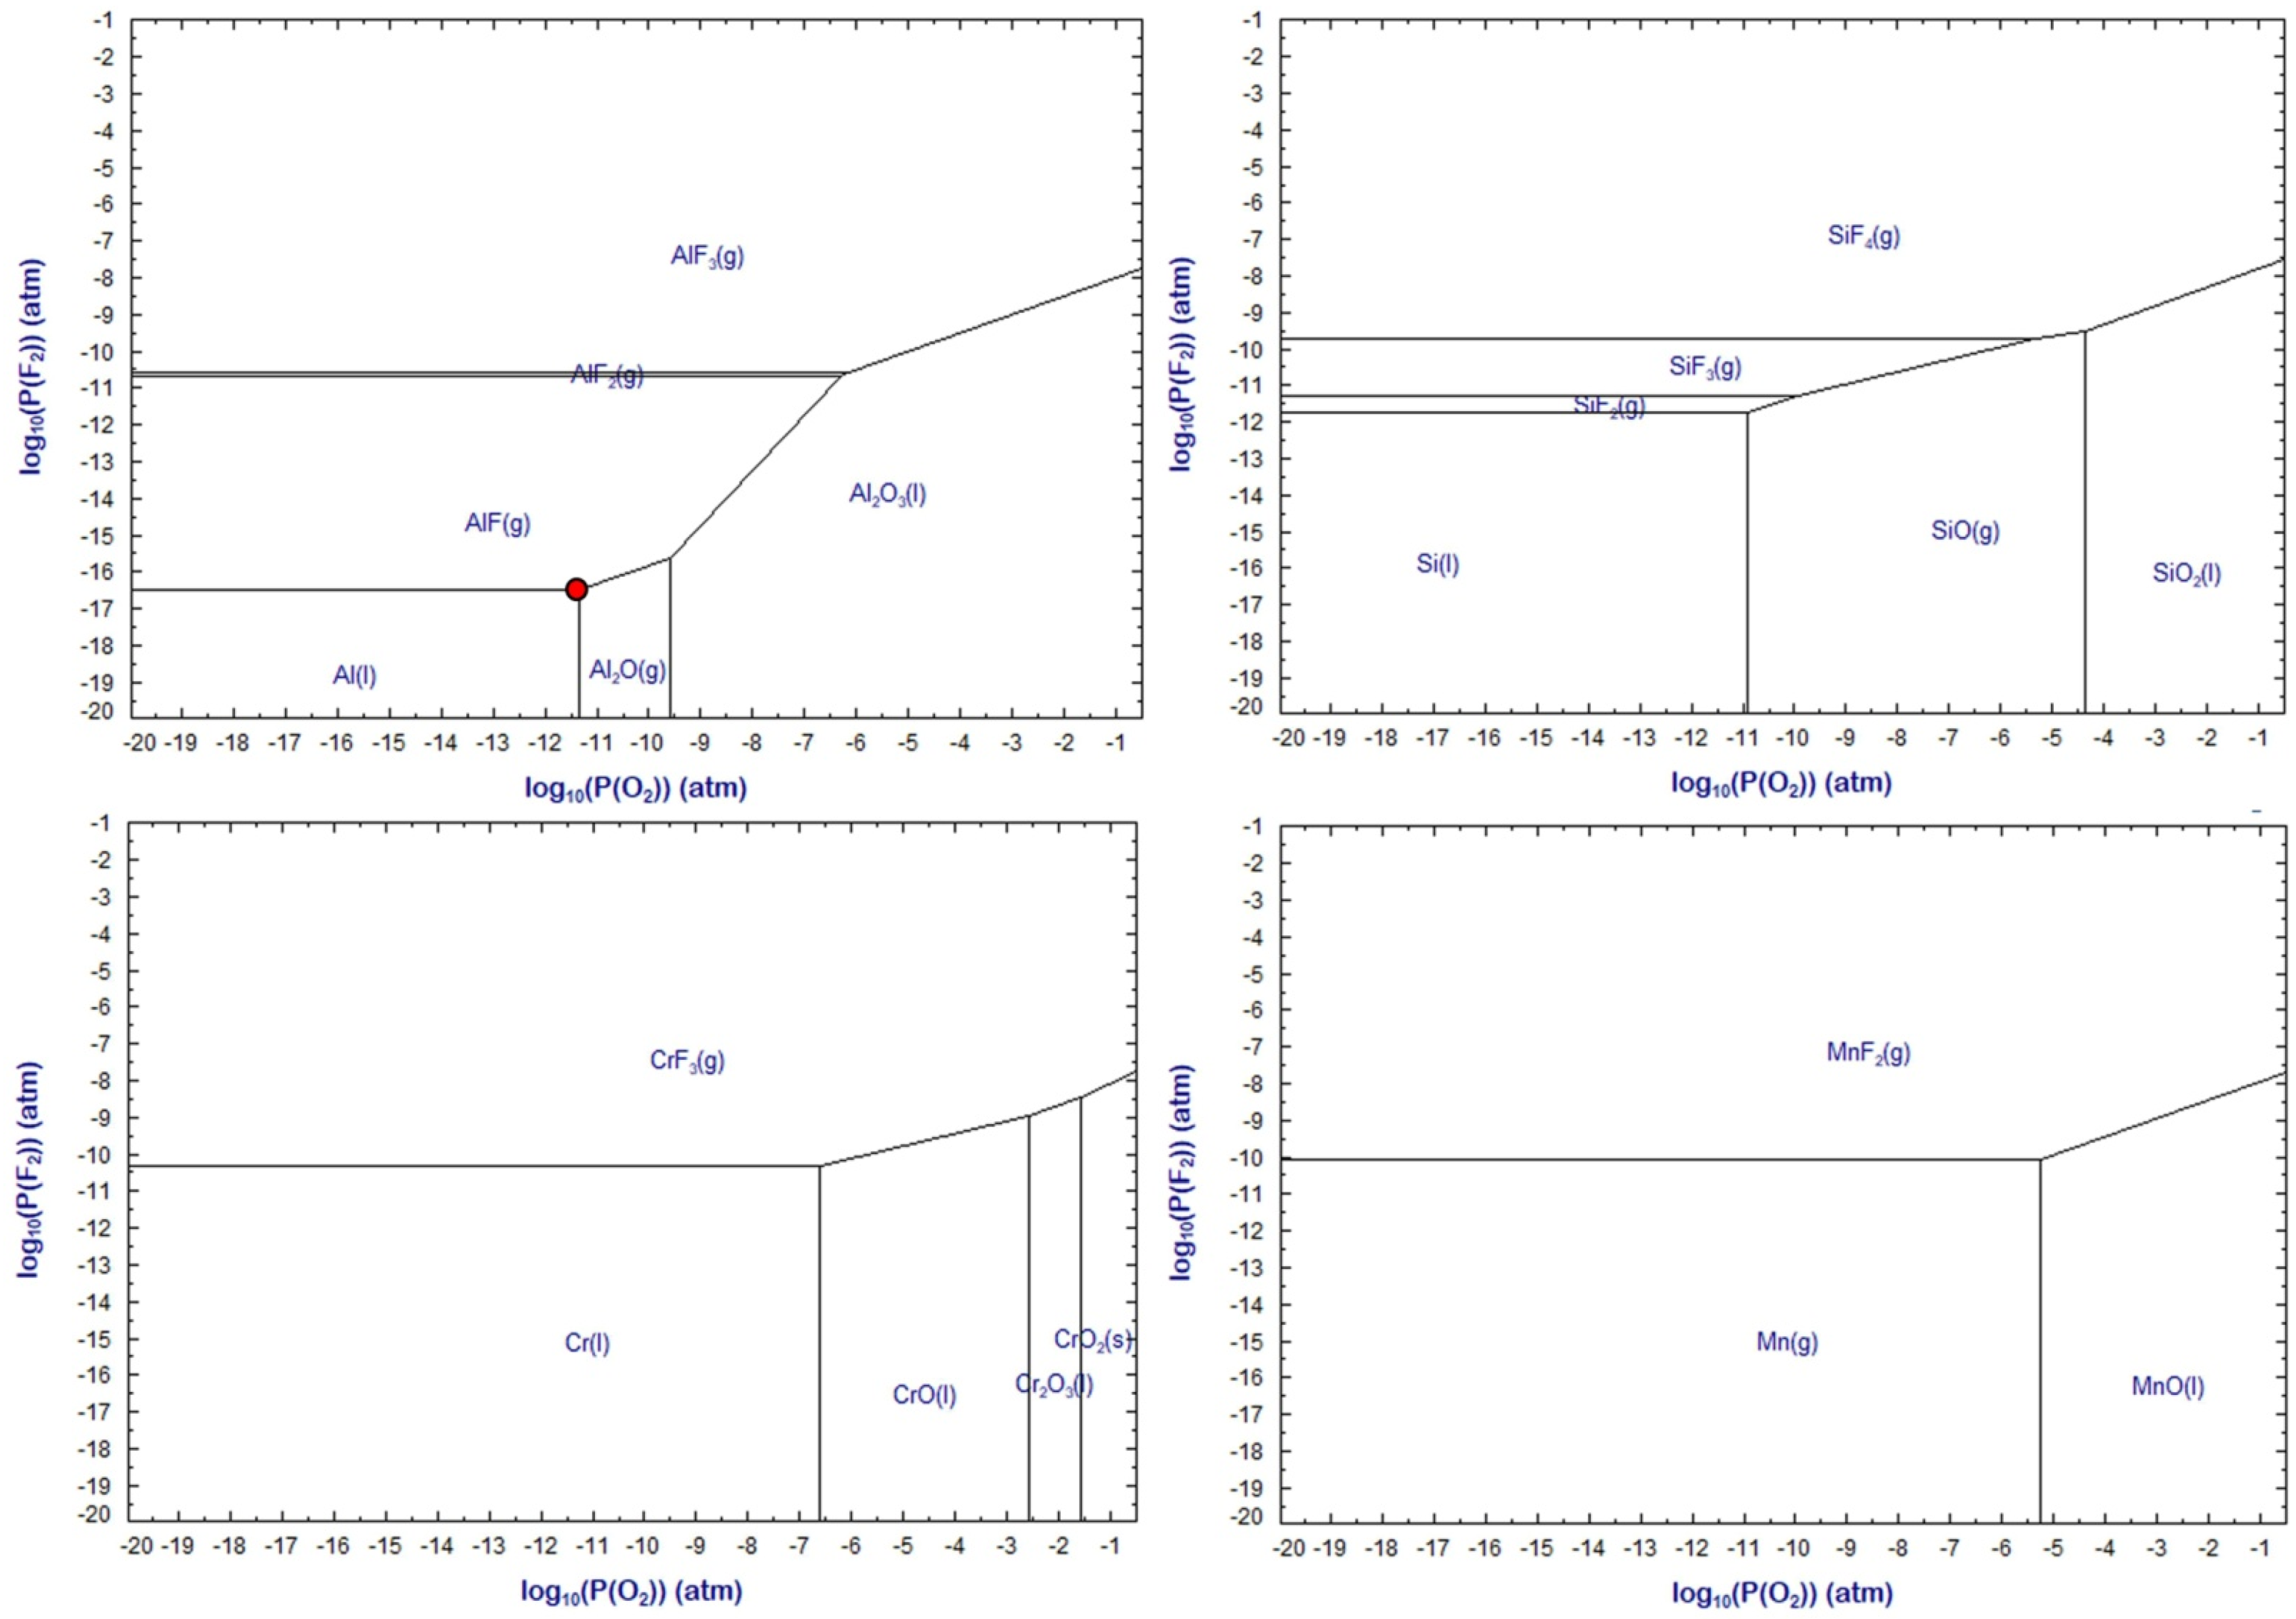
Figure 18 and
Figure 19 show predominance diagrams for the systems M-O-F with M = Al, Cr, Mn, and Si at 2000 °C and 2500 °C, respectively. It is seen in
Figure 18 that because of the presence of aluminium added as de-oxidiser element, the oxygen partial pressure (P
O2) is lowered to 10
−14.5 atm, or (log P
O2) = −14.5, when the three component equilibrium is enforced between Al(l), Al
2O
3(s), and AlF(g). This equilibrium point is marked as the red dot in
Figure 18. Comparison of this equilibrium point to the predominance diagram for Cr shows that the P
O2 is maintained sufficiently low so that chromium is maintained as metallic chromium without oxidation to its oxides. Furthermore, if the fluorine partial pressure (P
F2) is maintained low enough as indicated for the Al(l)-Al
2O
3(s)-AlF(g) equilibrium in
Figure 18 (red dot), then the formation of CrF
2(g) is inhibited.
The effect of increased temperature on the predominance areas can be seen by comparison of
Figure 18 and
Figure 19. The metal stability areas are enlarged to higher P
O2 and slightly higher P
F2. To be noted is that the values in
Figure 18 and
Figure 19 present equilibrium calculations, which may not precisely hold for the conditions in SAW. However, the predicted equilibrium trends are expected to hold since the temperatures in SAW are high at 2000 to 2500 °C. In the absence of aluminium as de-oxidiser element, the next best de-oxidiser element appears to be silicon. It is well-known that SiO
2 is very unstable in the arc plasma and dissociates to SiO(g) to release oxygen, which ends up in the weld metal and deteriorates the weld metal materials properties [
13]. Therefore, silicon as de-oxidiser in the SAW process is not viable.
In conclusion, the above results and discussion confirm the role of aluminium metal powder applied as de-oxidiser element in SAW. Aluminium enforces highly reducing conditions (low P
O2) to ensure that chromium is maintained as metallic chromium for maximum alloying of the weld metal. The discussion explains the reasons for the effect of aluminium in the arc cavity by maintaining the P
O2 and P
F2 at low values via the Al(l)-Al
2O
3(s)-AlF(g) equilibrium. These low values of P
O2 and P
F2 appear as the main factors in ensuring element transfer of the added metal powders to the weld metal and limiting oxide and fluoride gas loss of high oxygen affinity elements such as chromium. Besides the effect of aluminium in the gas phase, aluminium also ensures a reduced oxygen potential at the weld pool–slag interface where final reactions take place upon cooling of the weld pool to weld metal [
24,
25,
26,
27,
28,
29,
30].


