
Air Pollution Research Based on Spider Web and Parallel Continuous Particulate Monitoring—A Comparison Study Coupled with Identification of Sources

 , ,
, ,  ,
,  ,
,  ,
,  and
and 
Abstract
:1. Introduction
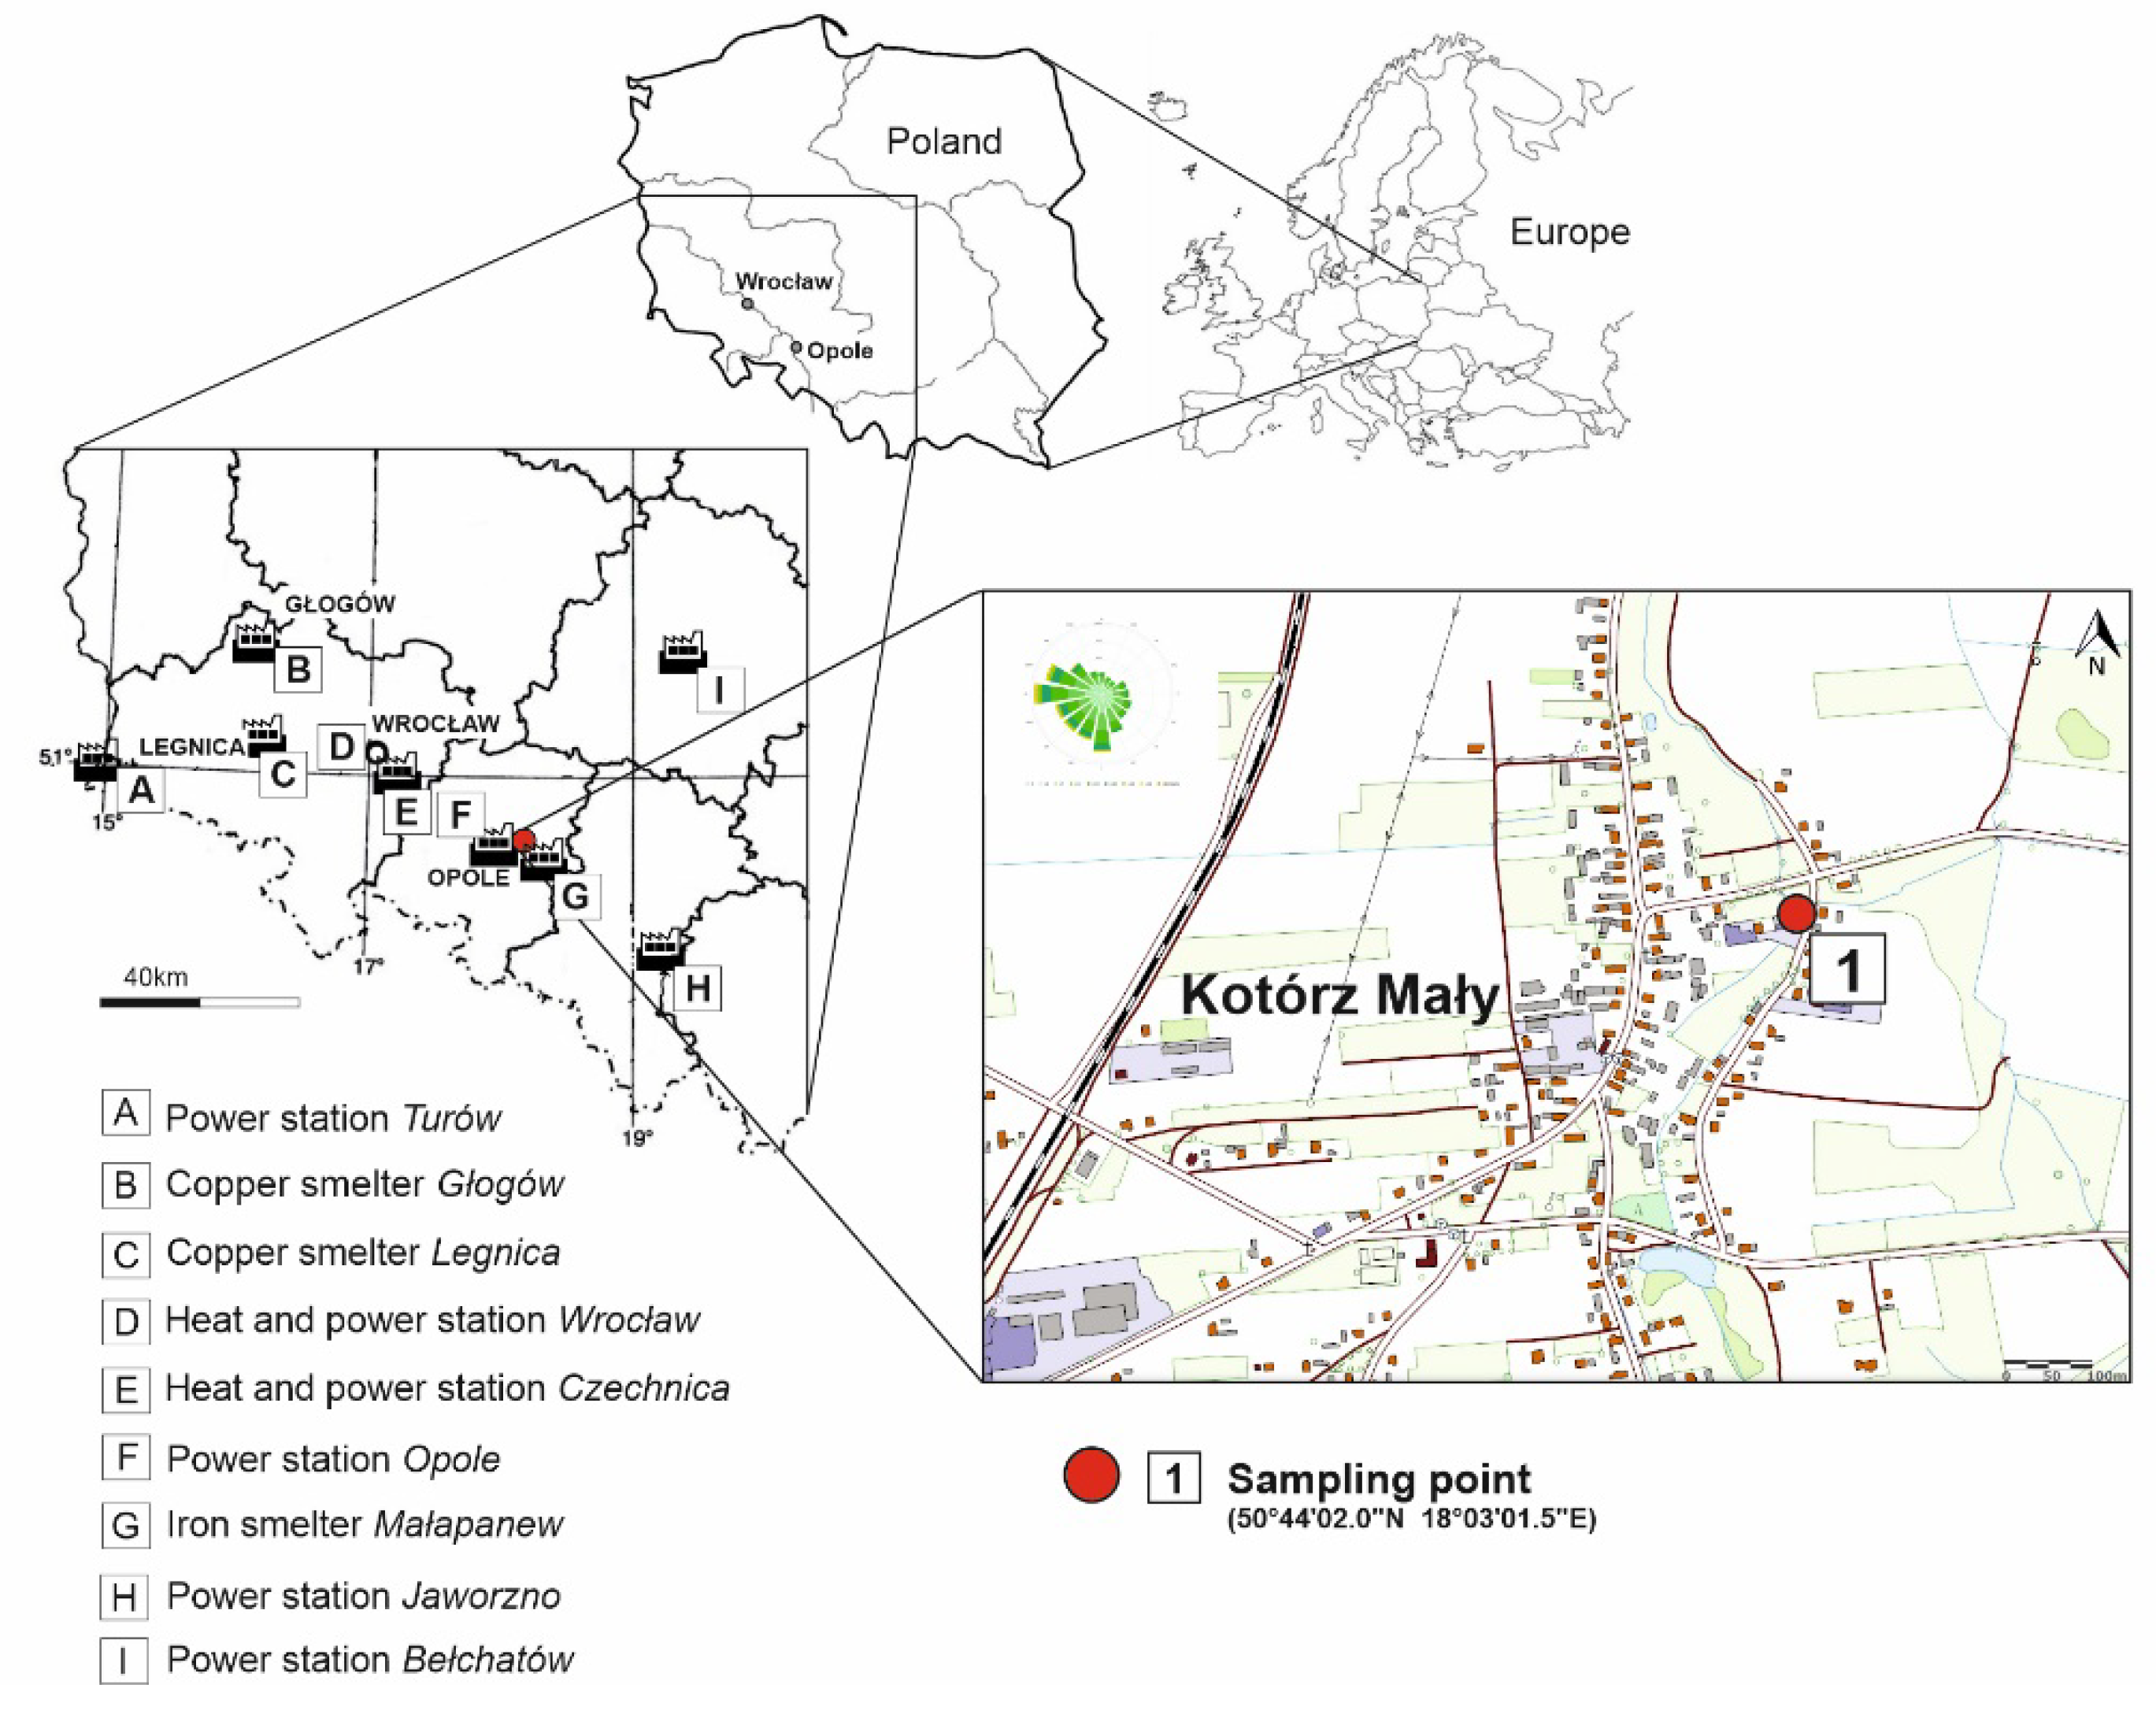
2. Study Area
3. Meteorological/Environmental Parameters
4. Methods
4.1. Monitoring with Continuous Particulate Monitor
Samples Collection
4.2. Air-Mass Back Trajectory Analysis
4.3. Enrichment Factor
4.4. The Concentrations of Metals in PM10
4.5. Biomonitoring with Spider Webs
Sampling Collection and Characteristic
4.6. Metal Concentration Analyses
4.7. Quality Assurance and Control
5. Results
5.1. Spider Webs Monitoring
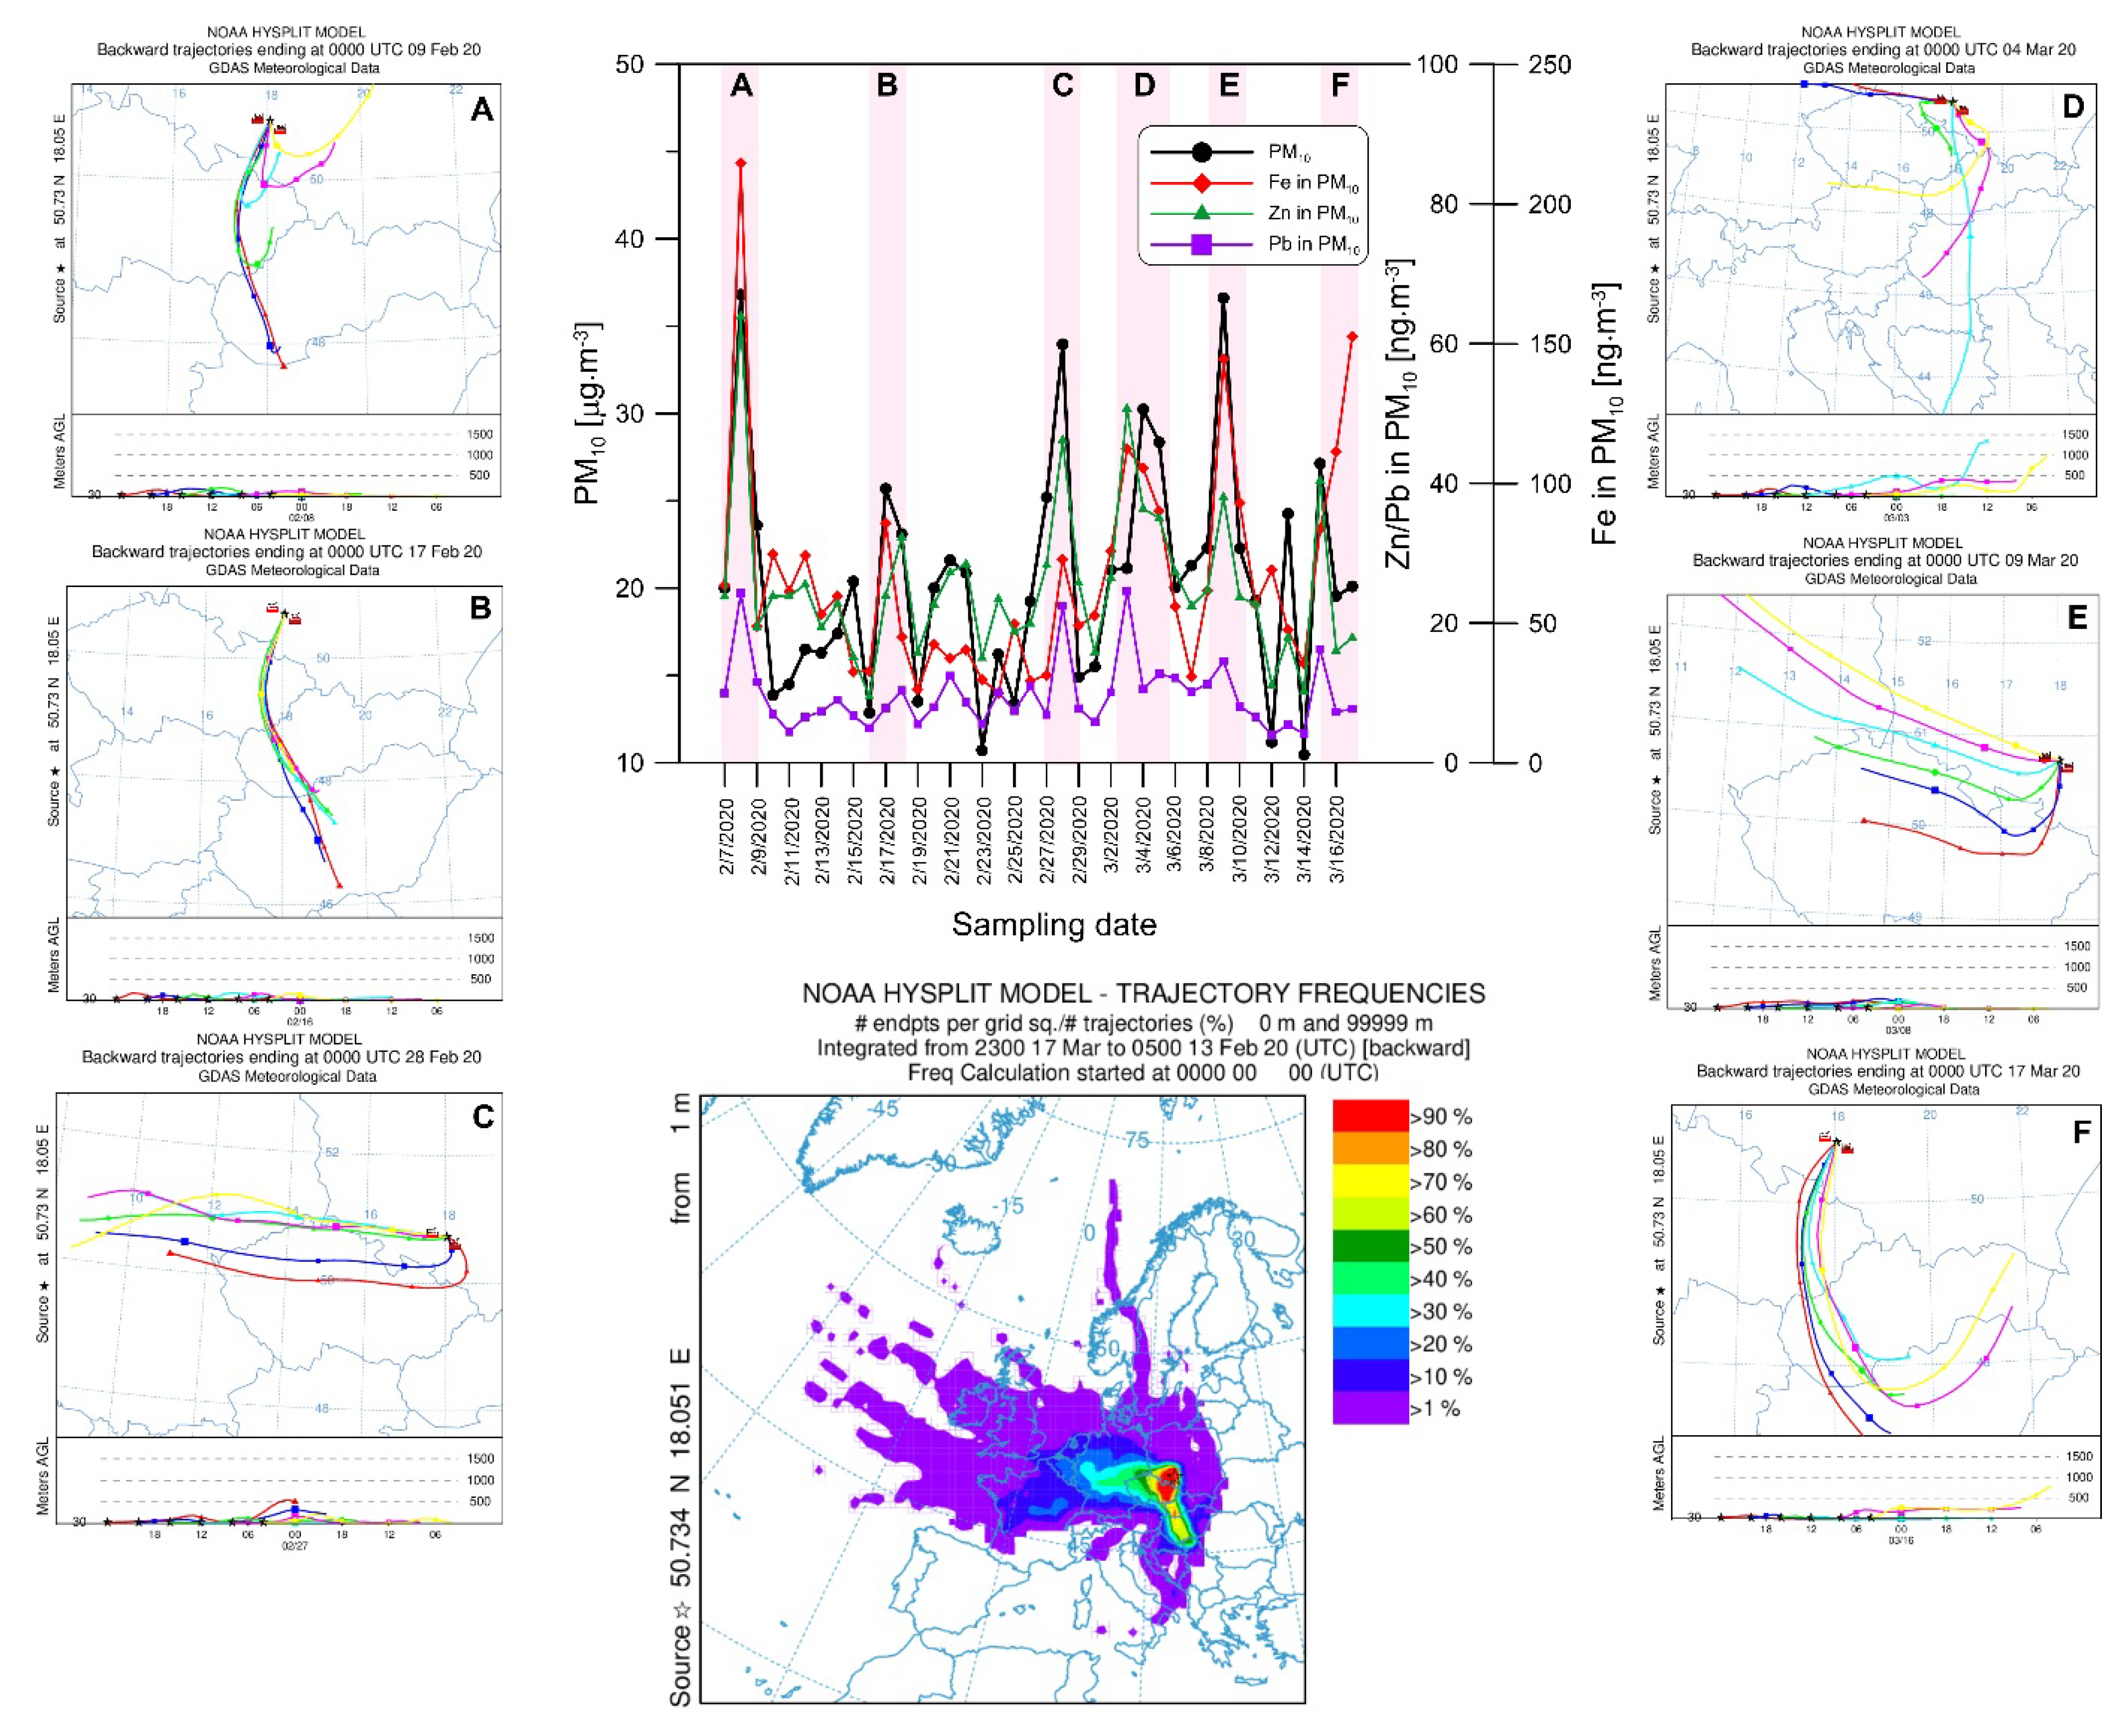
5.2. Continuous Particulate Monitor
5.3. Enrichment of Samples
5.4. Backward Trajectories and Trajectory Frequencies
6. Comparison of Methods
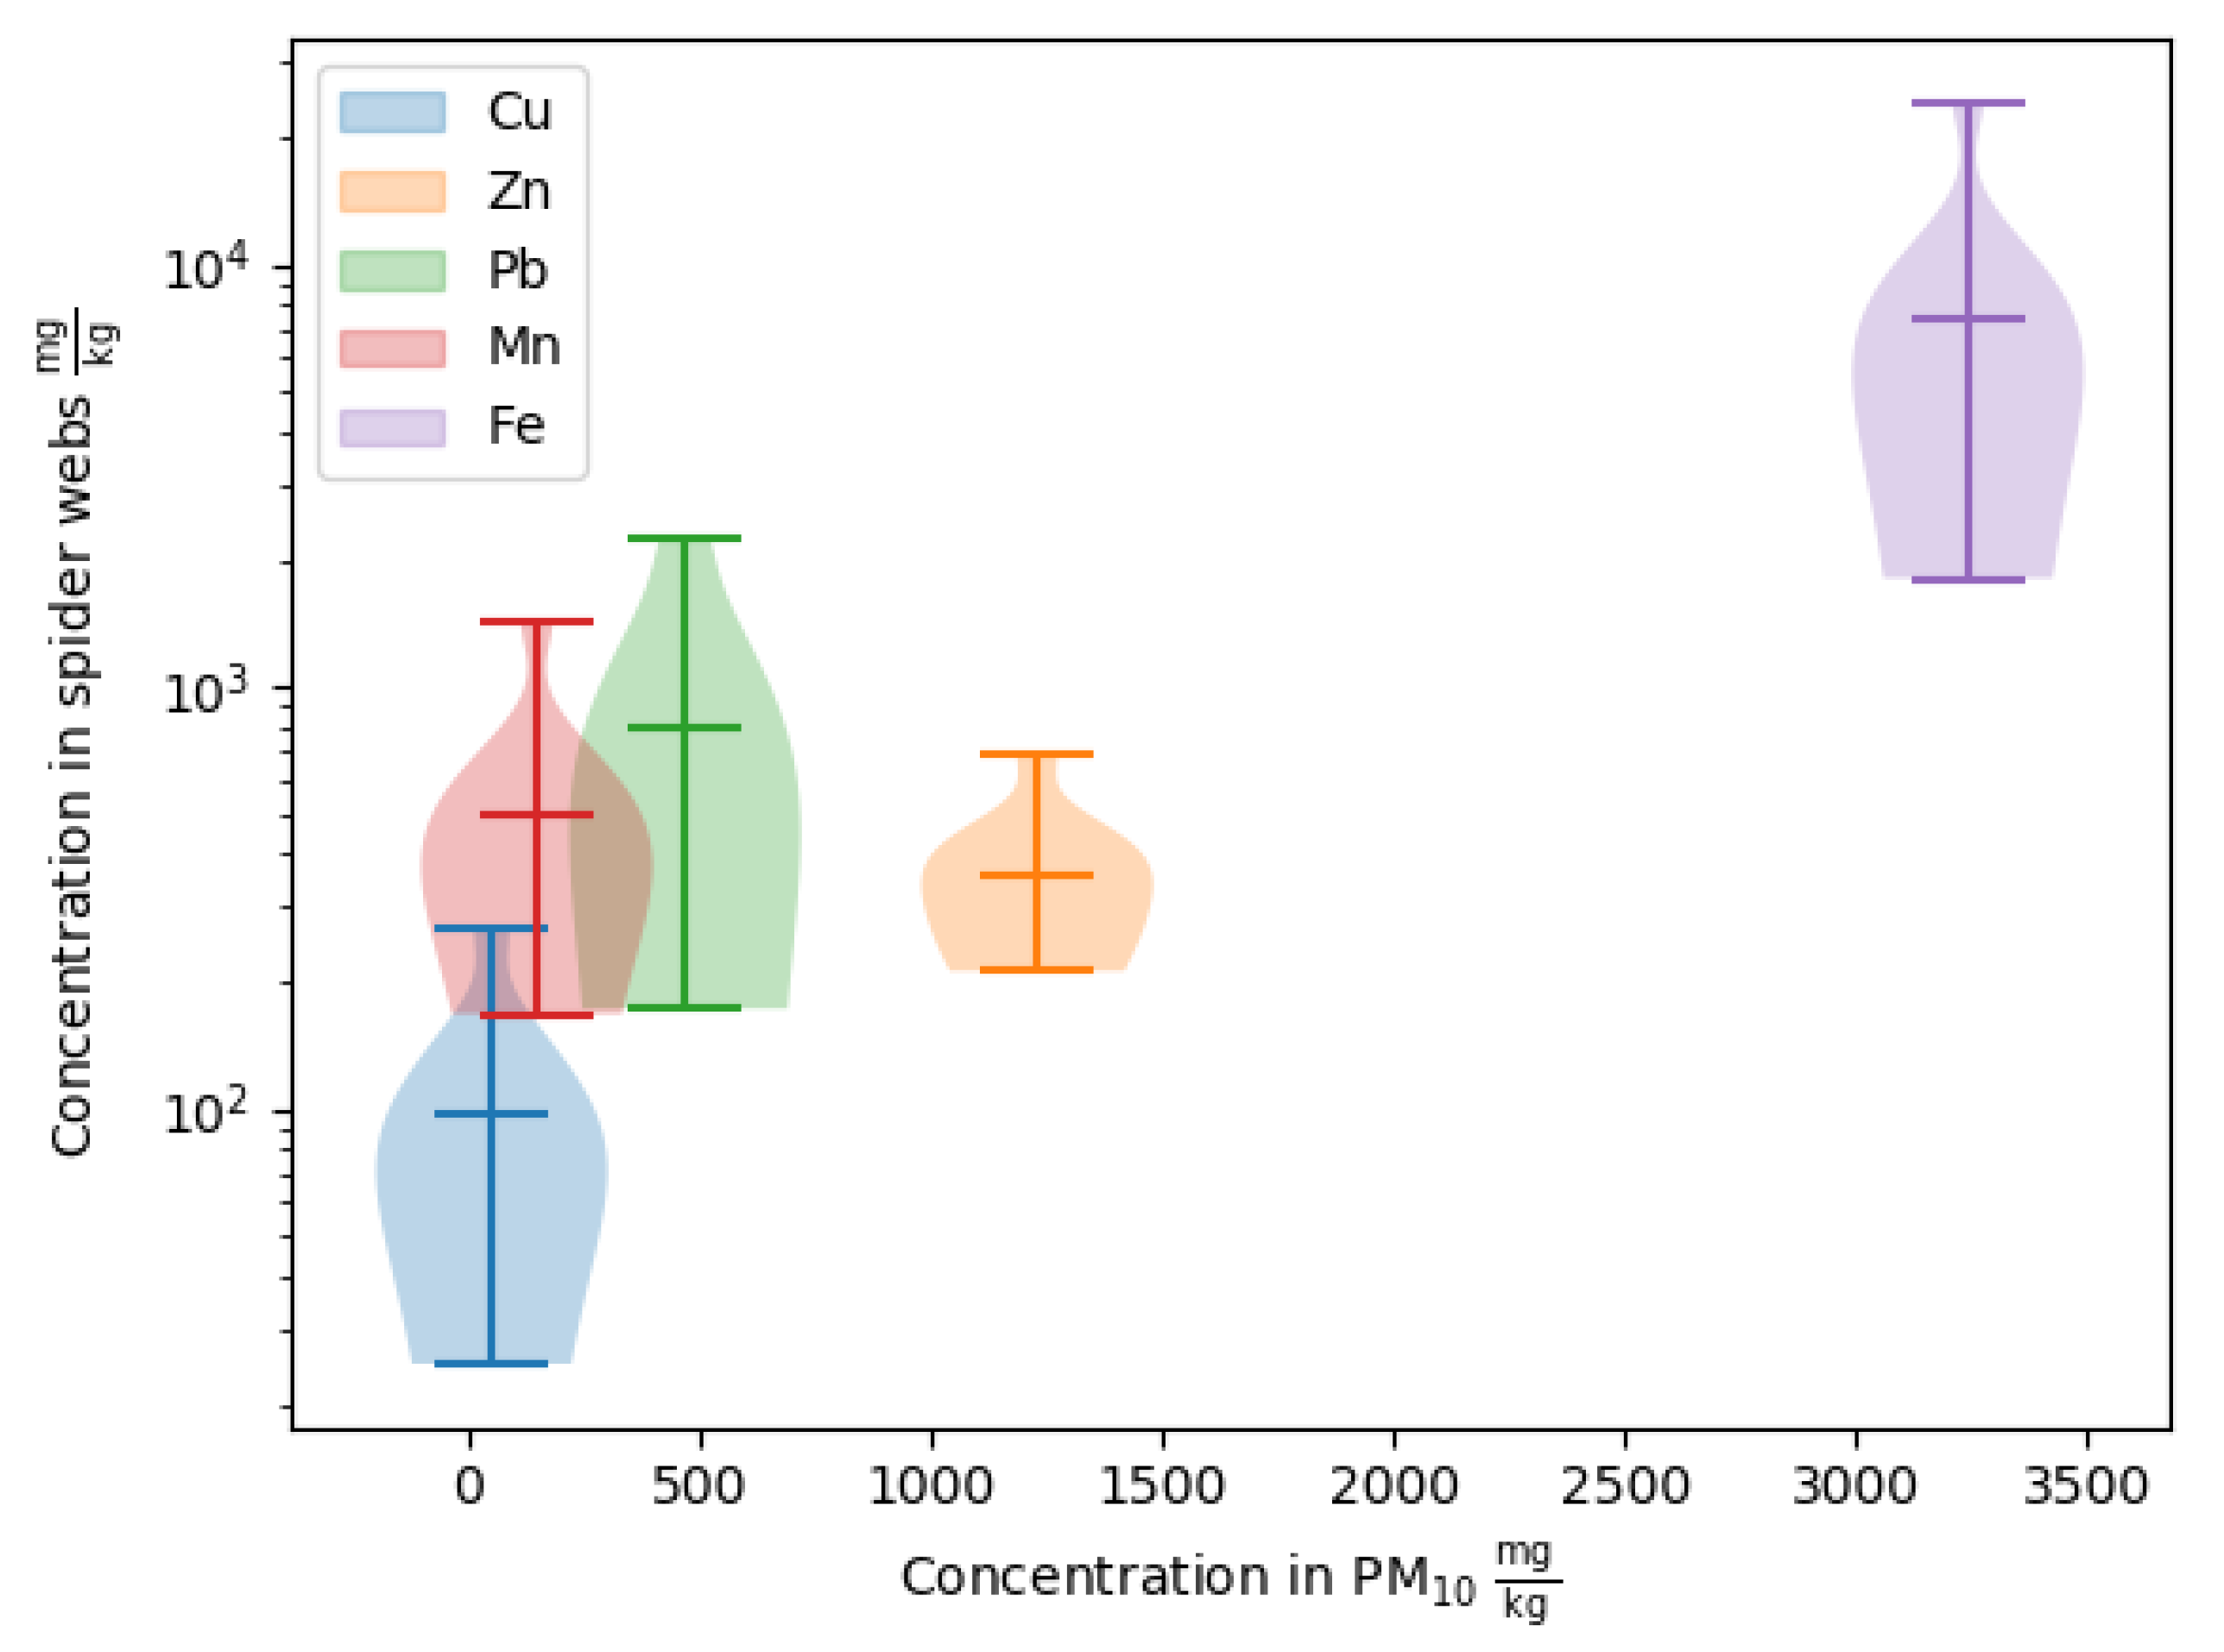
6.1. Concentration of PM-Bound Elements Obtained by Two Methods
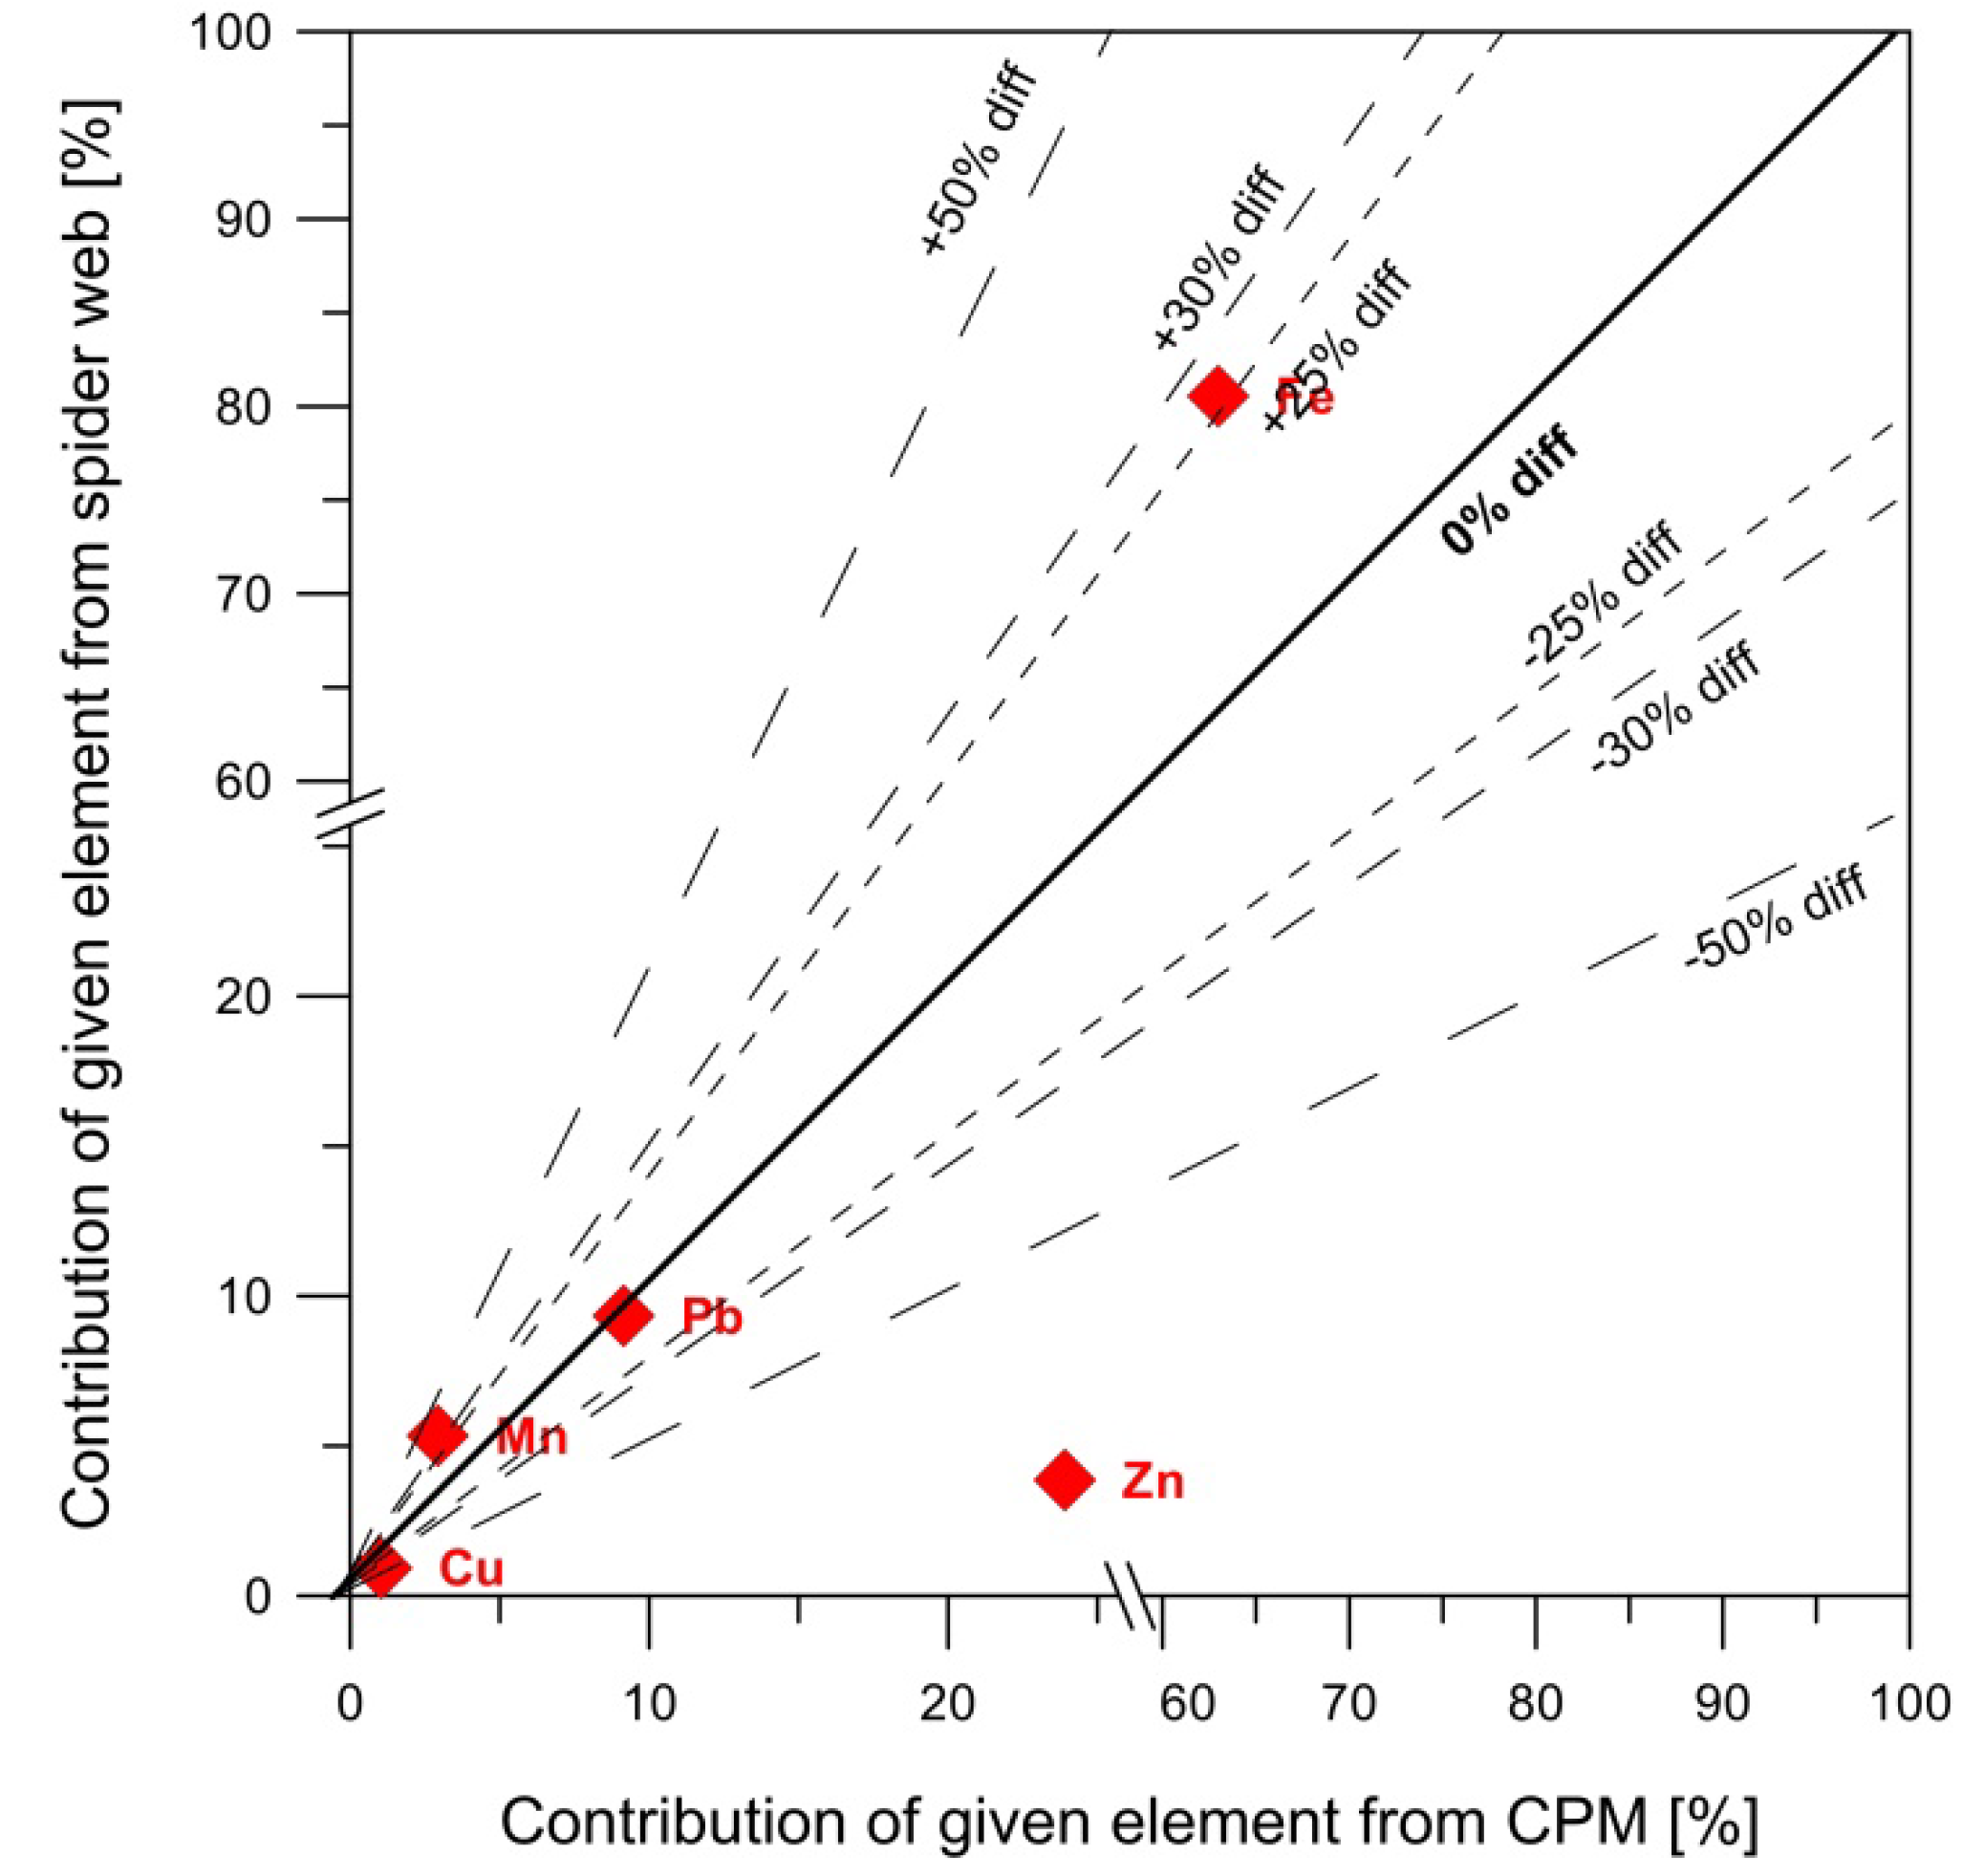
6.2. Percentage Contribution of Given Element
7. Discussion
8. Conclusions
Supplementary Materials
Author Contributions
Funding

Institutional Review Board Statement
Informed Consent Statement
Acknowledgments
Conflicts of Interest
References
- Ukaogo, P.O.; Ewuzie, U.; Onwuka, C.V. Environmental Pollution: Causes, Effects, and the Remedies. In Microorganisms for Sustainable Environment and Health, 1st ed.; Chowdhary, P., Raj, A., Vermna, D., Akhter, Y., Eds.; Elsevier: Amsterdam, The Netherlands, 2020; pp. 419–429. [Google Scholar]
- Yadav, I.C.; Devi, N.L. Biomass Burning, Regional Air Quality, and Climate Change. In Encyclopedia of Environmental Health, 2nd ed.; Nriagu, J., Ed.; Elsevier: Amsterdam, The Netherlands, 2019; pp. 386–391. [Google Scholar]
- European Environment Agency. Air Quality in Europe—2019 Report; European Environmental Agency: Copenhagen, Denmark, 2019. [Google Scholar]
- World Health Organization. Health Effects of Particulate Matter; WHO: Geneva, Switzerland, 2013. [Google Scholar]
- Braniš, M.; Domasová, M.; Řezáčová, P. Particulate air pollution in a small settlement: The effect of local heating. Appl. Geochem. 2007, 22, 1255–1264. [Google Scholar] [CrossRef]
- Furusjö, E.; Sternbeck, J.; Cousins, A.P. PM10 source characterization at urban and highway roadside locations. Sci. Total Environ. 2007, 387, 206–219. [Google Scholar] [CrossRef] [PubMed]
- Landrigan, P.J.; Fuller, R.; Acosta, N.J.R.; Adeyi, O.; Arnold, R.; Basu, N.N.; Baldé, A.B.; Bertollini, R.; Bose-O’Reilly, S.; Boufford, J.I.; et al. The Lancet Commission on pollution and health. Lancet 2018, 391, 462–512. [Google Scholar] [CrossRef] [Green Version]
- Ciężka, M.M.; Górka, M.; Modelska, M.; Tyszka, R.; Samecka-Cymerman, A.; Lewińska, A.; Łubek, A.; Widory, D. The coupled study of metal concentrations and electron paramagnetic resonance (EPR) of lichens (Hypogymnia physodes) from the Świętokrzyski National Park—Environmental implications. Environ. Sci. Pollut. Res. 2018, 25, 25348–25362. [Google Scholar] [CrossRef] [PubMed] [Green Version]
- Kłos, A.; Ziembik, Z.; Rajfur, M.; Dołhańczuk-Śródka, A.; Bochenek, Z.; Bjerke, J.W.; Tømmervik, T.; Zagajewski, B.; Ziółkowski, D.; Jerz, D.; et al. Using moss and lichens in biomonitoring of heavy-metal contamination of forest areas in southern and north-eastern Poland. Sci. Total Environ. 2018, 627, 438–449. [Google Scholar] [CrossRef] [PubMed]
- Świsłowski, P.; Kosior, G.; Rajfur, M. The influence of preparation methodology on the concentrations of heavy metals in Pleurozium schreberi moss samples prior to use in active biomonitoring studies. Environ. Sci. Pollut. Res. 2021, 28, 10068–10076. [Google Scholar] [CrossRef]
- Wang, L.; Gong, H.; Liao, W.; Wang, Z. Accumulation of particles on the surface of leaves during leaf expansion. Sci. Total Environ. 2015, 532, 420–434. [Google Scholar] [CrossRef]
- Górka, M.; Bartz, W.; Rybak, J. The mineralogical interpretation of particulate matter deposited on Agelenidae and Pholcidae spider webs in the city of Wrocław (SW Poland): A preliminary case study. J. Aerosol Sci. 2018, 123, 63–75. [Google Scholar] [CrossRef]
- Rybak, J. Accumulation of Major and Trace Elements in Spider Webs. Water Air Soil Pollut. 2015, 226, 1–12. [Google Scholar] [CrossRef] [PubMed] [Green Version]
- Rybak, J.; Sówka, I.; Zwoździak, A. Preliminary assessment of use of Spider webs for the indication of air contaminants. Environ. Prot. Eng. 2012, 38, 175–181. [Google Scholar] [CrossRef]
- Stojanowska, A.; Rybak, J.; Bożym, M.; Olszowski, T.; Bihałowicz, J.S. Spider webs and lichens as bioindicators of heavy metals: A comparison study in the vicinity of a copper smelter (Poland). Sustainability 2020, 12, 8066. [Google Scholar] [CrossRef]
- Xiao-Li, S.; Yu, P.; Hose, G.C.; Jian, C.; Feng-Xiang, L. Spider webs as indicators of heavy metal pollution in air. Bull. Environ. Contam. Toxicol. 2006, 76, 271–277. [Google Scholar] [CrossRef] [PubMed]
- Bartz, W.; Górka, M.; Rybak, J.; Rutkowski, R.; Stojanowska, A. The assessment of effectiveness of SEM- EDX and ICP-MS methods in the process of determining the mineralogical and geochemical composition of particulate matter deposited on spider webs. Chemosphere 2021, 278, 130454. [Google Scholar] [CrossRef]
- Rybak, J.; Sówka, I.; Zwozdziak, A.; Fortuna, M.; Trzepla-Nabagło, K. Evaluation of the Usefulness of Spider Webs as an Air Quality Monitoring Tool for Heavy Metals. Ecol. Chem. Eng. 2015, 22, 400. [Google Scholar] [CrossRef] [Green Version]
- Rybak, J.; Rogula-Kozłowska, W.; Loska, K.; Widziewicz, K.; Rutkowski, R. The concentration of Cu and Pb in the funnel spider Eratigena atrica (CL Koch 1843) (Araneae: Agelenidae) and its web. Chem. Ecol. 2019, 35, 1–12. [Google Scholar] [CrossRef]
- Rybak, J.; Olejniczak, T. Accumulation of polycyclic aromatic hydrocarbons (PAHs) on the spider webs in the vicinity of road traffic emissions. Environ. Sci. Pollut. Res. 2014, 21, 2313–2324. [Google Scholar] [CrossRef] [Green Version]
- Rybak, J.; Rogula-Kozłowska, W.; Jureczko, I.; Rutkowski, R. Monitoring of indoor polycyclic aromatic hydrocarbons using spider webs. Chemosphere 2019, 218, 758–766. [Google Scholar] [CrossRef] [PubMed]
- van Laaten, N.; Merten, D.; von Tümpling, W.; Schäfer, T.; Pirrung, M. Comparison of Spider Web and Moss Bag Biomonitoring to Detect Sources of Airborne Trace Elements. Water Air Soil Pollut. 2020, 231, 1–17. [Google Scholar] [CrossRef]
- Regionalny Wydział Monitoringu Środowiska w Opolu. Roczna Ocena Jakości Powietrza w Województwie Opolskim—Raport Wojewódzki za Rok 2019; Regionalny Wydział Monitoringu Środowiska w Opolu: Opole, Poland, 2020. [Google Scholar]
- Olszowski, T. The concentration of PM10 in a rural area during episodes of tropospheric inversion occurring in the cool months. ProScience 2014, 1, 387–392. [Google Scholar]
- European Environment Agency. Costs of Air Pollution from European Industrial Facilities 2008–2012—An Updated Assessment. EEA Technical Report No 20/2014; European Environmental Agency: Copenhagen, Denmark, 2014. [Google Scholar]
- WIOŚ. Raport o Stanie Środowiska Województwa Dolnośląskiego w 2007; WIOS: Wrocław, Poland, 2008. [Google Scholar]
- Parzentny, H.R.; Róg, L. Potentially hazardous trace elements in ash from combustion of coals in limnic series (Upper Carboniferous) of the Upper Silesian Coal Basin. Górnictwo Geol. 2007, 3, 81–91. [Google Scholar]
- Srogi, K. Pierwiastki śladowe w węglu. Wiadomości Górnicze 2007, 2, 87–96. [Google Scholar]
- Wierońska, F.; Makowska, D.; Strugała, A.; Bytnar, K. Analysis of the Content of Nickel, Chromium, Lead and Zinc in Solid Products of Coal Combustion (CCPs) Coming From Polish Power Plants. In IOP Conference Series: Earth and Environmental Science; IOP Publishing: Bristol, UK, 2019. [Google Scholar]
- Widera, M.; Kasztelewicz, Z.; Ptak, M. Lignite mining and electricity generation in Poland: The current state and future prospects. Energy Policy 2016, 92, 151–157. [Google Scholar] [CrossRef]
- Czech, T.; Marchewicz, A.; Sobczyk, A.T.; Krupa, A.; Jaworek, A. Śliwiński, Ł.; Rosiak, D. Heavy metals partitioning in fly ashes between various stages of electrostatic precipitator after combustion of different types of coal. Process. Saf. Environ. Prot. 2020, 133, 18–31. [Google Scholar] [CrossRef]
- Muszer, A. Charakterystyka Sferul i Minerałów Akcesorycznych z Wybranych Utworów Fanerozoicznych i Antropogenicznych; Fundacja Ostoja: Wrocław, Poland, 2007. [Google Scholar]
- Podgórska, B.; Synowiec, P.; Górniak, J.; Podgórska, S. Program Ochrony Środowiska dla Gminy Ozimek na Lata 2017–2020 wraz z Perspektywą na Lata 2021–2024; ALBEKO: Opole, Poland, 2017. [Google Scholar]
- Hanculak, J.; Kurbel, T.; Spaldon, T.; Sestinova, O.; Findorakova, L.; Fedorova, E. Influence of Iron and Steel Industry on Selected Elements of Atmospheric Deposition in the Urban and Suburban Area of Košice (Slovakia). J. Pol. Miner. Eng. Soc. 2005, 16, 95–102. [Google Scholar] [CrossRef]
- Sýkorová, B.; Kucbel, M.; Raclavská, H.; Raclavský, K.; Matýsek, D. Heavy metals in air nanoparticles in affected industry area. J. Sustain. Dev. Energy Water Environ. Syst. 2017, 5, 58–68. [Google Scholar] [CrossRef]
- Hykyšová, S.; Brejcha, J. Monitoring of PM10 air pollution in small settlements close to opencast mines in the North-Bohemian Brown Coal Basin. WIT Trans. Ecol. Environ. 2009, 123, 387–398. [Google Scholar] [CrossRef] [Green Version]
- Suchara, I.; Sucharová, J. Distribution of sulphur and heavy metals in forest floor humus of the Czech Republic. Water Air Soil Pollut. 2002, 136, 289–316. [Google Scholar] [CrossRef]
- GIOŚ. The State of the Environment in the Opolskie Voivodship; GIOŚ: Opole, Poland, 2020. (In Polish) [Google Scholar]
- HORIBA. New Construction Resolves Many of the Problems Associated with the Demanding Usage Environment for PM Sampling Filters. Available online: http://www.horiba.com/fileadmin/uploads/Process-Environmental/Documents/Downloads_Catalog/Catalog_Ambient/TFH-01_47_brochure_HRE2423B_uploaded_on_20140619.pdf (accessed on 20 June 2021).
- Zhang, Y.; Yin, M.; Xia, O.; Zhang, A.P.; Tam, H.Y. Optical 3D μ-printing of polytetrafluoroethylene (PTFE) microstructures. In Proceedings of the IEEE International Conference on Micro Electro Mechanical Systems (MEMS), Belfast, Northern Ireland, 21–25 January 2018; pp. 37–40. [Google Scholar]
- Ebnesajjad, S. Introduction to Fluoropolymers: Materials, Technology, and Applications. In Introduction to Fluoropolymers: Materials, Technology, and Applications; Elsevier LTD: Oxford, UK, 2013. [Google Scholar]
- Teng, H. Overview of the development of the fluoropolymer industry. Appl. Sci. 2012, 2, 496–512. [Google Scholar] [CrossRef]
- Liberti, A. Modern methods for air pollution monitoring. Pure Appl. Chem. 1975, 519–534. [Google Scholar] [CrossRef] [Green Version]
- Rolph, G.; Stein, A.; Stunder, B. Real-time Environmental Applications and Display sYstem: READY. Environ. Model. Softw. 2017, 95, 210–228. [Google Scholar] [CrossRef]
- Stein, A.F.; Draxler, R.R.; Rolph, G.D.; Stunder, B.J.B.; Cohen, M.D.; Ngan, F. Noaa’s hysplit atmospheric transport and dispersion modeling system. Bull. Am. Meteorol. Soc. 2015, 96, 2059–2077. [Google Scholar] [CrossRef]
- Zoller, W.H.; Gladney, E.S.; Duce, R.A. Atmospheric concentrations and sources of trace metals at the South Pole. Science 1974, 183, 198–200. [Google Scholar] [CrossRef] [PubMed]
- Wedepohl, K.H. The composition of the continental crust. Geochim. et Cosmochim. Acta 1995, 59, 1217–1239. [Google Scholar] [CrossRef]
- Yongming, H.; Peixuan, D.; Junji, C.; Posmentier, E.S. Multivariate analysis of heavy metal contamination in urban dusts of Xi’an, Central China. Sci. Total Environ. 2006, 355, 176–186. [Google Scholar] [CrossRef]
- Al-Azawii, Z.N. Study on chemical composition and designing web patterns of Iraqi spider silk. Biochem. Cell. Arch. 2020, 20, 1397–1400. [Google Scholar] [CrossRef]
- Hose, G.C.; James, J.M.; Gray, M.R. Spider webs as environmental indicators. Environ. Pollut. 2002, 120, 725–733. [Google Scholar] [CrossRef]
- Gerboles, M.; Buzica, D.; Brown, R.J.C. Interlaboratory comparison exercise for the determination of As, Cd, Ni and Pb in PM10 in Europe. Atmos. Environ. 2011, 45, 3488–3499. [Google Scholar] [CrossRef]
- Konopka, Z.; Swisłowski, P.; Rajfur, M. Biomonitoring of Atmospheric Aerosol with the use of Apis mellifera and Pleurozium schreberi. Chem. Didact. Ecol. Metrol. 2020, 24, 107–116. [Google Scholar] [CrossRef] [Green Version]
- Spectro-Lab. Instrukcja Obsługi Aparatu AAS iCE 3500 Firmy Thermo Scientific; Spectro-Lab: Warszawa, Poland, 2013. [Google Scholar]
- Tychowska-Jankowska, A. Environmental Impact Forecast; Burmistrz Ozimka: Ozimek, Poland, 2013; (In Polish). Available online: https://ozimek.pl/static/img/k01/obwieszczenia_burmistrza/2013/04_Prognoza_oddzialywania_na_srodowisko.pdf (accessed on 20 June 2021).
- Muránszky, G.; Ovari, M.; Virág, I.; Csiba, P.; Dobai, R.; Záray, G. Chemical characterization of PM10 fractions of urban aerosol. Microchem. J. 2011, 98, 1–10. [Google Scholar] [CrossRef]
- Byeon, S.H.; Willis, R.; Peters, T.M. Chemical characterization of outdoor and subway fine (PM2.5–1.0) and coarse (PM10–2.5) particulate matter in Seoul (Korea) by computer-controlled scanning electron microscopy (CCSEM). Int. J. Environ. Res. Public Health 2015, 12, 2090–2104. [Google Scholar] [CrossRef] [Green Version]
- Nalbandian, H. Trace Element Emissions from Coal; IEA Clean Coal Centre: Paris, France, 2012; Available online: https://usea.org/sites/default/files/092012_Trace%20element%20emissions%20from%20coal_ccc203.pdf (accessed on 20 June 2021).
- Vossler, T.; Cernikovsky, L.; Novak, J.; Placha, H.; Krejci, B.; Nikolova, I.; Chalupnickova, E.; Williams, R. An investigation of local and regional sources of fine particulate matter in Ostrava, the Czech Republic. Atmos. Pollut. Res. 2015, 6, 454–463. [Google Scholar] [CrossRef]
- Pokorná, P.; Hovorka, J.; Klán, M.; Hopke, P.K. Source apportionment of size resolved particulate matter at a European air pollution hot spot. Sci. Total Environ. 2015, 502, 172–183. [Google Scholar] [CrossRef]
- Slovak Hydrometeorological Institute. Air Pollution in the Slovak Republic; Slovak Hydrometeorological Institute: Bratislava, Slovakia, 2019. [Google Scholar]
- Olszowski, T. Influence of individual household heating on PM2.5 concentration in a rural settlement. Atmosphere 2019, 10, 782. [Google Scholar] [CrossRef] [Green Version]
- Mach, T.; Rogula-Kozłowska, W.; Bralewska, K.; Majewski, G.; Rogula-Kopiec, P.; Rybak, J. Impact of Municipal, Road Traffic, and Natural Sources on PM10: The Hourly Variability at a Rural Site in Poland. Energies 2021, 14, 2654. [Google Scholar] [CrossRef]
- Juda-Rezler, K.; Kowalczyk, D. Size distribution and trace elements contents of coal fly ash from pulverized boilers. Pol. J. Environ. Stud. 2013, 22, 25–40. [Google Scholar]
- Miler, M.; Gosar, M. Assessment of metal pollution sources by SEM/EDS analysis of solid particles in snow: A case study of Žerjav, Slovenia. Microsc. Microanal. 2013, 19, 1–14. [Google Scholar] [CrossRef] [PubMed]
- Goix, S.; Resongles, E.; Point, D.; Oliva, P.; Duprey, J.L.; de la Galvez, E.; Ugarte, L.; Huayta, C.; Prunier, J.; Zouiten, C.; et al. Transplantation of epiphytic bioaccumulators (Tillandsia capillaris) for high spatial resolution biomonitoring of trace elements and point sources deconvolution in a complex mining/smelting urban context. Atmos. Environ. 2013, 80, 330–341. [Google Scholar] [CrossRef]
- Cadle, S.H.; Mulawa, P.A.; Hunsanger, E.C.; Nelson, K.; Ragazzi, R.A.; Barrett, R.; Gallagher, G.L.; Lawson, D.R.; Knapp, K.T.; Snow, R. Composition of light-duty motor vehicle exhaust particulate matter in the Denver, Colorado area. Environ. Sci. Technol. 1999, 33, 2328–2339. [Google Scholar] [CrossRef]
- Pant, P.; Harrison, R.M. Estimation of the contribution of road traffic emissions to particulate matter concentrations from field measurements: A review. Atmos. Environ. 2013, 77, 78–97. [Google Scholar] [CrossRef]
- GDDKiA. Generalny Pomiar Ruchu w 2015 Roku; GDDKiA: Warsaw, Poland, 2016. (In Polish) [Google Scholar]
- Adamiec, E.; Jarosz-Krzemińska, E.; Wieszała, R. Heavy metals from non-exhaust vehicle emissions in urban and motorway road dusts. Environ. Monit. Assess. 2016, 188, 369. [Google Scholar] [CrossRef] [Green Version]
- Root, R.A. Lead loading of urban streets by motor vehicle wheel weights. Environ. Health Perspect. 2000, 108, 937. [Google Scholar] [CrossRef]
- Bartoňová, L.; Raclavská, H.; Čech, B.; Kucbel, M. Behavior of Pb during coal combustion: An overview. Sustainability 2019, 11, 6061. [Google Scholar] [CrossRef] [Green Version]
- Moore, K.; Polidori, A.; Sioutas, C. Toxicological Assessment of Particulate Emissions From the Exhaust of Old and New Model Heavy- and Light-Duty Vehicles; METRANS: Los Angeles, CA, USA, 2011. [Google Scholar]
- Deng, S.; Shi, Y.; Liu, Y.; Zhang, C.; Wang, X.; Cao, Q.; Zhang, F. Emission characteristics of Cd, Pb and Mn from coal combustion: Field study at coal-fired power plants in China. Fuel Process. Technol. 2014, 126, 469–475. [Google Scholar] [CrossRef]
- WHO. Chapter 6.8—Manganese. In Air Quality Guidelines, 2nd ed.; WHO: Geneva, Switzerland, 2001; pp. 1–13. [Google Scholar]
- Lindsley, W.G. Filter Pore Size and Aerosol Sample Collection. In NIOSH Manual of Analytical Methods, 5th ed.; Kevin, A., O’Connor, P.F., Eds.; National Institute for Occupational Safety and Health: Washington, DC, USA, 2016; pp. 2–14. [Google Scholar]
- Opell, B.D. What forces are responsible for the stickiness of spider cribellar threads? J. Exp. Zool. 1993, 265, 469–476. [Google Scholar] [CrossRef]
- Opell, B.D. Do static electric forces contribute to the stickiness of a spider’s cribellar prey capture threads? J. Exp. Zool. 1995, 273, 186–189. [Google Scholar] [CrossRef]
- Ortega-Jimenez, V.M.; Dudley, R. Spiderweb deformation induced by electrostatically charged insects. Sci. Rep. 2013, 3, 1–4. [Google Scholar] [CrossRef] [PubMed] [Green Version]
- Peters, H.M. The spinning apparatus of Uloboridae in relation to the structure and construction of capture threads (Arachnida, Araneida). Zoomorphology 1984, 104, 96–104. [Google Scholar] [CrossRef]
- Vollrath, F.; Edmonds, D. Consequences of electrical conductivity in an orb spider’s capture web. Naturwissenschaften 2013, 100, 1163–1169. [Google Scholar] [CrossRef] [PubMed]


| EF Value | Level of Enrichment |
|---|---|
| minimal | |
| [2,5] | moderate |
| [5,20] | significant |
| [20,40] | very high |
| extremely high |
| Metal | IDL (mg/dm3) | IQL (mg/dm3) |
|---|---|---|
| Mn | 0.0016 | 0.020 |
| Fe | 0.0043 | 0.050 |
| Ni | 0.0043 | 0.050 |
| Cu | 0.0045 | 0.033 |
| Zn | 0.0033 | 0.010 |
| Cd | 0.0028 | 0.013 |
| Pb | 0.0130 | 0.070 |
| Element | Cu | Zn | Pb | Mn | Fe |
|---|---|---|---|---|---|
| EF | 30.4 | 192 | 225 | 2.33 | 0.853 |
| Parameter | This Study | Stojanowska et al. (2020) | Rybak (2015) | Rybak et al. (2015) | Bartz et al. (2021) |
|---|---|---|---|---|---|
| Study area | Kotórz Mały | Smelter in Legnica | Wrocław | Wrocław | Smelter in Głogów |
| Fe [μg/g] | 7469 | 2058 | |||
| Mn [μg/g] | 494 | 146 | |||
| Pb [μg/g] | 797 | 307 | 87 | 738 (2011) 790 (2012) | 357 |
| Zn [μg/g] | 357 | 500 | 738 | 3666 (2011) 1919(2012) | 479 |
| Cu [μg/g] | 98 | 706 | 109 | 226 | |
| Exposition time | 1 month | 1 month (recalculated from 2 months) | 1 month (recalculated from 2 months) | 1 month | 1 month (recalculated from 3 months) |
Publisher’s Note: MDPI stays neutral with regard to jurisdictional claims in published maps and institutional affiliations. |
© 2021 by the authors. Licensee MDPI, Basel, Switzerland. This article is an open access article distributed under the terms and conditions of the Creative Commons Attribution (CC BY) license (https://creativecommons.org/licenses/by/4.0/).
Share and Cite
Stojanowska, A.; Mach, T.; Olszowski, T.; Bihałowicz, J.S.; Górka, M.; Rybak, J.; Rajfur, M.; Świsłowski, P. Air Pollution Research Based on Spider Web and Parallel Continuous Particulate Monitoring—A Comparison Study Coupled with Identification of Sources. Minerals 2021, 11, 812. https://doi.org/10.3390/min11080812
Stojanowska A, Mach T, Olszowski T, Bihałowicz JS, Górka M, Rybak J, Rajfur M, Świsłowski P. Air Pollution Research Based on Spider Web and Parallel Continuous Particulate Monitoring—A Comparison Study Coupled with Identification of Sources. Minerals. 2021; 11(8):812. https://doi.org/10.3390/min11080812
Chicago/Turabian StyleStojanowska, Agnieszka, Tomasz Mach, Tomasz Olszowski, Jan Stefan Bihałowicz, Maciej Górka, Justyna Rybak, Małgorzata Rajfur, and Paweł Świsłowski. 2021. "Air Pollution Research Based on Spider Web and Parallel Continuous Particulate Monitoring—A Comparison Study Coupled with Identification of Sources" Minerals 11, no. 8: 812. https://doi.org/10.3390/min11080812
APA StyleStojanowska, A., Mach, T., Olszowski, T., Bihałowicz, J. S., Górka, M., Rybak, J., Rajfur, M., & Świsłowski, P. (2021). Air Pollution Research Based on Spider Web and Parallel Continuous Particulate Monitoring—A Comparison Study Coupled with Identification of Sources. Minerals, 11(8), 812. https://doi.org/10.3390/min11080812