Article

Spatial Distribution and Pollution Assessment of Potentially Toxic Elements (PTEs) in Surface Sediments at the Drinking Water Source Channel of Taipu River in China

1
School of Environment and Architecture, University of Shanghai for Science and Technology, Shanghai 200093, China
2
College of Environmental Science and Engineering, Tongji University, Shanghai 200092, China
*
Author to whom correspondence should be addressed.
Minerals 2021, 11(11), 1202; https://doi.org/10.3390/min11111202
Submission received: 3 October 2021 / Revised: 23 October 2021 / Accepted: 27 October 2021 / Published: 28 October 2021

Abstract

:
With the integration strategy of the Yangtze River Delta rising to the height of the national strategy, it is crucial to ascertain pollution, ecological risks, and possible sources of potentially toxic elements (PTEs) in the sediments of the drinking water source channel Taipu River across the core demonstration zone. In this study, distribution, risk assessment, and source of 12 PTEs were investigated in sediment samples from the Taipu River. The concentrations of Mo, Cu, Cd, Ni, and Zn in the sediments of the Taipu River were generally 1.01–5.84 times higher than the background value of the soil from Jiangsu Province. The spatial distribution of PTEs presented differently upstream, middle, and downstream of the river. The values of I g e o and E F showed moderate pollution at individual points, mainly due to Cd, Cu, and Mo. Except for Cd, the average potential ecological risk of other elements was low. Analysis of contamination source indicated that Cr, Ni, Tl, V, As, and Co were from natural sources while Zn, Mo, Cd, Pb, and Sb were associated with industrial activities. Copper was possibly derived from historic aquaculture activities along the Taipu River. Although the concentration of PTEs is generally low, particular attention should be given to Cd, Mo, and Cu as pollution sources. The results provide guidance for controlling PTEs pollution and protecting drinking water sources in the Taipu River.

1. Introduction

River plays a pivotal role in the life of humans. It helps in irrigation, aquaculture, flood control, transportation, drinking water, and balancing the ecosystem. The river sediments are an important indicator for the assessment of the water environment due to the sediment–water interactions [1,2,3]. Aquatic sediments can act as a sink of potentially toxic elements (PTEs) by deposition [4], and a source of lithogenic or anthropogenic PTE through resuspension [5]. Due to their low solubility, PTEs, which are often derived from atmospheric deposition, surface runoff, wastewater discharge, would accumulate in river sediments. These processes include the physical (such as flocculation, precipitation, and adsorption), chemical (complexation, chelation, and ion exchange), and biological (such as absorption, metabolism, releasing). It has been reported that the concentrations of many PTEs in the sediment can generally reach tens to hundreds of times those overwater [6].
The Taipu River is an important drinking water source channel for the Yangtze River Delta Ecology and Greenery Integration Development Demonstration Zone in China. The river is an important artificially excavated channel connecting Taihu Lake and the Huangpu River. The upstream is connected with the East Taihu Lake Water Source and the East Taihu Lake Emergency Standby Water Source, and the downstream is connected with Shanghai Jinze Reservoir and Jiashan Changbaidang Drinking Water Source Protection Area. It is located in the Yangtze River Delta Ecology and Greenery Integration Development Demonstration Zone in China. It acts as an important channel for flood discharge and shipping, but also a supply for potable water sources, which requires a very high standard of water quality and ecological balance. The Taipu River flows through fifteen towns of three provinces (Jiangsu, Zhejiang, and Shanghai), which have a very dense population and developed industries including (chemical, textile, printing, and dyeing, polyester, etc.). Recently, several pollution incidents occurred in the Taipu River, such as the input of cyanobacteria from the upstream (Taihu Lake) and antimony exposure by point sources (factories and wastewater treatment plants), which have raised widespread concern. The PTEs in the Taihu Lake posed serious threats to the water supply safety downstream (Jiashan and Qingpu) [7]. For decades, the Taipu River’s different functional positions set by each administrative region have made the governance of the Taipu River a problem.
However, most of the current studies about the Taipu River focused on the conventional physicochemical parameters [8,9,10] or the PTEs concentration in water [11], while few have investigated the situation of sediments. As the major navigable and tidal watercourse, the hydrodynamic of the Taipu River changes frequently, thereby promoting the transformation of PTEs in the sediments.
In this paper, the distribution and source of PTEs in the surface sediments of the Taipu River were investigated. The enrichment level and ecological risk of the sediments were also evaluated by various methods (geoaccumulation index, enrichment factor, potential ecological risk index). With a view to protect the regional water environment and ensure the safety of upstream and downstream water supply in the Taipu River watershed, this study can provide a scientific basis for the implementation of the protection of the Taipu River’s ecology and water environment.

2. Materials and Methods

2.1. Study Area and Sediment Sampling

The Taipu River belongs to the river network area of the Taihu Lake Basin. With a length of 57 km, it connects Taihu Lake, which is the third-largest freshwater lake, and the largest river in Shanghai, the Huangpu River. In addition, it is closely related to the surrounding water network, including 205 small/medium size lakes, and affected by the inflow of tributaries on both sides of the river. The average flux was 300 m3/s, and the flow rate was 0.03–0.33 m/s [12]. The bottom of the Taipu River is relatively flat, mostly covered by loose Quaternary layers, and the exposed area of bedrock is small. Sediment accumulation rate was about 4.2 cm/a [13]. This investigation conducted intensive sampling of the Taipu River, focusing on the intersection of the main tributaries and regional functional areas.
The sampling sites were recorded with a GPS and shown in Figure 1. From September to October 2018, 25 surface sediment samples (0–15 cm) were collected using a grab sampler, numbered TP1 to TP25. Before being kept in polyethylene Ziploc bags, the stones, animals, plants, debris, and the parts that were in contact with the sampler were carefully removed. Prior to storage at 4 °C, the samples were then taken back to the laboratory, freeze-dried at −20 °C, ground, sorted through 20 mesh and 200 mesh nylon sieves for the analysis of the particle size (20 mesh) and PTEs (200 mesh).

2.2. Analysis of PTE Concentration in Sediments

The concentration of PTEs was analyzed on an aliquot (0.1 g) of the pretreated sample digested by 1.0 mL HCl, 4.0 mL HNO3, 1.0 mL HF, and 1.0 mL H2O2 in Teflon vessels in a microwave digestion system. After digestion (heating to 180 °C for 10 min prior to maintaining at 180 °C for 20 min) and cooling, the digestion vessels were placed in an electric hot plate heating (DKQ-1800, China), keeping at 150 °C to drive away HF. The digest was made up to 50 mL with 5% HNO3 before analysis. The concentrations of Cr, Ni, Cu, Zn, Mo, Cd, Tl, Pb, V, Co, As and Sb were determined using Inductively Coupled Plasma-Mass Spectrometry (ICP-MS, NexIon300X, PerkinElmer, Waltham, MA, USA).

2.3. Quality Control

The quality assurance and quality control (QA/QC) procedures were performed by setting blank and quality control samples for each batch of sediment samples. In the analysis of the total amount of PTEs, the certified reference materials (GBW07408, National Research Center of Certified Reference Materials of China, Beijing, China) were used for the quality control of the digestion process. The results showed that the reference materials recovery rate is within 88–109%. Sediment samples (every 5 samples) were analyzed in parallel during the digestion, and the relative error was below 6%. The total amounts were determined by ICP-MS, and each sample was repeatedly determined 3 times with relative standard deviation (RSD) < 10.8%, which insured the precision of the results. The internal standard method was applied, with Ge (10 μg/L), In (5 μg/L), and Bi (5 μg/L) as internal standard substances to correct the response signal to eliminate Instrument drift and matrix effects.

2.4. Sediment Characterization

The sediment pH values and the total organic carbon (TOC) were measured using the methods of Soil Determination of pH Potentiometry (HJ 962-2018, China) [14] and Soil Determination of Organic Carbon Combustion Oxidation Nondispersive Infrared Absorption (HJ695-2014, China) [15], respectively. The particle size was analyzed by laser diffraction (GB/T 12763.8-2007, China) [16].

2.5. Risk Assessment Methods

2.5.1. Geoaccumulation Index ( I g e o )

Geoaccumulation index ( I g e o ) was introduced to assess the risk of trace elements in sediment samples collected [17]. I g e o is defined by the following equation:
I g e o = log 2 [ C n / ( k × B n ) ] ,
where C n represents the concentration of elements tested in sediment samples, and B n is the geochemical background concentration of the element (n), employing the deep soil environmental background concentrations in Jiangsu Province; the values are shown in Table S4. The constant of 1.5 acts as the background matrix correction due to lithospheric effects to minimize the variation of background values. The seven pollution grades of I g e o are shown in Supplementary Materials Table S1.

2.5.2. Enrichment Factor ( E F )

Enrichment factor ( E F ) is a useful index in diagnosing the degree of anthropogenic PTEs pollution [18]. The enrichment factors for the tested PTEs in the sediments are calculated choosing Fe as the element of normalization since the Fe input is dominated vastly by its natural sources [19,20]. The formula applies is as follows:
E F = C n / C r e f B n / B r e f   ,
where Cn represents the element concentration in the sediment, and C r e f represents the concentration of the reference element used. B n and B r e f represent the background concentrations of PTEs and the reference element, respectively. Table S2 shows the factor standard of different levels.

2.5.3. Potential Ecological Risk Index ( R I )

The potential ecological risk index ( R I ) was proposed by [21] and can be used to comprehensively evaluate the ecological risks of PTEs and their impacts on biology [22]. The equations used to calculate RI were as follows:
E r i = T r i × C n i C 0 i   ,
R I = i = 1 n E r i   ,  
where C n i is the content of element i, C 0 i is the background value for the metal i, E r i is the potential ecological risk factor of the monomial element, and T r i is the toxicity coefficient; its values for Cr, Ni, Cu, Zn, Mo, Cd, Pb, V, Co, As, and Sb are 2, 5, 5, 1, 1, 30, 5, 10, 2, 5, and 10, respectively. R I   is the sum of potential ecological risk for all the elements. As shown in Table S3, the values of E r i can be divided into five categories, and R I values can be divided into four categories.

2.6. Data Analysis

Microsoft Excel 2016 (Microsoft, Redmond, WA, USA), Origin 2018 (OriginLab, Northampton, MA, USA), SPSS 25.0 (IBM, Chicago, IL, USA), and Arc GIS 10.6 (ESRI, Redlands, CA, USA) were used for data processing and drawing of charts and graphs. Microsoft Excel 2016 and Origin 2018 were used for data collation and charting, respectively. Pearson correlation analysis and principal component analysis (PCA) were conducted within SPSS 25.0. ArcGIS 10.6 was applied to map the sampling area, and Kriging interpolation was used to analyze and represent the spatial distribution of PTEs graphically.

3. Results and Discussion

3.1. Sediment Characterization

The pH, particle size distribution, and total organic carbon of surface sediments are shown in Table 1. The pH values of surface sediments in the Taipu River range between 6.48 and 8.81, with an average pH of 7.65, showing slight alkalinity. The values of total organic carbon (TOC) range from 3.73 to 49.23 g kg−1, and average at 12.60 g/kg. The variation coefficient of the pH values is 0.074, indicating a low spatial variability in alkalinity and acidity, while the higher variation coefficients of TOC (0.77) and the particle size (0.74 and 0.23) imply the more obvious spatial variabilities in the study area. In addition, the mean silt content of samples collected is much greater than clay.

3.2. PTEs Concentration

The amounts of Cr, Ni, Cu, Zn, Mo, Cd, Tl, Pb, V, Co, As, and Sb in the surface sediments of samples collected in the Taipu River are shown in Table 2. Due to the strong regionality with the environmental sediment background, this study compared PTEs concentrations with the Jiangsu Province soil environmental background value (hereinafter referred to as the background value) to analyze the environmental pollution status of PTEs in the sediments of the Taipu River [23]. The maximum detection values of all PTEs at the sampled points exceed the background values. The maximum contents of Cu, Cd, and Mo are 130.2 mg/kg, 0.455 mg/kg, and 0.963 mg/kg, respectively, which are 5.84, 3.65, and 3.2 times of the background values, indicating severe enrichment in the Taipu River sediments. The average contents of Mo, Cu, Zn, and Ni surpass the background values, which are 1.53, 1.15, 1.23, and 1.03 times the background value, respectively. The median values of three elements (Ni, Zn, and Mo) exceed the background values, while Cu and Co are equivalent to the background values. As to the variation coefficients of element concentrations, discrepancies also are exhibited. Copper and chromium are more than 80%, indicating that the distribution of Cu and Cd in the Taipu River sediment has been highly uneven. The concentration variation coefficients of Zn, Mo, and As range from 40.1% to 48.2%, and that of other elements (Cr, Ni, Tl, Pb, V, Co, and Sb) range from 20.2% to 31.7%.
Compared with other water source rivers (such as Huangpu River and Biliuhe Reservoir), the overall pollution levels of various elements in the sediments of the Taipu River are lower (Table S5). As regards other important tributaries in the Yangtze River Basin (such as Xiangjiang River, Zijiang River, and Dadu River), the PTE contents in the Taipu River demonstrate light pollution. Except for Cd, the PTE concentrations in the Taipu River are higher than in the Liaohe River, while these are lower than in the Jialu River (Huaihe River Basin) and the Haihe River, apart from As. The contents of Cu, Pb, and Cd are below records in the rivers of the other countries, such as Vaigai River (India), and Bangshi River and Somesu Mic River (Romania); nevertheless, the contents of Cu, Pb, Zn, and Mo exceed the values of Chenab River, Pakistan.

3.3. Spatial Distribution

From upstream to downstream of the Taipu River (Figure 2), the spatial variation trends of the elements in the surface sediment samples are different, with significant fluctuations. The concentrations of Zn and Mo upstream are significantly higher than those in the middle and downstream, and high concentration sites are at TP2, TP3, TP5, TP8, and TP9. The element As is mainly concentrated midstream, and its maximum concentration is at TP13. Cu (TP11), Cd, and Pb (TP5, TP8, TP13) are higher in a few sites in the middle and upstream, and the values in other positions remained uniform. The spatial distribution of Ni, Cr, Tl, V, and Co are similar; their concentration in the middle and downstream is higher than upstream, but the three sites (TP3, TP8, and TP9) upstream also show high values. Sb shows a high concentration upstream and downstream but a low concentration midstream. The distribution of the sites generally shows that multiple elements are highly enriched at TP3, TP5, and TP8, indicating that these sites will become the main focus of environmental management.

3.4. Pollution and Risk Assessment

3.4.1. Pollution Degree Assessment

The geoaccumulation index ( I g e o ) results of Cr, Ni, Cu, Zn, Mo, Cd, Tl, Pb, V, Co, As, and Sb in the surface sediments of the Taipu River are shown in Figure 3a. Overall, the I g e o values of all PTEs are below zero, showing unpolluted conditions. Spatial distribution characteristics of enrichment for differing elements are various, with individual elements enriched seriously within the region. The I g e o values of Cr, Tl, Pb, V, Co, Ni, As, Zn, and Sb are greater than zero at some points, and thus, the overall pollution accumulation of these PTEs is low. Mo and Cd show uncontaminated to moderately polluted conditions at TP5 and TP8, and Cu is moderately polluted at TP11. These results may be related to the large number of industries distributed at TP5 and TP8. TP11 is located at the junction of the Taipu River and the Jinghang Grand Canal. The surrounding domestic and industrial pollutants carried by the Beijing–Hangzhou Canal may have caused the accumulation of elements.
Figure 3b presents the values of E F s of PTEs studied. According to previous research, enrichment factor values below 1.5 indicate that elements originate from crustal materials or natural processes, while values higher than 1.5 suggest anthropogenic sources [24]. In general, among the analyzed 12 PTEs, the average E F is between 0.83 and 1.67, of which Cu, Mo, and Zn reveal more elevated enrichment. The highest E F value of a single element in all samples occurs at TP11, reaching 8.95 for Cu, which indicates moderately severe enrichment. The E F C u values of the four sites (TP9, TP13, TP11, and TP14) are all higher than 1.5, implying minor enrichment caused by human activities in the area. The high E F value of the second enriched metal element Mo is mainly concentrated upstream and midstream. In addition, the E F for Cd is above 2 in both TP5 and TP8, showing minor enrichment. The enrichment factors for Cd are above 2 in both TP5 and TP8 sites, showing minor enrichment. This indicates that the sediment enrichment factors for Cu, Mo, and Cd are mainly caused by anthropogenic impact. The E F values of Zn, Co, As, Sb, and Ni are higher than 1.5 in some points, which indicates that the enrichment of these elements is affected by anthropogenic activities. E F T l and E F V are less than 1.5, implying their natural enrichment. The low E F value (<1.0) indicates that Cr and Pb originate from natural processes such as soil and lithospheric weathering.
Variability in background values of PTEs in soils and sediments as a result of uneven distribution of natural PTEs has been reported in various studies [25,26]. A single threshold value, which is often determined as an average/medium value in the area, may lead to an under/overestimation of the pollution level [27]. Therefore, in this study, the uncertainty of the I g e o and E F results were assessed by comparing those based on background values of adjacent study areas (Figures S1 and S2). Under the background values of the three provinces, the elements with significant differences in the proportion of I g e o pollution levels are Cu, Zn, Mo, and Cd. The unpolluted to moderately polluted concentrations of Cu (28%) and Cd (28%) in Zhejiang Province are significantly higher than the other two provinces, while Zn and Mo concentrations are higher in Jiangsu Province. The E F values of all PTEs basically show differences under different background values. In general, Zhejiang Province has a higher proportion of minor enrichment, especially in Cr, Cu, Cd, Pb, V, and As. Determination of sediment background values in the study area is necessary to provide a more accurate assessment in the future.

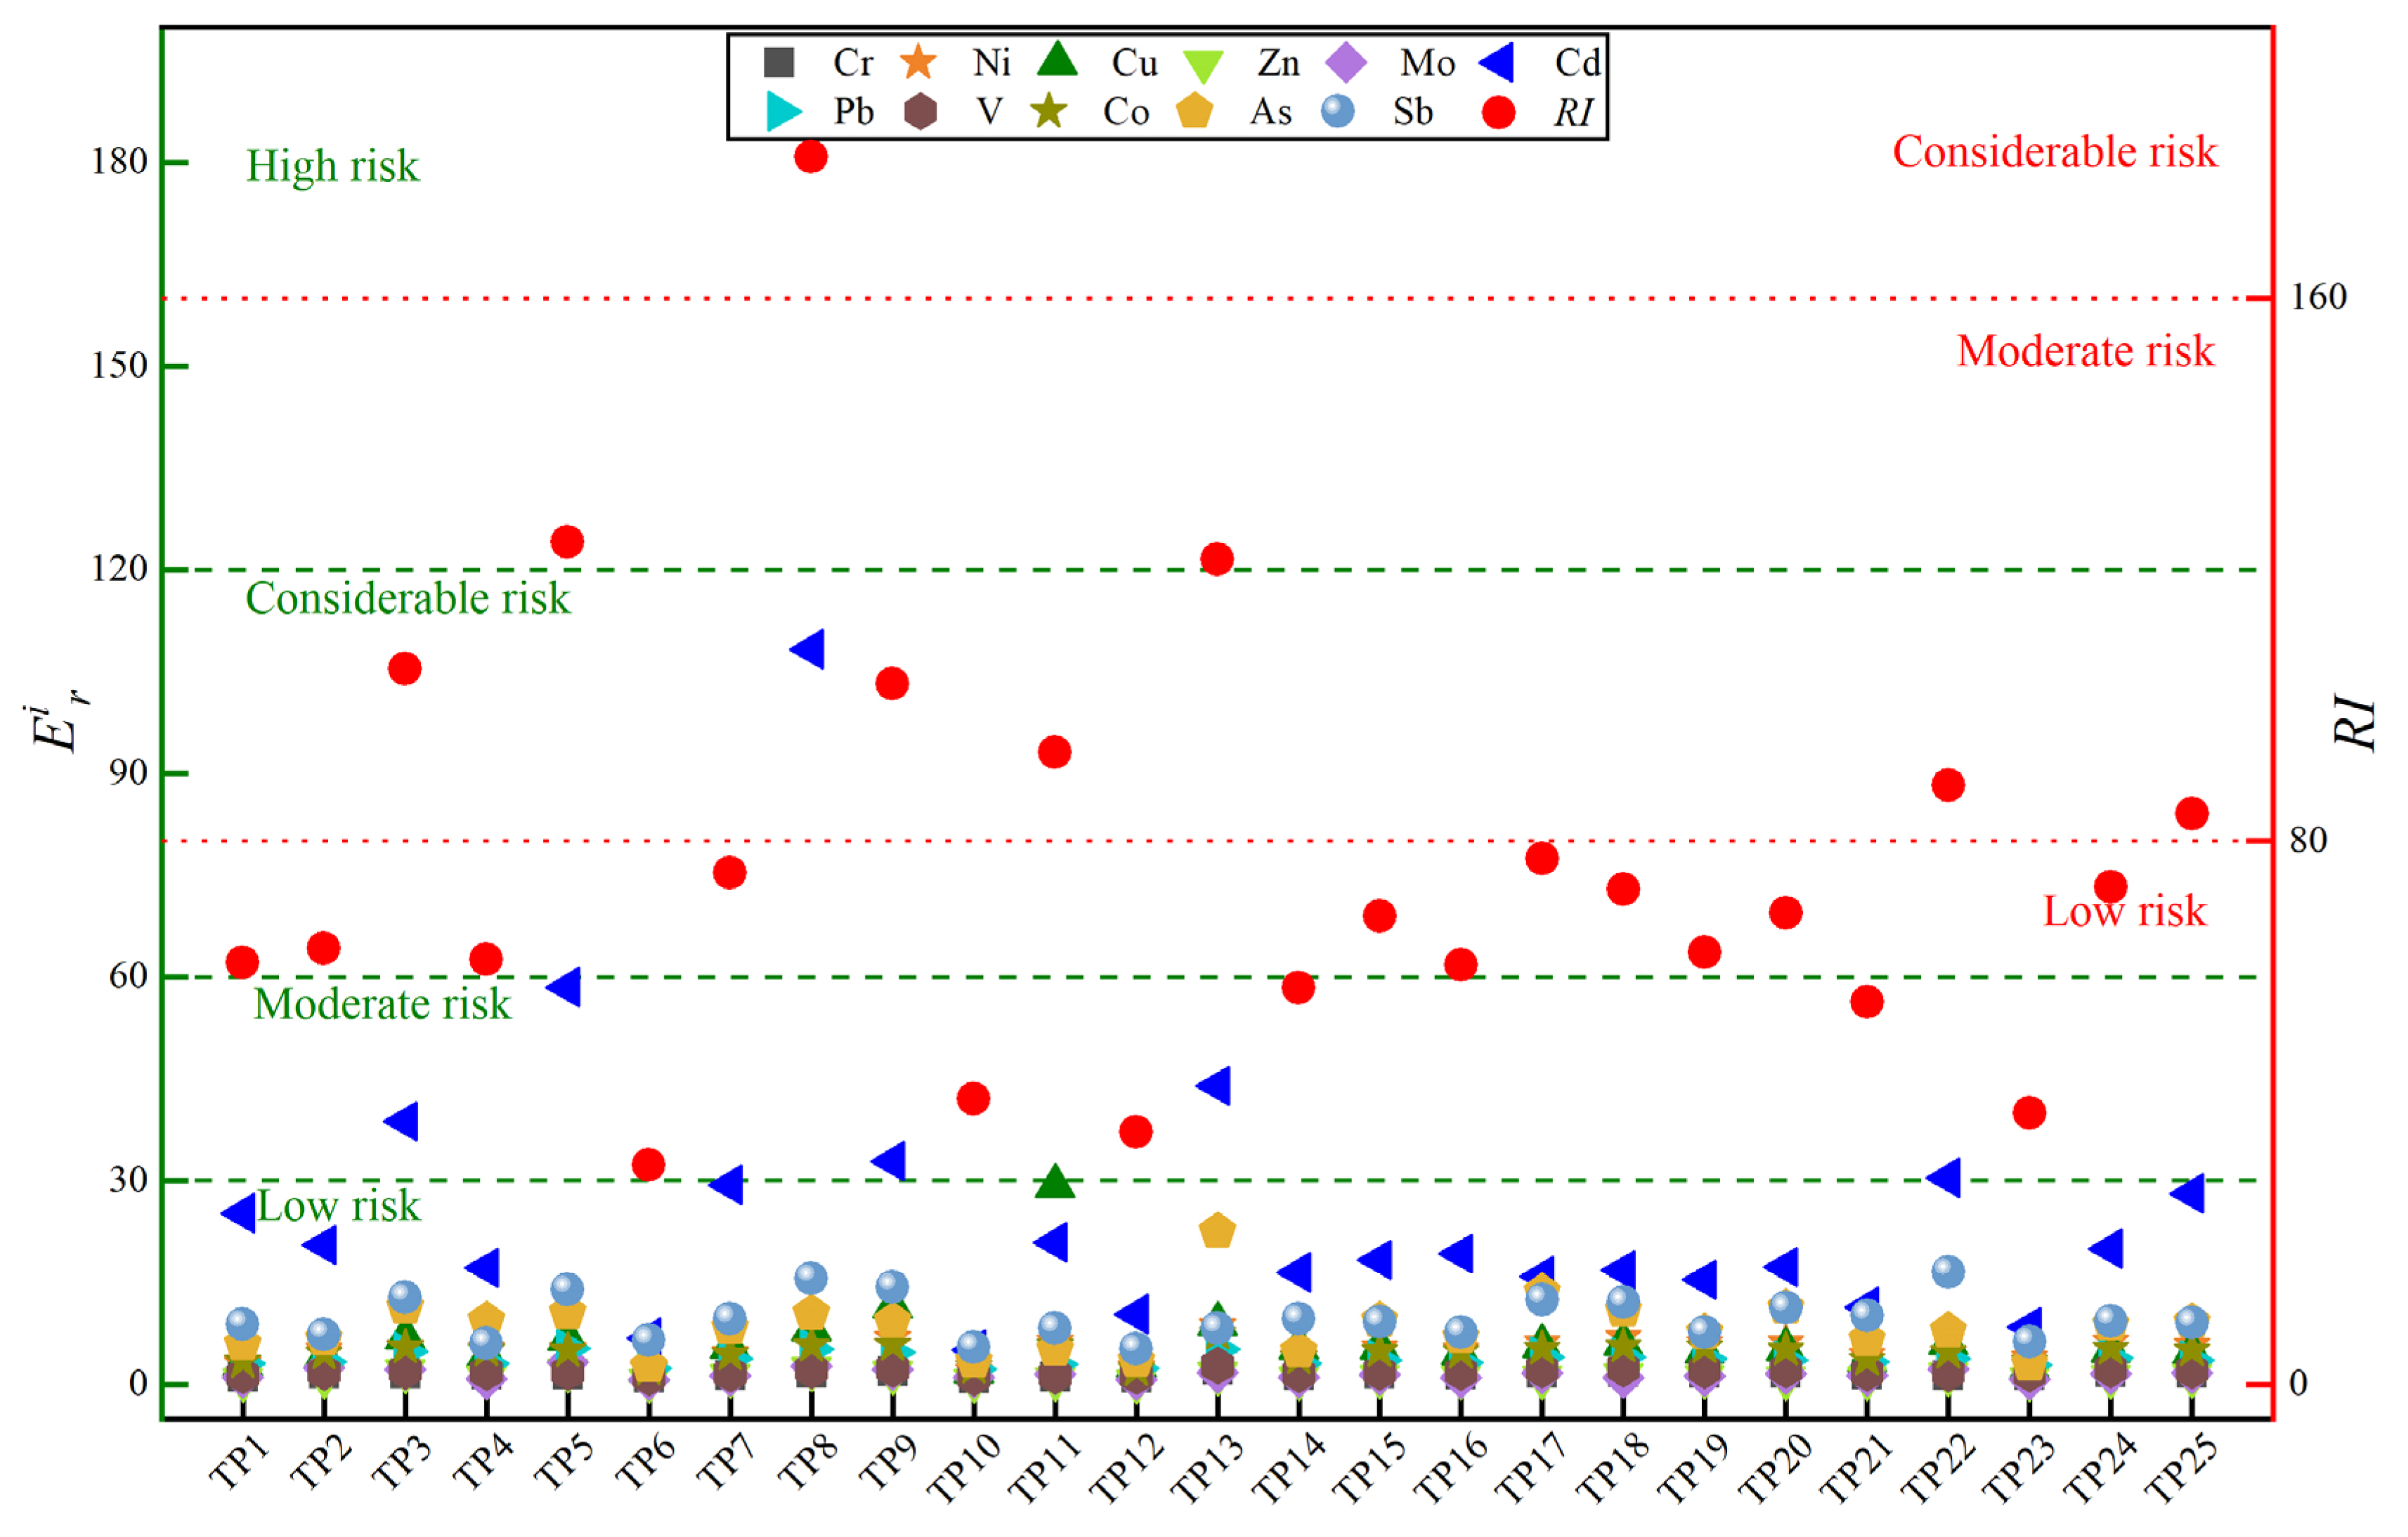
3.4.2. Environmental Risk Assessment

The potential ecological risk index of PTEs in the surface sediments of the Taipu River is shown in Figure 4. The potential ecological risk level of almost all elements is low risk ( E r i < 30). Only Cd exhibits a certain ecological risk at a few sites. In terms of a single PTE, the E r i value of Cd at TP3, TP5, TP9, TP13, and TP22 ranges from 30 to 60, which indicates moderate risk, and the E r i value at TP8 is between 60 and 120, indicating considerable risk. These are basically in line with the pollution level results obtained by I g e o and E F ; the difference in some elements (Mo and Cu) may be caused by the toxicity coefficient. As regards the comprehensive potential ecological risk index ( R I ), the value is 80 < R I < 160 at TP3, TP5, TP9, TP11, TP13, and TP22, which is a moderate risk level, while in TP8, it indicates a considerable risk. Other sampling sites in the study area are at low potential ecological risk. According to the above analysis, the ecological risk grades from small to large are Zn < Cr < V < Pb < Co < Ni < Cu < As < Sb < Cd.

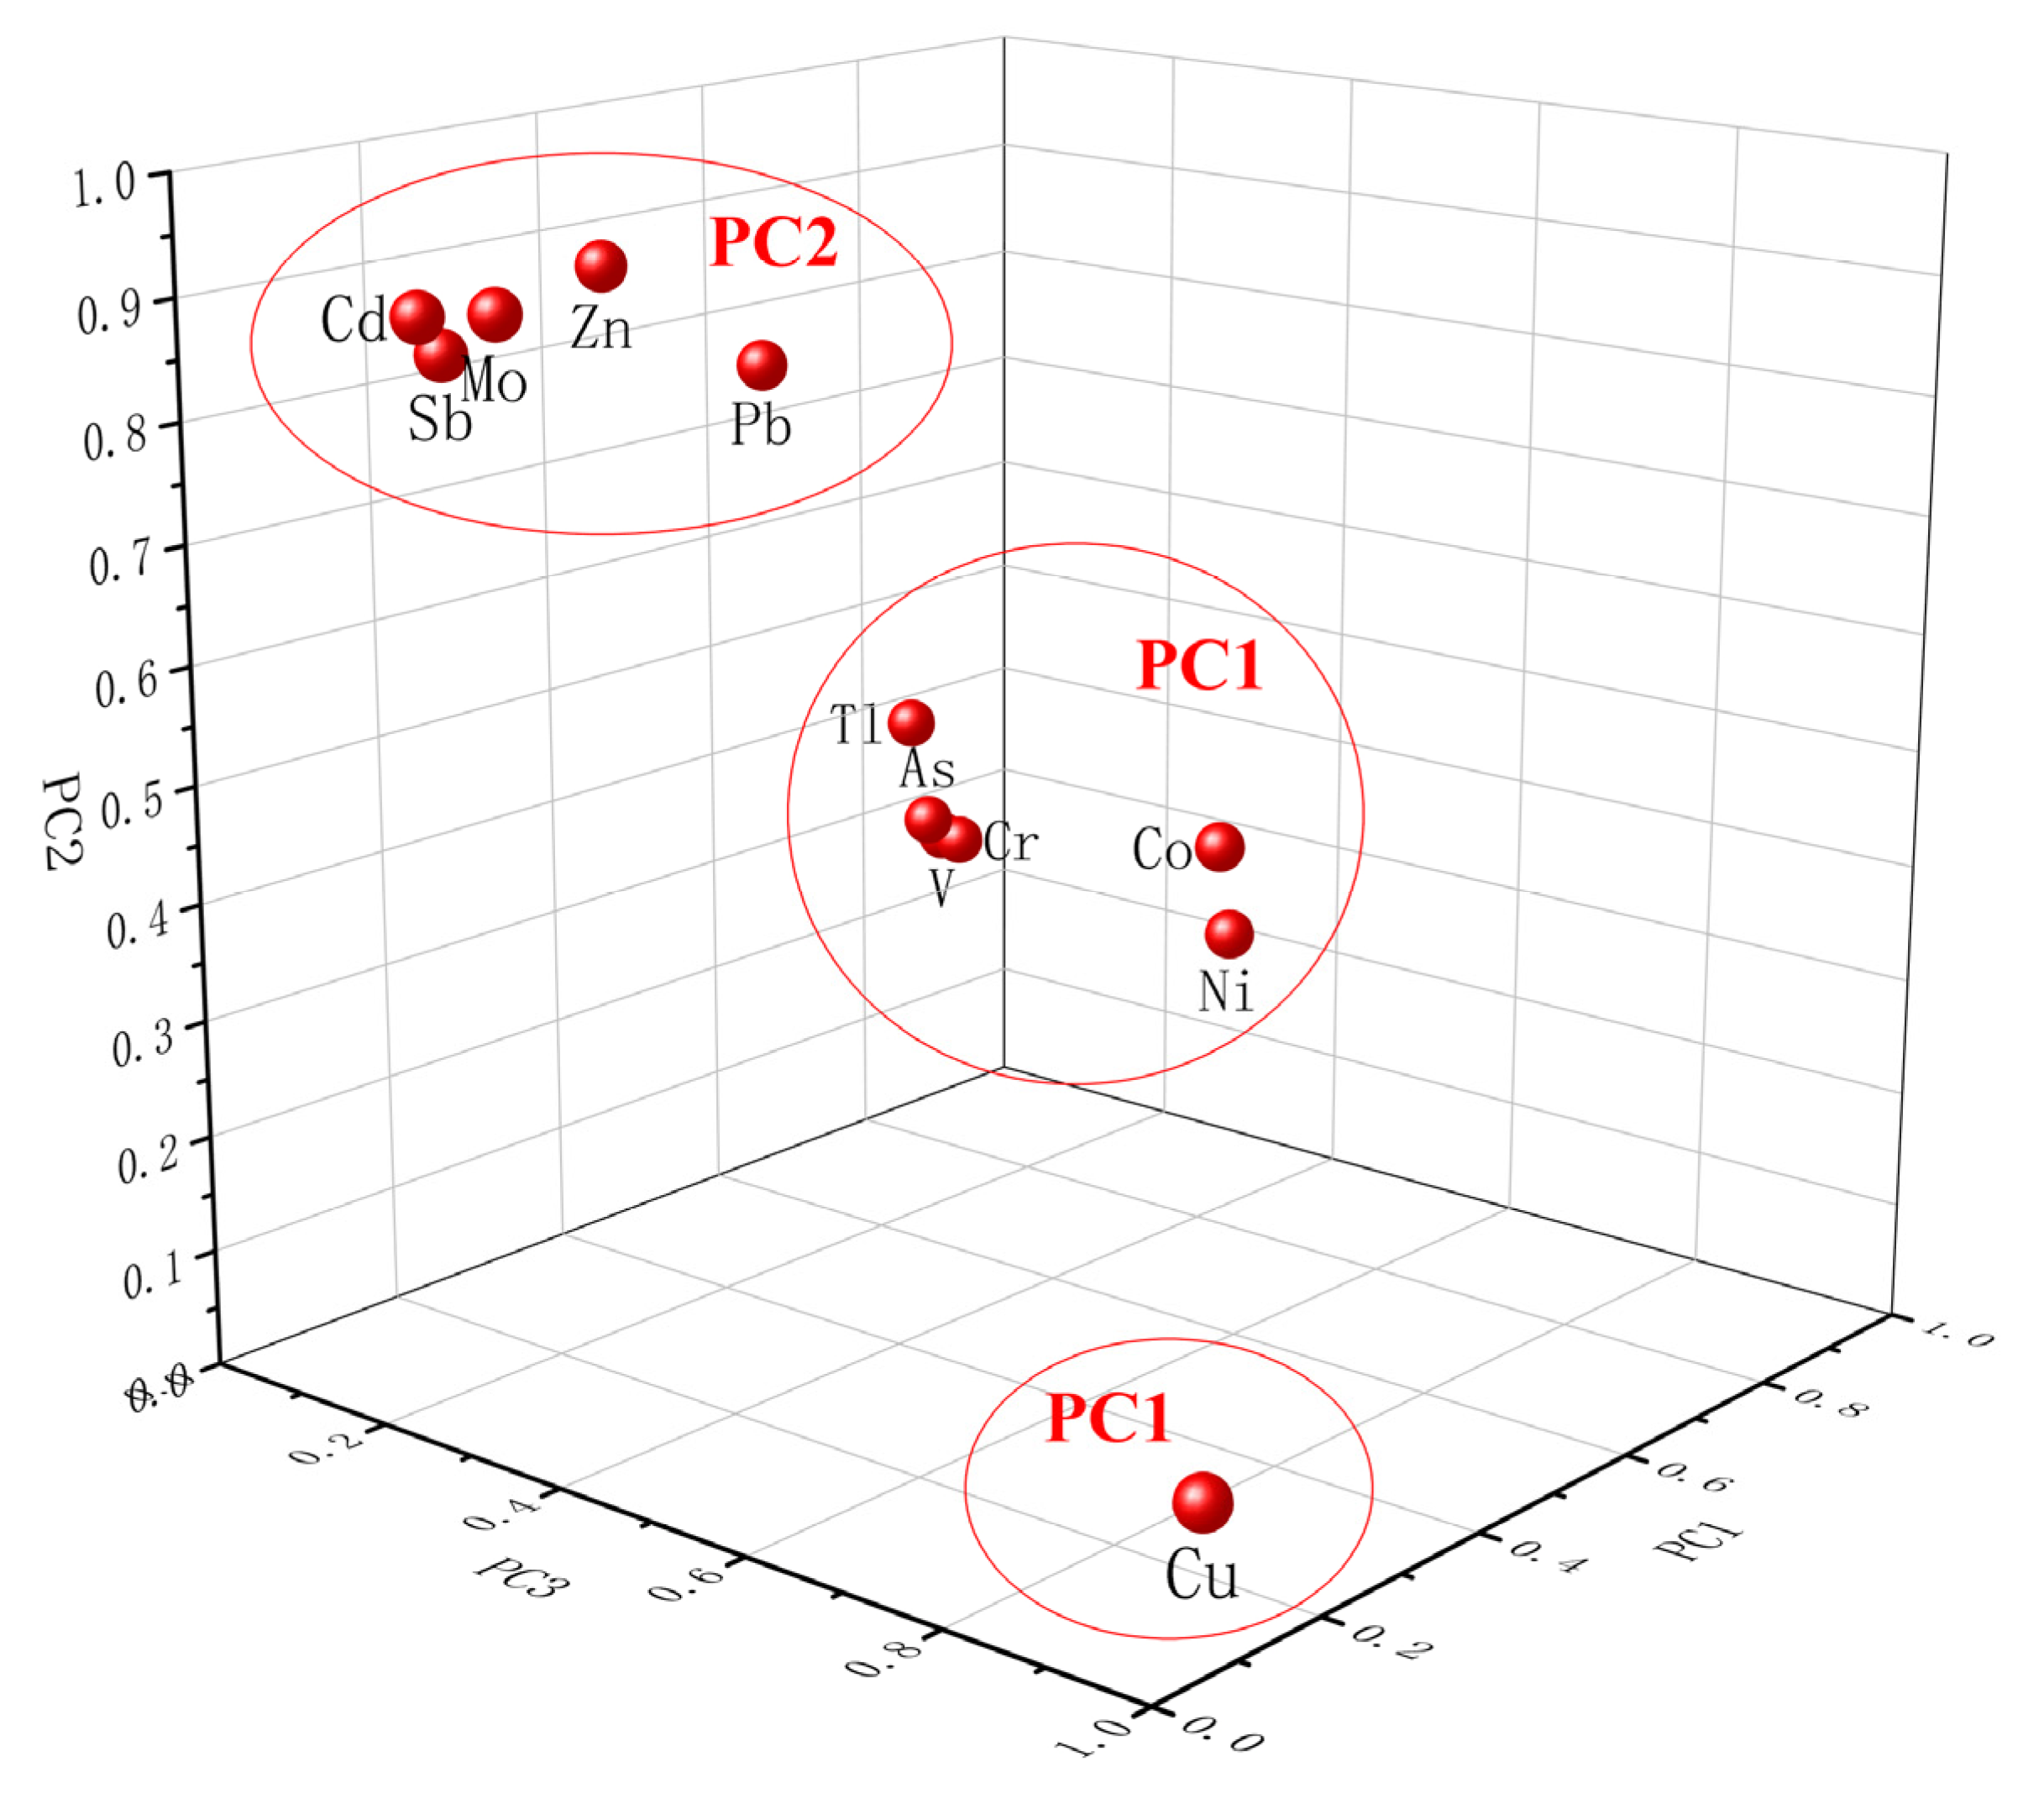
3.5. Source Apportionment

The PCA was used to distinguish the pollution sources of PTEs in the sediments (Figure 5). The Kaiser–Meyer–Olkin (KMO) test value is 0.779, and the Bartlett sphericity test value P (corresponding to 0.000) is below 0.05, indicating that the data is suitable for principal component analysis. Three principal components loaded with eigenvalues >1 were extracted. which together explain 91.006% of the concentrations of these PTEs. PC1 explains 46.576% of the total variation, and it shows high loadings of Cr, Ni, Tl, V, Co, and As. PC2 explains 33.699% of the total variation, with the higher loadings of Zn, Mo, Cd, Pb, and Sb. Moreover, PC3 explains the lowest percentage (10.732%) of the total variance, and it merely loads with Cu.
PC1 components are identified as natural sources, as the average concentrations of Cr, Ni, Tl, V, As, and Co are lower than or equivalent to the background value. Cr, Ni, Tl, and V are the only elements related to particle size (Table S6). Some studies assert that Cr, Ni, Tl, V, Pb, and Co are mainly controlled by the parent material and the soil-forming process [28]. The correlation coefficients of the five elements in PC2 are all >7, and the I g e o and E F values of Zn, Mo, and Cd reach the maximum at TP5 and TP8, indicating that these elements may originate from the same source to a greater extent. A large number of metal casting, textile, printing and dyeing, chemical fiber, and other industries are distributed near TP5 and TP8. Cd, Cu, Mo, Pb, and Sb are common elements in wastewater from these industries [29,30,31,32,33,34]. In summary, PC2 components are considered industrial sources. The only contributing element of PC3 is Cu. In aquaculture activities with a long history along the Taipu River, copper sulfate (CuSO4) algaecides or parasiticides are used to control the outbreak of cyanobacteria [35]. In Han’s study, with the CuSO4·5H2O-amended, pond sediment had a high total Cu concentration of 172.5 mg/kg, and four to five times higher than the data measured in the nonamended pond sediment, demonstrating an apparent copper accumulation [36]. Based on this, it can be denoted that PC3 might be mainly associated with the nearby aquaculture activities, especially the frequent addition of copper sulfate.

4. Conclusions

(1) The average contents of PTEs Cr, Ni, Cu, Zn, Mo, Cd, Tl, Pb, V, Co, As, and Sb in the surface sediments of the Taipu River are 58.2 ± 11.9 mg/kg, 27.6 ± 8.3 mg/kg, 27.5 ± 23.0 mg/kg, 71.7 ± 28.7 mg/kg, 0.457 ± 0.192 mg/kg, 0.107 ± 0.087 mg/kg, 0435 ± 0.088 mg/kg, 19.1 ± 4.41 mg/kg, 77.1 ± 17.11 mg/kg, 11.8 ± 3.04 mg/kg, 8.4 ± 4.04 mg/kg, 1.01 ± 0.321 mg/kg. The concentrations of Mo, Cu, Cd, Ni, and Zn are generally higher than the soil background value from Jiangsu Province, and other elements fluctuate around the background value. Compared with other rivers at domestic and abroad, the surface sediments of the Taipu River are slightly polluted. Spatially, Zn, Mo, and Sb have higher concentrations upstream, while As concentrations are enriched in the middle reaches, and the characteristic elements downstream are Ni, Cr, Tl, V, Co, and Sb.
(2) In the pollution assessment, based on deep soil background values, the I g e o values of Mo and Cd show uncontaminated to moderately polluted conditions at TP5 and TP8, while Cu is moderately polluted at TP11. E F indicates that Zn (TP5), Mo (TP2, TP3, TP5, TP8, TP11, TP22), and Cd (TP5, TP8) are slightly or moderately enriched at some sites, while Cu shows moderately severe enrichment ( E F = 8.95 ) at TP11. In the risk assessment, the potential ecological risk of almost all elements is low, and only Cd has moderate risk and considerable risk in individual sites. A comprehensive evaluation of R I   (168.37) revealed a moderate risk level at TP8. Determination of sediment background values in the study area is necessary to provide a more accurate assessment in the future.
(3) The analysis of contamination sources indicated that Cr, Ni, Tl, V, As, and Co derived from natural sources. Zn, Mo, Cd, Pb, and Sb are considered to have originated from industrial sources, which may be associated with industrial activities. Copper, independent of other elements, possibly derived from the long historic aquaculture activities along the Taipu River.
(4) In this study, the concentrations of 12 PTEs are generally low, but there may be potential risks at individual sites. For the safety of water quality in the upper and lower reaches of the Taipu River, it is recommended that managers particularly consider Cd, Mo, and Cu levels.

Supplementary Materials

The following are available online at https://www.mdpi.com/article/10.3390/min11111202/s1, Table S1: Pollution grades of the geo-accumulation index ( I g e o ); Table S2: Enrichment factor ( E F ) of different levels; Table S3: The categories of potential ecological risk represented by E r i and R I ; Table S4: PTEs content in surface sediments of the Taipu River; Table S5: The content of PTEs in the surface sediments of the Taipu River and other rivers in the study [31,37,38,39,40,41,42,43,44,45,46,47,48,49,50]; Table S6: Correlation analysis of PTEs and physicochemical properties in surface sediments of the Taipu River; Figure S1: Percentage of different pollution grades of PTEs in the geoaccumulation index ( I g e o ) of 25 surface sediments in background values of three provinces (Zhejiang, Shanghai and Jiangsu); Figure S2: Percentage of different pollution grades of PTEs in the enrichment factor ( E F ) of 25 surface sediments in background values of three provinces (Zhejiang, Shanghai, and Jiangsu).

Author Contributions

Investigation, M.C.; data curation, Y.W.; writing—original draft preparation, Y.W.; writing—review and editing, F.L. and L.M.; supervision, H.T.; project administration, F.L.; funding acquisition, J.L. All authors have read and agreed to the published version of the manuscript.

Funding

This research was funded by the Fund of the Bureau of Water Resource of Wujiang District (SZSY2018-WJ-G-033).

Data Availability Statement

The data presented in this study are available in this article.

Acknowledgments

The authors gratefully acknowledge Wei Liu, Xiao Han, Jiong Huang and others for their hard work during sample collection.

Conflicts of Interest

The authors declare no conflict of interest.

References

  1. Li, F.; Huang, J.; Zeng, G.; Yuan, X.; Li, X.; Liang, J.; Wang, X.; Tang, X.; Bai, B. Spatial risk assessment and sources identification of heavy metals in surface sediments from the Dongting Lake, Middle China. J. Geochem. Explor. 2013, 132, 75–83. [Google Scholar] [CrossRef]
  2. Tam, N.F.Y.; Wong, Y.S. Spatial variation of heavy metals in surface sediments of Hong Kong mangrove swamps. Environ. Pollut. 2000, 110, 195–205. [Google Scholar] [CrossRef]
  3. Ikem, A.; Egiebor, N.O.; Nyavor, K. Trace Elements in Water, Fish and Sediment from Tuskegee Lake, Southeastern USA. Water Air Soil Pollut. 2003, 149, 51–75. [Google Scholar] [CrossRef]
  4. Duncan, A.E.; de Vries, N.; Nyarko, K.B. Assessment of Heavy Metal Pollution in the Sediments of the River Pra and Its Tributaries. Water Air Soil Pollut. 2018, 229, 272. [Google Scholar] [CrossRef] [PubMed] [Green Version]
  5. Kalnejais, L.H.; Martin, W.R.; Signell, R.P.; Bothner, M.H. Role of Sediment Resuspension in the Remobilization of Particulate-Phase Metals from Coastal Sediments. Environ. Sci. Technol. 2007, 41, 2282–2288. [Google Scholar] [CrossRef]
  6. Audry, S.; Schäfer, J.; Blanc, G.; Jouanneau, J.M. Fifty-year sedimentary record of heavy metal pollution (Cd, Zn, Cu, Pb) in the Lot River reservoirs (France). Environ. Pollut. 2004, 132, 413–426. [Google Scholar] [CrossRef]
  7. Zhu, H. Distribution and control countermeasures for antimony in water source of Huangpu River upper stream. Water Purif. Technol. 2018, 37, 25–32. [Google Scholar]
  8. Wang, X.; Lu, Y.; Han, J.; He, G.; Wang, T. Identification of anthropogenic influences on water quality of rivers in Taihu watershed. J. Environ. Sci. 2007, 19, 475–481. [Google Scholar] [CrossRef]
  9. Yao, H.; Qian, X.; Yin, H.; Gao, H.; Wang, Y. Regional Risk Assessment for Point Source Pollution Based on a Water Quality Model of the Taipu River, China. Risk Anal. 2015, 35, 265–277. [Google Scholar] [CrossRef] [PubMed]
  10. Guo, J.; Wang, L.; Yang, L.; Deng, J.; Zhao, G.; Guo, X. Spatial-temporal characteristics of nitrogen degradation in typical Rivers of Taihu Lake Basin, China. Sci. Total Environ. 2020, 713, 136456. [Google Scholar] [CrossRef] [PubMed]
  11. Yao, H.; Zhuang, W.; Qian, Y.; Xia, B.; Yang, Y.; Qian, X. Estimating and Predicting Metal Concentration Using Online Turbidity Values and Water Quality Models in Two Rivers of the Taihu Basin, Eastern China. PLoS ONE 2016, 11, e0152491. [Google Scholar] [CrossRef] [PubMed]
  12. Yao, H. Study on Regional Risk Assessment and Risk Governance Based on Water Quality Modelling—Exampled in the Multi-Provincial Boundary Region of the Taihu Basin, China; Nanjing University: Nanjing, China, 2015. [Google Scholar]
  13. Xue, B.; Yao, S. Recent sedimentation rates in lakes in lower Yangtze River basin. Quat. Int. 2011, 244, 248–253. [Google Scholar] [CrossRef]
  14. China Environment Publishing Group. Soil-Determination of pH-Potentiometry; Ministry of Ecology and Environment of the People’s Republic of China, China Environment Publishing Group: Beijing, China, 2018. [Google Scholar]
  15. China Environment Publishing Group. Soil-Determination of Organic Carbon-Combustion Oxidation Nondispersive Infrared Absorption Method; Ministry of Ecology and Environment of the People’s Republic of China, China Environment Publishing Group: Beijing, China, 2014. [Google Scholar]
  16. National Standardization Administration of the People’s Republic of China. Specifications for Oceanographic Survey —Part 8: Marine Geology and Geophysics Survey; Inspection and Quarantine of the People’s Republic of China General Administration of Quality Supervision, National Standardization Administration of the People’s Republic of China: Beijing, China, 2008. [Google Scholar]
  17. Müller, G. Index of Geoaccumulation in Sediments of the Rhine River. GeoJournal 1969, 2, 108–118. [Google Scholar]
  18. Zoller, W.H.; Gladney, E.S.; Duce, R.A. Atmospheric Concentrations and Sources of Trace Metals at the South Pole. Science 1974, 183, 198. [Google Scholar] [CrossRef] [PubMed]
  19. Sinex, S.A.; Wright, D.A. Distribution of trace metals in the sediments and biota of Chesapeake Bay. Mar. Pollut. Bull. 1988, 19, 425–431. [Google Scholar] [CrossRef]
  20. Barbieri, M. The Importance of Enrichment Factor (EF) and Geoaccumulation Index (Igeo) to Evaluate the Soil Contamination. J. Geol. Geophys. 2016, 5, 1–4. [Google Scholar] [CrossRef]
  21. Hakanson, L. An ecological risk index for aquatic pollution control.a sedimentological approach. Water Res. 1980, 14, 975–1001. [Google Scholar] [CrossRef]
  22. Deng, J.; Zhang, J.; Yin, H.; Hu, W.; Zhu, J.; Wang, X. Ecological risk assessment and source apportionment of metals in the surface sediments of river systems in Lake Taihu Basin, China. Environ. Sci. Pollut. Res. Int. 2020, 27, 25943–25955. [Google Scholar] [CrossRef] [PubMed]
  23. Guozhong, Y. Background Value of Soil Elements in China; China Environmental Science Press: Beijing, China, 1991. [Google Scholar]
  24. Varol, M. Assessment of heavy metal contamination in sediments of the Tigris River (Turkey) using pollution indices and multivariate statistical techniques. J. Hazard. Mater. 2011, 195, 355–364. [Google Scholar] [CrossRef]
  25. Reimann, C.; Garrett, R.G. Geochemical background—Concept and reality. Sci. Total Environ. 2005, 350, 12–27. [Google Scholar] [CrossRef] [PubMed]
  26. Mao, L.; Ye, H.; Li, F.; Yang, M.; Tao, H.; Wen, H. Enrichment assessment of Sb and trace metals in sediments with significant variability of background concentration in detailed scale. Environ. Sci. Pollut. Res. Int. 2019, 26, 2794–2805. [Google Scholar] [CrossRef]
  27. Meklit, T.; Meirvenne, M.V.; Verstraete, S.; Bonroy, J.; Tack, F. Combining marginal and spatial outliers identification to optimize the mapping of the regional geochemical baseline concentration of soil heavy metals. Geoderma 2009, 148, 413–420. [Google Scholar] [CrossRef]
  28. Zhuang, S.; Lu, X.; Yu, B.; Fan, X.; Yang, Y. Ascertaining the pollution, ecological risk and source of metal(loid)s in the upstream sediment of Danjiang River, China. Ecol. Indic. 2021, 125, 107502. [Google Scholar] [CrossRef]
  29. Timofeev, I.; Kosheleva, N.; Kasimov, N. Contamination of soils by potentially toxic elements in the impact zone of tungstenmolybdenum ore mine in the Baikal region: A survey and risk assessment. Sci. Total Environ. 2018, 642, 63–76. [Google Scholar] [CrossRef]
  30. Ke, X.; Gui, S.; Huang, H.; Zhang, H.; Wang, C.; Guo, W. Ecological risk assessment and source identification for heavy metals in surface sediment from the Liaohe River protected area, China. Chemosphere 2017, 175, 473–481. [Google Scholar] [CrossRef]
  31. Shahab, A.; Zhang, H.; Ullah, H.; Rashid, A.; Rad, S.; Li, J.; Xiao, H. Pollution characteristics and toxicity of potentially toxic elements in road dust of a tourist city, Guilin, China: Ecological and health risk assessment. Environ. Pollut. 2020, 266 Pt 3, 115419. [Google Scholar] [CrossRef]
  32. Ziwa, G.; Crane, R.; Hudson-Edwards, K.A. Geochemistry, Mineralogy and Microbiology of Cobalt in Mining-Affected Environments. Minerals 2020, 11, 22. [Google Scholar] [CrossRef]
  33. Costa-Boddeker, S.; Hoelzmann, P.; Thuyen, L.X.; Huy, H.D.; Nguyen, H.A.; Richter, O.; Schwalb, A. Ecological risk assessment of a coastal zone in Southern Vietnam: Spatial distribution and content of heavy metals in water and surface sediments of the Thi Vai Estuary and Can Gio Mangrove Forest. Mar. Pollut. Bull. 2017, 114, 1141–1151. [Google Scholar] [CrossRef]
  34. Tallkvist, J.; Oskarsson, A. Molybdenum. In Handbook on the Toxicology of Metals, 4th ed.; Nordberg, G.F., Fowler, B.A., Nordberg, M., Eds.; Academic Press: San Diego, CA, USA, 2015; pp. 1077–1089. [Google Scholar]
  35. Xue, H.B.; Sigg, L.; Gchte, R. Transport of Cu, Zn and Cd in a Small Agricultural Catchment. Water Res. 2000, 34, 2558–2568. [Google Scholar] [CrossRef]
  36. Han, F.X.; Hargreaves, J.A.; Kingery, W.L.; Huggett, D.B.; Schlenk, D.K. Accumulation, distribution, and toxicity of copper in sediments of catfish ponds receiving periodic copper sulfate applications. J. Environ. Qual. 2001, 30, 912–919. [Google Scholar] [CrossRef] [PubMed]
  37. Weng, H. The Determination of Environmental Geochemical Baseline of Heavy Metals in the Surface Sediments of Lake Taihu and Lake Dianchi; Nanchang University: Nanchang, China, 2011. [Google Scholar]
  38. Manman, W. Risk Assessment and Source Analysis of Heavy Metals in Typical Rivers of Taihu Lake Basin. Doctoral dissertation; Nanjing University: Nanjing, China, 2016. [Google Scholar]
  39. Liu, J.; Ren, T.; Pu, Y.; Duan, Y.; Zhi, W.; Tang, Y.; Zhang, H.; Luo, P. Pollution status and source analysis of heavy metals in the Huangpu River Basin. Environ. Tech. 2019, 032, 1–7. [Google Scholar]
  40. Chai, L.; Li, H.; Yang, Z.; Min, X.; Liao, Q.; Liu, Y.; Men, S.; Yan, Y.; Xu, J. Heavy metals and metalloids in the surface sediments of the Xiangjiang River, Hunan, China: Distribution, contamination, and ecological risk assessment. Environ. Sci. Pollut. Res. Int. 2016, 24, 874–885. [Google Scholar] [CrossRef]
  41. Guoxin, L.; Wen, Z.; Yunpeng, X.; Xuemei, C. Evaluation of Heavy Metal Pollution and Estimation of Release Flux in Sediment of Dadu River. Environ Sci. Tech 2019, 42, 193–200. [Google Scholar]
  42. Fu, J.; Zhao, C.; Luo, Y.; Liu, C.; Kyzas, G.Z.; Luo, Y.; Zhao, D.; An, S.; Zhu, H. Heavy metals in surface sediments of the Jialu River, China: Their relations to environmental factors. J. Hazard. Mater. 2014, 270, 102–109. [Google Scholar] [CrossRef] [PubMed]
  43. Li, N.; Tian, Y.; Zhang, J.; Zuo, W.; Zhan, W.; Zhang, J. Heavy metal contamination status and source apportionment in sediments of Songhua River Harbin region, Northeast China. Environ. Sci. Pollut. Res. Int. 2017, 24, 1–12. [Google Scholar] [CrossRef]
  44. Tang, W.; Yu, Z.; Chao, W.; Shan, B.; Cui, J. Heavy metal contamination of overlying waters and bed sediments of Haihe Basin in China. Ecotoxicol. Environ. Saf. 2013, 98, 317323. [Google Scholar] [CrossRef]
  45. Jian, Z. Risk Assessment of Heavy Metals in Sediments in Drinking Water Sources: A Case Study of Biliuhe Reservoir in Dalian. Doctoral Dissertation, Dalian University of Technology, Dalian, China, 2016. [Google Scholar]
  46. Zhang, Z.; Li, J.; Mamat, Z.; Ye, Q.F. Sources identification and pollution evaluation of heavy metals in the surface sediments of Bortala River, Northwest China. Ecotoxicol. Environ. Saf. 2016, 126, 94–101. [Google Scholar] [CrossRef]
  47. Eqani, S. Geo-accumulation and enrichment of trace metals in sediments and their associated risks in the Chenab River, Pakistan. J. Geochem. Explor. 2016, 165, 62–70. [Google Scholar]
  48. Paramasivam, K.; Ramasamy, V.; Suresh, G. Impact of sediment characteristics on the heavy metal concentration and their ecological risk level of surface sediments of Vaigai river, Tamilnadu, India. Spectrochim. Acta A Mol. Biomol. Spectrosc. 2015, 137, 397–407. [Google Scholar] [CrossRef]
  49. Rahman, M.S.; Saha, N.; Molla, A.H. Potential ecological risk assessment of heavy metal contamination in sediment and water body around Dhaka export processing zone, Bangladesh. Environ. Earth Sci. 2014, 71, 2293–2308. [Google Scholar] [CrossRef]
  50. Barhoumi, B.; Beldean-Galea, M.S.; Ai-Rawabdeh, A.M.; Roba, C.; Martonos, I.M.; Balc, R.; Kahlaoui, M.; Touil, S.; Tedetti, M.; Driss, M.R. Occurrence, distribution and ecological risk of trace metals and organic pollutants in surface sediments from a Southeastern European river (Someu Mic River, Romania). Sci. Total Environ. 2019, 660, 660–676. [Google Scholar] [CrossRef] [PubMed]
Figure 1. The Sampling sites map of the Taipu River sediments (map source: National Catalogue Service For Geographic Information and Map World: www.tianditu.gov.cn (accessed on on 16 August 2021)).
Minerals 11 01202 g001
Figure 2. Spatial distribution map of PTEs concentration in sediments of the Taipu River: (a) Cr, Ni, Cu, Zn, Mo, Cd; (b) Tl, Pb, V, Co, As, Sb.
Minerals 11 01202 g002
Figure 3. (a) Geoaccumulation index ( I g e o ) of PTEs in surface sediments of the Taipu River; (b) enrichment factor ( E F ) of PTEs in surface sediments of the Taipu River.
Minerals 11 01202 g003
Figure 4. Potential ecological risk index ( E r i   a n d   R I ) of PTEs in surface sediments of Taipu River.
Minerals 11 01202 g004
Figure 5. Component loading, scores, and confidence ellipse of the three principal components (PCs) for PTEs concentrations by principal component analysis (the number in the brackets indicates the proportion of total variance explained by each PC).
Minerals 11 01202 g005
Table 1. Physicochemical properties data for surface sediment in the Taipu River.
Physicochemical IndexMaxMinMedianAverageStandard DeviationVariable Coefficient
pH8.816.487.867.650.560.074
TOC(g/kg)49.233.7310.2112.609.660.77
Clay (<4 μm) (%)75.477.3518.0924.9318.400.74
Silt (4–63 μm) (%)79.1024.5368.963.2214.850.23
Table 2. The content of PTEs in the surface sediments of the Taipu River (mg/kg).
AverageMedianMin–MaxDetection LimitStandard DeviationVariable Coefficient (%)Background
Cr58.257.935.6–85.30.1111.8820.477.8
Ni27.628.110.88–46.90.678.2630.026.7
Cu27.523.38.53–130.20.0623.383.722.3
Zn71.767.126.8–143.10.0528.740.162.6
Mo0.4600.4330.222–0.9630.020.1941.90.3
Cd0.1070.0810.021–0.4550.090.08781.50.126
Tl0.4350.4230.291–0.6170.080.08820.20.439
Pb19.118.412.03–27.50.034.4123.126.2
V77.177.245.8–116.50.1217.122.283.4
Co11.7812.585.48–18.90.153.0425.812.6
As8.398.332.70–22.50.114.0448.210
Sb1.0130.9500.549–1.7170.670.32131.71.04
Publisher’s Note: MDPI stays neutral with regard to jurisdictional claims in published maps and institutional affiliations.

