
Application of Deep Learning in Petrographic Coal Images Segmentation


1
Department of Acoustics, Electronics and IT Solutions, GIG Research Institute, 40-166 Katowice, Poland
2
Department of Solid Fuels Quality Assessment, GIG Research Institute, 40-166 Katowice, Poland
*
Author to whom correspondence should be addressed.
Minerals 2021, 11(11), 1265; https://doi.org/10.3390/min11111265
Submission received: 8 September 2021
/
Revised: 3 November 2021
/
Accepted: 10 November 2021
/
Published: 13 November 2021
(This article belongs to the Special Issue Advances in Computational Intelligence Applications in the Mining Industry)
Abstract
:The study of the petrographic structure of medium- and high-rank coals is important from both a cognitive and a utilitarian point of view. The petrographic constituents and their individual characteristics and features are responsible for the properties of coal and the way it behaves in various technological processes. This paper considers the application of convolutional neural networks for coal petrographic images segmentation. The U-Net-based model for segmentation was proposed. The network was trained to segment inertinite, liptinite, and vitrinite. The segmentations prepared manually by a domain expert were used as the ground truth. The results show that inertinite and vitrinite can be successfully segmented with minimal difference from the ground truth. The liptinite turned out to be much more difficult to segment. After usage of transfer learning, moderate results were obtained. Nevertheless, the application of the U-Net-based network for petrographic image segmentation was successful. The results are good enough to consider the method as a supporting tool for domain experts in everyday work.
1. Introduction
Coal petrography is a science that, despite the passage of many years, is developing and updating its knowledge with a view to new directions for use in the energy industry. Particular emphasis is placed on clean coal technologies as well as the recovery of critical elements from coal [1,2,3,4,5,6].
Coal is a heterogeneous substance in terms of its chemical composition. Its heterogeneity is due to the variation in the peat-forming plant material from which it was formed and the variation in the conditions, time, pressure, and temperature to which the organic material was subjected during both its biochemical and geochemical phases [7]. The basic units of the structure of coal, homogeneous in physical and chemical terms, are macerals. The study of the petrographic structure of coal is important from both a cognitive and a utilitarian point of view [7,8,9,10,11]. It is the petrographic constituents and their individual characteristics and features that are responsible for the property of coal and the way it behaves in various technological processes [7,8,12,13,14,15].
Knowledge of the percentage of individual petrographic constituents in coal is very important, as the petrographic constituents differ in terms of their physical and chemical properties, such as volatile matter content, elemental composition, vitrinite reflectance, and specific density, all of which affect the chemical, physical and technological properties of coal [7,13,16,17,18].
The knowledge of the petrographic and mineral composition of the coal deposit, and the properties resulting from this composition, should be the basis for optimizing the conditions in coal preparation plants [6,19,20]. Such an approach makes it possible to control the properties of the final product in order to obtain concentrates with precisely defined parameters and properties, usable in clean coal technologies (CCT), especially in combustion, coking, and gasification processes [21,22,23,24,25,26,27].
Petrographic studies are also used to determine the composition of coke mixtures and to forecast coke quality. In addition, petrographic analyses of coal are used in research on the production of liquid fuels by means of the direct hydrogenation method [13]. Another important parameter in the selection of coal for various technologies is the degree of coalification of the organic matter in coal, a measure of which is the reflectance value determined on one of the most homogeneous macerals, namely vitrinite [16,28].
The petrographic composition of hard coals and their degree of coalification, determined by analyzing huminite reflectance for low-rank coals, and vitrinite reflectance for medium- and high-rank coals, have become an important element in the classification of coals, both according to the Polish classification PN-G-97002:2018:11 Hard coal. Types and the international classification ISO 11760:2005 Classification of coals and international codification system for medium and high-rank coals, ECE/COAL/115, United Nations Publication, New York, 1998. The international classification and codification are based on both the maceral content in coal and the degree of vitrinite carbonization, while the Polish classification by type is based on the vitrinite reflectance value. Although huminite reflectance could be a useful parameter for low-rank coal, the heterogeneous geochemical characteristics of huminite macerals might also be problematic [7,29,30,31,32,33]. Based on the above information, it can be concluded that petrographic studies of coal are very frequently used, and thus they are becoming more and more important.
The microscopic analysis of composition is based on the identification of individual petrographic constituents observed by the operator in the microscopic image. The method is standardized and based on ISO 7404-3:1994 Methods for the petrographic analysis of bituminous coal and antaracite–Part 3: Method of determining maceral group composition, as well as the maceral classification of the International Committee for Coal and Organic Petrology (ICCP) [9,10,11]. The determination is based on the identification of macerals at a minimum of 500 points. Even though several attempts have been made to design automated systems, this analysis is still commonly based on a manual method, which is very time consuming. It requires a lot of knowledge and skill on the part of the operator.
The application of image analysis and computer vision in minerals science has a long and successful history. The images were used for the identification of the minerals based on their color and textural features [34,35,36]. There were also attempts at the determination of grains sizes using the computer vision approach when the boundaries were used using color [37,38] as well as texture [39,40] features. Computer vision was also used to analyze the microscopic images of minerals. Martens et al. analyzed the microscopic pictures of mortars to assess the distribution of the sand grains sizes [41]. Kazak et al. successfully applied machine learning methods in the analysis of focused ion beam scanning electron microscopy (FIB SEM) images for void space characterization of tight reservoir rocks [42]. Zhou et al. investigated the possibility of segmenting mineral grains in petrographic images using various edge detection algorithms [43]. A similar problem, but with the application of the level set method [44], was also considered in [45]. The attempts were made to use image analysis in the petrography, macerals, cleat, and lithotypes of coal samples as early as in the 1980s [46,47,48]. The researchers investigated different possibilities to differentiate the organic and mineral matter. Hou et al. used the time-of-flight secondary ion mass spectrometry to obtained images of the macerals and selected mineral matter [49]. Alphana et al., based on scanning electron microscope images (SEM) [50], calculated a set of color and textural features for each image. The classification process is aimed at predicting the coal quality, namely as best, good and poor. The application of radial base functions neural networks (RBFNN) outperformed the other classification methods. However, there was no attempt to identify the macerals composing the sample, and the application of SEM complicated the image acquisition. The most interesting and desirable solution should address the automation of coal petrography using the simplest image acquisition procedure possible. In this direction, O’Braien et al. proposed the usage of full maceral reflectograms for maceral identification [51]. The coal samples were submerged in resin and polished. After the resin regions were masked out in the image, the cumulative curve of reflectance was computed using the gray values of the remaining pixels. The shape of the curve reflects the composition of the coal. The method turned out to be successful, but it required appropriate preparation of sample and imaging protocol (e.g., usage of red dye for resin and green light for images acquisition). The gray level values had to be calibrated, so that the resulting curve could be interpreted in terms of maceral’s containment. The idea was further enhanced by using simultaneous analysis of optic and SEM gathered images [52]. The idea of the usage of optical microscopy obtained images for automated macerals identification was also considered by other researchers [53,54,55,56,57,58]. Młynarczuk and Skiba proposed the usage of machine learning (ML) and artificial intelligence methods in maceral identification [59]. The maceral group identification is based on the color features vector computed for the square neighborhood of the selected pixel. The k nearest neighbors (kNN) and multilevel perceptron (MLP) were used as the classifier. The results were very promising, and the method was developed to identify the macerals within the inertinite group [60]. The features vector was extended to include both color and texture properties of the pixels. The results were satisfactory, but the effectiveness depended on the maceral. However, none of the methods tried to semantically segment the image. One of the attempts in this direction was made by Wang et al. [56]. In this attempt, the shapes of macerals groups were identified using a clustering procedure, namely a modified k-means algorithm. Then, the discovered objects were classified using morphological, color and texture features. It should be emphasized that in addition to the analysis of images from various types of microscopes, other methods were also used for carbon analysis, examples of which can be found in [61,62].
Semantic segmentation is a topic of much research interest nowadays [63,64]. The application of deep learning (DL) and convolutional neural networks (CNN) allowed for achieving stunning results. The DL was used as a tool for microfossils, core images, petrographic and rock images classification [65]. Attempts are being made to apply these approaches to the analysis of coal characteristics and particularly its petrography using visual information. The most fundamental characteristic of coal’s run-of-mine (ROM) distinguishes between coal rocks and the accompanying gangue. Pu et al. used the VGG16 CNN for the classification of images presenting coal or gangue in different configurations (as stockpiles, during transportation, photographed in laboratory conditions, etc.) with satisfactory results [66]. Li et al. developed a solution for the identification of coal and gangue rocks on images [67]. The proposed framework processed the Gaussian pyramid of the input image. The rock grains were detected and classified as coal or gangue. The authors reported impressive accuracy, exceeding 98%, in rock type recognition. The application of semantic segmentation to maceral group identification was developed by Lei et al. [68]. The proposed network utilizes the U-Net [69] network enhanced with the attention gates. The authors used the multi-class form of the output layer of the network. The segmentation results were very good and proved the robustness of DL methods.
The identification of the macerals directly on the image by means of the direct assignment of the maceral label to every pixel would be beneficial in many ways. First of all, it will allow the determination of maceral composition. Secondly, it would provide the scientist with information allowing them to judge whether the individual parts of the image have been correctly identified. Third, the calibration should not be critical in maceral identification, because not only are the color statistics considered, but also the spatial arrangement of pixels constituting the maceral groups (for medium- and high-rank coals). Therefore, attempts were made to develop a method suitable for such coal petrographic images analysis. The presented paper provides a proposition of such a method using the deep learning approach. The highlights of the presented results include the development of the coal petrographic images database, the method of image preparation and augmentation, and the development of a U-Net [69]-based convolutional neural network for the semantic segmentation of coal petrographic images. The proposed approach is based on using single-class classification—a separate model of the same architecture was trained for each of the macerals.
2. Materials and Methods
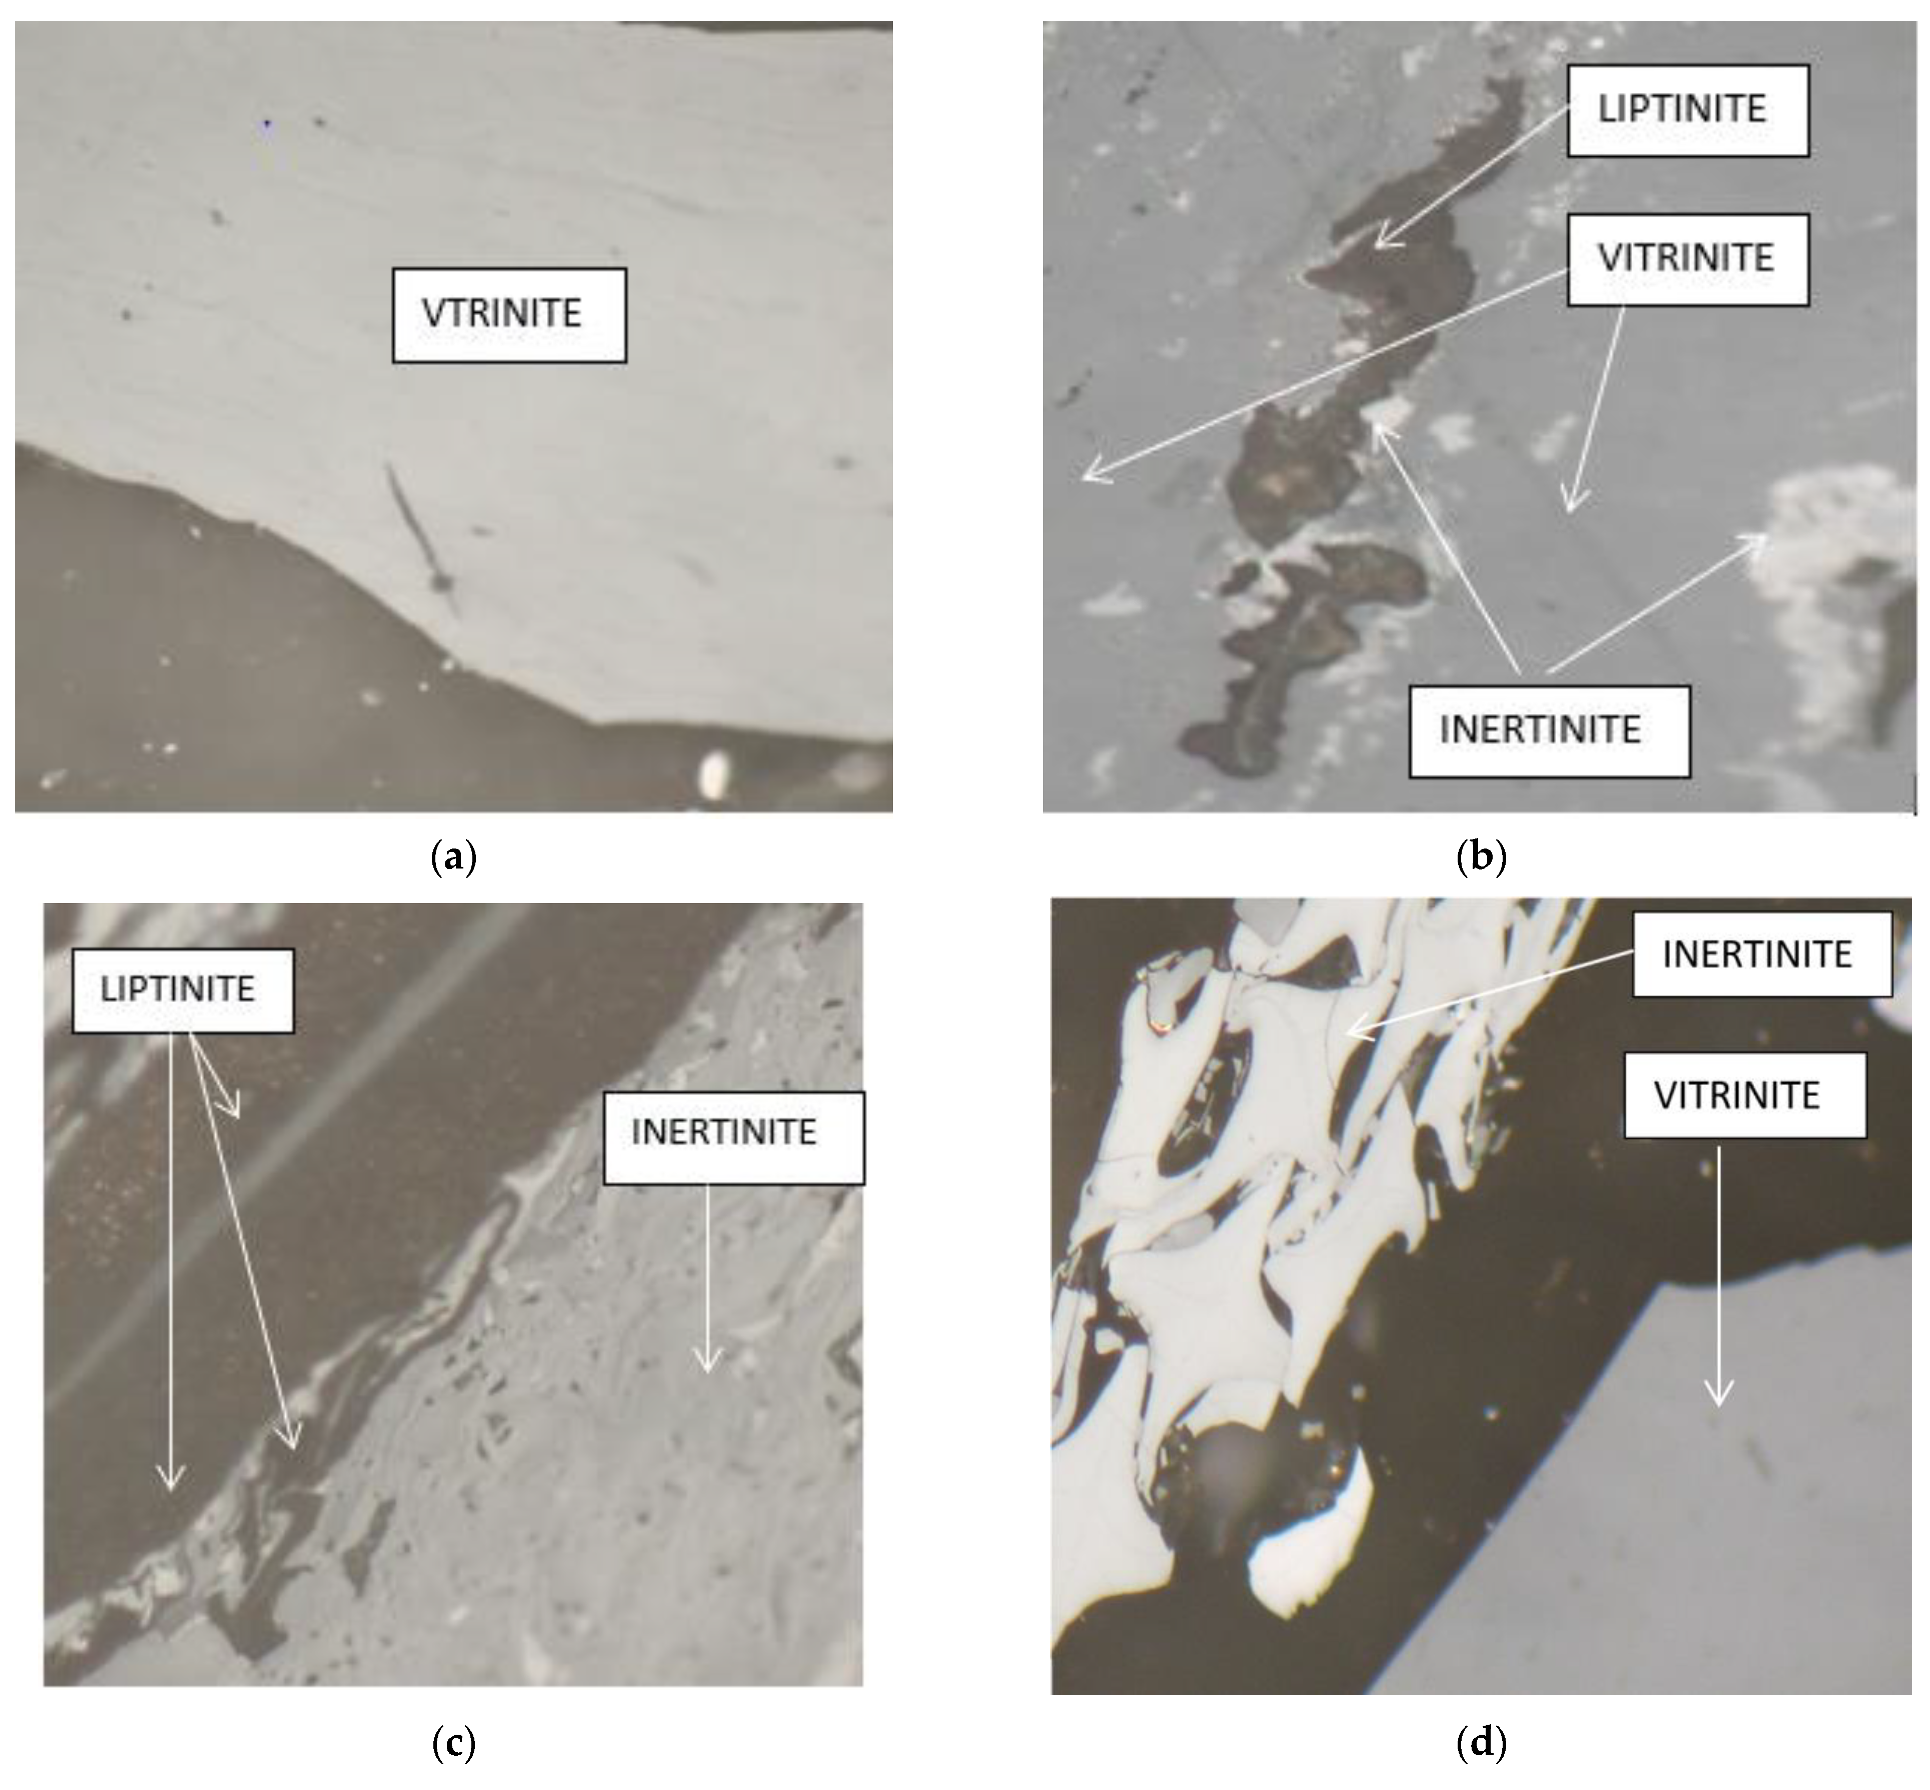
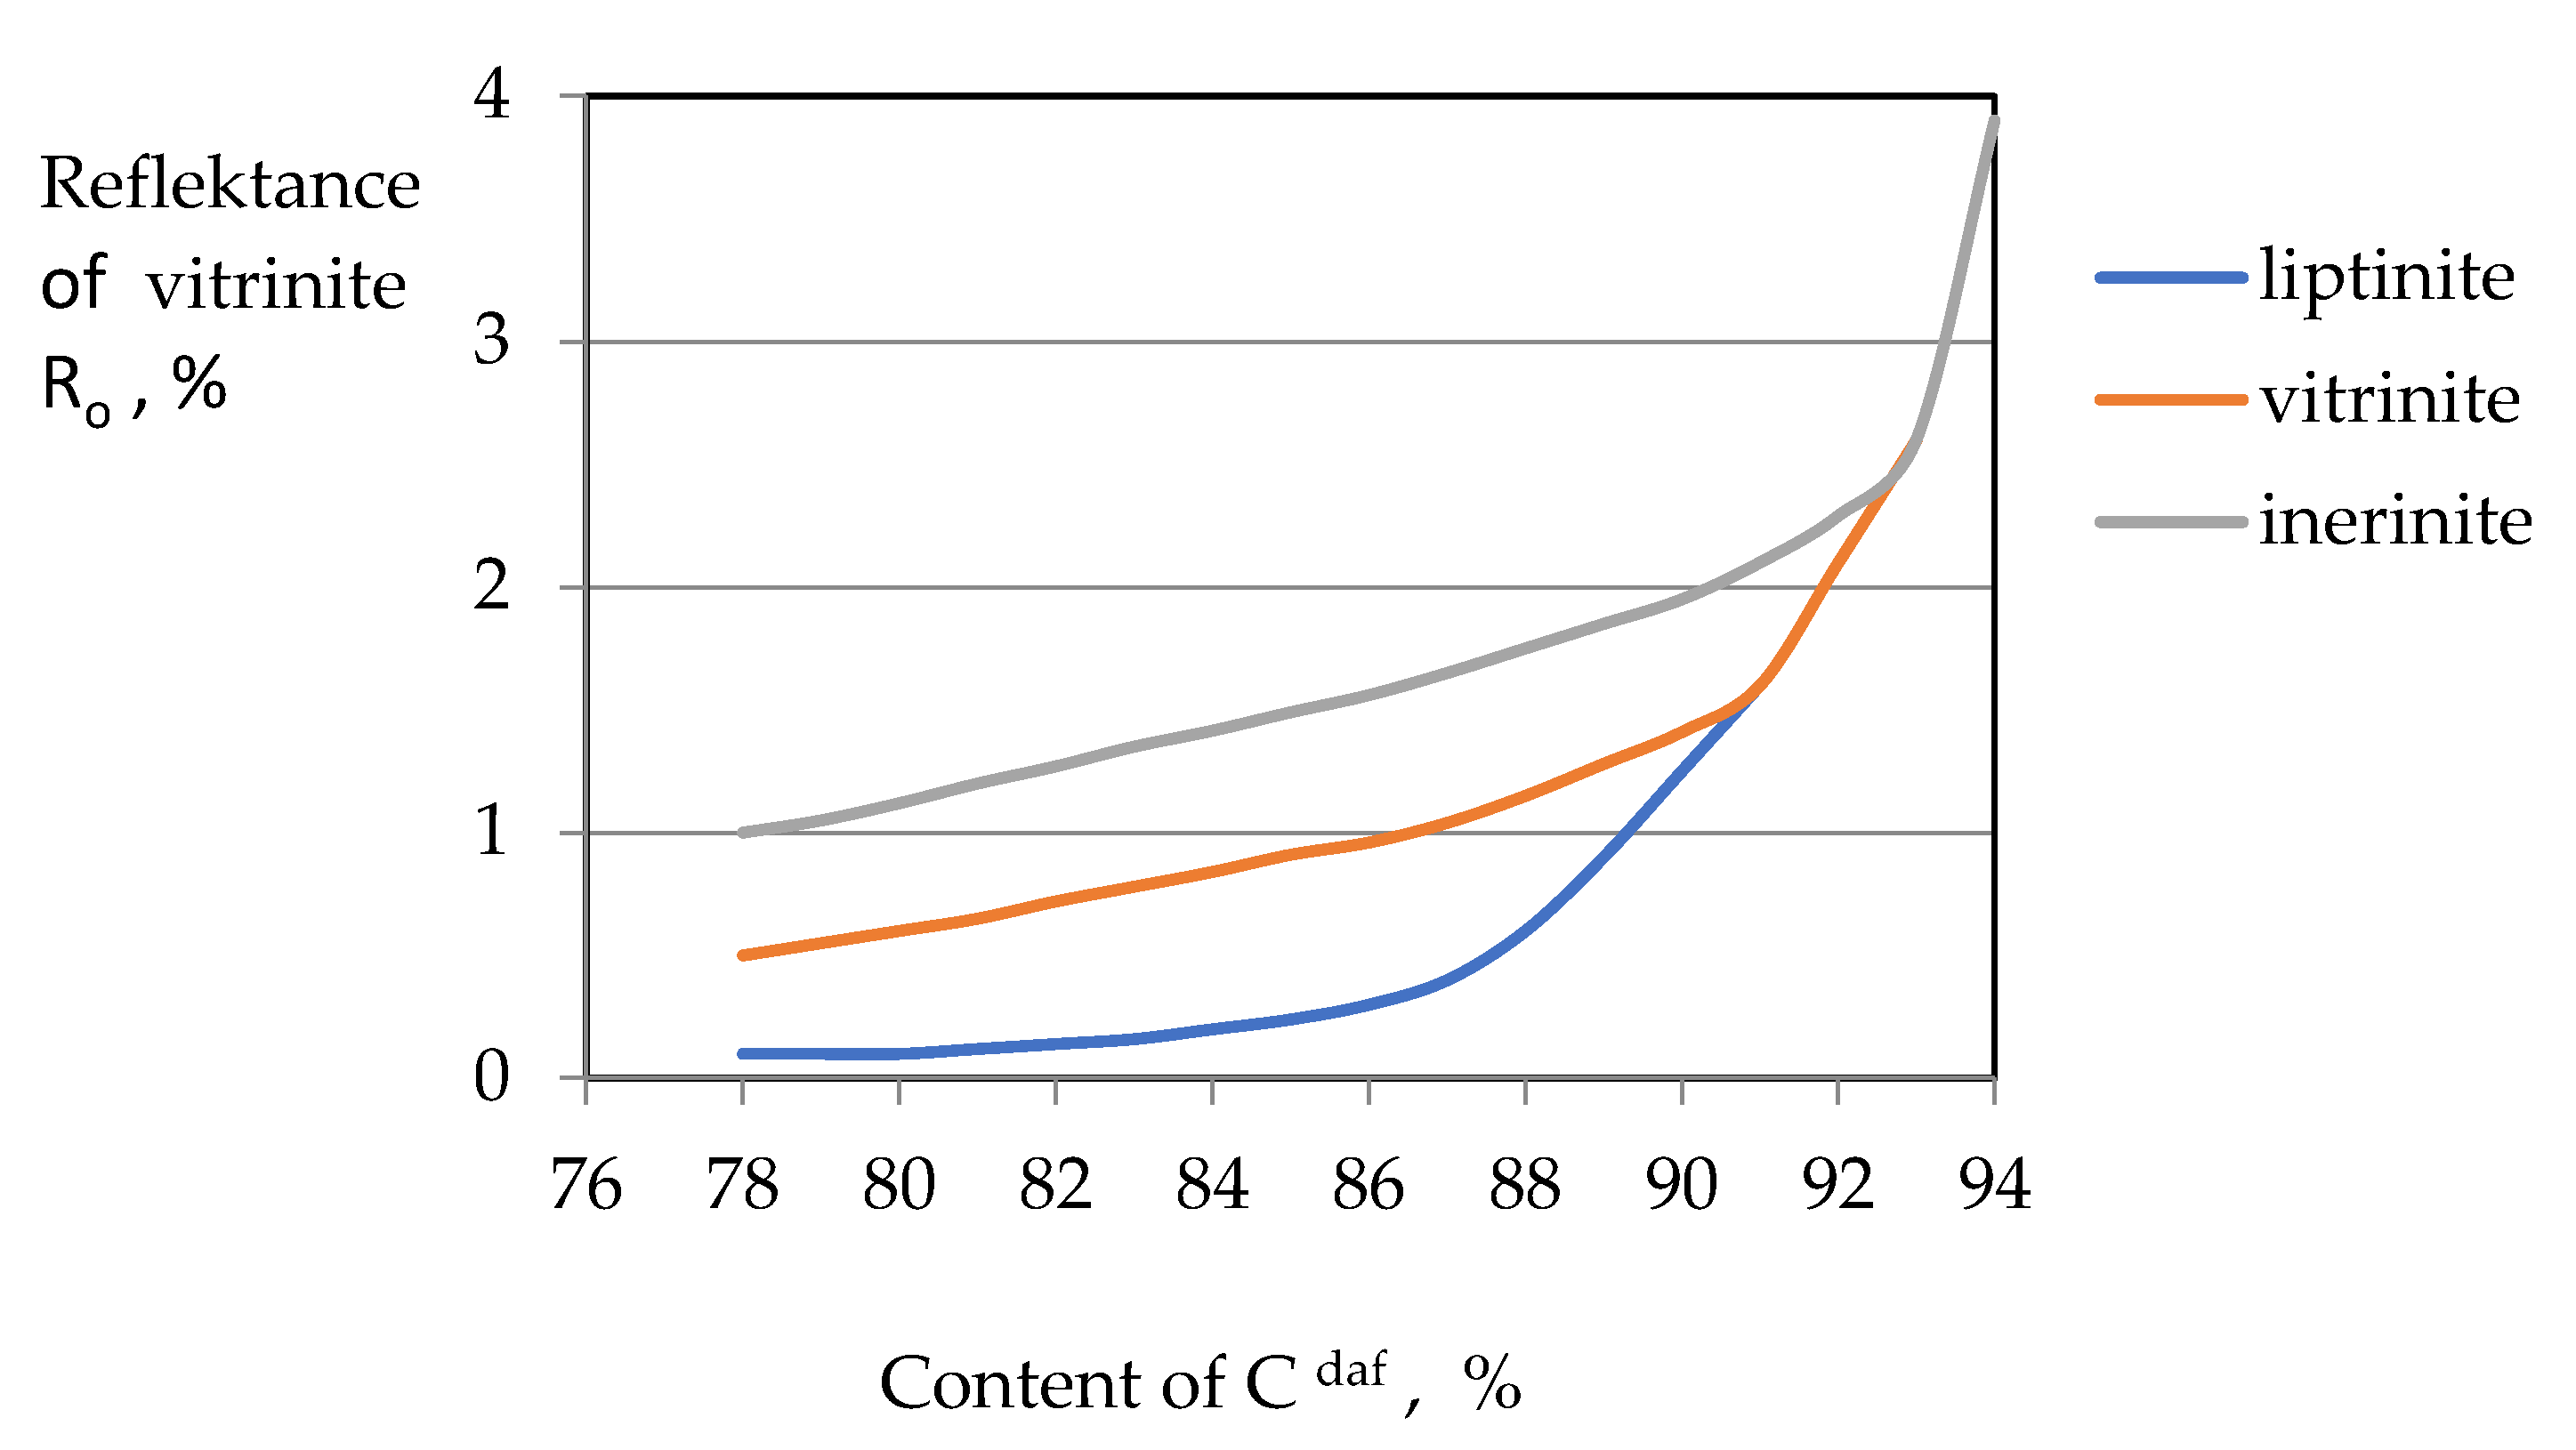
The identification of macerals is based on the microscopic evaluation of grain morphology and color. On this basis, three groups of macerals were distinguished: liptinite, vitrinite, and inertinite (Figure 1) [9,10,11]. The color of liptinite changes from brown through dark grey to light grey in the microscopic image. Under incident light, depending on coal rank, the color of vitrinite changes from dark grey through light grey to almost white. On the other hand, in the same light conditions, the color of inertinite in coal is always the brightest and changes from light grey to white and bright white. The reflectance of all macerals increases with the increasing carbonization of the organic matter of the coal (Figure 2). At the vitrinite reflectance (%Rr) level of about 1.5%, the simultaneous differences in reflectance and in color between liptinite and vitrinite disappear, and with a %Rr about 2.4%, the differences between vitrinite and inertinite also disappear.
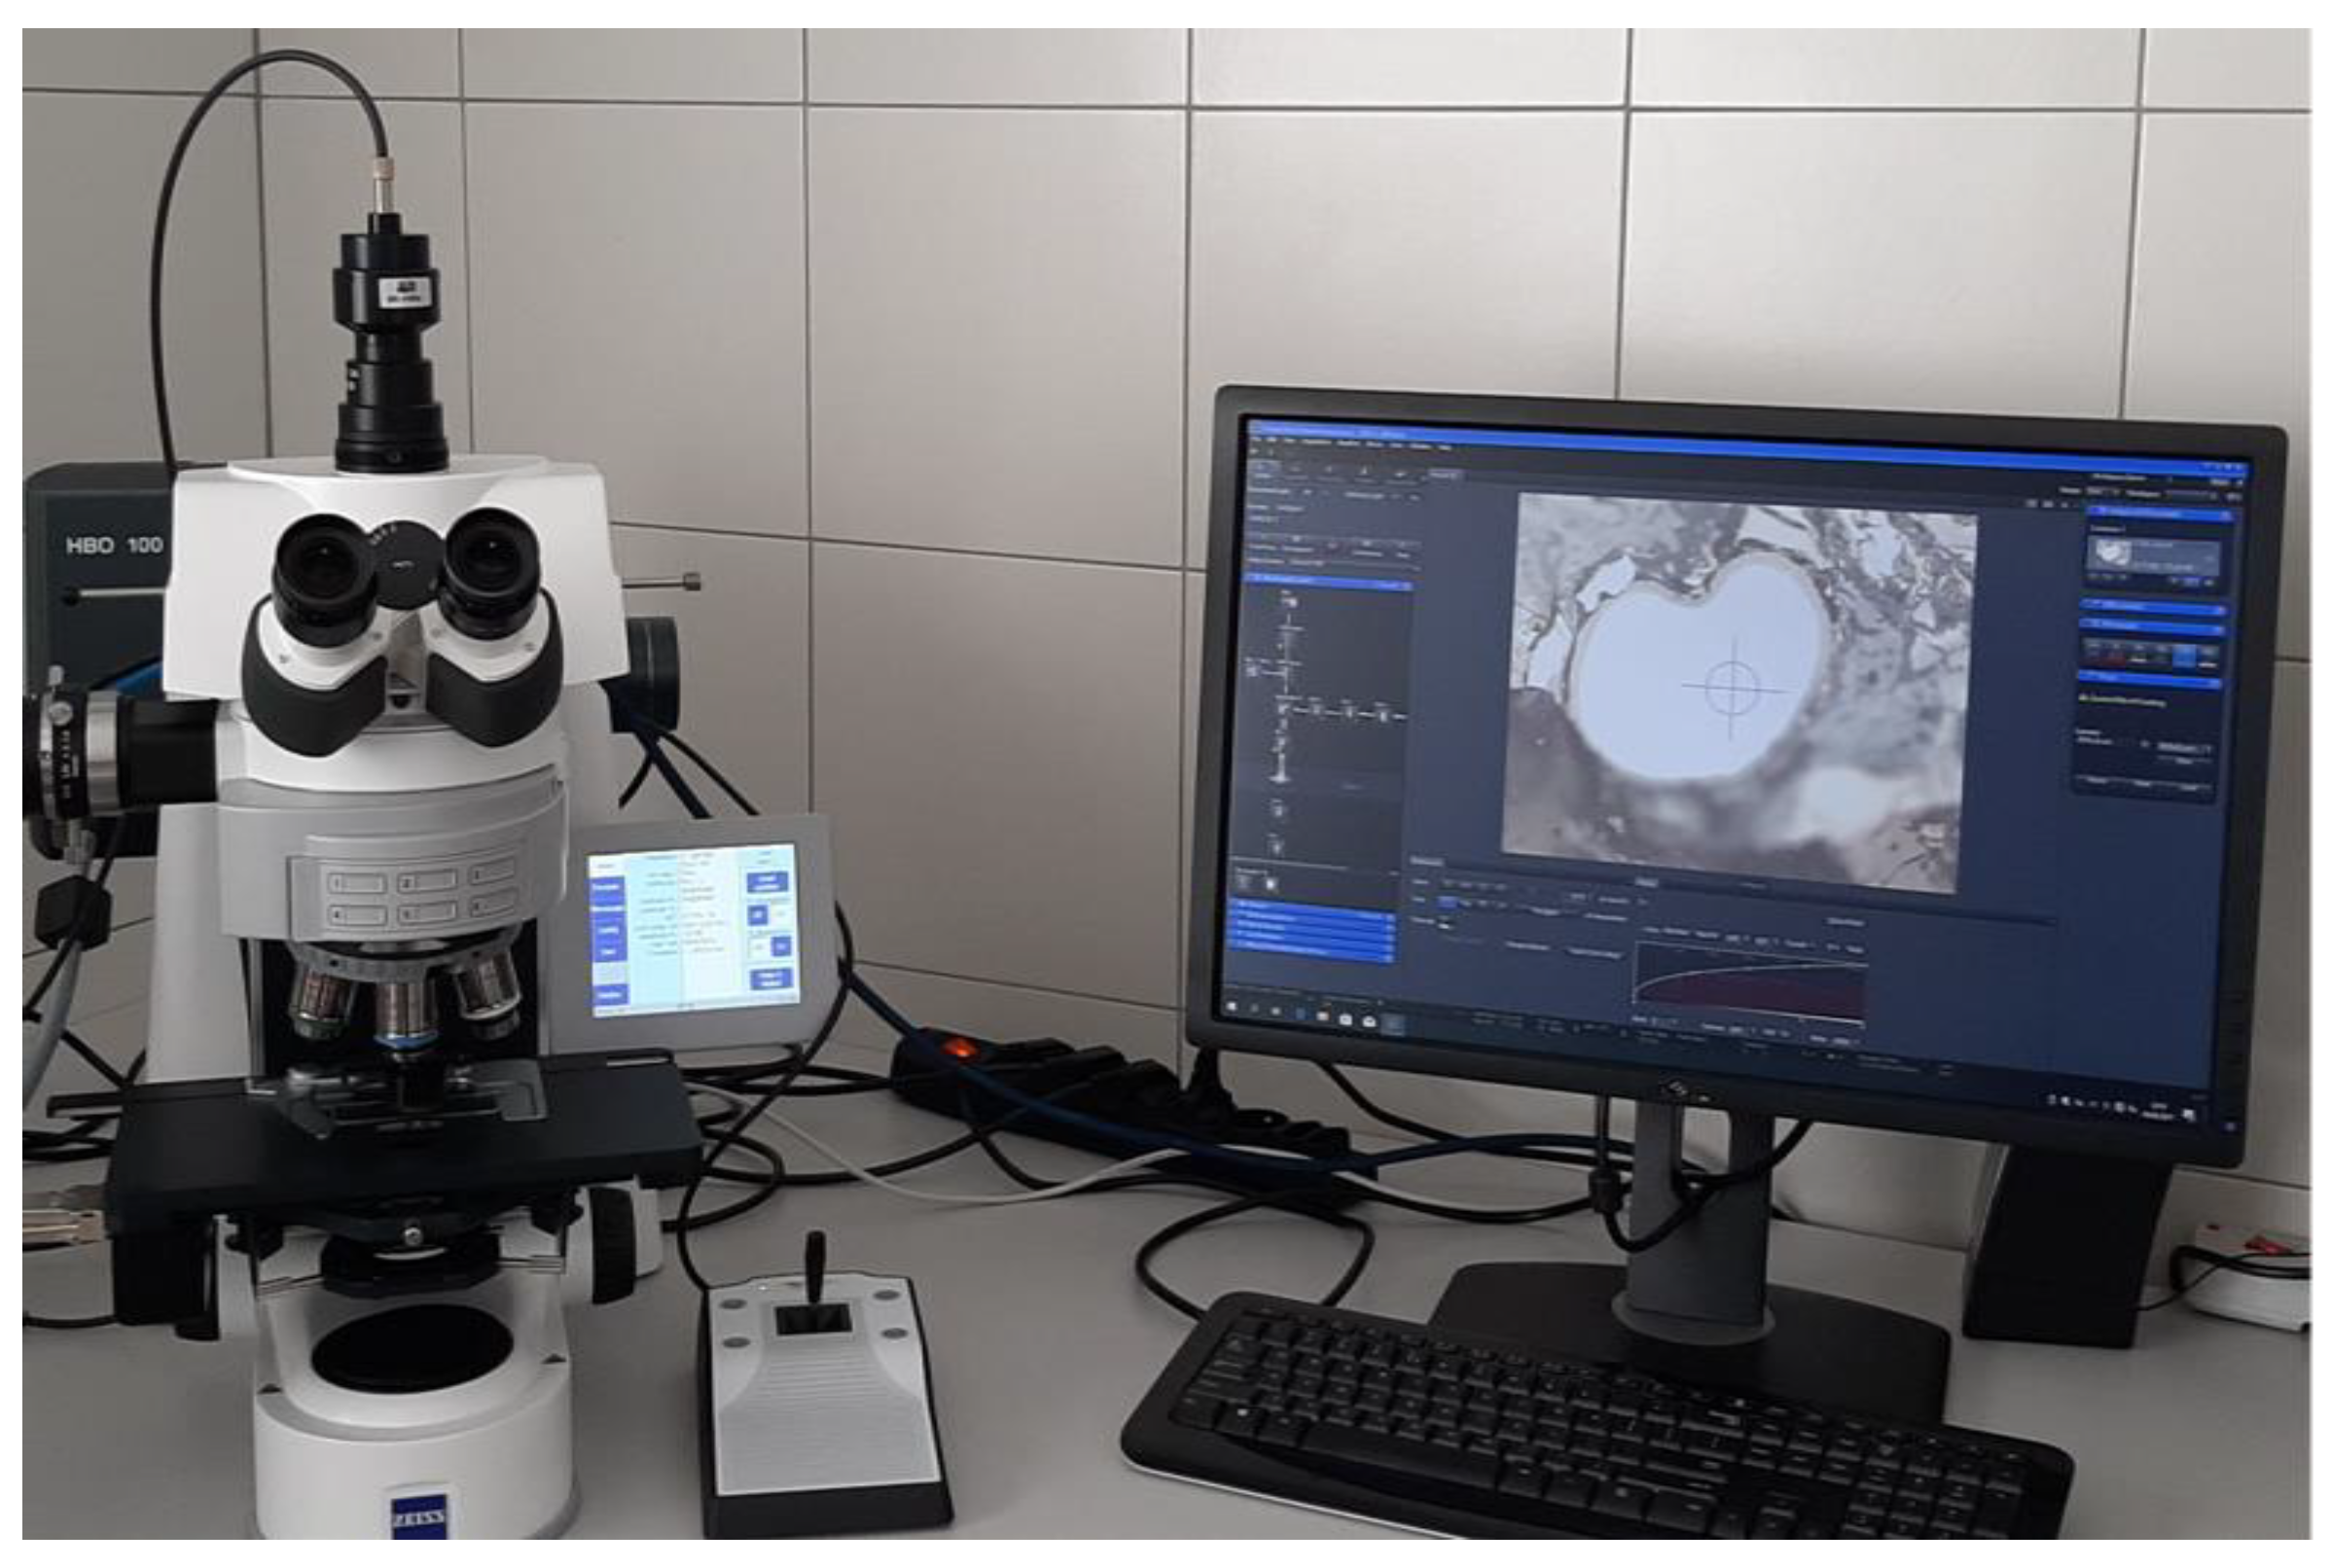
For the purposes of this study, medium-sized samples were prepared for petrographic analyses, according to the PN-ISO 7404-2:2005 Methods for the petrographic analysis of bituminous coal and anthracite–Part 2: Method of preparing coal samples, from selected coal samples in which vitrinite reflectance did not exceed 0.8%. Coal samples were taken from coals originating from Polish coal basins: the Upper Silesian Coal Basin and the Lublin Coal Basin. Data on the tested coal samples (rank, the origin of the samples, and maceral compositions are presented in Table 1. The microscopic specimens were prepared by the immersion of coal dust in a mixture of epoxy resin and hardener, obtained by mixing the components at a ratio of 8:1. The immersed microscopic specimens were left for at least 24 h until solidification. The solidified specimens were ground and polished using a Struers LaboForce-3 grinding/polishing machine (Struers Inc., Cleveland, OH, USA). A Zeiss Axio Imager Z 2m microscope (Carl Zeiss AG, Oberkochen, Germany) (Figure 3) was used for the study. A magnification of 500 times and white light reflected in oil immersion were used. Surfaces were selected for which photographs were taken using an Axiocam 506 color camera. The set of microscope photographs obtained showed different macerals for which a mask set was developed. In the petrographic analysis, the participation of maceral groups was most important. The results of the determination of the mineral substance are rarely used. Therefore, they were omitted in the first stage of the research. We plan to take care of this problem in the future.
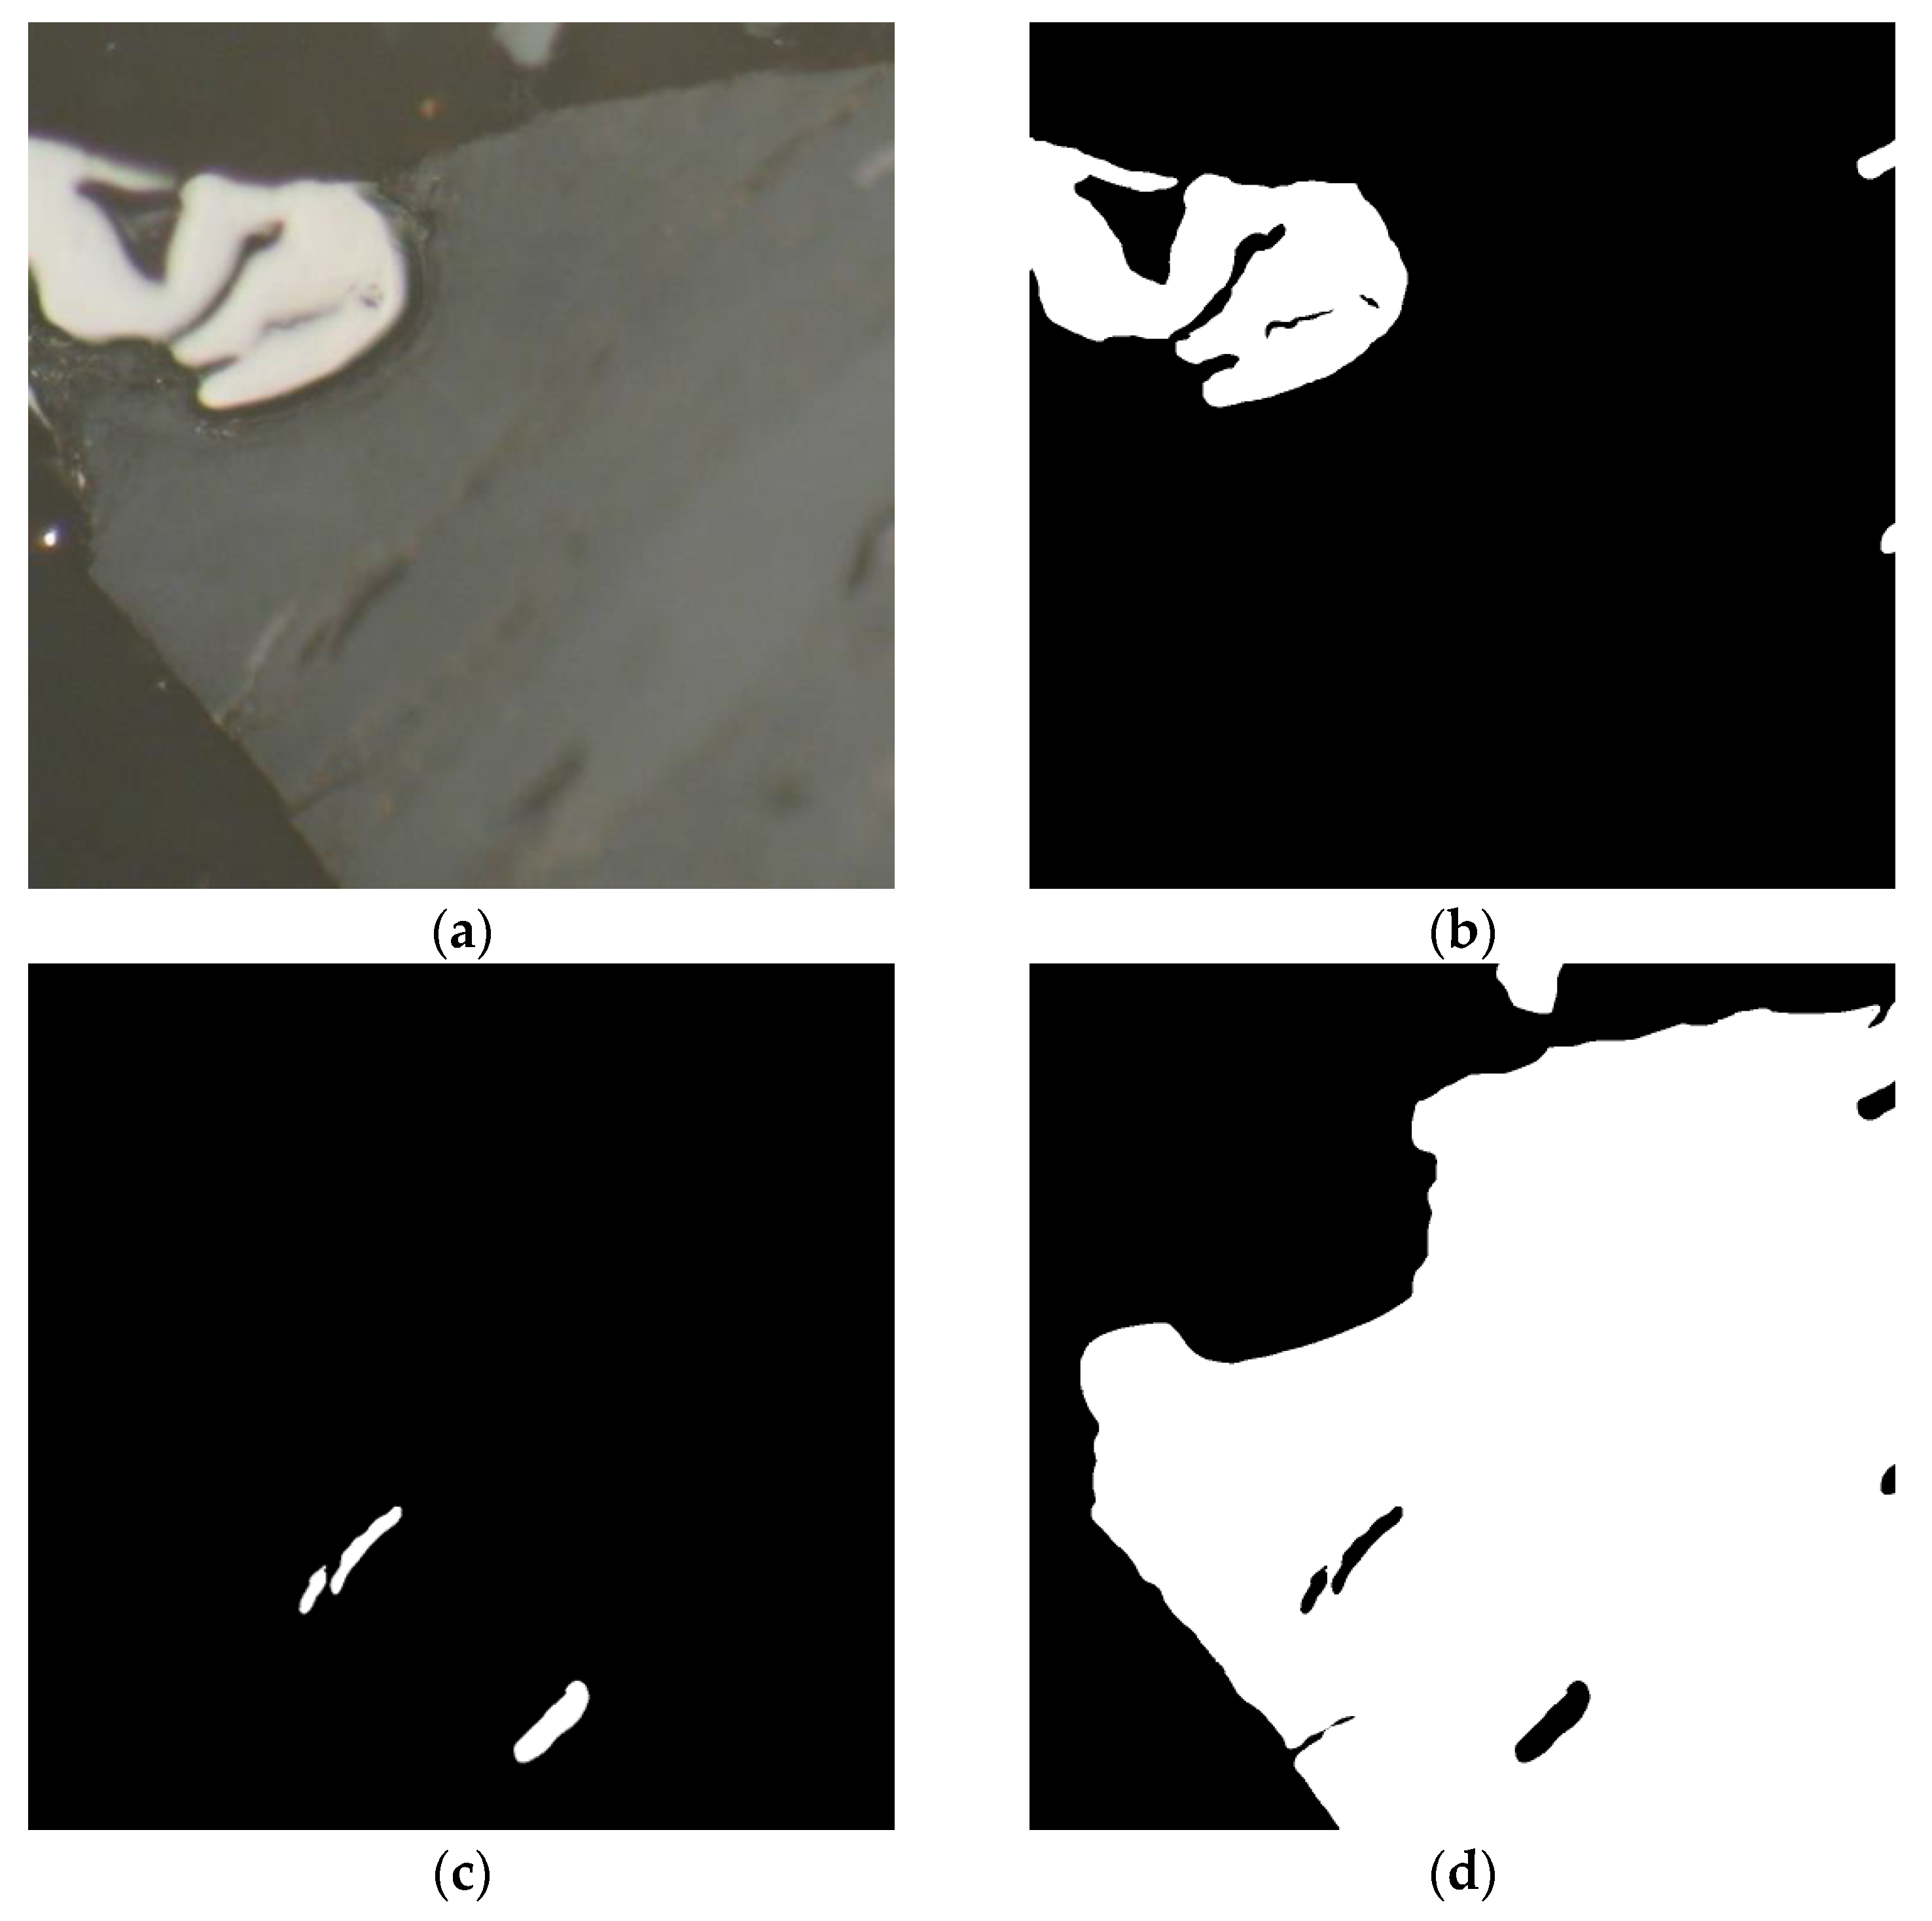
The images were captured with the resolution 3072 × 2304 pixels with 8-bit RGB color space. For further processing, the images were cut into 512 × 512 parts. Then, the manual segmentation of the vitrinite, inertinite, and liptinite was performed by a domain expert. The segmentation was used as the ground truth for further processing. There were separate masks created for each of the macerals. The completed database consisted of 162 images for which the masks were created (three masks were created for each input image). The example image and masks are presented in Figure 4.
It was decided to use a separately trained single-class model for the maceral identification. This approach has its advantages, dictated by both practical and computational considerations. In petrographic practice, the identification of macerals is used in various variants. For example, as far as the analysis of the vitrinite reflectance index is concerned, the recognition of only one maceral—collotelinite—is required. Similarly, the research carried out in order to determine the coke-forming properties requires the recognition of two types of petrographic components, namely reactive ones, which include macerals from the vitrinite and liptinite groups, and inert ones, which include macerals from the inertinite group. Using a single-class approach gives the opportunity to make it possible to obtain a network that is particularly sensitive to a specific group of macerals. Such a network is expected to be easier to train than a multiclass network and will allow for the usage of a simpler architecture without sacrificing the performance. The above is also true with respect to the preparation of a set of training images. It also provides the possibility to optimize the network architecture for each group of macerals. The usage of single-class models does not limit the common analysis of all of the maceral groups simultaneously. The outputs of the models can be combined into the result, showing all classes on a single image using for example argmax function (argmax function returns the argument for which the maximum value of output was achieved).
For the segmentation experiments, the U-Net convolutional semantic segmentation network was used [71]. The architecture of the network is presented in Figure 5.
The U-Net is an example of an autoencoder network. It can be divided into three parts: the contraction part (4 blocks composed of two convolutional steps and pulling step), the bottleneck (the convolutional layer with 1024 channels), and the expansion part (4 blocks composed of two convolutional layers followed by upscaling layer). All convolutional layers use the rectified linear unit (ReLU) as the activation function. The input layer in the constructed U-Net-based network has a 512 × 512 resolution, which is in accordance with the input image size. The output layer was constructed with a 1 × 1 convolutional layer with a sigmoid activation function. The list of layers along with their shapes is presented in Table 2. The network architecture was implemented using the Tensorflow deep learning framework library.
The input images were split randomly into training and validation sets. The validation set was formed with 10% of all images. The binary cross-entropy function was used as a loss function during the network training process. During the training, the pixel-wise accuracy (PA), intersection-over-union (IoU), and mean intersection-over-union (MIoU) were also monitored as effectiveness measures. The ADAM optimizer was chosen for model learning [72]. The training of the network was performed in two stages. In the first stage, the batch size and the learning rate range were estimated. The model training was stopped after just a few epochs and the training results were analyzed. The upper limit for learning rate was established by choosing the value at which the model improved the performance in at least 4 consecutive epochs. The batch size was limited by the size of the input dataset. The bigger the batch size, the fewer steps per epoch the training procedure can make. It was assumed that the biggest batch size allowed for at least several dozen steps for the epoch. The second stage was devoted to model training. During the training, the decreasing learning rate was used. The model was trained for 50 epochs with a constant rate. If no improvement to the loss function was observed, the learning rate was decreased by 10 and the training process was repeated. The accuracy for the validation set was observed as an indicator for possible overtraining. The training was stopped once the validation set accuracy start to decrease. The presented learning procedure was used for each of the macerals. During the training process, two kinds of data modifications were performed:
- The images which do not show the given maceral were excluded from the training set. For example, if the model was trained for vitrinite segmentation, all images where vitrinite was not present were excluded from the training set;
- Basic images augmentation was performed. The augmentation was limited to rotation by π/2, π, 3π/2 and mirroring horizontally and vertically.
The order of the images during each epoch was randomized. All input images were in RGB color space. All masks were binary. No image preprocessing except for the described augmentation was performed.
All the calculations were performed on an MS Windows workstation equipped with an Intel i7 processor running at 3.6 GHz (maximum), 32 GB RAM, and an NVIDIA GeForce GTX 1080 graphic card. All software necessary for computation was prepared with the Python programming language using the TensorFlow framework [73].
3. Results and Discussion
The learning rate during the first stage of experiments was changed from 10−1 to 10−6. It was observed that learning rates greater than 10−4 caused huge changes in the loss function for consecutive epochs. The loss hardly shows any improvement. Therefore, the rate of 10−4 was chosen as the largest learning rate used in the calculation. After every 50 epochs during the training, the results were examined and the learning rate decreased once the loss function values started to oscillate from one epoch to another. The calculations were stopped once the validation test accuracy started to increase. At this moment, the learning rate was as low as 10−7.
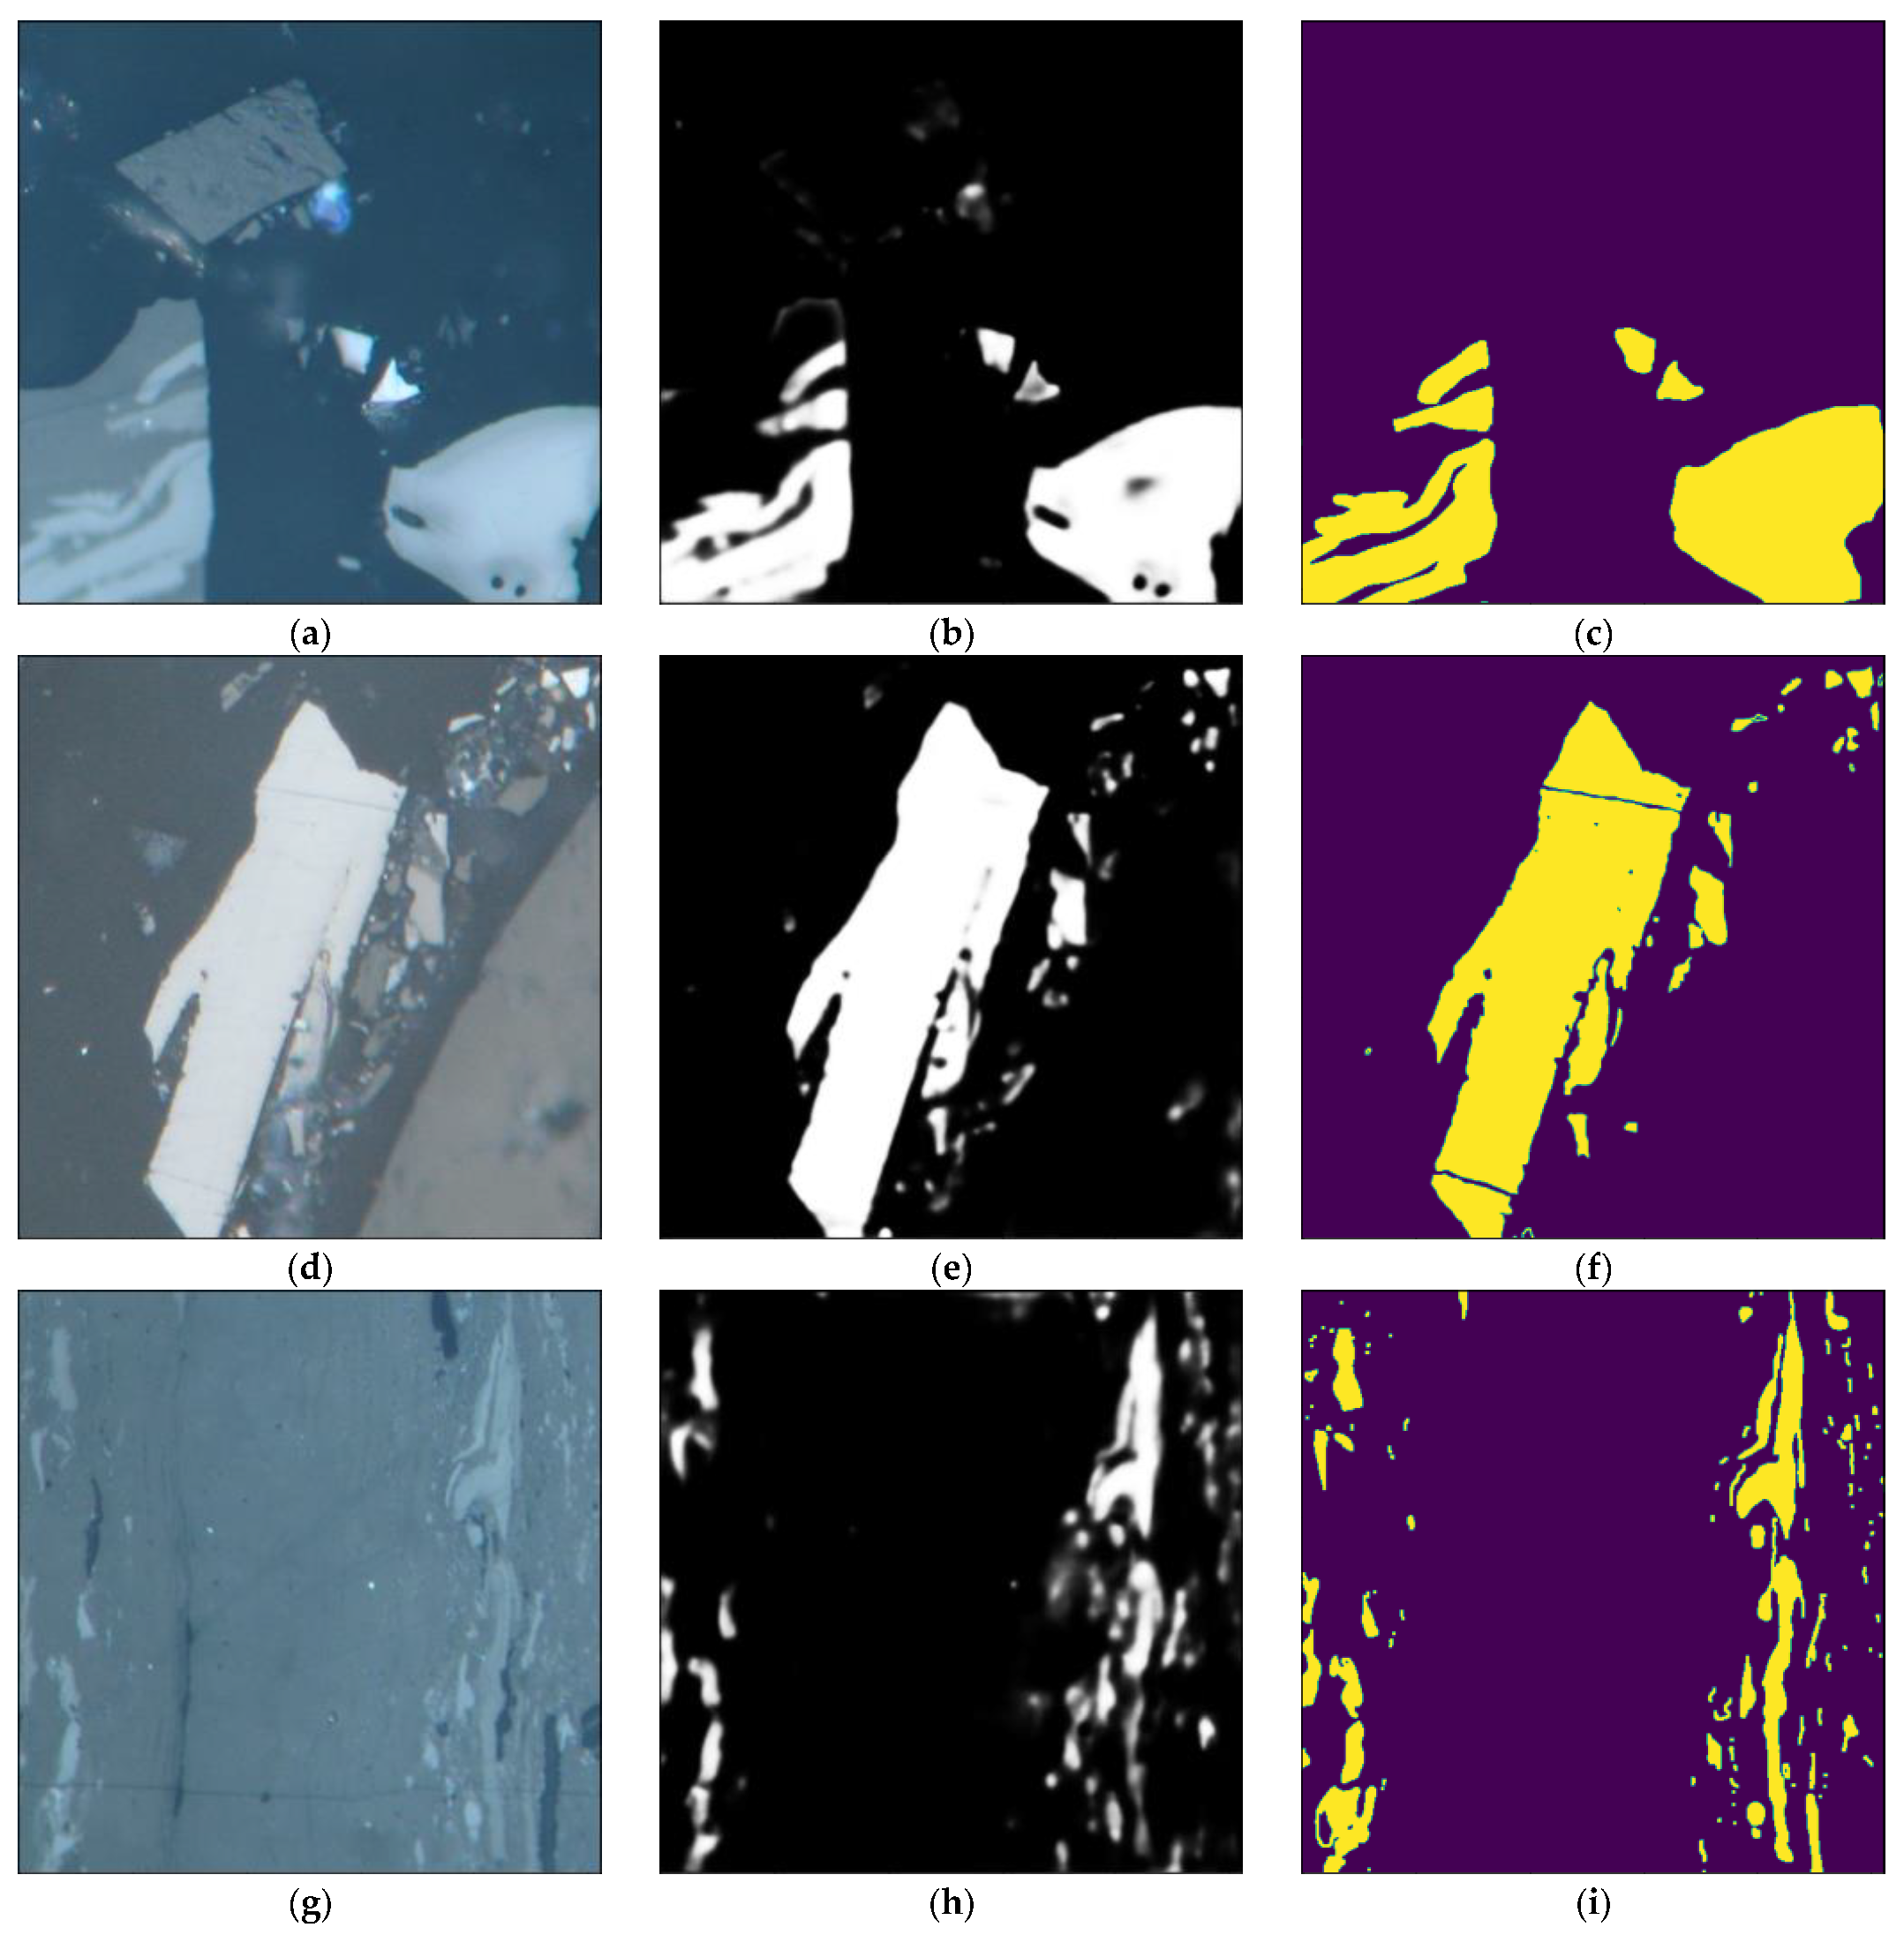
The training for the inertinite started from the randomly initialized network, using Xavier initializer [74]. During the 250 epochs of the training process, the learning rate was changed from 10−4 to 10−6. The final accuracy computed for the validation set was equal to 0.9385. The values of IoU and MIoU were equal 0.79 and 0.85, respectively. The segmentation results compared with the input image and the ground truth for selected images are presented in Figure 6.
The presented results of segmentation are indeed the output values from the last layer in the used U-Net based network. The values, being the values of the sigmoid function, vary from 0 to one, which is reflected by the grayscale level in the picture. The segmentation quality can be assessed as very good, though not perfect. It may be noticed that some minor artifacts are visible on each of the presented images. The network has difficulties in recognizing the tiny structures of inertinite visible among other macerals of similar greyscale and textures. In addition to that, vast structures were correctly noticed by U-Net and marked.
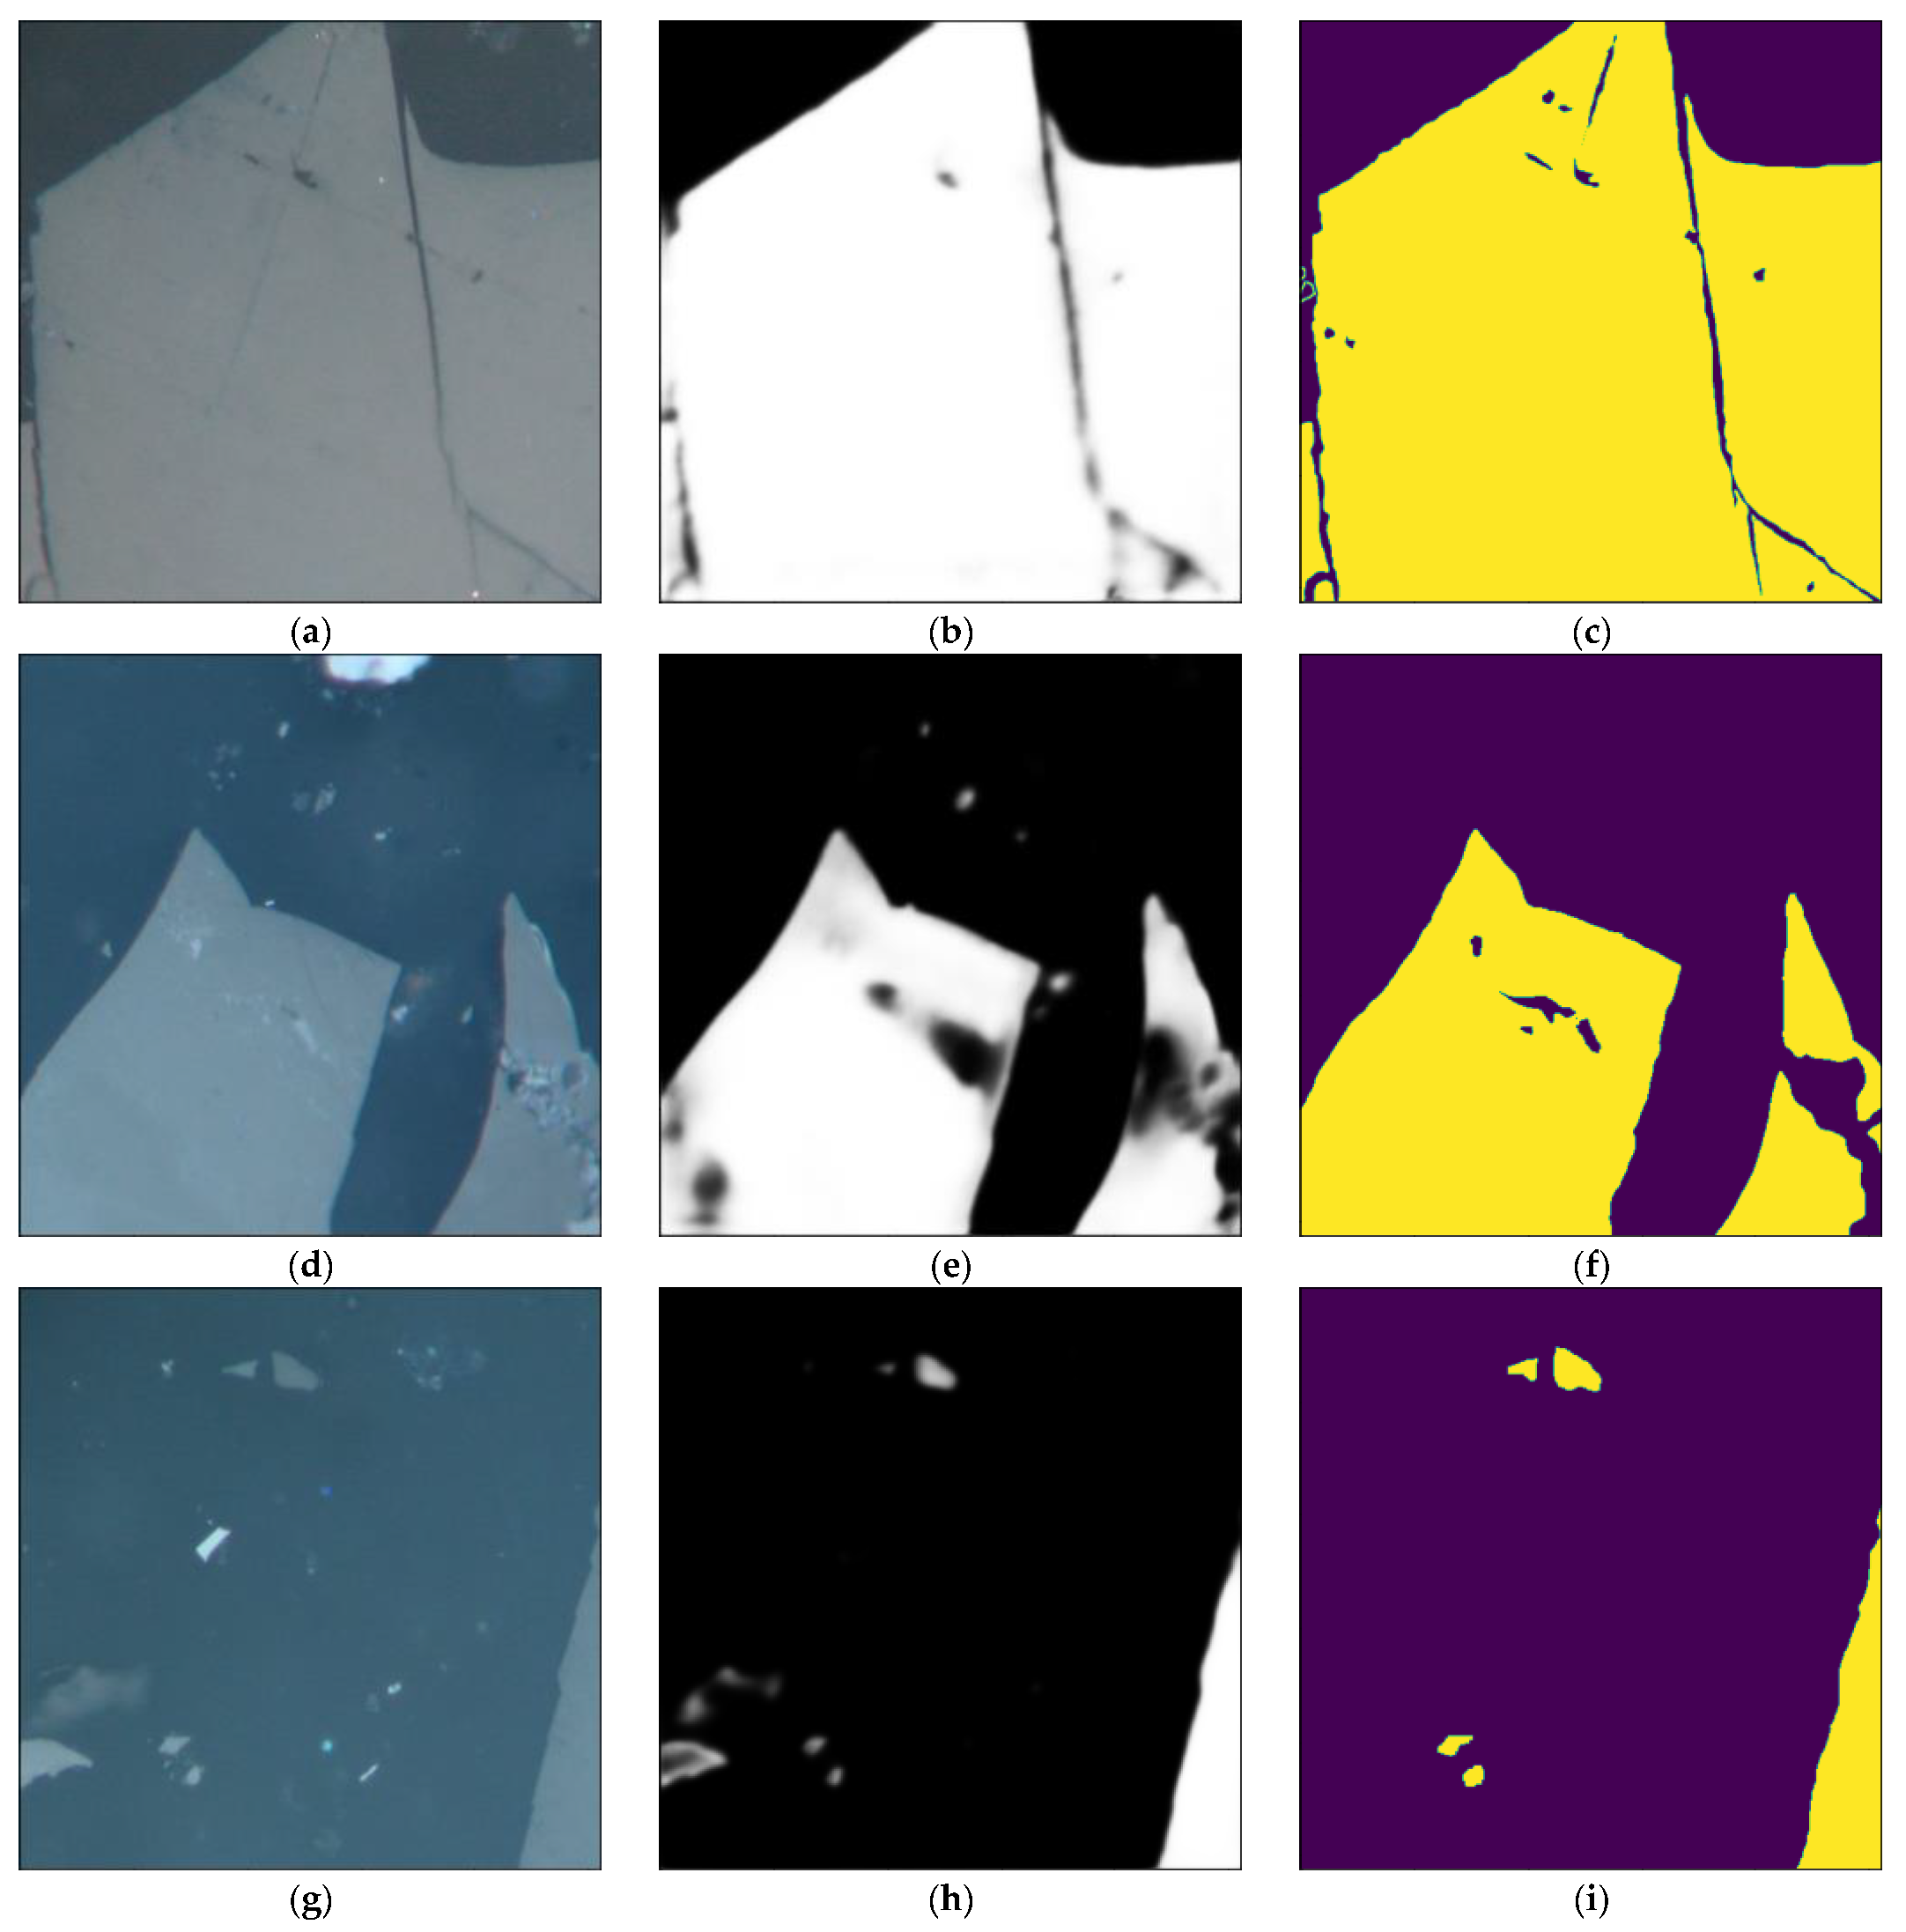
The training procedure and the results obtained for vitrinite were similar to those for inertinite. The learning process also lasted 250 epochs, though the learning rate was changed in a wider range. It started at 10−4, but ended with 10−7. The selected results of the segmentation are presented in Figure 8. The obtained accuracy computed for the validation set was equal to 0.9176. The IoU was equal to 0.78 and the MIoU was equal to 0.75.
The analysis of the results shows that the quality of segmentation is similar to that for inertinite; however, a slightly higher level of artifacts was observed, which is also visible in the presented images (see Figure 7). The results can be considered very good and suitable for practical applications.
As expected for medium- and high-rank coals, the segmentation of liptinite turned out to be the most difficult. There was no success with the training network beginning with the randomly initialized weights. Moderately satisfactory results were obtained when the training process for liptinite used the weights from the trained model for inertinite segmentation. The application of such performed transfer learning made it possible to obtain acceptable liptinite segmentation, but the errors and artifacts are clearly visible in the resulting images. The accuracy value for the validation set was 0.9791. Such a large value, with a relatively low quality of segmentation, results from the small area covered by the liptinite on the analyzed images. The calculated values for the IoU (0.18) and the MIoU (0.58) show that the segmentation is indeed poor, and can be treated as a rough identification of liptinite’s presence. The results of segmentation are presented in Figure 8.
A summary of the obtained values of accuracy, IoU, and MIoU is presented in Table 3. The quality of segmentation obtained for inertinite and vitrinite was good enough to be used as the basis for the development of an autonomous maceral identification method. The imperfections were small, not differing much from the ground truth. Moreover, during the analysis of the results, it turned out that the network was able to identify the small inertinite structures overlooked during manual segmentation. It seems reasonable to use the U-Net-based convolutional network for the segmentation of the mentioned macerals with only a little attention from a domain expert. Unfortunately, this is definitely not true for liptinite. The network was able to identify the liptinite only roughly. The result should instead be treated as approximate, possible locations of liptinite structures which have to be verified and corrected by a domain expert. The training for liptinite was also more difficult than for other macerals. It is probably caused by its more varied appearance. In addition, liptinite covered small areas in the images and was present only on relatively small numbers of them. Nevertheless, such support in assessing the maceral can be useful in practice. The obtained results can be related to others reported in the literature [56,68]; however, the comparison is not obvious as the mentioned papers do not provide the measures for the macerals’ groups separately. Therefore, it is reasonable to use the mean values for the IoU and MIoU presented in Table 3 and the values of the same measures presented in [68]. The presented U-Net-based network gives better results than the non-DL methods. The results obtained by the improved U-Net (enhanced with the use of attention gates) are better than presented in the paper, though the difference is small (IoU ~ 0.8554 and MIoU ~ 0.631 for best enhanced network presented in [68]). However, it is impossible to assess how it is divided into individual macerals groups. When the liptinite, with the worst results, is omitted, the mean IoU and MIoU for inertinite and vitrinite are much greater. As the proposed models address the segmentation of each of the macerals individually, they should be treated as complementary to the model presented in [68]. Wang et al. presents the results obtained using different deep learning networks architectures, such as U-Net (standard multi-class architecture), SegNet, and DeepLab V3+ [57]. The results are provided for each of the macerals separately. The comparison is presented in Table 4.
The proposed simplified U-Net-based network did very well in segmenting the inertinite, achieving a better result than much more sophisticated DeepLab V3+ network (the best from architectures compared in [57]). The results obtained for vitrinite are slightly worse than for the other two networks. There are very large differences in the case of liptinite. The network architecture was probably too simple to successfully cope with the most difficult to recognize maceral groups. The results obtained for two other maceral groups are optimistic. In particular, the IoU measure for the inertinite is good enough to contribute to the assumptions made and present the network’s robustness. The proposed network can be efficiently used for inertinite and vitrinite identification in the petrographic images.
The discussed approaches present different means to provide the solution for maceral groups identification. The usage of different models trained for each maceral group separately gives the opportunity for finetuning. This also allows the architecture of the net to be kept relatively simple (e.g., simpler than in the original U-Net) while still providing good performance, at least for inertinite and vitrinite. The results are also encouraging in research targeted at discovering the simplest and most robust neural network structure for the efficient analysis of petrographic images.
4. Conclusions
The application of a U-Net-based CNN network for macerals segmentation on the coal petrographic optical microscope images has been presented. The set of images was manually segmented by experts and used further as the ground truth. The network was trained to segment inertinite, liptinite, and vitrinite. During the training, basic image augmentation was used (horizontal and vertical flipping, rotation by multiplicity of π/2 angle). The result show that very good results can be achieved for inertinite segmentation. The vitrinite was segmented slightly worse, but also at a very good level. The liptinite was most difficult to process. Moderately good results were obtained after the transfer learning usage. Even so, the segmentation was noticeably worse than for inertinite and vitrinite.
The obtained results show that the proposed convolutional autoencoder could effectively be used for maceral segmentation. Although the results for the liptinite were worse than those for other macerals, due to the advanced rank of analyzed coal samples, the network in most cases was able to locate the estimated maceral location. The inertinite and vitrinite segmentation are good enough to be considered as a base for autonomous petrographic processing. Although the results do not justify such a sentence in the case of liptinite, it still can be a valuable tool supporting the expert during petrographic image analysis. Data augmentation and transfer learning in particular proved their effectiveness in at least partially solving the problems in difficult cases. The comparison of the results with similar research showed that the obtained values of IoU and MIoU are better than those reported in the literature for the ML models, and are similar to those achieved by using the DL models (for inertinite and vitrinite). The segmentation of liptinite with the simplified, U-Net-based network is still a challenge and requires further research. The ML methods as well as image analysis methods are very promising, and have been utilized for coal analysis by many scientists with satisfactory results. The approach proposed here, though encouraging, fulfills only a tiny portion of the scientific challenges related to coal petrography. Further research work in this field is required.
Author Contributions
Conceptualization, S.I. and L.R.; methodology, S.I. and L.R.; software, S.I.; validation, L.R.; formal analysis, S.I.; investigation, S.I.; resources, L.R.; data curation, S.I. and L.R.; writing—original draft preparation, S.I. and L.R.; writing—review and editing, S.I. and L.R.; visualization, S.I.; supervision, L.R.; project administration, L.R.; funding acquisition, L.R. All authors have read and agreed to the published version of the manuscript.
Funding
This research was funded by Ministry of Science and Higher Education (Poland), grant number 11185011.
Data Availability Statement
Not applicable.
Conflicts of Interest
The authors declare no conflict of interest. The funders had no role in the design of the study; in the collection, analyses, or interpretation of data; in the writing of the manuscript, or in the decision to publish the results.
References
- Dai, S.; Hower, J.C.; Finkelman, R.B.; Graham, I.T.; French, D.; Ward, C.R.; Eskenazy, G.; Wei, Q.; Zhao, L. Organic associations of non-mineral elements in coal: A review. Int. J. Coal Geol. 2019, 218, 103347. [Google Scholar] [CrossRef]
- Dai, S.; Finkelman, R.B. Coal as a promising source of critical elements: Progress and future prospects. Int. J. Coal Geol. 2018, 186, 155–164. [Google Scholar] [CrossRef]
- Finkelman, R.B.; Dai, S.; French, D. The importance of minerals in coal as the hosts of chemical elements: A review. Int. J. Coal Geol. 2019, 212. [Google Scholar] [CrossRef]
- Hower, J.C. Clean Coal Technologies and Clean Coal Technologies Roadmaps-by Colin Henderson, International Energy Agency, CCC/74 and CCC/75, 2003; and Trends in Emission Standards by Lesley L. Sloss, International Energy Agency, CCC/77, 2003. Int. J. Coal Geol. 2004, 4, 270–271. [Google Scholar] [CrossRef]
- Hower, J.C.; Ban, H.; Schaefer, J.L.; Stencel, J.M. Maceral/microlithotype partitioning through triboelectrostatic dry coal cleaning. Int. J. Coal Geol. 1997, 34, 277–286. [Google Scholar] [CrossRef]
- Hower, J.C.; Robl, T.L.; Thomas, G.A. Changes in the quality of coal delivered to Kentucky power plants, 1978 to 1997: Responses to Clean Air Act directives. Int. J. Coal Geol. 1999, 41, 125–155. [Google Scholar] [CrossRef]
- O’Keefe, J.M.; Bechtel, A.; Christanis, K.; Dai, S.; DiMichele, W.A.; Eble, C.F.; Esterle, J.; Mastalerz, M.; Raymond, A.L.; Valentim, B.; et al. On the fundamental difference between coal rank and coal type. Int. J. Coal Geol. 2013, 118, 58–87. [Google Scholar] [CrossRef]
- Hower, J.C.; Eble, C.F.; O’Keefe, J.M. Phyteral perspectives: Every maceral tells a story. Int. J. Coal Geol. 2021, 247, 103849. [Google Scholar] [CrossRef]
- ICCP, I. Handbook Coal Petr. Suppl. to 2nd Ed. ICCP. 1998. The New Vitrinite Classification (ICCP System 1994). Fuel 2001, 77, 349–358. [Google Scholar]
- Sỳkorová, I.; Pickel, W.; Christanis, K.; Wolf, M.; Taylor, G.; Flores, D. Classification of Huminite—ICCP System 1994. Int. J. Coal Geol. 2005, 62, 85–106. [Google Scholar] [CrossRef]
- Pickel, W.; Kus, J.; Flores, D.; Kalaitzidis, S.; Christanis, K.; Cardott, B.; Misz-Kennan, M.; Rodrigues, S.; Hentschel, A.; Hamor-Vido, M.; et al. Classification of Liptinite–ICCP System 1994. Int. J. Coal Geol. 2017, 169, 40–61. [Google Scholar] [CrossRef] [Green Version]
- Parzentny, H.R.; Róg, L. Dependences between Certain Petrographic, Geochemical and Technological Indicators of Coal Quality in the Limnic Series of the Upper Silesian Coal Basin (USCB), Poland. Arch. Min. Sci. 2020, 65, 665–684. [Google Scholar] [CrossRef]
- Kruszewska, K.; Dybowa-Jachowicz, S. Draft of Coal Pertology; Publishing House of the University of Silesia: Katowice, Poland, 1997. [Google Scholar]
- Parzentny, H.; Róg, L. Evaluation the Value of Some Petrographic, Physico-Chemical and Geochemical Indicators of Quality of Coal in Paralic Series of the Upper Silesian Coal Basin and Attempt to Find a Correlation Between Them. Gospod. Surowcami Miner. 2017, 33, 51–76. [Google Scholar] [CrossRef] [Green Version]
- Vasconcelos, L.D.S.E. The petrographic composition of world coals. Statistical results obtained from a literature survey with reference to coal type (maceral composition). Int. J. Coal Geol. 1999, 40, 27–58. [Google Scholar] [CrossRef]
- Permana, A.K.; Ward, C.R.; Gurba, L.W. Maceral Characteristics and Vitrinite Reflectance Variation of The High Rank Coals, South Walker Creek, Bowen Basin, Australia. Indones. J. Geosci. 2013, 8. [Google Scholar] [CrossRef]
- Denge, E.; Baiyegunhi, C. Maceral Types and Quality of Coal in the Tuli Coalfield: A Case Study of Coal in the Madzaringwe Formation in the Vele Colliery, Limpopo Province, South Africa. Appl. Sci. 2021, 11, 2179. [Google Scholar] [CrossRef]
- Suárez-Ruiz, I.; Ward, C.R. Basic Factors Controlling Coal Quality and Technological Behavior of Coal. In Applied Coal Petrology; Elsevier: Amsterdam, The Netherlands, 2008; pp. 19–59. [Google Scholar]
- Cutruneo, C.M.; Oliveira, M.; Ward, C.; Hower, J.C.; de Brum, I.A.; Sampaio, C.H.; Kautzmann, R.M.; Taffarel, S.R.; Teixeira, E.C.; Silva, L. A mineralogical and geochemical study of three Brazilian coal cleaning rejects: Demonstration of electron beam applications. Int. J. Coal Geol. 2014, 130, 33–52. [Google Scholar] [CrossRef]
- Mastalerz, M.; Padgett, P.L. From in situ coal to the final coal product: A case study of the Danville Coal Member (Indiana). Int. J. Coal Geol. 1999, 41, 107–123. [Google Scholar] [CrossRef]
- Méndez, L.; Borrego, A.; Martinez-Tarazona, M.; Menéndez, R. Influence of petrographic and mineral matter composition of coal particles on their combustion reactivity. Fuel 2003, 82, 1875–1882. [Google Scholar] [CrossRef]
- Jelonek, I.; Jelonek, Z. Influence of petrographic properties of bituminous coal on the quality of metallurgical coke. Sci. J. Inst. Miner. Energy Econ. Pol. Acad. Sci. 2017, 100, 49–66. [Google Scholar]
- Jelonek, I.; Mirkowski, Z. Petrographic and geochemical investigation of coal slurries and of the products resulting from their combustion. Int. J. Coal Geol. 2015, 139, 228–236. [Google Scholar] [CrossRef]
- Bielowicz, B. Petrographic Characteristics of Coal Gasification and Combustion by-Products from High Volatile Bituminous Coal. Energies 2020, 13, 4374. [Google Scholar] [CrossRef]
- Bielowicz, B. Petrographic Composition of Coal from the Janina Mine and Char Obtained as a Result of Gasification in the CFB Gasifier. Miner. Resour. Manag. 2019, 35, 99–116. [Google Scholar] [CrossRef]
- Mirkowski, Z.; Jelonek, I. Petrographic composition of coals and products of coal combustion from the selected combined heat and power plants (CHP) and heating plants in Upper Silesia, Poland. Int. J. Coal Geol. 2018, 201, 102–108. [Google Scholar] [CrossRef] [Green Version]
- Bielowicz, B.; Misiak, J. The Impact of Coal’s Petrographic Composition on Its Suitability for the Gasification Process: The Example of Polish Deposits. Resources 2020, 9, 111. [Google Scholar] [CrossRef]
- Róg, L. Vitrinite reflectance as a measure of the range of influence of the temperature of a georeactor on rock mass during underground coal gasification. Fuel 2018, 224, 94–100. [Google Scholar] [CrossRef]
- Büçkün, Z.; Inaner, H.; Oskay, R.G.; Christanis, K. Palaeoenvironmental Reconstruction of Hüsamlar Coal Seam, SW Turkey. J. Earth Syst. Sci. 2015, 124, 729–746. [Google Scholar] [CrossRef] [Green Version]
- Oskay, R.; Christanis, K.; Inaner, H.; Salman, M.; Taka, M. Palaeoenvironmental reconstruction of the eastern part of the Karapınar-Ayrancı coal deposit (Central Turkey). Int. J. Coal Geol. 2016, 163, 100–111. [Google Scholar] [CrossRef]
- Mastalerz, M.; Hower, J.; Taulbee, D. Variations in Chemistry of Macerals as Refl Ected by Micro-Scale Analysis of a Spanish Coal. Geol. Acta 2013, 11, 483–493. [Google Scholar]
- Querol, X.; Cabrera, L.; Pickel, W.; López-Soler, A.; Hagemann, H.; Fernandez-Turiel, J.-L. Geological controls on the coal quality of the Mequinenza subbituminous coal deposit, northeast Spain. Int. J. Coal Geol. 1996, 29, 67–91. [Google Scholar] [CrossRef]
- Suarez-Ruiz, I.; Jimenez, A.; Iglesias, M.J.; Laggoun-Defarge, F.; Prado, J.G. Influence of Resinite on Huminite Properties. Energy Fuels 1994, 8, 1417–1424. [Google Scholar] [CrossRef]
- Oestreich, J.; Tolley, W.; Rice, D. The development of a color sensor system to measure mineral compositions. Miner. Eng. 1995, 8, 31–39. [Google Scholar] [CrossRef]
- Singh, V.; Rao, S.M. Application of image processing and radial basis neural network techniques for ore sorting and ore classification. Miner. Eng. 2005, 18, 1412–1420. [Google Scholar] [CrossRef]
- Tessier, J.; Duchesne, C.; Bartolacci, G. A machine vision approach to on-line estimation of run-of-mine ore composition on conveyor belts. Miner. Eng. 2007, 20, 1129–1144. [Google Scholar] [CrossRef]
- Iwaszenko, S.; Nurzynska, K. Rock Grains Segmentation Using Curvilinear Structures Based Features. In Proceedings of the Real-Time Image Processing and Deep Learning 2019. SPIE Int. Soc. Opt. Eng. 2019, 10996, 109960V. [Google Scholar]
- Zhang, Z.; Yang, J.; Su, X.; Ding, L.; Wang, Y. Multi-Scale Image Segmentation of Coal Piles on a Belt Based on the Hessian Matrix. Particuology 2013, 11, 549–555. [Google Scholar] [CrossRef]
- Perez, C.A.; Estévez, P.A.; Vera, P.A.; Castillo, L.E.; Aravena, C.M.; Schulz, D.A.; Medina, L.E. Ore grade estimation by feature selection and voting using boundary detection in digital image analysis. Int. J. Miner. Process. 2011, 101, 28–36. [Google Scholar] [CrossRef]
- Iwaszenko, S.; Smoliński, A. Texture features for bulk rock material grain boundary segmentation. J. King Saud Univ.—Eng. Sci. 2020, 33, 95–103. [Google Scholar] [CrossRef]
- Mertens, G.; Elsen, J. Use of computer assisted image analysis for the determination of the grain-size distribution of sands used in mortars. Cem. Concr. Res. 2006, 36, 1453–1459. [Google Scholar] [CrossRef]
- Kazak, A.; Simonov, K.; Kulikov, V. Machine-Learning-Assisted Segmentation of Focused Ion Beam-Scanning Electron Microscopy Images with Artifacts for Improved Void-Space Characterization of Tight Reservoir Rocks. SPE J. 2021, 26, 1739–1758. [Google Scholar] [CrossRef]
- Zhou, Y.; Starkey, J.; Mansinha, L. Segmentation of petrographic images by integrating edge detection and region growing. Comput. Geosci. 2004, 30, 817–831. [Google Scholar] [CrossRef]
- Sethian, J. Fast Marching Methods and Level Set Methods for Propagating Interfaces. In Proceedings of the 29th Computational Fluid Dynamics, Rhode-Saint-Genese, Belgium, 23–27 February 1998. [Google Scholar]
- Lu, B.; Cui, M.; Liu, Q.; Wang, Y. Automated Grain Boundary Detection Using the Level Set Method. Comput. Geosci. 2009, 35, 267–275. [Google Scholar] [CrossRef]
- Chao, E.; Minkin, J.; Thompson, C. Application of automated image analysis to coal petrography. Int. J. Coal Geol. 1982, 2, 113–150. [Google Scholar] [CrossRef]
- Crelling, J.C. Automated petrographic characterization of coal lithotypes. Int. J. Coal Geol. 1982, 1, 347–359. [Google Scholar] [CrossRef]
- Kuili, J.; Jian, X.; Duohu, H. The use of automated coal petrography in determining maceral group composition and the reflectance of vitrinite. Int. J. Coal Geol. 1988, 9, 385–395. [Google Scholar] [CrossRef]
- Hou, X.; Ren, D.; Mao, H.; Lei, J.; Jin, K.; Chu, P.K.; Reich, F.; Wayne, D.H. Application of imaging TOF-SIMS to the study of some coal macerals. Int. J. Coal Geol. 1995, 27, 23–32. [Google Scholar] [CrossRef]
- Alpana; Mohapatra, S. Automated Coal Characterization Using Computational Intelligence and Image Analysis Techniques; IEEE: Piscataway, NJ, USA, 2015; pp. 176–180. [Google Scholar] [CrossRef]
- O’Brien, G.; Jenkins, B.; Esterle, J.; Beath, H. Coal characterisation by automated coal petrography. Fuel 2003, 82, 1067–1073. [Google Scholar] [CrossRef]
- O’Brien, G.; Gu, Y.; Adair, B.; Firth, B. The use of optical reflected light and SEM imaging systems to provide quantitative coal characterisation. Miner. Eng. 2011, 24, 1299–1304. [Google Scholar] [CrossRef]
- Crelling, J.; Glasspool, I.; Gibbins, J.; Seitz, M. Bireflectance imaging of coal and carbon specimens. Int. J. Coal Geol. 2005, 64, 204–216. [Google Scholar] [CrossRef]
- Lester, E.; Watts, D.; Cloke, M. A novel automated image analysis method for maceral analysis. Fuel 2002, 81, 2209–2217. [Google Scholar] [CrossRef]
- Tiwary, A.K.; Ghosh, S.; Singh, R.; Mukherjee, D.P.; Shankar, B.U.; Dash, P.S. Automated coal petrography using random forest. Int. J. Coal Geol. 2020, 232, 103629. [Google Scholar] [CrossRef]
- Wang, H.; Lei, M.; Chen, Y.; Li, M.; Zou, L. Intelligent Identification of Maceral Components of Coal Based on Image Segmentation and Classification. Appl. Sci. 2019, 9, 3245. [Google Scholar] [CrossRef] [Green Version]
- Wang, Y.; Bai, X.; Wu, L.; Zhang, Y.; Qu, S. Identification of maceral groups in Chinese bituminous coals based on semantic segmentation models. Fuel 2021, 308, 121844. [Google Scholar] [CrossRef]
- Vranjes-Wessely, S.; Misch, D.; Kiener, D.; Cordill, M.; Frese, N.; Beyer, A.; Horsfield, B.; Wang, C.; Sachsenhofer, R. High-speed nanoindentation mapping of organic matter-rich rocks: A critical evaluation by correlative imaging and machine learning data analysis. Int. J. Coal Geol. 2021, 247, 103847. [Google Scholar] [CrossRef]
- Mlynarczuk, M.; Skiba, M. The application of artificial intelligence for the identification of the maceral groups and mineral components of coal. Comput. Geosci. 2017, 103, 133–141. [Google Scholar] [CrossRef]
- Skiba, M.; Młynarczuk, M. Identification of macerals of the inertinite group using neural classifiers, based on selected textural features. Arch. Min. Sci. 2018, 63, 827–837. [Google Scholar] [CrossRef]
- Busse, J.; de Dreuzy, J.; Torres, S.G.; Bringemeier, D.; Scheuermann, A. Image processing based characterisation of coal cleat networks. Int. J. Coal Geol. 2016, 169, 1–21. [Google Scholar] [CrossRef] [Green Version]
- Maxwell, K.; Rajabi, M.; Esterle, J. Automated classification of metamorphosed coal from geophysical log data using supervised machine learning techniques. Int. J. Coal Geol. 2019, 214. [Google Scholar] [CrossRef]
- Garcia-Garcia, A.; Orts-Escolano, S.; Oprea, S.; Villena-Martinez, V.; Garcia-Rodriguez, J. A Review on Deep Learning Techniques Applied to Semantic Segmentation. arXiv 2017, arXiv:1704.06857. [Google Scholar]
- Taghanaki, S.A.; Abhishek, K.; Cohen, J.P.; Cohen-Adad, J.; Hamarneh, G. Deep semantic segmentation of natural and medical images: A review. Artif. Intell. Rev. 2020, 54, 137–178. [Google Scholar] [CrossRef]
- De Lima, R.P.; Bonar, A.; Coronado, D.D.; Marfurt, K.; Nicholson, C. Deep convolutional neural networks as a geological image classification tool. Sediment. Rec. 2019, 17, 4–9. [Google Scholar] [CrossRef]
- Pu, Y.; Apel, D.B.; Szmigiel, A.; Chen, J. Image Recognition of Coal and Coal Gangue Using a Convolutional Neural Network and Transfer Learning. Energies 2019, 12, 1735. [Google Scholar] [CrossRef] [Green Version]
- Li, D.; Zhang, Z.; Xu, Z.; Xu, L.; Meng, G.; Li, Z.; Chen, S. An Image-Based Hierarchical Deep Learning Framework for Coal and Gangue Detection. IEEE Access 2019, 7, 184686–184699. [Google Scholar] [CrossRef]
- Lei, M.; Rao, Z.; Wang, H.; Chen, Y.; Zou, L.; Yu, H. Maceral groups analysis of coal based on semantic segmentation of photomicrographs via the improved U-net. Fuel 2021, 294, 120475. [Google Scholar] [CrossRef]
- Long, J.; Shelhamer, E.; Darrell, T. Fully convolutional networks for semantic segmentation. In Proceedings of the IEEE Conference on Computer Vision and Pattern Recognition (CVPR), Boston, MA, USA, 7–12 June 2015; pp. 3431–3440. [Google Scholar] [CrossRef] [Green Version]
- Van Krevelen, D.W.; Schuyer, J. Coal. Coal Chemistry and Its Structure; Państwowe Wydawnictwo Naukowe: Warsaw, Poland, 1959. [Google Scholar]
- Ronneberger, O.; Fischer, P.; Brox, T. U-Net: Convolutional Networks for Biomedical Image Segmentation. In Proceedings of the International Conference on Medical Image Computing and Computer-Assisted Intervention, Munich, Germany, 5–9 October 2015; Springer: Berlin/Heidelberg, Germany, 2015; pp. 234–241. [Google Scholar]
- Kingma, D.P.; Ba, J. Adam: A Method for Stochastic Optimization. arXiv 2017, arXiv:1412.6980. [Google Scholar]
- Abadi, M.; Agarwal, A.; Barham, P.; Brevdo, E.; Chen, Z.; Citro, C.; Corrado, G.S.; Davis, A.; Dean, J.; Devin, M.; et al. TensorFlow: Large-Scale Machine Learning on Heterogeneous Systems. arXiv 2015, arXiv:1603.04467. [Google Scholar]
- Glorot, X.; Bengio, Y. Understanding the Difficulty of Training Deep Feedforward Neural Networks. In Proceedings of the Thirteenth International Conference on Artificial Intelligence and Statistics, Sardinia, Italy, 13–15 May 2010; pp. 249–256. [Google Scholar]
Figure 1.
Maceral groups: (a) vitrinite; (b) liptinite and inertinite; (c) liptinite; (d) inertinite and vitrinite. Oil immersion, magnification 500×.
Figure 1.
Maceral groups: (a) vitrinite; (b) liptinite and inertinite; (c) liptinite; (d) inertinite and vitrinite. Oil immersion, magnification 500×.

Figure 2.
Variability of macerals’ groups reflectivity in coals of different carbonization degree [70].
Figure 2.
Variability of macerals’ groups reflectivity in coals of different carbonization degree [70].

Figure 3.
Microscope Zeiss Axio Imager Z 2m.

Figure 4.
Example of the input image and accompanying masks: (a) the input image; (b) mask for the inertinite; (c) mask for the liptinite; (d) mask for the vitrinite.
Figure 4.
Example of the input image and accompanying masks: (a) the input image; (b) mask for the inertinite; (c) mask for the liptinite; (d) mask for the vitrinite.

Figure 5.
The architecture of U-Net network [71].
Figure 5.
The architecture of U-Net network [71].

Figure 6.
The results of inertinite segmentation. (a,d,g) Input images; (b,e,h) segmentation results; (c,f,i) ground truth.
Figure 6.
The results of inertinite segmentation. (a,d,g) Input images; (b,e,h) segmentation results; (c,f,i) ground truth.

Figure 7.
The results of vitrinite segmentation. (a,d,g) Input images; (b,e,h) segmentation results; (c,f,i) ground truth.
Figure 7.
The results of vitrinite segmentation. (a,d,g) Input images; (b,e,h) segmentation results; (c,f,i) ground truth.

Figure 8.
The results of liptinite segmentation. (a,d,g) Input images; (b,e,h) segmentation results; (c,f,i) ground truth.
Figure 8.
The results of liptinite segmentation. (a,d,g) Input images; (b,e,h) segmentation results; (c,f,i) ground truth.


Table 1.
Data on the tested coal samples.
| Origin Samples | Numer of Samples | Maceral Groups (% vol.) | Vitrinite Reflectance (%) | ||
|---|---|---|---|---|---|
| Vitrinite | Liptinite | Inertinite | |||
| Upper Silesian Coal Basin | 12 | 45–79 | 7–12 | 17–31 | 0.51–0.80 |
| Lublin Coal Basin | 10 | 58–72 | 6–15 | 18–35 | 0.58–0.75 |
Table 2.
The shapes of layers used for the U-Net-based maceral segmentation network.
| Layer | Shape | Activation |
|---|---|---|
| Input | 512 × 512 × 3 | - |
| Convolutional 2D | 512 × 512 × 16 | ReLU |
| Convolutional 2D | 512 × 512 × 16 | ReLU |
| Max Pooling | 256 × 256 × 16 | |
| Convolutional 2D | 256 × 512 × 32 | ReLU |
| Convolutional 2D | 256 × 512 × 32 | ReLU |
| Max Pooling | 128 × 128 × 32 | |
| Convolutional 2D | 128 × 128 × 64 | ReLU |
| Convolutional 2D | 128 × 128 × 64 | ReLU |
| Max Pooling | 64 × 64 × 64 | |
| Convolutional 2D | 64 × 64 × 128 | ReLU |
| Convolutional 2D | 64 × 64 × 128 | ReLU |
| Max Pooling | 32 × 32 × 128 | |
| Convolutional 2D | 32 × 32 × 256 | ReLU |
| Convolutional 2D | 32 × 32 × 256 | ReLU |
| Up Sampling | 64 × 64 × 256 | |
| Convolutional 2D | 64 × 64 × 128 | ReLU |
| Convolutional 2D | 64 × 64 × 128 | ReLU |
| Up Sampling | 128 × 128 × 128 | |
| Convolutional 2D | 128 × 128 × 64 | ReLU |
| Convolutional 2D | 128 × 128 × 64 | ReLU |
| Up Sampling | 256 × 256 × 64 | |
| Convolutional 2D | 256 × 256 × 32 | ReLU |
| Convolutional 2D | 256 × 256 × 32 | ReLU |
| Up Sampling | 512 × 512 × 32 | |
| Convolutional 2D | 512 × 512 × 16 | ReLU |
| Convolutional 2D | 512 × 512 × 16 | ReLU |
| Convolutional 2D | 512 × 512 × 1 | Sigmoid |
Table 3.
The values of accuracy, IoU and MIoU obtained for validation images set.
| Macerals’ Group | PA | IoU | MIoU |
|---|---|---|---|
| Inertinite | 0.9385 | 0.79 | 0.85 |
| Liptinite | 0.9791 | 0.18 | 0.58 |
| Vitrinite | 0.9176 | 0.78 | 0.75 |
| Mean | 0.9451 | 0.58 | 0.79 |
| Mean without liptinite | 0.9280 | 0.73 | 0.80 |
Publisher’s Note: MDPI stays neutral with regard to jurisdictional claims in published maps and institutional affiliations. |
© 2021 by the authors. Licensee MDPI, Basel, Switzerland. This article is an open access article distributed under the terms and conditions of the Creative Commons Attribution (CC BY) license (https://creativecommons.org/licenses/by/4.0/).
Share and Cite
MDPI and ACS Style
Iwaszenko, S.; Róg, L. Application of Deep Learning in Petrographic Coal Images Segmentation. Minerals 2021, 11, 1265. https://doi.org/10.3390/min11111265
AMA Style
Iwaszenko S, Róg L. Application of Deep Learning in Petrographic Coal Images Segmentation. Minerals. 2021; 11(11):1265. https://doi.org/10.3390/min11111265
Chicago/Turabian StyleIwaszenko, Sebastian, and Leokadia Róg. 2021. "Application of Deep Learning in Petrographic Coal Images Segmentation" Minerals 11, no. 11: 1265. https://doi.org/10.3390/min11111265
Note that from the first issue of 2016, this journal uses article numbers instead of page numbers. See further details here.