Article

Mineralogy, Fluid Inclusions, and Isotopic Study of the Kargah Cu-Pb Polymetallic Vein-Type Deposit, Kohistan Island Arc, Northern Pakistan: Implication for Ore Genesis

1
Marine Science Department, Zhejiang University, Zhoushan 316021, China
2
Key Laboratory of Submarine Geosciences, Second Institute of Oceanography, MNR, Hangzhou 310012, China
3
Second Institute of Oceanography, MNR, Hangzhou 310012, China
4
Laboratory of Marine Mineral Resources, Qingdao National Laboratory for Maine Science and Technology, Qingdao 266237, China
5
Hainan Institute of Zhejiang University, Zhejiang University, Sanya 572025, China
6
Earth Science Department, Karakoram International University, Gilgit 15100, Pakistan
7
College of Oceanography, Hohai University, Nanjing 210098, China
8
State Key Laboratory of Geological Processes and Mineral Resources, China University of Geosciences, Wuhan 430074, China
*
Authors to whom correspondence should be addressed.
Minerals 2021, 11(11), 1266; https://doi.org/10.3390/min11111266
Submission received: 19 October 2021 / Revised: 8 November 2021 / Accepted: 8 November 2021 / Published: 14 November 2021

Abstract

:
The Kargah Cu-Pb polymetallic deposit is a newly discovered ore deposit from the Gilgit-Baltistan region, located in the Kohistan Island Arc, northern Pakistan. However, this area is poorly researched on the ore genesis, and its origin and the evolution of its magmatic-hydrothermal system remain unclear. Three stages of mineralization were identified, including quartz-pyrite, quartz-sulfide, and carbonate representing early, middle, and late stages, respectively. The major ore minerals are pyrite, chalcopyrite, galena, and zincian tetrahedrite with minor native silver, and native gold mainly distributed in pyrite. Here, we present a systematic study on ore geology, hydrothermal alterations, trace element composition of pyrite, fluid inclusions, and isotopes (S and Pb) characteristics to gain insights into the nature of the ore-forming fluids, types of unknown deposits, and hydrothermal fluid evolution. The high Co/Ni ratio (1.3–16.4) and Co content (average 1201 ppm), the low Mo/Ni ratio (0.43–0.94) and Mo contents (average 108 ppm) of both Py-I and Py-II suggest a mafic source for the mineralization. The Au-Ni plots, Co-As-Ni correlation, and the δ34S values range from −2.8 to 6.4‰ (average of 3.4‰) indicating the affiliation of the mineralization with a mantle-derived magmatic-hydrothermal provenance. The Pb isotope data showing the narrow variations in 206Pb/204Pb, 207Pb/204Pb and 208Pb/204Pb values suggest a single lead source from crustal-derived materials. The microthermometry data suggest that the dominant mechanisms are fluid boiling and mixing for mineral precipitation at temperatures ranging between 155 and 555 °C, and represent an intrusion-related magmatic-hydrothermal environment for the Kargah Cu-Pb polymetallic deposit.

1. Introduction

Northern Pakistan is characterized by diverse geological settings and complex history of crustal evolution [1,2,3] (Figure 1a), and it is a prosperous area for economically valuable minerals. Comprehensive geological work has been reported in the region [4,5,6,7]. Various types of mineralization have been reported, such as placer deposits for precious and base metals along the Indus River and its different tributaries [8,9,10,11], mineralization in hydrothermal sulfide-bearing quartz vein, and shear zones within the Kohistan Island Arc [10,12,13,14] and rare earth mineralization in alkaline rock [15].
Previous studies on this valley (Figure 2b) within the previously known belt of the Kohistan Batholith have been mainly focused on geotectonic characteristics, host rock features, and the occurrence of precious and base metals in the stream sediments [11,19,20,21]. Later, the local mined for the quartz crystals as well as sulfide-bearing quartz veins and opened exploratory pits, trenches, and tunnels. Since the Kargah Cu-Pb polymetallic deposit has been newly discovered, it has not yet been studied in detail. A systematic study on the paragenetic sequences of ore-forming minerals, alteration-mineralization types, the origin, composition, and evolution of the ore-forming fluids, as well as the mechanism of mineral precipitation of this deposit has not been documented.
In this paper, we present a systematic field and petrographic investigation, major and trace element characteristics, hydrothermal wall-rock alterations, fluid inclusion petrography and microthermometry of different ore-forming stages, Raman spectroscopy, as well as sulfur and lead isotopic compositions of sulfide from the orebody to gain insights into the source of ore-forming fluids and materials, physicochemical conditions and mechanism of ore precipitation. Our results provide implications for the origin and evolution mechanism of the ore-forming fluids, as well as the ore potential in Kargah area.

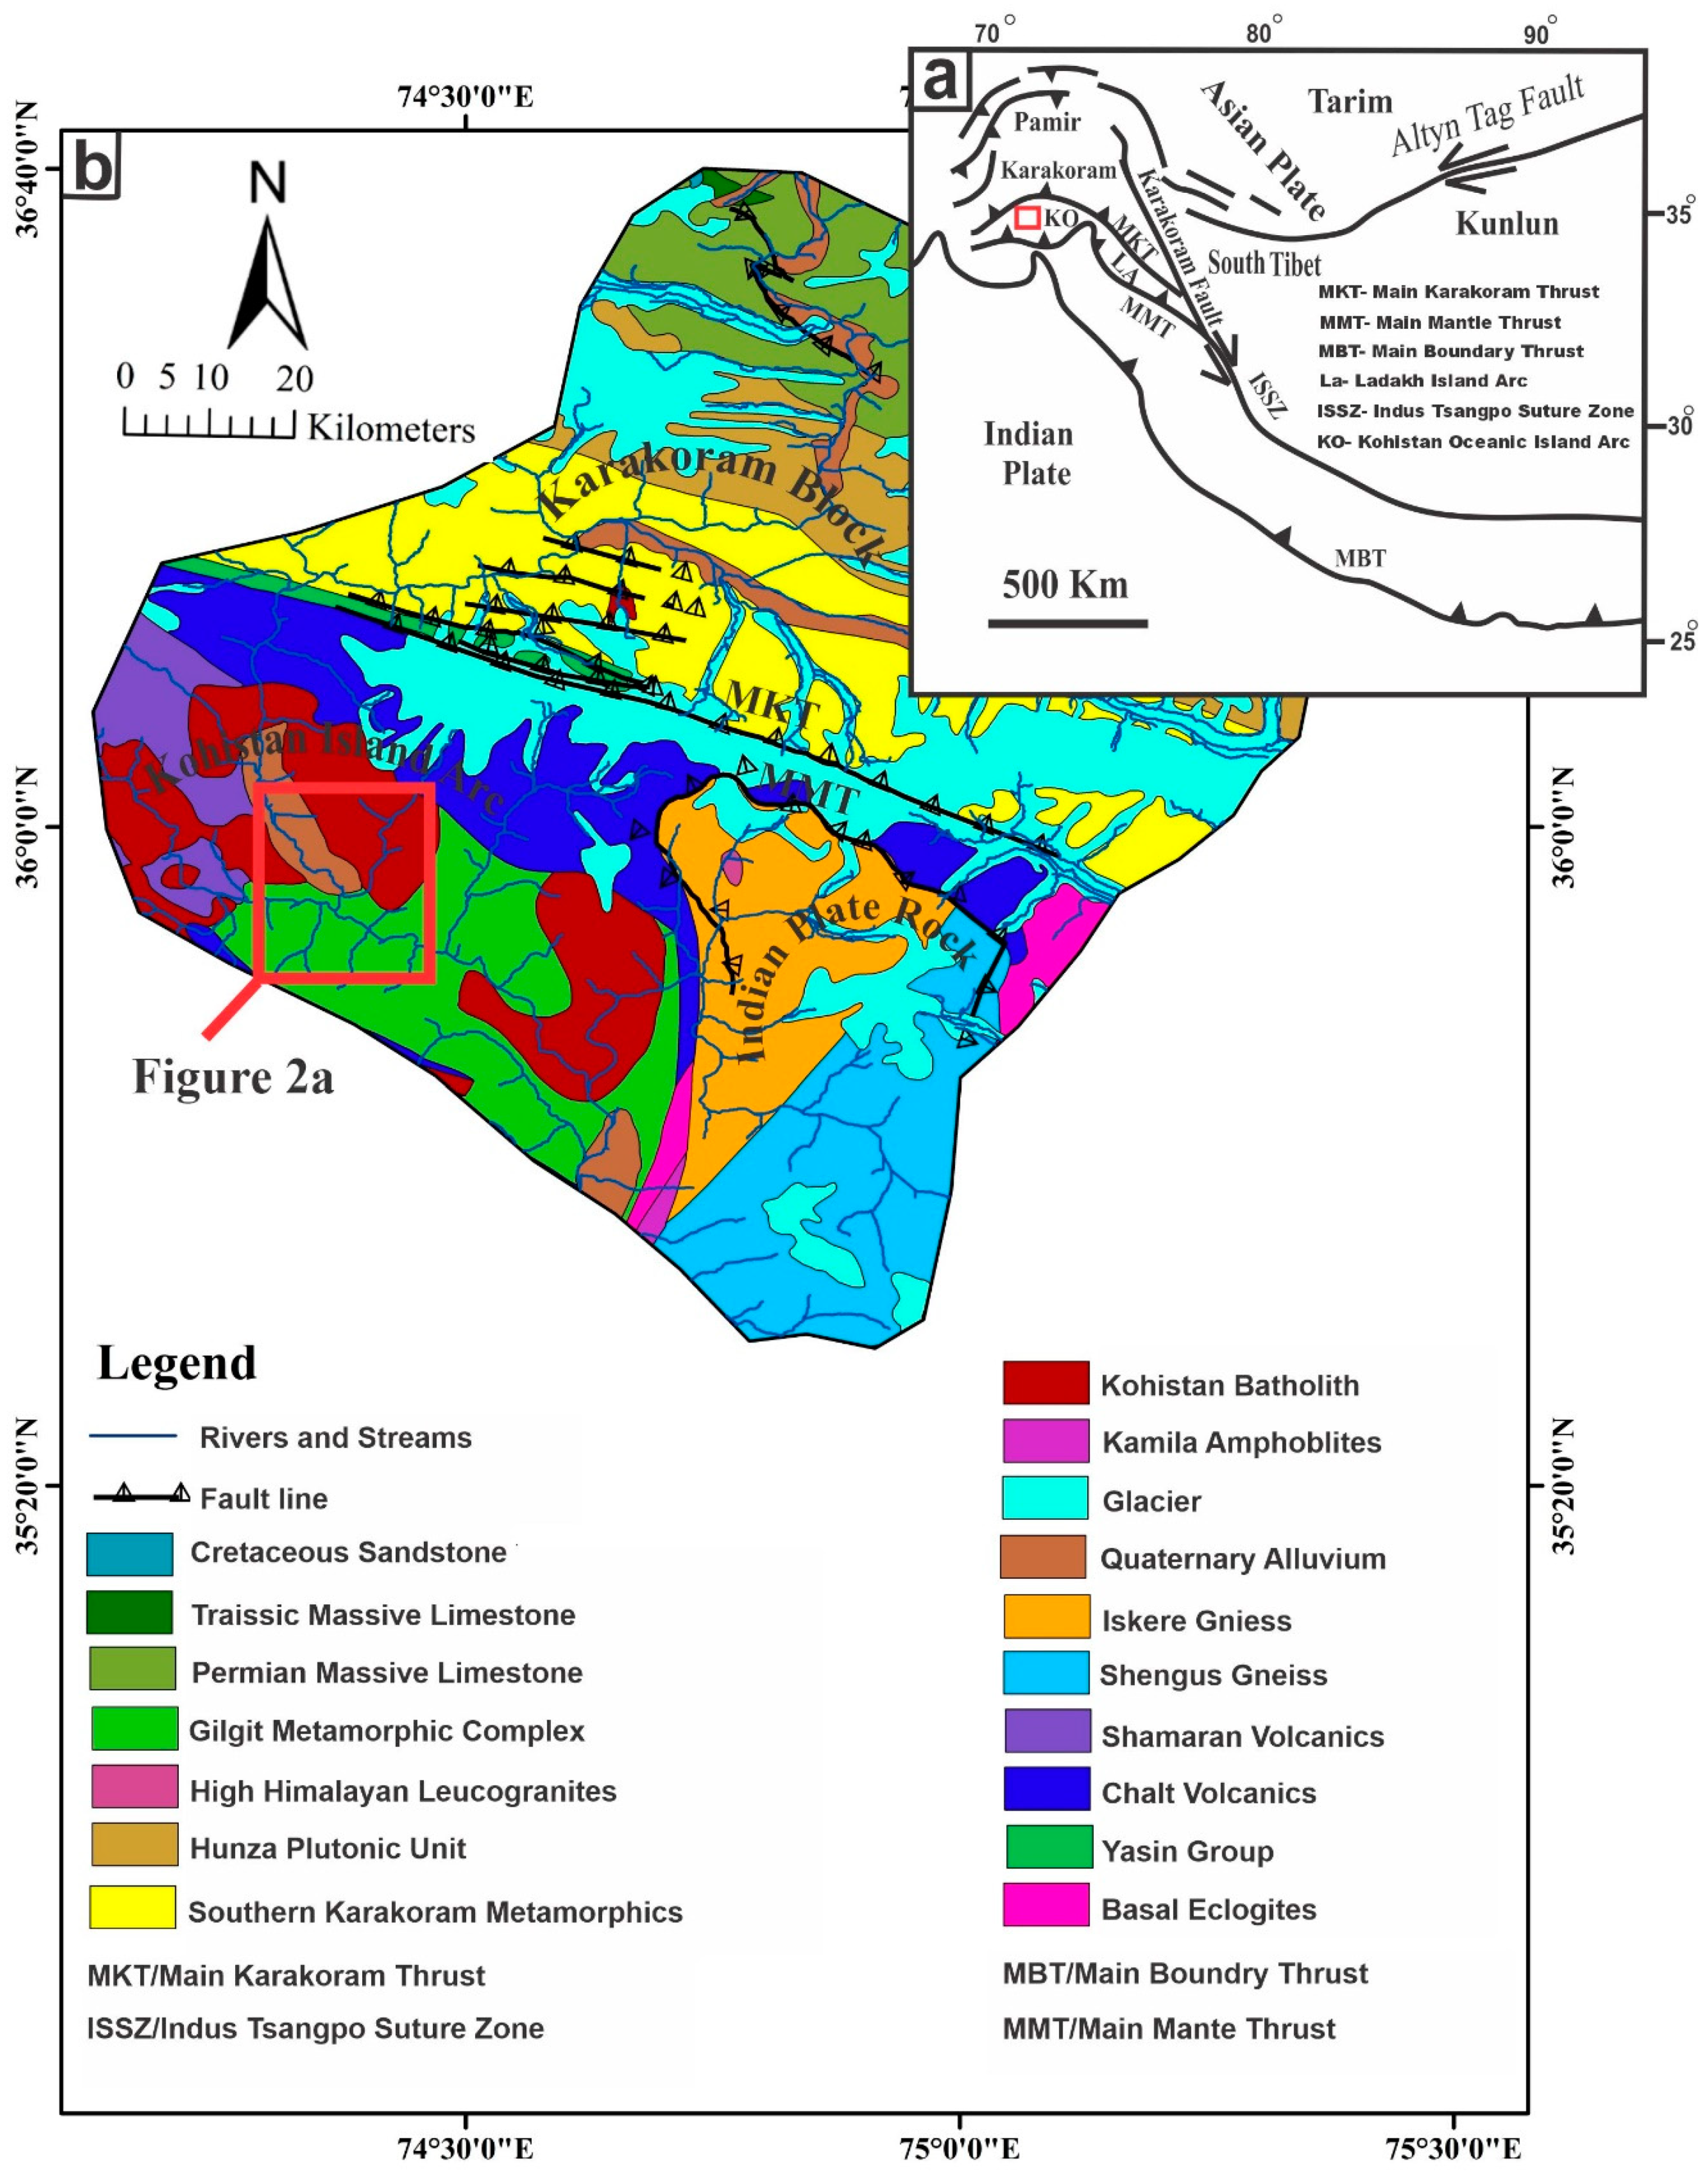
2. Geological Setting

2.1. Regional Geology

Northern Pakistan is characterized by remarkable continental collision and complex geological history. Generally, the region can be divided into three major blocks (from north to south the Karakoram Block, the Kohistan Island Arc (KIA), and the Indo-Pakistan Plate) by two suture zones, namely the Main Karakoram Thrust (MKT)/Shyok Suture Zone and the Main Mantle Thrust (MMT)/Indus Suture Zone, within the tectonic domains of the Himalayas (Figure 1b) [23,24,25,26].
The Karakoram Block formed on the southern margin of the Asian Plate (Figure 1a) during the late Permian-Triassic time and Karakorum Fault splits southern Tibet from the Karakorum Block (Figure 1a) [24]. The Main Karakoram Thrust (MKT) or Shyok Suture Zone (SSZ) is an important Cretaceous to Tertiary suture zone that separates the north of Karakoram Block (Asian Plate) from the Cretaceous Kohistan Island Arc (Figure 1a,b). This mélange zone resulted from the collision between the Kohistan Island Arc and the Asian Plate [27]. The Kohistan-Ladakh Island Arc is a part of the western Himalayas in northern Pakistan (Figure 1a), formed by northward intra-oceanic subduction of Neo-Tethys ophiolite crust of the Indian Plate beneath the Asian Plate [28,29,30]. The Main Mantel Thrust, also known as the Indus Suture Zone (ISZ), marks the boundary between the Kohistan Island Arc and Indian Plate rocks (Figure 1b). It is formed by subduction of the oceanic lithosphere beneath Kohistan during the closure of the Tethyan Ocean [31,32]. The Kohistan-Ladakh Island Arc, the western part of the Indus-Tsangpo Suture Zone (Figure 1b), was obducted onto the Indian Plate around 50 Ma ago along the Main Mantel Thrust (MMT) [1]. The Nanga Parbat-Haramosh Massif is formed due to the consumption of the Proterozoic Indian plate crust towards the south of the Kohistan Ladakh arc [33].

2.2. Geology of the Kargah Valley

The Kargah valley is a U-shaped valley that lies in the Gilgit district (Figure 2a). Geologically, the Kargah valley and its immediate surroundings lie in the Kohistan Batholith within the Kohistan Island Arc (Figure 1b). The Main Karakoram Thrust (MKT) passes along the vicinities of the valley from NE to SW, separating the Karakoram Block from the Kohistan Island Arc. The Kohistan batholith intruded mainly into the Thelichi and partially Gilgit Formation in the valley [20]. The study area shows a variety of plutonic, metavolcanic, and metasedimentary rocks (Figure 2b) [20,22]. The dominant rocks are plutonic, known as the Kohistan Batholith, which contains predominantly multiphase plutons [34,35]. The second major exposed formation is the Thelichi Formation and Greenstone complex, and the Gilgit Formation is also present as a minor exposure (Figure 2b).

3. Sampling and Analytical Methods
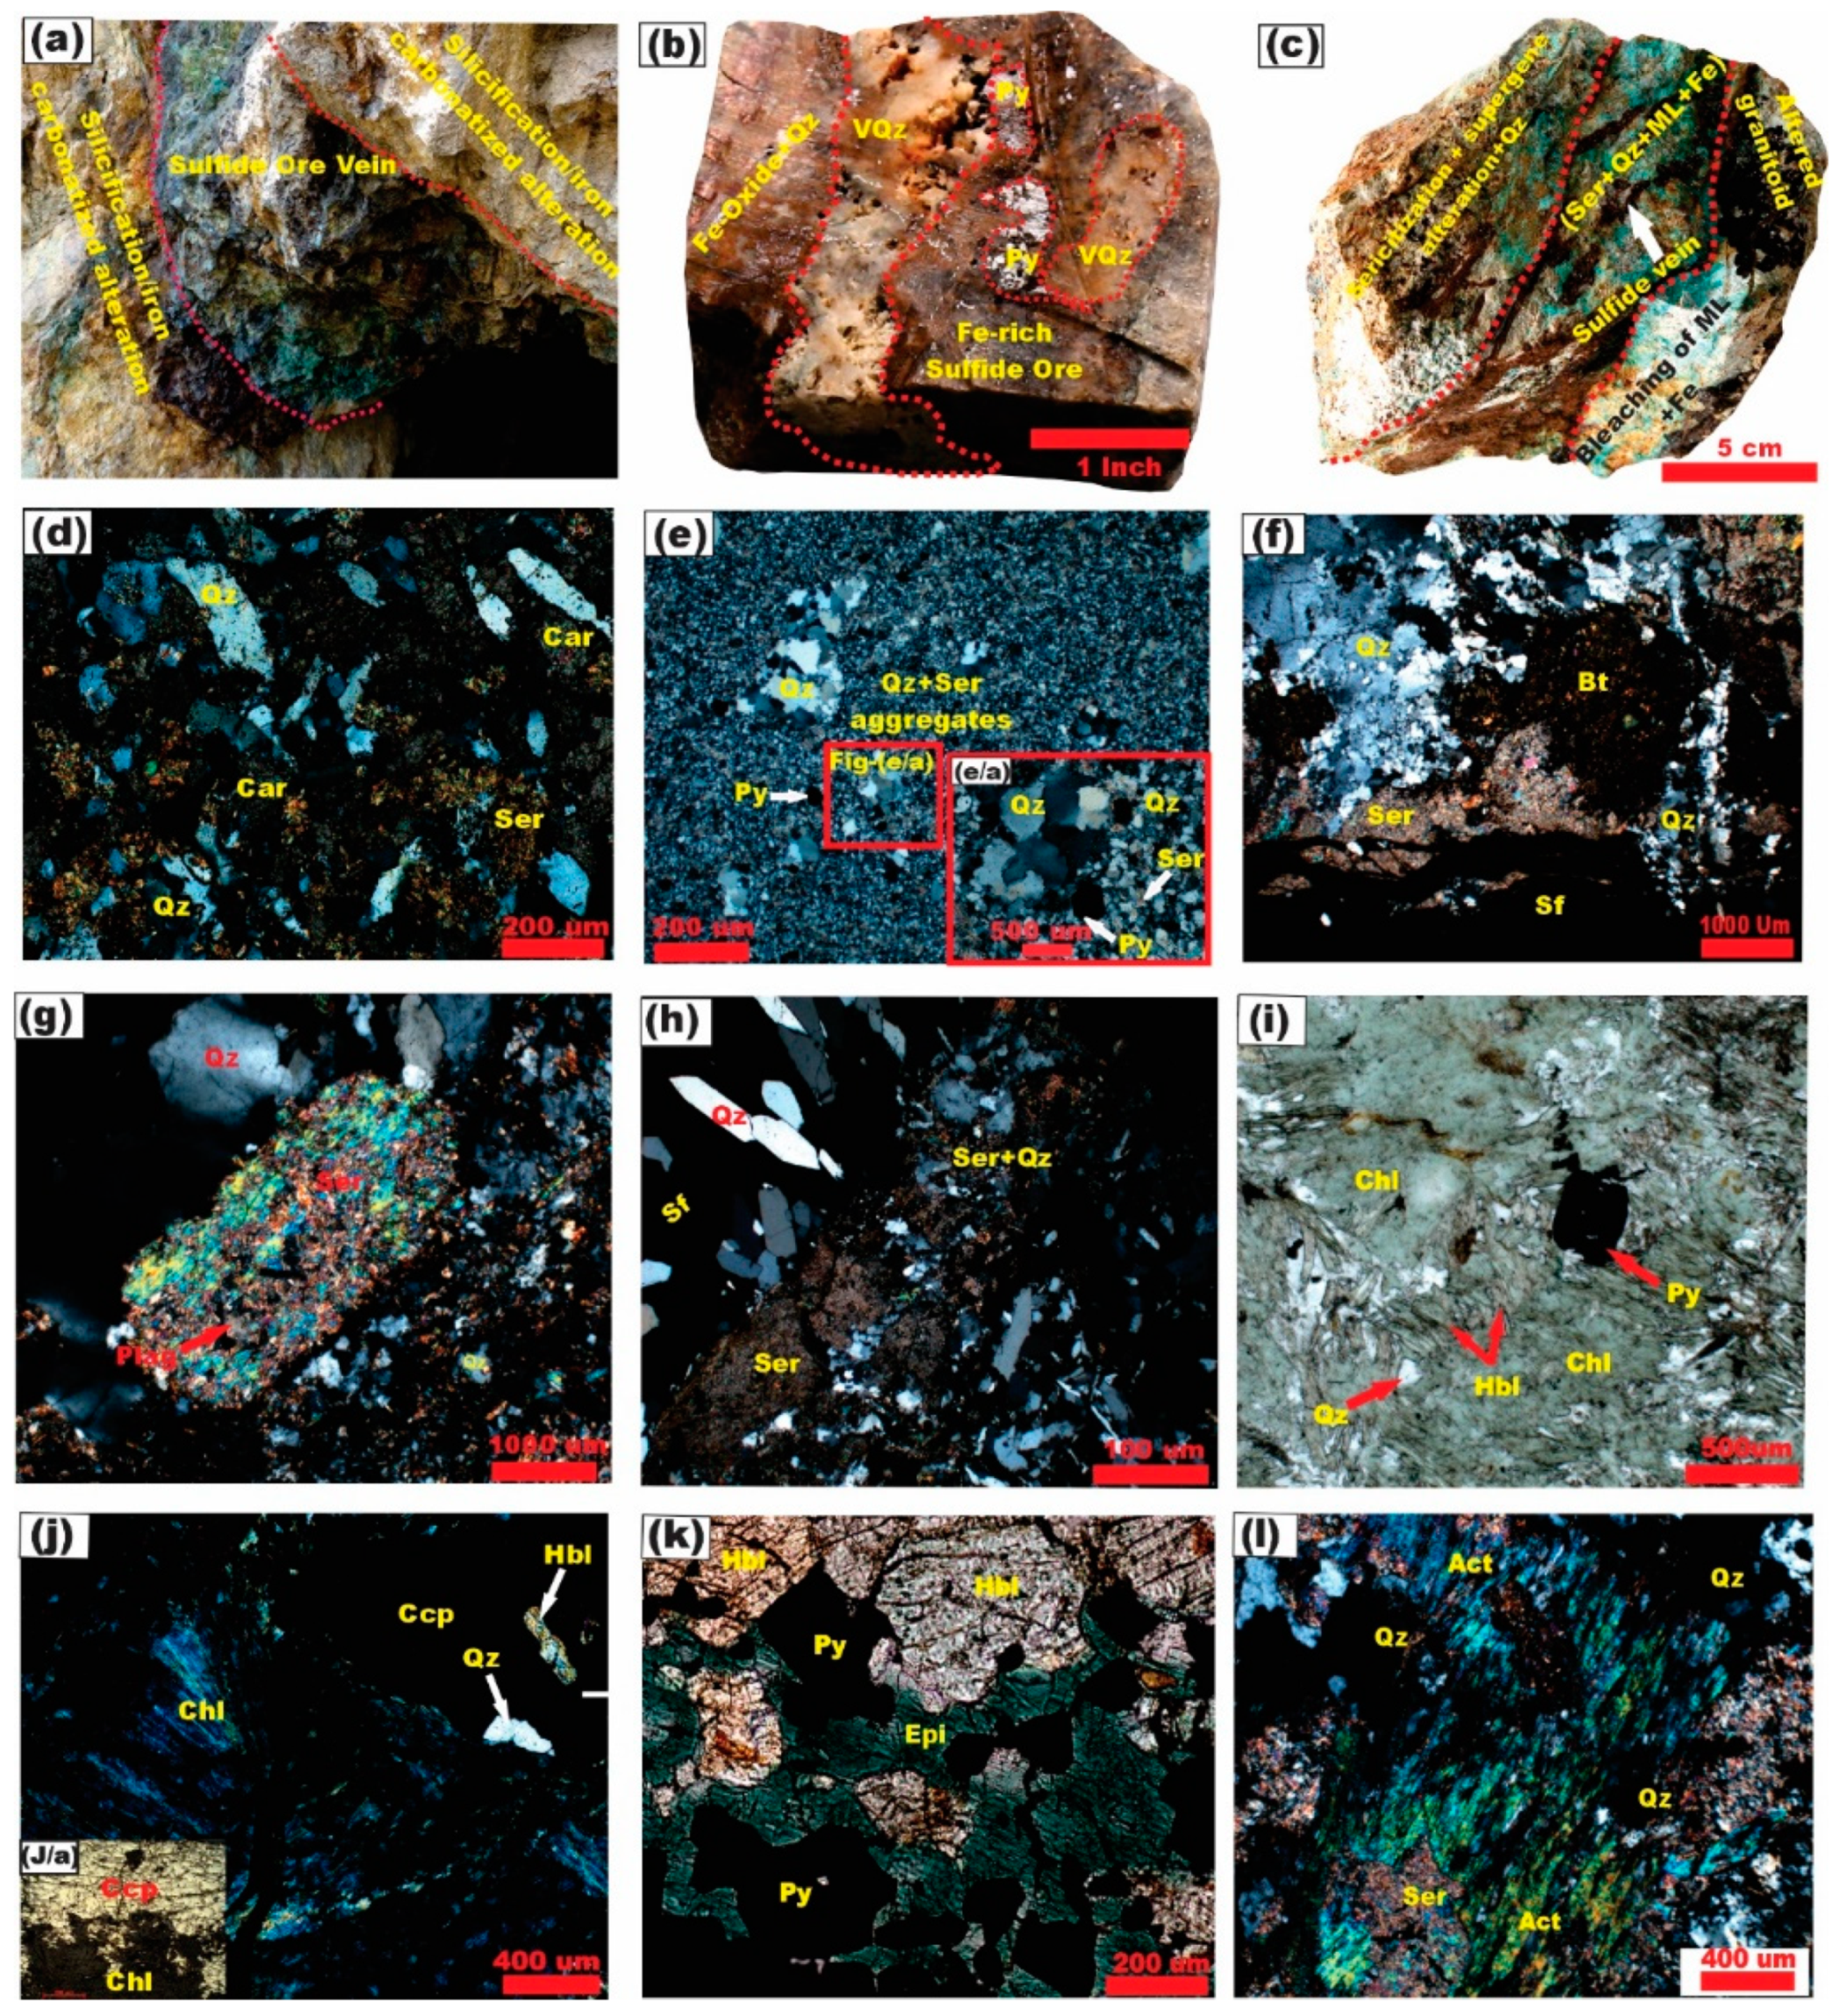
Sulfide-bearing ore samples were taken from the tunnels and trenches, at major exposed veins and alteration zones (Figure 2b). First, grab samples were selected based on hand specimen classification and cut down into a slab size (2 × 4 cm). Subsequently, we separately prepared 75 double-polished thin sections for ore petrography and 80 thin sections for alteration studies. All these sections were observed using an optical microscope Opton Universal Pol-U (Olympus Axia), a Scanning Electron Microscope-Energy Dispersive X-ray analyzer (SEM-EDS), and an Electron Probe Micro Analyzer (EPMA) at the Key Laboratory of Submarine Geosciences, Second Institute of Oceanography (SIO), Hangzhou, China. The chemical composition analysis of ore minerals was carried out on carbon-coated polished sections by EPMA using an accelerating voltage of 20 kV with a beam current of 20 nA. The time of counting for a peak was 15 and 5 s on each background-position of individual elements. Standard specimens were used for calibration, such as CuFeS2 (for Cu), FeS2 (for S and F), ZnS (for Zn), GaAs (for As), PbS (for Pb), CdS (for Cd), and native manganese, cobalt, nickel, silver, gold, and chromium (for Mn, Co, Ni, Ag, Sb, Au, and Cr, respectively).
Ninety double-polished wafers from different stages of mineralization were prepared for fluid inclusions study. Petrographic, microthermometric, and laser Raman spectroscopy studies were performed on fluid inclusions in the hydrothermal sulfide-bearing quartz grains from the pre-ore and main sulfide ore stages (I and II), and barren quartz and calcite from the post-ore stage. Finally, 50 double-polished sections were selected to conduct the microthermometry and laser Raman analysis considering the detailed petrography, primary fluid inclusions, size, and population. All studies for fluid inclusion were carried out at the Key Laboratory of Submarine Geosciences, SIO, Hangzhou, China.
Microthermometry data of fluid inclusions were measured using a Linkam THMSG 600 (manufactured by UK) heating-freezing stage with measurable temperatures between −196 °C and 600 °C. The precision of the temperature measurement was ensured by calibration with the freezing point of pure water (0.0 °C) and the triple point of CO2 (−56.6 °C). The accuracy of the temperature measurements was about ±0.1 and ±0.2 °C during freezing and heating, respectively. The rate ranges for freezing and heating were adjusted between 10 and 20 °C/min but gradually reduced to less than 0.2 °C/min when phase transitions were approached.
Laser Raman analysis was carried out using a Renishaw Invia Raman micro spectrometry, also at the Key Laboratory of Submarine Geosciences, SIO, Hangzhou, China. Representative inclusions were chosen for analyzing the composition of the fluid inclusions. The spectral range fell between 200 and 5000 cm−1 and an argon laser light was used as a laser source with a wavelength of 514.4 nm at a laser power of 20 nw. The laser beam size was about 1 um in diameter with a wavenumber precision of +1 cm−1 and spectral resolution of +2 cm1. The settings of the instrument were kept constant throughout the analysis procedure.
Aqueous fluid inclusion salinities were calculated based on the ice-melting temperatures of the two-phase inclusion [36], whereas the salinities of aqueous-carbonic inclusion were estimated according to clathrate ice melting temperatures [37]. The solid crystal (halite) dissolving temperatures were used to determine the salinities of solid-bearing inclusion [38,39]. The total salinity of the fluid inclusions was expressed as wt.% NaCl equivalent. Moreover, the densities of fluid inclusions for different stages were calculated using a conventional diagram comprised of the contoured plot of homogenization temperature and salinity with constant fluid density lines [40,41].
Twenty samples of sulfide minerals from different mineralization stages were analyzed for sulfur and lead isotopic compositions. Mineral separation was carried out by handpicking from crushed and sieved (40–60 mesh) samples under a binocular microscope and 99% pure grains of pyrite, chalcopyrite, and galena were collected. The sulfur isotopes were performed at the State Key Laboratory of Ore Deposit Geochemistry, Institute of Geochemistry, Chinese Academy of Sciences, using a Thermo Finnigan Mat 253 isotope ratio mass spectrometer (Thermo Scientific, Gremen, Germany), following the method suggested by [42]. The results are reported relative to the standard of Veinna Canon Diablo Troilite (V-CDT) using the standard reference materials IAEA-S1, IAEA-S-2, and IAEA-S-3 (international measurement standards). The analytical precision yielded a relative error (2σ) of <0.15‰. A Neptune II Multi Collector-Inductively Coupled Plasma Mass Spectrometer (MC-ICP-MS) was used to measure the Pb isotopic composition at the Beijing Research Institute of Uranium Geology (BRIUG), following the criteria described in Yuan et al. [43,44].

4. Ore Geology

The Kargah Cu-Pb polymetallic mineralization is a lithostructurally controlled vein-type deposit, which is mainly associated with sulfide-bearing quartz veins and alteration zones. Ore bodies are exposed at more than 50 different locations in the form of sulfide-bearing quartz veins and massive sulfide-bearing sheared zones (Figure 2b). Generally, ore bodies are oriented to NW and SE and commonly parallel to faults (Figure 2b). The ores occur either as discontinuous subhorizontal to sub-vertical quartz veins (Figure 3a,b), or less frequently as sulfide-bearing sheared zones. These quartz veins occupy the fractures, joints, and cracks mainly within the granitoids (Figure 3a and Figure 4a) and partly in the volcanic and meta-volcanic rocks (Figure 3b,d). The thickness of sulfide-bearing quartz veins varies from <1 to 5 m with an intermittent linear distance up to 1000 m on the outcrops, while the thickness of sheared zone differs from 1 to 150 m. The most common styles of sulfide ore bodies are symmetrical banded crustified quartz vein (Figure 3a and Figure 4a), comb texture with euhedral quartz (Figure 3f), corrugation texture (Figure 3g), massive sulfide ore with cavities and vugs, disseminated and nest-like texture, rarely stockworks, and highly oxidized sulfide-bearing rock with vuggy quartz.
Hydrothermal alterations are primarily present at the contact of host rock and quartz-bearing sulfide vein as well as around the sheared zones. The wall-rock alteration comprises four major styles: silicification, sericitization, propylitization, and carbonatization. Silicification is closely related to mineralization (Figure 4a), and can be observed from the main sulfide mineralization stages towards the post-ore stage. Typically, silicification is comprised of fine to medium grain subhedral to anhedral quartz, vuggy microcrystalline bodies (Figure 4b), massive quartz, and cryptocrystalline quartz. Sericitization is the most abundant and pervasive alteration in this deposit, mainly comprising sericite and quartz with a minor content of muscovite and biotite, and has a close relationship with the main sulfide minerals (Figure 4c). Alteration is so intense, and almost all plagioclase has been replaced into sericite, and fine-grained pseudomorphs of plagioclase are rarely noticed within the altered mineral (Figure 4g). Chlorite, epidote, and actinolite assemblages are the dominant mineralogical phases of propylitic alteration. These alteration minerals frequently replace hornblende biotite, pyroxene, and plagioclase feldspar (Figure 4i,k,l). This alteration is exposed as the exterior part of the alteration rims and is commonly noticed at the contact of sulfide veins and the metavolcanic rock. Moreover, it is also occasionally overprinted on the sulfide and pre-ore alteration mineral (Figure 4j). Carbonatization is intermittently observed at the final stage, indicating the weakening and termination of the hydrothermal ore-forming fluid activity. This type of alteration is noticed with oxidation products mostly around sulfide veins as a discrete layer (Figure 4a) and also overlapped with the barren quartz in the last stage (Figure 4d).
The mineralization process has been classified into three major stages (Figure 6). The pre-ore stage is characterized by the formation of euhedral to subhedral medium to coarse-grained pyrite and quartz with rare other sulfide minerals (Figure 5a,m). The main ore stage has been further divided into two substages (Figure 6). Ore stage I is characterized by an assemblage of chalcopyrite-magnetite-pyrite ± bornite (Figure 5b,d) and fine to medium-grained anhedral quartz with assemblages of silicified and sericitization alteration minerals. Ore stage II is represented by major massive galena, zincian tetrahedrite (Figure 5f,g), and native silver as well as some sericite alteration minerals and fine to medium-grained quartz as gangue minerals. The post-ore stage is dominated by barren quartz and carbonate with minor amounts of silicification and supergene minerals (Figure 3h and Figure 5o).

5. Results

5.1. Mineralogy and Mineral Chemistry
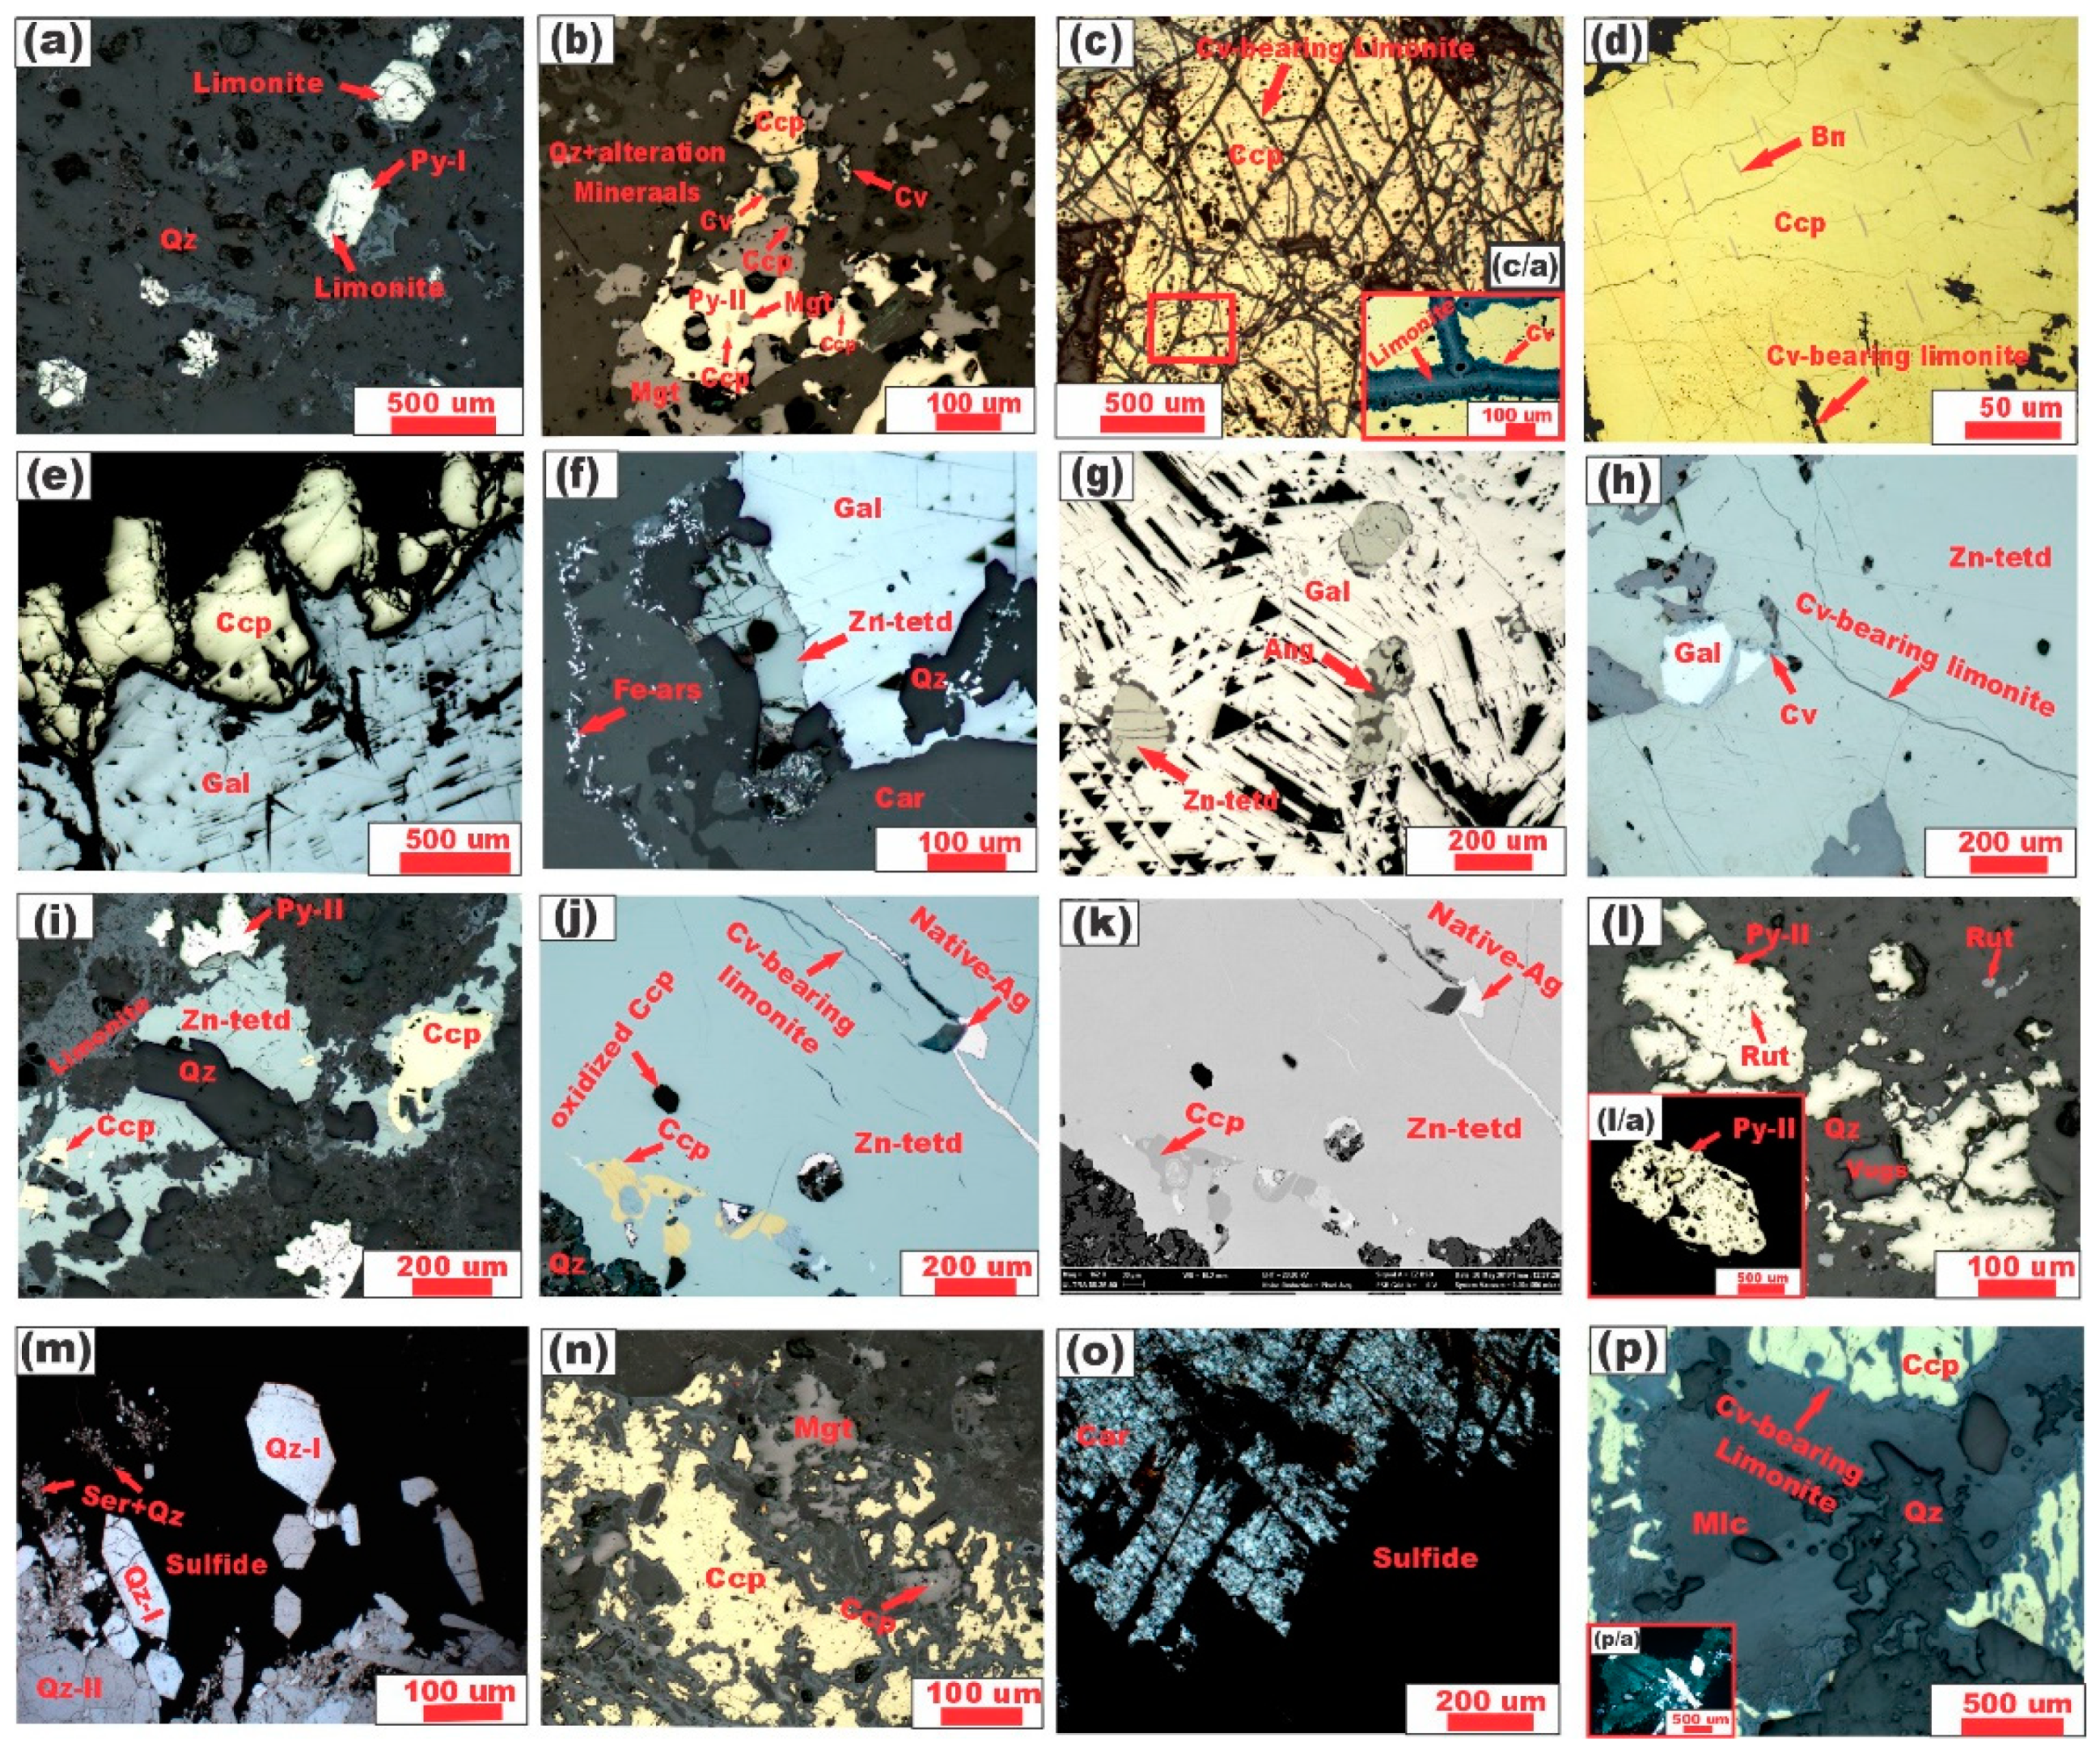
5.1.1. Ore Minerals

Pyrite

Pyrite is the most common and the only sulfide that occurs in two mineralization stages. Py-I usually occurs as euhedral to anhedral irregular dissemination in the form of free grains within the pre-ore stage (Figure 4i and Figure 5a). It is mainly associated with euhedral to subhedral quartz and rarely with other sulfides. Usually, Py-I is replaced by goethite veinlets (Figure 5a) and rarely observed as an inclusion within the sulfide ore stage II. Py-II occurs as a medium to coarse-grained anhedral crystal and commonly replaces chalcopyrite and magnetite (Figure 5b) from the sulfide ore stage I. Typically, Py-II encloses chalcopyrite and magnetite grains as an inclusion, indicating later formation in the paragenesis sequence compared to Py-I (Figure 5b).
The mineral chemistry of ore minerals is summarized in Table 1 and Table 2. Most of the Py-I and Py-II grains show low contents of Fe and S as compared with their standard values (Fe = 46.55 wt.% and S = 53.45 wt.%) [45]. Only one grain showed higher S content in Py-I, while two grains showed higher Fe content in Py-II (Table 2). S/Fe molar ratios higher than 2 exhibit iron loss, and ratios less than 2 are attributed to sulfur loss [46]. The calculated S/Fe molar ratios for Py-I and Py-II grains are <2 (Table 3); therefore, showing that the pyrite grains lost sulfur.
In Py-I, the ranges of trace element contents (i.e., As, Co, Ni, and Cd (ppm)) are 40–214 (average 115), 500–1900 (average 1201), 100–320 (average 166), and 140–250 (average 181), respectively. Py-II shows As, Co, Ni, and Cd content (ppm) ranges of 117–16,940 (average 3963), 130–380 (average 263), 100–240 (average 148), and 60–120 (average 78), respectively. Other trace elements, such as Cu, Au, Ag, and Zn are above the detection limit, whereas Pb and Sb are below the detection limit in all analyzed grains of Py-I (Table 2). In contrast, these trace elements (i.e., Cu, Au, Ag, Zn, Pb, and Sb) are above the detection limit in all analyzed grains of Py-II. Generally, Py-II shows higher contents of these trace elements compared with Py-I (Table 2).

Chalcopyrite

Chalcopyrite is the most abundant mineral of the sulfide ore stage I. It is commonly oxidized along the fractures and microcracks by covellite-bearing limonite (Figure 5a,c). Typically, massive chalcopyrite is observed with exsolution lamellae of bornite (Figure 5d), and irregular chalcopyrite grains commonly occur as an inclusion in the main sulfide stage II (Figure 5i,j). Generally, chalcopyrite is replaced by magnetite (Figure 5n). At some locations, both minerals are found as skeletal intergrown. Moreover, a relict inclusion of chalcopyrite is also observed, enclosed by massive magnetite. Further, medium to coarse-grained chalcopyrite crystals are noticed as relict grains in a larger phase of massive galena (Figure 3i), while at some places, galena is also observed to fill the fractures of chalcopyrite at contact (Figure 5e), showing different paragenetic sequence.
All various textural varieties of chalcopyrite have a similar and nearly stoichiometric chemistry (Cu1.01Ag0.003)1.01Fe1.00S1.98) (Table 1). The concentration of Ag has an average of 0.2 wt.%, while cobalt, chromium, cadmium, and nickel are less than 0.2 wt.% in chalcopyrite.

Magnetite

Magnetite is observed as medium to coarse-grained anhedral crystals and a massive form within the sulfide ore stage I (Figure 5b). Typically, magnetite replaces chalcopyrite, while magnetite itself is replaced by hematite and Py-II (Figure 5n,b). Mostly, magnetite and chalcopyrite are overgrown by Py-II (Figure 5b).

Bornite

Bornite (Cu5FeS4) is observed intermittently and as oriented exsolution lamellae within massive chalcopyrite, especially in association with Cu-rich quartz vein (Figure 5d). Bornite has near-stoichiometric chemistry (Cu5.0Fe1.0S4.0). As, Cd, and Cr are less than 0.01 wt.%.

Galena

Galena is the most abundant sulfide mineral and precipitated from the sulfide ore stage II. Massive galena contains deformation lamellae (Figure 3h and Figure 5f), whereas, at some places, it coexists with zincian tetrahedrite. Locally, blebs of zincian-tetrahedrite are observed from inclusions in the massive galena (Figure 5g). Galena is rarely encrusted and replaced by zincian tetrahedrite (Figure 5h), but mostly the opposite is observed. These relationships indicate the earlier formation of galena or suggest contemporaneous precipitation of galena and zincian tetrahedrite. Furthermore, medium- to coarse-grained chalcopyrite and Py-I are also noticed as relicts enclosed by galena (Figure 3i), showing later deposition of galena than chalcopyrite.
The EMPA analysis detected minor contents of Ag (0.44) and Sb (0.55) wt.% in massive galena (Table 1). The detection of Sb is probably due to the coexistence of galena and zincian-tetrahedrite (Figure 5f,g). The concentrations of Pb and S were calculated for galena at an average of 85.95 and 12.85 wt.%, respectively, and yielded stoichiometric chemistry ((Pb1.04Ag0.01Sb0.01Cd0.001)1.06S1.00).

Zincian Tetrahedrite

Zincian tetrahedrite is the second most abundant mineral in the sulfide ore stage II. It is observed generally in a massive form and encloses chalcopyrite and galena, and rarely Py-I (Figure 5i,l). In some samples, it has an opposite relationship with galena, where blebs of zincian tetrahedrite are included as inclusions within the massive galena (Figure 5g). These two different textural styles reveal the coexisting formation of these two minerals.
The major components of the zincian tetrahedrite are copper (39.22 wt.%), zinc (5.97 wt.%), antimony (16.19 wt.%), and sulfur (26.06 wt.%). Arsenic, iron, and silver are also present, with an average content of 8.56, 2.06, and 2.62 wt.%, respectively. The high contents of As, Fe, and Ag are probably due to iron-arsenide (lollingite) and native silver within the zincian-tetrahedrite (Figure 5j,f). Further, the minor amounts of Au, Co, Cr, Ni, and Cd were also detected with an average concentration of 0.01 wt.%. Hence, the overall chemistry for zincian tetrahedrite is (Cu9.48Ag0.37)9.85 (Zn1.40 Fe0.57Cd0.03)2.00 (Sb2.04 As1.75)3.79S12.56.

Native Silver

Native silver commonly fills the fractures, microcracks, and fissure gaps within zincian-tetrahedrite from the sulfide ore stage II (Figure 5j,k). Therefore, these features are good indicators for the presence of native silver at the deposit. The grains of the native silver are bright white, and their morphology depends on the shape of the cavity, crack, and fracture they infill.
The EPMA results show an average of 98.66 wt.% of Ag with detectable amounts of Cu, Zn, and Cd in 1.02, 0.10, and 0.07 wt.%, respectively. The contents of Au, Cr, and Co are 0.01 wt.% on average, indicating empirical formula (Ag0.92Cu0.02Cd0.01)0.9 (Table 1).

Iron-Arsenide (Lollingite)

Iron-arsenide (lollingite) is commonly noticed along the fractures and microcracks of carbonate mineral from the post-ore stage but hardly occurs in association with zincian-tetrahedrite as prismatic aggregates in sulfide-ore stage II (Figure 5f). It has a bright silver-white color with metallic reflection under ore petrography. It contains high concentrations of As (average 65.70 wt.%) and Fe (average 29.86 wt.%) with minor amounts of S and Pb (average 2.58 and 0.12 wt.%, respectively). The contents of Cu, Zn, Cr, and Cd are <0.01 wt.%.

5.2. Fluid Inclusion Study

5.2.1. Petrography and Classification

Primary, secondary, and pseudo-secondary inclusions were identified based on Roedder criteria [28], and primary inclusions are further classified according to their nature, number, phase proportion at room temperature, and phase transitions during cooling and heating, plus by laser Raman spectroscopy. Five types of inclusions were recognized: type I (monophase aqueous), type II (two phases liquid and vapor aqueous), type III (aqueous-carbonic), type IV (liquid-rich aqueous), and type V (solid-bearing inclusions).

Type I Inclusions

Type I inclusions are rarely distributed and typically observed in pre-ore and occasionally in the sulfide ore stage I (Figure 7a). These inclusions are monophase H2O, which are identified by laser Raman spectroscopy. The inclusions are ellipsoidal in shape, irregular, negative crystals, dark colors, with sizes varying from 3 to 16 µm, but most of the inclusions have sizes from about 4 to 6 µm (Figure 7b). Usually, these inclusions are observed as isolated forms and are rarely associated with type II and type IV.

Type II Inclusions

Type II inclusions have two phases: aqueous liquid and vapor, but their volumetric ratios are approximately equal in most inclusions (Figure 7f,i,j), and rarely vary between 20 (liquid) and 80% (vapor) (Figure 7a–c). This type is abundant in the pre-ore and the main sulfide ore stages. The sizes of inclusions are from 1 to 22 µm but commonly are between 3 and 10 µm. These inclusions have oblate, native crystal, irregular shapes, and coexist with type I (Figure 7b) and type IV inclusions (Figure 7c,f).

Type III Inclusions

Type -III inclusions comprise three phases (i.e., VCO2 + LCO2 + LH2O) (Figure 7d), but most of the inclusions are observed as two phases (i.e., LCO2 + LH2O) at room temperature (Figure 7g). These inclusions occur as isolated patches in the pre-ore and sulfide ore stage I, which represents the primary origin and is occasionally observed with type II inclusions. Overall, their proportion is less than all other inclusion types. The type III inclusions can be further classified into two subtypes: IIIa and IIIb. Type IIIa inclusions have more H2O than CO2 (Figure 7g), while type IIIb inclusions contain more CO2 than H2O (Figure 7d). The sizes of inclusions vary from 3 to 60 µm; however, most of them range from 10 to 20 µm. The shapes are typically oblate, elongated, negative crystals, and irregular. The volumetric proportions of CO2 vary between 20 to 80%.

Type IV Inclusions

These types of inclusions consist of liquid and vapor phases and are observed to occupy the highest inclusion population as compared with all other types, which is approximately up to 40%. These fluid inclusions are observed in all stages, however most consistently present in sulfide-ore stage II and late stage, as isolated or trial form, along the growth zones, indicating a primary genesis (Figure 7h,i,l). The range of size is observed from less than 2 µm to a maximum of 40 µm, and they are oblate, ellipsoidal, and irregular in shape. These inclusions contain an abundant ratio of vapor (approximately from 30 to 40%) in the pre-ore and sulfide ore stage I, while the volumetric proportions of vapor are observed between 15–30 and 5–10% in the sulfide ore stage II and late stage, respectively.

Type V Inclusions

Type V fluid inclusions are only hosted in quartz of sulfide ore stage II, having three phases including aqueous-liquid, vapor bubble, and solid-bearing inclusion (Figure 7h,j). The daughter mineral (solid phase) is identified primarily as halite (NaCl), with a cubic, irregular, oval, and globular form and sizes ranging from 5 to 12 µm in diameter. Halite is mostly noticed as having light color and cubic form (Figure 7i). During microthermometry, halite dissolved before the vapor phase disappeared, and only a few daughter minerals disappeared after the vapor phase. These inclusions account for approximately 15–20% of the total inclusion population, whereas the vapor bubbles account for 10–45%. These halite-bearing inclusions (type V) usually coexist with type II and type IV in the sulfide ore stage II as fluid inclusion assemblages (Figure 7h,j), indicating the primary origin of these inclusions [47,48,49].

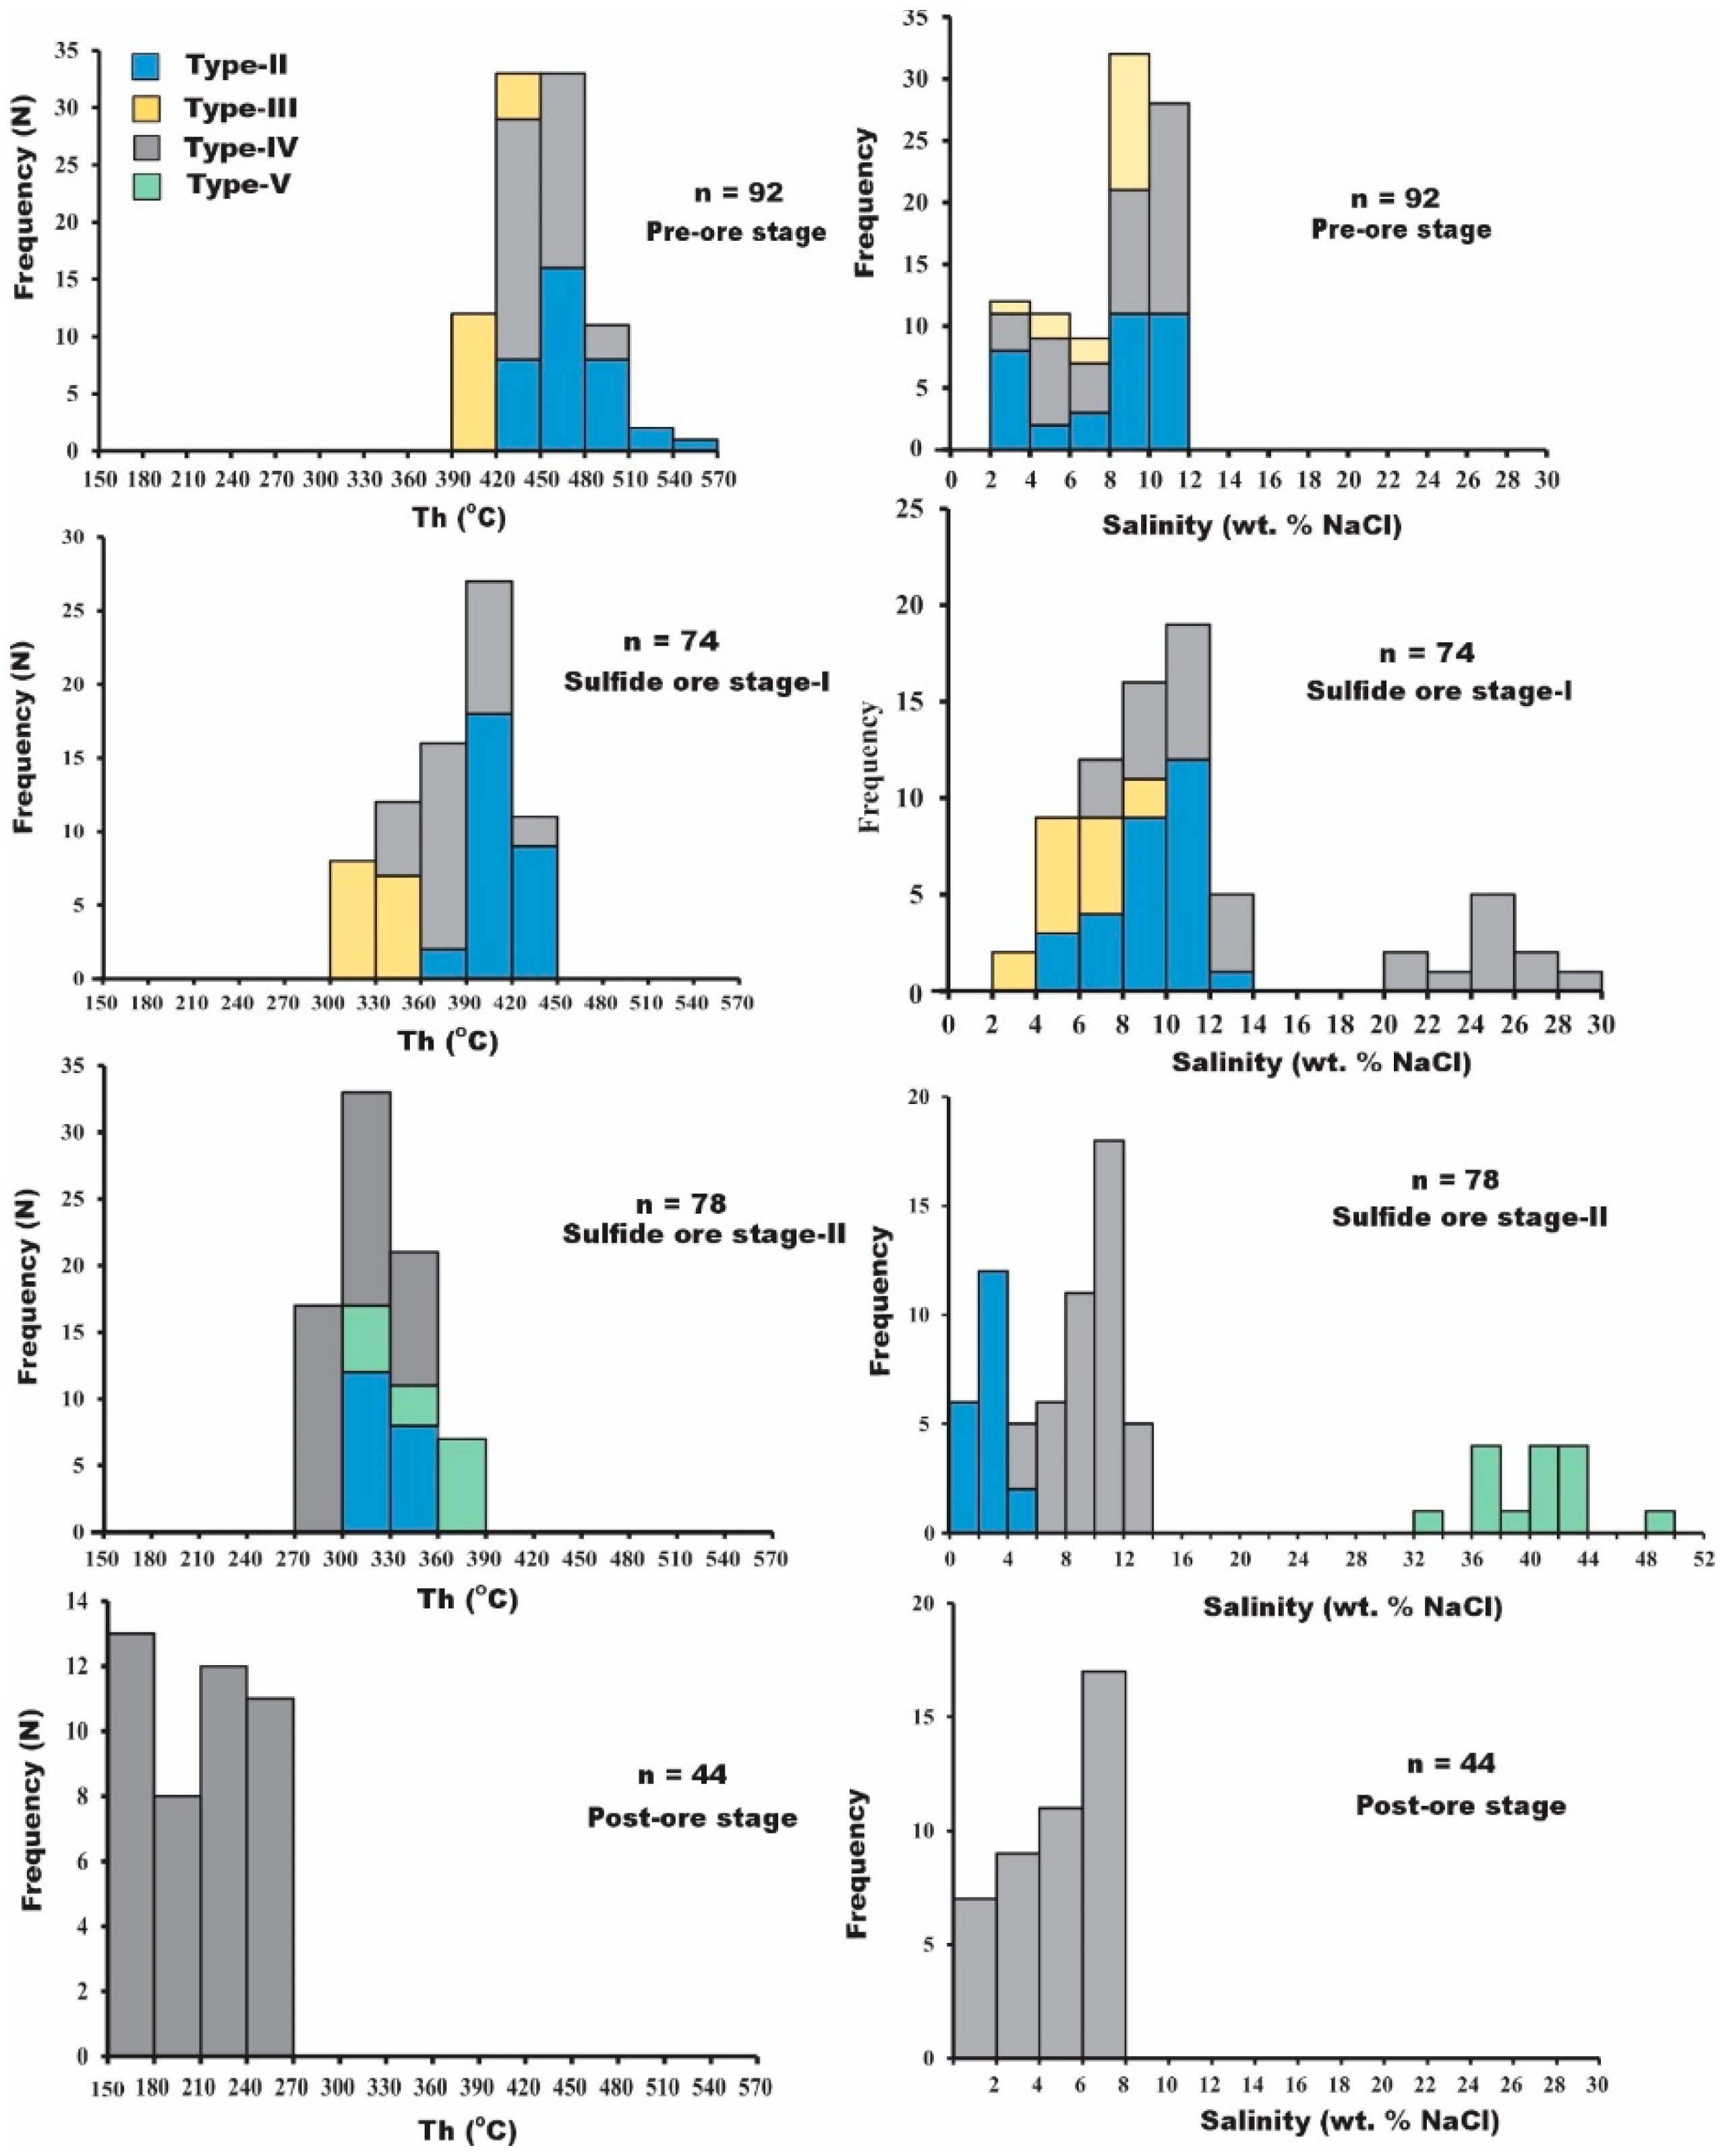
5.2.2. Microthermometry

Microthermometric analyses were conducted on all types of inclusions, excluding type I. The microthermometry data are summarized in Table 4 and Figure 8.

Pre-Ore Stage

The ice melting temperatures and corresponding salinities range of type II and type IV inclusions are almost close to each other in the pre-ore stage, which extends from −8.3 to −1.8 °C and from 3.06 to 12.05 wt.% NaCl, respectively. These types of inclusions (type II and type IV) stand for approximately 40–50% and 35–45%, respectively, of the total inclusion population with conspicuous vapor bubbles accounting for 70–90% and 30–40% of the volume (Figure 7f), respectively. These inclusions are both mostly homogenized to the liquid phase and show critical behaviors at temperatures ranging from 434 to 555 °C and from 442 to 495 °C (Figure 8), respectively. Moreover, type II and type IV inclusions have calculated densities that range from 0.20 to 0.65 g/cm3 and from 0.40 to 0.70 g/cm3, respectively.
The first ice melting temperatures of type III inclusions range from −57.0 to −54.0 °C, whereas the minimum first melting temperature is not much less than the triple point of pure CO2 (−56.6 °C). Hence, these temperature ranges can be characterized by the absence of any volatile substances with the CO2 fluid, which are confirmed by laser Raman spectroscopy (Figure 9b,d). The salinity of these inclusions is calculated to range between 4.07 and 10.04 wt.% NaCl. The consistent clathrate final ice melting temperatures of these inclusions range from 4.3 to 7.9 °C, and the homogenization temperatures of CO2 range from 30 to 31.5 °C. The final homogenization temperatures of these inclusions in the liquid phase range between 399 and 425 °C (average 415 °C). Moreover, the type III inclusions show intended densities of the total fluids that range from approximately 0.55 to 0.70 g/cm3.

Sulfide Ore Stage I

All types of inclusions, excluding type V (solid-bearing inclusion), were identified in this stage. The volumetric proportion ratios of liquid and vapor of type II and type IV are slightly different. Type II inclusions account for 40–50% of the total inclusion population, whereas type IV inclusions comprise 30–40%. The vapor bubbles account for 50–70% and 20–30% of the volume (Figure 7e,f), respectively. Type II inclusions have homogenization temperatures ranging from 380 to 438 °C (average 410 °C). The final ice melting temperature of these inclusions is calculated to be between −8.7 and −3.0 °C, with the corresponding salinities from 4.96 to 12.51 wt.% NaCl. Type IV inclusions are homogenized to the liquid phase with temperatures ranging from 332 to 423 °C (average 380.8 °C). These inclusions have final ice melting temperatures between −29.0 and −5.0 °C, and the corresponding salinities range from 7.86 to 29.26 wt.% NaCl. Type II and type IV inclusions have densities of 0.65 and 0.80 g/cm3, respectively.
In this stage, the total inclusion population of type III is comparatively higher than the pre-ore stage, which comprises from 15 to 20% of the total inclusion population with a volume of LH2O accounting for 70% and LCO2 accounting for 10% at room temperature (Figure 7g). The homogenization temperatures of these inclusions range from 300 to 359 °C (average 327.47 °C) by the disappearance of the vapor bubble. These inclusions have, first, ice-melting temperatures (from −57.0 to −53.6 °C), and clathrate final ice-melting temperatures between 4.8 and 8.2 °C with the corresponding salinities from 3.52 to 9.28 wt.% NaCl. The homogenization temperatures of CO2 into the vapor phase are calculated from 30 to 36 °C. In addition, these inclusions reveal that the range of the densities the total fluids approximately range from 0.70 to 0.80 g/cm3.

Sulfide Ore Stage II

In this stage, three types of inclusions were identified (type II, type IV, and type V). The total inclusion population of type II is from approximately 30 to 40%, whereas type IV inclusions account for 40–50% of the total inclusion population. The homogenization temperatures of type II inclusions are measured from 300 to 356 °C (average 331.95 °C). These inclusions have ice-melting temperatures that range from −3.1 to −0.9 °C, with corresponding salinities ranging from 1.57 to 6.45 wt.% NaCl. The calculated densities range from 0.65 to 0.80 g/cm3. Type IV inclusions occupy the highest volume of inclusion population as compared with other types. These inclusions are homogenized from 280 to 352 °C (average 308.67 °C) by the disappearance of the vapor bubble. The calculated ice-melting temperature range is from −9.2 to −3.0 °C, whereas equivalent salinities are estimated between 4.96 and 13.04 wt.% NaCl. The densities of these inclusions are measured from 0.75 to 0.90 g/cm3.
The solid-bearing inclusions (type V) were only observed at this stage, which occupied a lower abundant volume than all other types, accounting for approximately 10% of the total inclusion population. The homogenization temperature range of type V inclusion is between 313 and 390 °C. The dissolving temperature range of the daughter minerals is from 283 to 368 °C, with an average of 325 °C. The corresponding salinity range is between 33.44 and 49.26 wt.% NaCl. Minerals are not considered to be true daughter minerals, which are undissolved by heating to more than 500 °C, indicating that they are entrapped accidentally instead of being precipitated.

Post-Ore Stage

At this stage, only type IV fluid inclusions were identified. The vapor bubbles account for approximately less than 10% of the volume (Figure 7l), and all are homogenized to the liquid state by the disappearance of the vapor. The homogenization temperature range is between 155 and 256 °C, on average, 211.20 °C. The range of the final ice-melting temperatures is calculated from −5.3 to 4.5 °C, with the corresponding salinities from 0.88 to 8.28 wt.% NaCl. Moreover, the total fluid density is significantly higher than the former stages, ranging between 0.85 and 1.0 g/cm3.

5.2.3. Laser Raman Spectroscopy

The laser Raman spectroscopy results reveal that type I inclusions have apparent peaks of H2O with the absence of any other component peak, suggesting that they contain only H2O. In the pre-ore stage, the vapor-rich (type II) inclusions reveal that water is the dominant fluid component of the liquid phase, whereas the vapor bubbles are mainly comprised of CO2 and H2O spectrum (Figure 9a). In contrast, type II inclusions have a large amount of water in the sulfide ore stages I and II with the absence of CO2 peak (Figure 9d). The carbonic inclusions (type III) show that the vapor bubbles and intermediate liquid phase contain a large amount of CO2 (Figure 9b,e), while the end member of type III inclusions has a significant amount of water. Moreover, the Raman analyses of liquid-rich (type IV) inclusions, in all stages, reveal that H2O is the only dominant constituent of the fluid system (Figure 9c,f). These inclusions lack any other compressive volatile substances, which probably result from phase separation or boiling.

5.3. Sulfur Isotopes

The sulfur isotopic measurements from 20 sulfide minerals (e.g., pyrite, chalcopyrite, and galena) from different mineralization stages obtained during this study show a variable range of composition from −2.80 to 6.41‰ (average 3.38‰) (Table 5 and Figure 10). The pyrite, chalcopyrite, and galena δ34S values range between −2.80 and 5.82‰ (average 2.46‰), 5.91 and 6.41‰ (average 6.19‰), and 3.59 and 3.69‰ (average 3.50‰), respectively. These values show a trend of δ34S chalcopyrite > δ34S pyrite > δ34S galena (Figure 10), which suggests an overall equilibrium of the S isotopes among sulfide minerals during the evolution of the hydrothermal fluids [50].

5.4. Pb Isotopes

The results of the Pb analyses of the sulfide minerals from the Kargah Cu-Pb polymetallic deposit are presented in Table 5. The ratios of 206Pb/204Pb range from 18.54 to 20.37 (average 20.04), 207Pb/204Pb range from 15.67 to 16.01 (15.90), and 208Pb/204Pb range from 39.07 to 40.86 (40.28). These values are plotted in the Pb isotope evolution diagram of Zartman and Doe [51].

6. Discussion

6.1. Trace Elements Incorporation within Pyrite

Previous studies have indicated that pyrite can host different trace elements within its structure. Therefore, the trace element content of pyrite may be used to interpret the different geological environments and hydrothermal fluid evolution [45,52,53,54,55,56]. Trace elements in pyrite can occur mainly in the form of mineral inclusions such as visible micro-sized sulfide minerals, visible micro-sized oxide silicate inclusions, and invisible sulfide nanoparticles [57,58], and invisible solid solution within the crystal structure [59]. Several elements, i.e., As, Ag, Au, Co, Ni, Co, Pb, Te, Se, and As may occur in a pyrite lattice by the replacement of Fe and S, respectively [60,61,62].
The moderate to weak negative correlations of As with Fe and S in Py-I and Py-II. (Figure 11a,b), suggest that the former element is weakly substituted into the pyrite lattice, for example, [61,63]. Arsenic exhibits positive correlations with Ni, Co, Au, and Ag in Py-I and Py-II indicating the former element facilitates later element incorporation into the pyrite structure (Figure 11c–e) [60]. A strong to moderate negative correlation between Fe and Cu + Co + Ni + Au suggests their ionic replacement with Fe2+ and likely entry into the structures of pyrites (Figure 11f). Elements such as Zn, Pb, Sb, As, and Ag are the major and trace element components of sulfosalts, for example, [64]. The strong positive correlations between Pb-Zn, Pb-Sb, As-Ag, Sb-Zn, and Ag-Au (Figure 11g–j) indicate the presence of Zn-As-Ag-Sb-Au-Pb bearing sulfosalt as mineral inclusions in Py-II. This is analogous to the sulfosalt inclusions in pyrite from the Agua Rica porphyry deposit, Catamarca, Argentina [65], TAG massive sulfide deposits [66], and Py2 at Mirkhani ore deposit [45]. Positive and negative correlations of Cu with arsenic (Figure 11k) in Py-I and Py-II, respectively, suggest dissimilar fluid chemistry of Py-I and Py-II [45]. In addition, Cu also exhibits a weak to very weak geochemical association with Zn, Pb, and Sb in pyrites, inferring the dissimilar paragenesis sequences with the later elements (Figure 11l) [67]. These correlation diagrams differentiate the chemistry of Py-I from Py-II, which is also consistent with the textural study of different pyrites at the Kargah Cu-Pb polymetallic deposit. The LA-ICP-MS time-resolved depth profiles are required to provide further evidence about the existence of both mineral inclusions and structural bound elements within pyrite structures.
The depth of mineralization can be predicted by the ratio of Fe to (S + As). Usually, this ratio increases from a depth towards the surface and shows 0.846, 0.863, and 0.926 at greater, moderate, and shallow depths, respectively [68]. These ratios are calculated from 0.850 to 0.863 (average 0.856), and from 0.873 to 0.908 (average 0.890) in Py-I and Py-II, respectively suggesting a moderate to shallow depth for Kargah Cu-Pb polymetallic mineralization (Table 3).

6.2. Evolution of Ore-Forming Fluids

The microthermometry results from the Kargah Cu-Pb polymetallic deposit reveal continuous cooling of the ore-forming fluids (Figure 8) and homogenization temperature linearly decreases with the salinities (Figure 12), probably indicating mixing of fluid in the formation of ore deposits (Figure 12). At the pre-ore stage, fluid inclusions are characterized by a high temperature (399–555 °C) with a low to moderate salinity (3.06–12.05 wt.% NaCl), which indicates the critical condition of inclusions (Figure 10 and Figure 12). According to Cline et al. [69] and Liao et al. [70], critical condition fluid inclusions typically show low to moderate salinity (4–11 wt.% NaCl) with high temperature, which is consistent with the pre-ore stage inclusions. The coexisting liquid-rich (type IV), vapor-rich (type II), and solid-bearing inclusions (type V) are present as a group assemblage in the main sulfide ore stages (Figure 7f,h,i), suggesting that liquid and vapor are separated from a single-phase fluid due to similar homogeneous temperatures and contrasting salinities, and that fluid boiling occurs [37,71,72]. As ore-forming fluids evolve into sulfide ore stage I from the pre-ore stage, they go through the boiling process because the separated coexisting phases of type II and IV inclusions are closely associated with each other (Figure 7e,f), showing a large variation in salinities but similar homogenization temperatures [73,74,75] (Figure 8).
Generally, fluid inclusions lack evidence of trapping from a boiling fluid. Therefore, the trapping pressure of inclusions should be greater than the minimum pressure [72,76,77]. Hence, we used the isobars from Dresner and Heinrich [77] to estimate the trapping pressure of the pre-ore and sulfide ore stages I and II. Estimated trapping pressures of the sulfide ore stage II range from 100 to 250 bars (Figure 13), and the average entrapment pressure is mostly less than 200 bars, suggesting a depth of less than 2 km and corresponding to a hydrostatic condition [72]. The trapping pressures of the pre-ore and sulfide ore stage I range from 200 to 800 bars, with an average pressure of 450 bars (Figure 13). This average pressure reveals to a depth approximately greater than 2 km, assuming a lithostatic pressure [72]. Therefore, structural evidence of an evolution from a closed to an open vein system and a simultaneous transition from lithostatic to hydrostatic conditions also indicate that boiling may have occurred. Moreover, the salinity of liquid-rich inclusions (type IV) of sulfide ore stages is slightly greater than in the pre-ore stage. This also implies fluid boiling because the concentration effect of losing volatile substance throughout the fluid boiling may slightly increase the salinity, for example, [70,78,79,80].
A low to moderate salinity fluid cannot be developed by only a simple boiling of magmatic fluid [72,81]; therefore, a reliable source is meteoric water heated by external fluid. Subsequently, upon cooling, the magmatic fluid is mixed with a low to moderate salinity and low-temperature surface derived fluid. The results reflect a sequence of events with variable amounts of mixing, boiling, and cooling in the mineralization system. Therefore, the ore-forming fluids reveal two stages of fluid evolution with partial overlap (Figure 12). The early stage of ore-forming fluid is derived from magmatic fluids and subsequently diluted by meteoric water during the sulfide ore stage II. In the sulfide ore stage I, the low salinity (Figure 8 and Table 4) probably reflects the condensed steam with saline fluids, while the large variation of the early fluids is involved in the sulfide ore stage II (Figure 8 and Table 4). In the post-ore stage, the formation of barren quartz and calcite veins both have lower salinity (from 0.88 to 8.28 wt.%) and lower temperature (from 155 to 256 °C), which indicates termination of the mineralization in the circular hydrothermal system.
The pre-ore and sulfide ore stage I have an abundant amount of type III (aqueous-carbonic) inclusions, whereas these inclusions disappeare in the sulfide ore stage II. Further, type II inclusions contain large amounts of water with less CO2 (Figure 9a) in the pre-ore and sulfide ore stage I. We did not find any CO2 spectrum in the vapor bubbles of type II inclusions of the sulfide ore stage II and observed only aqueous inclusions (Figure 9d). Suddenly, the disappearance of type III inclusion and absence of the CO2 in the vapor bubbles of type II inclusion in the sulfide ore stage II could be caused by losing a volatile substance (CO2) through the fluid mixing. Thus, it can be concluded that ore-forming fluid of pre-ore and sulfide ore stage I have an abundant amount of CO2, whereas, in the sulfide ore stage II, the disappearance of CO2 reflects the mixing of meteoric water. In the post-ore stage, the ore-forming fluid significantly decreases in salinity and temperature and increases in density, suggesting that it mainly evovles into meteoric water.

6.3. Composition and Implication for Ore-Forming Fluids

Previous studies have exhibited that ultramafic and mafic rocks are enriched in Ni [82]. In contrast, Mo is enriched in felsic rocks (i.e., granite) [83]. As a result, the values of the Mo/Ni ratio are used as an empirical tracer to constrain the relative proportion of mafic to ultramafic over a felsic rock in the source area [84]. The Mo/Ni ratio values in the pyrite from the Kargah Cu-Pb polymetallic deposit are characterized by low values, ranging from 0.43 to 0.94. This range of values is closed to the Yongxin Au deposit (0.41–2.33), which is derived from the mafic-source hydrothermal fluids [44]. In contrast, a mixed provenance of mafic to intermediate and felsic ore-forming fluids such as Bagrote gold deposit show high ratio values (1.35–59) as compared with our data [9]. Further, the Co/Ni ratio also provides a reasonable clue to discriminate the hydrothermal fluid source characteristics [85,86]. The low (0.43–0.94) and high (1.3–16.4) ratio values of Mo/Ni and Co/Ni, respectively, from the Kargah Cu-Pb polymetallic deposit suggest a mafic source for the hydrothermal fluids.
The eutectic temperature range of type IV inclusions is between −17.6 and 21.5 °C, which is higher than the H2O-NaCl-KCl (−22.5) and H2O-MgCl2 systems (−33.6), suggesting that the ore-forming fluids probably belong to the H2O-NaCl system [75,87]. Further, the combined results of both laser Raman analyses and microthermometry reveal that the ore-forming fluids of the pre-ore and sulfide ore stage I primarily belong to an H2O-NaCl ± CO2 system, whereas sulfide ore stage II and post-ore stage corresponds to an H2O-NaCl system.
An abundant content of arsenic in pyrite is typically used to represent a low-temperature condition, which can enter into the pyrite structure by replacement of both S and/or Fe [55,88]. The low and high As contents (ppm) in Py-I (average 115) and Py-II (average 2963), from the Kargah deposit, indicate a moderate to high temperature for ore-forming fluids. The variation of Co contents in pyrite (ppm) such as high (>1000), moderate (100–1000), and low (<100) suggests high-, medium-, and low-temperature origin, respectively [89]. Most studies have demonstrated that coarse-grained pyrite forms at a higher temperature (>350 °C) and is enriched in Se, Co, Bi, and Ni [66,90]. The contents of As, Co, and Ni (ppm) 40–16,940, 210–1900, and 100–320, respectively, in pyrites from the Kargah Cu-Pb polymetallic deposit are supported with the formation in moderate- to high-temperature environments [45,55,90,91,92]. In addition, the average high (Co = 1201, Se = 159, and Ni = 166) and low (As = 155, Zn = 117, and Ag = 41) concentrations (ppm) in Py-I and inverse contents in Py-II (Co = 430, Se = 80, and Ni = 148) and (As = 3963, Zn = 330, and Ag = 243), as well as low (0.7) and high (3.7) ratio of Zn/Cd in Py-I and Py, respectively, suggest a high-temperature environment for the former pyrite as compared with the latter. The decrease in temperature from early to late probably shows the mixing of meteoric water, which is consistent with the fluid inclusion study.
The different ratios of Co-Ni-As in pyrite (Figure 14d) are used as a good indicator to determine the hydrothermal sources and evolution of ore-forming fluid [44,93]. The ratio of magmatic and meteoric water in the hydrothermal fluid is revealed via different contents of Co and As. For example, the higher As content or the values of the plot are concentrated at the As end in the Co-Ni-As diagram indicates excessive meteoric water volume in the hydrothermal fluid. In contrast, the plots are closer at the Co endmember, and therefore suggest that the ore-forming fluid is dominant magmatic water [44,85,94]. The plots of this study are scattered from Co towards As ends with far from Ni within the Co-Ni-As diagram, but most values are closer to Co end (Figure 14d), suggesting that the ore-forming fluids are relatively dominant magmatic water.

6.4. Source of the Ore-Forming Materials

The δ34S range of this study (from -2.80 to 6.41‰, average 3.38‰) is higher than that of most magmatic-hydrothermal deposits (typically δ34S = from −3 to +1 ‰) [72,97]. A magmatic source in hydrothermal deposits implies that the δ34S values are near (0 ± 3‰) [98,99]. Previous studies have revealed that the sulfur isotopic composition of sulfide minerals depend on the δ34S of source materials, and also on the physicochemical condition (pH value, temperature, ion activity, and oxygen fugacity), as well as the evolution of the hydrothermal fluids [100,101]. The δ34S variation in the magmatic-hydrothermal deposit is also caused by magma contamination via interactions with country rocks, and typically assigned to the assimilation of sulfur from the wall rocks [97]. The slightly different δ34S values can also be caused by the boiling process during mineralization [102]. The wall-rock hydrothermal alterations are prominently present in this deposit at the contact of host rock and quartz-bearing sulfide vein, as well as around the sheared zones. The dominant country rock in the study area is granitoids (Kohistan Batholith, Figure 2). The δ34S values in this type of rock are reported in the range from −11 to 14.5‰ (average 1.0 ± 6.1‰) [103]. Therefore, it can be concluded that sulfur was probably supplied via fluid input from deep-seated magma and contaminated or assimilated by host rock sulfur, most likely from granitoid rock due to the presence of Kohistan Batholith as the dominant constitute in the area.
The δ34S values of sulfide minerals, in this study, are mainly concentrated between 3.04 and 6.41‰, indicating a deep source (mantle and magmatic) for the mineralization fluid, see (Figure 15 [44]). In addition, the δ34S values (from −2.80 to 6.41‰) of the sulfide minerals are nearly similar to those of the Erdaokan Ag-Pb-Zn deposit [43], Bianjiadayuan Au-Zn-Pb deposit [104], Sandaowanzi Au deposit [105], and Yonxin Au deposit [64], where the mineralization fluids were likely derived from deep sources (Figure 15).
Lead (Pb) isotopes of sulfides are considered to be an additional geochemical indicator to constrain the source of metals in ore deposits, for example, [106,107]. The Pb isotopes of sulfide minerals from the study area have a homogeneous composition (Table 5). In the lead isotope evolution diagram of Zartman and Doe [51] (Figure 16, all of the analyzed samples are plotted intensively in the field above the average upper crustal Pb evolution line. These data indicate that Cu-Pb polymetallic mineralization in the Kargah deposit contains crustal-derived materials. Existing Pb isotope data for Kohistan Batholith (granitoid) [108] (Figure 2b), partially overlap with those of sulfide minerals derived from the Kargah Cu-Pb polymetallic deposits, with similar trend lines (Figure 16), suggesting that the Kohistan Batholith may have provided metals for mineralization.

6.5. Precipitation Mechanism for Ore Minerals

Sulfide precipitation in hydrothermal deposits depends on many factors such as temperature and pressure, phase separation (fluid immiscibility), acidity (pH), mixing of meteoric water, salinity, fugacity of oxygen and sulfur, and fluid-rock interactions [75,110,111]. The boiling process is considered to be one of the most important mechanisms of ore precipitation [49,112,113]. The physicochemical system balance of the ore-forming fluids is mainly disrupted by rapid pressure changes, causing fluid boiling and volatile escape substances from the fluid system. As a result, the salinity, pH, and other features of the solution are significantly transformed [70,80,114,115], leading to precipitation and enrichment of ore-forming materials such as native silver and sulfide minerals [116,117]. Consequently, ore minerals are precipitated and distributed mostly along the fractures and fissures of the rock to form vein-type mineralization. The evidence of a direct link between boiling and Cu-Pb polymetallic mineralization exists in most veins, showing the highest copper and lead grades, caused by fluid boiling [70].
In this study, the temperature range of ore stage I mineral (i.e., chalcopyrite) precipitation was probably between 300 and 438 °C, while in ore stage II (galena, zincian tetrahedrite, and native silver) were from 280 to 390 °C, respectively (Figure 8). Fluid cooling has an important role in the precipitation of many hydrothermal deposits. However, the temperature range from the pre-ore to the post-ore stage is very broad (from 155 to 555 °C), indicating that the cooling is possibly not a major factor in the precipitation of ore-forming minerals. In many magmatic-hydrothermal deposits, fluid mixing is an important influencing factor for mineralization [70,118,119]. As aforementioned in Section 6.2, a potential fluid mixing process was inferred at the sulfide ore stage II. Thus, the important causes for ore mineral precipitation and deposition for the Kargah Cu-Pb polymetallic deposit are fluid boiling, cooling phase separation, and mixing with meteoric waters.

6.6. Deposit Genesis

The temperature of early-stage fluid inclusions is used to evaluate the genesis and nature of the ore-forming fluids [120,121]. The early-stage is mainly comprised of type II and type IV inclusions that show high homogenization temperatures (from 434 to 555 °C and from 442 to 495 °C, respectively) and low to moderate salinities (wt.% NaCl) (3.06–12.05 and 3.39–12.05, respectively), which support early-stage magmatic fluids [98,103,122]. In addition, on the homogenization temperature and salinity diagram [79], our data mainly plot in the field of magmatic-hydrothermal mineralization (Figure 13). Typically, the formation of porphyry deposits occurs at high temperature (from 300 to 700 °C), while epithermal deposits exhibit temperatures below 300 °C. In contrast, vein-type magmatic-hydrothermal deposits show a wide range of temperatures [123,124,125]. Our microthermometry data show a wide range of temperatures from 115 to 555 °C (Table 4 and Figure 8), indicating magmatic-hydrothermal vein-type mineralization.
Our study shows the presence of less abundant CO2-bearing and solid-bearing inclusions, high to an intermediate temperature, with moderate to low salinity (Figure 8 and Table 4), and evidence of fluid boiling and mixing of meteoric water. These characteristics are commonly used as a genetic marker of intrusion-related hydrothermal deposits [67,75,121,126]. The wall-rock alteration is comprised of silicification, sericitization, chloritization, and minor carbonatization. These alteration types also show magmatic-hydrothermal features [75].
A magmatic-hydrothermal source for ore-forming fluids indicates high Co/Ni ratios in pyrites, for example, [55,57,90,92]. Typically, Co/Ni ratios > 1 represent the hydrothermal origin (see Figure 14c, [95,127]). The pyrites, in this study, are characterized by high Co/Ni ratios between 1.60 and 16.4 (average 5.41), suggesting that magmatic-hydrothermal fluids were probably involved in the formation of ore-forming fluids. In addition, the relative contents of Co, Ni, As, and Au were used to characterize the ore-forming fluids, for example, [45,63,93,118]. In the Kargah Cu-Pb polymetallic deposit, the relative concentrations of Co, Ni, As, and Au in pyrites exhibit their precipitation from magmatic-hydrothermal fluids (Figure 14a,b,d).
Furthermore, the δ34S values (from -2.80 to 6.41‰, average 3.38‰), in this study, are markedly similar to the majority of magmatic-hydrothermal deposits such as the Jinchang Gold-Copper deposit (from 1.1 to 8.8‰, average 3.5‰) [100], the Yongxin gold deposit (from 3.5 to 5.4‰, average 4.48‰) [44], and Baoshan, Shuikoushan, and Kangjiawan Pb-Zn deposits (from −2.7 to 6.46‰) [109,128], probably showing the magmatic-hydrothermal origin for ore-forming fluid [44,100,109,128].

7. Conclusions

  • Three main stages of mineralization were identified, including the pre-ore (quartz-pyrite), main sulfide ore, and post-ore (quartz-carbonate) stages. Pyrite, chalcopyrite, galena, and zincian tetrahedrite are major sulfides, with accessory mineral native silver and gold mainly distributed in pyrite.
  • High Co/Ni ratios, low Mo/Ni ratios, and low Ni and Mo contents in pyrites suggest a mafic source for mineralization.
  • Five types of fluid inclusions were identified. At the pre-ore stage, the fluid was observed to show critical behaviors at temperatures between 434 and 555 °C. Chalcopyrite/magnetite ± bornite were primarily precipitated at temperatures ranging from 300 to 438 °C (>45 Mpa and depth > 2 km); galena/zincian tetrahedrite + native silver were deposited at temperatures ranging from 280 to 390 °C (<20 Mpa and depth < 2 km).
  • The sulfur and lead isotope data of sulfide minerals (pyrite, chalcopyrite, and galena) suggest that the ore-forming fluid of the Kargah Cu-Pb polymetallic deposit was mainly derived from a deep magma source, accompanied by crustal-derived materials, and the Kohistan Batholith provided metals for mineralization.
  • The ore-forming fluids contained both magmatic and meteoric waters. High to moderate temperatures with contrasting salinities, solid-bearing inclusions, less abundant CO2 components, and a range of δ34S values, in this study, (from −2.80 to 6.41‰, average 3.38‰) probably suggest an intrusion-related magmatic-hydrothermal deposit for the studied area.

Author Contributions

Conceptualization: Z.H.; methodology: S.L. and M.A.; software: M.F. and A.H.; validation: H.Z.; formal analysis, Z.H.; investigation: C.T.; resources: C.T. and C.-F.L.; data curation: Z.H.; writing—original draft preparation: Z.H.; writing—review and editing: S.L., H.Z. and C.-F.L.; visualization, Z.H.; supervision: C.T. and C.-F.L.; project administration: C.T.; funding acquisition: C.T. and C.-F.L. All authors have read and agreed to the published version of the manuscript.

Funding

This study was supported by the National Natural Science Foundation of China (grant nos. 41776057 and 91858213), the National Key Research and Development Program of China (2018YFC0309901), and the China Ocean Mineral Resources R & D Association Project (DY135-S1-1-01).

Acknowledgments

We are grateful for the constructive comments and suggestions from Chief Editor and two other anonymous reviewers.

Conflicts of Interest

The authors declare no conflict of interest.

References

  1. Tahirkheli, R.K. Geology of Kohistan and adjoining Eurasian and Indo-Pakistan continents, Pakistan. Geol. Bull. Univ. Peshawar 1979, 11, 1–30. [Google Scholar]
  2. Ziabrev, S.V.; Aitchison, J.C.; Abrajevitch, A.V.; Davis, A.M.; Luo, H. Bainang Terrane, Yarlung–Tsangpo suture, southern Tibet (Xizang, China): A record of intra-Neotethyan subduction–accretion processes preserved on the roof of the world. J. Geol. Soc. 2004, 161, 523–539. [Google Scholar] [CrossRef] [Green Version]
  3. Chatterjee, S.; Goswami, A.; Scotese, C.R. The longest voyage: Tectonic, magmatic, and paleoclimatic evolution of the Indian plate during its northward flight from Gondwana to Asia. Gondwana Res. 2013, 23, 238–267. [Google Scholar] [CrossRef]
  4. Jan, M.Q.; Howie, R. The mineralogy and geochemistry of the metamorphosed basic and ultrabasic rocks of the Jijal complex, Kohistan, NW Pakistan. J. Petrol. 1981, 22, 85–126. [Google Scholar] [CrossRef]
  5. Calkins, J.A.; Jamiluddin, S.; Bhuyan, K.; Hussain, A. Geology and Mineral Resources of the Chitral-Partsan Area, Hindu Kush Range, Northern Pakistan; US Govt. Print. Off: Washington, DC, USA, 1980.
  6. Hussain, A.; Inayat, U.; Mughal, M.S.; Hussain, S.A.; Arif, M. Comment on: “Platinum-group element geochemistry and geodynamic evolution of Chilas complex gabbros, Kohistan Island Arc NE Pakistan”. Lithos 2021, 106031. [Google Scholar] [CrossRef]
  7. Rehman, H.U.; Seno, T.; Yamamoto, H.; Khan, T. Timing of collision of the Kohistan–Ladakh Arc with India and Asia: Debate. Isl. Arc 2011, 20, 308–328. [Google Scholar] [CrossRef]
  8. Halfpenny, R.; Mazzucchelli, R.H. Regional multi-element drainage geochemistry in the Himalayan Mountains, northern Pakistan. J. Geochem. Explor. 1999, 67, 223–233. [Google Scholar] [CrossRef]
  9. Alam, M.; Li, S.-R.; Santosh, M.; Shah, A.; Yuan, M.-W.; Khan, H.; Qureshi, J.A.; Zeng, Y.-J. Morphological, thermoelectrical, geochemical and isotopic anatomy of auriferous pyrite from the Bagrote valley placer deposits, North Pakistan: Implications for ore genesis and gold exploration. Ore Geol. Rev. 2019, 112, 103008. [Google Scholar] [CrossRef]
  10. Austromineral. Final Report (feasibility Study), Indus Gold Project Submitted to Pakistan Mineral Development Corporation by Austromineral Vienna; Austromineral: Vienna, Austria, 1976. [Google Scholar]
  11. PMDC. Final Report on Geochemical Exploration and Evaluation of Gold and Base Metals, Northern Area, Pakistan; Pakistan Mineral Development Corporation: Islamabad, Pakistan, 2001; (Unpublished Results). [Google Scholar]
  12. Kausar, A.B. Petrology of the Kohistan Arc and hosted hydrothermal sulfides, Gilgit Area, Pakistan. Master’s Thesis, The Oregon State University, Corvallis, OR, USA, 28 May 1991. [Google Scholar]
  13. Shah, M.T.; Khan, S.D.; Ahmad, L. Investigation of gold and base metals mineralization and the petrochemical studies of the associated host rocks, Shagari Bala area, Skardu Gilgit-Baltistan, Pakistan. J. Himal. Earth Sci. 2015, 48, 26–40. [Google Scholar]
  14. Ahmad, L.; Khan, S.D.; Shah, M.T.; Jehan, N. Gold mineralization in Bubin area, Gilgit-Baltistan, Northern Areas, Pakistan. Arab. J. Geosci. 2018, 11, 1–12. [Google Scholar] [CrossRef]
  15. Hussain, A.; Zhao, K.-D.; Arif, M.; Palmer, M.R.; Chen, W.; Zhang, Q.; Li, Q.; Jiang, S.-Y.; Girei, M.B. Geochronology, mineral chemistry and genesis of REE mineralization in alkaline rocks from the Kohistan Island Arc, Pakistan. Ore Geol. Rev. 2020, 126, 103749. [Google Scholar] [CrossRef]
  16. Mahéo, G.; Pêcher, A.; Guillot, S.; Rolland, Y.; Delacourt, C. Exhumation of Neogene Gneiss Domes between Oblique Crustal Boundaries in South Karakorum (Northwest Himalaya, Pakistan); Geological Society of America: Boulder, CO, USA, 2004; pp. 141–154. [Google Scholar]
  17. Pecher, A.; Seeber, L.; Guillot, S.; Jouanne, F.; Kausar, A.; Latif, M.; Majid, A.; Mahéo, G.; Mugnier, J.-L.; Rolland, Y. Stress field evolution in the northwest Himalayan syntaxis, northern Pakistan. Tectonics 2008, 27. [Google Scholar] [CrossRef]
  18. Searle, M.P.; Khan, M.A. Geological Map of North Pakistan. Scale 1:650,000; Shell International Exploration and Production: The Hague, The Netherlands, 1996. [Google Scholar]
  19. Khan, T.; Latif, M.; Khan, N.; Shah, S. Geology and petrography of the rock outcrops in Shinghai Gah and Kiner Gah, Gilgit Chilas districts, Northern Areas. Pak. Geol. Surv. Pak. I. R 1989, 446, 16. [Google Scholar]
  20. Khan, T.; Asif Khan, M.; Qasim Jan, M.; Naseem, M. Back-arc basin assemblages in Kohistan, Northern Pakistan. Geodin. Acta 1996, 9, 30–40. [Google Scholar] [CrossRef]
  21. Khan, T.; Jan, M.Q.; Khan, M.A.; Kausar, A.B. High-grade metasedimentary rocks (Gilgit Formation) in the vicinity of Gilgit, Kohistan, northern Pakistan. J. Mineral. Petrol. Geol. 1997, 92, 465–479. [Google Scholar] [CrossRef]
  22. Khan, T.; Latif, M.; Fayaz, A.; Shah, S.H. Geology of the Kar Gah Quadrangle, District Gilgit, Northern area Pakistan, by Geological Survey of Pakistan. Inf. Release Geol. Surv. Pak. 1999, 675, 1–9. [Google Scholar]
  23. Fraser, J.E.; Searle, M.P.; Parrish, R.R.; Noble, S.R. Chronology of deformation, metamorphism, and magmatism in the southern Karakoram Mountains. Geol. Soc. Am. Bull. 2001, 113, 1443–1455. [Google Scholar] [CrossRef]
  24. Zanchi, A.; Gaetani, M. The geology of the Karakoram range, Pakistan: The new 1: 100,000 geological map of Central-Western Karakoram. Ital. J. Geosci. 2011, 130, 161–262. [Google Scholar]
  25. Searle, M.P.; Robb, L.J.; Gardiner, N.J. Tectonic Processes and Metallogeny along the Tethyan Mountain Ranges of the Middle East and South Asia (Oman, Himalaya, Karakoram, Tibet, Myanmar, Thailand, Malaysia). Spec. Publ. 2016, 19, 301–32721. [Google Scholar]
  26. Hussain, A.; Shah, M.T.; Arif, M.; Agheem, M.H.; Mughal, M.S.; Ullah, S.; Hussain, S.A.; Sadiq, I. Chemical composition of gemstones and characterization of their host pegmatites and country rocks from Chumar Bakhoor, Gilgit-Baltistan, Pakistan: Implications for the source of gem-forming fluids. Arab. J. Geosci. 2021, 14, 1–15. [Google Scholar] [CrossRef]
  27. Pudsey, C.J. The Northern Suture, Pakistan: Margin of a Cretaceous island arc. Geol. Mag. 1986, 123, 405–423. [Google Scholar] [CrossRef]
  28. Petterson, M.G. A review of the geology and tectonics of the Kohistan island arc, north Pakistan. Geol. Soc. Lond. Spec. Publ. 2010, 338, 287–327. [Google Scholar] [CrossRef]
  29. Shah, S.Z.; Sayab, M.; Aerden, D.; Khan, M.A.J.T. Foliation intersection axes preserved in garnet porphyroblasts from the Swat area, NW Himalaya: A record of successive crustal shortening directions between the Indian plate and Kohistan–Ladakh Island Arc. Tectonophys 2011, 509, 14–32. [Google Scholar] [CrossRef]
  30. Jagoutz, O.; Schmidt, M.W. The formation and bulk composition of modern juvenile continental crust: The Kohistan arc. Chem. Geol. 2012, 298, 79–96. [Google Scholar] [CrossRef]
  31. Rowley, D.B. Age of initiation of collision between India and Asia: A review of stratigraphic data. Earth Planet. Sci. Lett. 1996, 145, 1–13. [Google Scholar] [CrossRef]
  32. Anczkiewicz, R.; Burg, J.-P.; Hussain, S.; Dawood, H.; Ghazanfar, M.; Chaudhry, M. Stratigraphy and structure of the Indus Suture in the lower Swat, Pakistan, NW Himalaya. J. Asian Earth Sci. 1998, 16, 225–238. [Google Scholar] [CrossRef]
  33. Treloar, P.; Rex, D. Cooling, uplift and exhumation rates in the crystalline thrust stack of the North Indian Plate, west of the Nanga Parbat syntaxis. Tectonophys 1990, 180, 323–349. [Google Scholar] [CrossRef]
  34. Kazmi, A.H.; Jan, M.Q. Geology and Tectonics of Pakistan; Graphic Publishers: Karachi, Pakistan, 1997; p. 554. [Google Scholar]
  35. Petterson, M.G.; Windley, B.F. RbSr dating of the Kohistan arc-batholith in the Trans-Himalaya of north Pakistan, and tectonic implications. Earth Planet. Sci. Lett. 1985, 74, 45–57. [Google Scholar] [CrossRef]
  36. Bodnar, R. Revised equation and table for determining the freezing point depression of H2O-NaCl solutions. Geochim. Et Cosmochim. Acta. 1993, 57, 683–684. [Google Scholar] [CrossRef]
  37. Collins, P.L. Gas hydrates in CO2-bearing fluid inclusions and the use of freezing data for estimation of salinity. Econ. Geol. 1979, 74, 1435–1444. [Google Scholar] [CrossRef]
  38. Bodnar, R.J. Introduction to aqueous-electrolyte fluid inclusions. Fluid Incl. Anal. Interpret. 2003, 32, 81–100. [Google Scholar]
  39. Sterner, S.M.; Hall, D.L.; Bodnar, R.J. Synthetic fluid inclusions. V. Solubility relations in the system NaCl-KCl-H2O under vapor-saturated conditions. Geochim. Et Cosmochim. Acta 1988, 52, 989–1005. [Google Scholar] [CrossRef]
  40. Bodnar, R.J. A method of calculating fluid inclusion volumes based on vapor bubble diameters and PVTX properties of inclusion fluids. Econ. Geol. 1983, 78, 535–542. [Google Scholar] [CrossRef]
  41. Rajabzadeh, M.A.; Rasti, S. Investigation on mineralogy, geochemistry and fluid inclusions of the Goushti hydrothermal magnetite deposit, Fars Province, SW Iran: A comparison with IOCGs. Ore Geol. Rev. 2017, 82, 93–107. [Google Scholar] [CrossRef]
  42. Giesemann, A.; Jäger, H.-J.; Norman, A.; Krouse, H.; Brand, W. Online sulfur-isotope determination using an elemental analyzer coupled to a mass spectrometer. Anal. Chem. 1994, 66, 2816–2819. [Google Scholar] [CrossRef]
  43. Yuan, M.-W.; Li, L.; Li, S.-R.; Li, C.-L.; Santosh, M.; Alam, M.; Bao, X.-B. Mineralogy, fluid inclusions and S-Pb-HO isotopes of the Erdaokan Ag-Pb-Zn deposit, Duobaoshan metallogenic belt, NE China: Implications for ore genesis. Ore Geol. Rev. 2019, 113, 103074. [Google Scholar] [CrossRef]
  44. Yuan, M.-W.; Li, S.-R.; Li, C.-L.; Santosh, M.; Alam, M.; Zeng, Y.-J. Geochemical and isotopic composition of auriferous pyrite from the Yongxin gold deposit, Central Asian Orogenic Belt: Implication for ore genesis. Ore Geol. Rev. 2018, 93, 255–267. [Google Scholar] [CrossRef]
  45. Farhan, M.; Arif, M.; Ying, Y.; Chen, X.; Garbe-Schönberg, D.; Li, C.-F.; Hussain, Z.; Ullah, Z.; Zhang, P.; Khan, A. Fluid source, element mobility and physicochemical conditions of porphyry-style hydrothermal alteration-mineralization at Mirkhani, southern Chitral, Pakistan. Ore Geol. Rev. 2021, 104222. [Google Scholar] [CrossRef]
  46. Doyle, F.; Mirza, A.H. Electrochemical oxidation of pyrite samples with known composition and electrical properties. Electrochem. Proc. 1996, 96, 203–214. [Google Scholar]
  47. Roedder, E. Fluid Inclusions. In Reviews in Mineralogy; Mineralogical Society of America: Chantilly, VA, USA, 1984; Volume 12, 646p. [Google Scholar]
  48. Roedder, E.; Bodnar, R.J. Fluid Inclusion Studies of Hydrothermal Ore Deposits; John Willey & Sons: New York, NY, USA, 1997. [Google Scholar]
  49. Cai, Y.-T.; Ni, P.; Wang, G.-G.; Pan, J.-Y.; Zhu, X.-T.; Chen, H.; Ding, J.-Y. Fluid inclusion and H–O–S–Pb isotopic evidence for the Dongxiang Manto-type copper deposit, South China. J. Geochem. Explor. 2016, 171, 71–82. [Google Scholar] [CrossRef]
  50. Ma, Y.; Jiang, S.-Y.; Chen, R.-S.; Li, X.-X.; Zhu, L.; Xiong, S.-F. Hydrothermal evolution and ore genesis of the Zhaiping Ag-Pb-Zn deposit in Fujian Province of Southeast China: Evidence from stable isotopes (H, O, C, S) and fluid inclusions. Ore Geol. Rev. 2019, 104, 246–265. [Google Scholar] [CrossRef]
  51. Zartman, R.; Doe, B. Plumbotectonics—The model. Tectonophys 1981, 75, 135–162. [Google Scholar] [CrossRef]
  52. Barker, S.L.; Hickey, K.A.; Cline, J.S.; Dipple, G.M.; Kilburn, M.R.; Vaughan, J.R.; Longo, A. Uncloaking invisible gold: Use of nanoSIMS to evaluate gold, trace elements, and sulfur isotopes in pyrite from Carlin-type gold deposits. Econ. Geol. 2009, 104, 897–904. [Google Scholar] [CrossRef]
  53. Deditius, A.P.; Utsunomiya, S.; Ewing, R.C.; Chryssoulis, S.L.; Venter, D.; Kesler, S.E. Decoupled geochemical behavior of As and Cu in hydrothermal systems. Geology 2009, 37, 707–710. [Google Scholar] [CrossRef]
  54. Agangi, A.; Hofmann, A.; Wohlgemuth-Ueberwasser, C.C. Pyrite zoning as a record of mineralization in the Ventersdorp Contact Reef, Witwatersrand Basin, South Africa. Econ. Geol. 2013, 108, 1243–1272. [Google Scholar] [CrossRef]
  55. Reich, M.; Deditius, A.; Chryssoulis, S.; Li, J.-W.; Ma, C.-Q.; Parada, M.A.; Barra, F.; Mittermayr, F. Pyrite as a record of hydrothermal fluid evolution in a porphyry copper system: A SIMS/EMPA trace element study. Geochim. Cosmochim. Acta 2013, 104, 42–62. [Google Scholar] [CrossRef]
  56. Ingham, E.S.; Cook, N.J.; Cliff, J.; Ciobanu, C.L.; Huddleston, A. A combined chemical, isotopic and microstructural study of pyrite from roll-front uranium deposits, Lake Eyre Basin, South Australia. Geochim. Cosmochim. Acta 2014, 125, 440–465. [Google Scholar] [CrossRef]
  57. Zhang, J.; Deng, J.; Chen, H.-Y.; Yang, L.-Q.; Cooke, D.; Danyushevsky, L.; Gong, Q.-J. LA-ICP-MS trace element analysis of pyrite from the Chang’an gold deposit, Sanjiang region, China: Implication for ore-forming process. Gondwana Res. 2014, 26, 557–575. [Google Scholar] [CrossRef]
  58. Thomas, H.V.; Large, R.R.; Bull, S.W.; Maslennikov, V.; Berry, R.F.; Fraser, R.; Froud, S.; Moye, R. Pyrite and pyrrhotite textures and composition in sediments, laminated quartz veins, and reefs at Bendigo gold mine, Australia: Insights for ore genesis. Econ. Geol. 2011, 106, 1–31. [Google Scholar] [CrossRef]
  59. Ciobanu, C.L.; Cook, N.J.; Utsunomiya, S.; Kogagwa, M.; Green, L.; Gilbert, S.; Wade, B. Gold-telluride nanoparticles revealed in arsenic-free pyrite. Am. Mineral. 2012, 97, 1515–1518. [Google Scholar] [CrossRef]
  60. Chouinard, A.; Paquette, J.; Williams-Jones, A.E. Crystallographic controls on trace-element incorporation in auriferous pyrite from the Pascua epithermal high-sulfidation deposit, Chile–Argentina. Miner. Depos. 2005, 43, 951–963. [Google Scholar] [CrossRef] [Green Version]
  61. Deditius, A.P.; Utsunomiya, S.; Renock, D.; Ewing, R.C.; Ramana, C.V.; Becker, U.; Kesler, S.E. A proposed new type of arsenian pyrite: Composition, nanostructure and geological significance. Geochim. Et Cosmochim. Acta. 2008, 72, 2919–2933. [Google Scholar] [CrossRef]
  62. Tardani, D.; Reich, M.; Deditius, A.P.; Chryssoulis, S.; Sánchez-Alfaro, P.; Wrage, J.; Roberts, M.P. Copper–arsenic decoupling in an active geothermal system: A link between pyrite and fluid composition. Geochim. Et Cosmochim. Acta. 2017, 204, 179–204. [Google Scholar] [CrossRef]
  63. Reich, M.; Kesler, S.; Utsunomiya, S. Solubility of Gold in Arsenian Pyrite. Geochim. Et Cosmochim. Acta. 2005, 69, 2781–2796. [Google Scholar] [CrossRef]
  64. Sack, R.O.; Loucks, R.R. Thermodynamic properties of tetrahedrite-tennantite: Constraints on the interdependence of the Ag⇌ Cu, Fe⇌ Zn, Cu⇌ Fe, and As⇌ Sb exchange reactions. Am. Mineral. 1985, 70, 1270–1289. [Google Scholar]
  65. Franchini, M.; McFarlane, C.; Maydagán, L.; Reich, M.; Lentz, D.R.; Meinert, L.; Bouhier, V. Trace metals in pyrite and marcasite from the Agua Rica porphyry-high sulfidation epithermal deposit, Catamarca, Argentina: Textural features and metal zoning at the porphyry to epithermal transition. Ore Geol. Rev. 2015, 66, 366–387. [Google Scholar] [CrossRef]
  66. Grant, H.L.; Hannington, M.D.; Petersen, S.; Frische, M.; Fuchs, S.H. Constraints on the behavior of trace elements in the actively-forming TAG deposit, Mid-Atlantic Ridge, based on LA-ICP-MS analyses of pyrite. Chem. Geol. 2018, 498, 45–71. [Google Scholar] [CrossRef]
  67. Mehrabi, B.; Fazel, E.T.; Yardley, B. Ore geology, fluid inclusions and OS stable isotope characteristics of Shurab Sb-polymetallic vein deposit, eastern Iran. Geochemistry 2019, 79, 307–322. [Google Scholar] [CrossRef]
  68. Zhou, X.W.; Li, S.R.; Lu, L.; Li, J.J.; Wang, J. Study of Pyrite Typomorphic Characteristics of Wulong Quartz-Vein-Type Gold Deposit in Dandong, Liaoning Province, China. Geoscience 2005, 19, 231. [Google Scholar]
  69. Cline, J.S.; Bodnar, R.J. Direct evolution of brine from a crystallizing silicic melt at the Questa, New Mexico, molybdenum deposit. Econ. Geol. 1994, 89, 1780–1802. [Google Scholar] [CrossRef]
  70. Liao, S.; Chen, S.; Deng, X.; Li, P.; Zhao, J.; Liao, R. Fluid inclusion characteristics and geological significance of the Xi’ao copper–tin polymetallic deposit in Gejiu, Yunnan Province. J. Asian Earth Sci. 2014, 79, 455–467. [Google Scholar] [CrossRef]
  71. Roedder, E. Fluid inclusions as samples of ore fluids. Geochemistry of Hydrothermal Ore Deposit, 2nd ed.; Wiley: New York, NY, USA, 1979; pp. 684–737. [Google Scholar]
  72. Mei, W.; Lü, X.; Cao, X.; Liu, Z.; Zhao, Y.; Ai, Z.; Tang, R.; Abfaua, M.M. Ore genesis and hydrothermal evolution of the Huanggang skarn iron–tin polymetallic deposit, southern Great Xing’an Range: Evidence from fluid inclusions and isotope analyses. Ore Geol. Rev. 2015, 64, 239–252. [Google Scholar] [CrossRef]
  73. Ramboz, C.; Pichavant, M.; Weisbrod, A. Fluid immiscibility in natural processes: Use and misuse of fluid inclusion data: II. Interpretation of fluid inclusion data in terms of immiscibility. Chem. Geol. 1982, 37, 29–48. [Google Scholar] [CrossRef]
  74. Hayba, B. Geologic, mineralogic and geochemical characteristics of volcanic hosted epithermal precious metal deposits. In Geology and geochemistry of epithermal systems. Rev. Econ. Geol. 1985, 2, 129–167. [Google Scholar]
  75. Liu, L.; Gu, X.-X.; Zhang, Y.-M.; Ouyang, X.; Wang, L.-Z.; Gao, L.-Y. Genesis of the Jinchanggouliang gold deposit, Chifeng, China: Constraints from fluid inclusions and isotopic geochemistry. Ore Geol. Rev. 2019, 115, 103180. [Google Scholar] [CrossRef]
  76. Shepherd, T.; Rankin, A.; Alderton, D. A Practical Guide to Fluid Inclusion Studies; Blackie Academic & Professional: Glasgow, UK, 1985; p. 239. [Google Scholar]
  77. Driesner, T.; Heinrich, C.A. The system H2O–NaCl. Part I: Correlation formulae for phase relations in temperature–pressure–composition space from 0 to 1000 C, 0 to 5000 bar, and 0 to 1 XNaCl. Geochim. Et Cosmochim. Acta. 2007, 71, 4880–4901. [Google Scholar] [CrossRef]
  78. Henley, R.; McNabb, A. Magmatic vapor plumes and ground-water interaction in porphyry copper emplacement. Econ. Geol. 1978, 73, 1–20. [Google Scholar] [CrossRef]
  79. Wilkinson, J. Fluid inclusions in hydrothermal ore deposits. Lithos 2001, 55, 229–272. [Google Scholar] [CrossRef]
  80. Meinert, L.; Hedenquist, J.; Satoh, H.; Matsuhisa, Y. Formation of anhydrous and hydrous skarn in Cu-Au ore deposits by magmatic fluids. Econ. Geol. 2003, 98, 147–156. [Google Scholar] [CrossRef]
  81. Kontak, D.J.; Clark, A.H. Genesis of the giant, bonanza San Rafael lode tin deposit, Peru: Origin and significance of pervasive alteration. Econ. Geol. 2002, 97, 1741–1777. [Google Scholar] [CrossRef]
  82. Palme, H.; O’Neill, H.S.C. Cosmochemical estimates of mantle composition. Treatise Geochem. 2003, 2, 568. [Google Scholar]
  83. Rudnick, R.; Gao, S.; Holland, H.; Turekian, K.J. Composition of the continental crust. Crust 2003, 3, 1–64. [Google Scholar]
  84. Koglin, N.; Frimmel, H.E.; Minter, W.L.; Brätz, H. Trace-element characteristics of different pyrite types in Mesoarchaean to Palaeoproterozoic placer deposits. Mineral. Depos. 2010, 45, 259–280. [Google Scholar] [CrossRef]
  85. Niu, S.-D.; Li, S.-R.; Santosh, M.; Zhang, D.-H.; Li, Z.-D.; Shan, M.-J.; Lan, Y.-X.; Gao, D.-R.; Zhao, W.-B. Mineralogical and isotopic studies of base metal sulfides from the Jiawula Ag–Pb–Zn deposit, Inner Mongolia, NE China. J. Asian Earth Sci. 2016, 115, 480–491. [Google Scholar] [CrossRef]
  86. Li, S.-R.; Santosh, M.; Zhang, H.-F.; Luo, J.-Y.; Zhang, J.-Q.; Li, C.-L.; Song, J.-Y.; Zhang, X.-B. Metallogeny in response to lithospheric thinning and craton destruction: Geochemistry and U–Pb zircon chronology of the Yixingzhai gold deposit, central North China Craton. Ore Geol. Rev. 2014, 56, 457–471. [Google Scholar] [CrossRef]
  87. Hall, D.; Sterner, S. BO~ NAR RJ Freezingpoint depression of NaCI-KCEH20 solutions. Econ. Geol 1988, 83, 197–202. [Google Scholar] [CrossRef]
  88. Liu, J.; Mao, J.-W.; Wu, G.; Wang, F.; Luo, D.-F.; Hu, Y.-Q.; Li, T.-G. Fluid inclusions and H–O–S–Pb isotope systematics of the Chalukou giant porphyry Mo deposit, Heilongjiang Province, China. Ore Geol. Rev. 2014, 59, 83–96. [Google Scholar] [CrossRef]
  89. Mei, J. Chemical typomorphic characteristic of pyrites from Zhilingtou gold deposit, Suichang, Zhejiang. Geoscience 2000, 14, 51–55. [Google Scholar]
  90. Liu, Z.; Shao, Y.; Zhou, H.; Liu, N.; Huang, K.; Liu, Q.; Zhang, J.; Wang, C. Major and trace element geochemistry of pyrite and pyrrhotite from stratiform and lamellar orebodies: Implications for the ore genesis of the Dongguashan copper (gold) deposit, eastern China. Minerals 2018, 8, 380. [Google Scholar] [CrossRef] [Green Version]
  91. Román, N.; Reich, M.; Leisen, M.; Morata, D.; Barra, F.; Deditius, A.P. Geochemical and micro-textural fingerprints of boiling in pyrite. Geochim. Et Cosmochim. Acta 2019, 246, 60–85. [Google Scholar] [CrossRef]
  92. Liu, Z.; Mao, X.; Deng, H.; Li, B.; Zhang, S.; Lai, J.; Bayless, R.C.; Pan, M.; Li, L.; Shang, Q. Hydrothermal processes at the Axi epithermal Au deposit, western Tianshan: Insights from geochemical effects of alteration, mineralization and trace elements in pyrite. Ore Geol. Rev. 2018, 102, 368–385. [Google Scholar]
  93. Brill, B.A. Trace-element contents and partitioning of elements in ore minerals from the CSA Cu-Pb-Zn deposit, Australia, and implications for ore genesis. Can. Mineral. 1989, 27, 263–274. [Google Scholar]
  94. Yan, Y.; Li, S.; Jia, B.; Zhang, N.; Yan, L. Composition typomorphic characteristics and statistic analysis of pyrite in gold deposits of different genetic types. Earth Sci. Front. 2012, 19, 214–226. [Google Scholar]
  95. Large, R.R.; Danyushevsky, L.; Hollit, C.; Maslennikov, V.; Meffre, S.; Gilbert, S.; Bull, S.; Scott, R.; Emsbo, P.; Thomas, H. Gold and trace element zonation in pyrite using a laser imaging technique: Implications for the timing of gold in orogenic and Carlin-style sediment-hosted deposits. Econ. Geol. 2009, 104, 635–692. [Google Scholar]
  96. Bajwah, Z.; Seccombe, P.; Offler, R. Trace element distribution, Co: Ni ratios and genesis of the Big Cadia iron-copper deposit, New South Wales, Australia. Mineral. Depos. 1987, 22, 292–300. [Google Scholar] [CrossRef]
  97. Hoefs, J. Stable Isotope Geochemistry; Springer: Belin, German, 2009; Volume 285. [Google Scholar]
  98. Ohmoto, H.; Rye, R.O. Isotopes of sulfur and carbon. In Geochemistry of Hydrothermal Ore Deposits, 2nd ed.; Holt Rinehart and Winston: New York, NY, USA, 1979; pp. 509–567. [Google Scholar]
  99. Ohmoto, H.; Goldhaber, M.B. Sulfur and carbon isotopes. In Geochemistry of Hydrothermal Ore Deposit, 3rd ed.; Wilay: New York, NY, USA, 1997; pp. 517–611. [Google Scholar]
  100. Li, S.; Zhang, X.; Gao, L. Ore Genesis at the Jinchang Gold–Copper Deposit in Heilongjiang Province, Northeastern China: Evidence from Geology, Fluid Inclusions, and H–O–S Isotopes. Minerals 2019, 9, 99. [Google Scholar] [CrossRef] [Green Version]
  101. Li, L.; Li, S.-R.; Santosh, M.; Zhu, J.; Suo, X.-J. Early Jurassic decratonic gold metallogenesis in the eastern North China Craton: Constraints from S-Pb-CDO isotopic systematics and pyrite Rb-Sr geochronology of the Guilaizhuang Te-Au deposit. Ore Geol. Rev. 2018, 92, 558–568. [Google Scholar] [CrossRef]
  102. Duuring, P.; Rowins, S.M.; McKinley, B.S.; Dickinson, J.M.; Diakow, L.J.; Kim, Y.-S.; Creaser, R.A. Examining potential genetic links between Jurassic porphyry Cu–Au ± Mo and epithermal Au ± Ag mineralization in the Toodoggone district of north-central British Columbia, Canada. Mineral. Depos. 2009, 44, 463–496. [Google Scholar] [CrossRef]
  103. Seal, R.R. Sulfur isotope geochemistry of sulfide minerals. Rev. Mineral. Geochem. 2006, 61, 633–677. [Google Scholar] [CrossRef]
  104. Zhai, D.; Liu, J.; Cook, N.J.; Wang, X.; Yang, Y.; Zhang, A.; Jiao, Y. Mineralogical, textural, sulfur and lead isotope constraints on the origin of Ag-Pb-Zn mineralization at Bianjiadayuan, Inner Mongolia, NE China. Mineral. Depos. 2019, 54, 47–66. [Google Scholar] [CrossRef]
  105. Zhai, D.; Williams-Jones, A.E.; Liu, J.; Tombros, S.F.; Cook, N.J. Mineralogical, fluid inclusion, and multiple isotope (HOS-Pb) constraints on the genesis of the sandaowanzi epithermal Au-Ag-Te deposit, NE China. Econ. Geol. 2018, 113, 1359–1382. [Google Scholar] [CrossRef] [Green Version]
  106. Bozkaya, G. Sulphur-and lead-isotope geochemistry of the Arapuçandere lead–zinc–copper deposit, Biga Peninsula, northwest Turkey. Int. Geol. Rev. 2011, 53, 116–129. [Google Scholar] [CrossRef]
  107. Goldfarb, R.J.; Ayuso, R.; Miller, M.L.; Ebert, S.W.; Marsh, E.E.; Petsel, S.A.; Miller, L.D.; Bradley, D.; Johnson, C.; McClelland, W. The late cretaceous Donlin Creek gold deposit, Southwestern Alaska: Controls on epizonal ore formation. Econ. Geol. 2004, 99, 643–671. [Google Scholar] [CrossRef]
  108. Jagoutz, O.; Bouilhol, P.; Schaltegger, U.; Müntener, O. The isotopic evolution of the Kohistan Ladakh arc from subduction initiation to continent arc collision. Geol. Soc. Lond. Spec. Publ. 2019, 483, 165–182. [Google Scholar] [CrossRef]
  109. Zuo, C.H. Study of the Kangjiawan Lead–Zinc Deposit Genesis and Relationship with Surrounding Magmatism in Changning City; Nanjing University: Nanjing, China, 2015. [Google Scholar]
  110. Chi, G.; Lai, J. Roles of fluid inclusions in study of mineral deposits. Miner. Depos. 2009, 6. Available online: https://en.cnki.com.cn/Article_en/CJFDTotal-KCDZ200906012.htm (accessed on 7 November 2021).
  111. Fontboté, L.; Kouzmanov, K.; Chiaradia, M.; Pokrovski, G.S. Sulfide minerals in hydrothermal deposits. Elements 2017, 13, 97–103. [Google Scholar] [CrossRef]
  112. Sillitoe, R.H. Porphyry copper systems. Econ. Geol. 2010, 105, 3–41. [Google Scholar] [CrossRef] [Green Version]
  113. Heinrich, C.A.; Candela, P.A. Fluids and ore formation in the Earth’s crust. In Treatise on Geochemistry, 2nd ed.; Elsevier: Amsterdam, The Netherlands, 2014; Volume 13, pp. 1–28. [Google Scholar]
  114. Hedenquist, J.W.; Arribas, A.; Reynolds, T.J. Evolution of an intrusion-centered hydrothermal system; Far Southeast-Lepanto porphyry and epithermal Cu-Au deposits, Philippines. Econ. Geol. 1998, 93, 373–404. [Google Scholar] [CrossRef] [Green Version]
  115. Logan, M.A.V. Mineralogy and geochemistry of the Gualilán skarn deposit in the Precordillera of western Argentina. Ore Geol. Rev. 2000, 17, 113–138. [Google Scholar] [CrossRef]
  116. Heinrich, C.A. Fluid-fluid interactions in magmatic-hydrothermal ore formation. Rev. Mineral. Geochem. 2007, 65, 363–387. [Google Scholar] [CrossRef]
  117. Wagner, T.; Mlynarczyk, M.S.; Williams-Jones, A.E.; Boyce, A.J. Stable isotope constraints on ore formation at the San Rafael tin-copper deposit, Southeast Peru. Econ. Geol. 2009, 104, 223–248. [Google Scholar] [CrossRef]
  118. Audétat, A.; Günther, D.; Heinrich, C.A. Formation of a magmatic-hydrothermal ore deposit: Insights with LA-ICP-MS analysis of fluid inclusions. Science 1998, 279, 2091–2094. [Google Scholar] [CrossRef] [Green Version]
  119. Lu, H.-Z.; Liu, Y.; Wang, C.; Xu, Y.; Li, H. Mineralization and fluid inclusion study of the Shizhuyuan W-Sn-Bi-Mo-F skarn deposit, Hunan Province, China. Econ. Geol. 2003, 98, 955–974. [Google Scholar] [CrossRef]
  120. Chen, Y.J. On epizonogenism and genetic classification of hydrothermal deposits. Earth Sci. Front. 2010, 17, 27. [Google Scholar]
  121. Han, J.-S.; Yao, J.-M.; Chen, H.-Y.; Deng, X.-H.; Ding, J.-Y. Fluid inclusion and stable isotope study of the Shagou Ag–Pb–Zn deposit, Luoning, Henan province, China: Implications for the genesis of an orogenic lode Ag–Pb–Zn system. Ore Geol. Rev. 2014, 62, 199–210. [Google Scholar] [CrossRef]
  122. Sabeva, R.; Mladenova, V.; Mogessie, A. Ore petrology, hydrothermal alteration, fluid inclusions, and sulfur stable isotopes of the Milin Kamak intermediate sulfidation epithermal Au-Ag deposit in Western Srednogorie, Bulgaria. Ore Geol. Rev. 2017, 88, 400–415. [Google Scholar] [CrossRef]
  123. Foster, R.P. Gold Metallogeny and Exploration; Springer Science & Business Media: Belin, Germany, 2012. [Google Scholar]
  124. Hedenquist, J.W.; Lowenstern, J.B. The role of magmas in the formation of hydrothermal ore deposits. Nature 1994, 370, 519–527. [Google Scholar] [CrossRef]
  125. Ramsay, W.; Bierlein, F.; Arne, D.; VandenBerg, A. Turbidite-hosted gold deposits of Central Victoria, Australia: Their regional setting, mineralising styles, and some genetic constraints. Ore Geol. Rev. 1998, 13, 131–151. [Google Scholar] [CrossRef]
  126. Melfos, V.; Voudouris, P. Fluid evolution in Tertiary magmatic-hydrothermal ore systems at the Rhodope metallogenic province, NE Greece. A review. Geol. Croat. 2016, 69, 157–167. [Google Scholar] [CrossRef] [Green Version]
  127. Bralia, A.; Sabatini, G.; Troja, F. A revaluation of the Co/Ni ratio in pyrite as geochemical tool in ore genesis problems. Miner. Depos. 1979, 14, 353–374. [Google Scholar] [CrossRef]
  128. Xie, Y.; Lu, J.; Yang, P.; Ma, D.; Xu, Z.; Zhang, R.; Cai, Y.; Ding, T. S, Pb, C and O isotopic characteristics and sources of metallogenic materials of Baoshan Pb–Zn deposit, southern Hunan Province. Miner. Depos. 2015, 34, 333–351. [Google Scholar]
Figure 1. (a) Tectonic zones of northern Pakistan modified after [16] and [17]; (b) regional geological map showing the main lithological units and tectonic zones of northern Pakistan modified from Searle et al. [9,18].
Minerals 11 01266 g001
Figure 2. (a) Simplified geological map of the Kohistan terrane exposed between Gilgit and Chilas after Khan et al. [20]; (b) The local geological map of the Kargah valley was modified from Khan et al. [20] and Khan et al. [22].
Minerals 11 01266 g002
Figure 3. Photographs of representative mineralization types and textures: (a) Crustified-banding of zincian tetrahedrite-rich sulfide quartz vein cutting host rock (granitoids) along the fracture; (b) galena-rich quartz vein hosted by volcanic rock; (c) intensively altered sulfide-bearing granitoids at contact with sulfide vein; (d) massive chalcopyrite penetrating in metavolcanic rock (greenschist), covellite rim is visible around chalcopyrite; (e) copper-rich sample with the association of vuggy quartz and supergene alteration; (f) comb texture of euhedral early quartz in sulfide vein at wall rock contact; (g) corrugation structure of galena at the boundary of silicification/iron carbonatization; (h) gradational contact of quartz-carbonate and sulfide ore; (i) relict grains of chalcopyrite within massive galena. Py, pyrite; Ccp, chalcopyrite; Cv, covellite; Gal, galena; Fe, native iron; Qz, quartz.
Minerals 11 01266 g003
Figure 4. Outcrop photos and microphotographs (transmitted plane and cross-polarized light) of alteration types: (a) Silicification/iron carbonatization around the sulfide vein; (b) vuggy quartz is surrounded by sulfide (mainly pyrite) + iron hydroxide; (c) sericitization + supergene alteration at wall rock contact + within sulfide quartz vein; (d) brecciation of quartz and carbonate filled by sericite; (e) first stage of silicification enclosed the coarse-grained quartz + Py-I; (e/a) showing the high magnification microphotograph of (Figure 3e); (f) second stage of silicification cutting primary alteration mineral; (g) sericites aggregates with plagioclase pseudomorph phenocryst; (h) fine grain aggregates of sericite and quartz cutting early formed euhedral quartz and sulfide; (i) chlorite replacing prismatic hornblende, and euhedral Py-I is enclosed within alteration zone; (j) chlorite is overprinted on sulfide mineral (massive chalcopyrite) in transmitted crossed-polarized light, (j/a) showing reflected plane-polarized light of same sample; (k) epidote replacing hornblende at sulfide bearing sheared zone, and Py-I is encrusted by these alteration mineral; (l) overlapping of actinolite on the sericite aggregates. Py, pyrite; Ccp, chalcopyrite; Fe, iron; Qz, quartz; ML, malachite; Ser, sericite; Bt, biotite; Sf, sulfide ore; Plag, plagioclase; Chl, chlorite; Hbl, hornblende; Epi, epidote; Act, actinolite; Car, carbonate; VQz, vuggy quartz.
Minerals 11 01266 g004
Figure 5. Ore mineralogy of different mineralization stages (reflected plane-polarized light, transmitted plane and cross-polarized light, and back-scatt ered electron images): (a) Euhedral Py-I is usually replaced by limonite; (b) Py-II replaces chalcopyrite and magnetite in open space filling texture in quartz and alteration zone, while magnetite also replaces chalcopyrite and chalcopyrite replaced by covellite; (c) massive chalcopyrite is replaced by covellite-bearing limonite veinlets; (c/a) high magnification of red box area is marked in Figure 3c; (d) oriented bornite exsolution lamellae within massive chalcopyrite; (e) galena filling the microfractures of chalcopyrite as open space texture; (f) galena coexisting with zincian-tetrahedrite, and Fe-arsenide infill microfractures among quartz and carbonate; (g) bleb of zincian-tetrahedrite within massive galena as contemporaneous and both replacing by anglesite along the cleavage gaps and micro cracks; (h) massive zincian tetrahedrite replacing relict-grained galena and itself replaced by covellite-bearing limonite; (i) Chalcopyrite and Py-II and are replacing by massive zincian tetrahedrite as open space texture in quartz; (j) native-silver filling the fractures and microcracks within massive zincian tetrahedrite, chalcopyrite also observed as inclusion; (k) same sample of Figure 3j in back-scattered electron image; (l) rutile coexisting as inclusion in Py-II and quartz; (m) doubly terminated euhedral quartz floating in sulfide ore, while fine grain sericite and quartz aggregates filling interstices (PPL); (n) chalcopyrite is replaced by magnetite, fine grain pseudomorph of chalcopyrite is observable within magnetite; (o) contact boundary between sulfide and carbonate mineral (transmitted PPL); (p) malachite replacing chalcopyrite (supergene alteration) and itself replaced by covellite-bearing limonite (reflected PPL); (p/a) same sample of Figure 3 in transmitted PPL, showing green internal reflection of malachite. Py, pyrite; Ccp, chalcopyrite; Gal, galena; Zn, tetd (zincian-tetrahedrite); Bn, bornite; Mgt, magnetite; Cv, covellite; ML, malachite; Rut, rutile; Car, carbonate; Qz, quartz; Ser, sericite; Fe, ars (Fe-arsenide); Ang, anglesite.
Minerals 11 01266 g005
Figure 6. The paragenetic sequence of the Kargah Cu-Pb polymetallic ores.
Minerals 11 01266 g006
Figure 7. Photographs of fluid inclusion from the Cu-Pb polymetallic mineralization, Kargah: (a) Type I and type II inclusions in the pre-ore stage quartz grains; (b) sulfide stage I shows the type I and type II inclusions in chalcopyrite bearing quartz vein; (c) the coexistence of type II and type IV inclusions in quartz grains of the pre-ore stage; (d) type IIIb (aqueous-carbonic) inclusion in the pre-ore stage quartz grain; (e) assemblages of type II and type IV inclusions in the sulfide stage I quartz grain; (f) sulfide stage I shows type IV inclusions with type II inclusions in quartz grains; (g) two-phase type IIIa (aqueous-carbonic) inclusions at room temperature in quartz grain of sulfide ore stage I; (h) the coexistence of type V (solid inclusion) with type IV and type II inclusions in sulfide ore stage II; (i) sulfide stage II shows coexistence of type II, type IV, and type V inclusions in zincian-tetrahedrite rich quartz vein; (j) type II inclusions associated with type V (solid inclusion) in the sulfide stage II of quartz vein; (k) type IV and type V inclusions in sulfide stage II quartz bearing vein; (l) post-ore stage shows the type IV inclusions in calcite vein. L, liquid; V, vapor; LH2O, liquid H2O; LCO2, liquid CO2; VCO2, vapor CO2; S, halite crystal.
Minerals 11 01266 g007
Figure 8. Histograms of homogenization temperatures (Th) and salinities of fluid inclusions of the different mineralization stages.
Minerals 11 01266 g008
Figure 9. Representative laser Raman spectra of fluid inclusions of the magmatic-hydrothermal Cu-Pb polymetallic mineralization, Kargah: (a) H2O and CO2 spectrums in type II inclusions of the pre-ore stage; (b) type III inclusions of vapor in the pre-ore stage; (c,d) H2O spectrums of vapor in type IV and type II inclusions of the pre-ore and sulfide ore stage II, respectively; (e) CO2 spectrum in type III inclusion of vapor in sulfide ore stage I; (f) type IV inclusion in the calcite vein of the post-ore stage.
Minerals 11 01266 g009
Figure 10. Histogram of the sulfur isotopic compositions of sulfide minerals in the Kargah Cu-Pb polymetallic deposit.
Minerals 11 01266 g010
Figure 11. Binary plots of selected trace elements in pyrite using EPMA, demonstrating positive and negative correlations. (a) Fe/As; (b) S/As; (c) Ni/As; (d) Co/As; (e) Ag/As; (f) Fe/(Cu + Co + Ni + Au); (g) Zn/Pb; (h) Sb/Pb; (i) Zn/Sb; (j) Au/Ag; (k) As/Cu; (l) Zn/Cu.
Minerals 11 01266 g011
Figure 12. Homogenization temperatures (Th) versus salinity and fluid mixing of fluid inclusions from the Kargah Cu-Pb polymetallic mineralization, (modified after [72]).
Minerals 11 01266 g012
Figure 13. Typical ranges of fluid inclusions in magmatic, epithermal, and MVT deposits worldwide and pressure estimation diagram, (modified after [72,75]), for the pre-ore and sulfide-ore stage fluid inclusions of the Kargah Cu-Pb polymetallic deposit.
Minerals 11 01266 g013
Figure 14. Pyrite mineralization plots: (a) Au-As plot, dash line showing Au solubility limit, (after [45,63]); (b) Au-Ni plot of Py-I and Py-II fall in the hydrothermal field, (after [95]); (c) Co and Ni ratio > 1 suggesting hydrothermal origin for the studied ores, (after [96]); (d) Co-As-Ni ternary diagram of the Kargah Cu-Pb deposit indicating magmatic-hydrothermal origin, (after [44,85]).
Minerals 11 01266 g014
Figure 15. Sulfur isotopic compositions of the Kargah Cu-Pb polymetallic deposit as compared with the magmatic-hydrothermal deposits and other geological settings, (after [9,43,44]); data of the Erdaokan Ag-Pb-Zn deposit from Yuan et al. [43]; Bianjiadayuan Ag-Pb-Zn deposit from Zhai et al. [104]; Jiawula Ag-P-Zn deposit from Niu et al. [85]; Sandaowanzi deposit from Zhai et al. [105]; Jinchang Gold-Copper deposit from Li et al. [100]; Baoshan, Shuikoushan, and Kangjiawan Pb-Zn deposits from Zou [109]; Yongxin deposit from Yuan et al. [44].
Minerals 11 01266 g015
Figure 16. Diagram of lead isotopic composition of the Kargah Cu-Pb polymetallic deposit. The evolution lines for upper crust, orogene, mantle, and lower crust are modified after Zartman and Doe [51]. Lead isotope data of host rock are from Jagoutz et al. [108].
Minerals 11 01266 g016
Table 1. Representative compositions of ore-forming minerals based on electron microprobe analyzer (EPMA). bdl, below detection limit.
MineralsWt.%SFeAsCuMnZnCoNiAgSbPbAuCdCrTotalRepresentative Formulae
Pyrite-I
(n = 8)
Average53.0445.410.010.020.000.010.120.020.00bdlbdl0.000.020.0098.66(Fe0.99 Co0.002)1.00S2.02
St.dev.0.350.450.010.010.010.000.060.010.00bdlbdl0.000.000.01
Pyrite-II
(n = 6)
Average51.6546.390.400.62bdl0.030.040.010.010.000.000.010.000.00099.20Fe0.98 S1.93
(Fe0.98As0.01Cu0.01)1.0S1.93
St.dev.0.440.510.590.76bdl0.010.030.010.010.000.000.000.000.00
Chalcopyrite
(n = 13)
Average34.2929.890.0034.630.000.020.000.000.190.010.020.010.010.0199.08Cu1.00 Fe1.00S2.00
(Cu1.01Ag0.003)1.01Fe 1.00S1.98
St.dev.0.220.580.010.220.000.030.000.000.320.020.020.010.010.01
Zincian Tetrahedrite
(n = 11)
Average26.062.068.5639.280.005.970.010.002.6216.190.0120.010.220.01101.00Cu10Zn2Sb4S13
(Cu9.48Ag0.37)9.85 (Zn1.40 Fe0.57Cd0.03)2.00 (Sb2.04 As1.75)3.79S12.56
St.dev.0.250.950.320.710.001.470.010.000.550.490.030.010.050.01
Galena
(n = 5)
Average12.85bdlbdlbdlbdlbdlbdlbdl0.430.5585.95bdl0.040.0099.83PbS
(Pb1.04Ag0.01Sb0.01Cd0.001)1.06S1.00
St.dev.0.20bdlbdlbdlbdlbdlbdlbdl0.170.200.51bdl0.020.00
Native Silver
(n = 4)
Average0.060.090.001.020.000.110.010.0098.66bdl0.010.010.700.01100.68(Ag0.92Cu0.02Cd0.01)0.9
St.dev.0.030.050.000.270.000.010.010.000.52bdl0.000.010.040.02
Bornite
(n = 3)
Average25.4211.020.0162.83bdlbdlbdlbdlbdlbdlbdlbdl0.010.0399.31Cu5.0Fe1.0S4.0
St.dev.0.420.410.010.620.000.000.000.000.000.000.000.000.020.01
Iron-arsenide
(Lollingite)
(n = 2)
Average2.5829.8665.700.010.060.01bdl0.000.00bdl0.120.000.010.0198.37FeAs2
(Fe1.08As1.75)2.83S0.16
St.dev.0.280.190.220.000.010.01bdl0.000.00bdl0.020.000.000.01
Covellite
(n = 2)
Average33.321.31bdl66.13bdlbdlbdl0.000.10bdlbdlbdl0.020.00100.88CuS
(Cu1.00A0.01Fe0.02)1.03S1.00
St.dev.0.010.50bdl0.49bdlbdlbdl0.000.14bdlbdlbdl0.010.00
Table 2. EPMA analysis of pyrite from the Kargah Cu-Pb polymetallic deposit. Major elements (S and Fe) are in wt.%, while the rest of the elements are presented in ppm. bdl, below the detection limit.
Pyrite TypePy-IPy-IPy-IPy-IPy-IPy-IPy-IPy-IPy-IIPy-IIPy-IIPy-IIPy-IIPy-II
SpotCoreCoreCoreCoreCoreRimRimRimCoreCoreCoreRimRimRim
S52.6953.2353.8252.8353.0452.8552.9152.9351.5051.8052.4551.3251.7951.06
Fe45.18545.3946.4345.4545.1545.5345.1745.0146.5846.3847.1446.4145.4346.40
As6021445151200641434016,94028801709002650240
Cu10029080210280110200622920176402909015840180
Mn120bdlbdl600.0501200.0bdlbdlbdlbdlbdlbdl
Zn160170140150751304074410423270330210340
Co1720190050081018005201640720310320130380210230
Ni110310100120320130100140240200100120110120
Ag408055372376200.0410160200170310210
Sbbdlbdlbdlbdlbdlbdlbdlbdl919744805360
Pbbdlbdlbdlbdlbdlbdlbdlbdl10014051834294
Au241714515243bdlbdl15011010014080150
Cd250160170140170150230180120110800.010060
Cr180bdlbdlbdlbdlbdl190bdl110bdlbdlbdlbdlbdl
Mo982409410424312185911139461546351
Se187253163124217106981247310267936486
Table 3. S/Fe, Fe/(S + As), Co/Ni, and Mo/Ni pyrite ratios in the Kargah Cu-Pb polymetallic deposit.
Pyrite TypeSpotS
(wt. %)
Fe
(wt. %)
As
(ppm)
Co
(ppm)
Ni
(ppm)
Mo
(ppm)
S/FeFe/(S + As)Co/NiMo/Ni
Py-ICores52.6945.18601720110981.170.85715.640.89
Py-ICores53.2345.3921419003102401.170.8536.130.77
Py-ICores53.8246.4345500100941.160.8635.000.94
Py-ICores52.8345.451518101201041.160.8606.750.87
Py-ICores53.0445.1520018003202431.170.8515.630.76
Py-IRim52.8545.53645201301211.160.8614.000.93
Py-IRim52.9145.171431640100851.170.85316.400.85
Py-IRim52.9345.0140720140911.180.8505.140.65
Py-IICores51.5046.5816,9403102401131.110.8761.290.47
Py-IICores51.7946.382880320200941.120.8901.600.47
Py-IICores52.4547.14170130100611.110.8991.300.61
Py-IIRim51.3246.41900380120541.110.9033.170.45
Py-IIRim51.7945.432650210110631.140.8731.910.57
Py-IIRim51.0646.40240230120511.100.9081.920.43
Table 4. Microthermometry data of the Kargah Cu-Pb polymetallic mineralization.
StageHost MineralTypeNSize (um)Tm,CO2 (oC)Tm,cla (°C)Th,CO2 (°C)Tm.ice (°C)Td (°C)Th (°C)W (wt.% NaCl)ρ (g/cm3)
Pre-oreQuartzII351–15 From −8.3 to −1.8
(−5.42)
434 –555
(470.49)
3.06–12.05
(8.26)
0.20–0.65
(0.43)
III163–60From −57.0 to −54.0
(−55.71)
From 4.3 to −7.9
(5.25)
From 30 to 33
(32.0)
399–425
(414.94)
4.07–10.04
(8.53)
0.55–0.70
(0.63)
IV411–27 From −8.3 to −2.0
(−5.62)
442–495
(450.07)
3.39–12.05
(9.10)
0.40–0.70
(0.55)
Sulfide ore IQuartzII291–19 From −8.7 to −3.0
(−6.55)
380–438
(410)
4.96–12.51
(9.87)
0.55–0.75
(0.65)
III152–45From −57.0 to −53.6
(−55.47)
From 4.8 to −8.2
(6.62)
From 30 to 36
(32.13)
300–359
(327.47)
3.52–9.28
(6.28)
0.70–0.80
(0.39)
IV301–37 From −31.0 to −5.0 (−13.59) 332–423 (380.8)7.86–29.26
(16.07)
0.65–0.95
(0.80)
Sulfide ore IIQuartzII201–22 From −3.1 to −0.9
(−1.90)
300–356 (331.95)1.57–6.45
(3.20)
0.60–0.80
(0.70)
IV431–39 From −9.2 to −3.0
(−6.97)
280–352
(308.67)
4.96–13.07
(10.34)
0.75–0.90
(0.83)
V155–31 From 283 to 368 (325)313–390
(354.8)
33.44–49.26
(40.94)
1.0–1.30
(1.15)
Post-ore Quartz, calciteIV441–40 From −5.3 to 4.5
(−3.13)
155–256
(211.20)
0.88–8.28
(5.37)
0.85–1.0
(0.90)
Notation: N, number of analyzed inclusions; Tm,CO2 (°C), first ice melting temperature of carbon dioxide; Tm,cla (°C), melting temperature of clathrate (carbonic hydrite); Th,CO2 (°C),homogenization temperature of carbon dioxide; Tm.ice (°C),final ice melting temperature; Td (°C),daughter mineral dissolved temperature; Th (°C), final homogenization temperature; W, salinity; ρ, density; numbers in “( )” are the averages. Temperatures over 550 °C were not calculated due to exceeding the limit of the instrument.
Table 5. Sulfur and lead isotope compositions of sulfide minerals from the Kargah Cu-Pb polymetallic deposit.
Sample NoMineralsδ34S (%)206Pb/204Pb207Pb/204Pb208Pb/204Pb
KCZ-01Pyrite5.418.50.015.70.039.40.0
KCZ-02Pyrite−2.819.30.015.80.039.80.0
KCZ-02-1Pyrite−2.519.50.015.90.039.10.0
KGH-04Pyrite4.920.20.015.90.040.70.0
KSL-M-1Pyrite4.420.20.015.90.040.40.0
KS-ad-01Pyrite−0.120.10.015.90.040.10.0
KCH-03Pyrite3.020.30.015.90.040.50.0
KS-ad-01-1Pyrite5.820.20.016.00.040.90.0
KS-ad-01-2Pyrite3.619.80.015.80.040.20.0
KS-sv-30Pyrite2.920.40.016.00.040.20.0
KJZ-07Galena0.720.30.015.90.040.30.0
KS-sv-24Galena3.720.30.015.90.040.20.0
KS-sv-T-1Galena3.420.20.016.00.040.80.0
KSL-sv-01Galena3.420.20.015.90.040.20.0
KGN-sv-02Galena3.420.30.015.90.040.60.0
KCH-sv-01Galena3.620.30.015.90.040.30.0
KS-sv-T-2Galena3.420.20.015.90.040.20.0
KS-ad-01Chalcopyrite5.920.20.015.90.040.60.0
KS-ad-01-2Chalcopyrite6.420.20.015.90.040.60.0
KS-sv-30Chalcopyrite6.220.20.016.00.040.70.0
Publisher’s Note: MDPI stays neutral with regard to jurisdictional claims in published maps and institutional affiliations.

