Article

Early Ordovician Age of Fluorite-Rare-Metal Deposits at the Voznesensky Ore District (Far East, Russia): Evidence from Zircon and Cassiterite U–Pb and Fluorite Sm–Nd Dating Results

by
Nailya G. Rizvanova
1,*,
Antonina A. Alenicheva
2,
Sergey G. Skublov
1,3,
Sergey A. Sergeev
2 and
Dmitriy A. Lykhin
4
1
Institute of Precambrian Geology and Geochronology, Russian Academy of Sciences, 199034 St. Petersburg, Russia
2
Karpinsky Russian Geological Research Institute, 199106 St. Petersburg, Russia
3
Faculty of Geological Prospecting, Saint-Petersburg Mining University, 199106 St. Petersburg, Russia
4
Institute of Geology of Ore Deposits, Petrography, Mineralogy, and Geochemistry, Russian Academy of Sciences, 119017 Moscow, Russia
*
Author to whom correspondence should be addressed.
Minerals 2021, 11(11), 1154; https://doi.org/10.3390/min11111154
Submission received: 28 August 2021 / Revised: 10 October 2021 / Accepted: 14 October 2021 / Published: 20 October 2021
(This article belongs to the Special Issue Cassiterite: The U-Pb Mineral Geochronometer)

Abstract

:
This article presents new isotope-geochronological results for the granites of the Voznesensky ore district (southeastern part of the Khanka massif). The granites are associated with extensive rare-metal–fluorite, tin and tantalum mineralization. Despite the numerous published results of Rb–Sr, Sm–Nd and U–Pb dating of ore-bearing granites and associated ores, the issues of age correlation and the genetic relationship of igneous rocks and mineralization remain unclear. U–Pb zircon SHRIMP dating reveals synchronous ages of 478 ± 4 Ma and 481 ± 7 Ma for two samples of biotite leucogranites as the age of magmatic crystallization of the Voznesensky granites. The composition of the studied zircon demonstrates the typical features of magmatic zircon and has the typical features of zircon exposed to fluids at the late/post-magmatic stage. Sm–Nd ID-TIMS dating of the fluorite of the Voznesenskoe deposit yields an age of 477 ± 9 Ma, and U–Pb ID-TIMS dating of cassiterite from the Yaroslavskoe and Chapaevskoe tin deposits yields an age of 480 ± 4 Ma, which confirms the direct genetic and age relationship of ore formation with granite magmatism.

1. Introduction

The Voznesensky Ore District (VOD) of the Khanka block of the Bureino-Khanka metallogenic province [1] is located in the southwest of the Primorsky Territory of the Russian Far East. VOD is known for the unique lithium–beryllium–fluorite Voznesenskoe and Pogranichnoe deposits associated with the intrusion of rare-metal lithium fluoride granites of the Voznesensky complex. In addition, there are Sn–W deposits of the quartz–cassiterite and cassiterite–silicate–fluorite associations.
The geological structure of deposits, mineral composition and isotopic characteristics of rocks have been published previously [2,3,4,5,6,7,8,9,10,11,12,13,14,15,16,17].
The Rb–Sr and Sm–Nd geochronology of igneous rocks and ores at the deposits of the Voznesensky ore district is debatable and controversial. A wide range (512–430 Ma) of ages of rare-metal granites of the Voznesensky complex has been proposed [18]; the Rb–Sr isotopic ages of Li–F granites from the Voznesenskoe deposit are estimated from 512 to 475 Ma [17]; the Rb–Sr ages of biotite granites of the Yaroslavsky, Pervomaisky and Chikhezsky massifs are 467–451 Ma [8,9]. According to the Sm–Nd method, the Li–F granites of the Voznesensky and Pogranichny massifs are dated 452 ± 9 Ma, 458 ± 11 Ma and 467 ± 34 Ma [15], and a U–Pb age of ~450 Ma for zircons on SIMS SHRIMP was also obtained [14]; the late magmatic Nb–Ta mineralization [9] is 440 ± 5 Ma (U–Pb, columbite); fluorite ores have a K–Ar age of 453 Ma, the CHIME method yields an age of ~450 Ma for zircons and monazites from granites of the Voznesensky complex [16], Rb–Sr ages of dikes and monzonitoids range from 415 to 406 Ma, rare-metal–fluorite ore is 423 Ma old [9]; 380 ± 93 Ma and 379 ± 29 Ma ages were obtained by the Sm–Nd method for cassiterite–tourmaline–fluorite and for scheelite–fluorite association, respectively [11,13].
Based on the available geochronological data, the long duration (up to 90 Ma) of the evolution of the ore-forming process, and the multistage nature of greisenization and albitization was suggested [12]. The deposit is located above the Voznesensky stock of leucocratic granites of the Voznesensky complex.
The issues of genetic relationships of fluorite mineralization, tin ore deposits and igneous rocks require a more detailed and accurate geochronological study of these objects using modern capabilities. The sequence of the development of ore-generating magmatic complexes of the VOD is important for prospecting and evaluation works.
The use of U–Pb SHRIMP dating of zircons from the Voznesensky massif granites, Sm–Nd dating of hand-picked fluorite samples from the rare-metal–fluorite ore of the Voznesensky deposit, and the U–Pb isotope analysis of cassiterite [19] of the Yaroslavskoe and Chapaevskoe deposits of the Khanka massif allow us to obtain new geochronological data for the VOD.

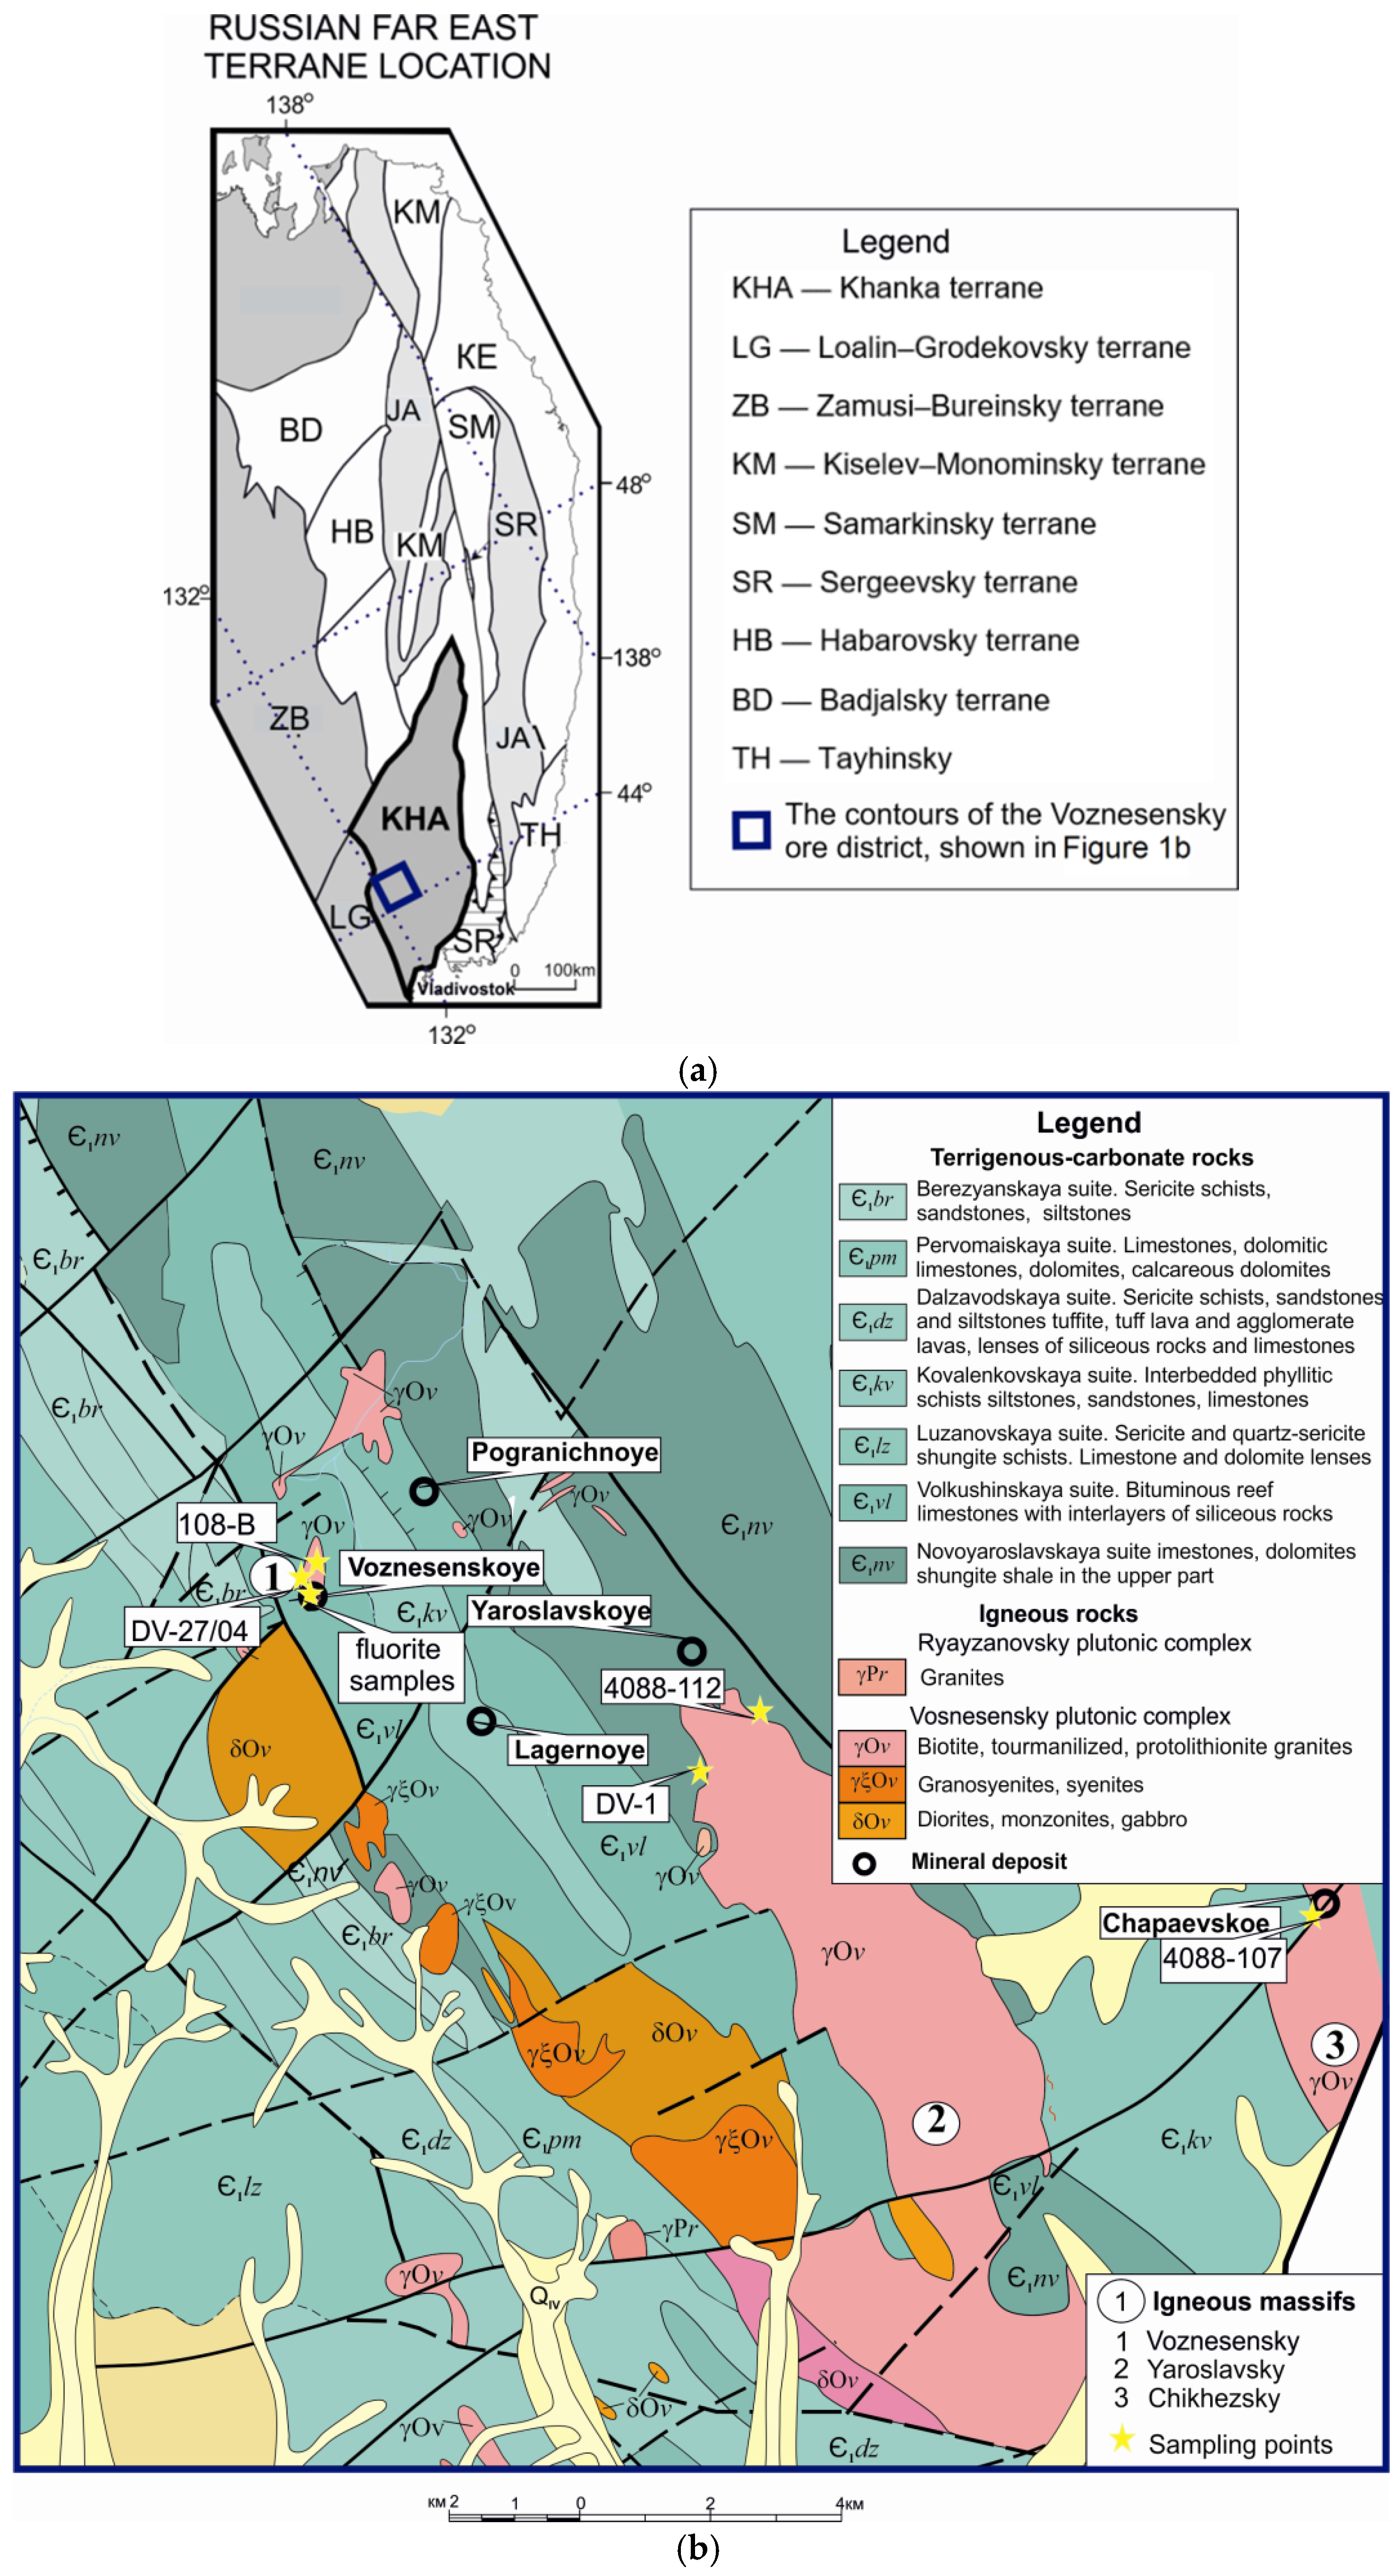
2. Characteristics of the Voznesensky Complex

Intrusions of the Voznesensky complex are represented by intrusive bodies that include diorites, monzodiorites, granosyenites, leucogranites, muscovite pegmatites, biotite granite porphyries and protolithionite granites [9]. These rocks break through the Lower Cambrian terrigenous deposits and form zones of skarnification, hornfelsing, greisenization and tourmalization (Figure 1).
Biotite granites compose large (8–12 km2) intrusions, elongated according to the strike of folded structures. They formed intrusions—Yaroslavsky, Chikhezsky and Pervomaisky—and a number of smaller ones, which are confined to uplifted blocks. Protolithionite leucogranites composing small ridge-like bodies—Voznesensky, Pogranichny and Lagerny—are confined to the node of the intersection of deep faults. According to Rub [7], they refer to rare-metal lithium fluoride granites. According to geophysical data [20], these small stock intrusions of the Voznesensky granites are small protrusions of a large granite pluton [9,16]. Lithium–fluorine granites of the Voznesenskoe fluorite–rare-metal deposit in chemical composition are close to alaskites, deviating towards alkaline granites. The most important discriminant parameter, the ratio of alumina and alkalis, characterizes the granites of the Voznesensky complex as the S-A type (Figure 2a). Pearce’s [21] Rb–Y + Nb discriminant diagram illustrates the position of the spots of the Voznesensky granites in the field of collisional settings (Figure 2b).
The biotite granites of the Yaroslavsky, Chikhezsky and Pervomaisky massifs and the biotite–protolitionite granites of the Voznesensky and Pogranichny massifs are not successive phases of the same magmatic complex; biotite–protolitionite granites are petrochemical facies that formed in different geodynamic conditions [9].
The Voznesenskoe fluorite–rare-metal deposit is localized in the terrigenous-carbonate Lower Cambrian sediments of the Yaroslavl series. The deposit is located above the Voznesensky stock of leucocratic granites of the Voznesensky complex (Figure 1). Ore bodies in deep horizons are penetrated by numerous subvertical apophyses of the intrusion, transformed into quartz–mica and quartz–topaz greisens. The marginal parts of the intrusion are also intensely greisenized, and at deep horizons they are albitized.
The Voznesenskoe and Pogranichnoe deposits formed in three stages: albite, greisen and hydrothermal [13]. The ore-forming processes of the Voznesenskoe deposit evolved from an early high-temperature stage with widespread albitization to the moderate greisen stage [9]. A later stage took place outside the granites. It was here that large-scale Li–Be–fluorite mineralization developed in the host rocks containing carbonate horizons, and the greisenization process exceeded the albitization one in intensity. The final pulse of greisenization resulted in the formation of topaz–fluorite ores. Ore bodies formed up to 250 m thick and up to 1200 m long multilayer lenses [13].
The ores of the deposits belonged to the mica–fluorite type formation, which is associated with a long process of the metasomatic replacement of limestones and skarns. Tin deposits are represented by the cassiterite–silicate–fluorite association (Yaroslavskoe and Pervomayskoe), confined to the outer zone of the Yaroslavsky massif of biotite granites in the host rocks and the cassiterite–quartz association (Chapaevskoe), located in the intragranite zone of the Chikhezsky massif of the biotite granite–leucogranite complex. About 70 ore bodies with an average tin content of 0.06% to 1.41% have been identified within the Yaroslavskoe ore deposit.

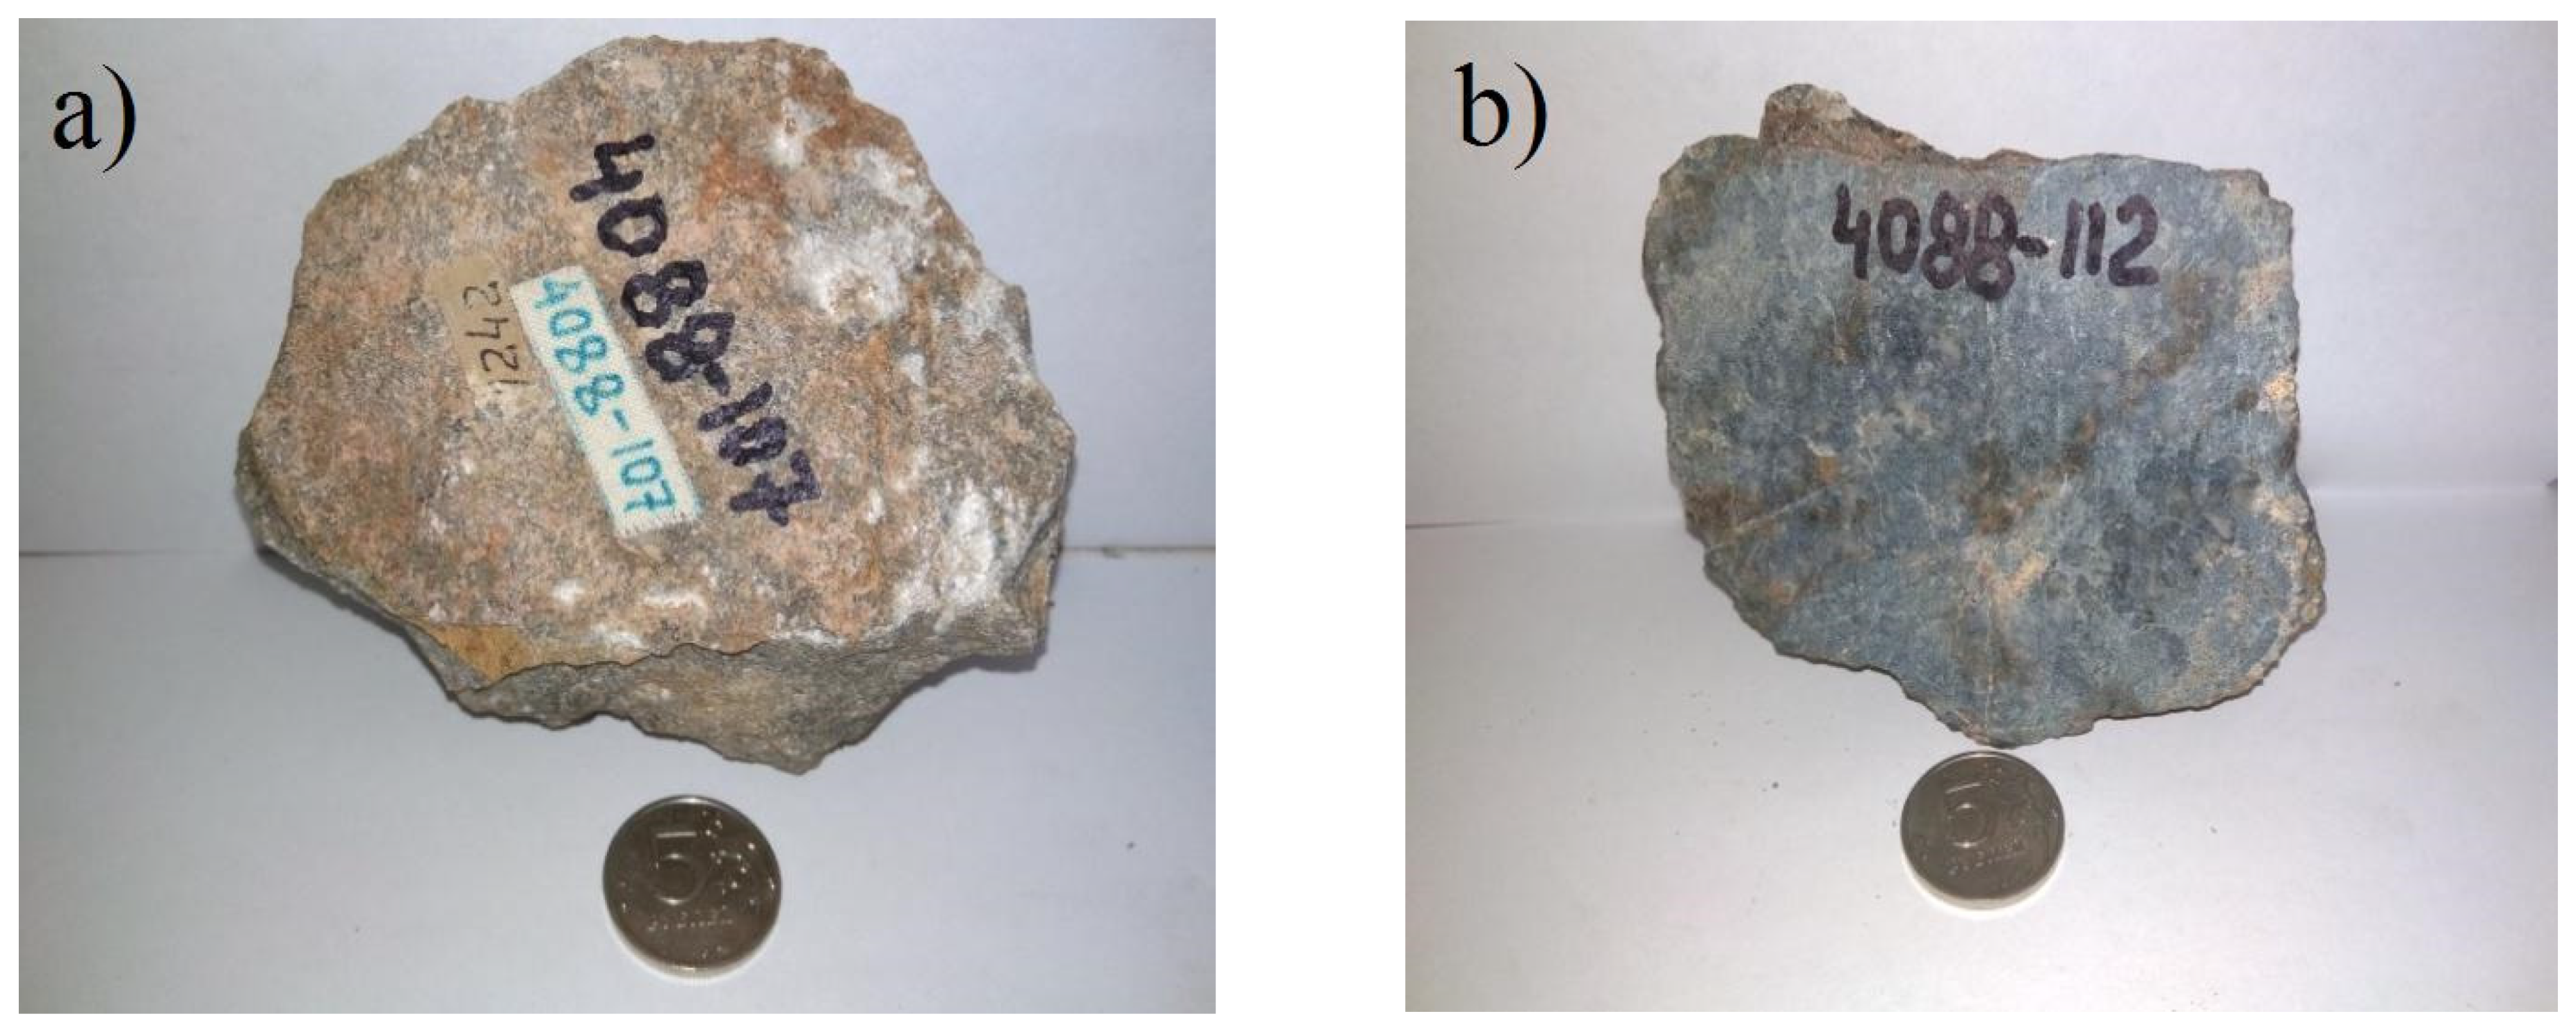
3. Sample Descriptions

Two zircon samples and three cassiterite samples were chosen for U–Pb dating and four fluorite samples for Sm–Nd dating. Sample locations are shown in (Figure 1). Accessory zircons were separated from biotite granite (DV-27/04) and from leucogranite (108-B) of the Voznesensky massif. Fluorite samples (335-4, 352-3, B-107, B-109) were from the micaceous-fluorite ores of the Voznesenskoe deposit. Samples corresponded to a fine-grained matrix consisting of fluorite (63–66 wt.%) and muscovite (25–35 wt.%), with a minor amount of tourmaline, cassiterite and topaz. Monomineral fractions of 1 to 10 mm rounded grains fluorite were hand-picked for the analysis. Cassiterite samples DV-1 and 4088-112 were from a greisen and a pegmatite vein, respectively, in the Yaroslavskoe deposit. The cassiterite sample 4088-107 was from a greisen from the Chapaevskoe deposit (Figure 3a,b).

4. Analytical Methods

4.1. Zircon U–Pb SHRIMP and Trace Element Microanalysis

In situ U–Pb SIMS zircon dating was performed by sensitive high-resolution ion microprobe (SHRIMP IIe) at the Center of Isotopic Research of the Russian Geological Research Institute (CIR VSEGEI), St. Petersburg. The selected zircon grains were mounted in epoxy resin together with chips of Temora [22] and 91,500 [23] reference zircons. Zircon Temora was measured once per every 3 analyses of unknowns as the main reference material to obtain their U/Pb ratios normalized to the instrument bias. Zircon 91,500 was used as a U concentration standard. The microanalysis points were selected with the help of optical, back-scattered electron (BSE) and cathodoluminescence (CL) images, which showed the internal structure and zoning of the zircon crystals. The U–Pb measurements followed the techniques described by [24,25], with a mass-filtered O2− primary beam of ~4 nA yielding a spot diameter of 25 μm and a ~2 μm pit depth. Common lead correction was performed based on the measured 204Pb/206Pb ratios using Stacey-Kramers’ Pb isotope evolution model for 450 Ma [26]. The results were processed using SQUID software [27]. The 206Pb/238U ratios were normalized to that in the Temora standard zircon (0.0668), corresponding to the age of 416.75 Ma. The errors of single analyses (U/Pb isotope ratios and ages) and the errors of concordant ages and intercepts were quoted at the 1σ and 2σ levels, respectively. The concordia diagram was plotted using ISOPLOT/EX software [28].
Measurements of zircon trace element composition were performed using an IMS-4f (CAMECA) ion microprobe at the Yaroslavl branch of the Institute of Physics and Technology, Russian Academy of Sciences. We mainly followed the analytical procedures described in [29,30]. The primary O2– ion beam spot size was ~20 µm. Each analysis was averaged from 3 measurement cycles. Accuracy of trace element measurements was 10% and 20% for concentrations of more than 1 ppm and between 0.1 and 1 ppm, respectively. To construct REE distribution spectra, the composition of zircon was normalized to that of chondrite CI [31]. The zircon crystallization temperature was determined by the Ti-in-Zrn thermometer [32].

4.2. Fluorite Sm–Nd Geochronology

Isotope analysis of Sm and Nd was carried out on a nine-collector TRITON TI mass spectrometer in a static mode at the CIR VSEGEI. Correction for isotopic fractionation of Nd was performed by normalizing the measured values with respect to 148Nd/144Nd = 0.241578. The normalized ratios were brought to the value 143Nd/144Nd = 0.511860 in the La Jolla isotope standard. The error in determining the contents of Sm and Nd was 0.5%. The blank level was 30 pg for Sm and 70 pg for Nd. The parameter εNd was calculated with an accuracy of ±0.5 epsilon units. The isochron construction and the calculation of the age of the samples studied, as well as εNd, were carried out using the ISOPLOT program [6], using the following values of the constants: λ147Sm = 6.54 × 10⁻¹² year−1, (143Nd/144NdCHUR) = 0.512636, (147Sm/144NdCHUR) = 0.1967. In the calculations, the following values of the Sm–Nd determination errors were introduced: 0.5% for 147Sm/144Nd; 0.005% for 143Nd/144Nd.
Silicate X-ray spectral analysis, X-ray fluorescence analysis and determination of rare Earth and trace elements by ICP MS ELAN 6100 DRC were performed at VSEGEI.
Determination of the contents of the main petrogenic elements and some trace elements in rocks by the X-ray fluorescence method (X-ray spectrometer ARL 9800 f. ARL) and determination of rare Earth and trace elements by inductively coupled plasma mass spectrometry (ICP MS ELAN 6100 DRC) were performed at VSEGEI. A technique developed and certified by the VSEGEI CL: VSEGEI MP no. 10/2010, no. 14/2010 https://www.vsegei.ru/ru/activity/labanalytics/lab/lab-operations/ (accessed on 1 January 2021).

4.3. Cassiterite U–Pb TIMS Geochronology

Isotope studies of cassiterite were performed at the Institute of Precambrian Geology and Geochronology, Russian Academy of Sciences (IPGG, RAS), St. Petersburg. Before the chemical treatment, cassiterite samples were checked under a binocular scope and repeatedly ultrasonically washed in H2O. Reagents were in-house Teflon distilled acids, and 18.2 MΩ-water from a Millipore system. Gulson and Jones [33] first showed that acid washing or leaching of cassiterite concentrates removes significant amounts of common Pb hosted in sulfide inclusions. A detailed description of the previously published leaching procedure is given in Tapster and Bright [34] and Carr et al.’s [35] studies. Since the studied cassiterites, in addition to sulfides, may have contained other inclusions, we used a modified leaching routine that included preliminary treatment with various reagents, selecting the most efficient ones. Some of the studied samples were pretreated in HF + HNO3 in Teflon liners placed in stainless steel bombs at 220 °C for 24 h to remove potentially present inclusions of variable compositions, including silicate minerals. Then, the acid solution was decanted, the cassiterite was thoroughly washed with deionized (DI) H2O and powdered in a jasper mortar. The quantity of cassiterite required for analysis was placed in a Savillex Teflon vial and treated with a mixture of 2N HCl and 2N HNO3 on a hotplate at 70 °C for 2 h. Then, the sample was washed twice with DI H2O for 15 min while heating on a hotplate. Then, it was treated with a mixture of 6N HCl and 6N HNO3 by heating on a hotplate at 70 °C for 2 h. The solution after the second treatment that may have represented dissolved altered portions of cassiterite was collected and, in some cases, was analyzed for U/Pb compositions in order to obtain additional information about possible superimposed processes.
The best results with higher degree of concordance were obtained when cassiterites were pretreated in HF + HNO3 at 220 °C, followed by washing in aqua regia. Then, the sample was totally digested in 10N HCl at 235 °C in Teflon liners placed in stainless steel bombs for 2 days. In subsequent experiments described below, the complete decomposition of cassiterites was successfully carried out at 230 °C for 2 days. An important condition for complete decomposition is the creation of high pressure in the liners during the digestion, which is achieved by filling the entire working volume of the liners with an acid solution. This volume was 0.5 mL in our liners. As a result of this chemical procedure, a complete decomposition of cassiterite samples was achieved [19]. Next, the cassiterite solution was split into two aliquots to determine the unspiked Pb isotopic ratios in the first aliquot and isotopic ratios after addition of a 235U–208Pb mixed tracer in the second spiked aliquot. Then, the aliquots were evaporated, converted into the bromide form for subsequent Pb and U purification by chromatography according to the method [36] on an ion-exchange resin Bio-Rad AG 1-X8 100–200 mesh in HBr-form, followed by additional purification of U in HNO3 on the UTEVA resin. Laboratory blank was 25 pg Pb and 10 pg U. All measurements of Pb and U isotopes were carried out on a TRITON TI 9-collector mass spectrometer. The error in determining the concentrations and Pb/U ratios was given with a 95% (2 σ) confidence interval. The raw U–Pb data were processed using the PbDAT program [26]. The concordia plots were constructed using the ISOPLOT/EX software [28].

5. Results

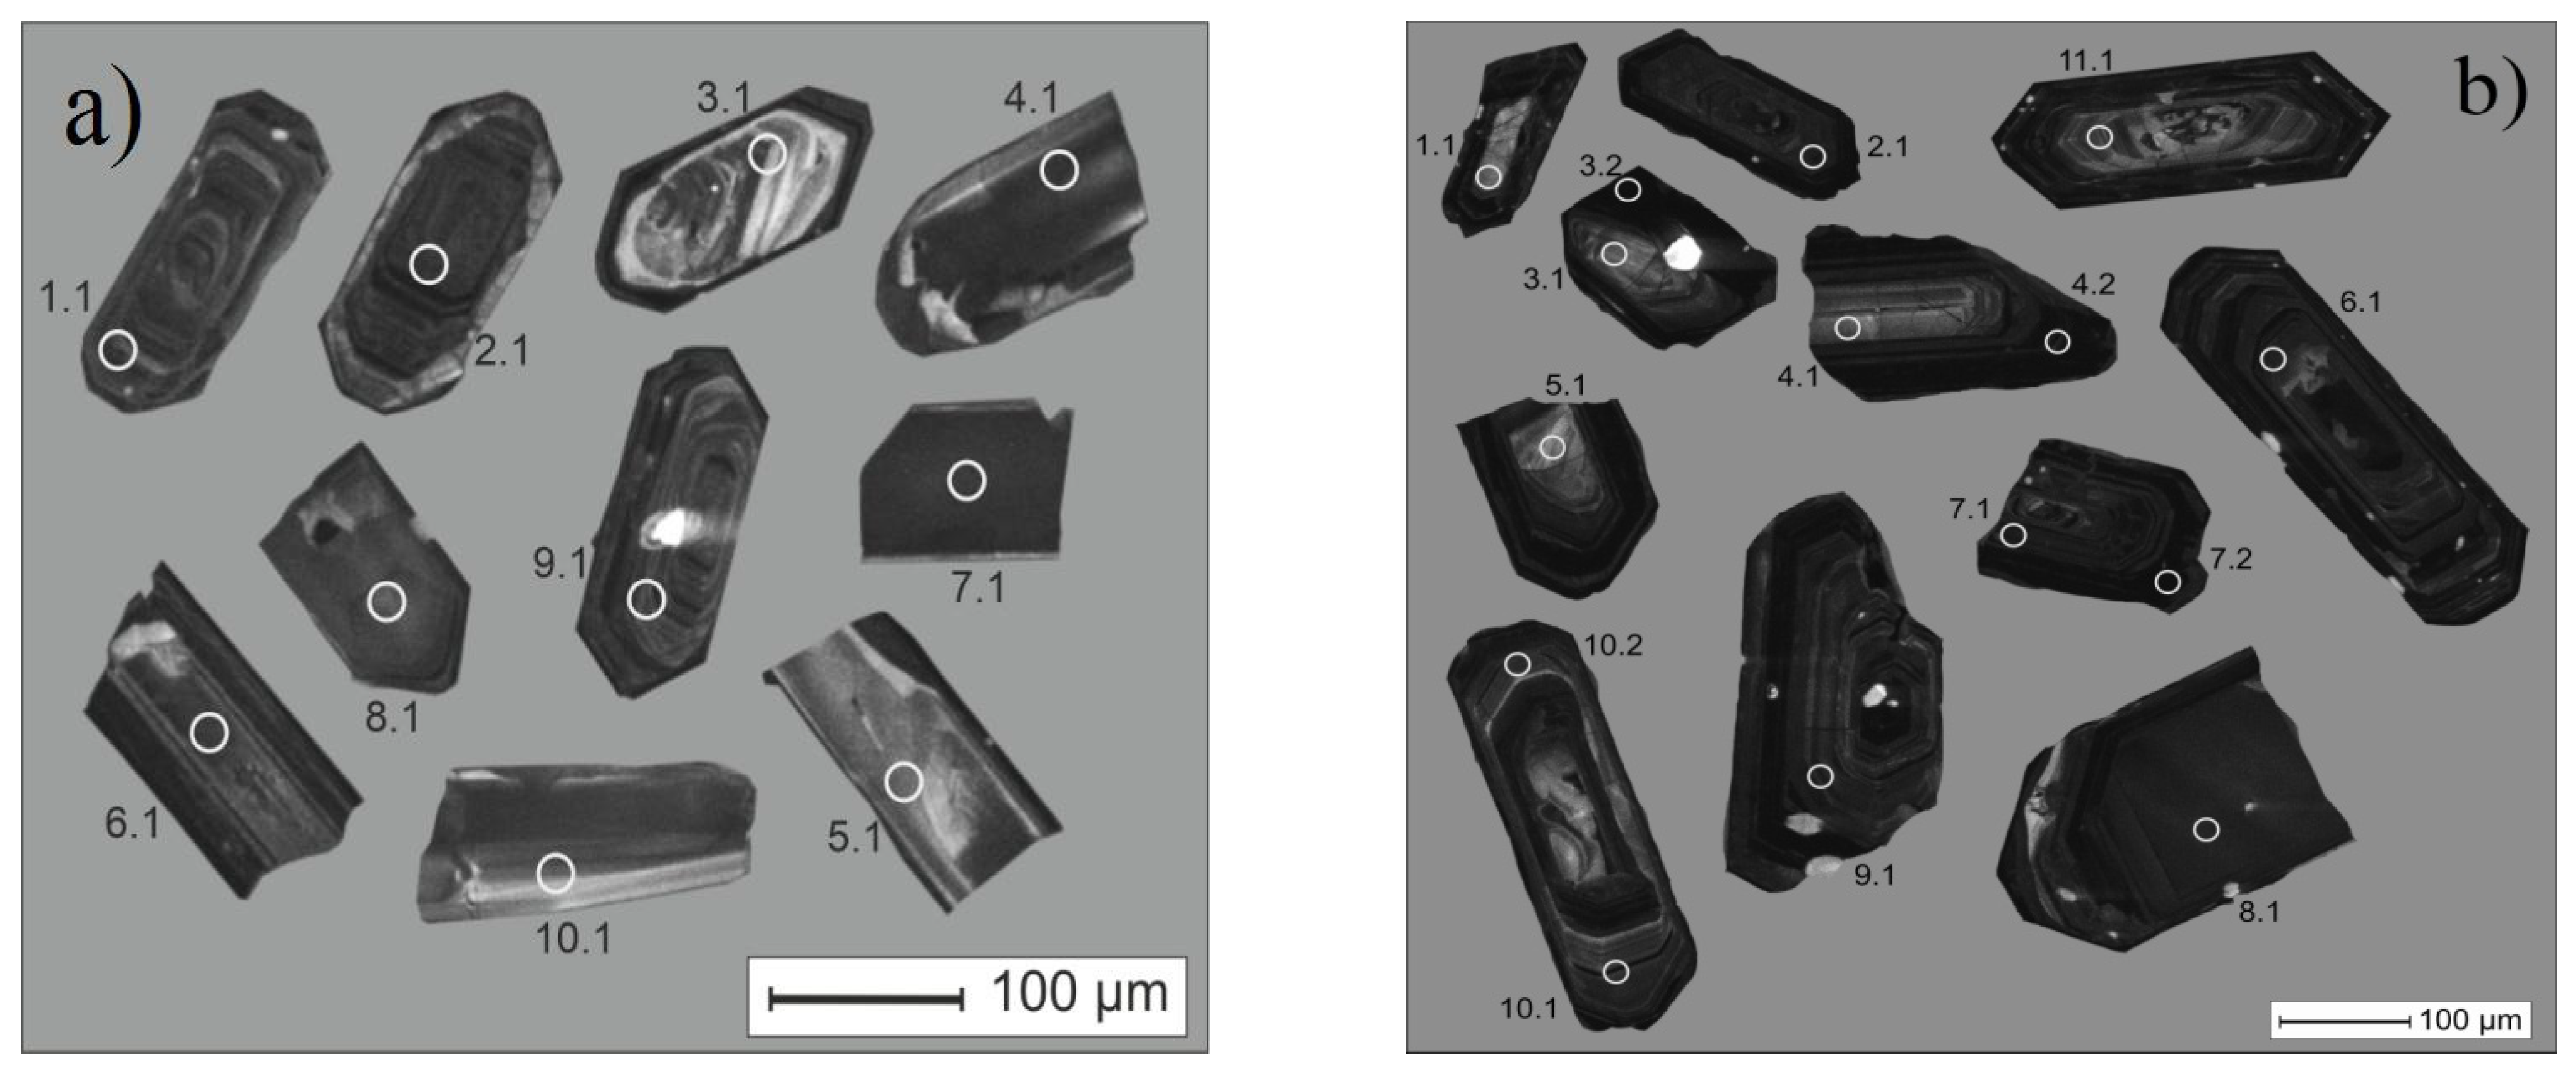
5.1. Zircon U–Pb SIMS Geochronology

Sample 108-B. Zircons were transparent, idiomorphic, short and long prismatic with bipyramids. The grain size varied from 150 to 300 microns. The CL showed an oscillatory zoning characteristic of magmatic zircons (Figure 4a). The cores were not pronounced; very thin dark rims were observed in some zircons. Measurements were conducted for 10 zircon grains (Table 1). Zircons were high in uranium with a U content from 463 to 10,214 ppm, Th/U = 0.20–1.7.
U–Pb isotope data are presented in Table 1. The Concordia age of the granite sample 108-B was 480 ± 7 Ma (n = 5), MSWD = 0.036 (Figure 5b). Moderate Th/U = 0.42–0.65 indicated the magmatic origin of zircons [37]. Zircon (108-B_3.1) with a 206Pb/238U age of 736 Ma (Th/U = 0.72) was inherited from the host rock protolith of the Khanka Massif. In two zircons with a disturbed isotope system, a significant enrichment in uranium (8052 and 10,214 ppm) was noted, which could be explained by the input of uranium during hydrothermal alteration with a significant influence of the fluid phase. As such, a high uranium content could have caused the metamictization of zircon and the subsequent loss of radiogenic lead from its broken crystal lattice. (Figure 5a).
Sample DV-27/04. Zircon grains were of a idiomorphic appearance with clearly pronounced prism and bipyramid facets, with short-prismatic crystals (Figure 4b). Grain sizes were up to 300 µm. Zircon was characterized by a heterogeneous structure—the central part was light gray in CL, with relics of thin-strip growth oscillatory zoning (for example, point 4.1 in Figure 4b). The margins (50–70 µm wide) were darker, almost black, at CL (points 7.1 and 7.2 in Figure 4b).
When dating zircon from sample DV-27/04, 12 spots in 11 grains were analyzed, of which 10 were located in the central part of the grains and 2 (10.1 and 10.2, Figure 4b) in the marginal part. On the Tera–Wasserburg concordia diagram, six spots formed a compact concordant cluster, but the other six spots were significantly shifted along the concordia to the right towards younger ages (the individual 206Pb/238U age for them varied from 368 to 197 Ma), (Figure 5c) (Table 1). For six spots included in the concordant cluster, a Concordia age of 478 ± 4 Ma (MSWD = 1.6) was calculated (Figure 5b). Five of these spots (1.1, 3.1, 5.1, 9.1 and 11.1) were in the central part of zircon grains and one (10.2) was in the marginal zone.
The U content at the spots for which the concordant age was calculated varied from 477 to 1561 ppm with a median value of 826 ppm, the Th content varied from 237 to 1027 ppm with a median value of 333 ppm (Table 1). The Th/U ratio varied from 0.33 to 0.68, averaging at 0.51, which is typical for magmatic zircons [37]. The share of common Pb for four spots from the concordant group did not exceed 0.55%, but it was higher for spots 5.1 and 1.1 (2.76% and 16.73%, respectively). The common Pb content did not correlate with the U content.
The spot analyses plotted to the right of the concordant cluster were characterized by a high U content (from 1682 to 5240 ppm with a median value of 2513 ppm). The Th content was also increased (617 to 3440 ppm with a median value of 1178 ppm). Variations of the Th/U ratio (from 0.25 to 1.20) were more significant than those of the spot analyses from the concordant cluster, but the average Th/U ratio of 0.57 was similar. All five spot analyses from this group (except spot 10.1) had a high common Pb content, varying from 17.5% to 43.0%. In addition, increased Ca contents (from 433 to 2228 ppm with a median value of 834 ppm) were found in spots with a reduced 206Pb/238U age. The Ca content was significantly lower (from 55.8 to 425 ppm with a median value of 326 ppm) in the spots included in the concordant cluster. It was previously established [38] that a Ca content above ~ 100 ppm may indicate a disturbance of the U–Pb isotope system and an age discordance of zircon that experienced an interaction with fluid. Therefore, there is every reason to consider the group of zircon spot analyses with younger 206Pb/238U ages as a result of the radiogenic Pb loss and the input of uranium during zircon’s interaction with the fluid.

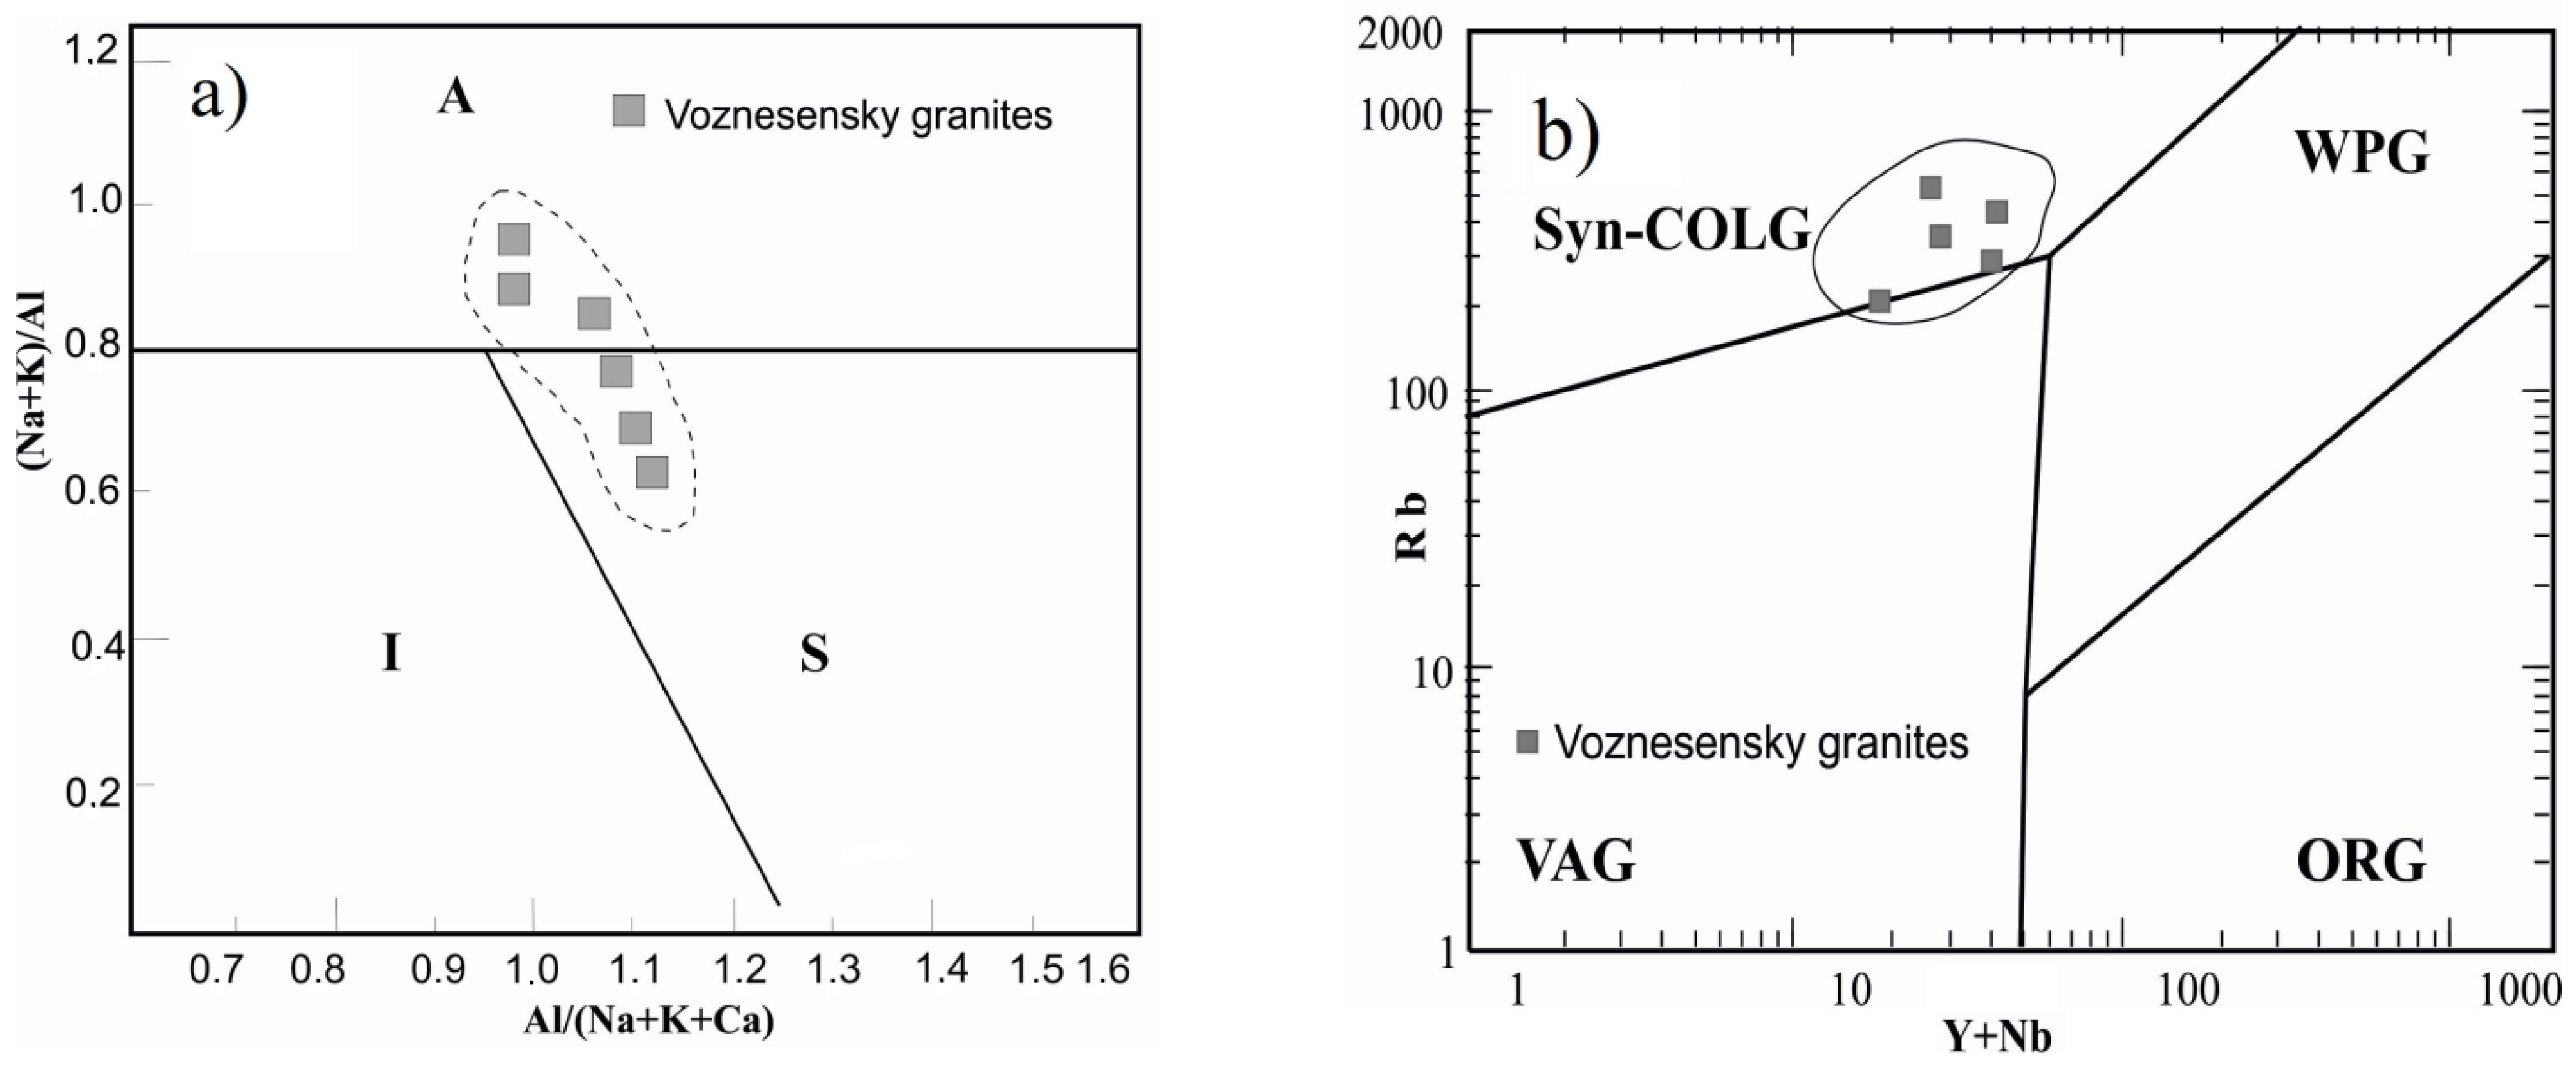
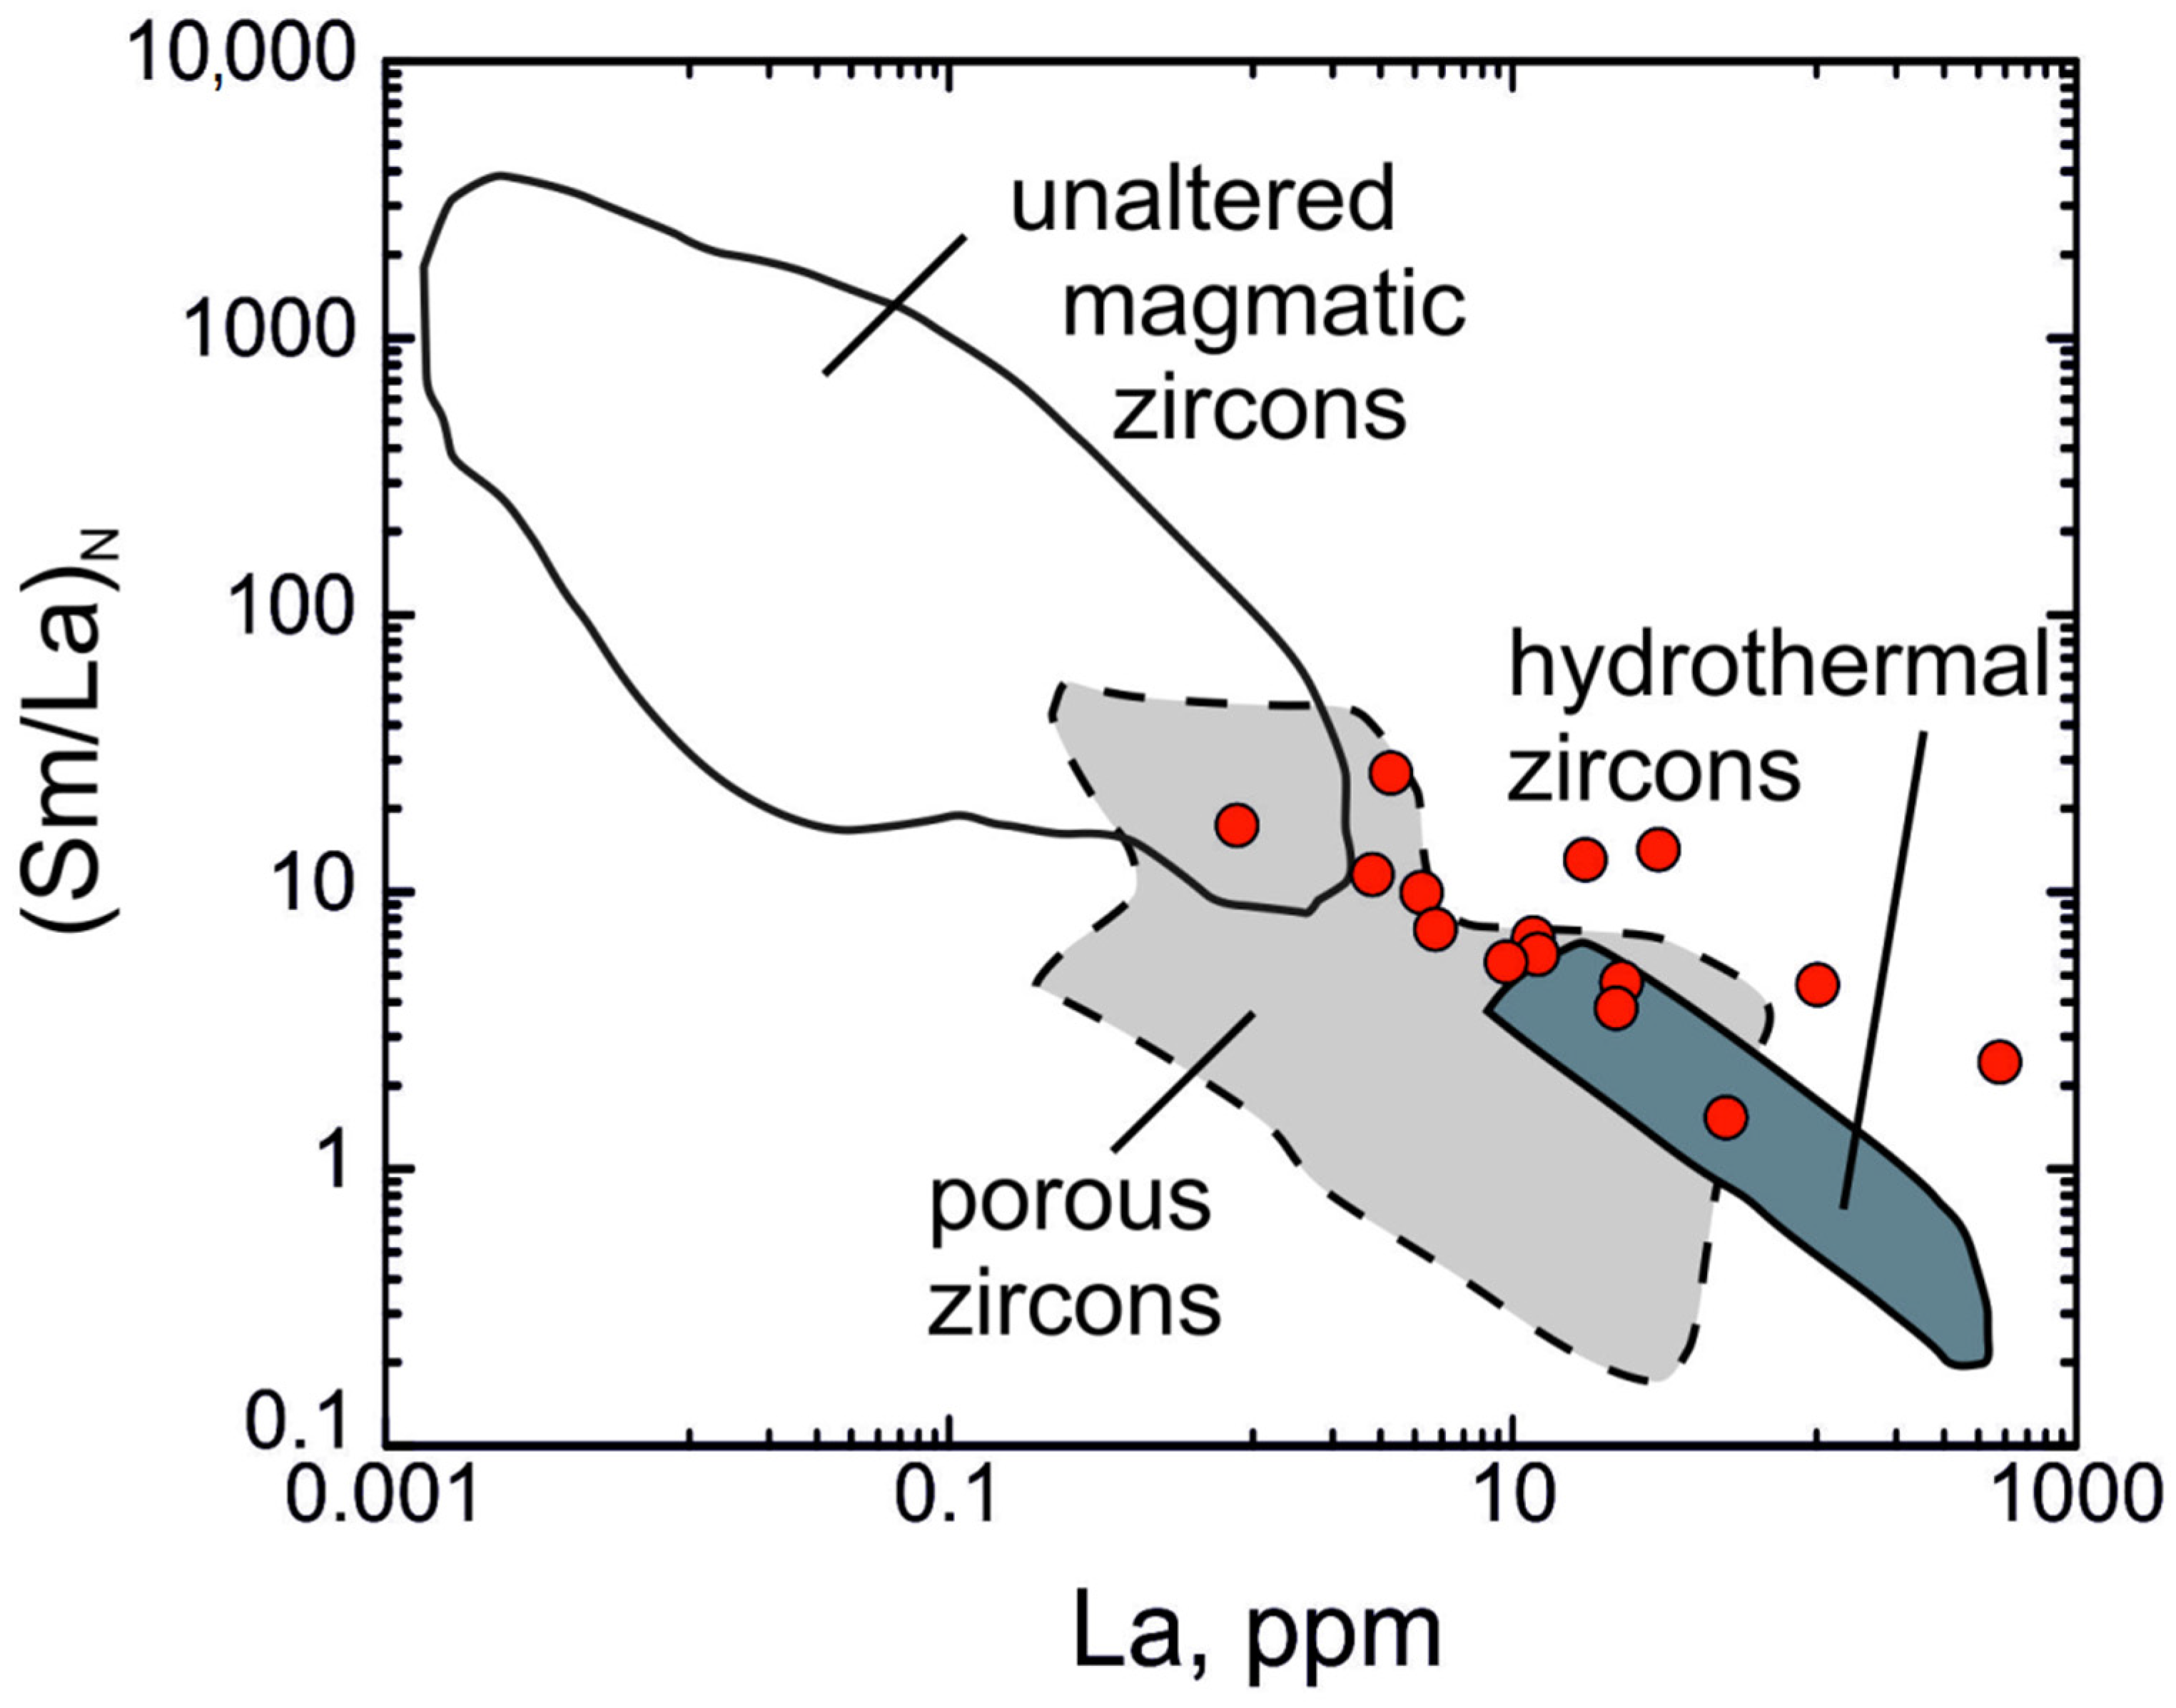
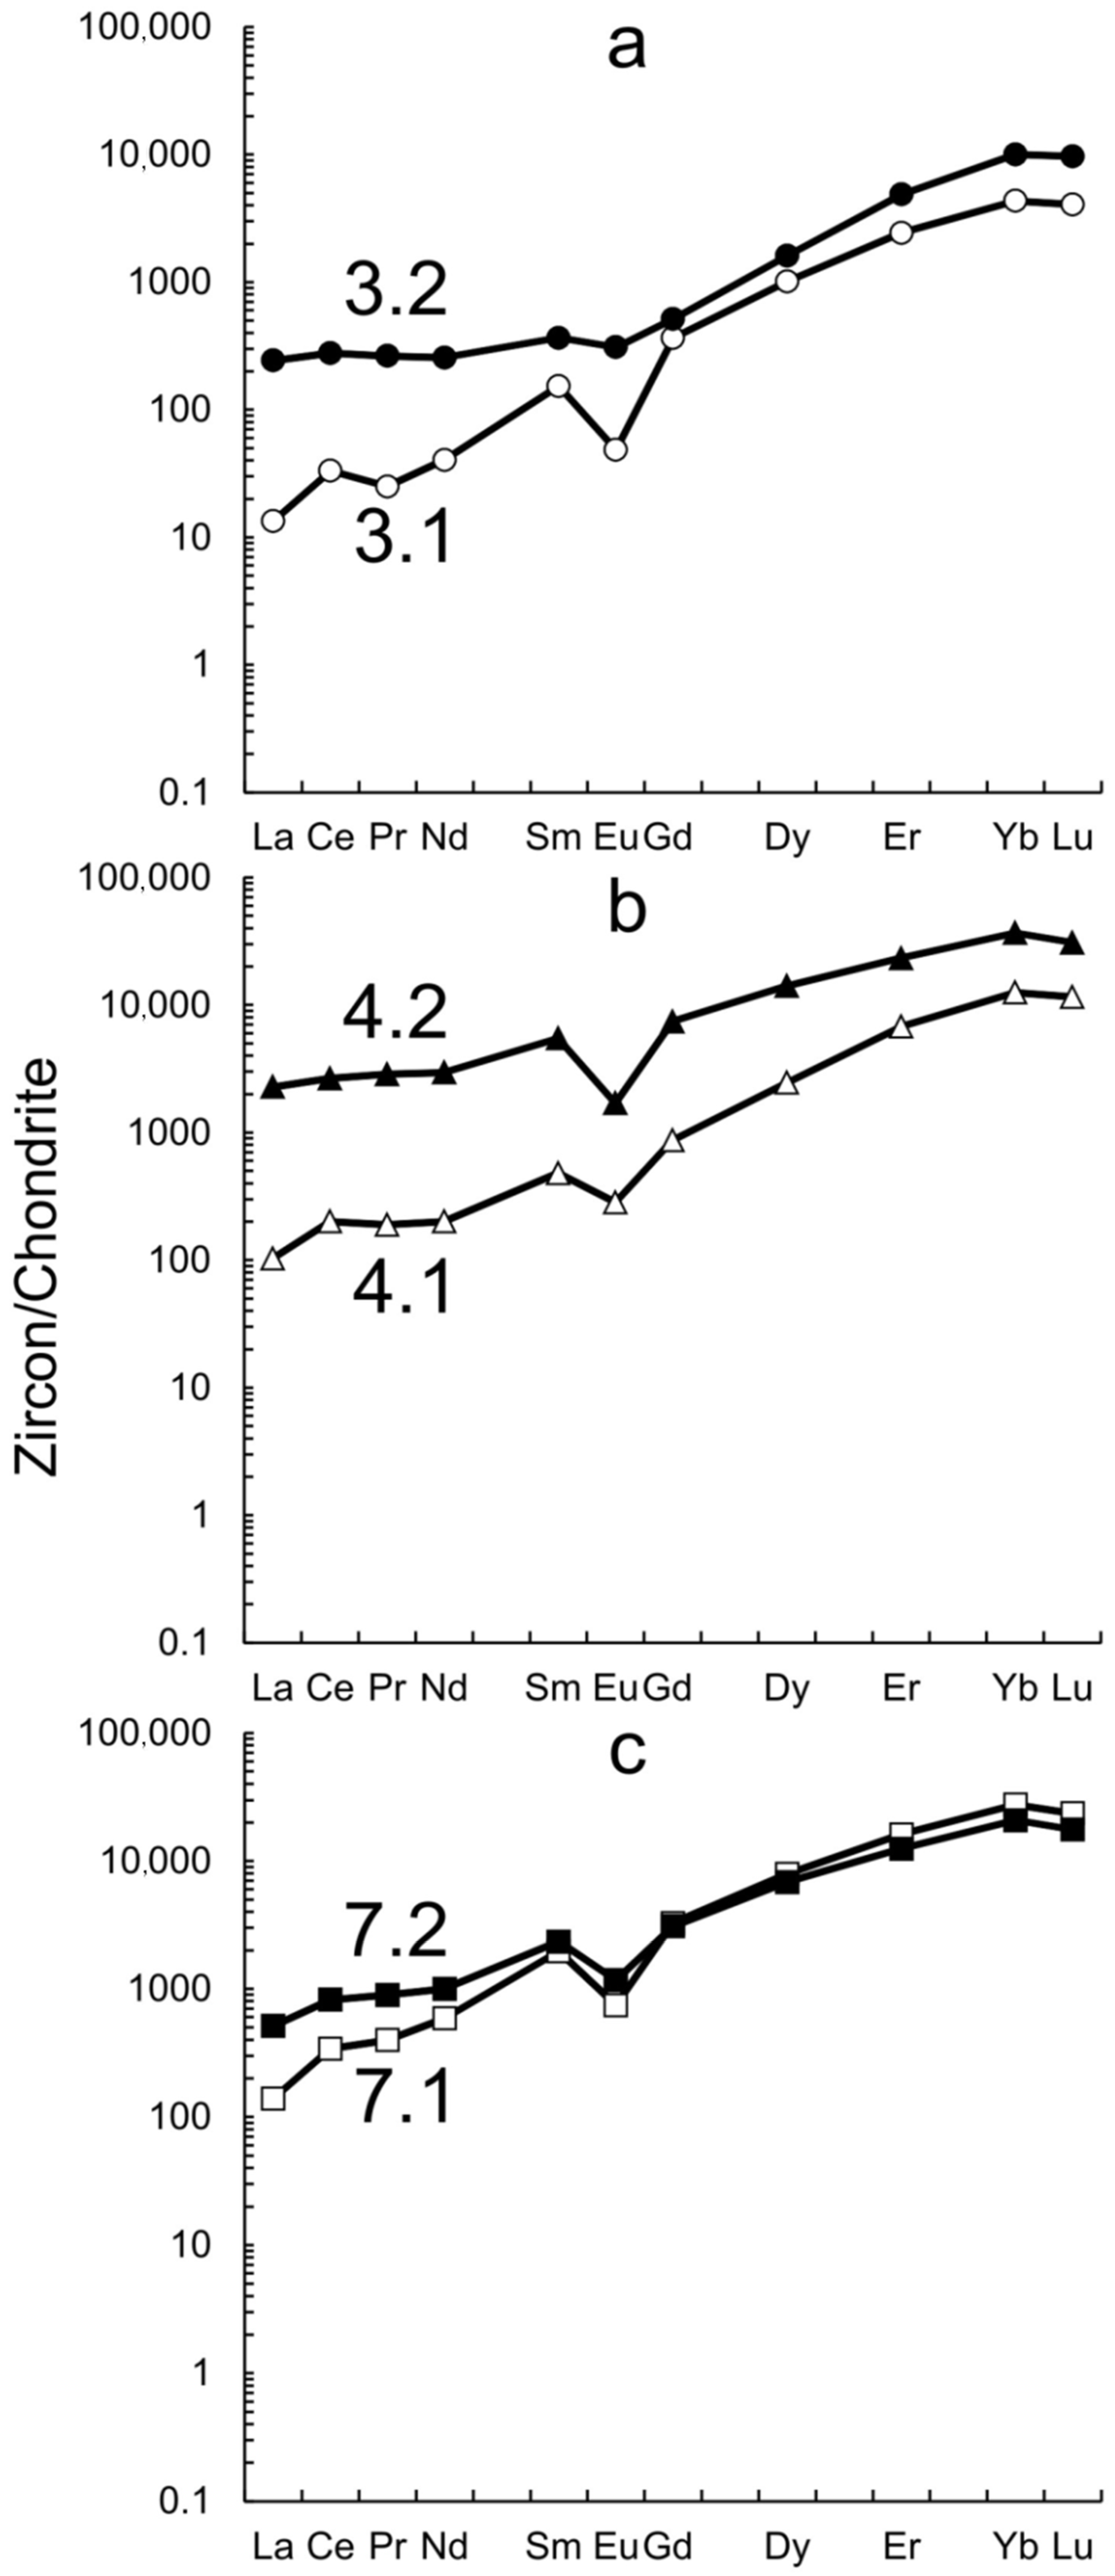
5.2. Zircon Trace Element Composition

The content of trace and rare Earth elements (REE) in zircons from sample DV-27/04 was analyzed at the same spots as the age determination (Table 2). Additionally, three analyses were conducted in the marginal parts of zircon, which were darker in the CL images (spots 3.2, 4.2 and 7.2, Figure 4b).
The REE patterns normalized to the CI chondrite composition [31] formed a broad band in Figure 6. The spectra for all spots were differentiated with a magnification typical for zircon from light to heavy REE. Spots 3.2, 4.2 and 7.2 in the marginal zones of zircon were distinguished by the minimum value of the fractionation index REE—the value of the LuN/LaN ratio (39.8, 13.5 and 34.5, respectively). For the remaining spots, the LuN/LaN ratio varied from 63.7 to 777, averaging at 232.
Spots 4.2, 7.1 and 7.2 increased the REE contents (20970, 11092 and 9638 ppm, respectively). The increased contents were especially noticeable for LREE, the content of which was 3777, 547 and 1164 ppm, respectively. The LREE (REE) content varied from 23.4 (1102) to 369 (5720) ppm, with a median value of 193 (2589) ppm in all other spots analyzed.
For all analyzed zircon domains from sample DV-27/04, a weak positive Ce anomaly was observed (Ce/Ce* varied from 1.04 to 3.45 with an average value of 1.65). A negative Eu anomaly was noticeable at all spots (Eu/Eu* from 0.12 to 0.44 with an average value of 0.28), with the exception of spot 3.2 (Eu/Eu* = 0.71).
The presence of paired (central/marginal) analyses for three grains made it possible to consider an evolution of the zircon composition during its crystallization. In grain three, with spots 3.1 and 3.2, the marginal zone was characterized by an increased content of REE with a sharp increase in LREE with a subordinate role of HREE, a disappearance of the positive Ce anomaly, and a reduction in the negative Eu anomaly (Figure 7a).
In grain four, with points 4.1 and 4.2, the content of both LREE and HREE noticeably increased in the marginal zone (Figure 7b). The positive Ce anomaly in the marginal zone of zircon also practically disappeared, but, in contrast to the previous case, the negative Eu anomaly increased.
For grain seven, the contrast in the REE distribution between the central and marginal zones was the least pronounced (Figure 7c). The HREE contents in both spots were comparable; the LREE content increased in the marginal zone, but less noticeably than in the previous examples. A slight decrease in the magnitude of the positive Ce and negative Eu anomalies was observed.
The Y content in zircon varied from 1737 ppm to an abnormally high value of 27,687 ppm in spot 4.2, and was positively correlated with REE (r = 0.99) and phosphorus (r = 0.84). The incorporation of Y and REE (mainly HREE) into the zircon structure is commonly ascribed to the coupled xenotime-type substitution (Y, REE)3+ + P5+ = Zr4+ + Si4+ [39]. Such an isomorphic scheme suggests a proportional increase in the content of Y and HREE on the one hand, and P on the other. According to the ratio of the Y content and the Ce anomaly, the zircons from sample DV-27/04 fell into the compositional field of zircons from granitoids [40].
The content of Ca, which was not in the zircon chemical formula, varied over a wide range from 55.8 to 5207 ppm, while the maximum Ca content was found in the black marginal zones of zircon in the CL image (domains 3.2, 4.2 and 7.2). For the same domains, the maximum content of other impurity elements, such as Sr, Ba, Nb and Ti, was also recorded.
In the analyzed zircon domains without black marginal zones in the CL, the Ti content varied from 6.57 to 167 ppm, which corresponded to a crystallization temperature of 707 to 1072 °C determined using [32]. It was found that the threshold of the Ti content was about 20 ppm [41] in the unaltered zircon. There were four such domains, where the Ti content did not significantly exceed this threshold (spots 3.1, 5.1, 9.1 and 11.1). For them, the temperature value, according to the Ti-in-zircon thermometer [32], varied in the range 707–837 °C with an average value of 793 °C, which could be interpreted as the zircon crystallization temperature from sample DV-27/04.
The Hf content in zircon varied from 9208 to 18,156 ppm with a median value of 12,802 ppm. The maximum Hf content was found for the black CL marginal zones of zircon. For each pair of domains belonging to the central and edge zones of the same crystal, an increase in the Hf content towards the edge by 2300–4700 ppm was observed. Such an increase in the Hf content towards the edge of zircon crystals is typical for granites and indicates the evolution of a magmatic melt, which, during the crystallization of zircon, becomes enriched in Hf, which is a more incompatible element compared to Zr [42].
The Li content in zircon varied from 9.19 to 98.1 ppm, and negatively correlated with the contents of Ca, Sr and Ba (r = −0.76). This range of Li content is characteristic of zircon from continental crustal rocks, the Li content in which typically falls in the range of 1–100 ppm [43].
Almost all figurative points of zircon from sample DV-27/04 fell either in the field of porous zircons that had experienced fluid action (11 points), or were located above this field, but gravitated towards it (4 points) in the La vs. SmN/LaN discrimination diagram (Figure 8). Only one point (5.1) was plotted in the area of the intersection of the compositions of porous and unaltered magmatic zircons. In this case, three points fell into the area of the intersection of the compositions of porous and hydrothermal zircons.

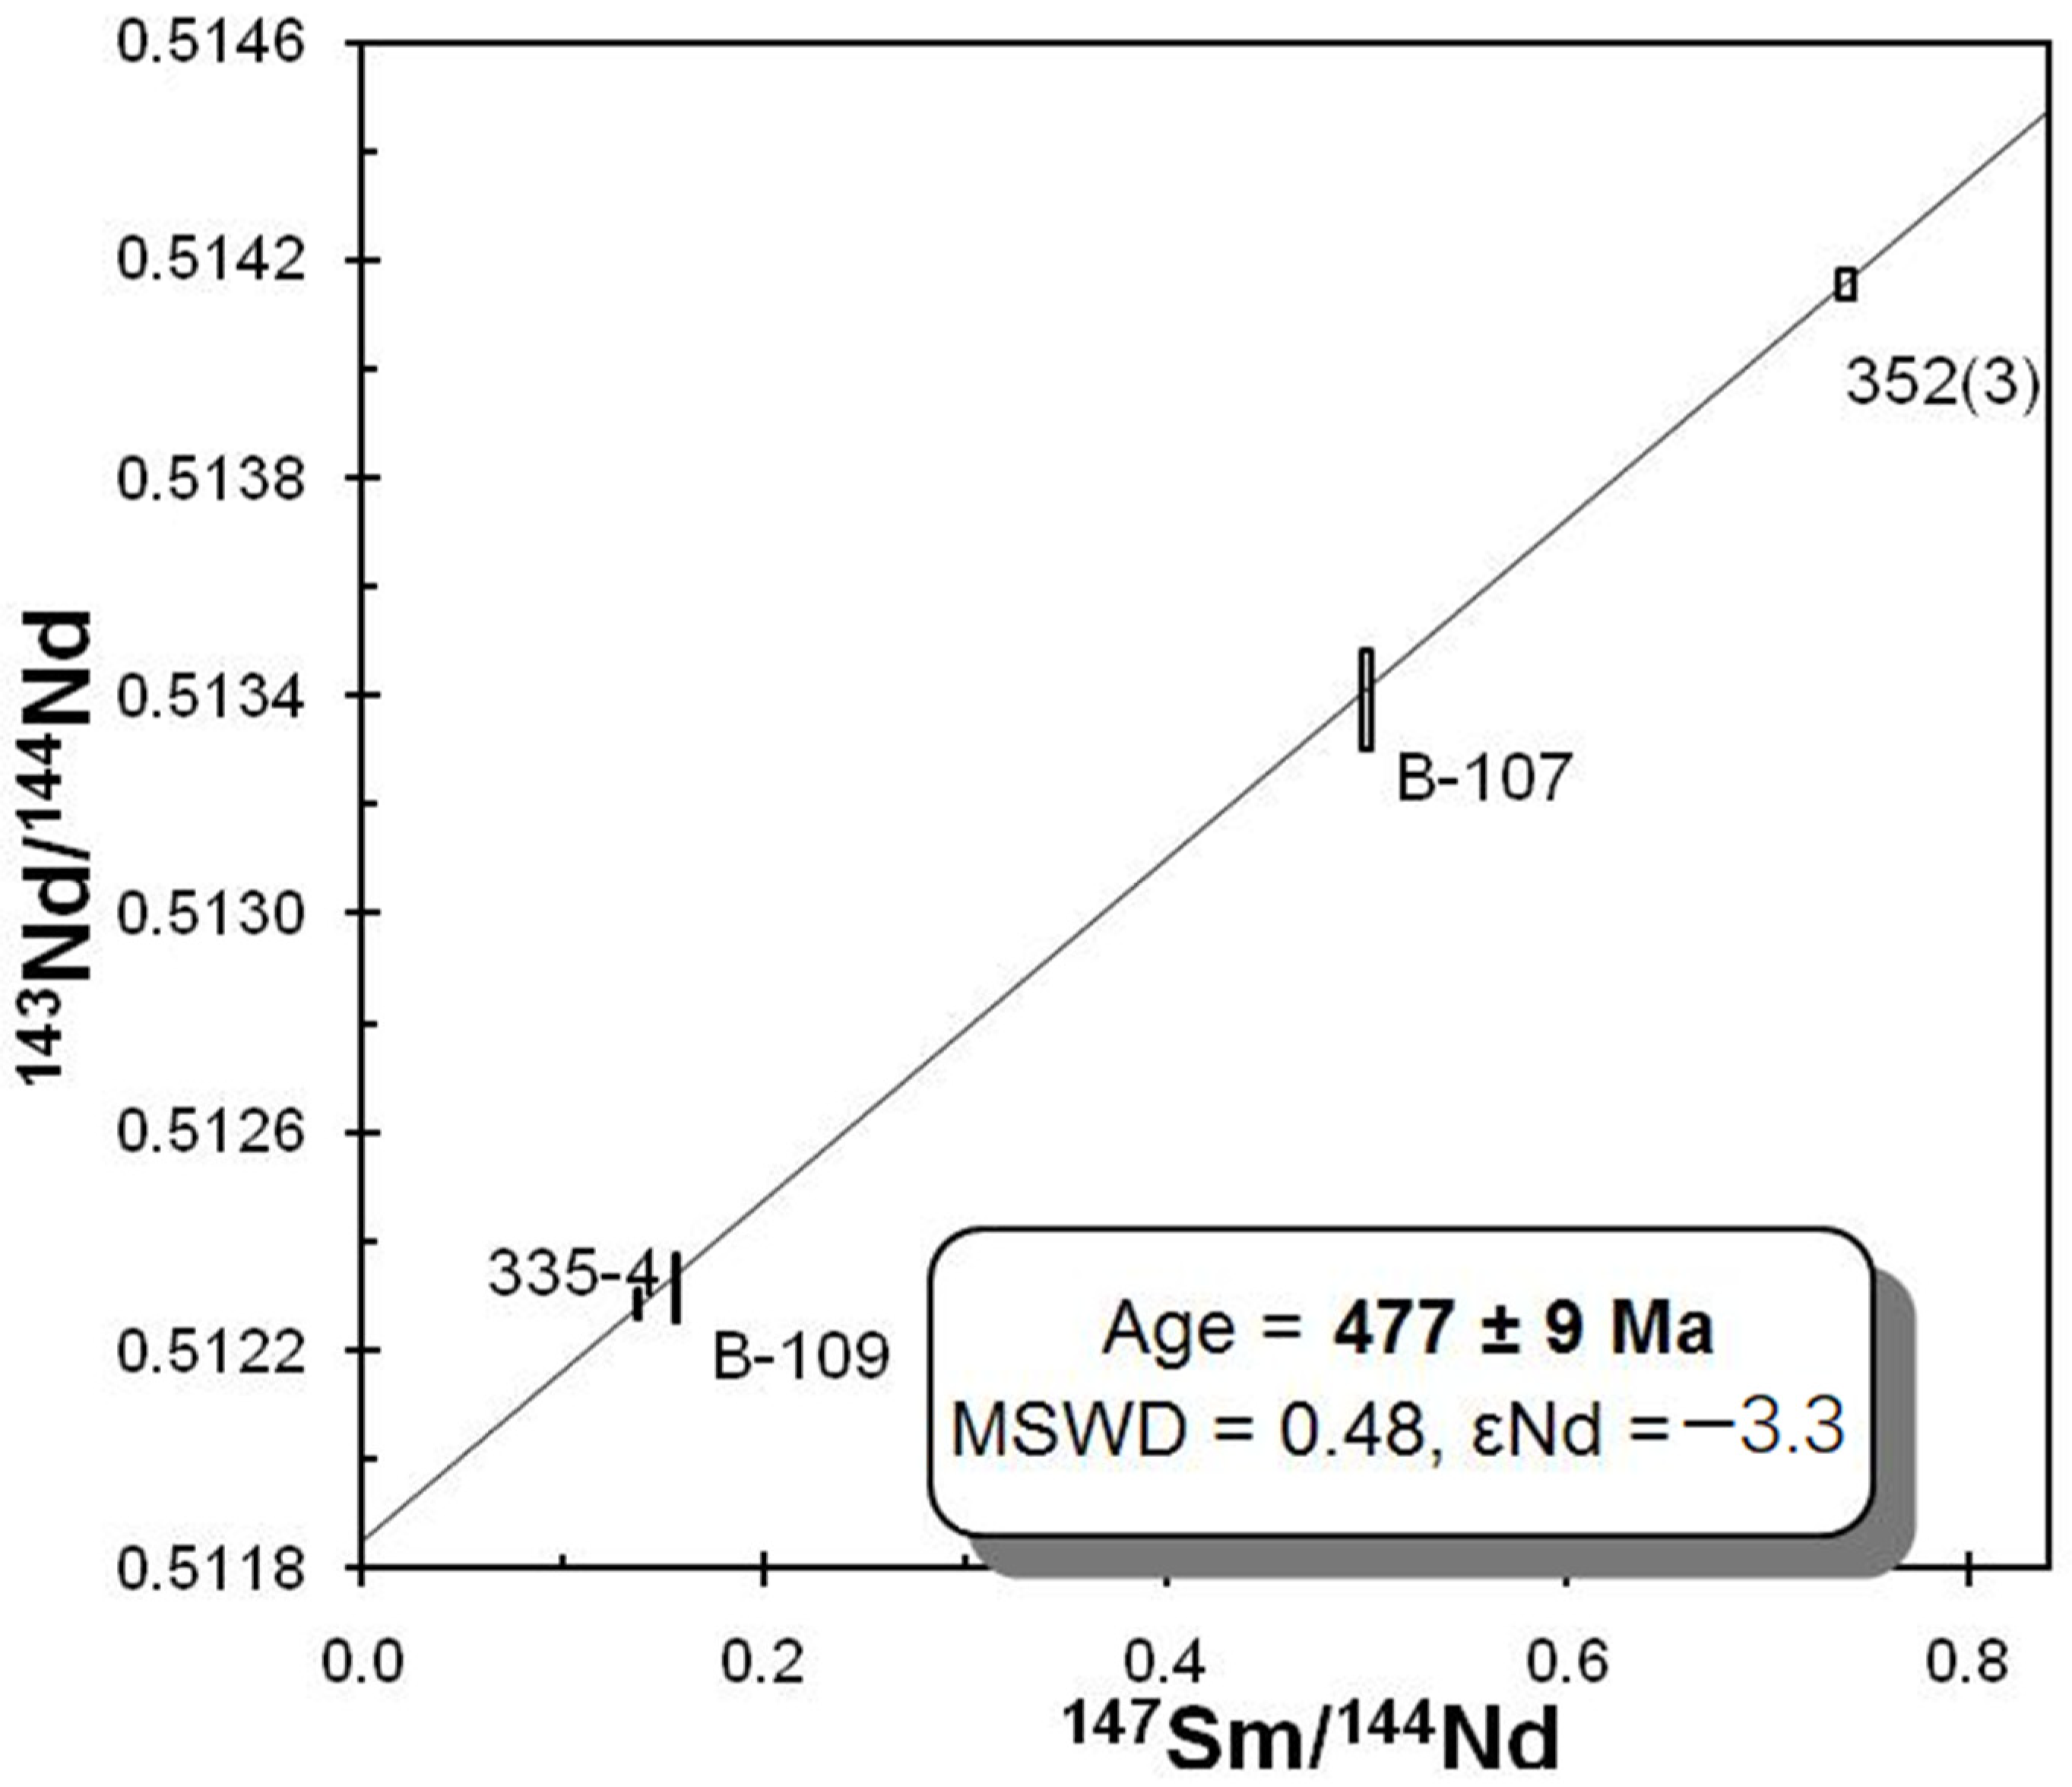
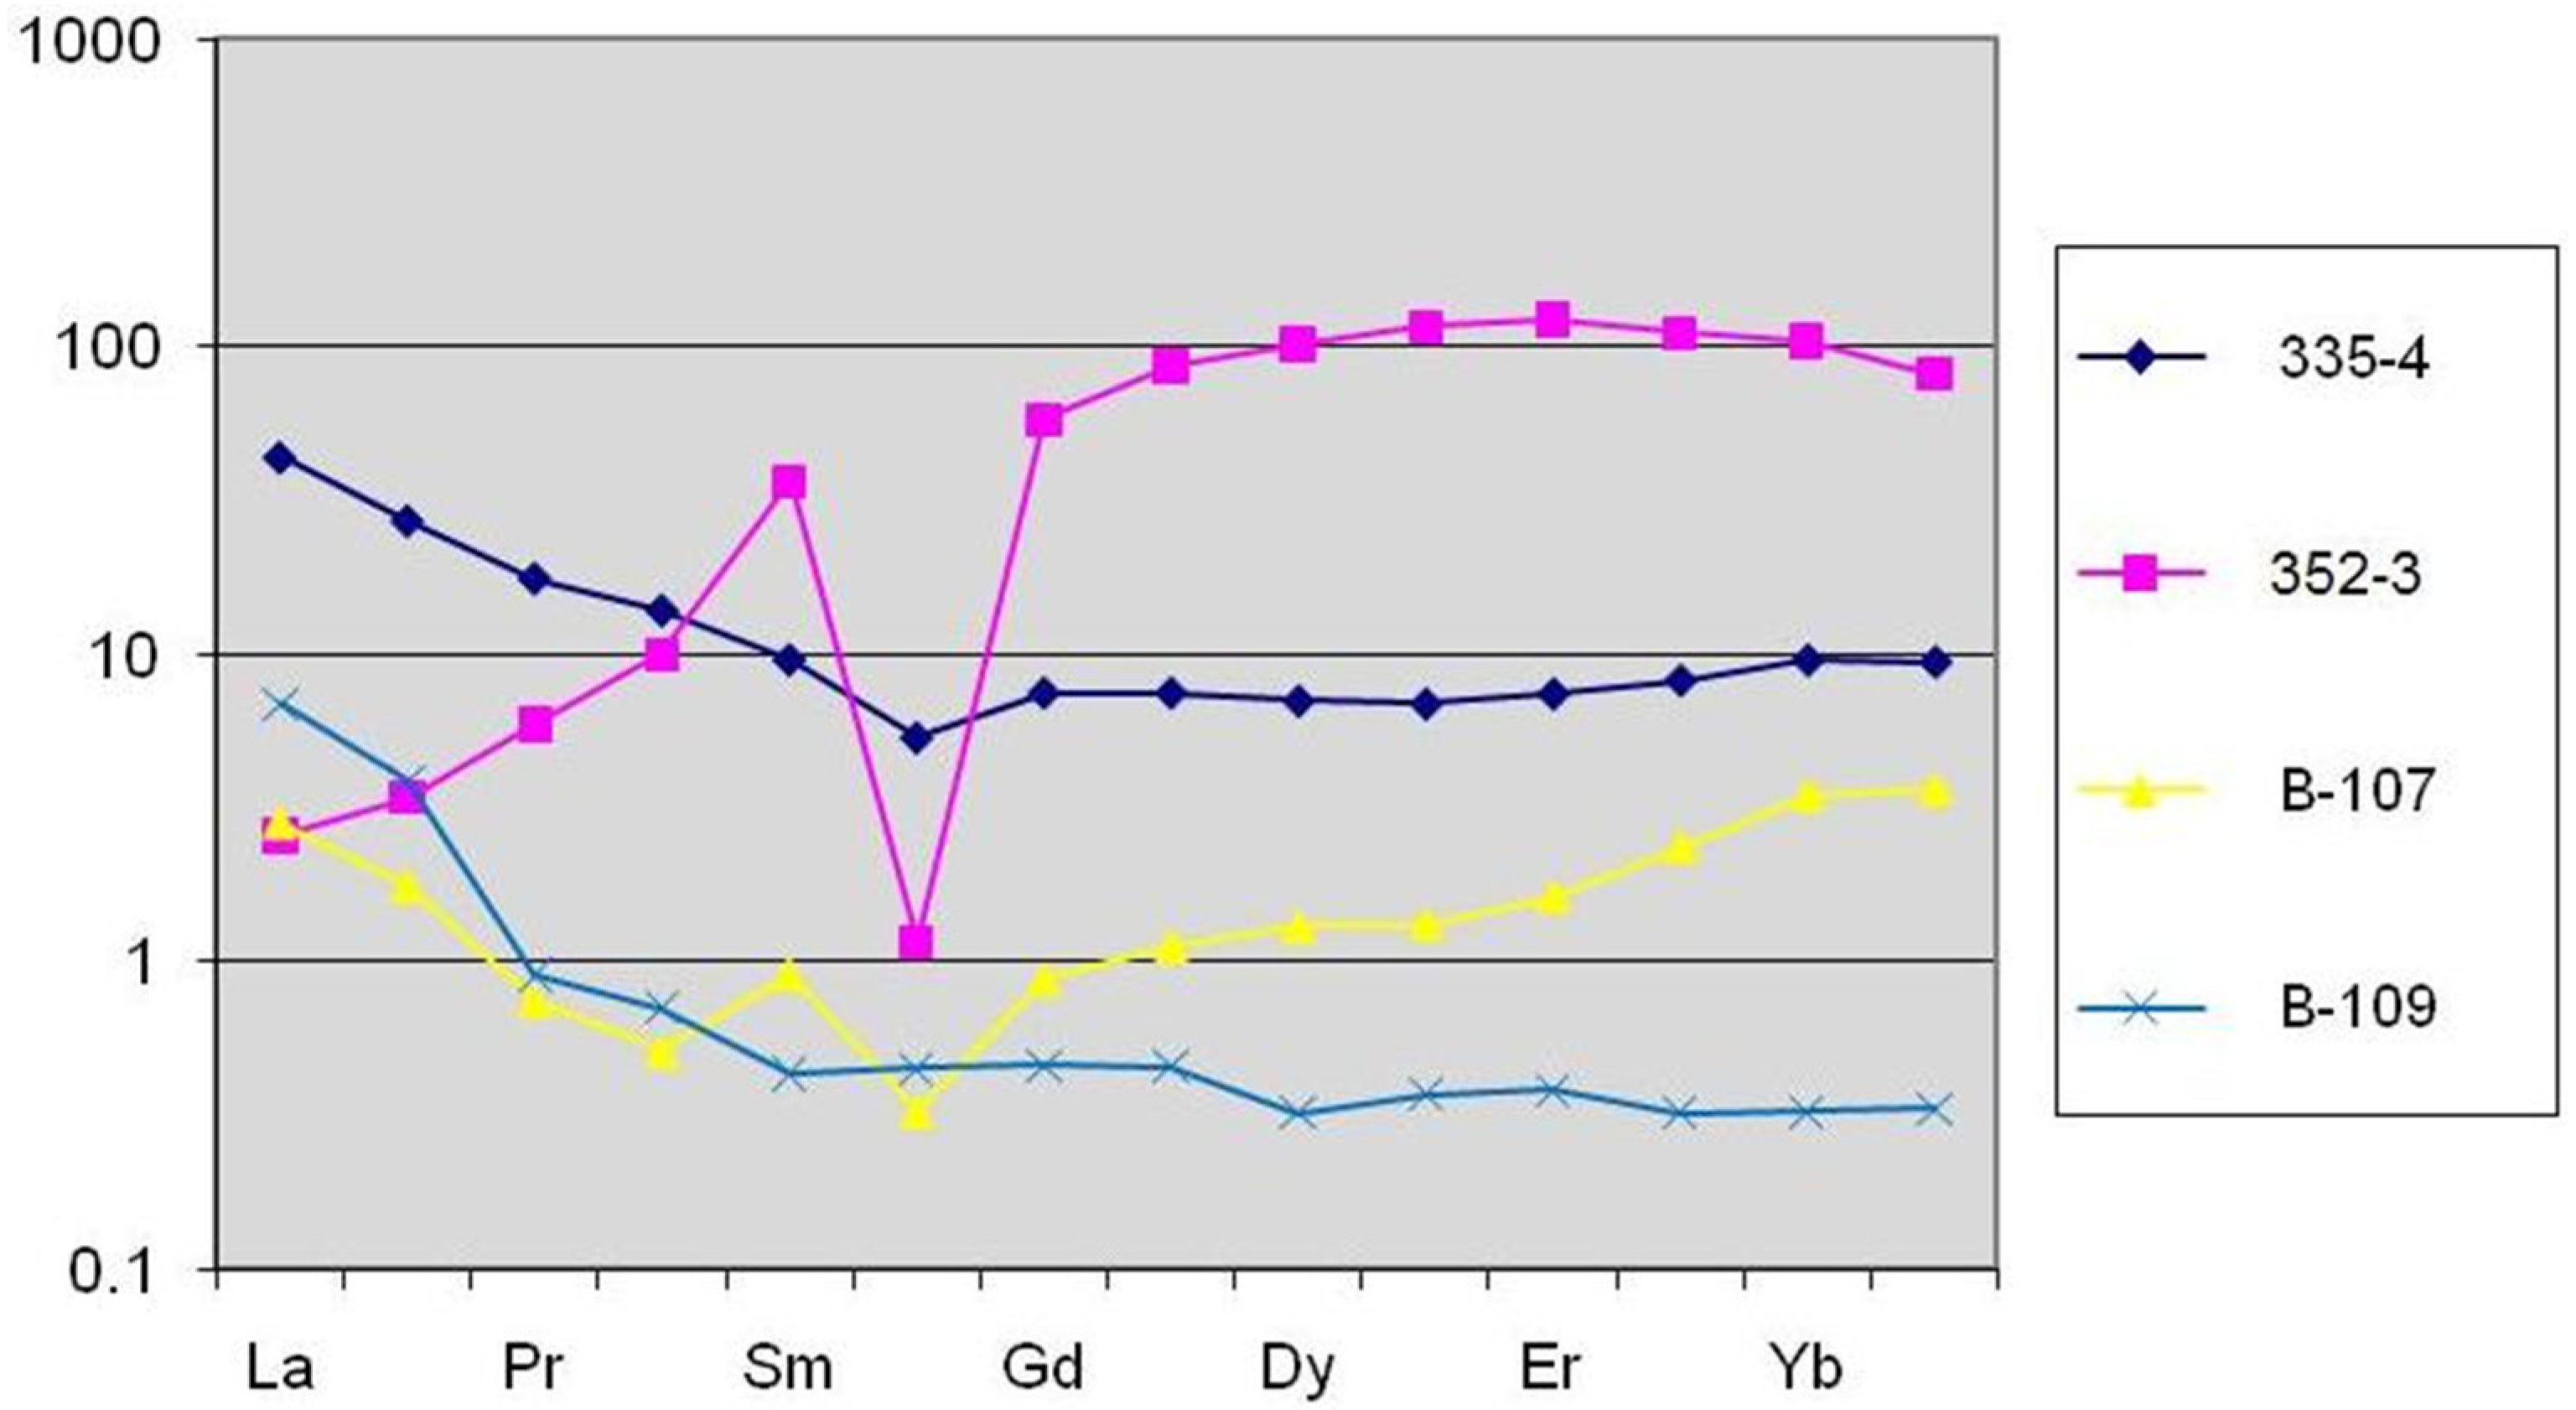
5.3. Fluorite Sm–Nd Geochronology

The sample of fluorite from the micaceous-fluorite ores analyzed by the Sm–Nd method showed a rarely observed large range of 147Sm/144Nd ratios, differing by more than a factor of six. The wide range of values allowed for a reliable age determination (Figure 9 and Table 3).
According to the results of the Sm–Nd isochron analysis of fluorites, the age of fluorite mineralization was 477 ± 9 Ma (MSWD = 0.48; εNd = −3.3) (Figure 9).
The REE patterns of the fluorites of the Voznesenskoe deposit (data are in Table 4) demonstrated various configurations, which are explained by different mineralization stages of fluorite formation, the composition of the fluids and the initial substrate. (Figure 10).
The fluorite samples 335-4 and B-109 that were enriched in ΣLREE (Table 4) with La/Yb = 6.3 and 29.6, respectively, formed in the early high-temperature (T) stage. Such features characterize early generation fluorites, which were deposited from acid magmatic fluids with high F activity. La/Ho ratios (26.7 and 77.6) in these fluorites indicated coeval precipitation in the LREE-enriched fluid phase. The high Sn content of 803 ppm in fluorite (sample 335-4) may also indicate its genetic relationship with igneous rocks because the Voznesensky granites associated with the fluorite mineralization contained high concentrations of Sn, Zn and Pb. The observed Y/Ho ratios (19.8–55.2) were typical of hydrothermal fluorites that were likely formed by magmatic fluids interacting with carbonate host rocks. The most REE-enriched (104.1 ppm) fluorite sample 352-3 also showed an enrichment in Y = 287 ppm (Table 4) and a decrease in LREE (Figure 10), which may be due to its recrystallization during the late stages of mineralization [47].

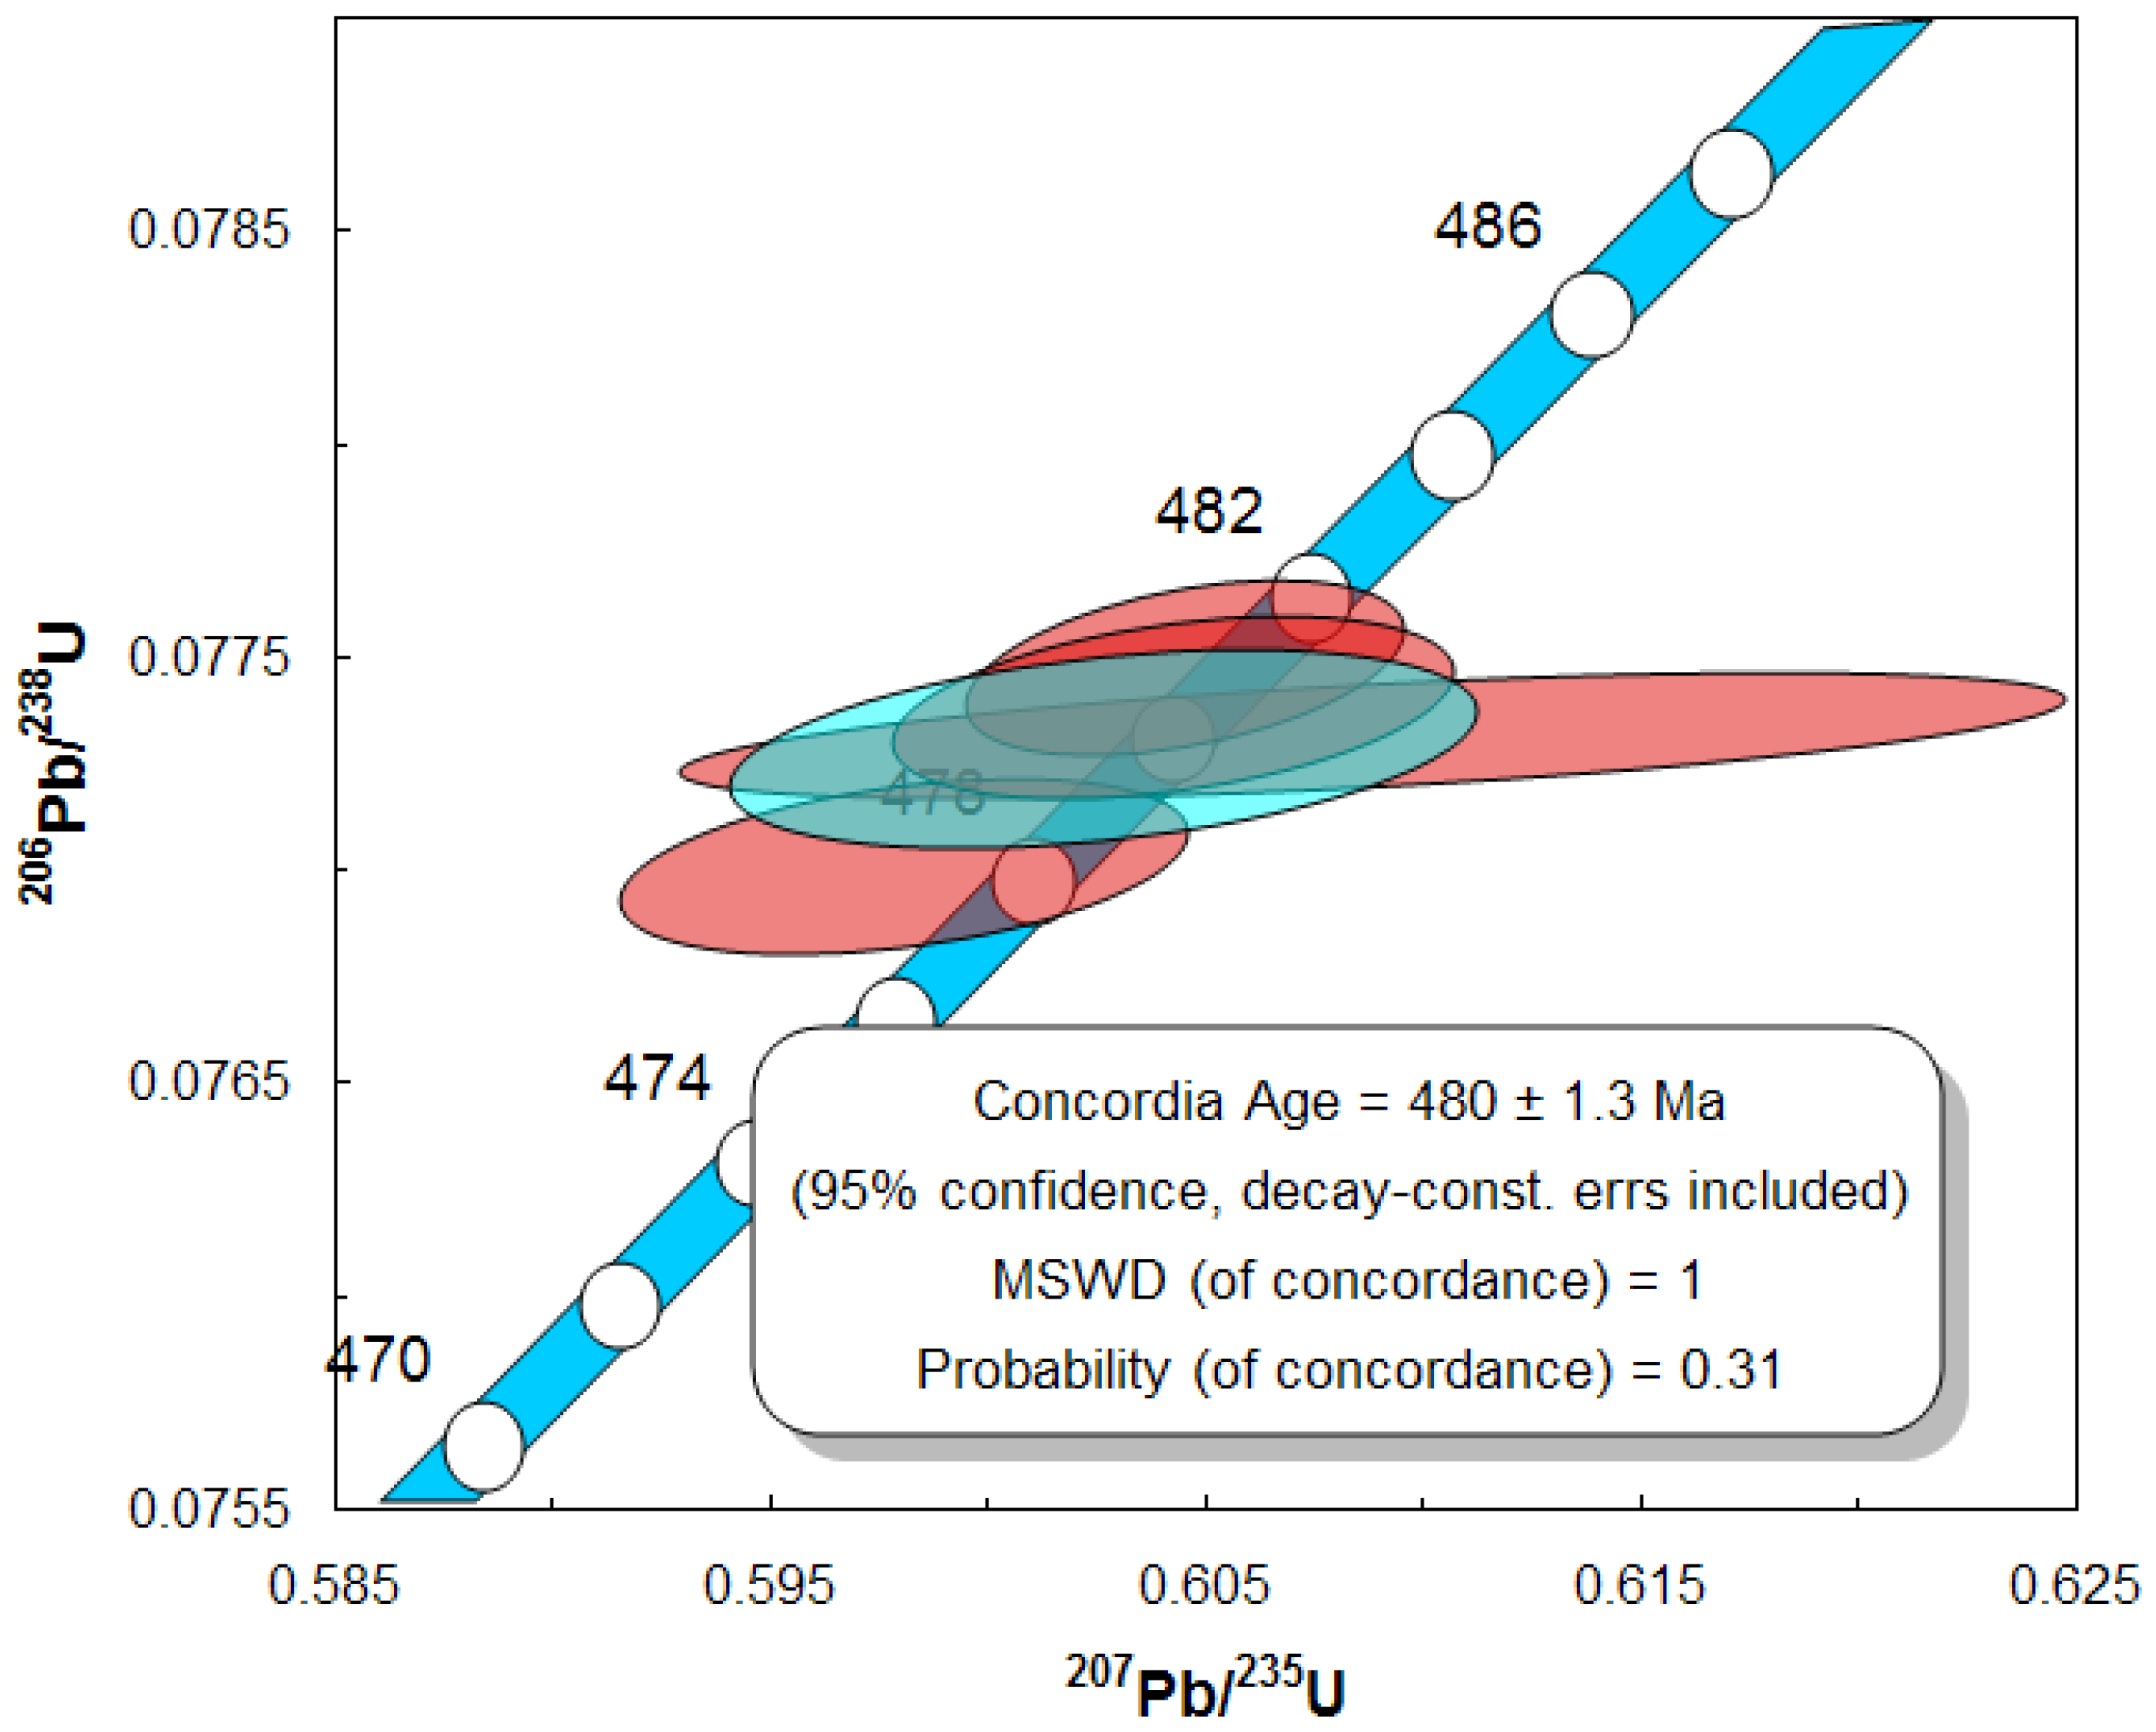
5.4. Cassiterite ID-TIMS U–Pb Geochronology

The U–Pb isotopic compositions of the DV-1 and 4088-112 (Yaroslavskoe deposit) and 4088-107 (Chapaevskoe deposit) cassiterite samples are listed in Table 5. Total Pb concentrations of the cassiterite varied between 0.27 and 1.88 ppm. The U concentration of the cassiterite was variable between 1.0 and 11.34 ppm.
As can be seen from the results of the isotopic analyses of three cassiterite samples, they had variable proportions of radiogenic Pb. Cassiterite 4088-112 had the highest 206Pb/204Pb ratios (649–917); in sample 4088-107 206Pb/204Pb, ratios varied between 49 and 136, and sample DV-1 had lower 206Pb/204Pb ratios (36–78). Analyses performed at IPGG on the SEM JSM-6510LA indicated that galena and lead containing bismuthine were present as inclusions in samples 4088-107 and DV-1. As noted by Li et al. [48], cassiterite from pegmatite, granite and greisen usually contains homogenized non-radiogenic lead. An appropriate correction for the isotopic composition of the initial common lead was very important for sample DV-1. As noted earlier [34,35], the correction for the initial lead calculated using the Stacey-Kramers model may have overestimated the U–Pb age of cassiterites. To calculate the common Pb-corrected 206Pb/238U and 207Pb/235U ratios for determining the age of cassiterite, we used the Total-Pb/U age isochron method [49] using measured 238U/206Pb, 207Pb/206Pb и 204Pb/206Pb. To calculate the U–Pb age of sample DV-1, we applied the results of experiments with the most severe conditions for a preliminary washing of cassiterite samples in HF + HNO3 and aqua regia. To calculate the initial Pb isotopic compositions, a 3D total isochron was used. The age value calculated with this correction for the Total-Pb/U age isochron turned out to be overestimated compared to the age of zircon from ore-forming biotite granites, although being slightly lower than the age calculated with the correction using the Stacey-Kramers common Pb evolution model for 480 Ma. Apparently, the isotopic composition of non-radiogenic lead in this cassiterite sample was not uniform, which was a necessary condition for using the Total-Pb/U isochronous age method. Tapster and Bright pointed out this possibility for their cassiterite [34].
Along with cassiterite, pyrite was isolated from sample DV-1; its isotopic composition was taken as the isotopic composition of the initial lead for making the common Pb correction. For samples 4088-107 and 4088-112, there was no significant difference in the calculated U–Pb ratios depending on the selected common Pb correction. For sample DV-1, the use of a correction for the isotopic composition of lead in pyrite turned out to be the most acceptable and produced concordant U–Pb ages (Figure 11 and Figure 12). For the four concordant analyzes of the DV-1 sample, the calculated age was 480 ± 1.3 Ma (MSWD = 1) (Figure 12).
The age at the upper intersection of the combined discordia calculated from three samples was 478 ± 8 Ma (MSWD = 4.9) (Figure 11).
In addition to calculating the U–Pb age using a concordia approach, the lead isotopic composition data for three cassiterite samples were presented in the 206Pb/204Pb-207Pb/204Pb coordinates (Figure 13). For this isochron, the results of all analyses were used, including the isotopic compositions of lead in pyrite and in one leachate collected during the acid treatment of DV-1 cassiterite. The resulting Pb–Pb isochron age was 480 ± 4 Ma (MSWD = 5.6; n = 18).

6. Discussion

According to our data, the ages of zircons from biotite leucogranites (sample 108-B) and biotite granites (sample DV-1) were overlapping within their errors and equal to 480 ± 7 Ma and 478 ± 4 Ma, respectively. According to the results of the Sm–Nd dating of fluorites from micaceous-fluorite ores of the Voznesenskoe deposit, the age of fluorite mineralization was 477 ± 9 Ma. The most precise U–Pb age of cassiterite for sample DV-1 was 480 ± 1.4 Ma, the integrated Pb–Pb age for three cassiterite samples was 480 ± 4 Ma. This confirmed a direct genetic relationship between the fluorite mineralization of the Voznesenskoe deposit and the tin mineralization of the Yaroslavskoe and Chapaevskoe deposits with the formation of granites of the Voznesensky complex.
Based on the age of cassiterites from the deposits associated with the granites of the Yaroslavsky and Chikhezsky massifs, and considering the similarity of their composition, it can be suggested that these biotite granites were cogenetic with the granites of the Voznesensky massif.
New data significantly clarify the sequence of the development of ore-generating magmatic complexes and the formation processes of fluorite and the rare-metal mineralization of the Voznesensky ore district.
The age of 480 ± 7 Ma, obtained by U–Pb SHRIMP zircon dating of biotite granites and leucogranites, which was older than previously thought (450–460 Ma), allowed us to eliminate the existing contradiction and substantiated the sequence of the development of intrusive phases from biotite leucogranites to biotite–protholithionite granites.
Earlier, based on geochronological data obtained in the 1980s–1990s of the last century, it was believed that the formation of granite-related mineralization followed immediately after the consolidation of the granite massifs. At the same time, it was assumed that the rare-metal–fluorite ores with the determined age of 428–370 Ma and associated with the process of late greisenization, were formed with a significant time gap in the host rocks in a zone outside the Voznesensky massif [8,9,11,12].
The new geochronologic results presented in this paper confirmed the synchronism of fluorite and tin ores of the Voznesensky ore district and granites of the Voznesensky complex and made it possible to distinguish the magmatogenic stage of the formation of ore associations. Based on our data, it was revealed that there was no significant time gap between the time of granite formation and the ore formation process associated with greisenization.
It should be noted that the processes at about 480 Ma were noted in recent works [50,51,52] for various rocks of the Khanka Terrane. For example, for the Artyomovsk massif in the southeastern part of the Khanka terrane, the LA-ICP-MS method for zircon yielded a U–Pb age of 482 ± 6 Ma [52].
Of interest is the difference in the dating result obtained in this work for the granites of the Voznesensky complex (480 Ma) and the results of other authors reporting an age of about 467–450 Ma [6,9,13,15]. The wide scatter of Rb–Sr isotope data and, sometimes, large errors in age determinations obtained by previous researchers could be associated with multistage postmagmatic evolution and the heterogeneity of granite stocks. A significant portion of the early dating results was obtained by Rb–Sr and Sm–Nd methods from strongly altered and weathered samples, as it was pointed out in [16]. In addition, it is known that the granites of the Voznesensky complex experienced multiple superimposed processes of greisenization and albitization. It is possible that such altered granite samples were analyzed earlier. For such objects, the Rb–Sr and Sm–Nd dating methods should be used only after sampling primary unaltered mineral phases.
The results obtained by Sato et al. [16] by the CHIME method of zircon and monazite samples of the Voznesensky granites indicated the presence of two phases of different ages within the grains of zircons and monazites of about 450 and 250 Ma. Ages of about 250 Ma were obtained along the edges and cracks of zircon grains, which may indicate a secondary from the Permian to Early Triassic thermal event. It is possible that the intrusion of 250–260 Ma granites of the Grodekovsky batholith, located to the west of VOD, thermally influenced the Ordovician granites of the Voznesensky ore district. The influence of this intrusion may have led to changes in the outer rims of the studied zircons, their enrichment in uranium and thorium, loss of lead and, consequently, decrease in their age. In order to understand whether the outer rims of zircons may have formed as a result of the Permian–Triassic event, further research will be conducted.
The dating of the granites of the Voznesensky complex and other granite complexes of the Khanka massif requires a geochronological study at a new modern level. Considering the complexity of the internal structure of zircons, the presence of a post magmatic impact on the granites of the Voznesensky complex, it is desirable to use high spatial resolution in situ U–Pb SIMS or LA-ICP-MS dating methods in order to avoid mixing zircon material of different ages and the dating of intermediate, partially recrystallized phases.
Cassiterite is the main mineral in tin ore or a minor one in polymetallic ores and an accessory mineral in rare-metal granites. The developed method for the chemical decomposition of cassiterite, which previously caused difficulties due to the high resistance of this mineral to the action of acids, made it possible to directly determine the U–Pb age of cassiterite-bearing ore mineralization using the high-precision ID-TIMS technique.

7. Conclusions

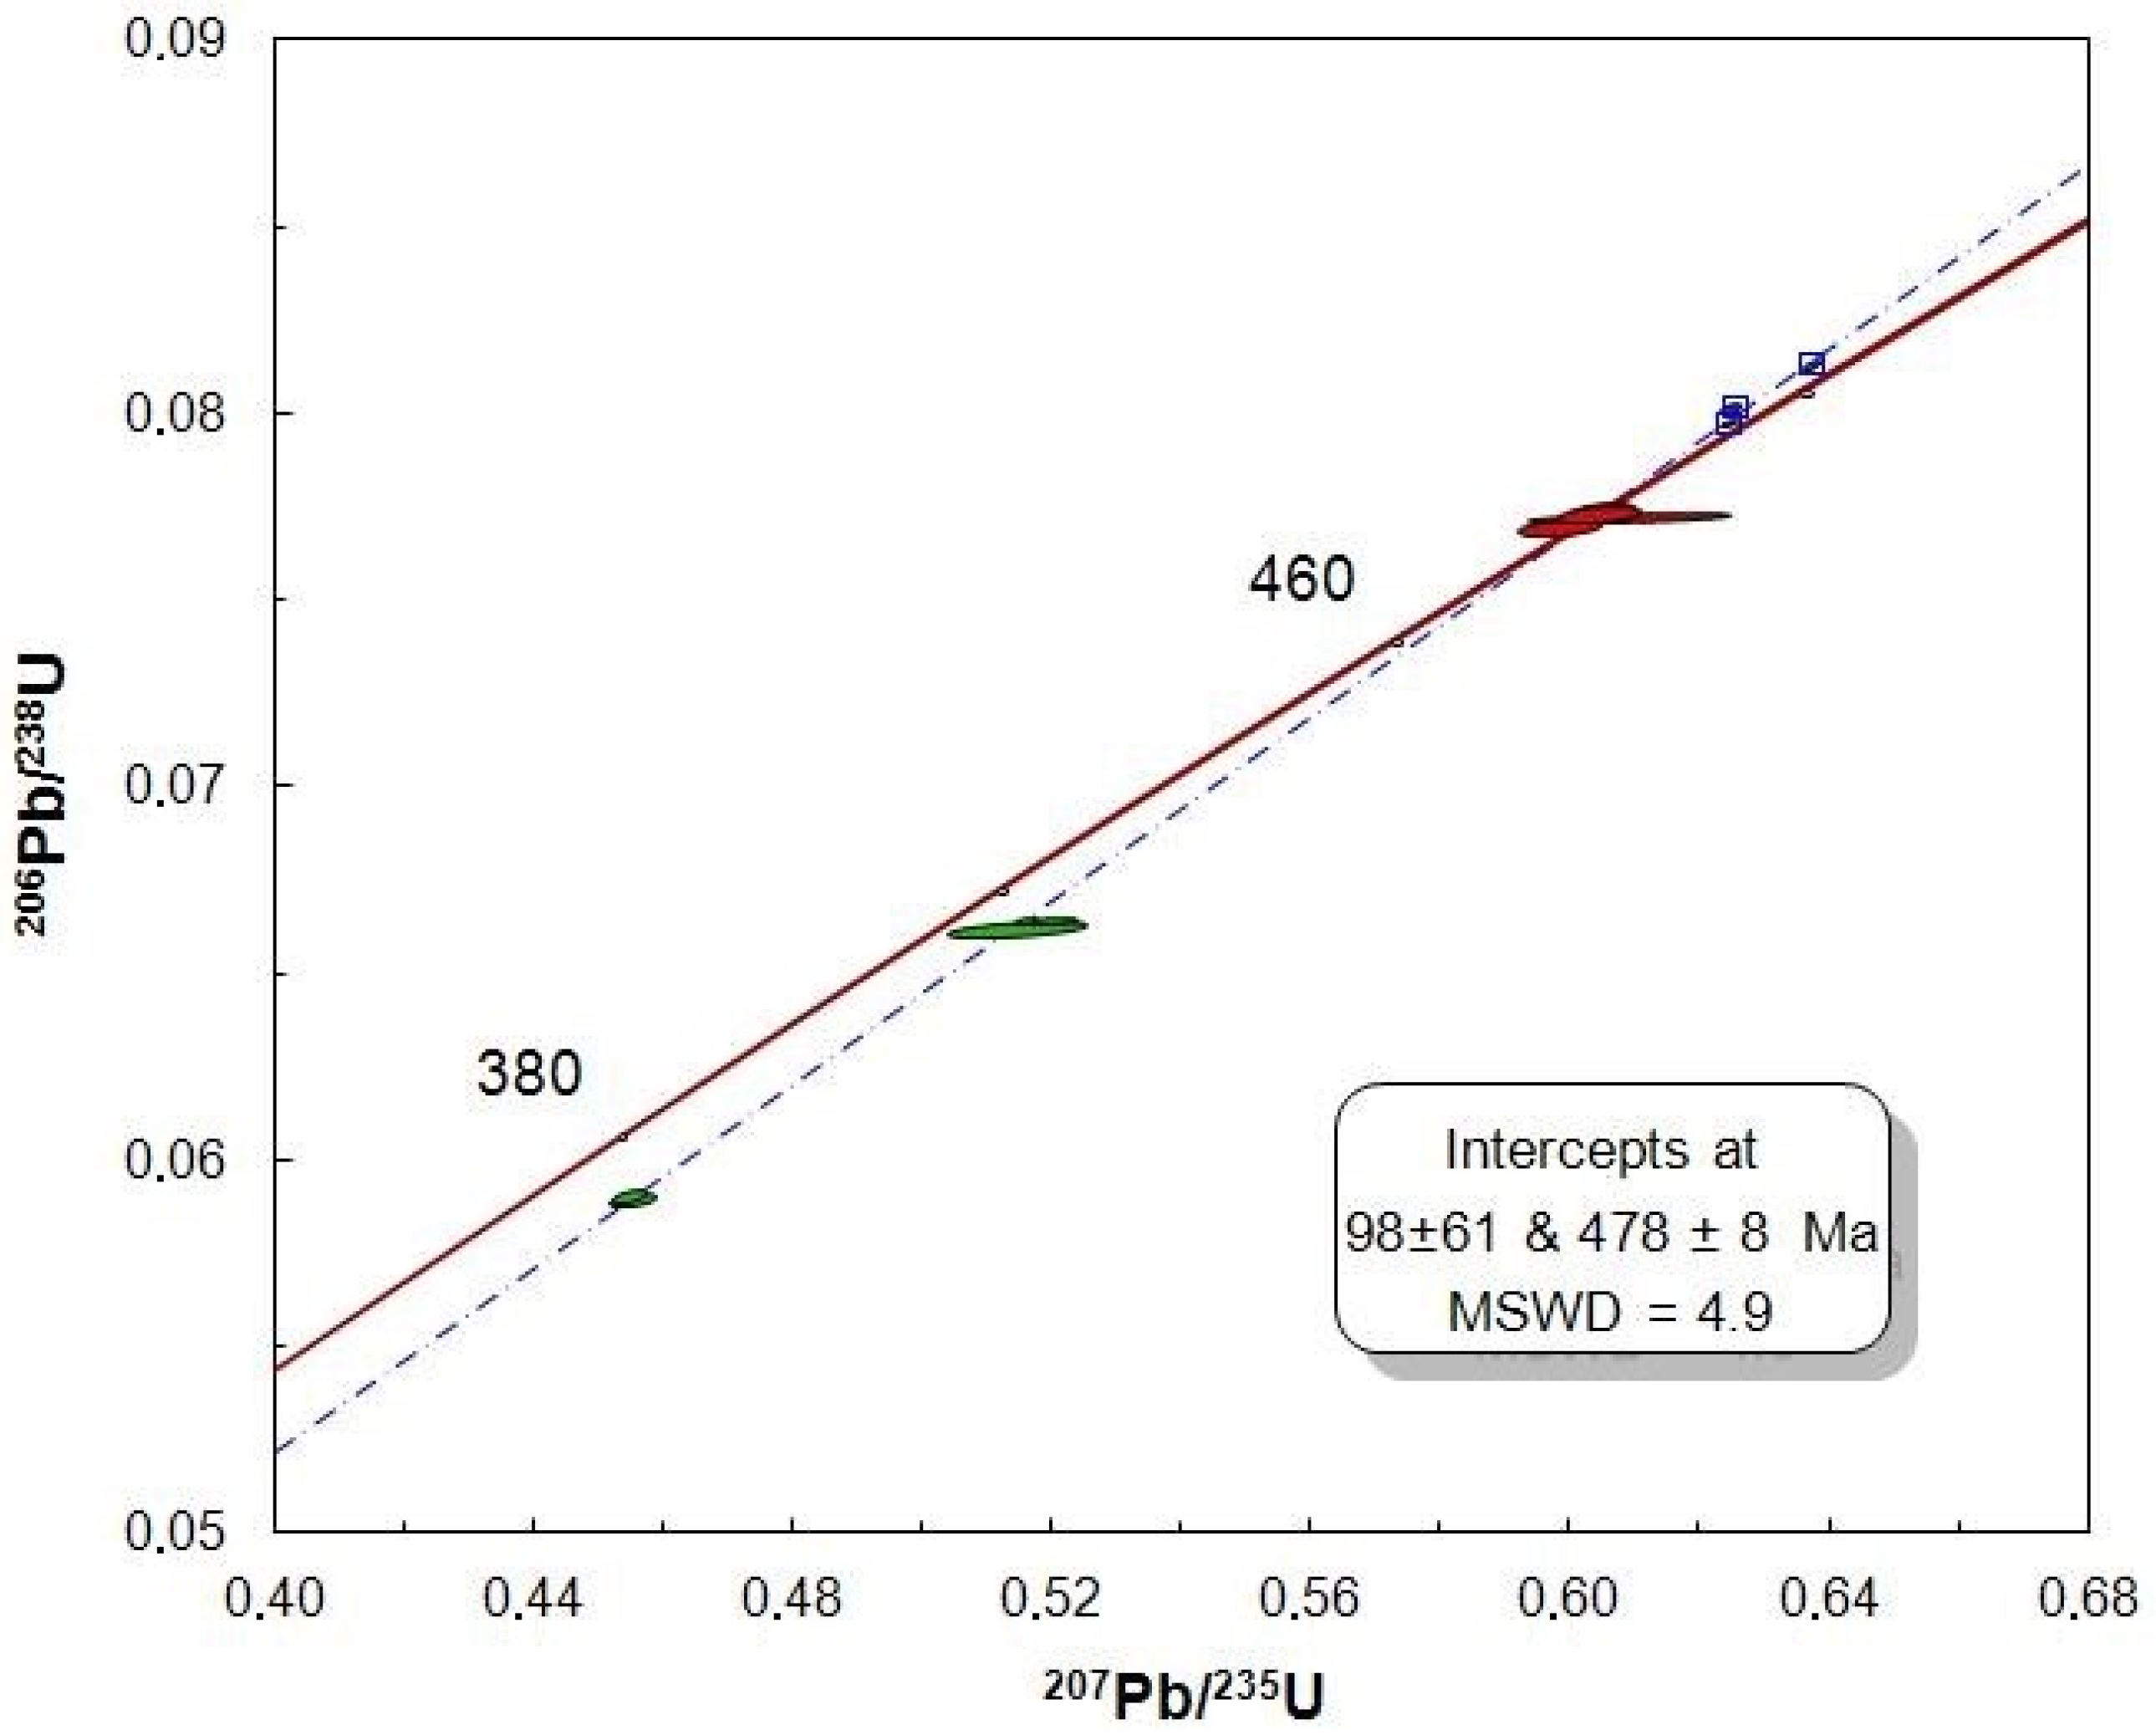
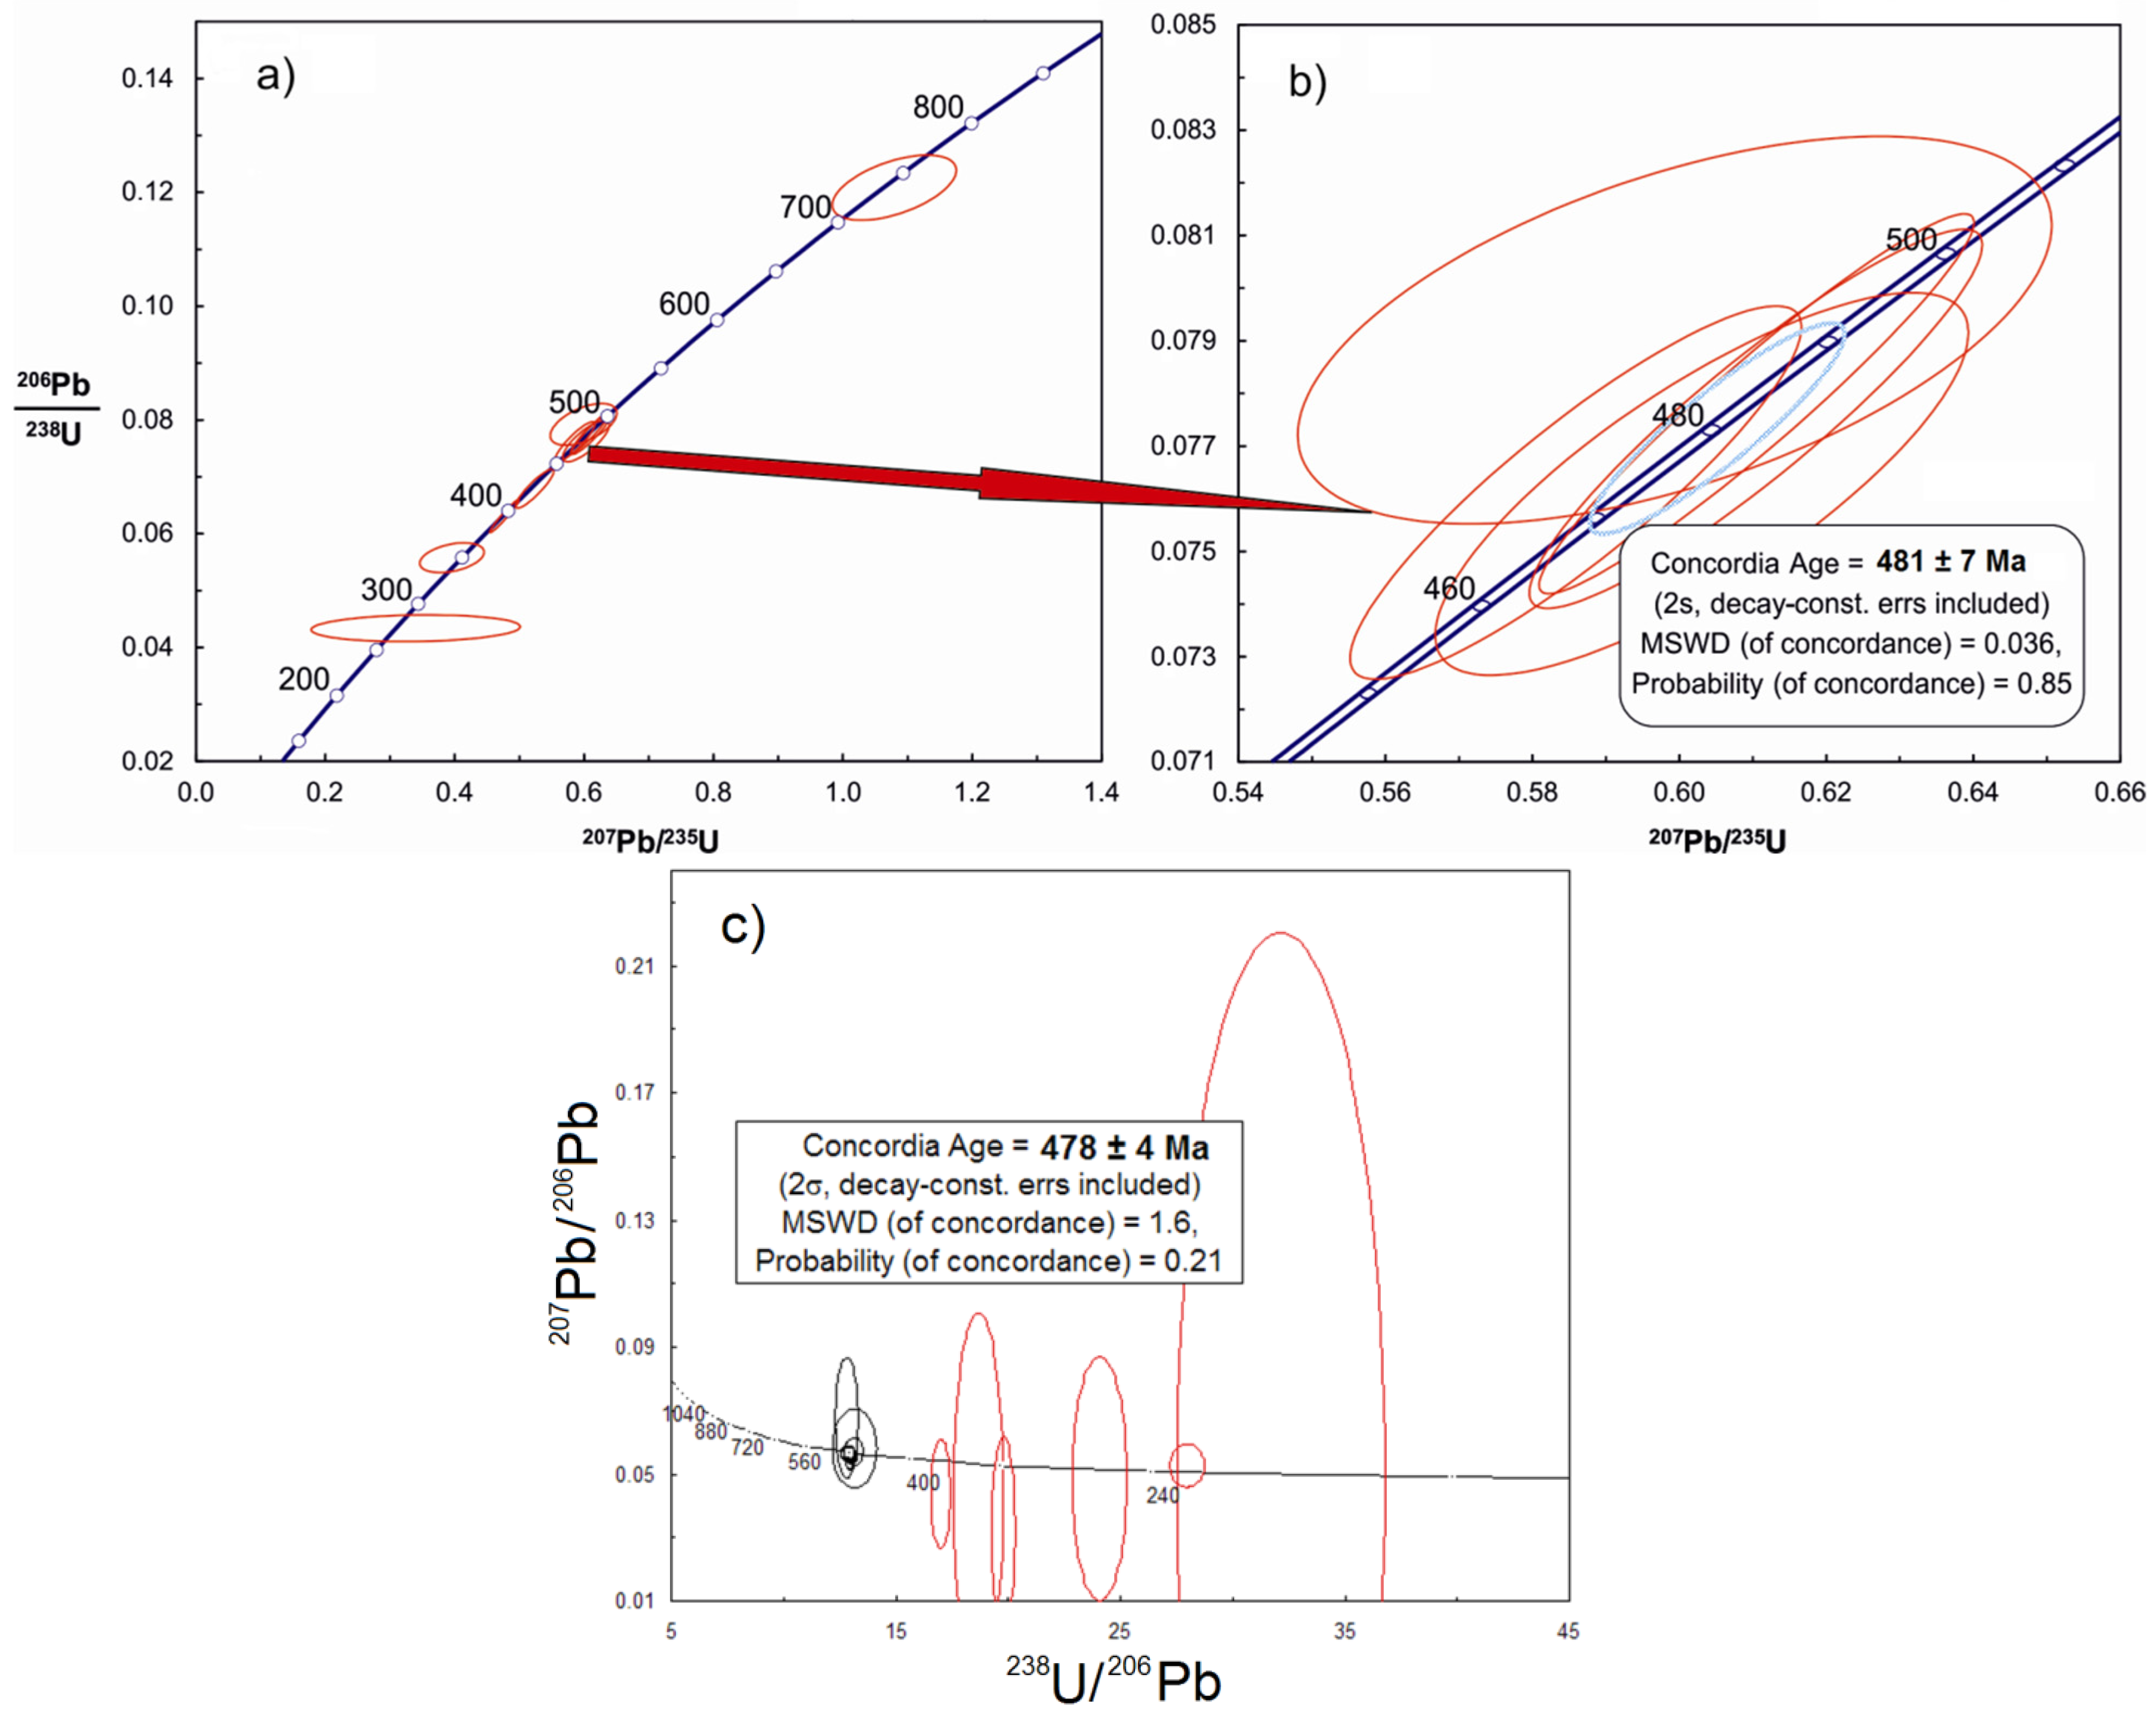
  • Overlapping within their errors, concordant U–Pb ages of two zircon samples were established at 478 ± 4 Ma and 481 ± 7 Ma of biotite leucogranites, which should be considered as the age of the magmatic crystallization of granites of the Voznesensky complex.
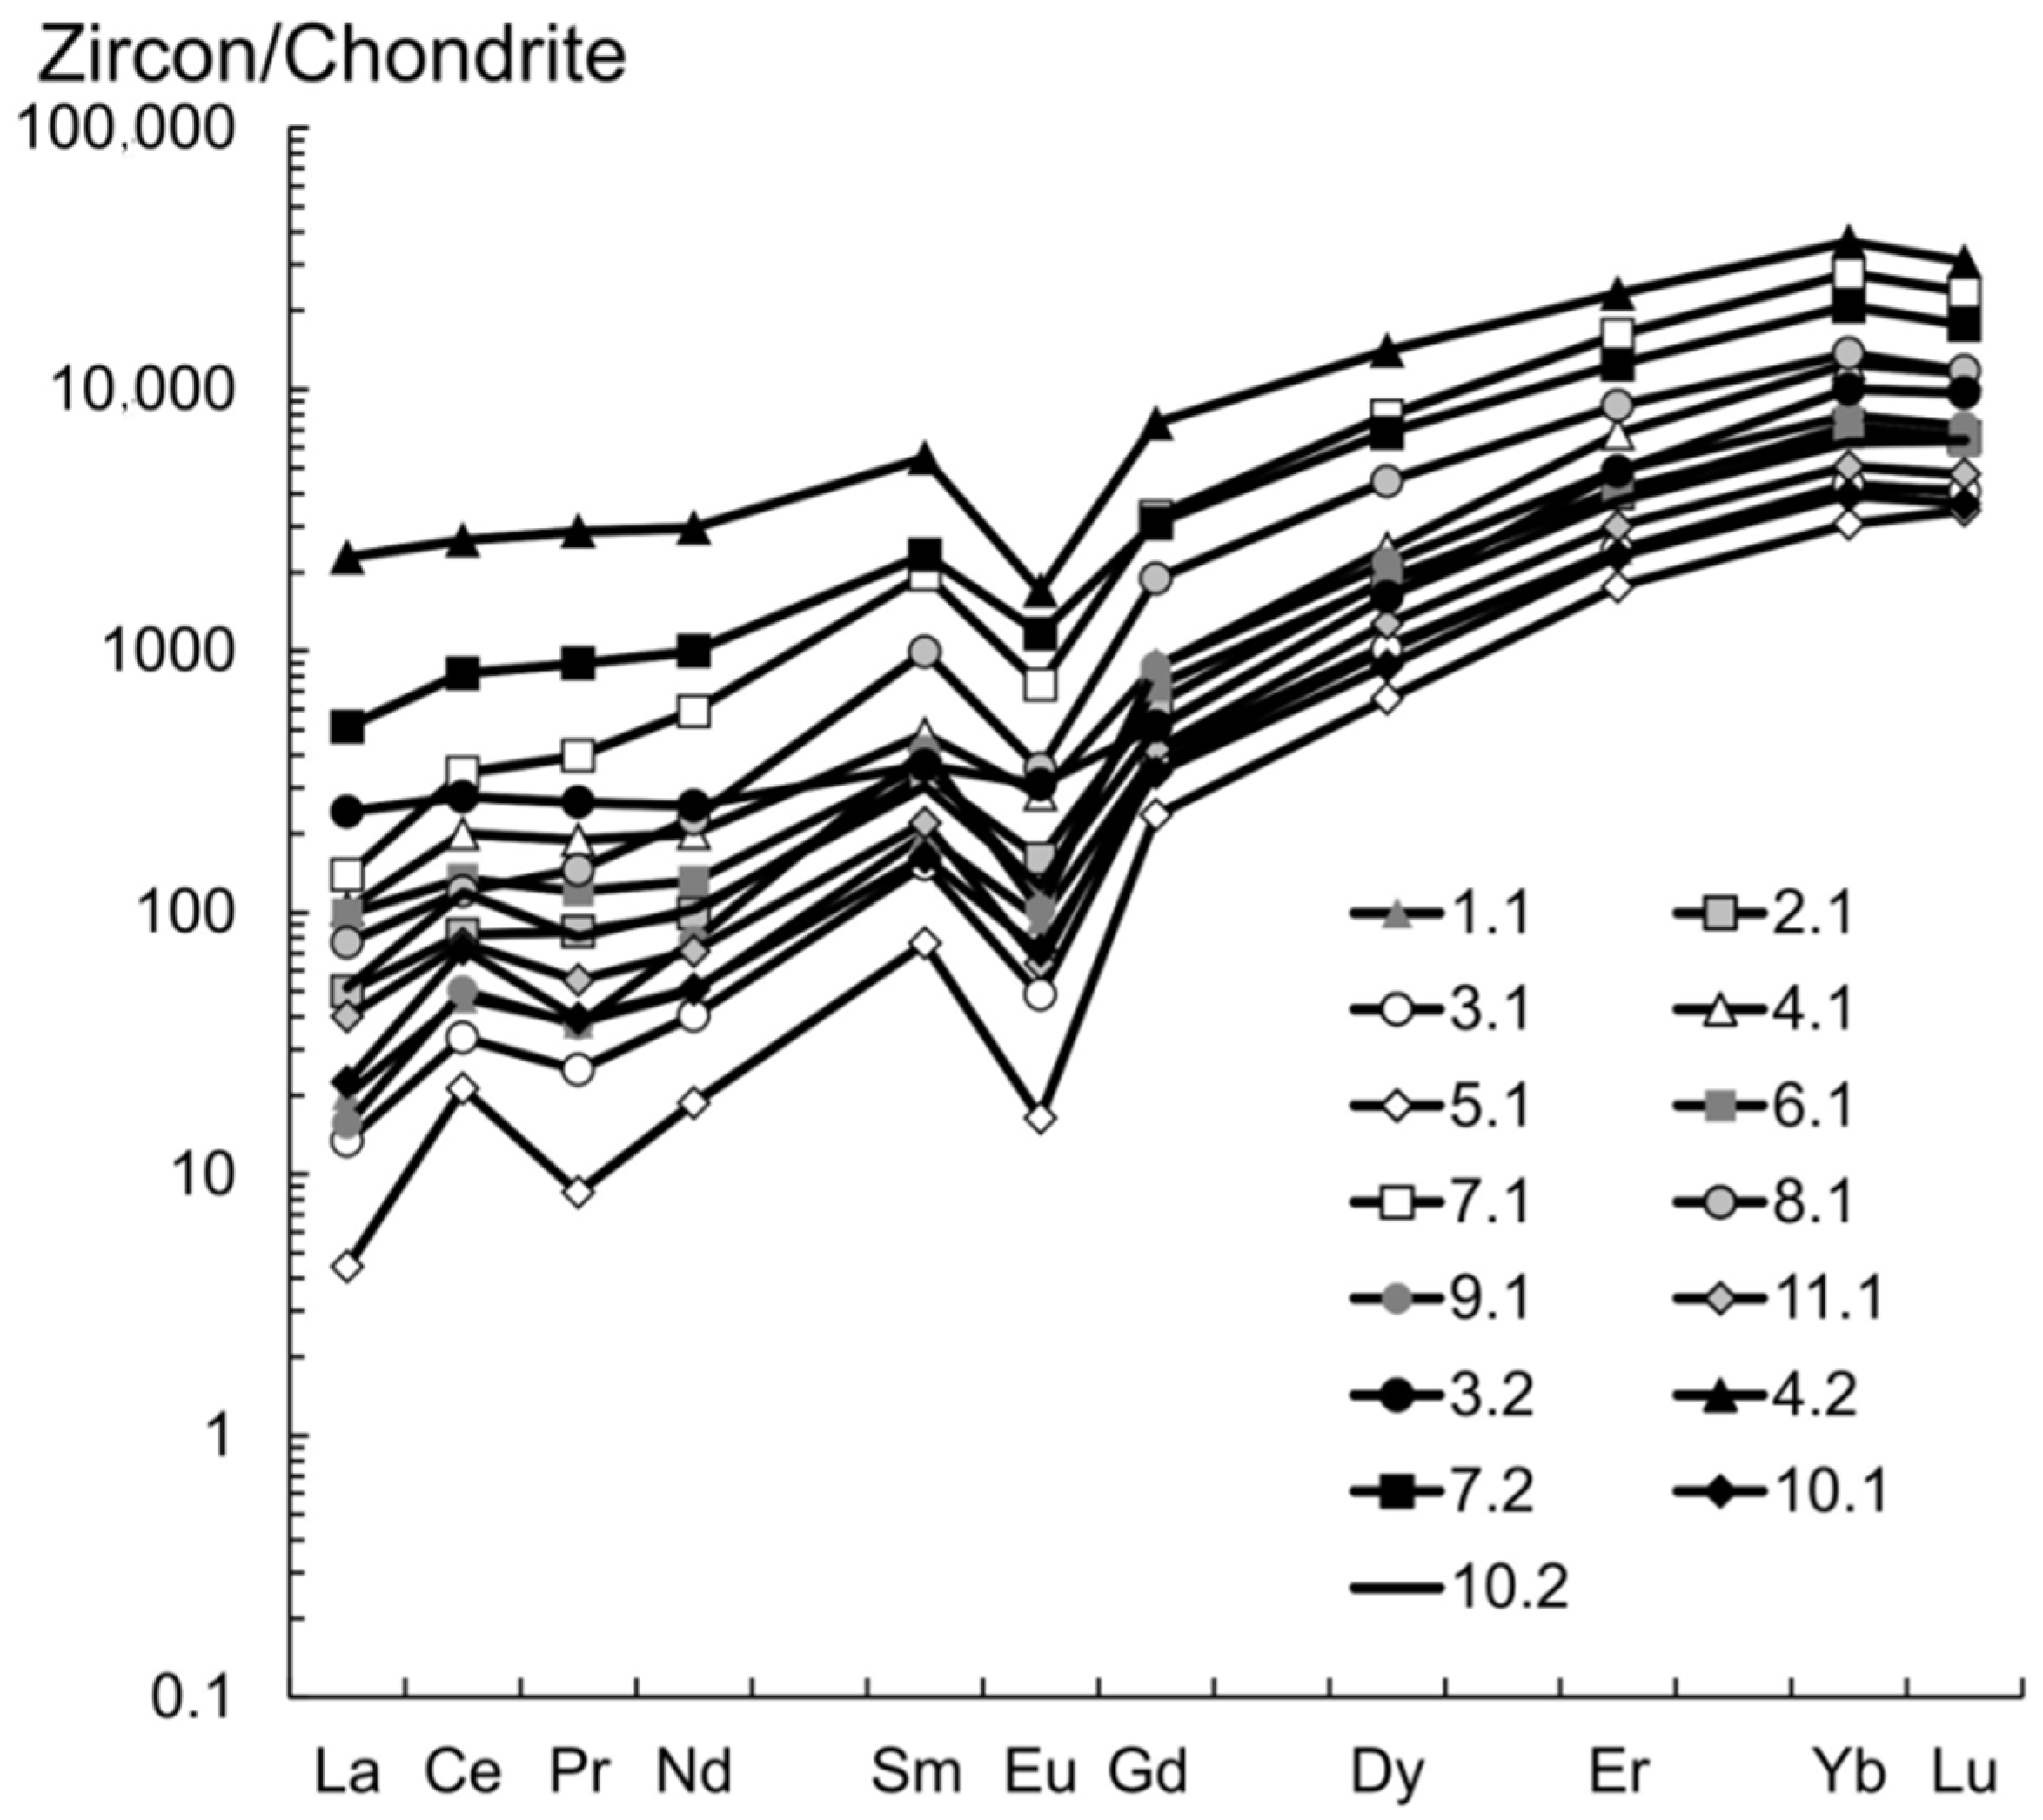
  • The composition of the studied zircon, on the one hand, demonstrated the typical features of magmatic zircon in granitoids; on the other hand, it had the characteristic features of zircon that interacted with fluids at the late/postmagmatic stage.
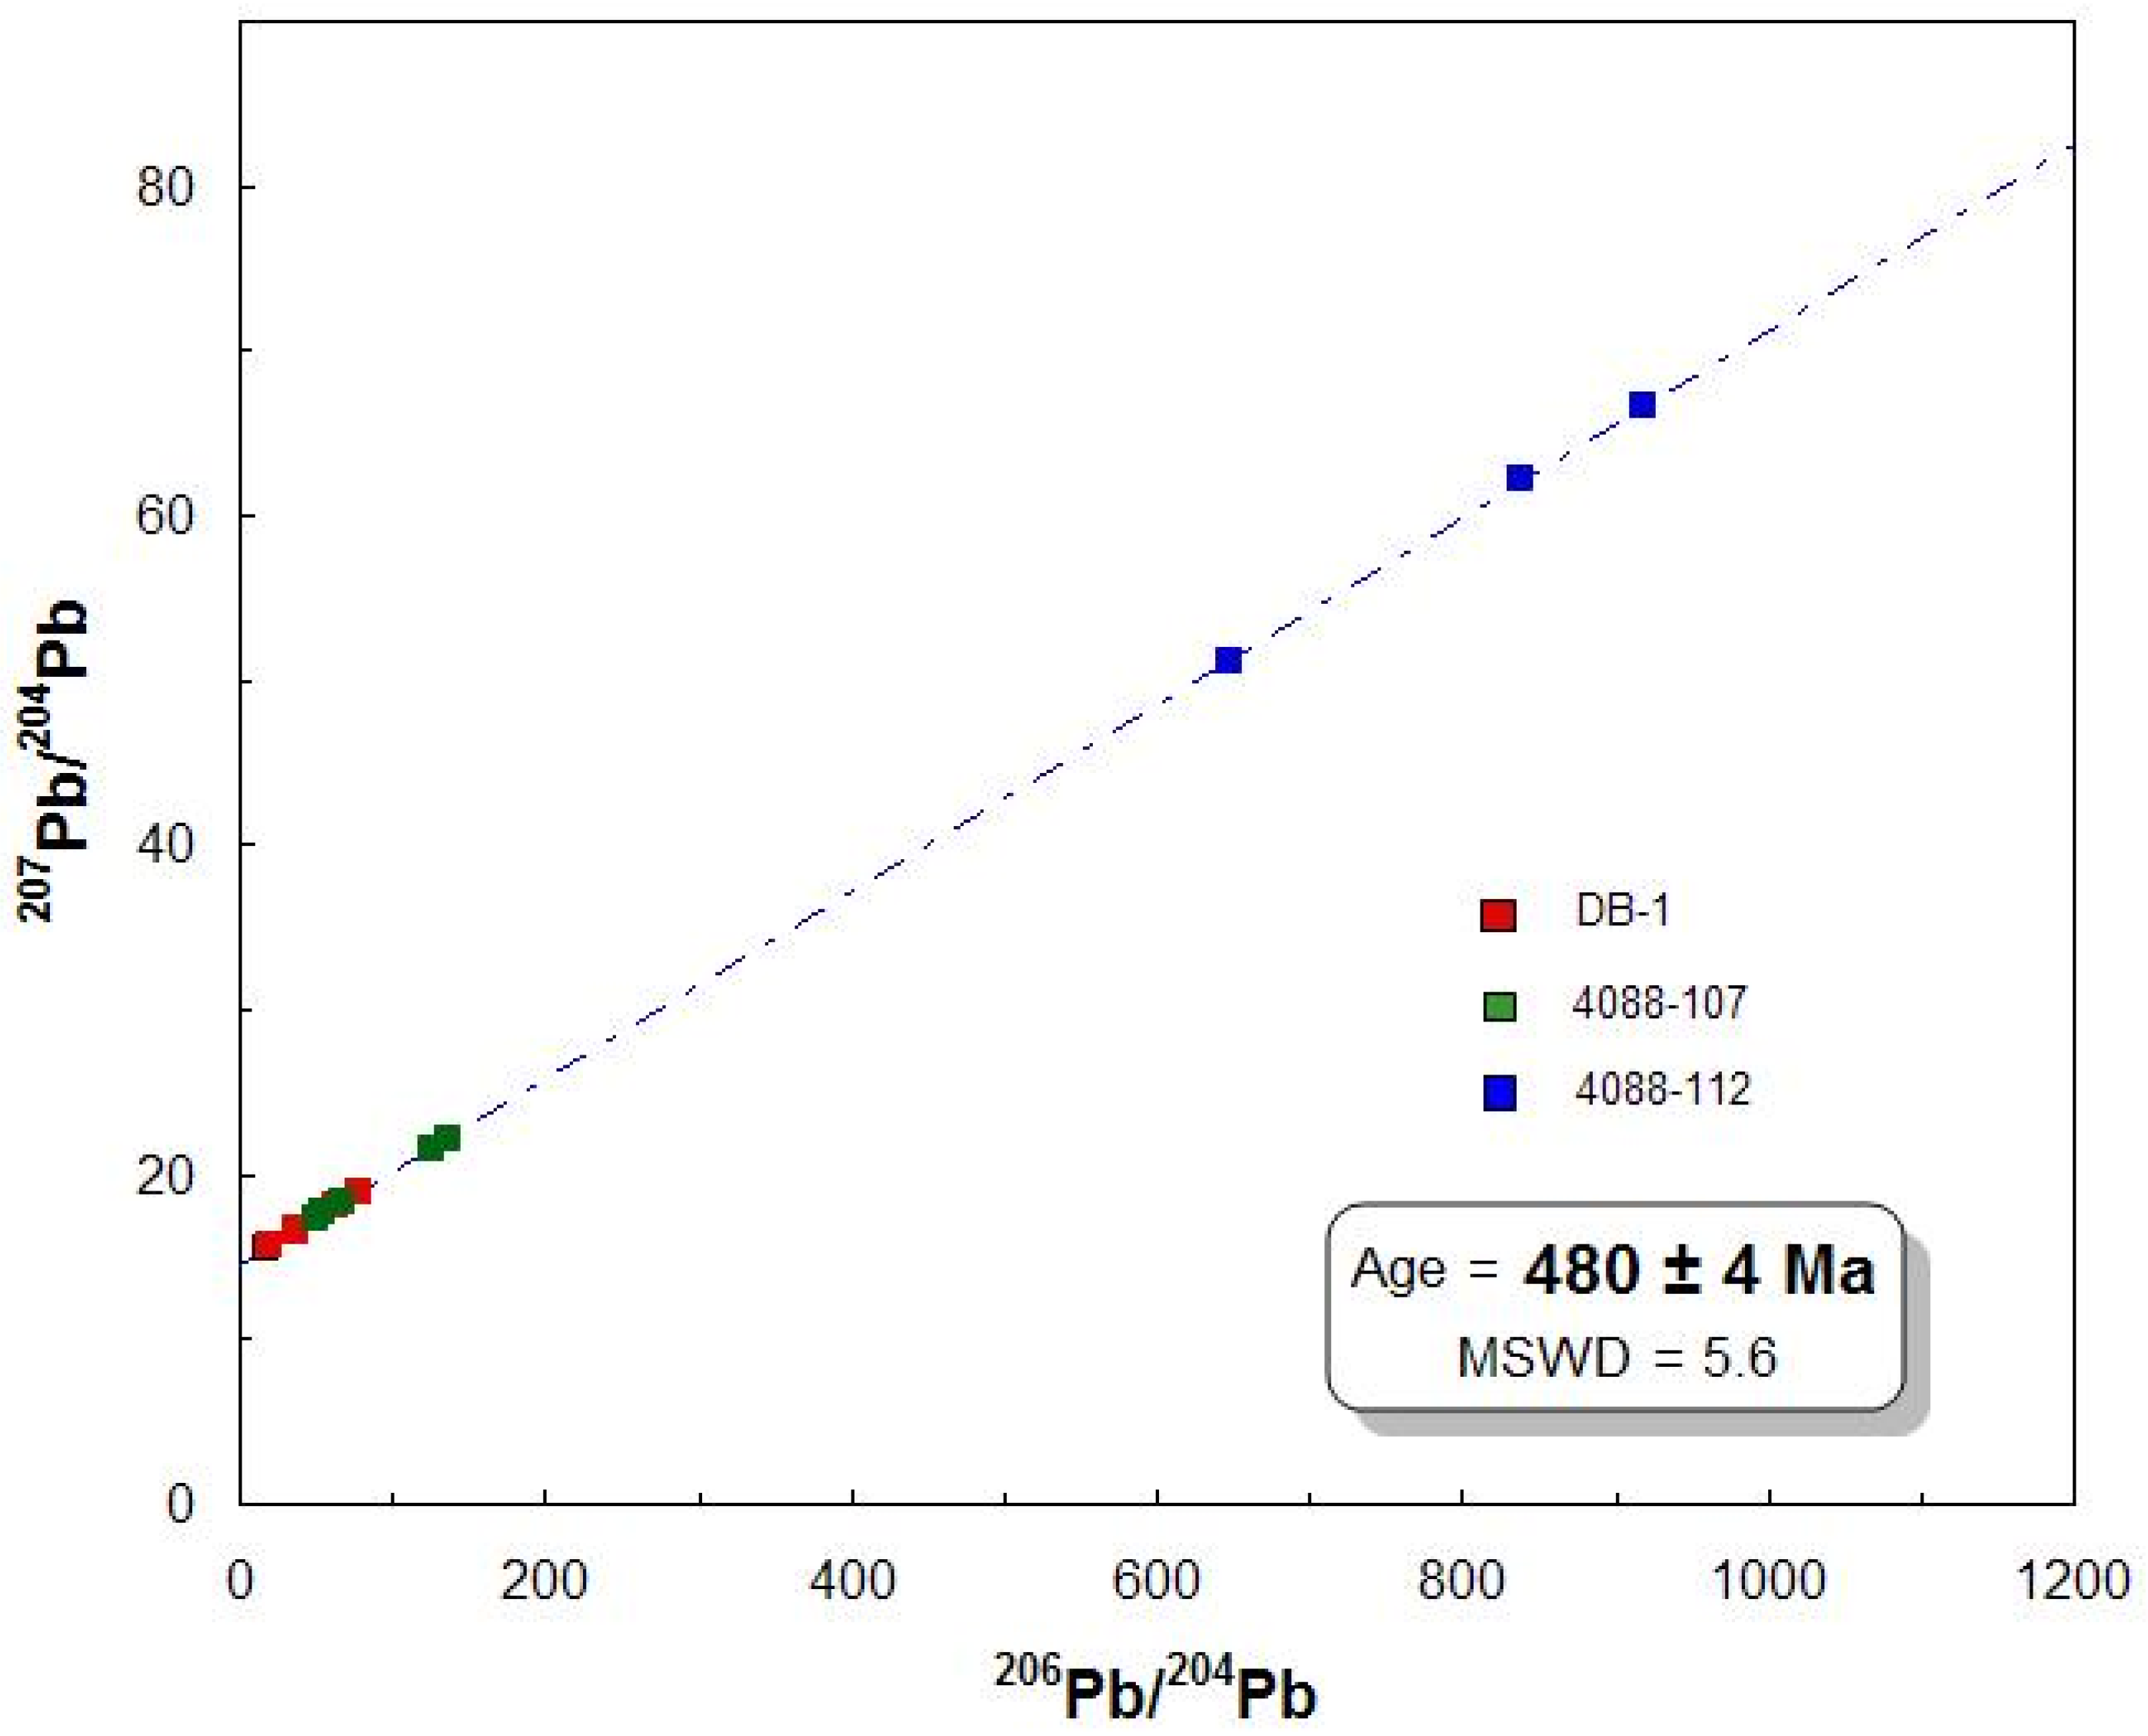
  • According to the results of the Sm–Nd isochron analysis of fluorites, the age of the rare-metal–fluorite mineralization of the Voznesenskoe deposit was established as 477 ± 9 Ma. Based on the results of the U–Pb ID-TIMS isotope dating of cassiterites, the age of the tin mineralization of the Yaroslavskoe and Chapaevskoe deposits was equal to 480 ± 4 Ma. These results supported the direct genetic and age relationship of ore formation within the Voznesensky ore district with early Ordovician granite magmatism.

Author Contributions

Conceptualization, N.G.R. and D.A.L.; methodology, N.G.R. and S.A.S.; software, D.A.L.; validation, N.G.R., S.G.S. and S.A.S.; formal analysis, N.G.R. and S.G.S.; investigation, N.G.R., S.G.S. and S.A.S.; resources, N.G.R. and D.A.L.; data curation, S.A.S.; writing—original draft preparation A.A.A., N.G.R., D.A.L. and S.G.S.; writing—review and editing, N.G.R., A.A.A., S.G.S. and S.A.S.; visualization, N.G.R., A.A.A., S.G.S. and D.A.L.; supervision, N.G.R. and S.A.S.; project administration, S.A.S. and N.G.R.; funding acquisition, N.G.R. and D.A.L., S.G.S. All authors have read and agreed to the published version of the manuscript.

Funding

This study was supported by the Russian Foundation of Basic Research (RFBR) (no. 19-05-00223), a State contract of the Institute of Precambrian Geology and Geochronology of Russian Academy of Sciences (no. FMNU-2019-0002) and a State contract of VSEGEI (no. AL-02-06/35).

Data Availability Statement

Data is contained within the article.

Acknowledgments

We gratefully acknowledge A.M. Larin (IPGG RAS) for the valuable advice and providing a constructive and thoughtful review of this manuscript. We thank O. Galankina of the IPGG RAS for the analysis performed on the SEM JSM-6510LA and D.V. Androsov for the provided sample of cassiterite DV-1.

Conflicts of Interest

The authors declare no conflict of interest.

References

  1. Khanchuk, A.I.; Ratkin, V.V.; Ryazantseva, M.D.; Golozubov, V.V.; Gonokhova, N.G. Geology and Mineral Deposits of Primorsky Krai (Territory); Dalnauka: Vladivostok, Russia, 1996; p. 61. (In Russian) [Google Scholar]
  2. Nedra. Genetic Types of Hydrothermal Deposits of Beryllium; Ginzburg, A.I., Ed.; Nedra: Moscow, Russia, 1975; p. 247. (In Russian) [Google Scholar]
  3. Govorov, I.N. Geokhimiya Rudnykh Raionov Primor’ya (Geochemistry of ore Districts in Primorye); Nauka: Moscow, Russia, 1977; p. 250. (In Russian) [Google Scholar]
  4. Govorov, I.N.; Blagodareva, N.S.; Zhuravlev, D.Z. Petrogenesis of fluorite deposits of the Voznesenovsky ore region (Primorye) according to the Rb-Sr isotopic data of igneous and metasomatic rocks. Pac. Geol. 1997, 16, 60–69. [Google Scholar]
  5. Rub, A.K.; Rub, M.G. Rare earth elements of igneous rocks in some regions of the Far East. Acad. Sci. USSR Ser. Geol. 1989, 2, 62–72. [Google Scholar]
  6. Rub, M.G.; Rub, A.K. Petrology of rare-metal granites from the Voznesenk ore-bearing area, Primor’e, Russia. Petrology 1994, 2, 43–67. [Google Scholar]
  7. Rub, A.K.; Rub, M.G. Rare-Metal Granites of Primorye; VIMS: Miscow, Russia, 2006; p. 86. (In Russian) [Google Scholar]
  8. Ryazantseva, M.D.; Gerasimov, N.S.; Govorov, I.N. Rb-Sr isochrons and petrogenesis of igneous rocks of the Voznesenka ore district. Pac. Geol. 1994, 13, 60–73. [Google Scholar]
  9. Ryazantseva, M.D.; Kupriyanova, I.I.; Belyatskiy, B.V.; Krymskiy, R.S.; Shpanov, E.P. Age genetic relationships of igneous rocks rare-metal-fluorite mineralization of the Voznesensky Ore District, (Primorye). Pac. Geol. 2003, 22, 87–102. [Google Scholar]
  10. Kupriyanova, I.I.; Shpanov, E.P. Beryllium-fluorite ores at the Voznesensk ore district (Primorskii Krai, Russia). Geol. Ore Depos. 1997, 39, 442–455. [Google Scholar]
  11. Kupriyanova, I.I.; Belyatsky, B.V.; Shpanov, E.P.; Kukushkina, O.I.; Kuvshinova, K.A.; Rassulov, V.A. The role of mineral typomorphism in the interpretation of isotope data (on the example of fluorite in the Voznesensky ore district). Petrology 2004, 12, 530–546. [Google Scholar]
  12. Kupriyanova, I.I.; Ryazantseva, M.D.; Belyatsky, B.V.; Shpanov, E.P. Geological and structural conditions for the manifestation of magmatic processes and the formation of large complex deposits of the Voznesensky ore district (Primorye, Russia). Geol. Ore Depos. 2005, 47, 127–147. [Google Scholar]
  13. Kupriyanova, I.I.; Shpanov, E.P. Beryllium Deposits of Russia; VIMS: Moscow, Russia, 2011; p. 353. [Google Scholar]
  14. Khanchuk, A.I.; Sakhno, V.G.; Alenicheva, A.A. First SHRIMP U-Pb zircon dating of magmatic complexes in the Southwestern Primor’e Region. Dokl. Earth Sci. 2010, 431, 424–428. [Google Scholar] [CrossRef]
  15. Belyatsky, B.V.; Krymsky, R.S.; Rub, M.G.; Pavlov, V.A.; Rub, A.K. Age and genetic relationships or rare-metal ore-bearing granites of Voznesenka ore fild, Primorye: Rb-Sr and Sm-Nd isotopic date. In Mineral Deposits: Processes to Processing; Stanley, C.J., Ed.; Balkema: Rotterdam, The Netherlands, 1999; pp. 313–316. [Google Scholar]
  16. Sato, K.; Suzuki, K.; Nedachi, M.; Terashima, S.; Pyazantseva, M.; Vrublevsky, A.; Khanchuk, A. Fluorite deposits at Voznesenka in the Khanka massif, Russia: Geology and age of mineralization. Resour. Geol. 2003, 53, 193–211. [Google Scholar] [CrossRef]
  17. Nokleberg, W.J. (Ed.) Metallogenesis and Tectonics of Northeast Asia; USGS: Reston, VA, USA, 2010; pp. 542–549.
  18. Khetchikov, L.N.; Govorov, I.N.; Pakhomova, V.A.; Androsov, D.V. New data on genesis of lithium-fluorite granite of the Khanka medium massif: U.S.S.R. Acad. Sci. Trans. 1992, 322, 1121–1127. (In Russian) [Google Scholar]
  19. Rizvanova, N.G.; Kuznetsov, A.B. A new approach to ID-TIMS U–Pb dating of cassiteriteby the example of the Pitkaranta Tin deposit. Dokl. Earth Sci. 2020, 491, 146–149. [Google Scholar] [CrossRef]
  20. Petrishchevsky, A.M. Deep Structures of the Voznesensky Fluorite Region; Dalnauka: Vladivostok, Russia, 2002; p. 106. [Google Scholar]
  21. Pearce, Y.A.; Harris, N.B.V.; Tindle, A.G. Trace element discrimination diagram for the tectonic interpretation of granitic rocks. Petroleum 1984, 70, 956–983. [Google Scholar] [CrossRef] [Green Version]
  22. Black, L.P.; Kamo, S.L.; Allen, C.M.; Aleinikoff, J.N.; Davis, D.W.; Korsch, R.J.; Foudoulis, C. TEMORA 1: A new zircon standard for phanerozoic U-Pb geochronology. Chem. Geol. 2003, 200, 155–170. [Google Scholar] [CrossRef]
  23. Wiedenbeck, M.; Allé, P.; Corfu, F.; Griffin, W.L.; Meier, M.; Oberli, F.; Von QuADT, A.; Roddick, J.C.; Spiegel, W. Three natural zircon standards for U-Th-Pb, Lu-Hf, trace element and ree analyses. Geostand. Newsl. 1995, 19, 1–23. [Google Scholar] [CrossRef]
  24. Williams, I.S. U-Th-Pb Geochronology by ion microprobe. In Applications of Microanalytical Techniques to Understanding Mineralizing Processes; McKibben, M., Shanks, W., Ridley, W., Eds.; Society of Economic Geologists: Littleton, CO, USA, 1998; Volume 7, pp. 1–35. [Google Scholar]
  25. Schuth, S.; Gornyy, V.I.; Berndt, J.; Shevchenko, S.S.; Sergeev, S.A.; Karpuzov, A.F.; Mansfeldt, T. Early proterozoic u-pb zircon ages from basement gneiss at the Solovetsky Archipelago, White Sea, Russia. Int. J. Geosci. 2012, 3, 289–296. [Google Scholar] [CrossRef] [Green Version]
  26. Stacey, J.S.; Kramers, J.D. Approximation of terrestrial lead isotope evolution by a two-stage model. Earth Planet Sci. Lett. 1975, 26, 207–221. [Google Scholar] [CrossRef]
  27. Ludwig, K.R. SQUID 1.02, A User Manual, A Geochronological Toolkit for Microsoft Excel; Berkeley Geochronology Center Spec. Publ.: Berkeley, CA, USA, 2001. [Google Scholar]
  28. Ludwig, K.R. User’s Manual for Isoplot/Ex, Version 3.00, A Geochronological Toolkit for Microsoft Excel; Berkeley Geochronology Center Spec. Publ.: Berkeley, CA, USA, 2003. [Google Scholar]
  29. Dokukina, K.A.; Kaulina, T.V.; Konilov, A.N.; Mints, M.V.; Van, K.V.; Natapov, L.; Belousova, E.; Simakin, S.G.; Lepekhina, E.N. Archaean to Palaeoproterozoic high-grade evolution of the Belomorian eclogite province in the Gridino area, Fennoscandian Shield: Geochronological evidence. Gondwana Res. 2014, 25, 585–613. [Google Scholar] [CrossRef]
  30. Fedotova, A.A.; Bibikova, E.V.; Simakin, S.G. Ion-microprobe zircon geochemistry as an indicator of mineral genesis during geochronological studies. Geochem. Int. 2008, 46, 912–927. [Google Scholar] [CrossRef]
  31. McDonough, W.F.; Sun, S.S. The composition of the Earth. Chem. Geol. 1995, 120, 223–253. [Google Scholar] [CrossRef]
  32. Watson, E.B.; Wark, D.A.; Thomas, J.B. Crystallization thermometers for zircon and rutile. Contrib. Miner. Petrol. 2006, 151, 413–433. [Google Scholar] [CrossRef]
  33. Gulson, B.L.; Jones, M.T. Cassiterite: Potential for direct dating of mineral deposits and a precise age for the bushveld complex granites. Geology 1992, 20, 355–358. [Google Scholar] [CrossRef]
  34. Tapster, S.; Bright, J. High-precision ID-TIMS Cassiterite U-Pb systematics using a low-contamination hydrothermal decomposition: Implications for LA-ICP-MS and ore deposit geochronology. EGU Geochronol. 2020, 2, 425–441. [Google Scholar] [CrossRef]
  35. Carr, P.; Zink, S.; Bennett, V.; Norman, M.; Amelin, Y.; Blevin, P.L. A new method for U-Pb geochronology of cassiterite by ID-TIMS applied to the Mole Granite polymetallic system, eastern Australia. Chem. Geol. 2020, 539, 1–10. [Google Scholar] [CrossRef]
  36. Manhes, G.; Minster, J.E.; Allegre, C.J. Comparative uranium-thorium-lead and rubidium-strontium study of the Severin Amphoterite: Consequences for early Solar System chronology. Earth Planet Sci. Lett. 1978, 39, 14–24. [Google Scholar] [CrossRef]
  37. Kirkland, C.L.; Smithies, R.H.; Taylor, R.J.M.; Evans, N.; McDonald, B. Zircon Th/U ratios in magmatic environs. Lithos 2015, 212, 397–414. [Google Scholar] [CrossRef]
  38. Geisler, T.; Scheicher, H. Improved U-Th-total Pb-dating of zircons by electron microprobe using a simple new background modeling procedure and Ca as a chemical criterion of fluid-induced U-Th-Pb discordance in zircon. Chem. Geol. 2000, 163, 269–285. [Google Scholar] [CrossRef]
  39. Finch, R.J.; Hanchar, J.M. Structure and chemistry of zircon and zircon-group minerals. Rev. Miner. Geochem. 2003, 53, 1–25. [Google Scholar] [CrossRef]
  40. Belousova, E.; Griffin, W.; O’Reilly, S.Y.; Fisher, N. Igneous zircon; Trace element composition as an indicator of source rock type. Contrib. Miner. Petrol. 2002, 143, 602–622. [Google Scholar] [CrossRef]
  41. Fu, B.; Page, F.Z.; Cavoise, A.J.; Fournelle, J.; Kita, N.T.; Lackey, J.S.; Wilde, S.A.; Valley, J.W. Ti-in-zircon thermometry: Applications and limitations. Contrib. Miner. Petrol. 2008, 156, 197–215. [Google Scholar] [CrossRef]
  42. Barth, A.P.; Wooden, J.L. Coupled elemental and isotopic analyses of polygenetic zircons from granitic rocks by ion microprobe, with implications for melt evolution and the sources of granitic magmas. Chem. Geol. 2010, 277, 149–159. [Google Scholar] [CrossRef]
  43. Ushikubo, T.; Kita, N.T.; Cavoise, A.J.; Wilde, S.A.; Rudnick, R.L.; Valley, J.W. Lithium in jack hills zircons: Evidence for extensive weathering of Earth’s earliest crust. Earth Planet. Sci. Lett. 2008, 272, 666–676. [Google Scholar] [CrossRef]
  44. Hoskin, P.W.O. Trace-element composition of hydrothermal zircon and the alteration of Hadean zircon from the Jack Hills, Australia. Geochim. Cosmochim. Acta 2005, 69, 637–648. [Google Scholar] [CrossRef]
  45. Grimes, C.B.; Ushikubo, T.; John, B.E.; Valley, J.W. Uniformly mantle-like δ18O in zircons from oceanic plagiogranites and gabbros. Contrib. Miner. Petrol. 2011, 161, 13–33. [Google Scholar] [CrossRef]
  46. Bouvier, A.-S.; Ushikubo, T.; Kita, N.T.; Cavoise, A.J.; Kozdon, R.; Valley, J.W. Li isotopes and trace elements as a petrogenetic tracer in zircon: Insights from Archean TTGs and sanukitoids. Contrib. Miner. Petrol. 2012, 163, 745–768. [Google Scholar] [CrossRef]
  47. Deng, X.H.; Chen, Y.J.; Yao, J.M.; Bagas, L.; Tang, H.S. Fluorite REE-Y (REY) geochemistry of the ca. 850 Ma Tumen molybdenite-fluorite deposit, eastern Qinling, China: Constraints on ore genesis. Ore Geol. Rev. 2014, 63, 532–543. [Google Scholar] [CrossRef]
  48. Li, C.; Zhang, R.; Ding, X.; Ling, M.; Fan, W.; Sun, W. Dating cassiterite using laser ablation ICP-MS. Ore Geol. Rev. 2016, 72, 313–322. [Google Scholar] [CrossRef]
  49. Ludwig, K.R. On the treatment of concordant uranium-lead ages. Geochim. Cosmochim. Acta 1998, 62, 665–676. [Google Scholar] [CrossRef]
  50. Xu, T.; Xu, W.L.; Wang, F.; Ge, W.C.; Sorokin, A.A. Geochronology and geochemistry of early Paleozoic intrusive rocks from the Khanka Massif in the Russian Far East: Petrogenesis andtectonic implications. Lithos 2018, 300–301, 105–120. [Google Scholar] [CrossRef]
  51. Mishkin, M.A.; Khanchuk, A.I.; Zhuravlev, D.P.; Lavrik, S.N. First data on the Sm–Nd systematics of metamorphic rocks in the Khankai Massif, Primor’e region. Dokl. Earth Sci. 2000, 374, 1283–1285. [Google Scholar]
  52. Kruk, N.N.; Golozubov, V.V.; Kiselev, V.I.; Kruk, E.A.; Rudnev, S.N.; Serov, P.A.; Kasatkin, S.A.; Moskalenko, E.Y. Paleozoic granitoids of the southern part of the Voznesenka Terrane (South Primorye): Age, composition, melt sources and Tectonic setting. Pac. Geol. 2018, 12, 190–209. [Google Scholar] [CrossRef]
Figure 1. (a) Tectonic sketch map of the Russian Far East terrane, emphasizing position of the Khanka massif; (b) simplified geological map of the part of the Khanka massif (based on the materials of Primorgeologiya OJSC, S.V. Kovalenko et al.), showing Voznesenskoe rare-metal–fluorite and Yaroslavskoe and Chapaevskoe tin ore deposits and sample locations. Sampling locations are shown as yellow stars.
Minerals 11 01154 g001
Figure 2. Discrimination diagrams for the Voznesensky complex granites: (a) typification of igneous rocks by the ratio of alkalis and alumina; (b) (Rb vs. Y + Nb); field boundaries from Pearce [21].
Minerals 11 01154 g002
Figure 3. Photographs of rock samples 4088-107 from the Chapaevskoe deposit (a) and 4088-112 pegmatite vein from the Yaroslavskoe deposit (b). Coin diameter is 2.5 cm.
Minerals 11 01154 g003
Figure 4. Typical CL images of zircons from the leucogranite (sample 108-B) (a) and from the biotite granites (sample DV-27/04) (b) of the Voznesensky complex. Circles show the SIMS SHRIMP analytical spots with their numbers corresponding to those in Table 1.
Minerals 11 01154 g004
Figure 5. (a,b) Concordia diagram for zircons from sample 108-B of the leucogranite; (c) Tera–Wasserburg concordia diagram for zircons (sample DV-27/04) from biotite granite of the Voznesensky complex.
Minerals 11 01154 g005
Figure 6. REE patterns for zircon grains from the Voznesensky complex (sample DV-27/04).
Minerals 11 01154 g006
Figure 7. REE pattern for zircon grains from sample DV-27/04 in central zones (open circles, triangles and squares on graphs (ac) and in marginal zones (filled symbols).
Minerals 11 01154 g007
Figure 8. Co-variation diagrams showing the composition of the studied zircons. Fields are after [44,45,46].
Minerals 11 01154 g008
Figure 9. Sm–Nd isochron of the fluorites in the Voznesenskoe deposit.
Minerals 11 01154 g009
Figure 10. Chondrite normalized [31] REE patterns of the fluorites in the Voznesenskoe deposit.
Minerals 11 01154 g010
Figure 11. Concordia diagram of the cassiterites from the Yaroslavskoe deposit (sample DV-1—red ellipses; sample 4088-112—blue ellipses in squares) and from the Chapaevskoe deposit (sample 4088-107—green ellipses).
Minerals 11 01154 g011
Figure 12. Concordia diagram for cassiterite from the Yaroslavskoe deposit (sample DV-1).
Minerals 11 01154 g012
Figure 13. Diagram in coordinates 206Pb/204Pb–207Pb/204Pb for cassiterite of the Yaroslavskoe and Chapaevskoe deposits.
Minerals 11 01154 g013
Table 1. U–Pb SIMS SHRIMP IIe isotope data of zircon from the leucogranite 108-B and the biotite granite DV-27/04.
Spot%
206Pbc
Ppm
U
Ppm
Th
Ppm
206Pb*
232Th
238U
Age
206Pb/238U
207Pb*
206Pb*
±%207Pb*
235U
±%206Pb*
238U
±%Err
Corr
Sample 108-B
1.10.6510,21419766000.20424±90.05591.00.522.30.06792.10.89
2.10.08805216084370.21394±70.05490.50.481.90.06311.90.97
3.11.23463325490.72736±130.06483.11.083.60.12091.90.53
4.11.55247415481710.65492±90.05492.90.603.50.07921.90.54
5.10.05566229370.42474±90.05731.50.602.50.07631.90.79
6.121.32366660301761.70277±60.057019.00.3519.00.04392.20.11
7.10.03334136272231.12483±90.05690.60.612.00.07781.90.96
8.10.061243847810.70473±90.05581.00.592.10.07611.90.89
9.15.78228715331160.69350±70.05154.80.405.10.05581.90.37
10.10.0115488051030.54481±90.05710.80.612.10.07751.90.92
Sample DV-27/04
7.126.3529513440791.20197±110.04831460.211460.03115.90.04
10.12.0024851743760.72226±30.052750.2650.03571.10.21
4.131.20524012701870.25262±50.0485320.28320.04152.00.06
6.143.0225417541100.31318±30.0318380.22380.05051.10.03
8.127.491682617770.38336±80.0429550.32550.05352.40.04
2.117.49210810861070.53368±40.0438160.36160.05881.00.07
5.12.76724369470.53472±140.058090.6190.07593.10.33
9.10.55156110271020.68473±60.057030.6030.07621.30.39
10.20.23928471610.52476±30.055220.5820.07670.70.41
11.10.20934297620.33480±30.055230.5930.07720.70.24
3.10.17607271410.46482±50.056620.6120.07771.00.51
1.116.73477237320.51484±80.0677110.73120.07811.60.14
Errors are 1-sigma; Pbc and Pb* indicate the common and radiogenic portions, respectively. Error in standard calibration was 0.69% (sample 108-B) and 0.25% (sample DV-1) (not included in above errors but required when comparing data from different mounts). (1) Common Pb corrected using measured 204Pb.
Table 2. Trace element concentrations (ppm) and the calculated temperature in zircons from the granites (sample DV-27/04).
SpotCentral PartsMarginal Parts
1.12.13.14.15.16.17.18.19.111.13.24.27.210.110.2
La4.7611.83.1724.41.0523.433.018.23.689.4857.55401215.3312.3
Ce28.950.520.312313.082.220973.730.746.6170162450344.372.9
Pr3.527.842.3217.50.7911.236.813.53.445.1124.526683.13.647.47
Nd22.845.318.491.78.5360.226910435.432.5117134845623.347.0
Sm29.249.922.670.911.354.629014661.332.553.980734424.144.9
Eu5.309.032.7315.90.926.7941.819.95.743.5817.495.665.54.037.12
Gd80.512572.717346.814664837417383.71021475612.368.199.6
Dy2574622496041614491944109353331339534521678215395
Er38864038810822826602585138178247977837171993369597
Yb6741163697201449210934454220812788161614589133486331011
Lu10116210028484.715558128817711723875543489.6157
Li53.392.657.134.349.198.145.579.250.168.39.1915.035.281.178.4
P462336104370186592902660184526104582651558109474
Ca25262082.2222855.843317681051329322423052072948463425
Ti31.947.121.068.06.5748.716752.726.621.110613206023061.7
Sr21.073.74.294990.7950.917467.89.5634.87334724268446.3
Y24214332227766961737407118,47710,15048323645455427,68713,29922633527
Nb11511367.415315.115141017077.287.12183107135379.4198
Ba27.295.18.556501.8949.925612621.924.71054558564.310346.2
Hf12,54712,53611,32415,86312,12313,49312,80212,999920813,46216,01718,15615,95211,69912,284
Th60212495021785381853513910361407524166933,40769701326960
U136732631415894811303109742336812607228413,88921,97915,94527392752
Th/U0.440.380.350.200.340.270.690.280.540.230.121.520.440.480.35
Eu/Eu*0.330.350.210.440.120.230.290.260.170.210.710.270.430.300.32
Ce/Ce*1.711.271.811.443.451.231.451.142.091.621.101.041.212.431.84
ΣREE15952726157645001102274211,092572030831938356619,970963814792452
ΣLREE60.011544.225623.417754720973.393.73693777116476.6140
ΣHREE15012552150641571067250310,213534429431808312615,289806413752260
LuN/LaN20513130311277763.717015346411839.913.534.4162124
LuN/GdN10.210.411.113.314.68.577.256.248.2911.318.84.145.7310.612.8
SmN/LaN9.836.7411.44.6617.23.7414.112.926.75.491.502.404.557.235.86
T(Ti),°C8579018139467079051072914837813100514911304849934
Abbreviations: Eu/Eu* = EuN/(SmN × GdN)0.5; Ce/Ce* = CeN/(LaN × PrN)0.5.
Table 3. Results of Sm–Nd isotope studies of fluorite of the rare-metal–fluorite Voznesenskoe deposit.
No.SampleSm (ppm)Nd (ppm)147Sm/144Nd143Nd/144Nd
1335-41.4966.6110.13680.512283 ± 5
2352/35.9044.8360.73810.514157 ± 5
3B1070.1340.1630.49930.513392 ± 9
4B1090.0510.1970.15670.512315 ± 7
Table 4. Rare element and trace element concentrations (ppm) in fluorites of various types from Voznesenskoe deposit.
SpotSamples
335-4352-3B-107B-109
La10.40.610.671.63
Ce16.72.091.082.37
Pr1.680.560.0710.086
Nd6.54.650.240.33
Sm1.475.570.140.066
Eu0.310.0670.0190.026
Gd1.5411.90.180.094
Tb0.283.230.0420.017
Dy1.7925.90.330.082
Ho0.396.560.0750.021
Er1.2320.30.270.063
Tm0.212.830.060.0082
Yb1.6317.80.590.055
Lu0.242.070.0920.0084
W16.30.430.425
Sn8030.750.980.91
Sr69124001410839
Y14.42871.491.16
Th5.270.930.680.11
U1.290.10.150.19
Th/U4.0859.34.530.57
Eu/Eu*0.13830.0050.08260.2300
Ce/Ce*1.48572.34831.53081.4166
Y/Y*7.2549.8354.05412.540
ΣREE44.37104.1373.8594.8566
ΣLREE38.625.4472.44.602
ΣHREE5.7778.591.4590.2546
LREE/HREE6.680.321.6418.41
La/Yb6.38030.0341.135529.636
La/Ho26.6660.09298.933377.619
La/Nd1.60.13112.79164.9393
Gd/Yb0.9440.6680.3051.709
Y/Ho36.9243.7519.8655.23
Abbreviations: Eu/Eu* = EuN/[(SmN + GdN)/2]; Ce/Ce* = CeN/[(LaN + PrN)/2]; Y/Y* = CeN/[(DyN + HoN/2] [47].
Table 5. U–Pb isotopic data of cassiterite for Yaroslavskoe and Chapaevskoe deposits.
NoTreatment ConditionsWt
(mg)
Pb
ppm
U
ppm
Isotopic RatiosRhoAge, Ma
206Pb/204Pb a207Pb/204Pb aErr-Corr
7/4-6/4
207Pb/235U206Pb/238U206Pb/238U207Pb/235U207Pb/206Pb
Yaroslavskoe deposit, sample DV-1
12N HCl + 2N HNO320.30.271.0342.7
(0.317)
16.930
(0.12)
0.64
26N HCl + 6N HNO322.351.765.5337.4
(0.068)
16.668
(0.09)
0.91
36N HCl + 6N HNO3
(repeat No2)
8.111.885.6036.1
(0.105)
16.601
(0.093)
0.70
4aqua regia15.931.775.1035.8
(0.077)
16.604
(0.093)
0.870.60891
(2.1)
0.07731
(0.16)
0.58480 ± 0.7482.9 ± 10496.4 ± 9.8
5HF 220 °C,
6N HCl + 6N HNO3
15.230.744.8877.8
(0.244)
18.971
(0.11)
0.730.60465
(0.68)
0.07747
(0.22)
0.43481 ± 1480.2 ± 3476.2 ± 3
6HF 220 °C,
aqua regia
26.00.915.0962.6
(0.12)
18.099
(0.096)
0.710.59824
(0.88)
0.07700
(0.22)
0.39478.2 ± 1476.1 ± 2465.9 ± 2
7HF 220 °C,
aqua regia,
6N HCl + 6N HNO3
11.90.774.3163.5
(0.256)
18.161
(0.108)
0.700.60437
(0.86)
0.07738
(0.23)
0.39480.5 ± 1480 ± 4477.8 ± 4
8HF 220 °C, HBr26.610.834.9671.5
(0.126)
18.698
(0.095)
0.71
9leach
2N HCl + 2N HNO3
---18.6
(0.06)
15.626
(0.09)
0.99
10pyrite---18.3
(0.012)
15.601
(0.018)
0.99
Yaroslavskoe deposit, sample 4088-112
116N HCl + 6N HNO316.60.496.18839
(3)
62.231
(2.33)
0.990.63736
(0.17)
0.08137
(0.11)
0.71504.3 ± 0.6500.7 ± 0.9484 ± 0.6
126N HCl + 6N HNO319.50.536.46649
(1.9)
51.175
(1.39)
0.990.62448
(0.21)
0.08024
(0.11)
0.61497.6 ± 0.6492.7 ± 1469.8 ± 0.8
136N HCl + 6N HNO3 (twice)12.20.486.1917
(5.1)
66.608
(4.1)
0.990.62433
(0.16)
0.07986
(0.11)
0.76495 ± 0.6492.6 ± 0.8481 ± 0.5
Chapaevskoe deposit, sample 4088-107
146N HCl + 6N HNO320.51.610.254.6
(0.1)
17.636
(0.1)
0.810.45529
(0.65)
0.05904
(0.23)
0.47369.8 ± 0.8381 ± 6.5449.8 ± 2.8
156N HCl + 6N HNO317.01.511.367.8
(0.11)
18.367
(0.09)
0.720.45465
(0.45)
0.05914
(0.22)
0.56368 ± 0.8378.8 ± 1.7444.9 ± 1.7
166N HCl + 6N HNO310.10.646.40125
(0.97)
21.596
(0.69)
0.880.51465
(1.7)
0.06624
(0.0.25)
0.55413.5 ± 1421.6 ± 7466.1 ± 7.3
176N HCl + 6N HNO315.81.336.8649.0
(0.096)
17.374
(0.09)
0.740.51970
(0.62)
0.06647
(0.12)
0.43414.8 ± 0.5425.0 ± 2.6480.2 ± 2.8
186N HCl + 6N HNO3 (twice)9.450.606.22136
(0.95)
22.201
(0.36)
0.950.51611
(0.27)
0.06652
(0.11)
0.5415.2 ± 0.5422.6 ± 1.2463.1 ± 1.1
Notes: a—isotopic ratios corrected for blank and fractionation; Rho is the correlation coefficient of errors in the ratios 207Pb/235U и 206Pb/238U. The lead and uranium contents in leach and pyrite were not determined.
Publisher’s Note: MDPI stays neutral with regard to jurisdictional claims in published maps and institutional affiliations.

