Article

Thermal State, Thickness, and Composition of the Lithospheric Mantle beneath the Upper Muna Kimberlite Field (Siberian Craton) Constrained by Clinopyroxene Xenocrysts and Comparison with Daldyn and Mirny Fields

by
Anna M. Dymshits
1,2,*,
Igor S. Sharygin
1,2,
Vladimir G. Malkovets
2,3,
Igor V. Yakovlev
2,
Anastasia A. Gibsher
2,3,
Taisia A. Alifirova
2,4,
Sofya S. Vorobei
5,6,
Sergey V. Potapov
1,2 and
Viktor K. Garanin
5,7
1
Institute of the Earth’s Crust, Siberian Branch of the Russian Academy of Sciences, 664033 Irkutsk, Russia
2
Sobolev Institute of Geology and Mineralogy, Siberian Branch of the Russian Academy of Science, 630090 Novosibirsk, Russia
3
Geo-Scientific Research Enterprise Public Joint-Stock Company “ALROSA”, 678170 Mirny, Russia
4
Department of Lithospheric Research, University of Vienna, Althanstraße 14/UZA2, 1090 Vienna, Austria
5
Geological Faculty, Moscow State University, 119991 Moscow, Russia
6
Institute of Geochemistry and Analytical Chemistry, Russian Academy of Sciences, 119991 Moscow, Russia
7
Fersman Mineralogical Museum, Russian Academy of Sciences, 119071 Moscow, Russia
*
Author to whom correspondence should be addressed.
Minerals 2020, 10(6), 549; https://doi.org/10.3390/min10060549
Submission received: 20 April 2020 / Revised: 15 June 2020 / Accepted: 15 June 2020 / Published: 18 June 2020

Abstract

:
To gain better insight into the thermal state and composition of the lithospheric mantle beneath the Upper Muna kimberlite field (Siberian craton), a suite of 323 clinopyroxene xenocrysts and 10 mantle xenoliths from the Komsomolskaya-Magnitnaya (KM) pipe have been studied. We selected 188 clinopyroxene grains suitable for precise pressure (P)-temperature (T) estimation using single-clinopyroxene thermobarometry. The majority of P-T points lie along a narrow, elongated field in P-T space with a cluster of high-T and high-P points above 1300 °C, which deviates from the main P-T trend. The latter points may record a thermal event associated with kimberlite magmatism (a “stepped” or “kinked” geotherm). In order to eliminate these factors, the steady-state mantle paleogeotherm for the KM pipe at the time of initiation of kimberlite magmatism (Late Devonian–Early Carboniferous) was constrained by numerical fitting of P-T points below T = 1200 °C. The obtained mantle paleogeotherm is similar to the one from the nearby Novinka pipe, corresponding to a ~34–35 mW/m2 surface heat flux, 225–230 km lithospheric thickness, and 110–120 thick “diamond window” for the Upper Muna field. Coarse peridotite xenoliths are consistent in their P-T estimates with the steady-state mantle paleogeotherm derived from clinopyroxene xenocrysts, whereas porphyroclastic ones plot within the cluster of high-T and high-P clinopyroxene xenocrysts. Discrimination using Cr2O3 demonstrates that peridotitic clinopyroxene xenocrysts are prevalent (89%) among all studied 323 xenocrysts, suggesting that the Upper Muna mantle is predominantly composed of peridotites. Clinopyroxene-poor or -free peridotitic rocks such as harzburgites and dunites may be evident at depths of 140–180 km in the Upper Muna mantle. Judging solely from the thermal considerations and the thickness of the lithosphere, the KM and Novinka pipes should have excellent diamond potential. However, all pipes in the Upper Muna field have low diamond grades (<0.9, in carats/ton), although the lithosphere thickness is almost similar to the values obtained for the high-grade Udachnaya and Mir pipes from the Daldyn and Mirny fields, respectively. Therefore, other factors have affected the diamond grade of the Upper Muna kimberlite field.

1. Introduction

Mantle-derived xenoliths and xenocrysts from kimberlites provide direct information about the composition and thermal state of the lithospheric mantle underlying the ancient cratons at time of kimberlite eruption [1,2,3,4,5,6,7,8]. Constraints on mantle paleogeotherms (temperature change with depth) allow determination of the thermal gradient and thickness of the lithosphere [2,3,9,10,11]. Besides the importance of understanding mantle dynamics and origin of cratons, knowledge of the thermal state and thickness of the subcratonic lithospheric mantle is also essential for predicting its diamond potential in the region of interest [12,13,14,15,16].
The common petrological approach to constraining the mantle paleogeotherm beneath cratons is based on the calculation of the P-T conditions of equilibration for mantle xenoliths using thermobarometry based on the exchange of components between multiple minerals [6,17,18,19,20,21,22]. Another option is to use P-T data obtained from mantle xenocrysts, which represent single grains of disintegrated mantle xenoliths [2,15,16,23]. Single-mineral thermometers and barometers are well-developed for peridotitic clinopyroxenes and garnets [12,24]. The advantages of the second approach are as follows: (1) it can be used in cases where mantle xenoliths are absent or rare, e.g., due to secondary alteration; (2) xenocrysts are routinely obtained during diamond exploration; (3) it requires fewer analytical resources because each mineral grain is assumed to represent one mantle xenolith with an inferred mineralogy, for instance, single-clinopyroxene thermobarometry requires 3 or 4 times fewer microprobe analyses than conventional thermobarometry using mineral pairs; (4) its relative cheapness and efficiency (only one mineral is used in the P-T calculations) thus makes it possible to obtain a statistically meaningful number of P-T points, which is very important for robust estimation of the paleogeotherm.
Our knowledge of the thermal state of the mantle beneath the Siberian craton in Late Devonian–Early Carboniferous time comes mainly from numerous studies of mantle xenoliths from the Udachnaya kimberlite pipe, Daldyn field [1,6,10,17,25,26,27,28]. Paleogeotherm constraints beneath the Upper Muna field were presented only in a few papers with slightly different results for the lithospheric thickness [2,23,29,30] because different approaches have been used.
In order to further evaluate the thermal state and structure of the lithospheric mantle beneath the Upper Muna kimberlite field at the time of kimberlite emplacement, we have analyzed a large suite of clinopyroxene xenocrysts from the Komsomolskaya-Magnitnaya (KM) pipe using the FITPLOT numerical fitting program (written by Dan McKenzie in 1988 and introduced by Mather et al. in 2011 [7], and based on a geotherm model proposed in [6,31]) and compare our results with the geotherm for the nearby Novinka pipe obtained in the same way [23]. To test the validity of single-mineral clinopyroxene thermobarometry, we compare our results with P-T data obtained from mantle xenoliths from the KM pipe. Discrimination of clinopyroxenes is based on Cr2O3 and demonstrates that the mantle column beneath the KM pipe appears to be predominantly composed of peridotite. We also estimated paleogeotherms beneath the Daldyn and Mirny kimberlite field using P-T data for mantle xenoliths from literature and the FITPLOT program to compare the thermal state of the lithospheric mantle between different tectonic terranes of the Siberian craton. We used FITPLOT to calculate paleogeotherms because it has been widely used by petrologists in the last decade and allows comparison of the thermal state of the lithospheric mantle for different regions in a quantitative manner [7,13,15,23,32].

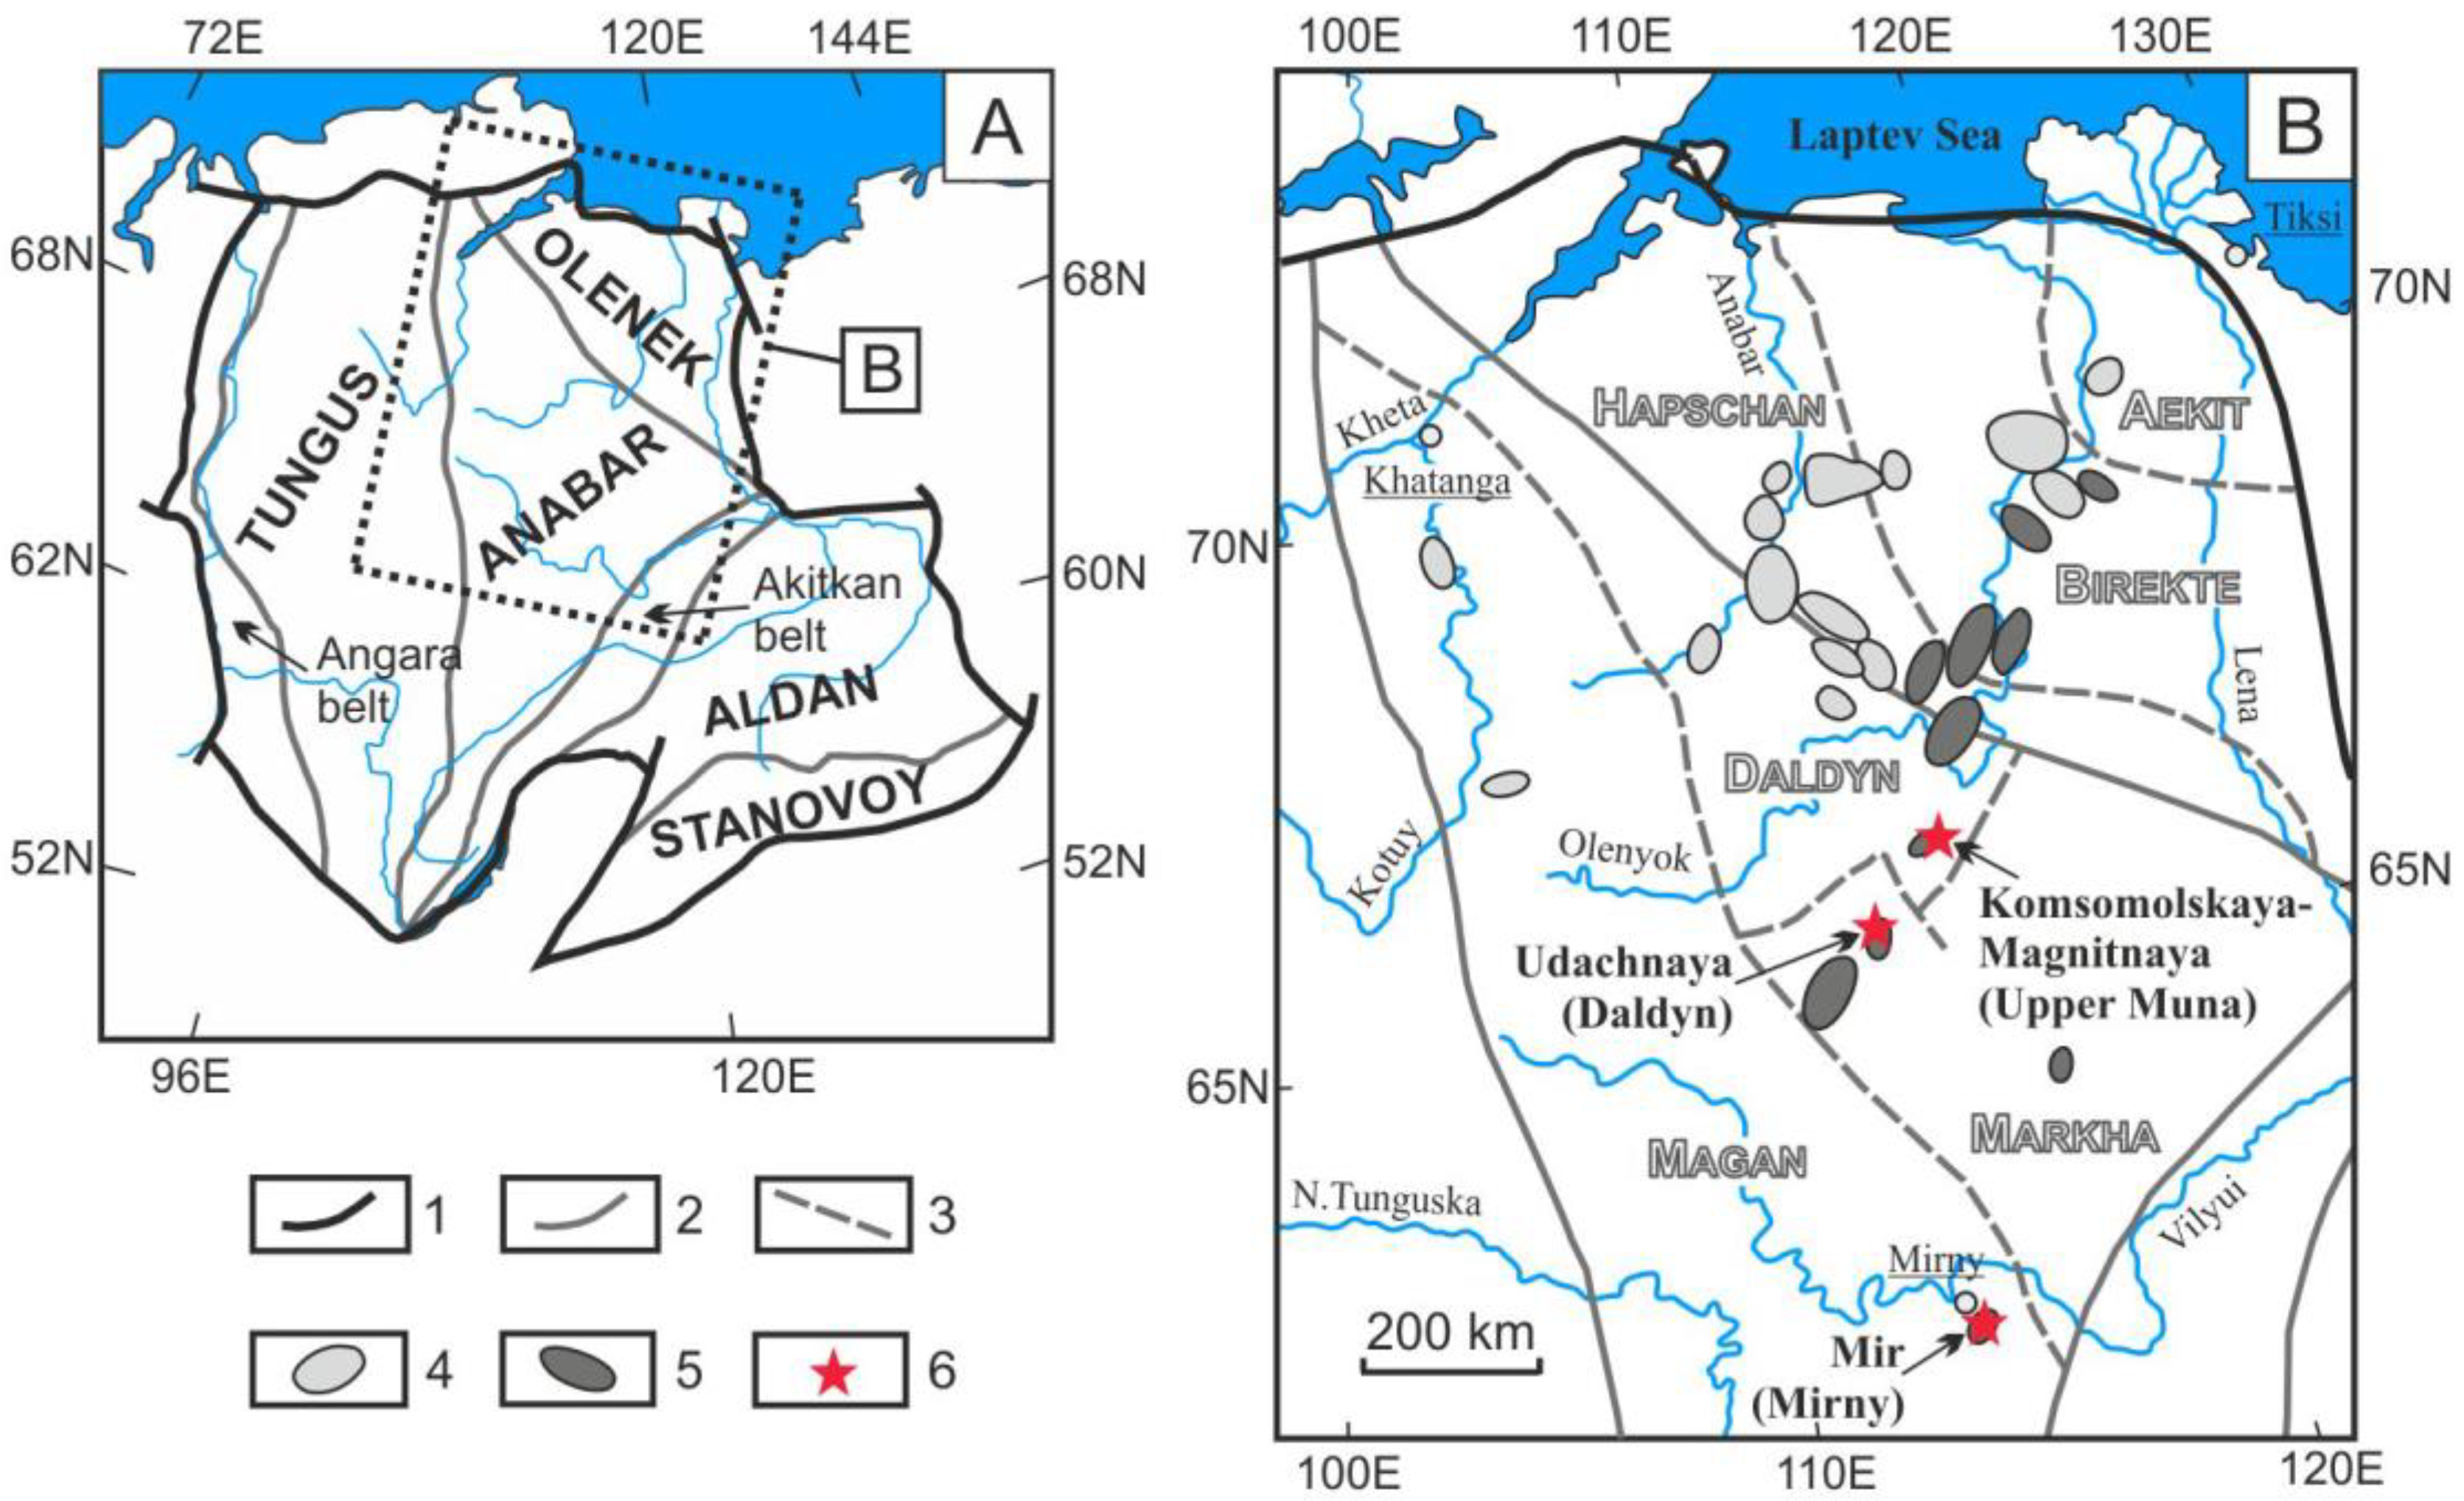
2. Geological Setting

The basement of the Siberian craton occupies ~4 million km2 and comprises Precambrian crust, mostly covered (~70%) by Riphean and Phanerozoic sediments and outcropping within the Anabar and the Aldan shields and several uplifts [33,34,35]. The basement of the Siberian craton is a Paleoproterozoic collage of granulite-gneiss and granite-greenstone Archean terranes. In the structure of the Siberian craton, different terranes are grouped in larger tectonic units—tectonic provinces: Tungus, Anabar, Olenek, Aldan, and Stanovoy (Figure 1). The Anabar province is divided into three terranes: Daldyn, Markha, and Magan (Figure 1). U-Pb and Hf-isotope studies of zircons from crustal xenoliths of the Anabar province (Upper Muna, Daldyn, Alakit, and Nakyn kimberlite fields) reveal the Archean age of the basement rocks, from 3.65 to 3.11 Ga. This Paleoarchean crust was significantly reworked in several tectonothermal events, including a Neoarchean stage (2.9–2.5 Ga), and several Paleoproterozoic metamorphic stages (1.98, 1.9, and 1.8 Ga) [36,37,38].
There are more than 20 known kimberlite fields in the Siberian craton located mostly within its northwestern part and grouped in the Yakutian kimberlite province [41,42,43]. Four distinct episodes of kimberlite magmatism are defined in the Siberian craton: Silurian–Early Devonian (420–400 Ma), Late Devonian–Early Carboniferous (350–380 Ma), Triassic (215–235 Ma), and Early Cretaceous–Jurassic (140–170 Ma) [44,45,46,47,48,49]. Diamond-rich kimberlites are overwhelmingly Late Devonian–Early Carboniferous in age. The Upper Muna, Daldyn, and Mirny fields are located within different terranes of the Anabar tectonic province: Daldyn, Markha, and Magan, respectively (Figure 1). Within the Upper Muna field, 19 kimberlite bodies are known, and all are diamondiferous (3 dykes and 16 pipes, five of which are of commercial value and comprise the Verkhne-Munskoe deposit: Zapolarnaya, Deimos, Novinka, KM, and Poiskovaya) [43,50]. The Upper Muna kimberlites are located as a compact group in the Ulakh-Muna River valley, right tributary of the Muna River, and intruded into terrigenous-carbonate Middle to Upper Cambrian sediments. The KM pipe is situated close to the Novinka pipe (~ 100 m), studied in [23], and it is thought they have a common feeder dyke [43]. The KM pipe comprises three types of kimberlite rocks: kimberlite breccia, monticellite-bearing porphyritic kimberlite, and monticellite-free porphyritic kimberlite. According to terminology proposed in [43], kimberlite breccia is defined as kimberlite rocks containing >10% of country rocks, whereas porphyritic kimberlite hosts <10% of country rocks. There are no U-Pb perovskite or megacrystic-zircon age data for the KM pipe. Recent U-Pb perovskite and macrocrystic-zircon age determinations for six other kimberlite pipes from the Upper Muna field gave a narrow interval of kimberlite magmatism from 367 to 345 Ma [2,47,51,52,53], corresponding to Late Devonian–Early Carboniferous. The emplacement age of KM is estimated as 334–382 Ma based on bulk groundmass K-Ar of kimberlite breccia [42,54]; Rb-Sr ages of phlogopite megacrysts from the pipe yielded 400–402 Ma [55]. These data are generally consistent with the Late Devonian–Early Carboniferous age of the Upper Muna field. The Novinka pipe has a U-Pb perovskite age of 355 ± 11 Ma [52].

3. Materials and Methods

3.1. Sample Descriptions

For this study, we used 323 clinopyroxene xenocrysts and 10 mantle xenoliths from the KM pipe. The heavy-mineral concentrates were obtained from material collected from the quarry left after bulk sampling inside the contour of the pipe at the present surface and represent a mixture of all exposed kimberlite types recognized at KM. The clinopyroxene grains were picked from the 0.5–4 mm fraction of heavy-mineral concentrates, without any preference to the size, color, or shape of the grains. The mantle xenolith collection is represented by one coarse spinel-garnet lherzolite, seven coarse garnet peridotites, and two porhyroclastic (sheared or high-T) peridotites.
To constrain the paleogeotherm beneath the Mir pipe, we used our P-T data for 12 mantle xenoliths (Table S4) and P-T data for 35 xenoliths from the literature [56,57,58]. All details on the 12 samples from the Mir pipe as well as the analytical details are described in Table S4. For the Udachnaya pipe, only literature data were used, 120 mantle xenoliths in total [4,10,25,26,27,28,59,60,61].

3.2. Analytical Methods

Chemical analyses of clinopyroxene xenocrysts and minerals of mantle xenoliths from the KM pipe were obtained using a JEOL JXA-8100 microprobe at the Analytical Center for Multi-Elemental and Isotope Research of Siberian Branch of the Russian Academy of Science (V.S. Sobolev Institute of Geology and Mineralogy, Novosibirsk, Russia). Mineral compositions are given in (Tables S2 and S3).
The single-clinopyroxene geobarometer requires very careful determination of the activity of CaCr-Tschermak’s components aCr (aCr = Cr − 0.81(Na + K) ∙ Cr/(Cr + Al) atoms per 6-oxygen formula unit) and Cr# (Cr# = Cr/(Cr + Al)) in clinopyroxenes [23]. Therefore, the analytical conditions for microprobe analyses should be selected to provide very low uncertainties. For analysis of clinopyroxene xenocrysts, we used high beam current (100 nA) and counting times (40 s for both peak and background, the same as in [23]) compared to with routine conditions. The accelerating voltage was 20 kV. Ten elements (Na, K, Mg, Cr, Ti, Ca, Si, Al, Fe, and Mn) were analyzed. The standards were minerals and synthetic materials: pyrope “O-145” (for Al, Fe), Cr-rich augite (for Cr), albite (for Na), diopside (for Ca, Si, Mg), glass with 2% TiO2 (for Ti), and Mn-rich garnet (for Mn) (for details see [62]). The detection limits (3σ) are (in wt%) 0.01 for CaO, FeO, MnO, Al2O3, Cr2O3, and K2O, 0.02 for SiO2, TiO2, and Na2O, and 0.04 for MgO. Relative errors (3σ) are <0.5% for major element (>10 wt%), 0.5–1% for minor elements (1–10 wt%), 1–5% for element concentrations 0.3–1 wt%, and >5% for element concentrations below 0.3 wt%. For each clinopyroxene grain, we analyzed 3 points along a line crossing the entire grain in the longest direction (rim-center-rim) to monitor compositional homogeneity.
Minerals of peridotite xenoliths (garnet, olivine, clinopyroxene, and orthopyroxene) were analyzed using an 11-element scheme (Na, K, Mg, Cr, Ti, Ca, Si, Al, Fe, Mn, and Ni). Analytical conditions were a 20 kV voltage and 100 nA beam current. Counting times were 10 s on peak and 5 s on backgrounds on each side of the peak for main elements (Mg, Ti, Ca, Si, Fe, Mn, Ni) and 20 s on peak and 10 s on background on each side of the peak for minor elements (Na, Cr, K, Al). Minerals and synthetic materials were used as standards: pyrope “O-145” (for Al, Fe), pyrope “Ud-92” (for Cr). The detection limits (3σ) do not exceed (in wt%), albite (for Na), diopside “BD” (for Ca, Si, Mg), glass “Gl-6” (for Ti), Mn-rich garnet “IGEM_3” (for Mn), and NiFe2O4 (for Ni), 0.01 for CaO and K2O, 0.02 for Al2O3, Cr2O3, FeO, MnO, NiO, and Na2O, 0.03 for TiO2, 0.04 for SiO2, and 0.14 for MgO.

3.3. Mineral Thermobarometry

For single-clinopyroxene thermobarometry, we used the combination of the enstatite-in-clinopyroxene thermometer (TNT00) and Cr-in-clinopyroxene barometer (PNT00) proposed by Nimis and Taylor [24]. TNT00 is based on the exchange of the enstatite component between clinopyroxene and orthopyroxene. PNT00 is based on Cr exchange between clinopyroxene and garnet, where Cr in clinopyroxene is expressed as CaCr-Tschermak’s component (CaCrAlSiO6) [24]. Therefore, only clinopyroxene that was in equilibrium with orthopyroxene and garnet in the mantle can be suitable for TNT00 and PNT00. Xenocrysts of such clinopyroxene are derived from garnet peridotites and pyroxenites and display specific compositional features (listed in Section 4.1) [23,24]. Moreover, PNT00 has intrinsic limitations related to the high sensitivity of pressure estimates to the activity of CaCr-Tschermak’s components (aCr = Cr−0.81(Na + K)∙Cr/(Cr + Al) atoms per 6-oxygen formula unit), as low values of aCr may provide large deviations, and to Cr# = Cr/(Cr + Al), because the barometer was calibrated on clinopyroxenes with Cr# ≤ 0.44. Ziberna et al. [23] revised the compositional filters to identify clinopyroxene compositions suitable for TNT00 and PNT00, and we have used their protocol for optimum thermobarometry.
The P-T values for the studied mantle xenoliths from KM (Table S4, Section 4.5) and Mir pipes (Table S1, Section 4.5) were obtained using several combinations of thermometers and barometers, depending on the mineral pairs available, and the PTQuick software provided by Dmitry Dolivo-Dobrovolsky (Institute of Precambrian Geology and Geochronology, Russian Academy of Sciences, St. Petersburg).

3.4. Computation of the Paleogeotherm

Paleogeotherms were numerically fitted from the discrete P-T data using the FITPLOT program [6,7]. This program quantifies the lithosphere thickness, calculated as the intersection of the conductive geotherm with the adiabatic geotherm of the convecting mantle, and the surface heat flow. A detailed description of the way the geotherm is calculated can be found in Mather et al. [7].
The program requires several input parameters for the crust and mantle. We assumed a heat production rate in the upper mantle of 0.0 μW/m3 and a potential temperature (Tp) for the asthenospheric isentrope of 1315 °C for all calculations. These input parameters are the same as Ziberna et al. [23] used for the nearby Novinka pipe. The FITPLOT program assumes a two-layer crust model that requires input of thickness and heat generation rates for the upper and lower crust; the values used in our calculations are shown in Table 1.

4. Results

4.1. Clinopyroxene Thermobarometry

The sample selection for single clinopyroxene thermobarometry used the following protocol [23]:
  • We discarded grains for which at least one of three electron microprobe analyses do not satisfy the quality test, i.e., total cations calculated per 6 oxygen atoms fall outside 3.98–4.02 range (Tables S2 and S3).
  • Twenty-nine grains exhibited obvious compositional inhomogeneity, suggesting possible disequilibrium and were excluded from the study.
  • Thus, 323 homogeneous clinopyroxene xenocrysts were selected (Tables S2 and S3). For further evaluation, we used the average of three individual analyses per grain. This reduces uncertainties proportional to the square root of three.
  • Equilibration with garnet was tested based on the Cr2O3 vs. Al2O3 discrimination diagram from [63], and 26 grains were discarded (Table S3).
  • We excluded 65 clinopyroxenes with low Al2O3 and MgO contents according to the following criteria: Al2O3 ≥ 0.7 wt% and Al2O3 ≥ 12.175−0.6375·MgO wt% (Table S3).
  • All grains that were not excluded at previous stages satisfy the Cr# criterion, i.e., are within the 0.10–0.65 interval (Table S2).
  • A further 43 grains with aCr/Cr# ≤ 0.11 were discarded (Table S3), as aCr is the main building block in the PNT00 formulation.
  • Verification of clinopyroxene equilibration with orthopyroxene is difficult by means of simple compositional filters. However, it is recommended to use clinopyroxene with molar Ca/(Ca + Mg) ratio (Ca#) below 0.5 [23]. Six of the studied clinopyroxene xenocrysts have Ca# > 0.5, but they had already been excluded at previous steps.
  • It is also recommended to exclude samples with temperatures below 700 °C because TNT00 is not calibrated at <700 °C. Another reason to discard these points is that low estimates of temperature may indicate that clinopyroxene was not in equilibrium with orthopyroxene. We excluded one grain at this step.
Thus, according to the proposed filters [23], we accepted 188 clinopyroxene xenocrysts for TNT00 and PNT00 thermobarometry (Table S2). Judging by eye, the majority of accepted points lie along a narrow, elongated field in P-T space (Figure 2a). However, there is a cluster of high-T points above 1300 °C that deviates from the main P-T-trend (Figure 2a). This may be due to two reasons: (1) an artifact caused by underestimation of PNT00 at pressures above 6 GPa [64] because experimental data used for PNT00 calibration were only up to 6 GPa [24]; (2) possible inflection of the geotherm caused by a thermal event preceding kimberlite emplacement [16,65,66]. Our preferred interpretation is that this phenomenon reflects a heating event, which may have taken place just prior to entrainment in the kimberlite magma (details in Section 5.2).

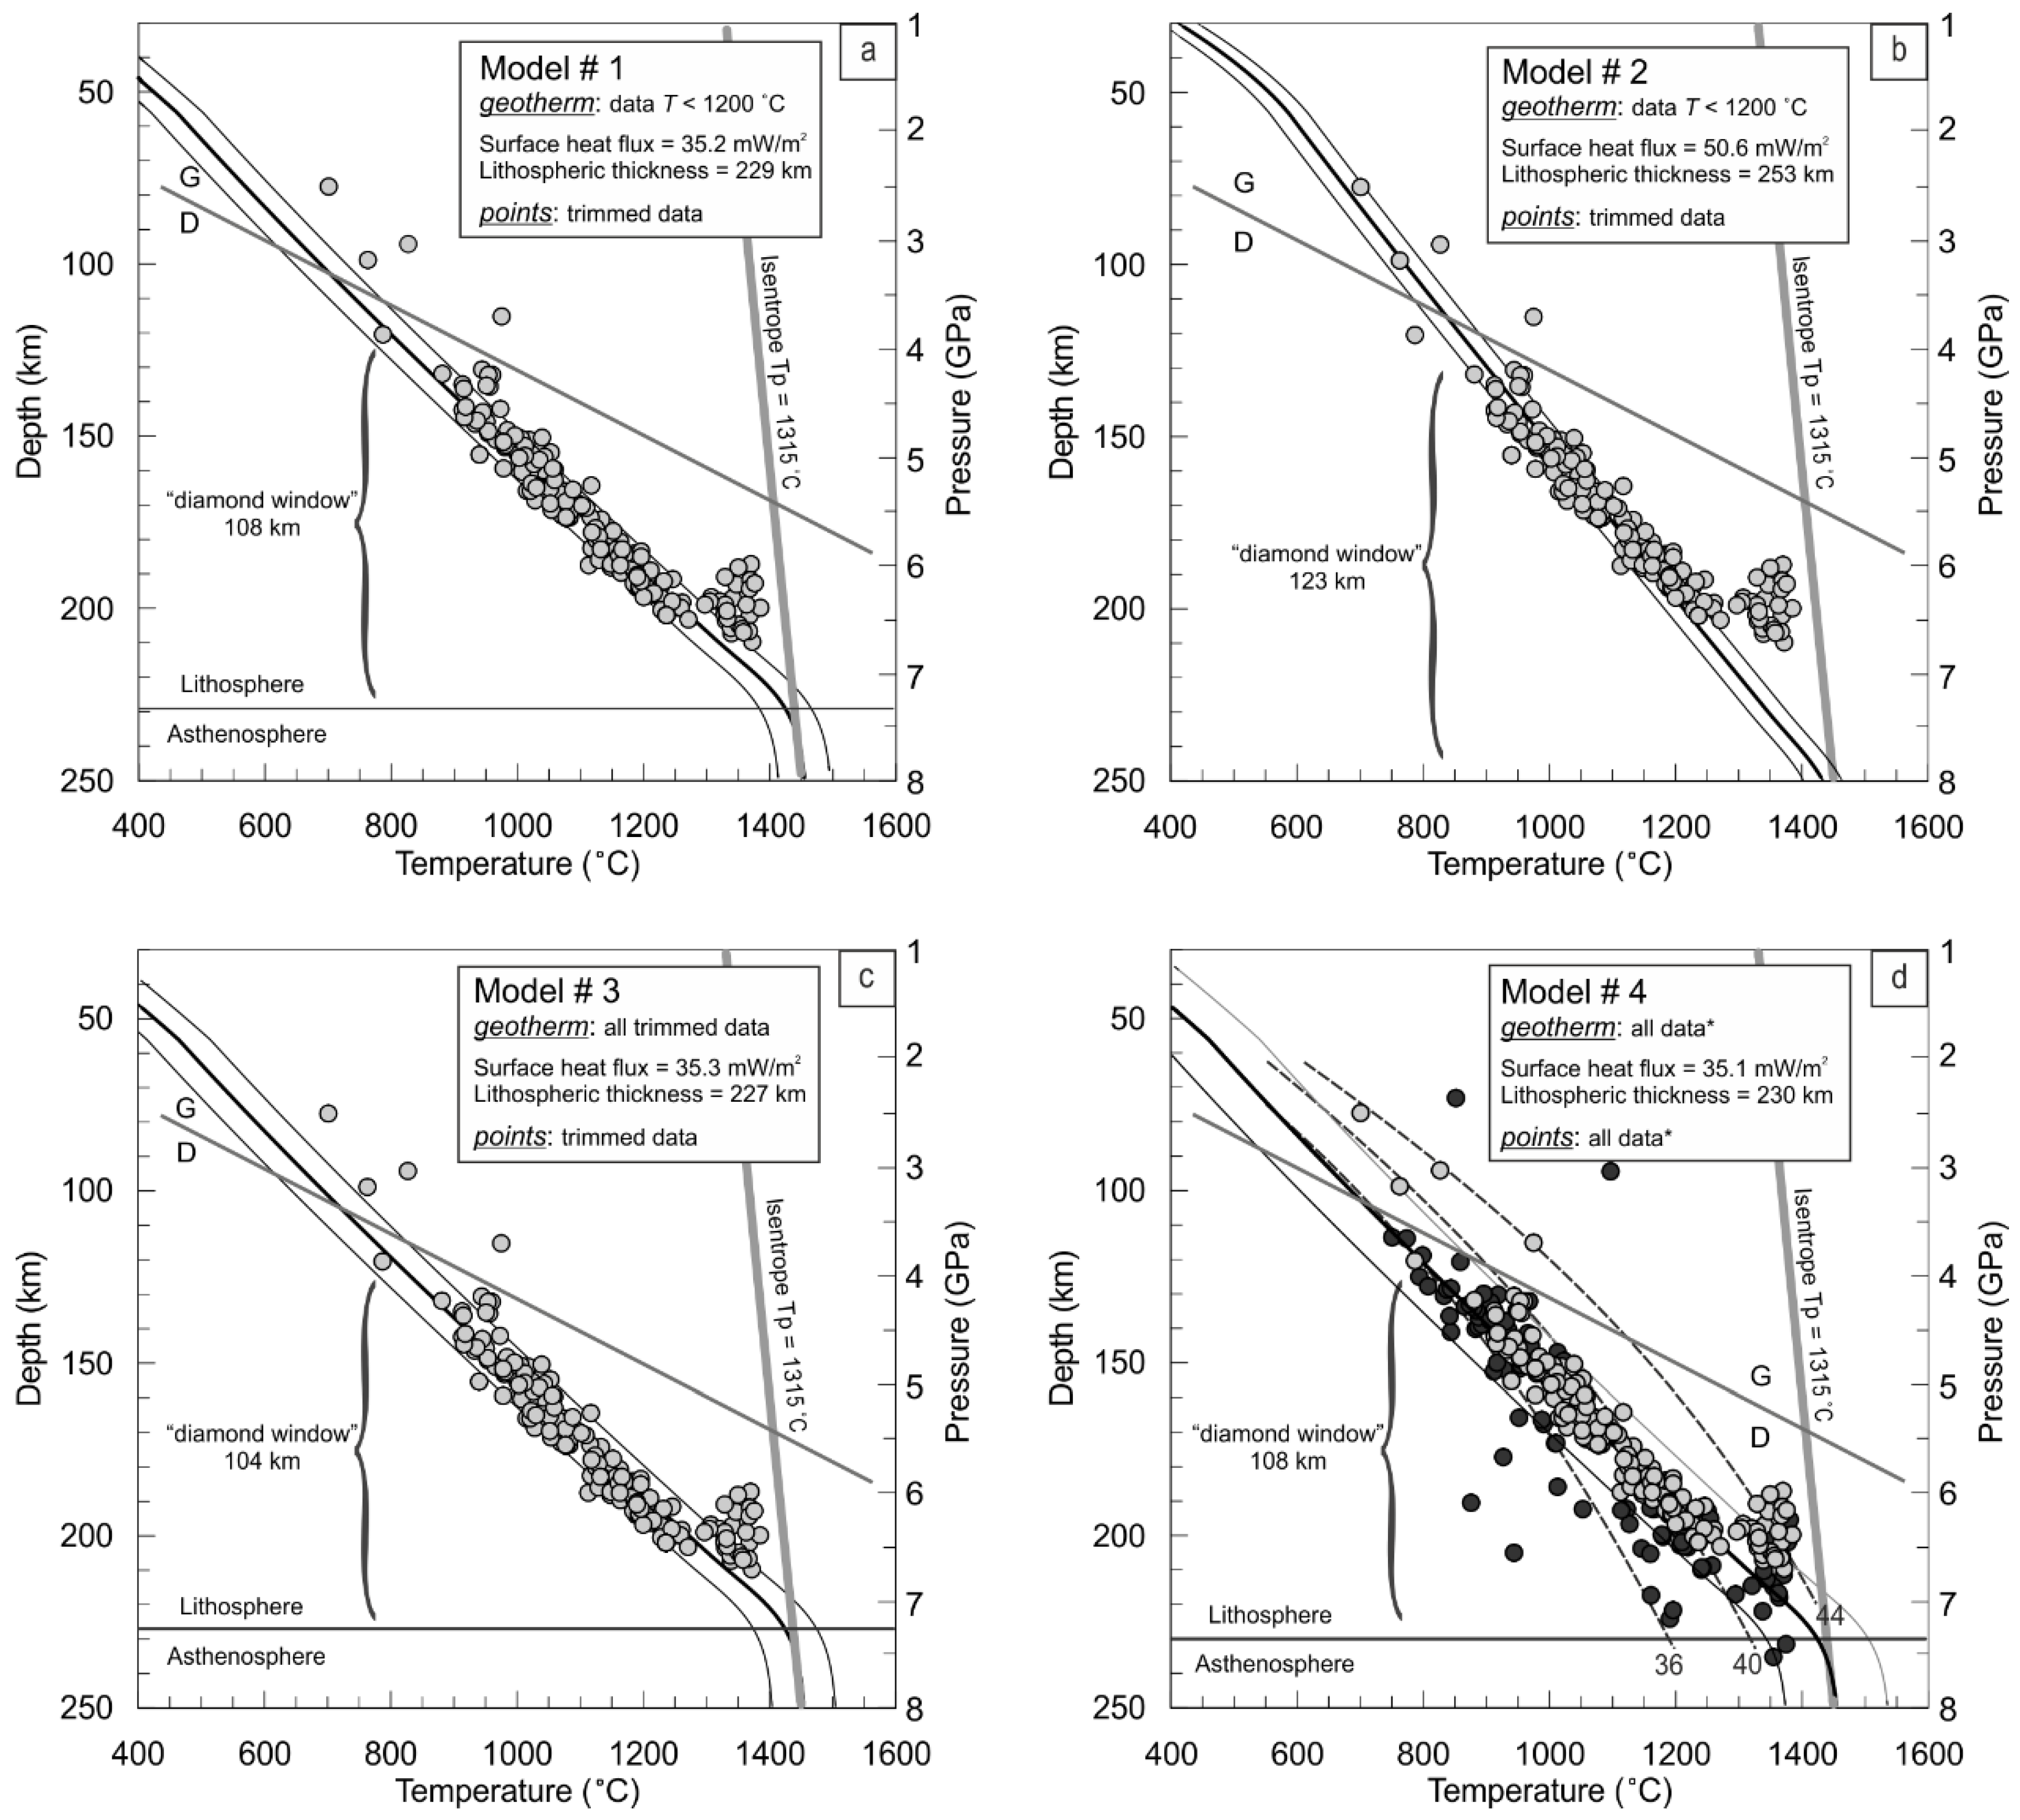
4.2. Steady-State Paleogeotherm for the Mantle Beneath the KM Pipe

Regardless of the nature of the high-T cluster of points, we exclude P-T points above 1200 °C for calculation of the steady-state paleogeotherm for the lithospheric mantle beneath the KM pipe, i.e., we have calculated the geotherm that existed prior to the thermal perturbation that preceded kimberlite emplacement (Section 5.2). Choosing T = 1200 °C as the cut-off value not only excludes the cluster of high-T points but also eliminates samples with possibly underestimated pressures because PNT00 has not been calibrated to P > 6 GPa.
The thermal properties of the crust have been identified as a significant source of uncertainty when calculating cratonic paleogeotherms [7,69]. We attempted to use the best available local estimations for the structure of the crust and its heat production for our preferred model (model #1), we fixed the heat production rate in the upper and lower crust beneath the Upper Muna field at 0.76 and 0.076 μW/m3 (Table 1) according to [35]. The thicknesses of the upper and lower crust were taken from [70] and they are 23 and 33 km, respectively (Table 1). Fitting of the accepted P-T estimates (<1200 °C) yields a surface heat flow of 35.2 mW/m2 and a lithosphere thickness of 229 km (Table 1, Figure 2a). The uncertainty of the geotherm calculation is plotted as thin lines (representing the 1-standard deviation misfit (Table 1)) parallel to the geotherm (Figure 2). The majority of the P-T points fall within this misfit.
McKenzie et al. [6], in their model for the Siberian craton (Udachnaya pipe), used higher values for the heat production rate both in the upper and lower crust—1.12 and 0.4 mW/m2. To demonstrate how the heat production rate in the crust affects geotherm parameters, we also calculated the paleogeotherm using these values (model #2, Table 1, Figure 2b). The resulting paleogeotherm requires a significantly higher surface heat flow (50.6 mW/m2) and lithosphere thickness (253 km) than model #1 (Table 1).
We calculated two other paleogeotherm models (Table 1). Model #3 (Figure 2c) uses all 188 clinopyroxenes accepted for PNT00 and TNT00. For model #4 (Figure 2c), we also included P-T estimates of 128 grains (avoiding seven samples showing crustal pressures) that were discredited by using the protocol (Section 3.1). Both models #3 and #4 yield surface heat flows and lithosphere thicknesses very similar to our preferred model #1, but with a higher misfit (Table 1). It is important to note that the vast majority of clinopyroxenes, filtered using the protocol, plot within misfit of model #4, whereas P-T points of clinopyroxene not recommended for PNT00 and TNT00 are significantly scattered (Figure 2d). This highlights the importance of the protocol proposed in [23] for the selection of appropriate clinopyroxene grains for single-clinopyroxene thermobarometry using PNT00 and TNT00. The similarity of the geotherm parameters obtained in models #1 and #3 demonstrates that inclusion of the high-T samples (>1200 °C) does not affect the calculated steady-state geotherm and only increases the resulting misfit. This is because most of the P-T points lie below 1200 °C and are scattered along a pressure range 5–7 times wider than the high-T cluster. The consistency in output parameters of models #1 and #4 shows that, even if the criteria for sample selection for PNT00 and TNT00 are ignored, a large array of P-T data may constrain a reasonable paleogeotherm, but with greater uncertainties (Table 1).

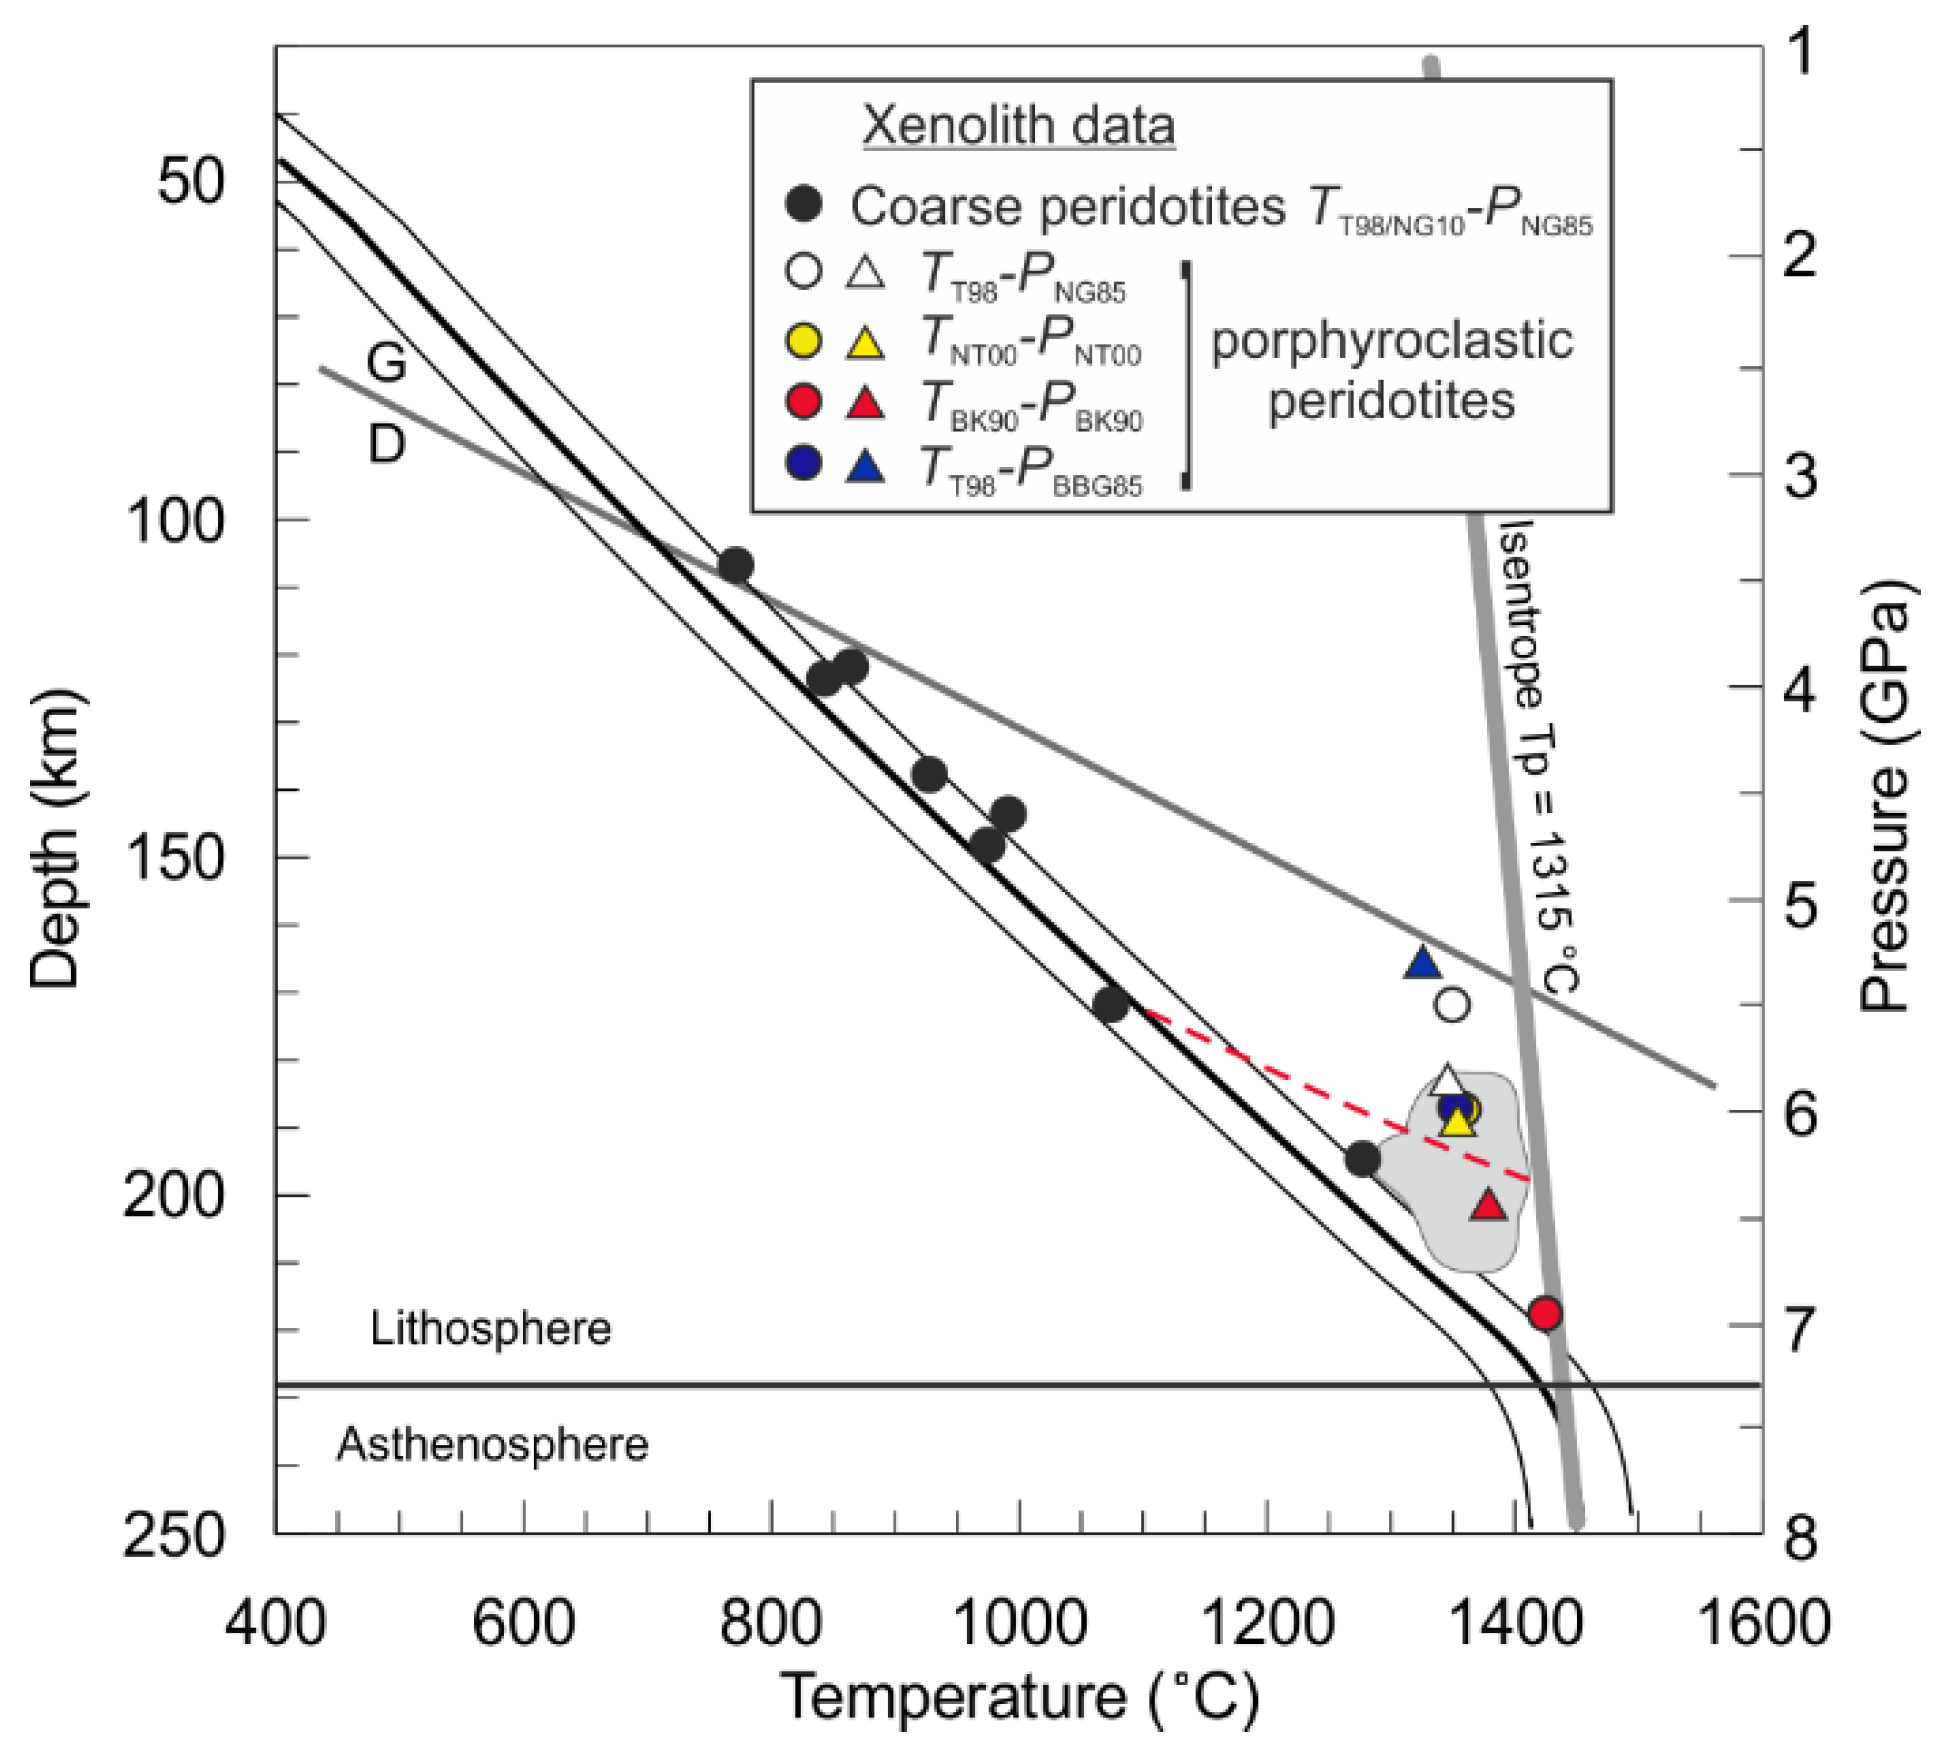
4.3. Thermobarometry of Mantle Xenoliths from the Komsomolskaya-Magnitnaya Pipe

We used combinations of either the orthopyroxene-garnet barometer of Nickel and Green [71] (PNG85) with the clinopyroxene-orthopyroxene thermometer of Taylor [72] (TT98) for clinopyroxene-bearing peridotites, or PNG85 with the orthopyroxene-garnet thermometer of Nimis and Grütter [73] (TNG10) for clinopyroxene-free peridotites. These combinations have been recommended as the most robust for peridotites [73]. P-T estimates for the coarse peridotites are in very good agreement with the preferred clinopyroxene geotherm (model #1), whereas P-T points for the porphyroclastic peridotites are outside the misfit area and plot within the high-T cluster of clinopyroxene xenocrysts (Figure 3). The latter phenomenon, which can be related to the pre-kimberlite thermal event, will be discussed in Section 5.2.

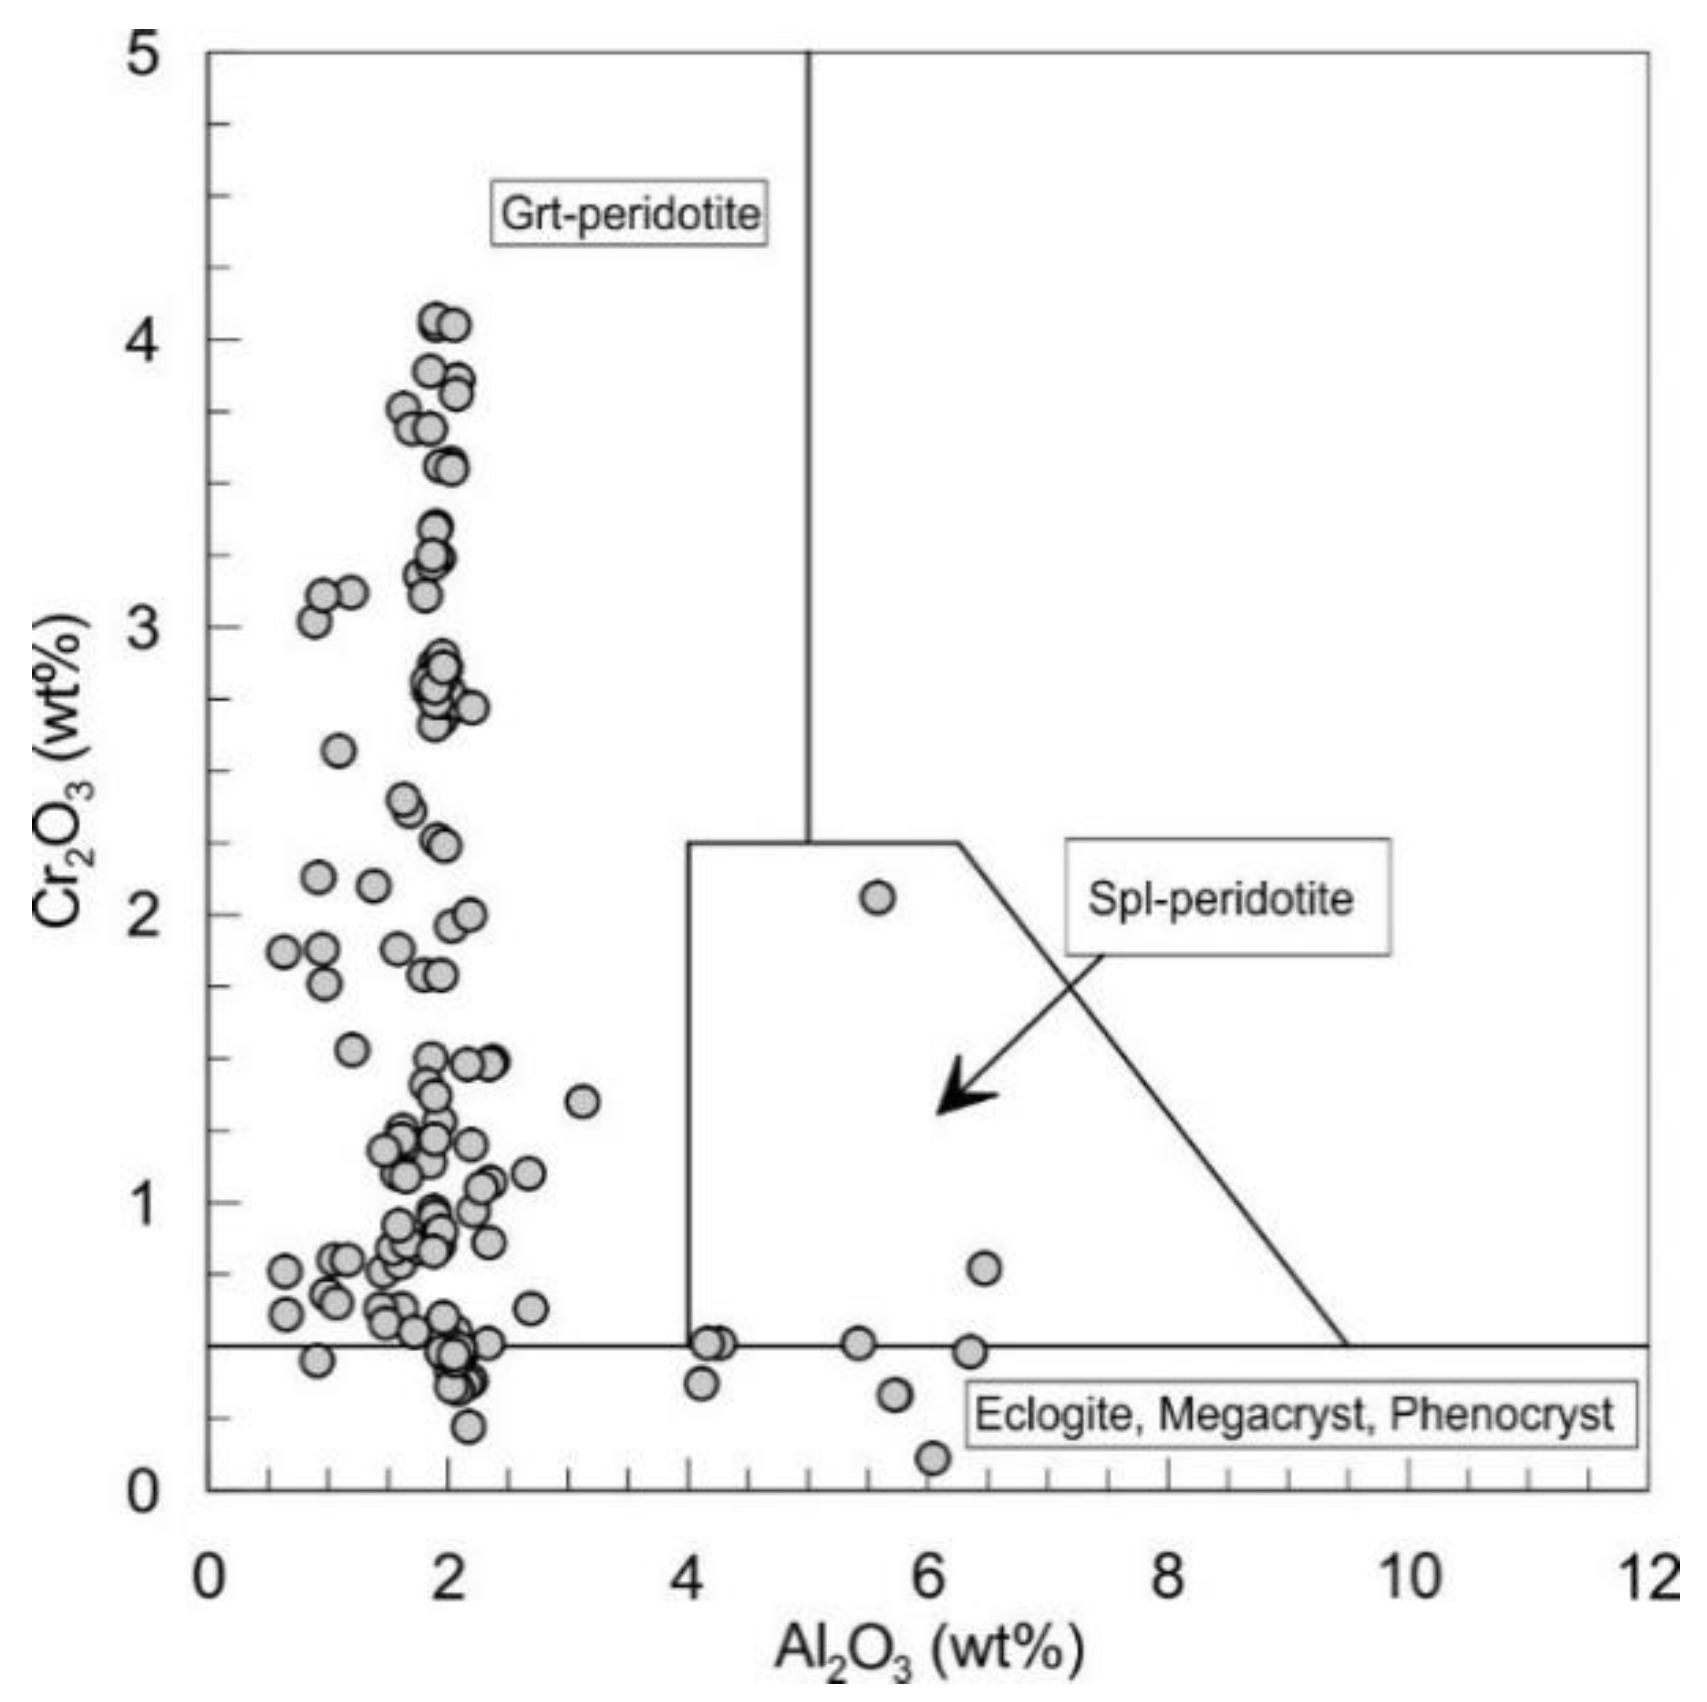
4.4. Mantle Composition for the Komsomolskaya-Magnitnaya Pipe: Constraints from Clinopyroxene Xenocrysts

Here, we discuss the data set that includes only homogenous clinopyroxene xenocrysts with satisfactory microprobe analyses, i.e., 323 grains. The 188 (58%) clinopyroxene grains accepted for thermobarometry are assumed to be derived from orthopyroxene-bearing garnet peridotites. The 114 clinopyroxenes that were rejected also belong to the peridotite paragenesis according to the criterion Cr2O3 >0.5 wt% [63] (Figure 4). One hundred and nine (31%) of them plot in the field of garnet peridotites in the discriminant diagram (Figure 4); among these, 109 grains show high Ca# > 0.5 and might not have been in equilibrium with orthopyroxene. The remaining 5 (4%) grains are from spinel peridotites (Figure 4).
The other 21 clinopyroxene xenocrysts may belong to eclogite xenoliths or the megacryst suite or may represent kimberlitic phenocrysts. This non-peridotitic group comprises only 7%, and keeping in mind that sampling of the lithosphere column by the kimberlite magmas need not be representative [74], we can suggest that peridotites are the predominant rocks in the lithospheric mantle beneath the KM pipe. At least 5 grains from non-peridotitic clinopyroxenes, which are characterized by high Na2O, Al2O3, and low MgO, may be derived from eclogites (Figure 5).

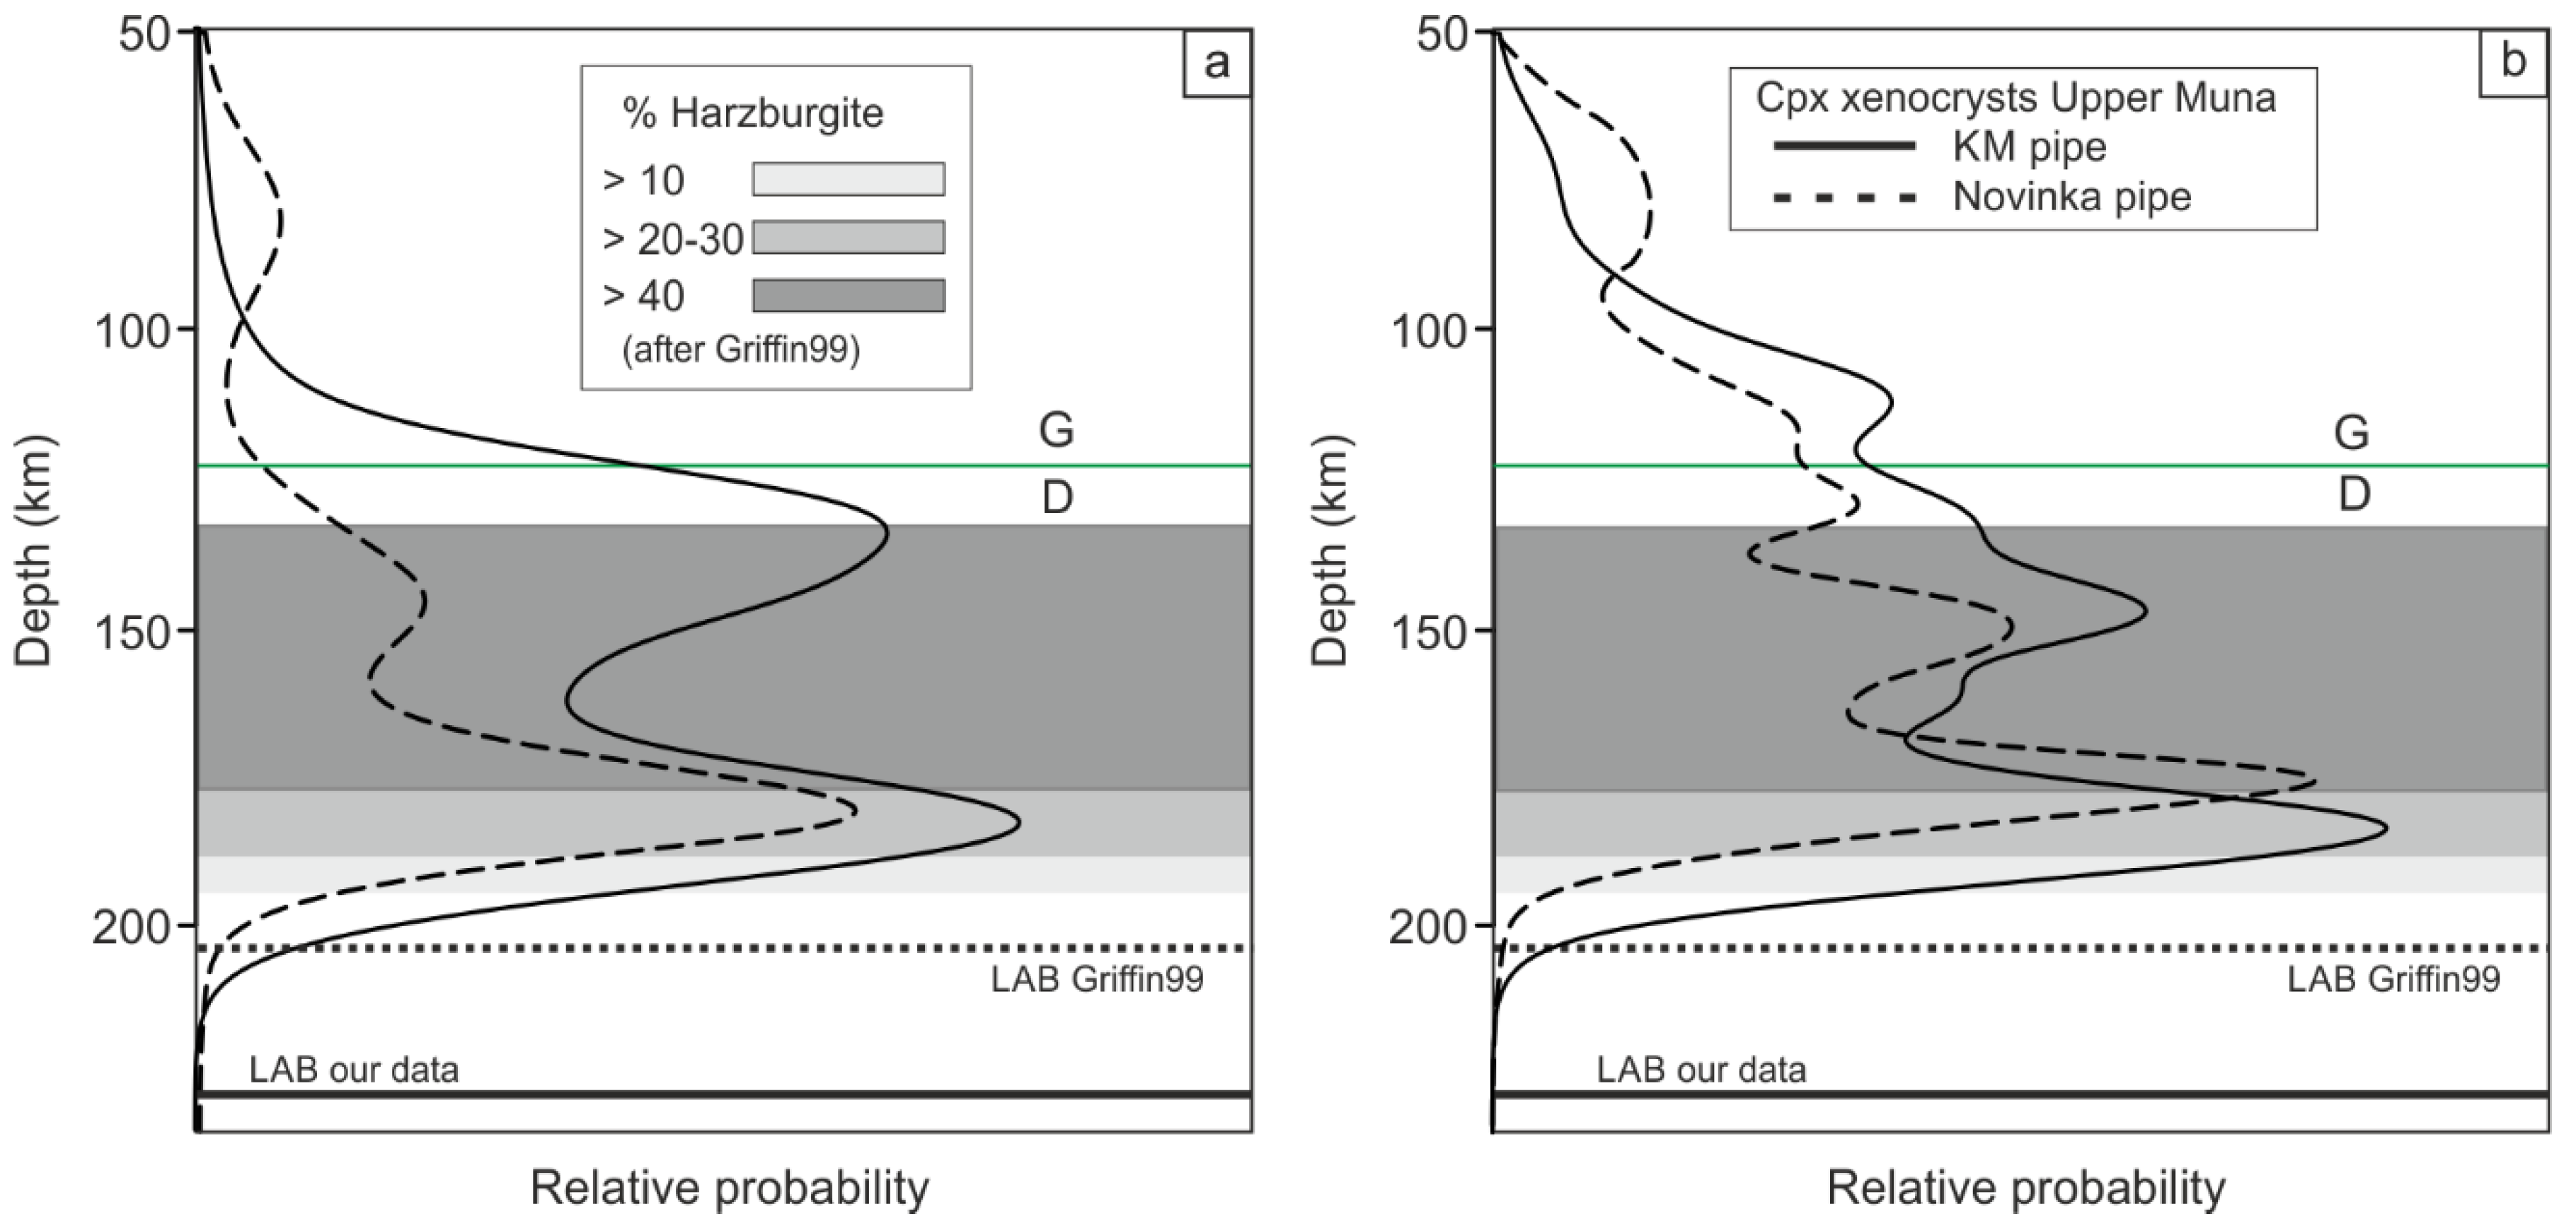
4.5. Clinopyroxene Xenocrysts: Depth Distribution Profile for KM Pipe

The pressures estimated from PNT00 demonstrate that the clinopyroxene grains accepted for thermobarometry show a bimodal depth distribution with peaks at 130 and 180 km (Figure 6a). However, accepted clinopyroxenes represent only 58% of all grains. Although 113 clinopyroxenes equilibrated with orthopyroxene were not accepted for PNT00, their P-T conditions may be calculated by using a combination of TNT00 and the obtained geotherm (model #1) as an equation for the barometer. The depth distribution profile for all 221 pyroxenes that were in equilibrium with orthopyroxene is shown in Figure 6b and is similar to that in Figure 6a. This comprises 89% of the grains and should yield a more representative depth distribution profile (Figure 6b).

4.6. The Mantle Paleogeotherm Beneath the Mir and Udachnaya Pipes

Input and output parameters for the Udachnaya and Mir geotherms are given in Table 1. We used original P-T values proposed by the authors for the mantle xenoliths and did not apply any filtering to the data. In the model #1 for both pipes, we used heat production rates in the upper and lower crust as in model #1 for the KM pipe. The Mir and Udachnaya pipes have similar thermal lithosphere thickness and surface heat flux (Figure 7, Table 1). In these models, the deepest (229 km) and the coldest lithosphere is observed beneath the KM pipe. However, the difference is not large and all three geotherms lie within their respective uncertainties. All paleogeotherms lie between the reference geotherms proposed by Hasterok and Chapman [77] with surface heat fluxes of 35 and 40 mW/m2.
For model #2, we used higher heat production rates in the upper and lower crust, and this yielded a higher thickness to slightly different degrees for all the pipes (Table 1). The higher values of the input heat production rates in the crust drastically affect the resulting surface heat flux for the calculated geotherms (Table 1). For all three pipes, surface heat flux and lithosphere thickness increased by 12–15 mW/m2 and 9–24 km in comparison to model #1. In Section 4.2, we proposed that the FITPLOT program fits the geotherms through the data array and is sensitive to the input crustal parameters. The higher values of the heat production in the crust (model #2) lead to a higher surface heat flux and a slightly oblique angle of the geotherm so it intersects the isentrope at greater depths (Section 5.1).

5. Discussion

5.1. A Mantle Paleogeotherm Beneath the Upper Muna Field

The common approach used to characterize the thermal state of the lithospheric mantle, used by petrologists for years, is a graphical comparison of the P-T data for mantle xenoliths and xenocrysts to the reference geotherms characterized in terms of surface heat flow [68] (hereafter PC77 geotherms). In this way, the best-fit geotherm is estimated qualitatively by eye. However, one of the main disadvantages of this method is that the resulting P-T data array often equally satisfies several reference geotherms. Other problems of this approach are discussed in detail in [7]. Currently, researchers both from scientific and diamond exploration communities use the FITPLOT program [10,13,15,32]. The FITPLOT program is based on an improved understanding of the thermal properties of the lithospheric mantle; it numerically fits obtained P-T data and allows the input of parameters for the crust estimated for the region of interest [7].
In order to compare our results with previous work, we nevertheless plotted our P-T estimates for clinopyroxene xenocrysts from the KM pipe against the reference PC77 geotherms (Figure 2d). Most of the KM samples lie between the 35 and 40 mW/m2 PC77 geotherms and the high-T cluster plots at 45 mW/m2 PC77 geotherm (Figure 2) similar to clinopyroxene xenocrysts from the Novinka pipe [23]. P-T estimates made for the large dataset of various mantle xenocrysts and xenoliths from the KM, Novinka, Deimos, and Zapolarnay pipes in [29,30] are scattered between 35 and 40 mW/m2. Overall, a qualitative comparison concludes that our data are similar to previous results on the Upper Muna field. However, it is difficult to estimate the exact depth of the lithosphere if paleogeotherms are estimated in terms of the range of surface heat flux of the reference PC77 geotherms. It is possible to estimate only an interval for the thermal lithosphere–asthenosphere boundary in the case of the 40 and 45 mW/m2 PC77 geotherms. Moreover, this is impossible in the case of PC77 geotherms with surface heat flux <40 mW/m2 because their gradients increase dramatically at depth and they do not cross the isentrope at any point [7]. However, in these cases, applying data for the deepest xenoliths can be used as an alternative method to assess lithosphere thickness [7,22]. Thus, the deepest mantle xenolith from [29,30] yields a lithosphere thickness of ~250 km, whereas our deepest sample gives 210 km (±20 km) for trimmed data and 235 km (±25 km) for all data (uncertainty for PNT00 based on [64]). However, the deepest P-T estimates may represent an artifact rather than realistic values due to analytical error or/and uncertainties in the barometer and/or thermometer. Thus, the lithosphere thickness may be overestimated. On the contrary, if P-T data are limited or if the kimberlite magma did not sample the entire lithosphere column, it may be underestimated.
Griffin et al. [2] also used the reference PC77 geotherms, but they applied the algorithms proposed by Ryan et al. [12] to garnet xenocrysts from three pipes (Novinka, Zapolarnaya, and Zimnaya) to estimate the paleogeotherm beneath the Upper Muna field using the Ni-in-garnet (TR96) thermometer and Cr-in-garnet barometer (PR96). The PR96 barometer has a limitation, because reliable pressure estimates can only be done for Cr-saturated garnets that coexisted with spinel, otherwise only minimum pressures can be estimated [12]. Thus, the “garnet geotherm” was defined by the envelope of maximum pressure at each temperature (see Figure 4 in [2]), assuming those garnets coexisted with chrome spinel. The resultant paleogeotherm corresponds to the 38 mW/m2 PC77 geotherm. However, above 1100 °C (~6 GPa), the locus of maximum PR96 no longer follows the 38 mW/m2 geotherm and there are no garnets with PR96 > 6 GPa. This is probably because most high-temperature garnets are undersaturated in Cr, i.e., were not in equilibrium with chromite. The pressure of each garnet grain was derived by projecting its TR96 to the geotherm [2]. Griffin et al. [2] defined the lithosphere as depleted material with garnets containing <10 ppm Y, distinct from the convecting, presumably more “fertile” asthenosphere. Thus, the lithosphere–asthenosphere boundary was determined as the temperature limit of the distribution of Y-depleted garnets. This corresponds to a pressure of ~6.5 GPa and a lithosphere thickness of ~205 km. At temperatures above 1000 °C (P > 6.5 GPa), there are only Y-rich garnets. Griffin et al. [2] noted that high-temperature garnets have undepleted trace-element chemistry similar to the garnets of high-temperature porphyroclastic xenoliths, and, thus, the lithosphere–asthenosphere boundary defined by Griffin et al. [2] actually represents a “kink” in the lithospheric paleogeotherm (Section 5.2). Therefore, we suggest that the Griffin et al. [2] approach underestimated the lithosphere thickness beneath the Upper Muna field by ca 10%.
Ziberna et al. [23] constrained the mantle paleogeotherm beneath the Novinka pipe based on 173 clinopyroxene xenocrysts. The authors evaluated the paleogeotherm using the FITPLOT program indicating ~34 mW/m2 surface heat flow, a thermal lithosphere thickness of ~225 km, and an over 100 km thick “diamond window” beneath the pipe at the time of kimberlite eruption.
Comparison of our models #1 and #2 geotherms for the KM pipe constrained by the FITPLOT program demonstrates that assumed heat production rates in the crust have drastic effects on the calculated paleogeotherm and lithosphere thickness. Heat production rates used in [6] were calculated based on the data from uplifted granulite terranes in Canada, whereas estimations in [35] are based on the upper and lower crustal xenoliths from Siberian kimberlites. We think that it is important to use the best available local estimates for the crustal parameters.
Thermal modeling has been used to propose that the present-day thermal lithosphere thickness varies from 300–350 km in the central part of the Siberian craton, where extremely low heat flow values (18–25 mW/m2) are measured [69,78]. Thermo-petrological interpretations of seismic Vp-velocity model along the Peaceful Nuclear Explosions profiles confirm a 300 km [79] or 220–250 km [80] thick lithospheric mantle in this part of the Craton. Our model #2 gives a lithospheric thickness of more than 250 km and an extremely high surface heat flow (50.6 mW/m2). Such inconsistency makes model #2 meaningless and further confirms that model #1 yields the preferred steady-state mantle paleogeotherm for the KM pipe. Model #1 excludes high-T points that may reflect a “kink” in the geotherm that was probably formed shortly before kimberlite emplacement (Section 5.2). If this geotherm inflection took place, then our model #1 paleogeotherm characterizes the thermal state of the lithospheric mantle beneath the Upper Muna field prior to kimberlite magmatic activity. Ziberna et al. [23] also did not include high-T points for their paleogeotherm calculation for the Novinka pipe and obtained similar results. Combining our model #1 for the KM pipe and results for the Novinka pipe [23] we can accept a ~34–35 mW/m2 surface heat flux and ~225–230 km lithospheric thickness for the Upper Muna field. The consistency of P-T data for the coarse peridotites with the clinopyroxene geotherm model #1 (Figure 3) testifies that only a large P-T data set for clinopyroxene xenocrysts can be successfully used to robustly constrain the steady-state paleogeotherm. This confirms the conclusions of Mather et al. [7] that the carefully filtered xenocryst P-T data yield a paleogeotherm almost identical to that produced from the well-equilibrated xenoliths.
The differences in the present-day lithospheric thickness and surface heat flow [69,78,79,80,81] and those obtained from the paleogeotherm in this study indicate thickening of the continental lithosphere with age in the central part of the Siberian craton. The progressive thickening of the continental lithosphere is typical for Archean cratonic mantle [69].

5.2. The “Kink” Problem of the Paleogeotherm in Lithosphere Mantle

In general, two textural types of peridotites xenoliths from kimberlites are defined: coarse and porphyroclastic [4,61,66]. Coarse peridotites are derived from the upper parts of the lithospheric mantle and their P-T estimates usually lie along a reference PC77 geotherm. Porphyroclastic peridotites are derived from the lower part of the lithosphere and have a significantly higher temperature range within a narrow range of pressures, demonstrating an inflection from the P-T array defined by granular peridotites. This “kink” (or in some cases a “step”) in P-T trends is found in xenolith suites from many kimberlite localities worldwide. In the case of the KM pipe, also there is the cluster of high-T clinopyroxene xenocrysts located within a narrow pressure range (Figure 3) and distinct from the calculated steady-state geotherm (model #1). Thus, these clinopyroxenes may represent fragments of porhyroclastic peridotites. It is thought that the deviation formed by porhyroclastic peridotites from the steady-state geotherm defined by coarse peridotites identifies a thermal event that affected the base of lithosphere shortly before or at the time of kimberlite emplacement, e.g., a mantle plume that may cause kimberlite magmatism [65,66,82,83,84,85,86].
However, the kinked (or stepped) geotherm has been the subject of much debate, centered on whether it is an artifact of thermometers and barometers [65]. Most of the used thermometers and barometers are calibrated at pressures below 6 GPa, i.e., they do not cover the pressure range of porphyroclastic peridotites. Here, we studied two porphyroclastic peridotites from the KM pipe. Estimated P-T parameters for these xenoliths using combinations of different thermometers and barometers, recommended in [73], show scattering within a pressure range up to 1 GPa (Figure 3). Most of the estimates plot within the high-T cluster of clinopyroxene xenocrysts. It is remarkable that P and T estimated by PNT00 and TNT00 using clinopyroxenes from these xenoliths plots within the cluster formed by clinopyroxene xenocrysts (Figure 3). Recently, Brey et al. [87] recalibrated a barometer based on Al partitioning between orthopyroxene and garnet (Al-in-orthopyroxene barometer, PBBG08) at P > 6 and showed that PBBG08 adequately reproduces experimental pressures up to 8 GPa. PBBG08 yields pressures for these porphyroclastic peridotites somewhat lower than other barometers and enhances the “kink” effect (Figure 3). This effect was also reported for other kimberlite localities [65]. Thus, pressures obtained for porphyroclastic peridotites using PBBG08 clearly show deviation from the steady-state geotherm and indicate the possibility of the existence of kinked geotherms.
Regardless of whether kinked geotherms are real or not, our model #1 constrains the steady-state geotherm before possible “kink” formation preceding kimberlite magmatism. Even if we include high-T points, which possibly reflect a “kink”, their effect on the calculated parameters for the steady-state paleogeotherm is negligible.

5.3. Comparison of Lithospheric Thickness Beneath the Upper Muna, Daldyn, and Mirny Fields

The Udachnaya and Mir pipes are the most thoroughly characterized kimberlite localities within the Daldyn and Mirny fields. There are several studies with calculated paleogeotherms beneath the Daldyn field [6,10,30,88,89]. McKenzie et al. [6] calculated a paleogeotherm for the Udachnaya pipe using the FITPLOT program. The input parameters for crustal heat production rates as in our model #2. However, the lithosphere thickness (242 km) and surface heat flow (58.6 mW/m2) obtained by McKenzie et al. [6] are significantly higher than in our model #2. This is because McKenzie et al. [6] used a much higher value for the thickness of the upper crust than predicted for the Daldyn field [70], and as a result, the overall heat production for the crust was larger than in our model #2. We prefer our model #1 for the paleogeotherm beneath the Udachnaya pipe as well as for the Mir and KM pipes because the input parameters are estimated for given kimberlite localities in the Siberian craton [35,70]. The paleogeotherm for the mantle beneath the Mirny field was calculated using the FITPLOT program for the first time.
Paleogeotherms constrained from garnets xenocrysts yielded different lithosphere thicknesses beneath the studied kimberlite fields: Daldyn (230 km) > Upper Muna (205 km) > Mirny (190 km) [2]. In contrast, both our models #1 and #2 demonstrate the similar lithosphere thickness for the Upper Muna, Daldyn, and Mirny fields. The “Garnet geotherms” may probably underestimate the lithospheric thickness and the Mirny and Upper Muna fields were studied based on a limited number of grains [2]. Our method yields more accurate results because it is based on the precise fitting of the large data suite and confirms that the lithospheric thickness at the time of kimberlite magmatism did not vary strongly across the central part of the Siberian craton.

5.4. Composition and Stratigraphy of Lithospheric Mantle Beneath the Upper Muna Field

Our results demonstrate that peridotitic clinopyroxenes are predominant (89%) among the studied xenocrysts from the KM pipe, suggesting that the sampled mantle is mainly composed of peridotites. Peridotitic clinopyroxene xenocrysts are also prevalent in the Novinka pipe [23]. Rare data on mantle xenoliths confirm that peridotites are the main rock types in the lithospheric mantle beneath the Upper Muna field, whereas eclogites are rare [90].
The depth distribution of xenocrysts of peridotitic clinopyroxene (Figure 6b) may be interpreted in two ways: (i) as the distribution of clinopyroxene-bearing peridotites in the mantle column, or (ii) as preferential sampling of rocks from different depths by the kimberlite magma. These possibilities are not mutually exclusive. The depth distribution profiles for the KM and Novinka pipes look slightly different (Figure 6b). If these two nearby pipes sampled the same lithospheric mantle, then the difference may be caused by the second scenario. Both profiles show a bimodal distribution for both pipes with the region of lower clinopyroxene concentration at 140–180 km between two peaks (Figure 6b). This may be evidence for a layer of clinopyroxene-poor or -free peridotitic rocks such as harzburgites and dunites beneath the Upper Muna field. This observation is consistent with garnet xenocryst data, which show that most of G10 (harzburgitic/dunitic) garnets from the Upper Muna kimberlites are also concentrated over this depth interval [2], as shown in Figure 6.

5.5. Implication for Diamond Potential of the Siberian Kimberlites

Both the KM and Novinka pipes are characterized by lower diamond grades (0.5 and 0.6, in carats/ton [91]) than the Udachnaya (2.1 [11]) and Mir (3.5 [91]) pipes. The diamond grade of kimberlites depends on both lithospheric mantle characteristics and processes occurring during kimberlite emplacement. The diamond potential of the lithospheric mantle depends on (i) its thickness and thermal state, which control the thickness of its volume located in the diamond P-T stability field, the so-called “diamond window”, and (ii) balance between diamond-friendly and diamond-unfriendly events during its pre-kimberlite history. The “diamond window” is the area between the point at which the graphite–diamond transition intersects the paleogeotherm and the lithosphere–asthenosphere boundary (e.g., Figure 7). Many factors that take place during emplacement may affect the diamond potential of kimberlites, e.g., (i) rate of magma ascent and possible halts of rising magma at shallow depths, allowing resorption of diamond by the kimberlite magma, (ii) redox condition of the kimberlite melt, (iii) selective sampling of mantle rocks at different depths, (iv) dilution by country rock. Our model #1 demonstrates a thicker lithosphere and diamond window for the KM pipe than for the Udachnaya and Mir pipes (Figure 7). However, if the uncertainties are considered, this difference is not significant, and we can conclude that the lithospheric thickness for these three fields is similar. Therefore, the thermal state of the mantle is not the cause of the differences in diamond grade of kimberlites from the Upper Muna, Daldyn, and Mir pipes. Perhaps other factors described above cause differences in diamond grades. This requires further studies of both mantle samples and kimberlites of the Upper Muna field, and the KM pipe in particular.

6. Concluding Remarks

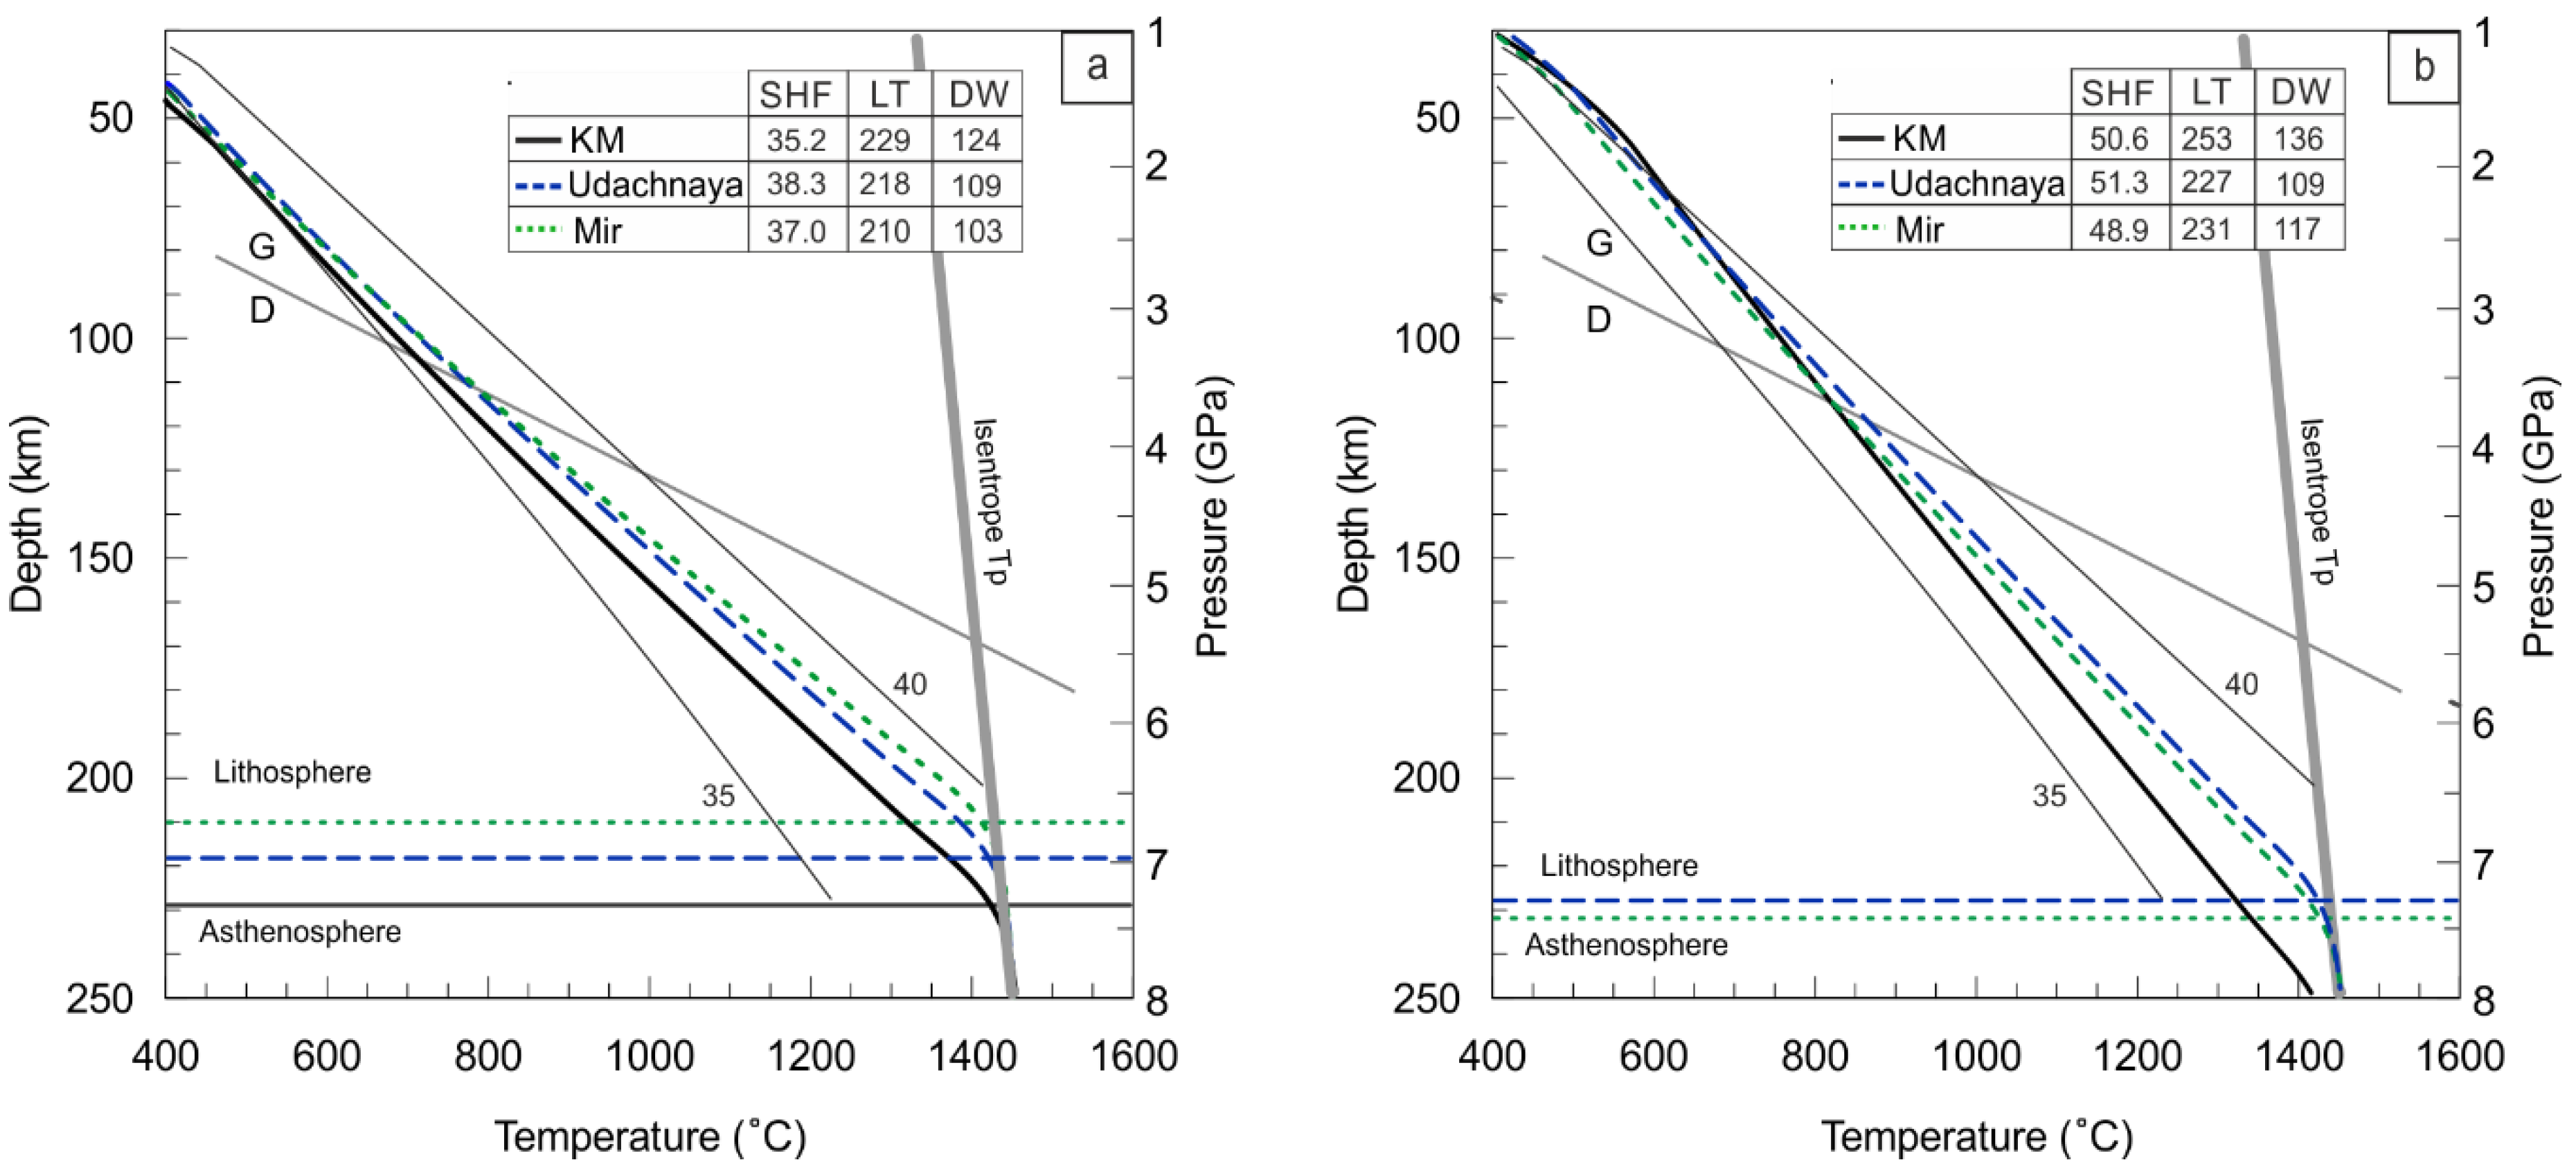
  • The preferred steady-state mantle paleogeotherm was constrained by P-T estimates of selected clinopyroxene xenocrysts from the Komsomolskaya-Magnitnaya pipe, i.e., that (i) passed through the protocol proposed by Ziberna et al. [23], and (ii) showed T < 1200 °C. Clinopyroxenes with T > 1200 °C were excluded because they may represent a “kink” caused by a thermal event associated with kimberlite magmatism.
  • P-T estimates for the coarse peridotites from the KM pipe are consistent with the clinopyroxene geotherm, testifying that large P-T data sets for clinopyroxene xenocrysts alone can be successfully used to constrain the robust steady-state paleogeotherm.
  • Fitting of P-T data for clinopyroxenes from the KM pipe using the FITPLOT program yielded a mantle paleogeotherm similar to the nearby Novinka pipe [23]. Thus, we accept a ~34–35 mW/m2 surface heat flux, 225–230 km lithospheric thickness, and 110–120 thick “diamond window” for the Upper Muna field.
  • Peridotitic clinopyroxenes are predominant (89%) among xenocrysts studied from the KM pipe, testifying that mantle beneath the Upper Muna field is mainly composed of peridotites. This is consistent with previous studies.
  • The estimated lithosphere thickness beneath Upper Muna is slightly larger than for the Daldyn (218 km) and Mirny (210 km) fields. However, considering their mutual uncertainties, the lithosphere thicknesses for these three fields are similar.

Supplementary Materials

The following are available online at https://www.mdpi.com/2075-163X/10/6/549/s1, Figure S1: Paleogeotherms calculated using the FITPLOT program for (a) the Udachnaya pipe and (b) the Mir pipe (see Table 1). Diamond (D)-graphite (G) transition from Day [67]. Table S1. Average major element composition (wt%) of minerals of Mir peridotite xenoliths (wt%) and calculated temperatures (°C) and pressures (GPa); Table S2. Composition of the clinopyroxene xenocrysts (wt%) suitable for Nimis and Taylor [24] thermobarometry. "Checks" shows the steps for grains filtering based on the protocol proposed by Ziberna et al. [23]; Table S3. Composition of the clinopyroxene xenocrysts excluded from the reliable P-T estimations for Nimis and Taylor [24] thermobarometry. "Checks" shows the steps for grains filtering based on the protocol proposed by Ziberna et al. [23]; Table S4. Average major element composition of minerals (wt%) of the Komsomolskaya-Magnitnaya peridotite xenoliths and calculated temperatures (°C) and pressures (GPa).

Author Contributions

Conceptualization, A.M.D., I.S.S. and V.G.M.; methodology, A.M.D. and I.S.S.; software, A.M.D.; validation, A.M.D. and I.S.S.; formal analysis, A.M.D., I.V.Y. and I.S.S.; investigation, A.M.D., I.V.Y., I.S.S., S.S.V. and S.V.P.; resources, A.M.D., I.S.S., V.G.M., A.A.G., T.A.A. and V.K.G.; data curation, A.M.D. and I.S.S.; writing—original draft preparation, A.M.D.; writing—review and editing, A.M.D., I.S.S., T.A.A. and V.K.M.; visualization, A.M.D., I.S.S. and S.V.P.; project administration, A.M.D.; funding acquisition, A.M.D., I.S.S. and V.G.M. All authors have read and agreed to the published version of the manuscript.

Funding

Sampling and study of the mantle xenoliths from the KM pipe, collection of literature data, P-T calculations for both the mantle xenoliths and clinopyroxene xenocrysts as well as computations of paleogeotherms were supported by the Russian Science Foundation, grant No. 18-77-00070. Sampling and electron microprobe analyses of clinopyroxene xenocrysts from the KM pipe were funded by the Russian Science Foundation, grant No 18-17-00249. Chemical analyses of minerals from the mantle xenoliths from the Mir pipe were supported by grant No. 18-77-10062 from the Russian Science Foundation.

Acknowledgments

We are grateful to S. Aulbach and W. Griffin for their constructive reviews that helped us to significantly improve this paper and to an Academic editor for manuscript handling.

Conflicts of Interest

The authors declare no conflict of interest. The funders had no role in the design of the study; in the collection, analyses, or interpretation of data; in the writing of the manuscript, or in the decision to publish the results.

References

  1. Griffin, W.L.; Kaminsky, F.V.; Ryan, C.G.; Oreilly, S.Y.; Win, T.T.; Ilupin, I.P. Thermal state and composition of the lithospheric mantle beneath the Daldyn kimberlite field, Yakutia. Tectonophysics 1996, 262, 19–33. [Google Scholar] [CrossRef]
  2. Griffin, W.L.; Ryan, C.G.; Kaminsky, F.V.; O’Reilly, S.Y.; Natapov, L.M.; Win, T.T.; Kinny, P.D.; Ilupin, I.P. The Siberian lithosphere traverse: Mantle terranes and the assembly of the Siberian Craton. Tectonophysics 1999, 310, 1–35. [Google Scholar] [CrossRef]
  3. Aulbach, S.; Griffin, W.L.; O’Reilly, S.Y.; McCandless, T.E. Genesis and evolution of the lithospheric mantle beneath the Buffalo Head Terrane, Alberta (Canada). Lithos 2004, 77, 413–451. [Google Scholar] [CrossRef]
  4. Agashev, A.M.; Ionov, D.A.; Pokhilenko, N.P.; Golovin, A.V.; Cherepanova, Y.; Sharygin, I.S. Metasomatism in lithospheric mantle roots: Constraints from whole-rock and mineral chemical composition of deformed peridotite xenoliths from kimberlite pipe Udachnaya. Lithos 2013, 160–161, 201–215. [Google Scholar] [CrossRef]
  5. Rezvukhin, D.I.; Malkovets, V.G.; Sharygin, I.S.; Tretiakova, I.G.; Griffin, W.L.; O’Reilly, S.Y. Inclusions of crichtonite-group minerals in Cr-pyropes from the Internatsionalnaya kimberlite pipe, Siberian Craton: Crystal chemistry, parageneses and relationships to mantle metasomatism. Lithos 2018, 308–309, 181–195. [Google Scholar] [CrossRef]
  6. McKenzie, D.; Jackson, J.; Priestley, K. Thermal structure of oceanic and continental lithosphere. Earth Planet. Sci. Lett. 2005, 233, 337–349. [Google Scholar] [CrossRef]
  7. Mather, K.A.; Pearson, D.G.; McKenzie, D.; Kjarsgaard, B.A.; Priestley, K. Constraints on the depth and thermal history of cratonic lithosphere from peridotite xenoliths, xenocrysts and seismology. Lithos 2011, 125, 729–742. [Google Scholar] [CrossRef]
  8. Griffin, W.L.; Fisher, N.I.; Friedman, J.; Ryan, C.G.; O’Reilly, S.Y. Cr-pyrope garnets in the lithospheric mantle. I. Compositional systematics and relations to tectonic setting. J. Petrol. 1999, 40, 679–704. [Google Scholar] [CrossRef]
  9. Kopylova, M.G.; Russell, J.K.; Cookenboo, H. Upper-mantle stratigraphy of the Slave craton, Canada: Insights into a new kimberlite province. Geology 1998, 26, 315–318. [Google Scholar] [CrossRef]
  10. Howarth, G.H.; Barry, P.H.; Pernet-Fisher, J.F.; Baziotis, I.P.; Pokhilenko, N.P.; Pokhilenko, L.N.; Bodnar, R.J.; Taylor, L.A.; Agashev, A.M. Superplume metasomatism: Evidence from Siberian mantle xenoliths. Lithos 2014, 184–187, 209–224. [Google Scholar] [CrossRef]
  11. Malkovets, V.G.; Griffin, W.L.; O’Reilly, S.Y.; Wood, B.J. Diamond, subcalcic garnet, and mantle metasomatism: Kimberlite sampling patterns define the link. Geology 2007, 35, 339–342. [Google Scholar] [CrossRef]
  12. Ryan, C.G.; Griffin, W.L.; Pearson, N.J. Garnet geotherms: Pressure-temperature data from Cr-pyrope garnet xenocrysts in volcanic rocks. J. Geophys. Res. Solid Earth 1996, 101, 5611–5625. [Google Scholar] [CrossRef]
  13. Kjarsgaard, B.A.; Januszczak, N.; Stiefenhofer, J. Diamond exploration and resource evaluation of kimberlites. Elements 2019, 15, 411–416. [Google Scholar] [CrossRef]
  14. Creighton, S. A semi-empirical manganese-in-garnet single crystal thermometer. Lithos 2009, 112, 177–182. [Google Scholar] [CrossRef]
  15. Seller, M.H. Lithosphere thickness determinations and kimberlite diamond potential. In Application of Indicator Mineral Methods to Bedrock and Sediments; McClenaghan, M.B., Layton-Matthews, D., Eds.; Natural Resources Canada, Geological Survey of Canada: Ottawa, ON, Canada, 2017; pp. 35–40. [Google Scholar]
  16. Grutter, H.S. Pyroxene xenocryst geotherms: Techniques and application. Lithos 2009, 112, 1167–1178. [Google Scholar] [CrossRef]
  17. Boyd, F.R. Siberian geotherm based on lherzolite xenoliths from the Udachnaya kimberlite, USSR. Geology 1984, 12, 528–530. [Google Scholar] [CrossRef]
  18. Boyd, F.R.; Pearson, D.G.; Hoal, K.O.; Hoal, B.G.; Nixon, P.H.; Kingston, M.J.; Mertzman, S.A. Garnet lherzolites from Louwrensia, Namibia: Bulk composition and P/T relations. Lithos 2004, 77, 573–592. [Google Scholar] [CrossRef]
  19. Rudnick, R.L.; McDonough, W.F.; O’Connell, R.J. Thermal structure, thickness and composition of continental lithosphere. Chem. Geol. 1998, 145, 395–411. [Google Scholar] [CrossRef]
  20. Finnerty, A.A.; Boyd, F.R. Thermobarometry for garnet peridotites: Basis for the determination of thermal and compositional structure of the upper mantle. In Mantle Xenolith; Nixon, P.H., Ed.; John Wiley & Sons: Chichester, UK, 1987; pp. 381–402. [Google Scholar]
  21. MacGregor, I.D. The system MgO-Al2O3-SiO2: Solubility of Al2O3 in enstatite for spinel and garnet peridotite compositions. Am. Mineral. 1974, 59, 110–119. [Google Scholar]
  22. Finnerty, A.A.; Boyd, F.R. Evaluation of thermobarometers for garnet peridotites. Geochim. Cosmochim. Acta 1984, 48, 15–27. [Google Scholar] [CrossRef]
  23. Ziberna, L.; Nimis, P.; Kuzmin, D.; Malkovets, V.G. Error sources in single-clinopyroxene thermobarometry and a mantle geotherm for the Novinka kimberlite, Yakutia. Am. Mineral. 2016, 101, 2222–2232. [Google Scholar] [CrossRef]
  24. Nimis, P.; Taylor, W.R. Single clinopyroxene thermobarometry for garnet peridotites. Part I. Calibration and testing of a Cr-in-Cpx barometer and an enstatite-in-Cpx thermometer. Contrib. Mineral. Petrol. 2000, 139, 541–554. [Google Scholar] [CrossRef]
  25. Goncharov, A.G.; Ionov, D.A.; Doucet, L.S.; Pokhilenko, L.N. Thermal state, oxygen fugacity and C-O-H fluid speciation in cratonic lithospheric mantle: New data on peridotite xenoliths from the Udachnaya kimberlite, Siberia. Earth Planet. Sci. Lett. 2012, 357, 99–110. [Google Scholar] [CrossRef]
  26. Pokhilenko, N.; Sobolev, N.; Boyd, F.; Pearson, D.; Shimizu, N. Megacrystalline pyrope peridotites in the lithosphere of the Siberian platform: Mineralogy, geochemical peculiarities and the problem of their origin. Russ. Geol. Geophys. 1993, 34, 56–67. [Google Scholar]
  27. Ionov, D.A.; Doucet, L.S.; Ashchepkov, I.V. Composition of the lithospheric mantle in the Siberian craton: New constraints from fresh peridotites in the Udachnaya-East kimberlite. J. Petrol. 2010, 51, 2177–2210. [Google Scholar] [CrossRef] [Green Version]
  28. Boyd, F.R.; Pokhilenko, N.P.; Pearson, D.G.; Mertzman, S.A.; Sobolev, N.V.; Finger, L.W. Composition of the Siberian cratonic mantle: Evidence from Udachnaya peridotite xenoliths. Contrib. Mineral. Petrol. 1997, 128, 228–246. [Google Scholar] [CrossRef]
  29. Ashchepkov, I.V.; Pokhilenko, N.P.; Vladykin, N.V.; Logvinova, A.M.; Afanasiev, V.P.; Pokhilenko, L.N.; Kuligin, S.S.; Malygina, E.V.; Alymova, N.A.; Kostrovitsky, S.I.; et al. Structure and evolution of the lithospheric mantle beneath Siberian craton, thermobarometric study. Tectonophysics 2010, 485, 17–41. [Google Scholar] [CrossRef]
  30. Ashchepkov, I.V.; Ivanov, A.S.; Kostrovitsky, S.I.; Vavilov, M.A.; Babushkina, S.A.; Vladykin, N.V.; Tychkov, N.S.; Medvedev, N.S. Mantle terranes of the siberian craton: Their interaction with plume melts based on thermobarometry and geochemistry of mantle xenocrysts. Geodyn. Tectonophys. 2019, 10, 197–245. (In Russian) [Google Scholar] [CrossRef]
  31. McKenzie, D.; Bickle, M.J. The volume and composition of melt generated by extension of the lithosphere. J. Petrol. 1988, 29, 625–679. [Google Scholar] [CrossRef]
  32. Pearson, D.; Liu, J.; Smith, C.; Mather, K.; Krebs, M.; Bulanova, G.; Kobussen, A. Characteristics and origin of the mantle root beneath the Murowa diamond mine: Implications for craton and diamond formation. Soc. Econ. Geol. Spec. Publ. 2017, 20, 403–423. [Google Scholar]
  33. Rosen, O.; Condie, K.C.; Natapov, L.M.; Nozhkin, A. Archean and early proterozoic evolution of the siberian craton: A preliminary assessment. In Developments in Precambrian Geology; Elsevier: Amsterdam, The Netherlands, 1994; Volume 11, pp. 411–459. [Google Scholar]
  34. Rosen, O.M.; Levskii, L.K.; Zhuravlev, D.Z.; Rotman, A.Y.; Spetsius, Z.V.; Makeev, A.F.; Zinchuk, N.N.; Manakov, A.V.; Serenko, V.P. Paleoproterozoic accretion in the Northeast Siberian craton: Isotopic dating of the Anabar collision system. Stratigr. Geol. Correl. 2006, 14, 581–601. [Google Scholar] [CrossRef]
  35. Rosen, O.M.; Soloviev, A.V.; Zhuravlev, D.Z. Thermal evolution of the northeastern siberian platform in the light of apatite fission-track dating of the deep drill core. Izv. Phys. Solid Earth 2009, 45, 914–931. [Google Scholar] [CrossRef]
  36. Griffin, W.; Belousova, E.; O’Neill, C.; O’Reilly, S.Y.; Malkovets, V.; Pearson, N.; Spetsius, S.; Wilde, S. The world turns over: Hadean–archean crust–mantle evolution. Lithos 2014, 189, 2–15. [Google Scholar] [CrossRef]
  37. Shatsky, V.S.; Malkovets, V.G.; Belousova, E.A.; Tretiakova, I.G.; Griffin, W.L.; Ragozin, A.L.; Gibsher, A.A.; O’Reilly, S.Y. Tectonothermal evolution of the continental crust beneath the Yakutian diamondiferous province (Siberian craton): U–Pb and Hf isotopic evidence on zircons from crustal xenoliths of kimberlite pipes. Precambrian Res. 2016, 282, 1–20. [Google Scholar] [CrossRef]
  38. Shatsky, V.S.; Malkovets, V.G.; Belousova, E.A.; Tretiakova, I.G.; Griffin, W.L.; Ragozin, A.L.; Wang, Q.; Gibsher, A.A.; O’Reilly, S.Y. Multi-stage modification of Paleoarchean crust beneath the Anabar tectonic province (Siberian craton). Precambrian Res. 2018, 305, 125–144. [Google Scholar] [CrossRef]
  39. Alifirova, T.A.; Pokhilenko, L.N.; Korsakov, A.V. Apatite, SiO2, rutile and orthopyroxene precipitates in minerals of eclogite xenoliths from Yakutian kimberlites, Russia. Lithos 2015, 226, 31–49. [Google Scholar] [CrossRef]
  40. Rosen, O.M.; Manakov, A.V.; Suvorov, V.D. The collisional system in the northeastern Siberian Craton and a problem of diamond-bearing lithospheric keel. Geotectonics 2005, 39, 456–479. [Google Scholar]
  41. Pokhilenko, N.P.; Sobolev, N.V.; Kuligin, S.S.; Shimizu, N. Peculiarities of distribution of pyroxenite paragenesis garnets in Yakutian kimberlites and some aspects of the evolution of the Siberian craton lithospheric mantle. In Proceedings of the 7th International Kimberlite Conference, Cape Town, South Africa, 11–17 April 1998; pp. 689–698. [Google Scholar]
  42. Zaitsev, A.; Smelov, A. Isotope Geochronology of Rocks of the Yakutian Kimberlite Province; DPMGI SB RAS: Yakutsk, Russia, 2010. (In Russian) [Google Scholar]
  43. Kostrovitsky, S.; Spetsius, Z.; Yakovlev, D.; der Flaass, G.F.; Bogush, I.; Pokhilenko, N. Atlas of the Igneous Rocks and Diamond Deposits of the Yakut Kimberlite Province; Pokhilenko, N., Ed.; MPG: Mirniy, Russia, 2015; p. 480. (In Russian) [Google Scholar]
  44. Agashev, A.M.; Pokhilenko, N.P.; Tolstov, A.V.; Polyanichko, V.V.; Mal’kovets, V.G.; Sobolev, N.V. New age data on kimberlites from the Yakutian diamondiferous province. Dokl. Earth Sci. 2004, 399, 1142–1145. [Google Scholar]
  45. Davies, G.L.; Sobolev, N.V.; Kharkiv, A.D. New data on the age of Yakutian kimberlites (U–Pb zircon method). Dokl. Akad. Nauk SSSR 1980, 254, 175–179. (In Russian) [Google Scholar]
  46. Kinny, P.D.; Griffin, B.J.; Heaman, L.M.; Brakhfogel, F.F.; Spetsius, Z.V. SHRIMP U-Pb ages of perovskite from Yakutian kimberlites. Geol. I Geofiz. 1997, 38, 91–99. [Google Scholar]
  47. Sun, J.; Liu, C.-Z.; Tappe, S.; Kostrovitsky, S.I.; Wu, F.-Y.; Yakovlev, D.; Yang, Y.-H.; Yang, J.-H. Repeated kimberlite magmatism beneath Yakutia and its relationship to Siberian flood volcanism: Insights from in situ U–Pb and Sr–Nd perovskite isotope analysis. Earth Planet. Sci. Lett. 2014, 404, 283–295. [Google Scholar] [CrossRef]
  48. Sun, J.; Tappe, S.; Kostrovitsky, S.I.; Liu, C.-Z.; Skuzovatov, S.Y.; Wu, F.-Y. Mantle sources of kimberlites through time: A U-Pb and Lu-Hf isotope study of zircon megacrysts from the Siberian diamond fields. Chem. Geol. 2018, 479, 228–240. [Google Scholar] [CrossRef]
  49. Tretiakova, I.G.; Belousova, E.A.; Malkovets, V.G.; Griffin, W.L.; Piazolo, S.; Pearson, N.J.; O’Reilly, S.Y.; Nishido, H. Recurrent magmatic activity on a lithosphere-scale structure: Crystallization and deformation in kimberlitic zircons. Gondwana Res. 2017, 42, 126–132. [Google Scholar] [CrossRef]
  50. Kharkiv, A.D.; Zinchuk, N.N.; Kryuchkov, A.I. Primary Diamond Deposits of the World; Nedra: Moscow, Russia, 1998; p. 555. (In Russian) [Google Scholar]
  51. Levchenkov, O.A.; Gaidamako, I.M.; Levskii, L.K.; Komarov, A.N.; Yakovleva, S.Z.; Rizvanova, N.G.; Makeev, A.F. U-Pb age of zircon from the Mir and 325 Let Yakutii pipes. Dokl. Earth Sci. 2005, 400, 99–101. [Google Scholar]
  52. Lepekhina, E.; Rotman, A.; Antonov, A.; Sergeev, S. SIMS SHRIMP U-Pb dating of perovskite from kimberlites of the Siberian platform (Verhnemunskoe and Alakite-Marhinskoe fields). In Proceedings of the 9th International Kimberlite Conference: Extended Abstracts, Frankfurt, Germany, 10–15 August 2008. Extended Abstract No. 9IKC-A-00353. [Google Scholar]
  53. Lepekhina, E.; Rotman, A.; Antonov, A.; Sergeev, S. SHRIMP U-Pb zircon ages of Yakutian kimberlite pipes. In Proceedings of the 9th International Kimberlite Conference: Extended Abstracts, Frankfurt, Germany, 10–15 August 2008. Extended Abstract No. 9IKC-A-00354. [Google Scholar]
  54. Sarsadskih, N.N.; Blagulkina, V.A.; Silin, Y.I. On the absolute age of the Yakutian kimberlites. Doklady Akademii Nauk SSR. 1966, 168, 420–423. (In Russian) [Google Scholar]
  55. Kostrovitsky, S.I.; Solov’eva, L.V.; Yakovlev, D.A.; Suvorova, L.F.; Sandimirova, G.P.; Travin, A.V.; Yudin, D.S. Kimberlites and megacrystic suite: Isotope-geochemical studies. Petrology 2013, 21, 127–144. [Google Scholar] [CrossRef]
  56. Roden, M.; Lazko, E.; Jagoutz, E. The role of garnet pyroxenites in the Siberian lithosphere: Evidence from the Mir kimberlite. In Proceedings of the 7th International Kimberlite Conference, Cape Town, South Africa, 11–17 April 1998; pp. 714–720. [Google Scholar]
  57. Roden, M.F.; Patino-Douce, A.E.; Jagoutz, E.; Laz’ko, E.E. High pressure petrogenesis of Mg-rich garnet pyroxenites from Mir kimberlite, Russia. Lithos 2006, 90, 77–91. [Google Scholar] [CrossRef]
  58. Agashev, A.M.; Watanabe, T.; Bydaev, D.A.; Pokhilenko, N.P.; Fomin, A.S.; Maehara, K.; Maeda, J. Geochemistry of kimberlites from the Nakyn field, Siberia: Evidence for unique source composition. Geology 2001, 29, 267–270. [Google Scholar] [CrossRef]
  59. Yaxley, G.M.; Berry, A.J.; Kamenetsky, V.S.; Woodland, A.B.; Golovin, A.V. An oxygen fugacity profile through the Siberian Craton—Fe K-edge XANES determinations of Fe3+/ΣFe in garnets in peridotite xenoliths from the Udachnaya East kimberlite. Lithos 2012, 140, 142–151. [Google Scholar] [CrossRef]
  60. Doucet, L.S.; Ionov, D.A.; Golovin, A.V. The origin of coarse garnet peridotites in cratonic lithosphere: New data on xenoliths from the Udachnaya kimberlite, central Siberia. Contrib. Mineral. Petrol. 2013, 165, 1225–1242. [Google Scholar] [CrossRef]
  61. Golovin, A.V.; Sharygin, I.S.; Kamenetsky, V.S.; Korsakov, A.V.; Yaxley, G.M. Alkali-carbonate melts from the base of cratonic lithospheric mantle: Links to kimberlites. Chem. Geol. 2018, 483, 261–274. [Google Scholar] [CrossRef] [Green Version]
  62. Lavrent’ev, Y.G.; Karmanov, N.S.; Usova, L.V. Electron probe microanalysis of minerals: Microanalyzer or scanning electron microscope? Russ. Geol. Geophys. 2015, 56, 1154–1161. [Google Scholar] [CrossRef]
  63. Ramsay, R.R.; Tompkins, L. The geology, heavy mineral concentrate mineralogy, and diamond propectivity of the Boa Esperanca and Cana Verde pipes, Corrego D’anta, Minas Gerais, Brasil. In Proceedings of the Geology, Heavy Mineral Concentrate Mineralogy, and Diamond Propectivity of the Boa Esperanca and Cana Verde Pipes, Corrego D’anta, Minas Gerais, Brasil, 1 January 1994; pp. 329–345. [Google Scholar]
  64. Nimis, P. The pressures and temperatures of formation of diamond based on thermobarometry of chromian diopside inclusions. Can. Mineral. 2002, 40, 871–884. [Google Scholar] [CrossRef]
  65. O’Reilly, S.Y.; Griffin, W.L. The continental lithosphere-asthenosphere boundary: Can we sample it? Lithos 2010, 120, 1–13. [Google Scholar] [CrossRef]
  66. Sharygin, I.S.; Litasov, K.D.; Shatskiy, A.; Golovin, A.V.; Ohtani, E.; Pokhilenko, N.P. Melting phase relations of the Udachnaya-East Group-I kimberlite at 3.0–6.5 GPa: Experimental evidence for alkali-carbonatite composition of primary kimberlite melts and implications for mantle plumes. Gondwana Res. 2015, 28, 1391–1414. [Google Scholar] [CrossRef]
  67. Day, H.W. A revised diamond-graphite transition curve. Am. Mineral. 2012, 97, 52–62. [Google Scholar] [CrossRef]
  68. Pollack, H.N.; Chapman, D.S. On the regional variation of heat flow, geotherms and lithosphere thickness. Tectonophysics 1977, 38, 279–296. [Google Scholar] [CrossRef] [Green Version]
  69. Artemieva, I.M.; Mooney, W.D. Thermal thickness and evolution of Precambrian lithosphere: A global study. J. Geophys. Res. Solid Earth. 2001, 106, 16387–16414. [Google Scholar] [CrossRef] [Green Version]
  70. Suvorov, V.D.; Timirshin, K.V.; Yurin, Y.A.; Parasotka, B.S.; Matveev, V.D. Relation of deep-seated and near-surface structures in the southern part of the Yakutian kimberlite province according to seismic data. Geol. I Geofiz. 1997, 38, 1014–1020. (In Russian) [Google Scholar]
  71. Nickel, K.; Green, D. Empirical geothermobarometry for garnet peridotites and implications for the nature of the lithosphere, kimberlites and diamonds. Earth Planet. Sci. Lett. 1985, 73, 158–170. [Google Scholar] [CrossRef]
  72. Taylor, W. An experimental test of some geothermometer and geobaro-meter formulations for upper mantle peridotites with application to the ther-mobarometry of fertile lherzolite and garnet websterite. N. Jahrb. Für Mineral.-Abh. 1998, 172, 381–408. [Google Scholar]
  73. Nimis, P.; Grütter, H. Internally consistent geothermometers for garnet peridotites and pyroxenites. Contrib. Mineral. Petrol. 2010, 159, 411–427. [Google Scholar] [CrossRef]
  74. Aulbach, S.; Massuyeau, M.; Gaillard, F. Origins of cratonic mantle discontinuities: A view from petrology, geochemistry and thermodynamic models. Lithos 2017, 268–271, 364–382. [Google Scholar] [CrossRef] [Green Version]
  75. Taylor, L.A.; Snyder, G.A.; Keller, R.; Remley, D.A.; Anand, M.; Wiesli, R.; Valley, J.; Sobolev, N.V. Petrogenesis of group A eclogites and websterites: Evidence from the Obnazhennaya kimberlite, Yakutia. Contrib. Mineral. Petrol. 2003, 145, 424–443. [Google Scholar] [CrossRef]
  76. Taylor, L.A.; Neal, C.R. Eclogites with oceanic crustal and mantle signatures from the Bellsbank kimberlite, South Africa. 1. Mineralogy, petrolory, and whole rock chemistry. J. Geol. 1989, 97, 551–567. [Google Scholar] [CrossRef]
  77. Hasterok, D.; Chapman, D.S. Heat production and geotherms for the continental lithosphere. Earth Planet. Sci. Lett. 2011, 307, 59–70. [Google Scholar] [CrossRef]
  78. Cherepanova, Y.; Artemieva, I.M. Density heterogeneity of the cratonic lithosphere: A case study of the Siberian Craton. Gondwana Res. 2015, 28, 1344–1360. [Google Scholar] [CrossRef]
  79. Kuskov, O.L.; Kronrod, V.A.; Prokof’ev, A.A.; Pavlenkova, N.I. Petrological-geophysical models of the internal structure of the lithospheric mantle of the Siberian Craton. Petrology 2014, 22, 17–44. [Google Scholar] [CrossRef]
  80. Suvorov, V.D.; Mel’nik, E.A.; Mishen’kina, Z.R.; Pavlov, E.V.; Kochnev, V.A. Seismic inhomogeneities in the upper mantle beneath the Siberian craton (Meteorite profile). Russ. Geol. Geophys. 2013, 54, 1108–1120. [Google Scholar] [CrossRef]
  81. Kuskov, O.L.; Kronrod, V.A.; Prokof’ev, A.A. Thermal structure and thickness of the lithospheric mantle underlying the Siberian craton from the Kraton and Kimberlit Superlong seismic profiles. Izv. Phys. Solid Earth 2011, 47, 155–175. [Google Scholar] [CrossRef]
  82. Agashev, A.M.; Pokhilenko, N.P.; Mal’kovets, V.G.; Sobolev, N.V. Sm-Nd isotopic system in garnet megacrysts from the Udachnaya kimberlite pipe (Yakutia) and petrogenesis of kimberlites. Dokl. Earth Sci. 2006, 407, 491–494. [Google Scholar] [CrossRef]
  83. Shatskiy, A.; Litasov, K.D.; Sharygin, I.S.; Ohtani, E. Composition of primary kimberlite melt in a garnet lherzolite mantle source: Constraints from melting phase relations in anhydrous Udachnaya-East kimberlite with variable CO2 content at 6.5 GPa. Gondwana Res. 2017, 45, 208–227. [Google Scholar] [CrossRef]
  84. Torsvik, T.H.; Burke, K.; Steinberger, B.; Webb, S.J.; Ashwal, L.D. Diamonds sampled by plumes from the core–mantle boundary. Nature 2010, 466, 352–355. [Google Scholar] [CrossRef] [PubMed]
  85. Sleep, N.H. Geodynamic implications of xenolith geotherms. Geochem. Geophys. Geosyst. 2003, 4. [Google Scholar] [CrossRef]
  86. Gibson, S.A.; Thompson, R.N.; Day, J.A. Timescales and mechanisms of plume–lithosphere interactions: 40Ar/39Ar geochronology and geochemistry of alkaline igneous rocks from the Paraná–Etendeka large igneous province. Earth Planet. Sci. Lett. 2006, 251, 1–17. [Google Scholar] [CrossRef]
  87. Brey, G.P.; Bulatov, V.K.; Girnis, A.V. Geobarometry for peridotites: Experiments in simple and natural systems from 6 to 10 GPa. J. Petrol. 2008, 49, 3–24. [Google Scholar] [CrossRef]
  88. Miller, W.G.R.; Holland, T.J.B.; Gibson, S.A. Garnet and spinel oxybarometers: New internally consistent multi-equilibria models with applications to the Oxidation state of the lithospheric mantle. J. Petrol. 2016, 57, 1199–1222. [Google Scholar] [CrossRef] [Green Version]
  89. Tychkov, N.S.; Yudin, D.S.; Nikolenko, E.I.; Malygina, E.V.; Sobolev, N.V. Mesozoic lithospheric mantle of the northeastern Siberian craton (evidence from inclusions in kimberlite). Russ. Geol. Geophys. 2018, 59, 1254–1270. [Google Scholar] [CrossRef]
  90. Yakovlev, D.A.; Kostrovitsky, S.I.; Alymova, N.V. Composition features of kimberlites from the Upper Muna field (Yakutia). Izv. Earth Sci. Sect. RANS 2009, 1, 111–119. (In Russian) [Google Scholar]
  91. Kolganov, V.F.; Akishev, A.N.; Drozdov, A.V. Mining and Geological Features of the Primary Deposits of Diamonds in Yakutia; Mirny Printing House: Mirniy, Russia, 2013. (In Russian) [Google Scholar]
Figure 1. Schematic map of the Siberian craton showing boundaries of the craton (1), its basement structure with boundaries of tectonic provinces (2), and terranes within the provinces (3), and locations of Mesozoic (4) and Paleozoic (5) kimberlite fields. Modified after a figure from [39]. Tectonic structure is after [40]. Kimberlite fields are shown after [41]. The Anabar province consists of the Daldyn, Markha, and Magan terranes, and the Olenyok Province consists of the Hapschan, Birekte, and Aekit terranes. Red stars (6) indicate kimberlite localities discussed in this study.
Minerals 10 00549 g001
Figure 2. PNT00 and TNT00 estimates for clinopyroxene xenocrysts from the Komsomolskaya-Magnitnaya pipe and four modeled mantle paleogeotherms calculated using the FITPLOT program (see Table 1). Diamond (D)–graphite (G) transition from [67]. (a) Model #1; (b) Model #2; (c) Model #3; (d) Model #4. Reference PC77 geotherms [68] with surface heat flux 36, 40, and 44 mW/m2 are also shown. * Do not include clinopyroxenes plotted within crustal depths.
Minerals 10 00549 g002
Figure 3. Comparison between the paleogeotherm calculated using clinopyroxene xenocrysts data in the FITPLOT program (model #1) and the P-T estimates for mantle xenoliths from the Komsomolskaya-Magnitnaya (KM) pipe. The dashed red line schematically demonstrates the “kink” (Section 5.2). The grey field shows the cluster of high-T clinopyroxene xenocrysts from Figure 2.
Minerals 10 00549 g003
Figure 4. Composition of clinopyroxene xenocrysts from the Komsomolskaya-Magnitnaya pipe plotted on the discriminant diagram of Ramsay and Tompkins [63]. The data represent grains that have not passed through the protocol proposed by Ziberna et al. [23] (Section 4.1).
Minerals 10 00549 g004
Figure 5. Na2O vs. MgO relations in mantle-derived clinopyroxene xenocrysts from the Komsomolskaya-Magnitnaya pipe that were rejected by the compositional protocol of Ziberna et al. [23] (Section 4.1) and which were excluded from model #1–3 geotherm calculations. Fields of eclogites from the Udachnaya pipe and mantle peridotites of worldwide occurrences are after Taylor et al. [75]. The subdivisions for eclogites into A, B, and C groups are after Taylor and Neal [76].
Minerals 10 00549 g005
Figure 6. Depth distribution of clinopyroxene xenocrysts from the Komsomolskaya-Magnitnaya (KM) pipe in comparison with the neighboring Novinka pipe (Upper Muna field). The gray zones show the amount of harzburgitic rocks layer beneath the Upper Muna field based on garnet distribution by Griffin et al [2] (Griffin99). The horizontal green line is the graphite (G)–diamond (D) phase transition. LAB—lithosphere–asthenosphere boundary; solid line—our data (model #1); dotted line—from [2] (a) Only accepted for single crystal thermobarometry. P-T calculated by PNT00 and TNT00. KM pipe—188 grains (58%). Novinka pipe—97 grains (56%) [23]. (b) All peridotitic xenocrysts assumed in equilibrium with orthopyroxene. P-T calculated by intersection of TNT00 with the paleogeotherm model #1. KM pipe—201 grains (89%). Novinka pipe—123 grains (71%) (data from [23]).
Minerals 10 00549 g006
Figure 7. Comparison of model #1 (a) and #2 (b) mantle paleogeotherms beneath the Komsomolskaya-Magnitnaya (KM), Udachnaya, and Mir pipes (Table 1). SHF—surface heat flux in mW/m2, LT—lithosphere thickness in km, DW—diamond window in km. Reference geotherms by Hasterok and Chapman [77] with a surface heat flux of 35 and 40 mW/m2 are also shown.
Minerals 10 00549 g007
Table 1. Input and output parameters used in the FITPLOT program for geotherm modeling.
LocalityModelCommentsInputOutput
HUCRUST 1 (µW/m3)HLCRUST 1 (µW/m3)TUCRUST 2 (km)TLCRUST 2 (km)Misfit 3 (°C)LITH.B.L.4 (km)SURF. HFLUX 5 (mW/m2)
KM 1Trimmed P-T data,
T < 1200 °C
0.760.07623334122935.2
KM 2Trimmed P-T data,
T < 1200 °C
1.120.423333125350.6
KM 3All trimmed P-T data0.760.07623335022735.3
KM4All P-T points0.760.07623338023035.1
Novinka * [23] 225 *34.1 *
Udachnaya1 0.760.07628169621838.3
Udachnaya2 1.120.4281610822751.3
Udachnaya [6]1.120.44010 242 *58.6 *
Mir1 0.760.076251810121037.0
Mir2 1.120.425188123148.9
1 HUCRUST and HLCRUST are heat production values for the upper and lower crust; 2 TUCRUST and TLCRUST are thickness of the upper and lower crust; 3 Misfit—average misfit in temperature to geotherm fit; 4 LITH.B.L. (km) = estimated lithospheric depth; 5 SURF. HFLUX—surface heat flux. Input parameters are labeled as in the FITPLOT program [7]. * Literature data.

