Textural Identification of Polycrystalline Magmatic, Tectonically-Deformed, and Shock-Related Zircon Aggregates

Abstract
1. Introduction
2. Geological Settings and Samples
2.1. The Ivrea-Verbano Zone, Val d’Ossola, Northern Italy, Southern Alps
2.2. The Western Tauern Window, Tyrol, Southern Austria, Eastern Alps
3. Methodology
3.1. Sample Preparation
3.2. Scanning Electron Microscopy (SEM) and Cathodoluminescence (CL) Imaging
3.3. Electron Backscatter Diffraction (EBSD) Analysis
3.4. Microprobe Mapping
4. Results
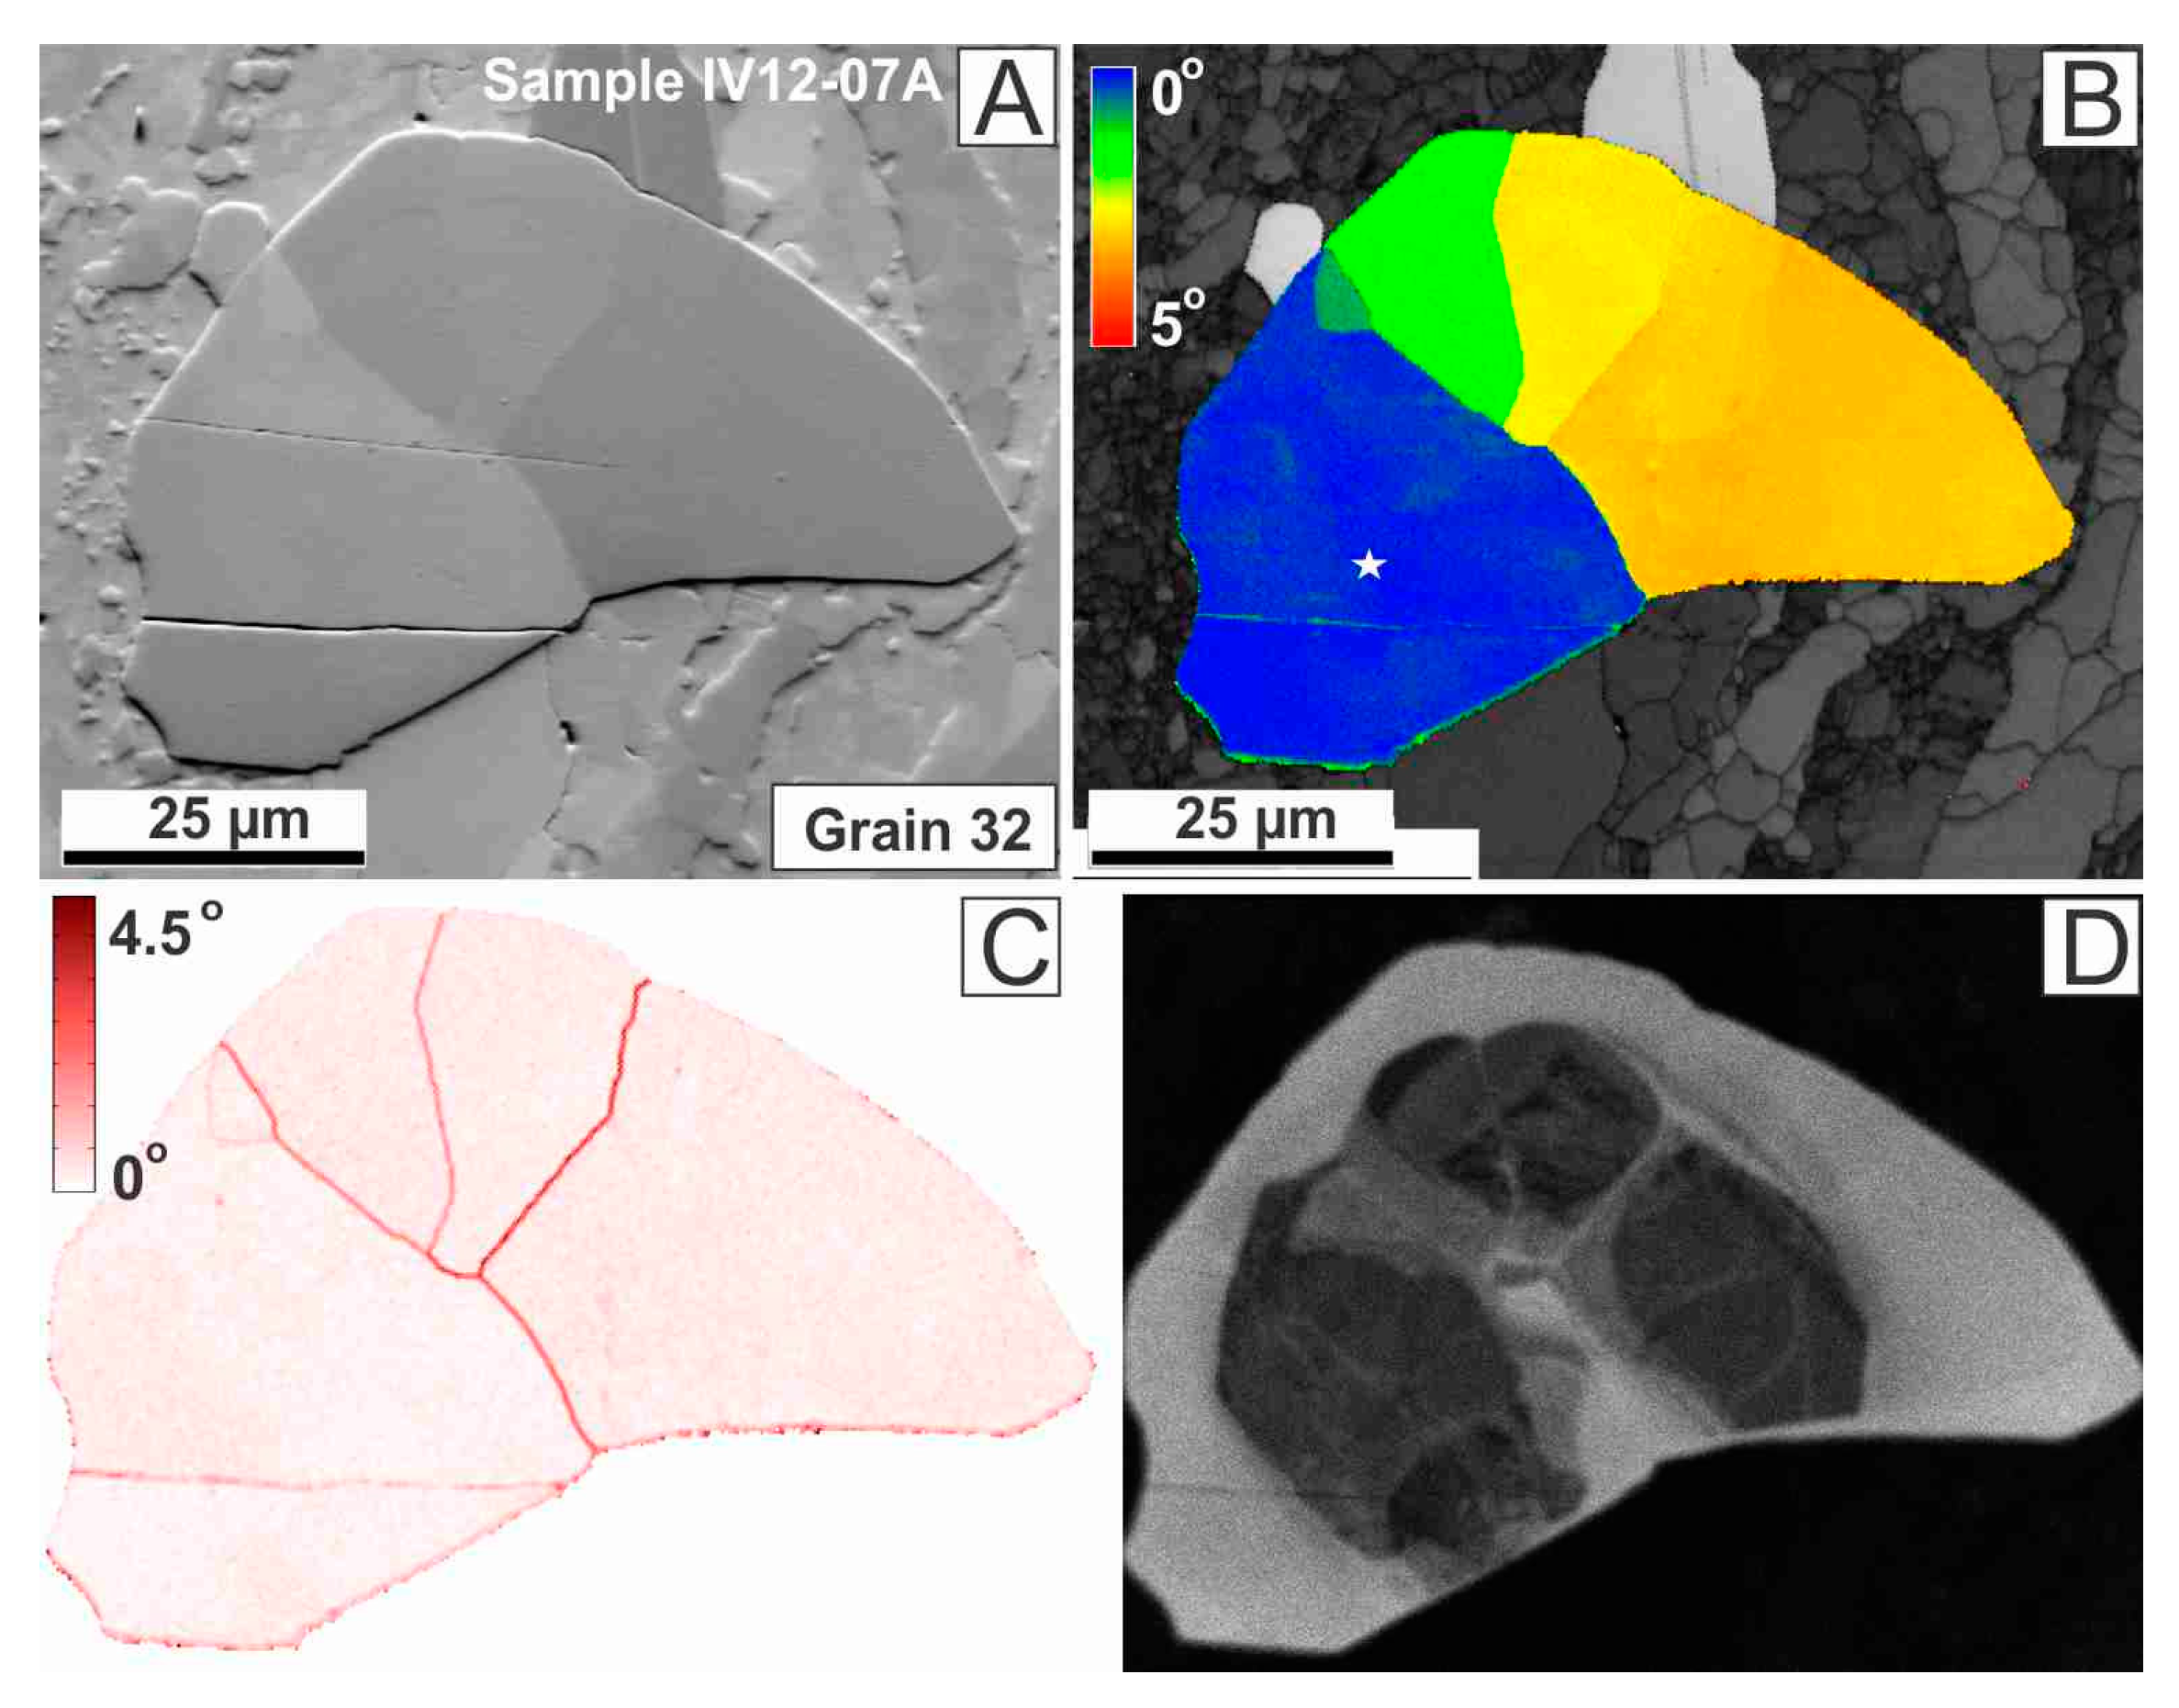
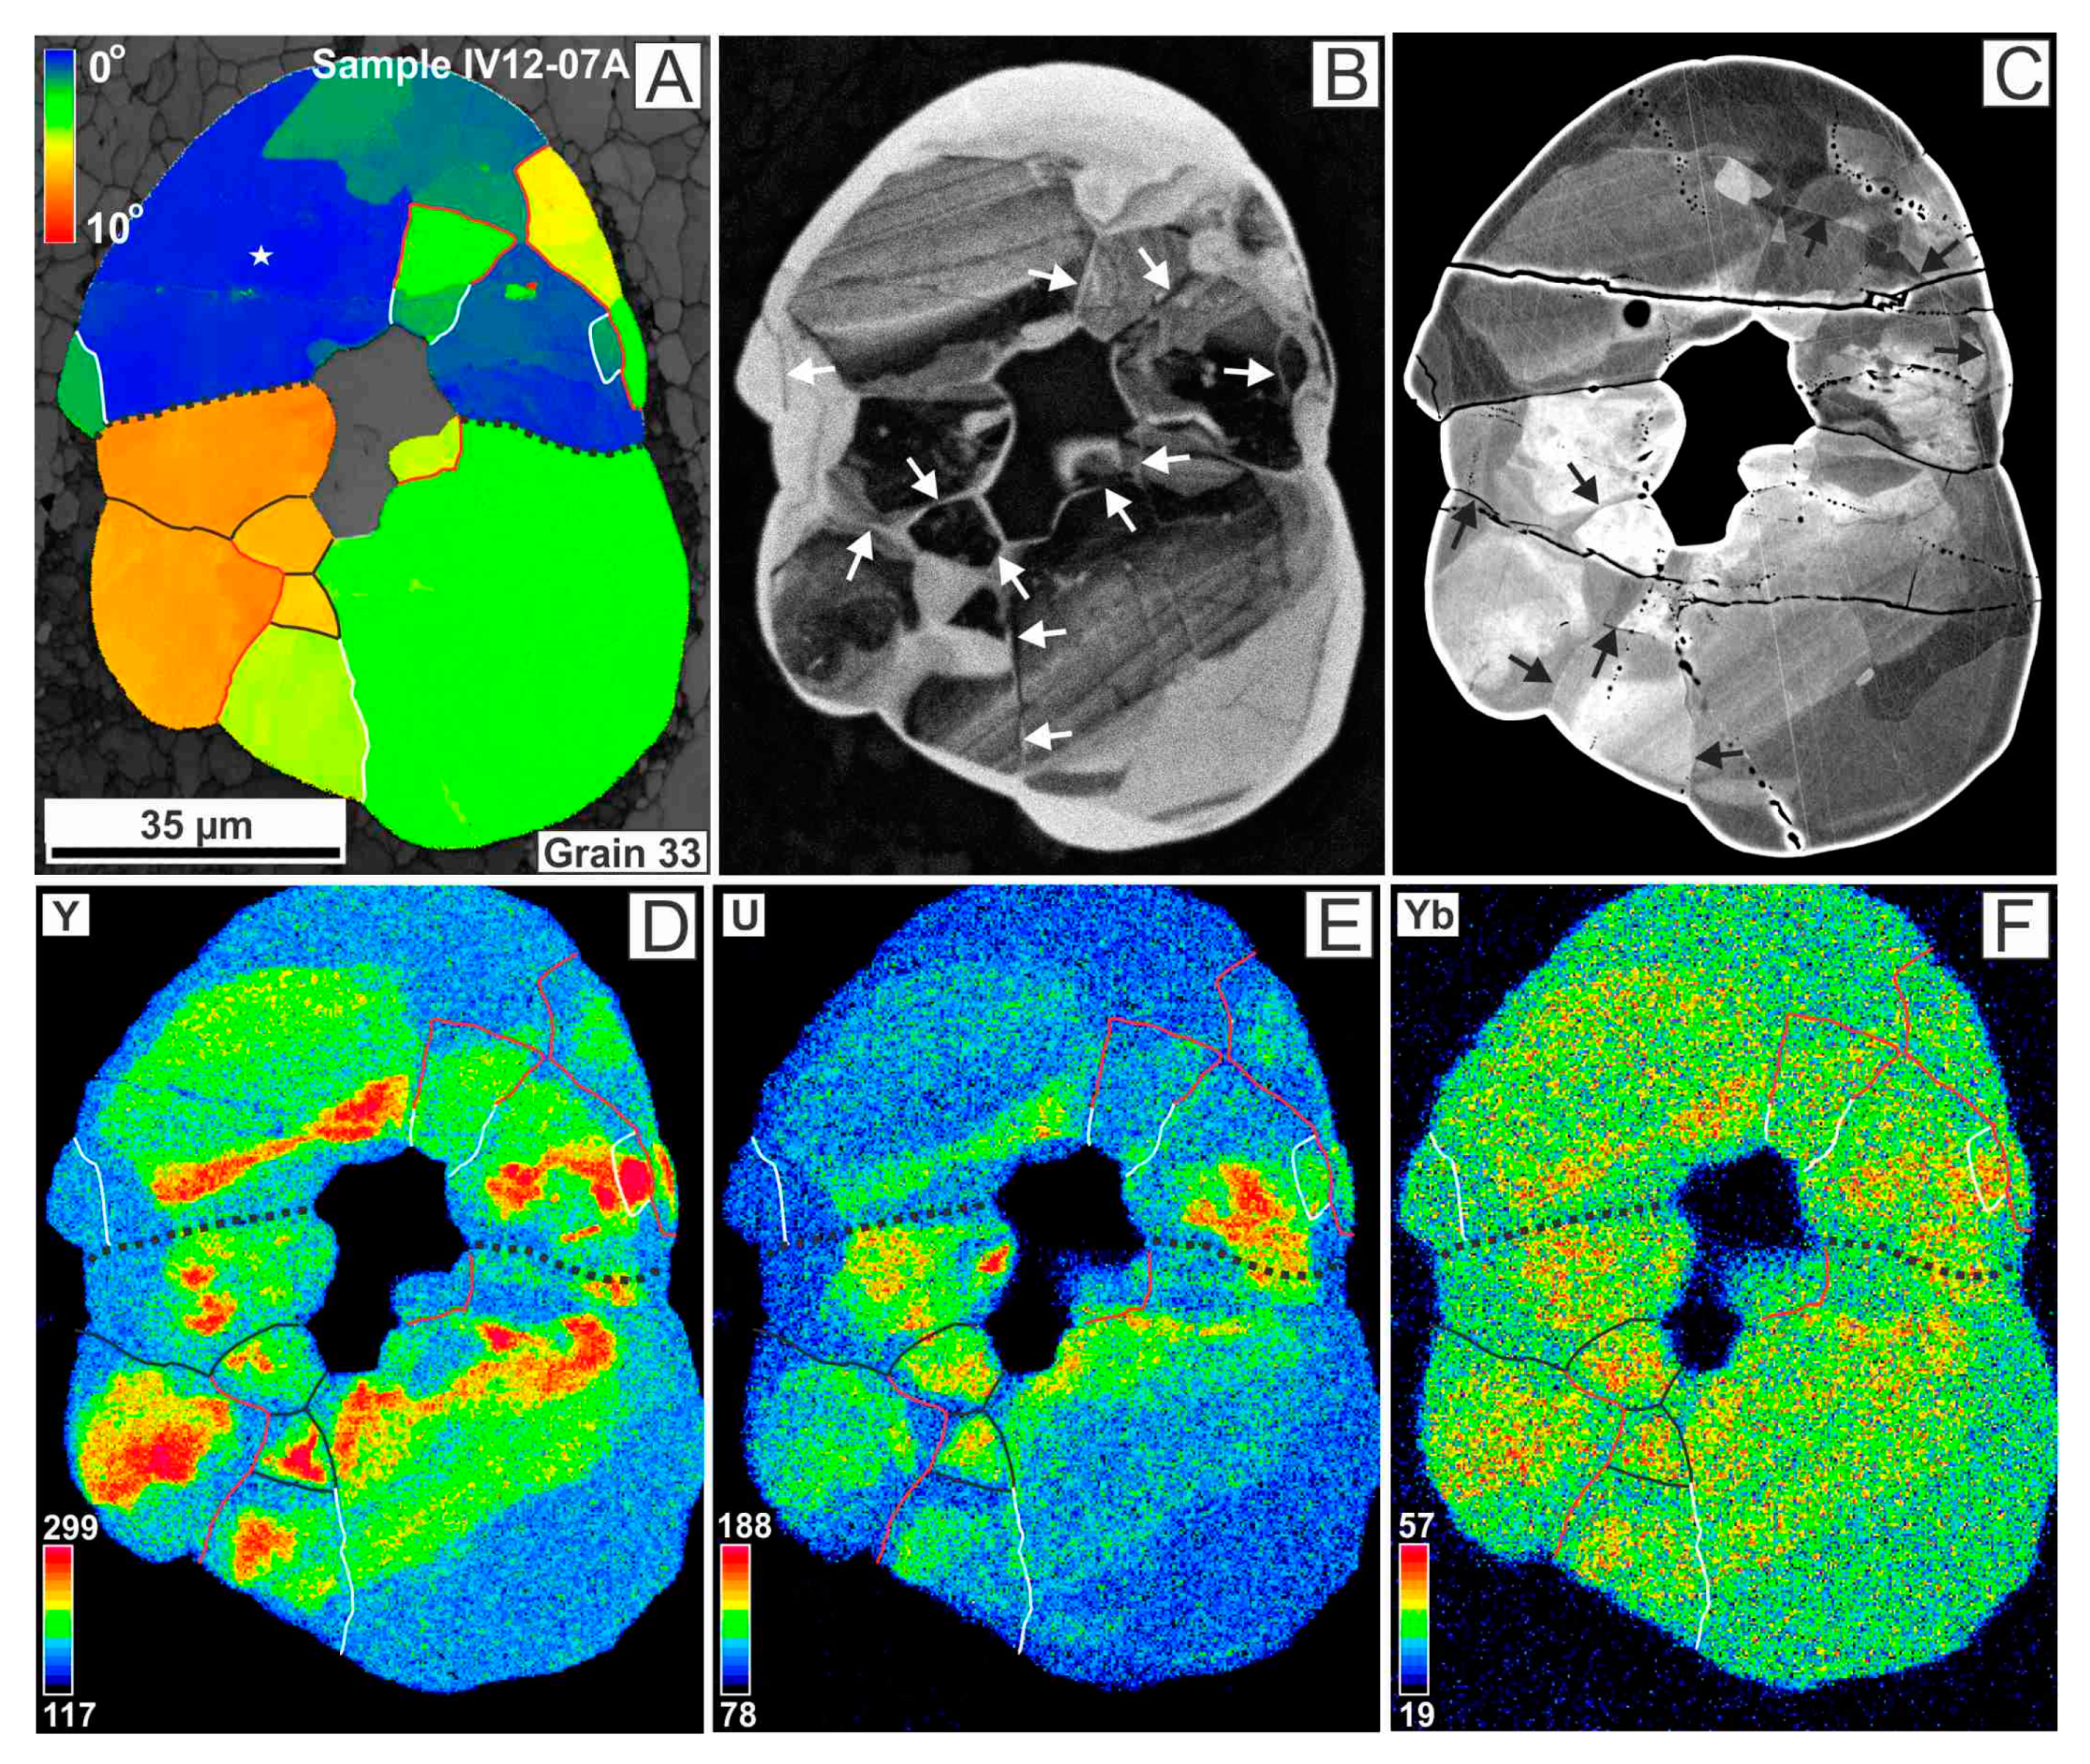
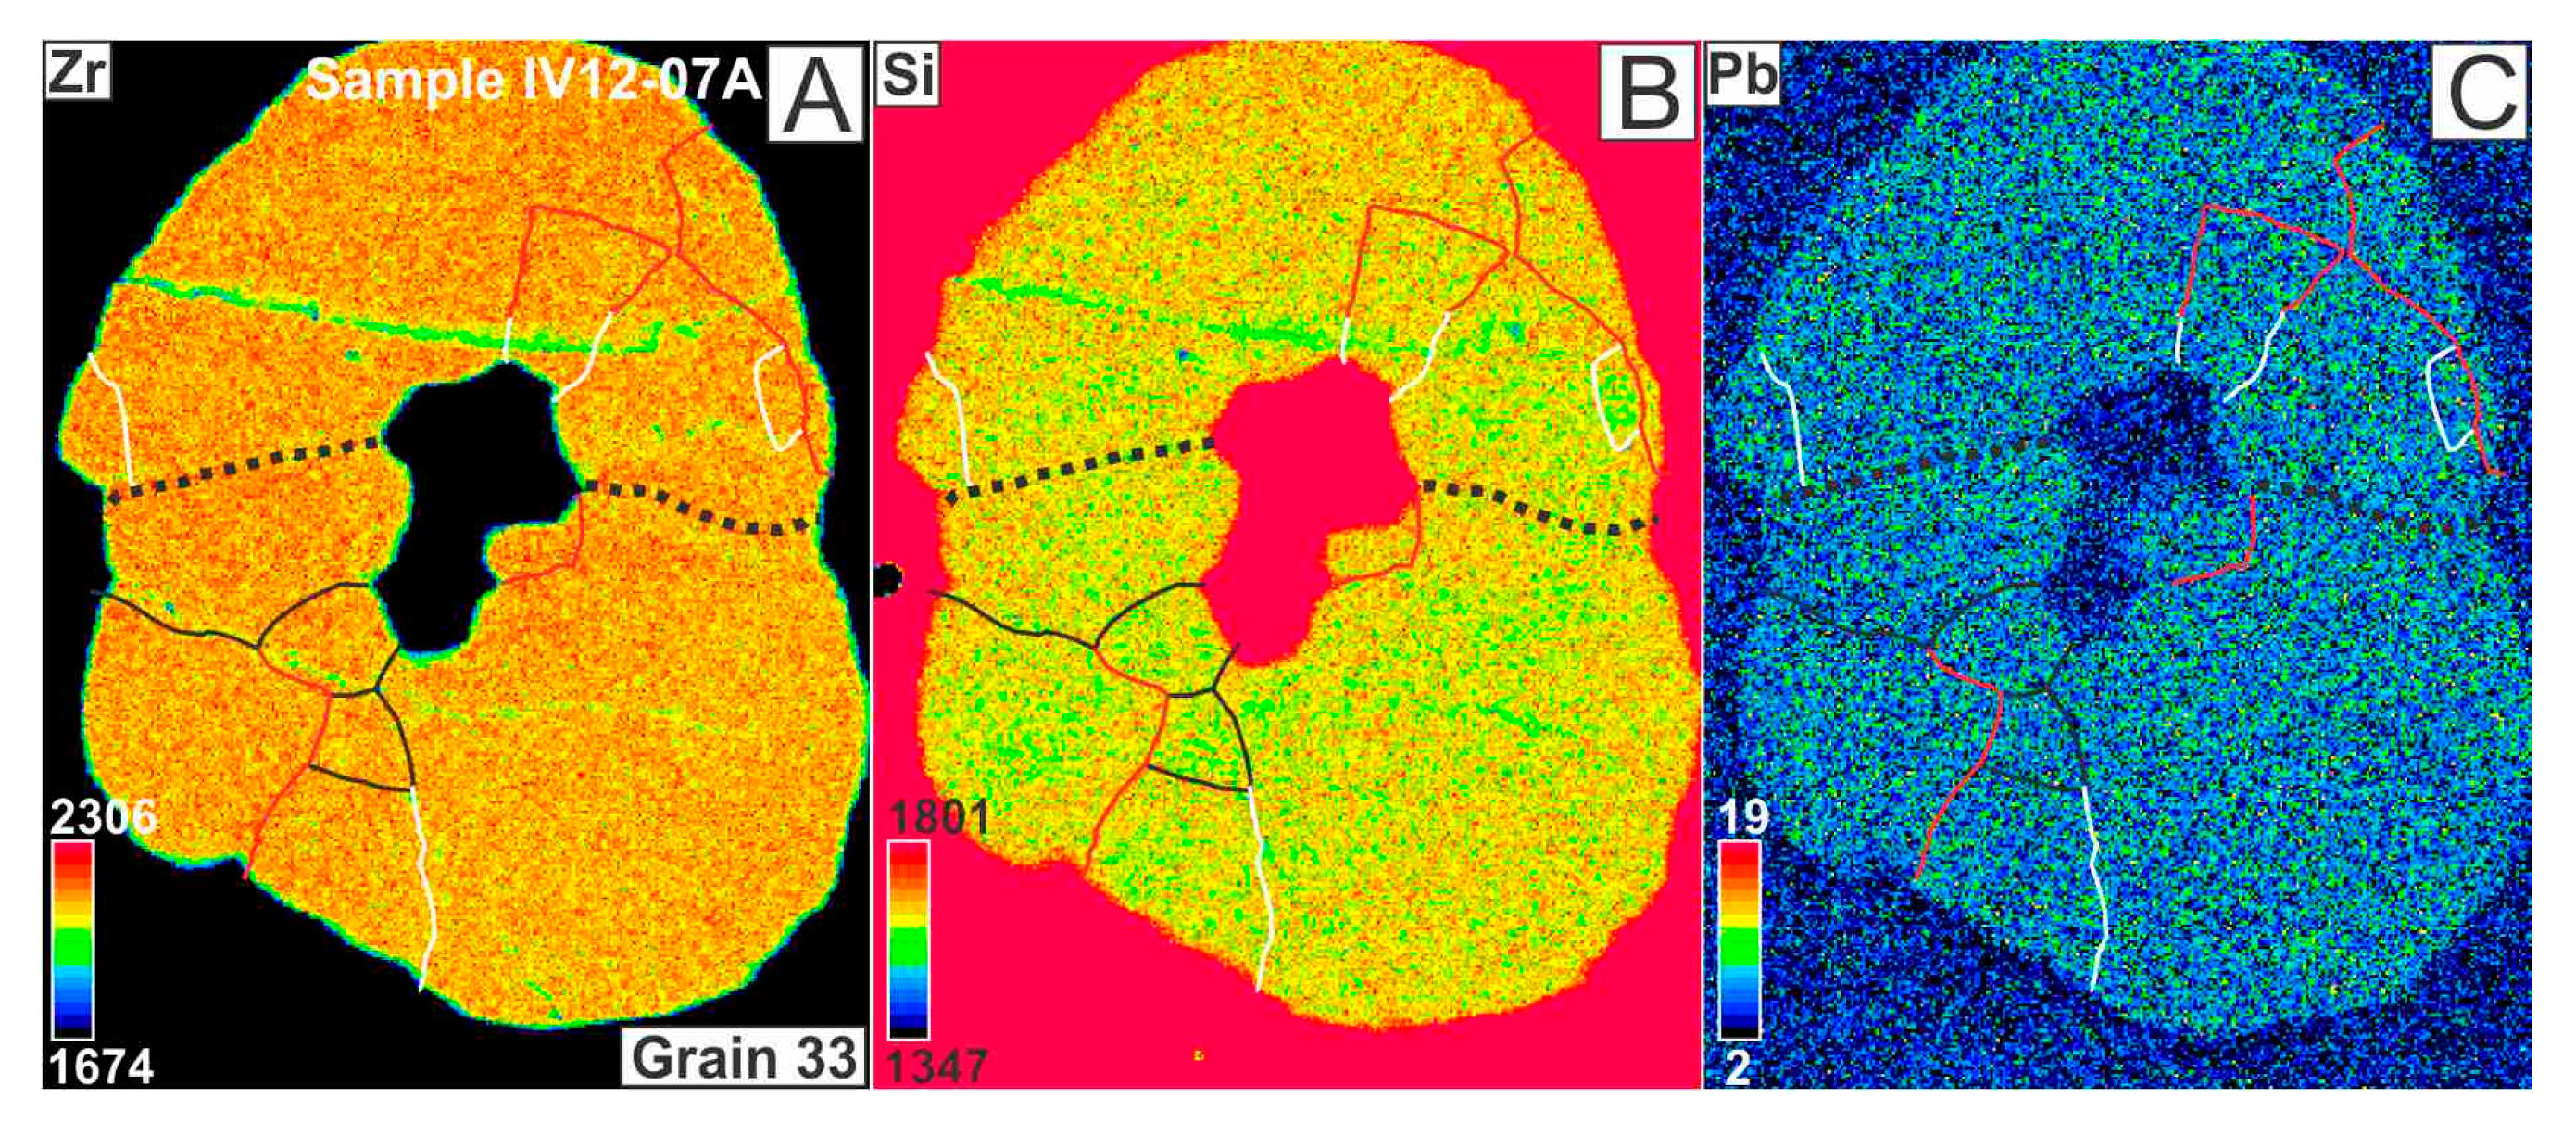
4.1. Sample IV12-07A, Felsic Mylonitic Metapelite, Ivrea Zone
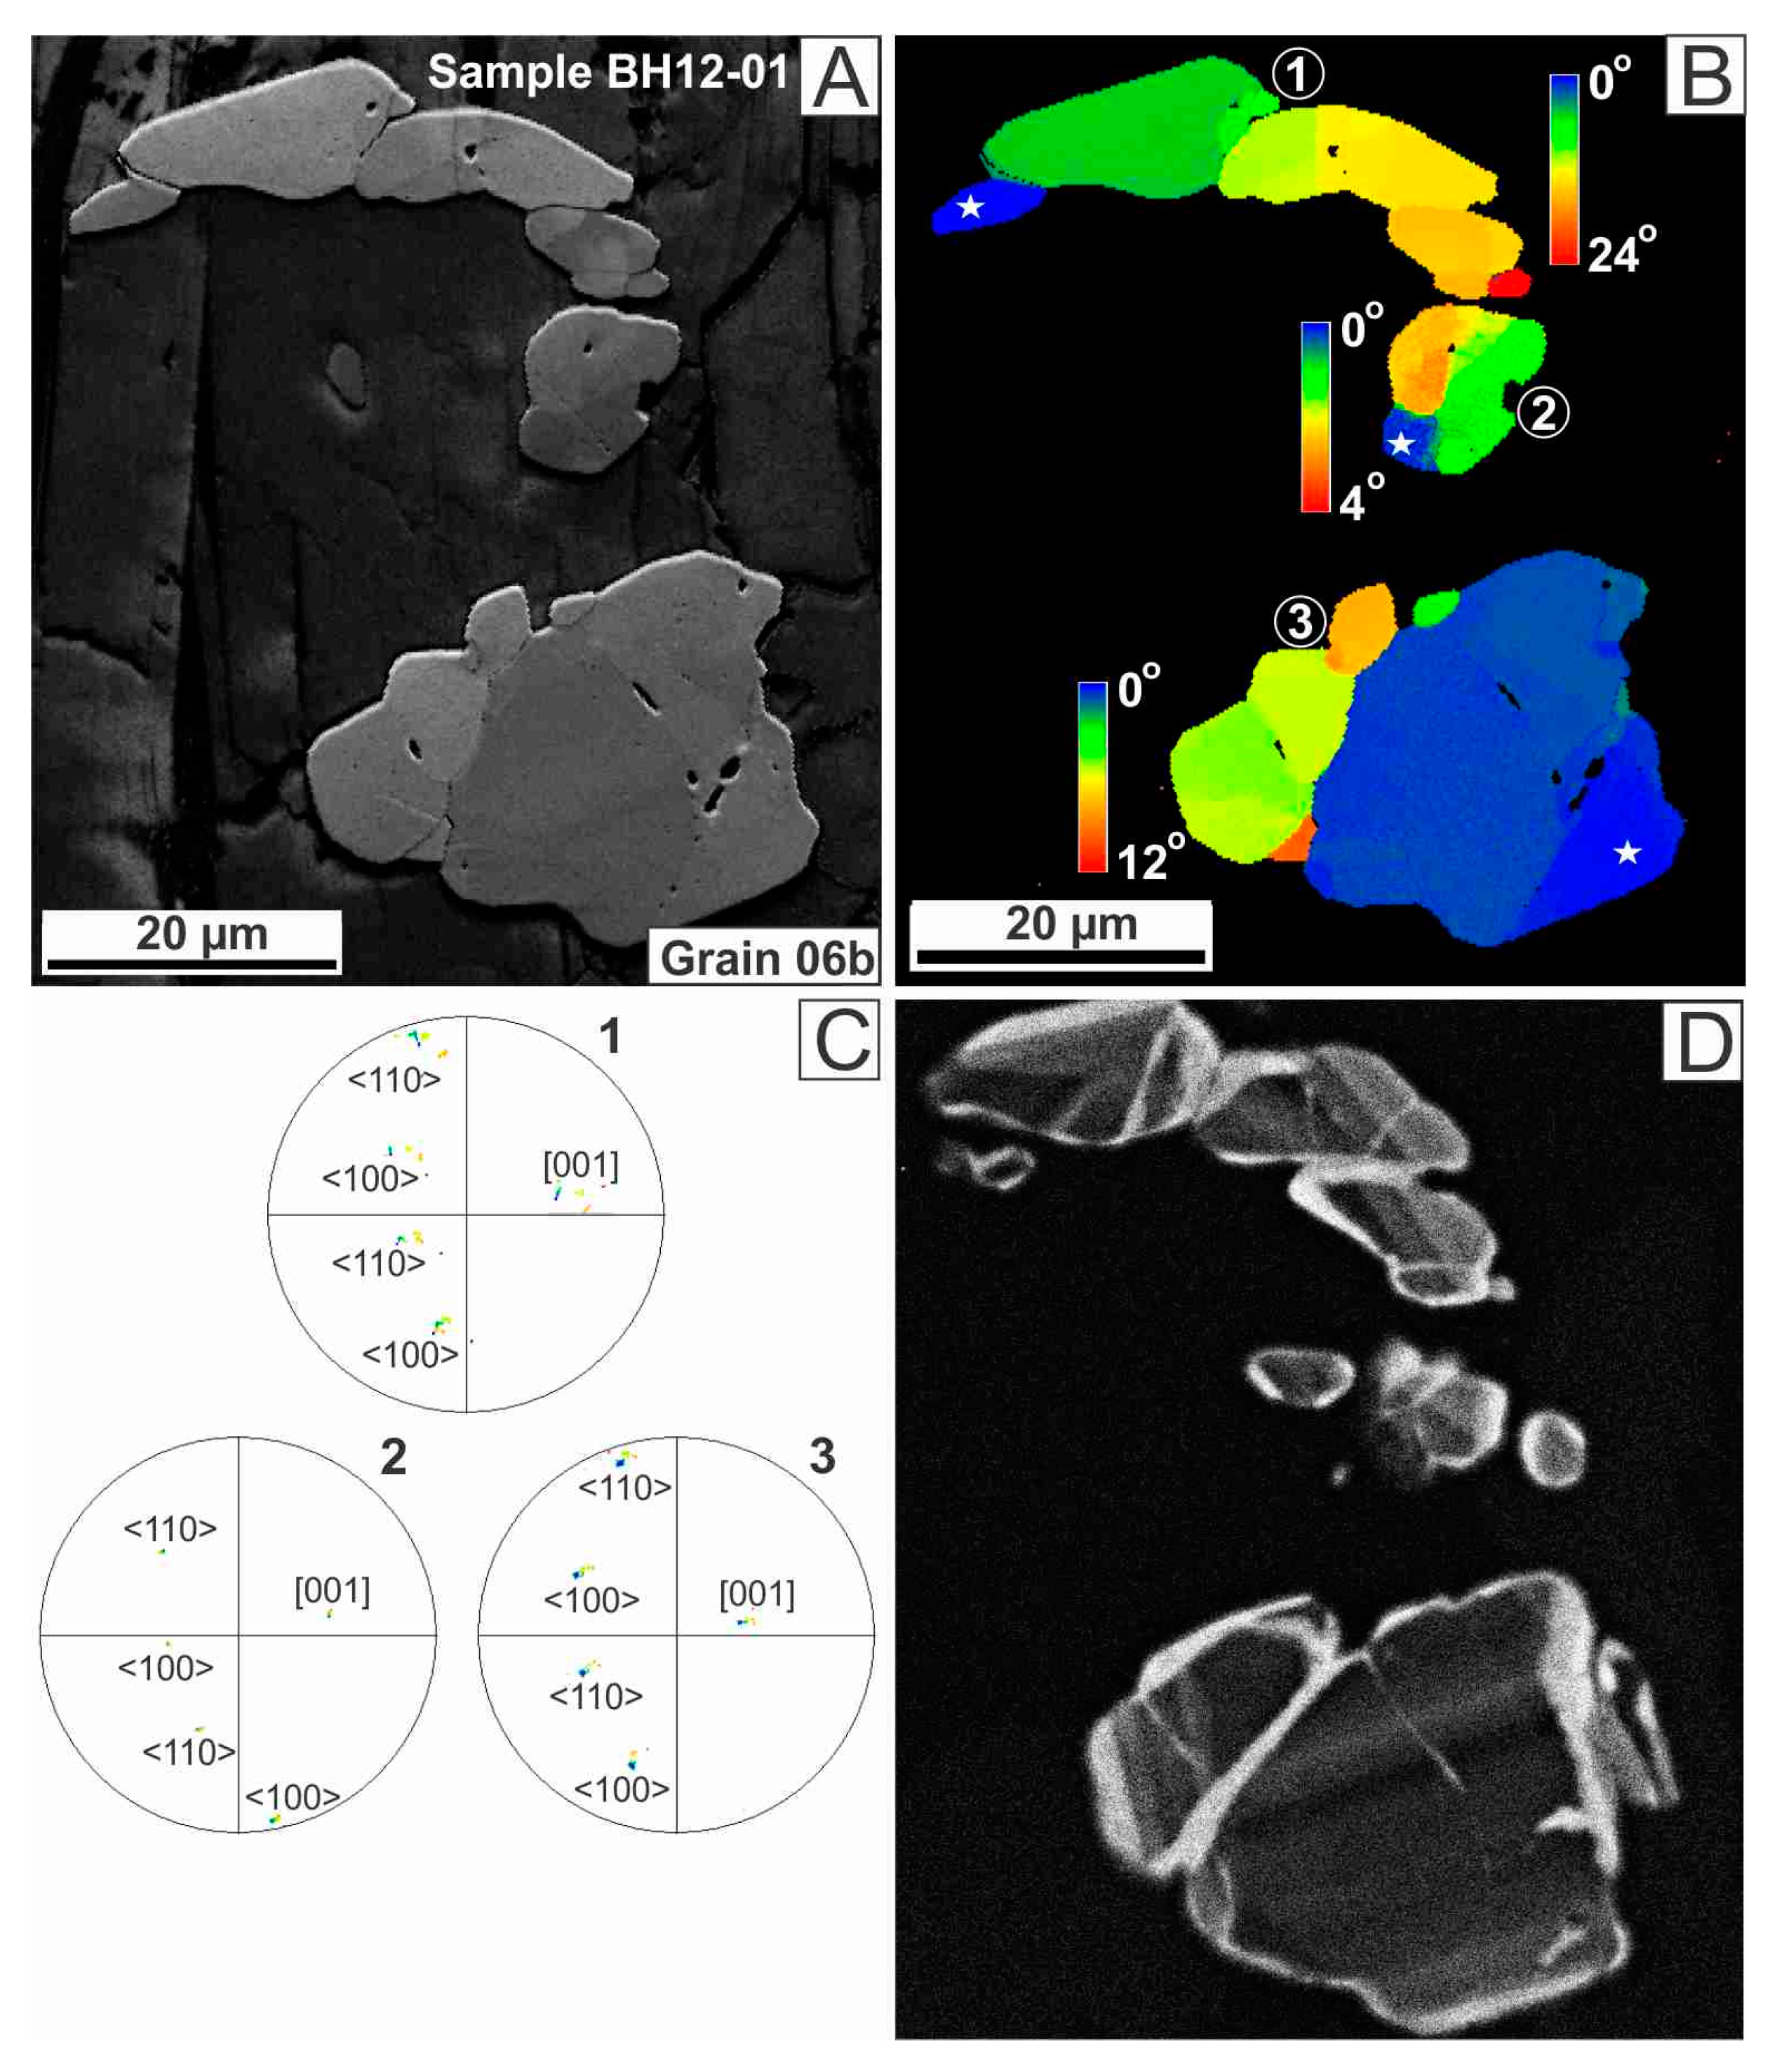
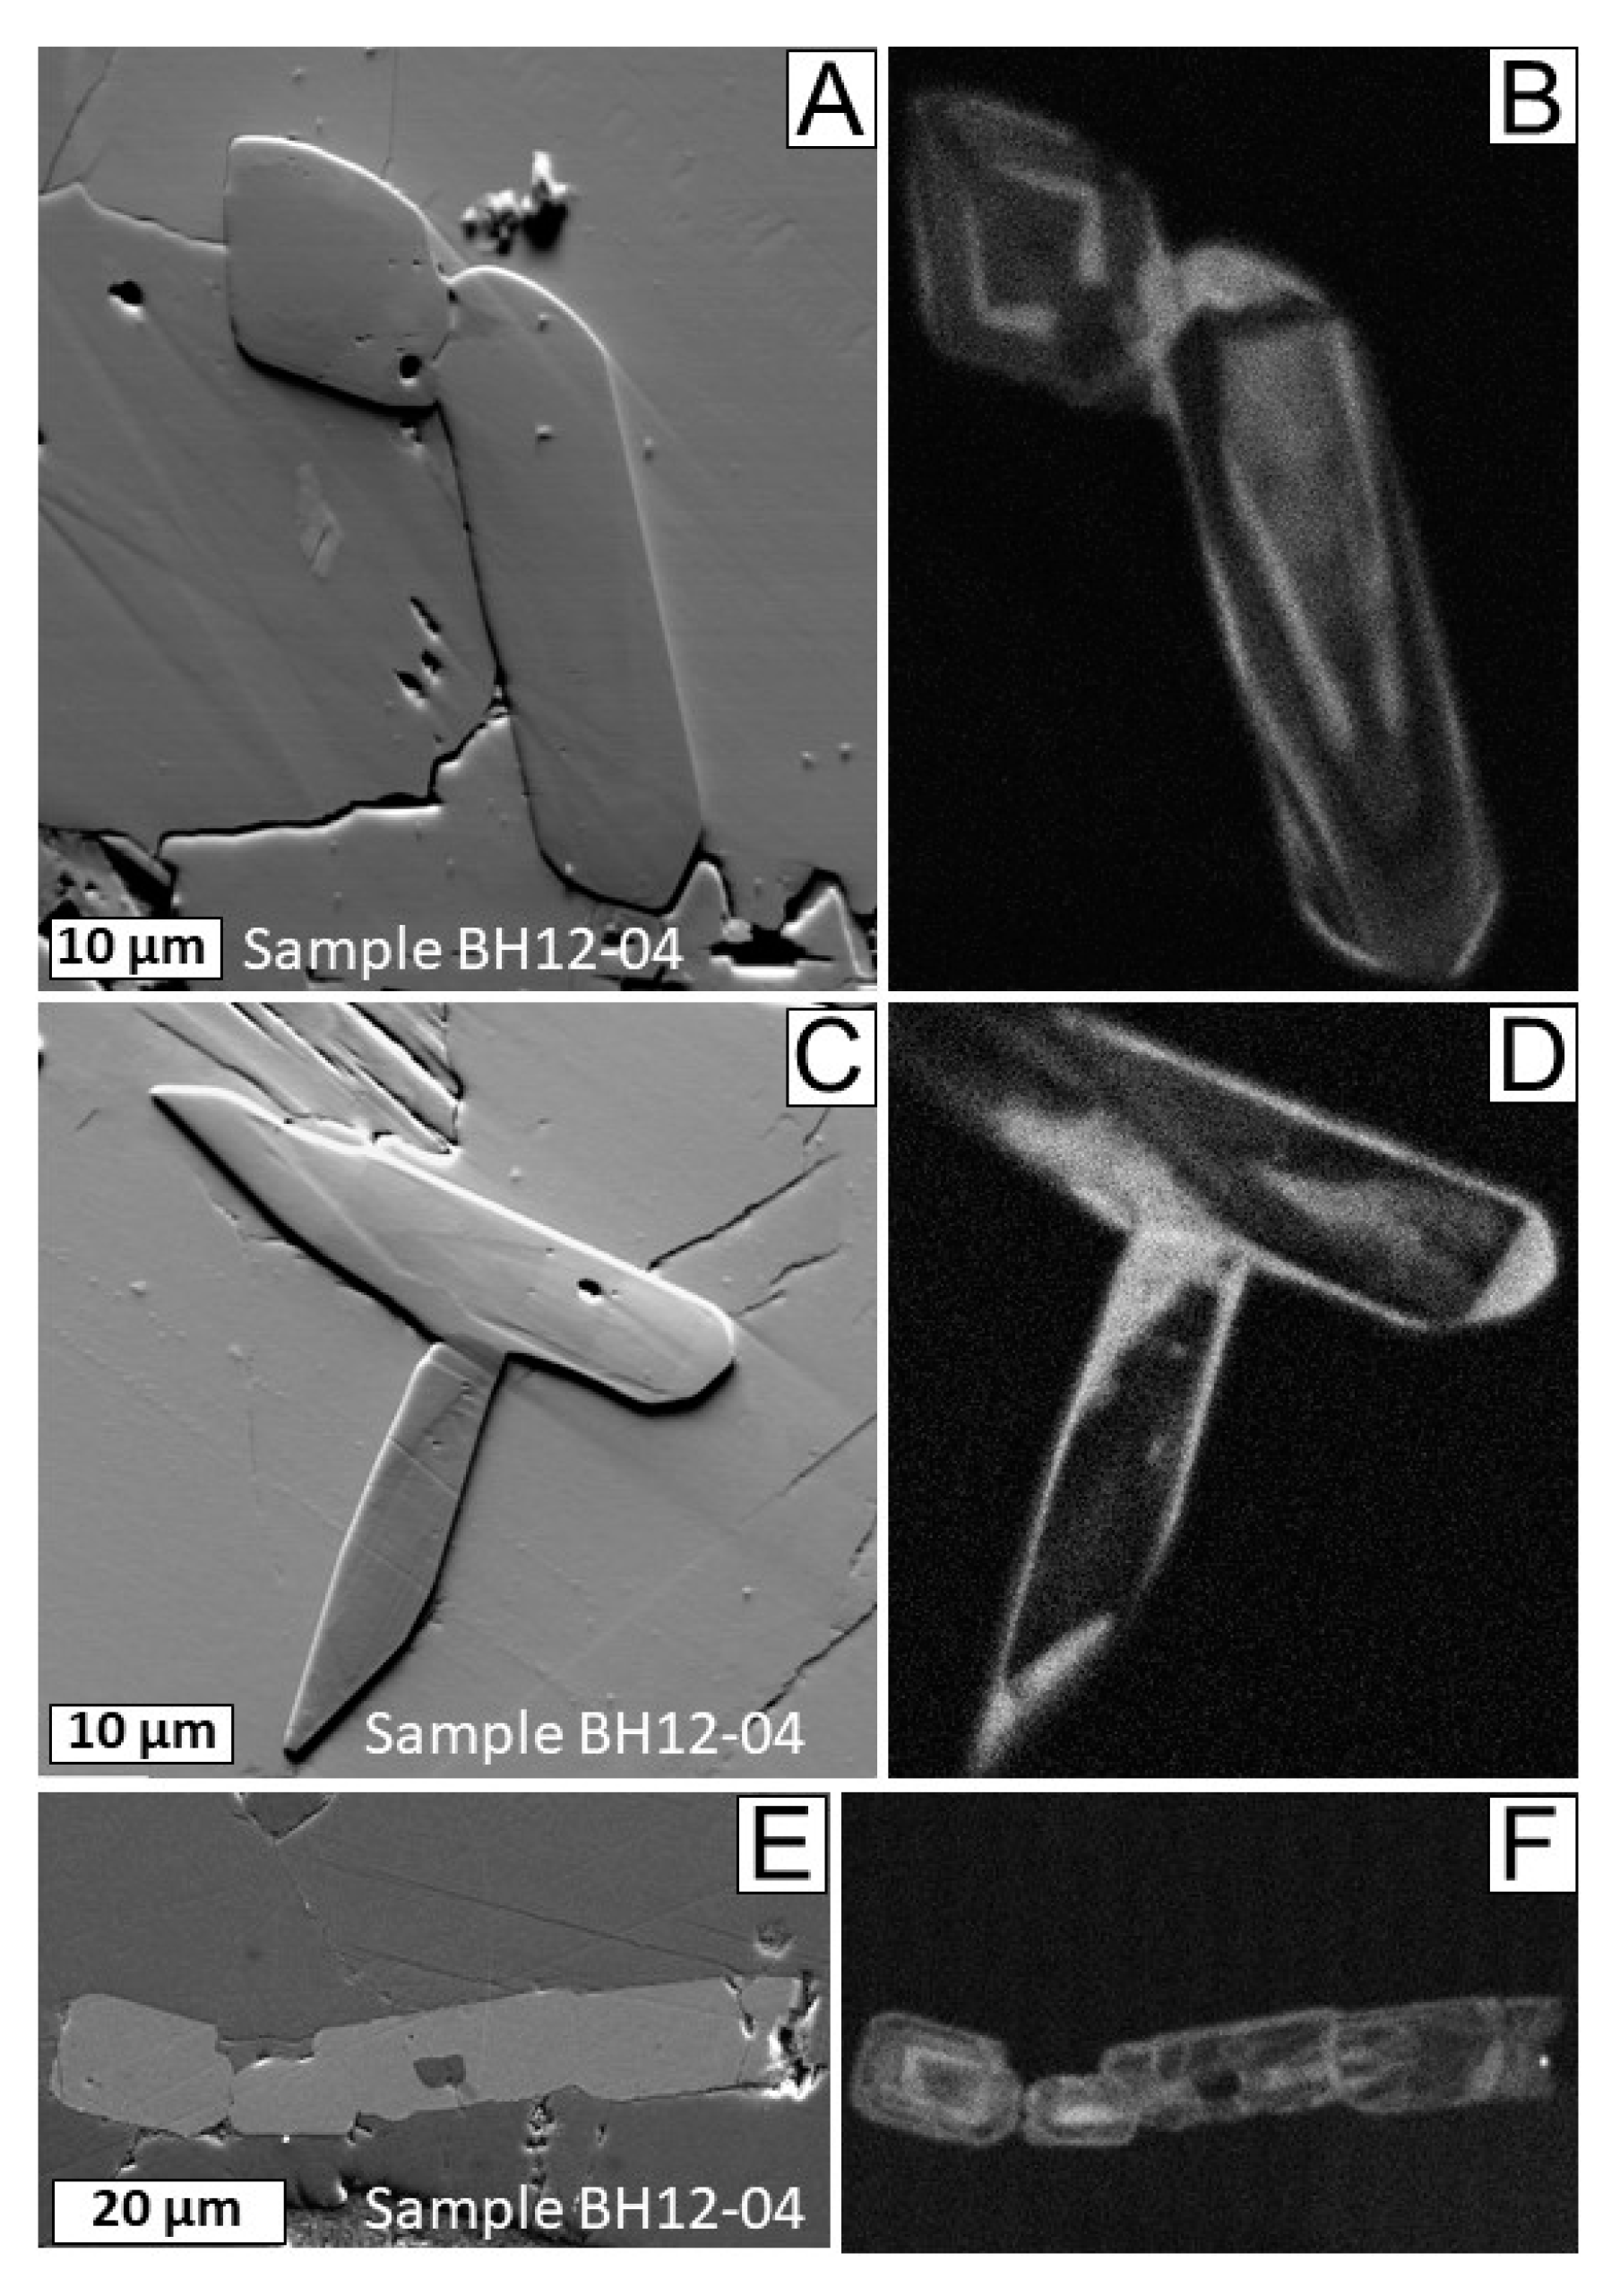
4.2. Sample Suite BH12, Mylonitic and Foliated Granitic Gneisses, Western Tauern Window
5. Discussion
5.1. Various Types of Polygranular Zircon
- (1)
- Polycrystalline domains that have fine granules (<1 µm) and twin orientation of the domains with rotation by 65° about [110] axis [61]. This textural type is said to be indicative of recrystallization under high shock pressure (20–30 GPa, [61]) and/or differential stress upon shock pressure release [62].
- (2)
- Polycrystalline domains with fine granules (1–3 µm) and specific crystallographic orientation of granules with respect to each other. Their c-axes are clustering around three mutually orthogonal directions, while the individual c-axis of each cluster is coincident with one of the [110] axes of each other cluster. Such orientation is said to indicate phase transformation from high-pressure zircon polymorph reidite, so-called “former reidite in granular neoblastic” (“FRIGN”) zircon (Figure 14C) [26,28,29,61,63]. This polycrystalline type might be indicative of high shock pressure (ca. 30–35 GPa) and subsequent heating (>1200 °C), which allowed for zircon to transform to reidite and for the reidite to revert back to zircon [64]. Such recrystallized grains may show remnant initial growth zoning, while the individual neoblasts, in turn, contain metamict cores and well-crystalline rims [30].
- (3)
- (4)
- (5)
- (6)
- Small granules (ca. 5 µm) with one orientation (Figure 14D) [28]. This textural type was observed in one grain, which might be unrelated to shock deformation, and could be metamorphic or related to shearing, pre- or post-impact, or affected by some long-term post-impact deformation; therefore, this type will not be taken into account further.
- (7)
- Large granules (10–100 µm) with concentric zoning [22,23,27,66], which nucleate inside the parent grain (Figure 14E–H). In some cases, granules cluster together and form triple junctions [23,67]. In other cases, they are spread randomly within the host grain [27]. Such neoblasts likely grew post-impact, due to elevated temperatures maintained after the shock event, for example, by the exposure to superheated impact melt [22,27].
5.2. Key Differences between Textures Observed in Polygranular Zircon Types
6. Conclusions and Recommendation
Supplementary Materials
Funding
Acknowledgments
Conflicts of Interest
References
- Davis, D.W.; Williams, I.S.; Krogh, T.E. Historical development of zircon geochronology. In Zircon, 1st ed.; Hanchar, J.M., Hoskin, P.W.O., Eds.; Mineralogical Society of America and Geochemical Society: Chantilly, VA, USA, 2003. [Google Scholar]
- Corfu, F. Uranium-Lead, Zircon. In Encyclopedia of Scientific Dating Methods; Rink, W.J., Thompson, J.W., Eds.; Springer: Dordrecht, South Africa, 2013. [Google Scholar] [CrossRef]
- Klötzli, U.S.; Sinigoi, S.; Quick, J.E.; Demarchi, G.; Tassinari, C.C.G.; Sato, K.; Günes, Z. Duration of igneous activity in the Sesia Magmatic System and implications for high-temperature metamorphism in the Ivrea–Verbano deep crust. Lithos 2014, 206–207, 19–33. [Google Scholar] [CrossRef]
- Kusiak, M.A.; Kovaleva, E.; Wirth, R.; Klötzli, U.; Dunkley, D.J.; Yi, K.; Lee, S. Lead oxide nanospheres in seismically deformed zircon grains. Geochim. Cosmochim. Acta 2019, 262, 20–30. [Google Scholar] [CrossRef]
- Pupin, J.P. Zircon and granite petrology. Contrib. Mineral. Petrol. 1980, 73, 207–220. [Google Scholar] [CrossRef]
- Corfu, F.; Hanchar, J.M.; Hoskin, P.W.O.; Kinny, P. Atlas of zircon textures. In Zircon, 1st ed.; Hanchar, J.M., Hoskin, P.W.O., Eds.; Mineralogical Society of America and Geochemical Society: Chantilly, VA, USA, 2003. [Google Scholar]
- Jocelyn, J.; Pidgeon, R.T. Examples of twinning and parallel growth in zircons from some Precambrian granites and gneisses. Mineral. Mag. 1974, 39, 587–594. [Google Scholar] [CrossRef][Green Version]
- Pin, C.; Lancelot, J. U-Pb dating of an Early Paleozoic bimodal magmatism in the French Massif Central and of its further metamorphic evolution. Contrib. Mineral. Petrol. 1982, 79, 1–12. [Google Scholar] [CrossRef]
- Charoy, B.; Raimbault, L. Zr, Th, and REE-rich biotite differentiates in the A-type granite pluton of Suzhou (Eastern China): The key role of fluorine. J. Petrol. 1994, 35, 919–962. [Google Scholar] [CrossRef]
- Kusiak, M.A.; Dunkley, D.J.; Słaby, E.; Martin, H.; Budzyń, B. Sensitive high-resolution ion microprobe analysis of zircon reequilibrated by late magmatic fluids in a hybridized pluton. Geology 2009, 37, 1063–1066. [Google Scholar] [CrossRef]
- Kovaleva, E.; Harlov, D.; Klötzli, U. Complicated secondary textures in zircon record evolution of the host granitic rocks: Studies from Western Tauern Window and Ötztal-Stubai Crystalline Complex (Eastern Alps, Western Austria). Lithos 2017, 284–285, 381–400. [Google Scholar] [CrossRef]
- Peucat, J.J.; Bernard-Griffiths, J.; Gil Ibarguchi, J.I.; Dallmeyer, R.D.; Menot, R.P.; Cornichet, J.; Iglesias Ponce De Leon, M. Geochemical and geochronological cross section of the deep Variscan crust: The Cabo Ortegal high-pressure nappe (northwestern Spain). Tectonophysics 1990, 177, 263–292. [Google Scholar] [CrossRef]
- Rimša, A.; Whitehouse, M.J.; Johansson, L.; Piazolo, S. Brittle fracturing and fracture healing of zircon: An integrated cathodoluminescence, EBSD, U-Th-Pb, and REE study. Am. Mineral. 2007, 92, 1213–1224. [Google Scholar] [CrossRef]
- Kovaleva, E.; Klötzli, U.; Habler, G.; Libowitzky, E. Finite lattice distortion patterns in plastically deformed zircon grains. Solid Earth 2014, 5, 1099–1122. [Google Scholar] [CrossRef]
- Bohor, B.F.; Betterton, W.J. Shocked zircons in the Onaping formation: Further proof of impact origin. In Meteorite Impacts and Planetary Evolution; LPI Contribution: Houston, TX, USA, 1992; Volume 790, pp. 9–10. [Google Scholar]
- Bohor, B.F.; Betterton, W.J.; Krogh, T.E. Impact-shocked zircons: Discovery of shock-induced textures reflecting increasing degrees of shock metamorphism. Earth Planet. Sci. Lett. 1993, 119, 419–424. [Google Scholar] [CrossRef]
- Kamo, S.L.; Krogh, T.E. Chicxulub crater source for shocked zircon crystals from the Cretaceous-Tertiary boundary layer, Saskatchewan: Evidence from new U-Pb data. Geology 1995, 23, 281–284. [Google Scholar] [CrossRef]
- Wittmann, A.; Kenkmann, T.; Schmitt, R.T.; Stöffler, D. Shock-metamorphosed zircon in terrestrial impact craters. Meteorit. Planet. Sci. 2006, 41, 433–454. [Google Scholar] [CrossRef]
- Kamo, S.L.; Lana, C.; Morgan, J.V. U–Pb ages of shocked zircon grains link distal K–Pg boundary sites in Spain and Italy with the Chicxulub impact. Earth. Planet Sci. Lett. 2011, 310, 401–408. [Google Scholar] [CrossRef]
- Krogh, T.E.; Kamo, S.L.; Bohor, B.F. Fingerprinting the K/T impact site and determining the time of impact by U-Pb dating of single shocked zircons from distal ejecta. Earth Planet. Sci. Lett. 1993, 119, 425–429. [Google Scholar] [CrossRef]
- Kamo, S.L.; Reimold, W.U.; Krogh, T.E.; Colliston, W.P. A 2.023 Ga age for the Vredefort impact event and a first report of shock metamorphosed zircons in pseudotachylitic breccias and Granophyre. Earth Planet. Sci. Lett. 1996, 144, 369–387. [Google Scholar] [CrossRef]
- Moser, D.E.; Cupelli, C.L.; Barker, I.R.; Flowers, R.M.; Bowman, J.R.; Wooden, J.; Hart, J.R. New zircon shock phenomena and their use for dating and reconstruction of large impact structures revealed by electron nanobeam (EBSD, CL, EDS) and isotopic U–Pb and (U–Th)/He analysis of the Vredefort dome. Canad. J. Earth Sci. 2011, 48, 117–139. [Google Scholar] [CrossRef]
- Cavosie, A.J.; Erickson, T.M.; Timms, N.E.; Reddy, S.M.; Talavera, C.; Montalvo, S.D.; Pincus, M.R.; Gibbon, R.J.; Moser, D. A terrestrial perspective on using ex situ shocked zircons to date lunar impacts. Geology 2015, 43, 999–1002. [Google Scholar] [CrossRef]
- Cavosie, A.J.; Timms, N.E.; Erickson, T.M.; Koeberl, C. New clues from Earth’s most elusive impact crater: Evidence of reidite in Australasian tektites from Thailand. Geology 2018, 46, 203–206. [Google Scholar] [CrossRef]
- Cavosie, A.J.; Timms, N.E.; Ferrière, L.; Rochette, P. FRIGN zircon—The only terrestrial mineral diagnostic of high-pressure and high-temperature shock deformation. Geology 2018, 46, 891–894. [Google Scholar] [CrossRef]
- Erickson, T.M.; Pearce, M.A.; Reddy, S.M.; Timms, N.E.; Cavosie, A.J.; Bourdet, J.; Rickard, W.D.A.; Nemchin, A.A. Microstructural constraints on the mechanisms of the transformation to reidite in naturally shocked zircon. Contrib. Mineral. Petrol. 2017, 172, 6. [Google Scholar] [CrossRef]
- Kenny, G.G.; Morales, L.F.; Whitehouse, M.J.; Petrus, J.A.; Kamber, B.S. The formation of large neoblasts in shocked zircon and their utility in dating impacts. Geology 2017, 45, 1003–1006. [Google Scholar] [CrossRef]
- Kenny, G.G.; Schmieder, M.; Whitehouse, M.J.; Nemchin, A.A.; Morales, L.F.G.; Buchner, E.; Bellucci, J.J.; Snape, J.F. A new U-Pb age for shock-recrystallised zircon from the Lappajärvi impact crater, Finland, and implications for the accurate dating of impact events. Geochim. Cosmochim. Acta 2019, 245, 479–494. [Google Scholar] [CrossRef]
- Hauser, N.; Reimold, W.U.; Cavosie, A.J.; Crósta, A.P.; Schwarz, W.H.; Trieloff, M.; Da Silva Maia De Souza, C.; Pereira, L.A.; Rodrigues, E.N.; Brown, M. Linking shock textures revealed by BSE, CL, and EBSD with U-Pb data (LA-ICPMS and SIMS) from zircon from the Araguainha impact structure, Brazil. Meteorit. Planet. Sci. 2019, 54, 2286–2311. [Google Scholar] [CrossRef]
- Kovaleva, E.; Zamyatin, D.; Habler, G. Granular zircon from Vredefort granophyre (South Africa) confirms the deep injection model for impact melt in large impact structures. Geology 2019, 47, 691–694. [Google Scholar] [CrossRef]
- Timms, N.E.; Reddy, S.M.; Healy, D.; Nemchin, A.A.; Grange, M.L.; Pidgeon, R.T.; Hart, R. Resolution of impact-related microstructures in lunar zircon: A shock-deformation mechanism map. Meteorit. Planet. Sci. 2012, 47, 120–141. [Google Scholar] [CrossRef]
- Grange, M.L.; Pidgeon, R.T.; Nemchin, A.A.; Timms, N.E.; Meyer, C. Interpreting U–Pb data from primary and secondary features in lunar zircon. Geochim. Cosmochim. Acta 2013, 101, 112–132. [Google Scholar] [CrossRef]
- Crow, C.A.; McKeegan, K.D.; Moser, D.E. Coordinated U–Pb geochronology, trace element, Ti-in-zircon thermometry and microstructural analysis of Apollo zircons. Geochim. Cosmochim. Acta 2017, 202, 264–284. [Google Scholar] [CrossRef]
- Crow, C.A.; Moser, D.E.; McKeegan, K.D. Shock metamorphic history of >4 Ga Apollo 14 and 15 zircons. Meteorit. Planet. Sci. 2019, 54, 181–201. [Google Scholar] [CrossRef]
- Zhang, A.-C.; Hsu, W.-B.; Li, X.-H.; Ming, H.-L.; Li, Q.-L.; Liu, Y.; Tang, G.-Q. Impact melting of lunar meteorite Dhofar 458: Evidence from polycrystalline texture and decomposition of zircon. Meteorit. Planet. Sci. 2011, 46, 103–115. [Google Scholar] [CrossRef]
- Montalvo, P.E.; Cavosie, A.J.; Kirkland, C.L.; Evans, N.J.; McDonald, B.J.; Talavera, C.; Erickson, T.M.; Lugo-Centeno, C. Detrital shocked zircon provides first radiometric age constraint (<1472 Ma) for the Santa Fe impact structure, New Mexico, USA. Geol. Soc. Am. Bull. 2019, 131, 845–863. [Google Scholar] [CrossRef]
- Brodie, K.H.; Rutter, E.H. Deep crustal extensional faulting in the Ivrea zone of northern Italy. Tectonophysics 1987, 140, 193–212. [Google Scholar] [CrossRef]
- Quick, J.E.; Sinigoi, S.; Peressini, G.; Demarchi, G.; Wooden, J.L.; Sbisà, A. Magmatic plumbing of a large Permian caldera exposed to a depth of 25 km. Geology 2009, 37, 603–606. [Google Scholar] [CrossRef]
- Rutter, E.H.; Brodie, K.H.; James, T.; Burlini, L. Large-scale folding in the upper part of the Ivrea-Verbano zone, NW Italy. J. Struct. Geol. 2007, 29, 1–17. [Google Scholar] [CrossRef]
- Brodie, K.H.; Rutter, E.H.; Evans, P. On the structure of the Ivrea-Verbano Zone (northern Italy) and its implications for present-day lower continental crust geometry. Terra Nova 1992, 4, 34–39. [Google Scholar] [CrossRef]
- Brodie, K. Variation in amphibole and plagioclase composition with deformation. Tectonophysics 1981, 78, 385–402. [Google Scholar] [CrossRef]
- Brodie, K.; Rutter, E. On the relationship between deformation and metamorphism, with special reference to the behavior of basic rocks. In Metamorphic Reactions: Kinetics, Textures and Deformation; Thompson, A.B., Rubie, D.C., Eds.; Springer: Berlin, Germany, 1985. [Google Scholar]
- Techmer, K.S.; Ahrendt, H.; Weber, K. The development of pseudotachylyte in the Ivrea-Verbano Zone of the Italian Alps. Tectonophysics 1992, 204, 307–322. [Google Scholar] [CrossRef]
- Pittarello, L.; Pennacchioni, G.; Di Toro, G. Amphibolite-facies pseudotachylytes in Premosello metagabbro and felsic mylonites (Ivrea Zone, Italy). Tectonophysics 2012, 580, 43–57. [Google Scholar] [CrossRef]
- Kovaleva, E.; Klötzli, U.; Habler, G.; Wheeler, J. Planar microstructures in zircon from paleo-seismic zones. Am. Mineral. 2015, 100, 1834–1847. [Google Scholar] [CrossRef]
- Kovaleva, E.; Klötzli, U.; Habler, G. On the geometric relationship between deformation microstructures in zircon and the kinematic framework of the shear zone. Lithos 2016, 262, 192–212. [Google Scholar] [CrossRef]
- Miller, C.; Konzett, J.; Tiepolo, M.; Armstrong, R.A.; Thöni, M. Jadeite-gneiss from the eclogite zone, Tauern Window, Eastern Alps, Austria: Metamorphic, geochemical and zircon record of a sedimentary protholith. Lithos 2007, 93, 68–88. [Google Scholar] [CrossRef]
- Selverstone, J.; Morteani, G.; Staude, J.-M. Fluid channeling during ductile shearing: Transformation of granodiorite into aluminous schist in the Tauern Window, Eastern Alps. J. Metamorph. Geol. 1991, 9, 419–431. [Google Scholar] [CrossRef]
- Veselá, P.; Söllner, F.; Finger, F.; Gerdes, A. Magmato-sedimentary Carboniferous to Jurassic evolution of the western Tauern window, Eastern Alps (constraints from U-Pb zircon dating and geochemistry). Int. J. Earth Sci. 2011, 100, 993–1027. [Google Scholar] [CrossRef]
- Pennacchioni, G.; Mancktelow, N.S. Nucleation and initial growth of a shear zone network within compositionally and structurally heterogeneous granitoids under amphibolite facies conditions. J. Struct. Geol. 2007, 29, 1757–1780. [Google Scholar] [CrossRef]
- Selverstone, J. Evidence for east-west crustal extension in the Eastern Alps: Implications for the unroofing history of the Tauern Window. Tectonics 1988, 7, 87–105. [Google Scholar] [CrossRef]
- Nasdala, L.; Hanchar, J.M.; Rhede, D.; Kennedy, A.K.; Vaczi, T. Retention of uranium in complexly altered zircon: An example from Bancroft, Ontario. Chem. Geol. 2010, 269, 290–300. [Google Scholar] [CrossRef]
- Geisler, T.; Schaltegger, U.; Tomaschek, F. Re-equilibration of zircon in aqueous fluids and melts. Elements 2007, 3, 43–50. [Google Scholar] [CrossRef]
- Soman, A.; Geisler, T.; Tomaschek, F.; Grange, M.; Berndt, J. Alteration of crystalline zircon solid solutions: A case study on zircon from an alkali pegmatite from Zomba-Malosa, Malawi. Contrib. Mineral. Petrol. 2010, 160, 909–930. [Google Scholar] [CrossRef]
- Kovaleva, E.; Klötzli, U.; Habler, G.; Huet, B.; Guan, Y.; Rhede, D. The effect of crystal-plastic deformation on isotope and trace element distribution in zircon: Combined BSE, CL, EBSD, FEG-EMPA and NanoSIMS study. Chem. Geol. 2017, 450, 183–198. [Google Scholar] [CrossRef]
- Bingen, B.; Austrheim, H.; Whitehouse, M. Ilmenite as a source for zirconium during high-grade metamorphism? Textural evidence from the Caledonides of western Norway and implications for zircon geochronology. J. Petrol. 2001, 42, 355–375. [Google Scholar] [CrossRef]
- Piazolo, S.; Austrheim, H.; Whitehouse, M. Brittle-ductile microfabrics in naturally deformed zircon: Deformation mechanisms and consequences for U-Pb dating. Am. Mineral. 2012, 97, 1544–1563. [Google Scholar] [CrossRef]
- Gurov, E.P.; Shekhunova, S.B.; Permyakov, V.V. Accessory and opaque minerals in impact melt rocks of the Boltysh structure, Ukraine. Meteorit. Planet. Sci. 2015, 50, 1139–1155. [Google Scholar] [CrossRef]
- Schmieder, M.; Tohver, E.; Jourdan, F.; Denyszyn, S.W.; Haines, P.W. Zircons from the Acraman impact melt rock (South Australia): Shock metamorphism, U–Pb and 40Ar/39Ar systematics, and implications for the isotopic dating of impact events. Geochim. Cosmochim. Acta 2015, 161, 71–100. [Google Scholar] [CrossRef]
- McGregor, M.; McFarlane, C.R.M.; Spray, J.S. In situ LA-ICP-MS apatite and zircon U–Pb geochronology of the Nicholson Lake impact structure, Canada: Shock and related thermal effects. Earth Planet. Sci. Lett. 2007, 504, 185–197. [Google Scholar] [CrossRef]
- Cavosie, A.J.; Timms, N.E.; Erickson, T.M.; Hagerty, J.J.; Hörz, F. Transformations to granular zircon revealed: Twinning, reidite, and ZrO2 in shocked zircon from Meteor Crater (Arizona, USA). Geology 2016, 44, 703–706. [Google Scholar] [CrossRef]
- Cox, M.A.; Cavosie, A.J.; Bland, P.A.; Miljković, K.; Wingate, M.T.D. Microstructural dynamics of central uplifts: Reidite offset by zircon twins at the Woodleigh impact structure, Australia. Geology 2018, 46, 983–986. [Google Scholar] [CrossRef]
- Cavosie, A.J.; Koeberl, C. Overestimation of threat from 100 Mt–class airbursts? High-pressure evidence from zircon in Libyan Desert Glass. Geology 2019, 47, 609–612. [Google Scholar] [CrossRef]
- Kusaba, K.; Syono, Y.; Kikuchi, M.; Fukuoka, K. Shock behavior of zircon: Phase transition to scheelite structure and decomposition. Earth Planet. Sci. Lett. 1985, 72, 433–439. [Google Scholar] [CrossRef]
- Timms, N.E.; Erickson, T.M.; Pearce, M.A.; Cavosie, A.J.; Schmieder, M.; Tohver, E.; Reddy, S.M.; Zanetti, M.R.; Nemchin, A.A.; Wittmann, A. A pressure-temperature phase diagram for zircon at extreme conditions. Earth-Sci. Rev. 2017, 165, 185–202. [Google Scholar] [CrossRef]
- Moser, D.E. Dating the shock wave and thermal imprint of the giant Vredefort impact, South Africa. Geology 1997, 25, 7–10. [Google Scholar] [CrossRef]
- Cavosie, A.J.; Quintero, R.R.; Radovan, H.A.; Moser, D.E. A record of ancient cataclysm in modern sand: Shock microstructures in detrital minerals from the Vaal River, Vredefort Dome, South Africa. Geol. Soc. Am. Bull. 2010, 122, 1968–1980. [Google Scholar] [CrossRef]
- Poldervaart, A.; Eckelman, F.D. Growth phenomena in zircon of autochthonous granites. Geol. Soc. Am. Bull. 1955, 66, 947–948. [Google Scholar] [CrossRef]
- Dietz, R.S. Vredefort ring structure: Meteorite impact scar? J. Geol. 1961, 69, 499–516. [Google Scholar] [CrossRef]
- Dence, M.R. Impact melts. J. Geoph. Res. 1971, 76, 5552–5565. [Google Scholar] [CrossRef]
- French, B.M. Traces of Catastrophe; LPI Contribution No. 954; Lunar and Planetary Institute: Houston, TX, USA, 1998; 120p. [Google Scholar] [CrossRef]
- Osinski, G.R.; Grieve, R.A.F.; Bleacher, J.E.; Neish, C.D.; Pilles, E.A.; Tornabene, L.L. Igneous rocks formed by hypervelocity impact. J. Volcanol. Geotherm. Res. 2018, 353, 25–54. [Google Scholar] [CrossRef]
- Gibson, R.L.; Reimold, W.U.; Stevens, G. Thermal-metamorphic signature of an impact event in the Vredefort Dome, South Africa. Geology 1998, 26, 787–790. [Google Scholar] [CrossRef]
- Gibson, R.L.; Reimold, W.U.; Ashley, A.J.; Koeberl, C. Metamorphism on the Moon: A terrestrial analogue in the Vredefort dome, South Africa? Geology 2002, 30, 475–478. [Google Scholar] [CrossRef]
- Perchuk, L.L.; Tokarev, D.A.; van Reenen, D.D.; Varlamov, D.A.; Gerya, T.V.; Sazonova, L.V.; Fel’dman, V.I.; Smit, C.A.; Brink, M.C.; Bisschoff, A.A. Dynamic and thermal history of the Vredefort explosion structure in the Kaapvaal craton, South Africa. Petrology 2002, 10, 395–432. [Google Scholar]
- Perchuk, L.L.; Sazonova, L.V.; van Reenen, D.D.; Gerya, T.V. Ultramylonites and their significance for the understanding of the history of the Vredefort impact structure, South Africa. Petrology 2003, 11, 114–129. [Google Scholar]


| Polycrystalline Zircon Characteristics | Genetic Types of Zircon | |||||
|---|---|---|---|---|---|---|
| Igneous | From Regional Metamorphic/Metasomatic Settings and Broad Shear Zones | Related to a Localized Shear-Zone, after [57] | Impact-Related | |||
| D-Grains | Z-Grains | Grains with Fine Granules (Types 1–5) | Grains with Large Granules (Type 7) | |||
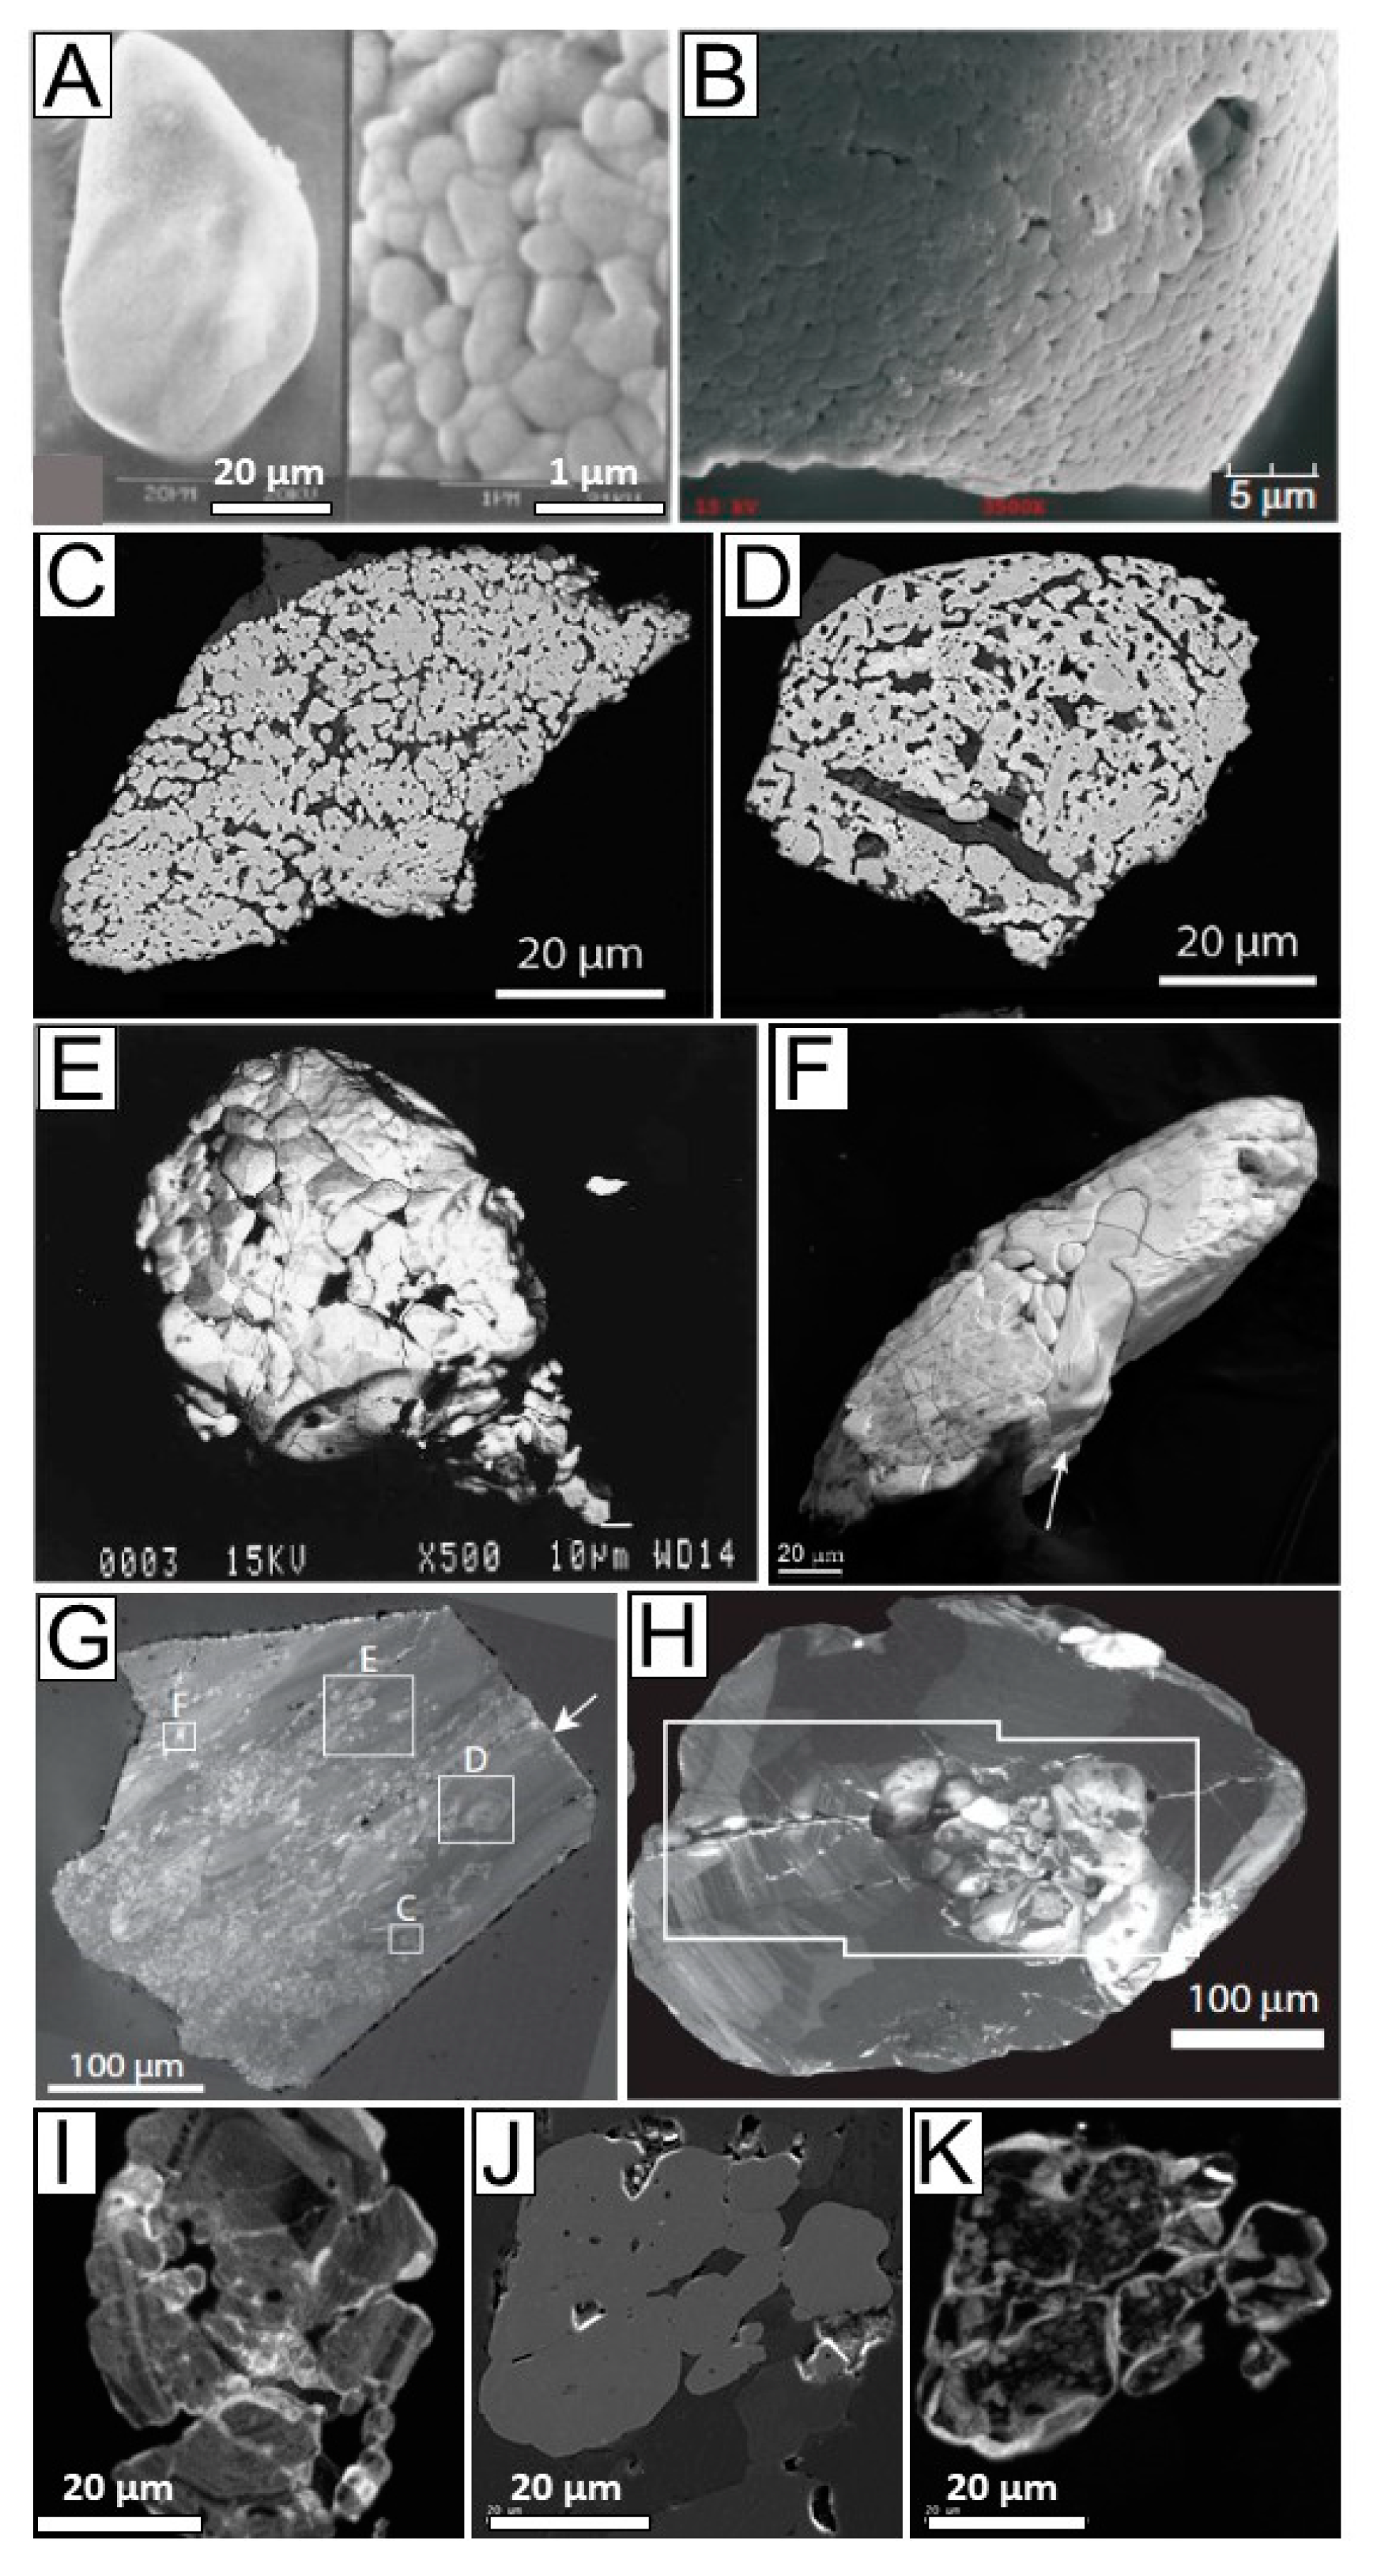
| Grain shape | Subhedral to euhedral, in metamorphosed rocks–(sub)rounded | Cauliflower, crescent shapes of the aggregate; individual granules vary | Elongated to equidimensional irregularly-shaped | Equidimensional, polygonal | Subhedral, rounded or slightly elongated | Euhedral, elongated or equidimensional |
| Grain size | 5–50 µm for individual grain in an aggregate | Parent grains are <10–>500 µm in length; resulting granules are <1–>30 µm | Range from very small <2 to 100–150 μm | 50–100 μm | 0.5–3 µm | 10–100 µm |
| Type of boundaries | Sharp grain boundaries | Low- or high-angle subgrain boundaries, healed fractures with bright haloes | Serrated and irregular grain boundaries | Polygonal grain boundary network with 120° triple junctions indicative of textural equilibrium | Grain boundaries between the granules | Sharp grain boundaries between the neoblasts and parent grain, triple junctions between the neoblasts |
| Internal misorientation type | No internal misorientation | Cumulative misorientation <3–25° by low-angle boundaries or free dislocations | Low-angle boundaries and high-lattice distortions of 2–8° within a single grain | Low internal strain (misorientation not exceeding 1°) | No internal misorientation | No internal misorientation |
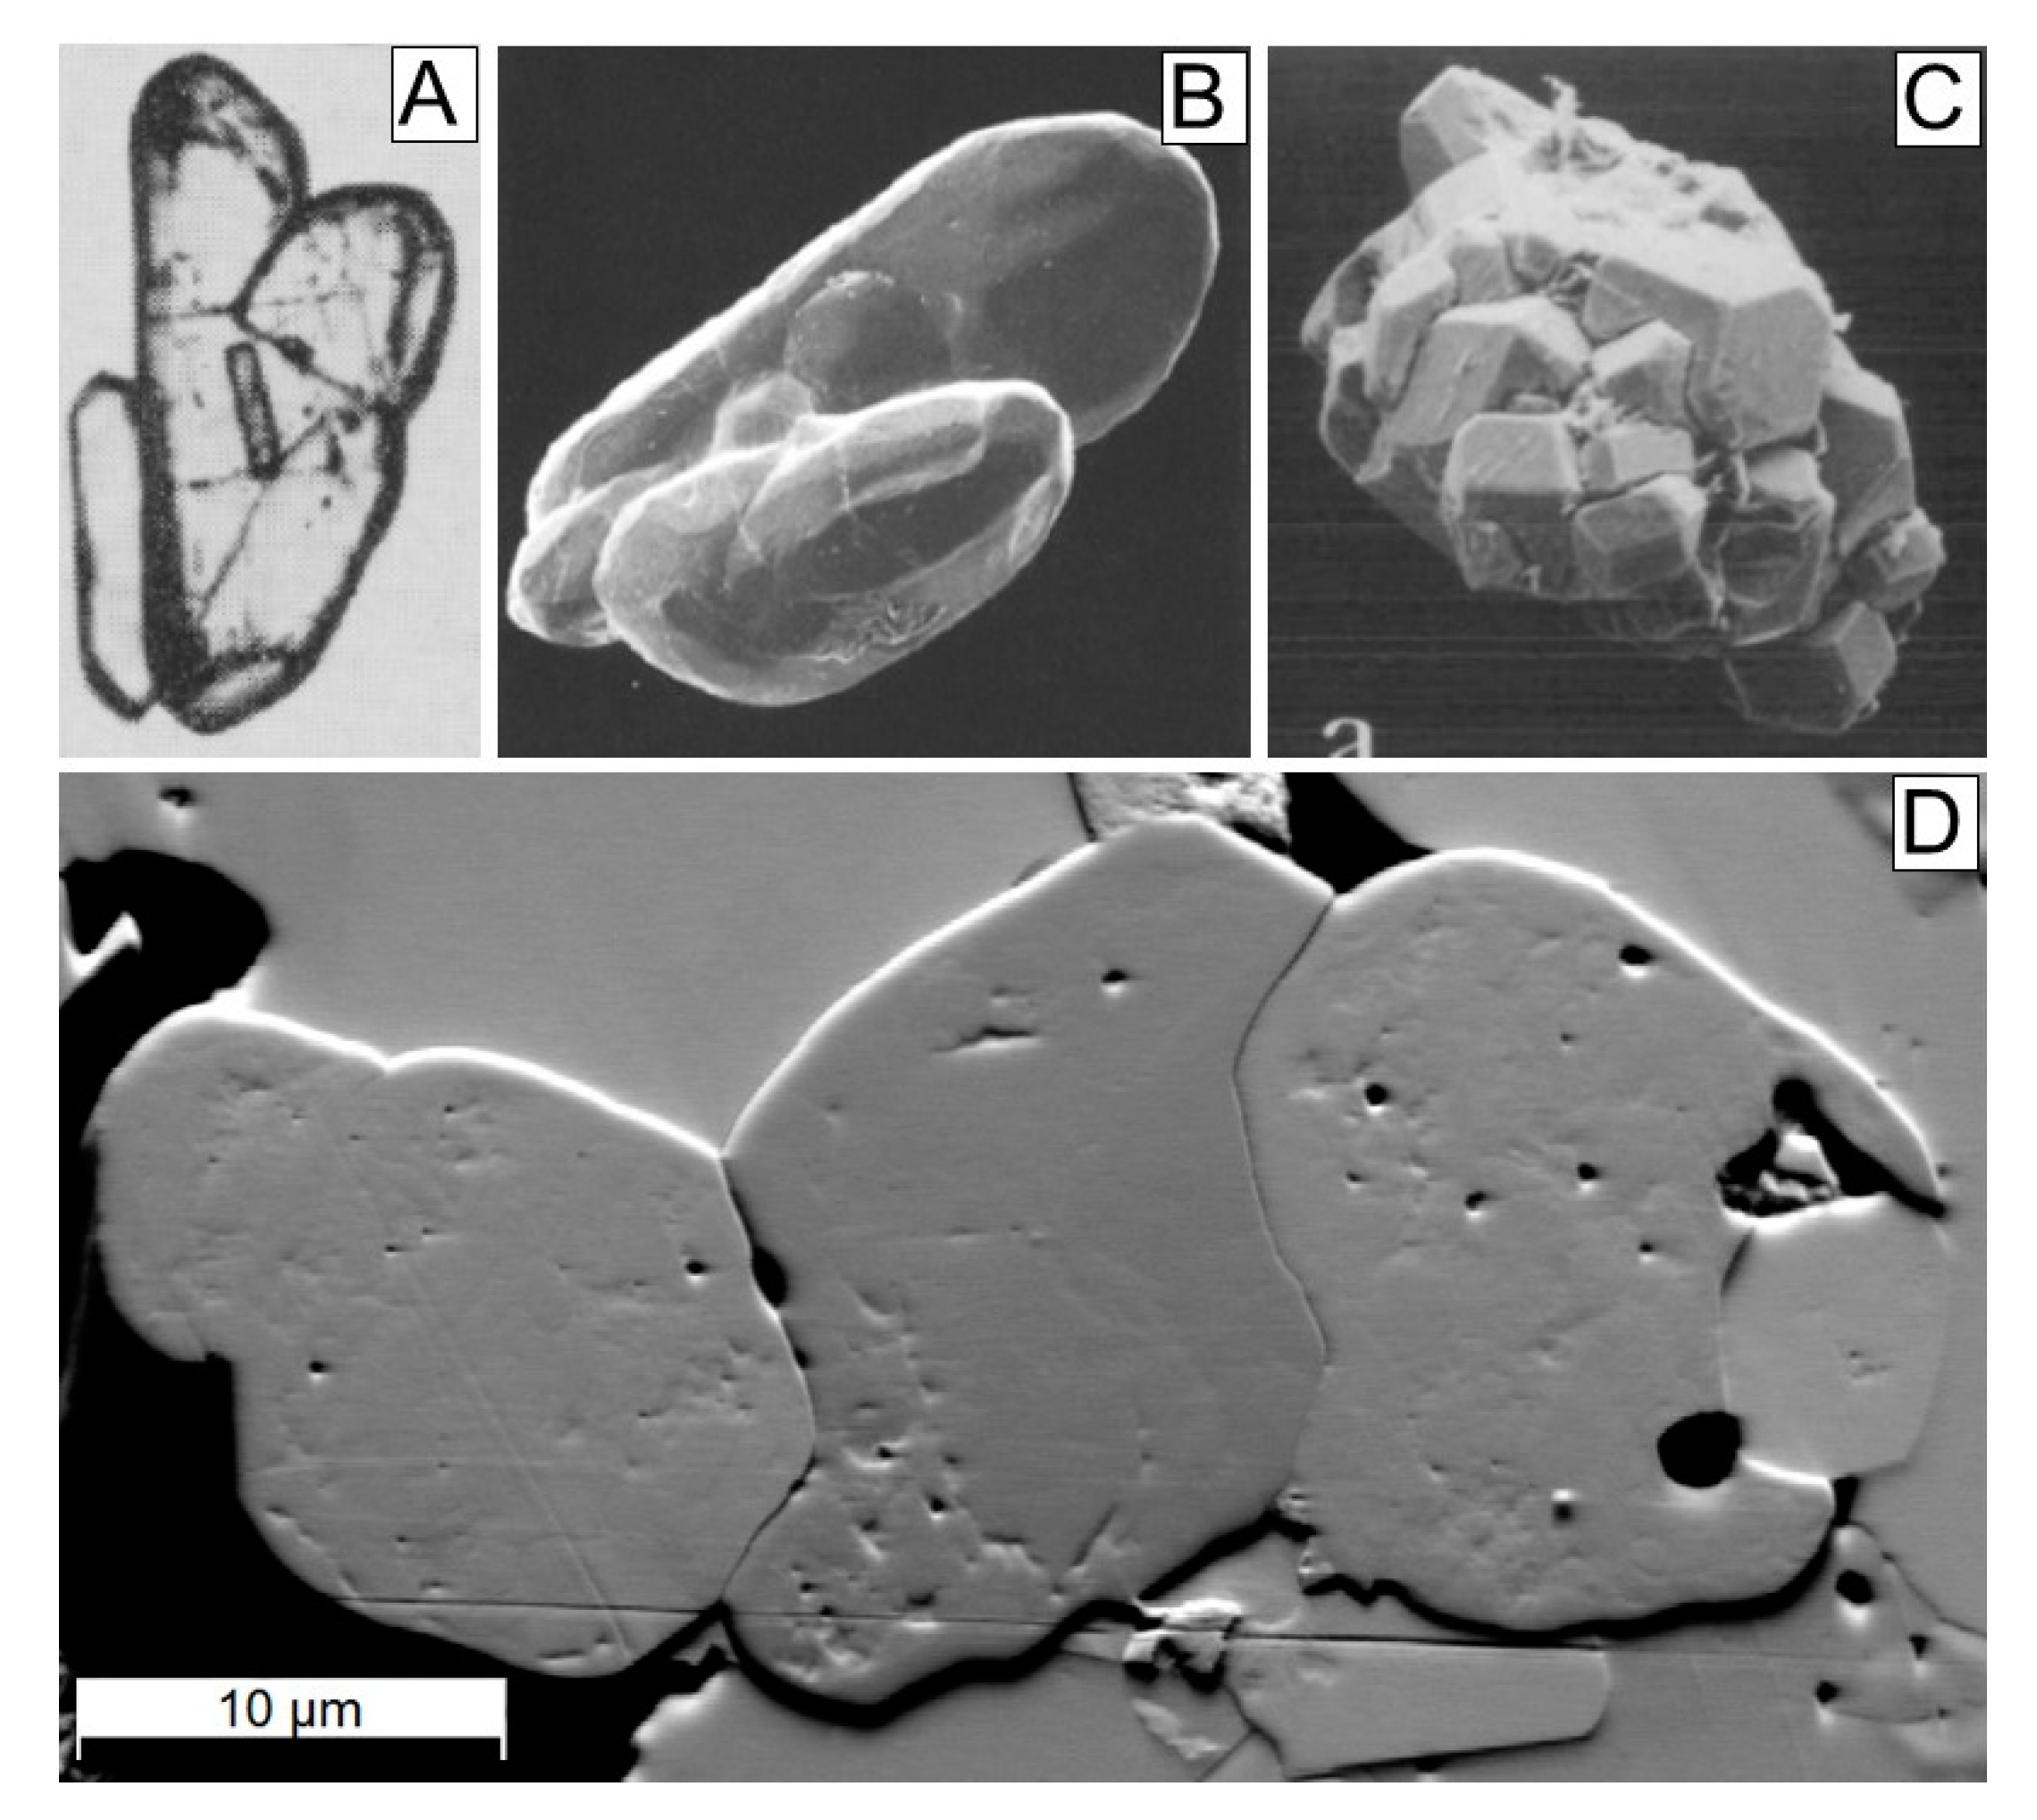
| Orientation with respect to each other or a parent grain | Twin relationships [7,11,68] or disorientation at high angles [11] | Unsystematic scattering around parent orientation with low total misorientation (5–15°) | Mostly random orientation and no relationship to the porphyroclast | Little affinity to a parent grain, random orientation | Random orientation, three clusters of orthogonal c-axes, twin orientation | Random orientation, independent of the host grain |
| Inclusions | Magmatic rock-forming or accessory minerals (e.g., apatite) | Fine-grained matrix phases within healed fractures | Rutile and ilmenite, smaller zircon grains (Z-grains) | Ilmenite trapped between the Z-grains | Reidite, baddeleyite | None |
| CL signature | Individual zircon grains within the aggregate have magmatic growth zoning | Initial concentric growth zoning is crosscut by CL-bright linear features; in some cases, overgrown by CL-bright, Y and REE-depleted metamorphic rims | Bright CL signature, closely linked to the deformation features | Concentric, slightly diffuse growth zoning | Concentric with dark cores and bright rims; the initial growth zoning of the parent grain is preserved | Concentric grown zoning as in igneous grains |
| Host rocks | Predominantly granitoids | Metaigneous and metasedimentary foliated (ultra)mylonites, peak conditions at amphibolite facies | High-strain mylonitic zone in the granulite facies meta-anorthositic body | High-strain mylonitic zone in the granulite facies meta-anorthositic body | Suevite, diaplectic glass, tectites, impact glasses and impact melts, fallback and distal ejecta | Impact melt rocks |
| Formation mechanism and temperature | Several nucleation points close to each other come into contact; crystallization temperature of granitoids | Fracturing and/or crystal-plastic deformation, e.g., due to hydraulic fracturing or high differential stress. The fragments are corroded and sometimes subsequently healed with metamorphic fluid. Peak metamorphic temperatures: 550–650 °C | Fragmentation with fragment detachment from each other. Fragments are being unsystematically rotated by grain boundary sliding. Deformation temperature ca. 620–690 °C | Heterogeneous nucleation/growth caused by a deformation-induced influx of fluids at the retrograde stage of deformation. Nucleate within the parent lattice with high dislocation density. (De)formation temperature ca. 725 to 750 °C | Recrystallization under high pressure-temperature conditions: solid-state or through melting. High impact temperatures: >1100–1200 °C [65] | Possibly, grew post-impact, due to elevated temperatures maintained after initial shock; could be similar to Z-grains. High post-impact temperatures of ca. 1000 °C |
| U-Pb dating | Age of crystallization of the igneous melt | Age of CL-bright metamorphic areas results in the age of regional metamorphism [4], the detrital cores might be partially reset [55] | Have a large age spread, distorted isotopic system | Directly date the metamorphic reworking, complete resetting of the U-Pb system | May or may not yield the age of an impact; partial or complete resetting of radiogenic Pb | Age of an impact event; complete resetting of radiogenic Pb |
© 2020 by the author. Licensee MDPI, Basel, Switzerland. This article is an open access article distributed under the terms and conditions of the Creative Commons Attribution (CC BY) license (http://creativecommons.org/licenses/by/4.0/).
Share and Cite
Kovaleva, E. Textural Identification of Polycrystalline Magmatic, Tectonically-Deformed, and Shock-Related Zircon Aggregates. Minerals 2020, 10, 469. https://doi.org/10.3390/min10050469
Kovaleva E. Textural Identification of Polycrystalline Magmatic, Tectonically-Deformed, and Shock-Related Zircon Aggregates. Minerals. 2020; 10(5):469. https://doi.org/10.3390/min10050469
Chicago/Turabian StyleKovaleva, Elizaveta. 2020. "Textural Identification of Polycrystalline Magmatic, Tectonically-Deformed, and Shock-Related Zircon Aggregates" Minerals 10, no. 5: 469. https://doi.org/10.3390/min10050469
APA StyleKovaleva, E. (2020). Textural Identification of Polycrystalline Magmatic, Tectonically-Deformed, and Shock-Related Zircon Aggregates. Minerals, 10(5), 469. https://doi.org/10.3390/min10050469