Quantitative Microstructural Analysis and X-ray Computed Tomography of Ores and Rocks—Comparison of Results


Abstract
1. Introduction
2. Methods and Materials
2.1. QMA—Microstructural Analysis Based on Optical Microscopy
Mode (Volume Percentage of the Mineral Phases)
Grain Size
Grain Shape
Roughness
Orientation
Distribution
Space Filling
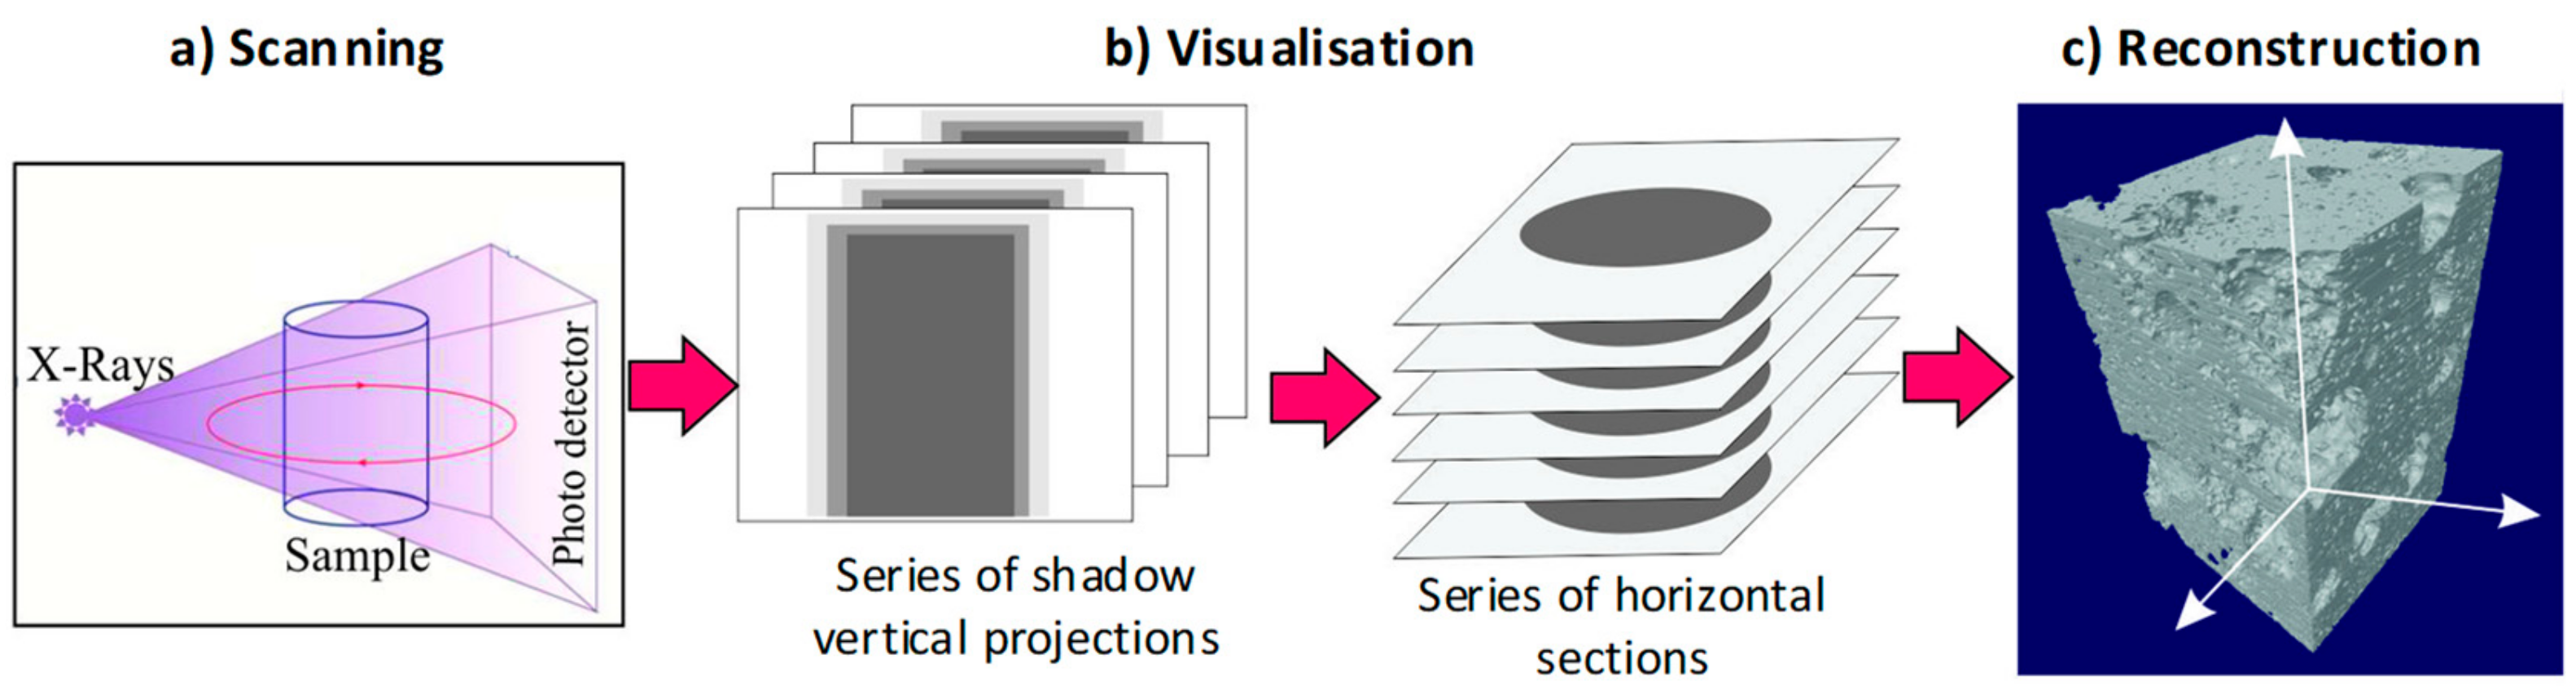
2.2. X-ray Computed Tomography (CT)
2.3. Sample Materials
- mode (volume percentage of the mineral phases),
- characteristic values of the texture (e.g., grain size and shape, roughness),
- characteristic values of the structure (e.g., orientation, distribution and space filling).
- copper ore (green sandstone ore) from Legnica (Poland),
- granodiorite from Kindisch (Saxony, Germany),
- kimberlite from Letseng (Lesotho).
3. Results
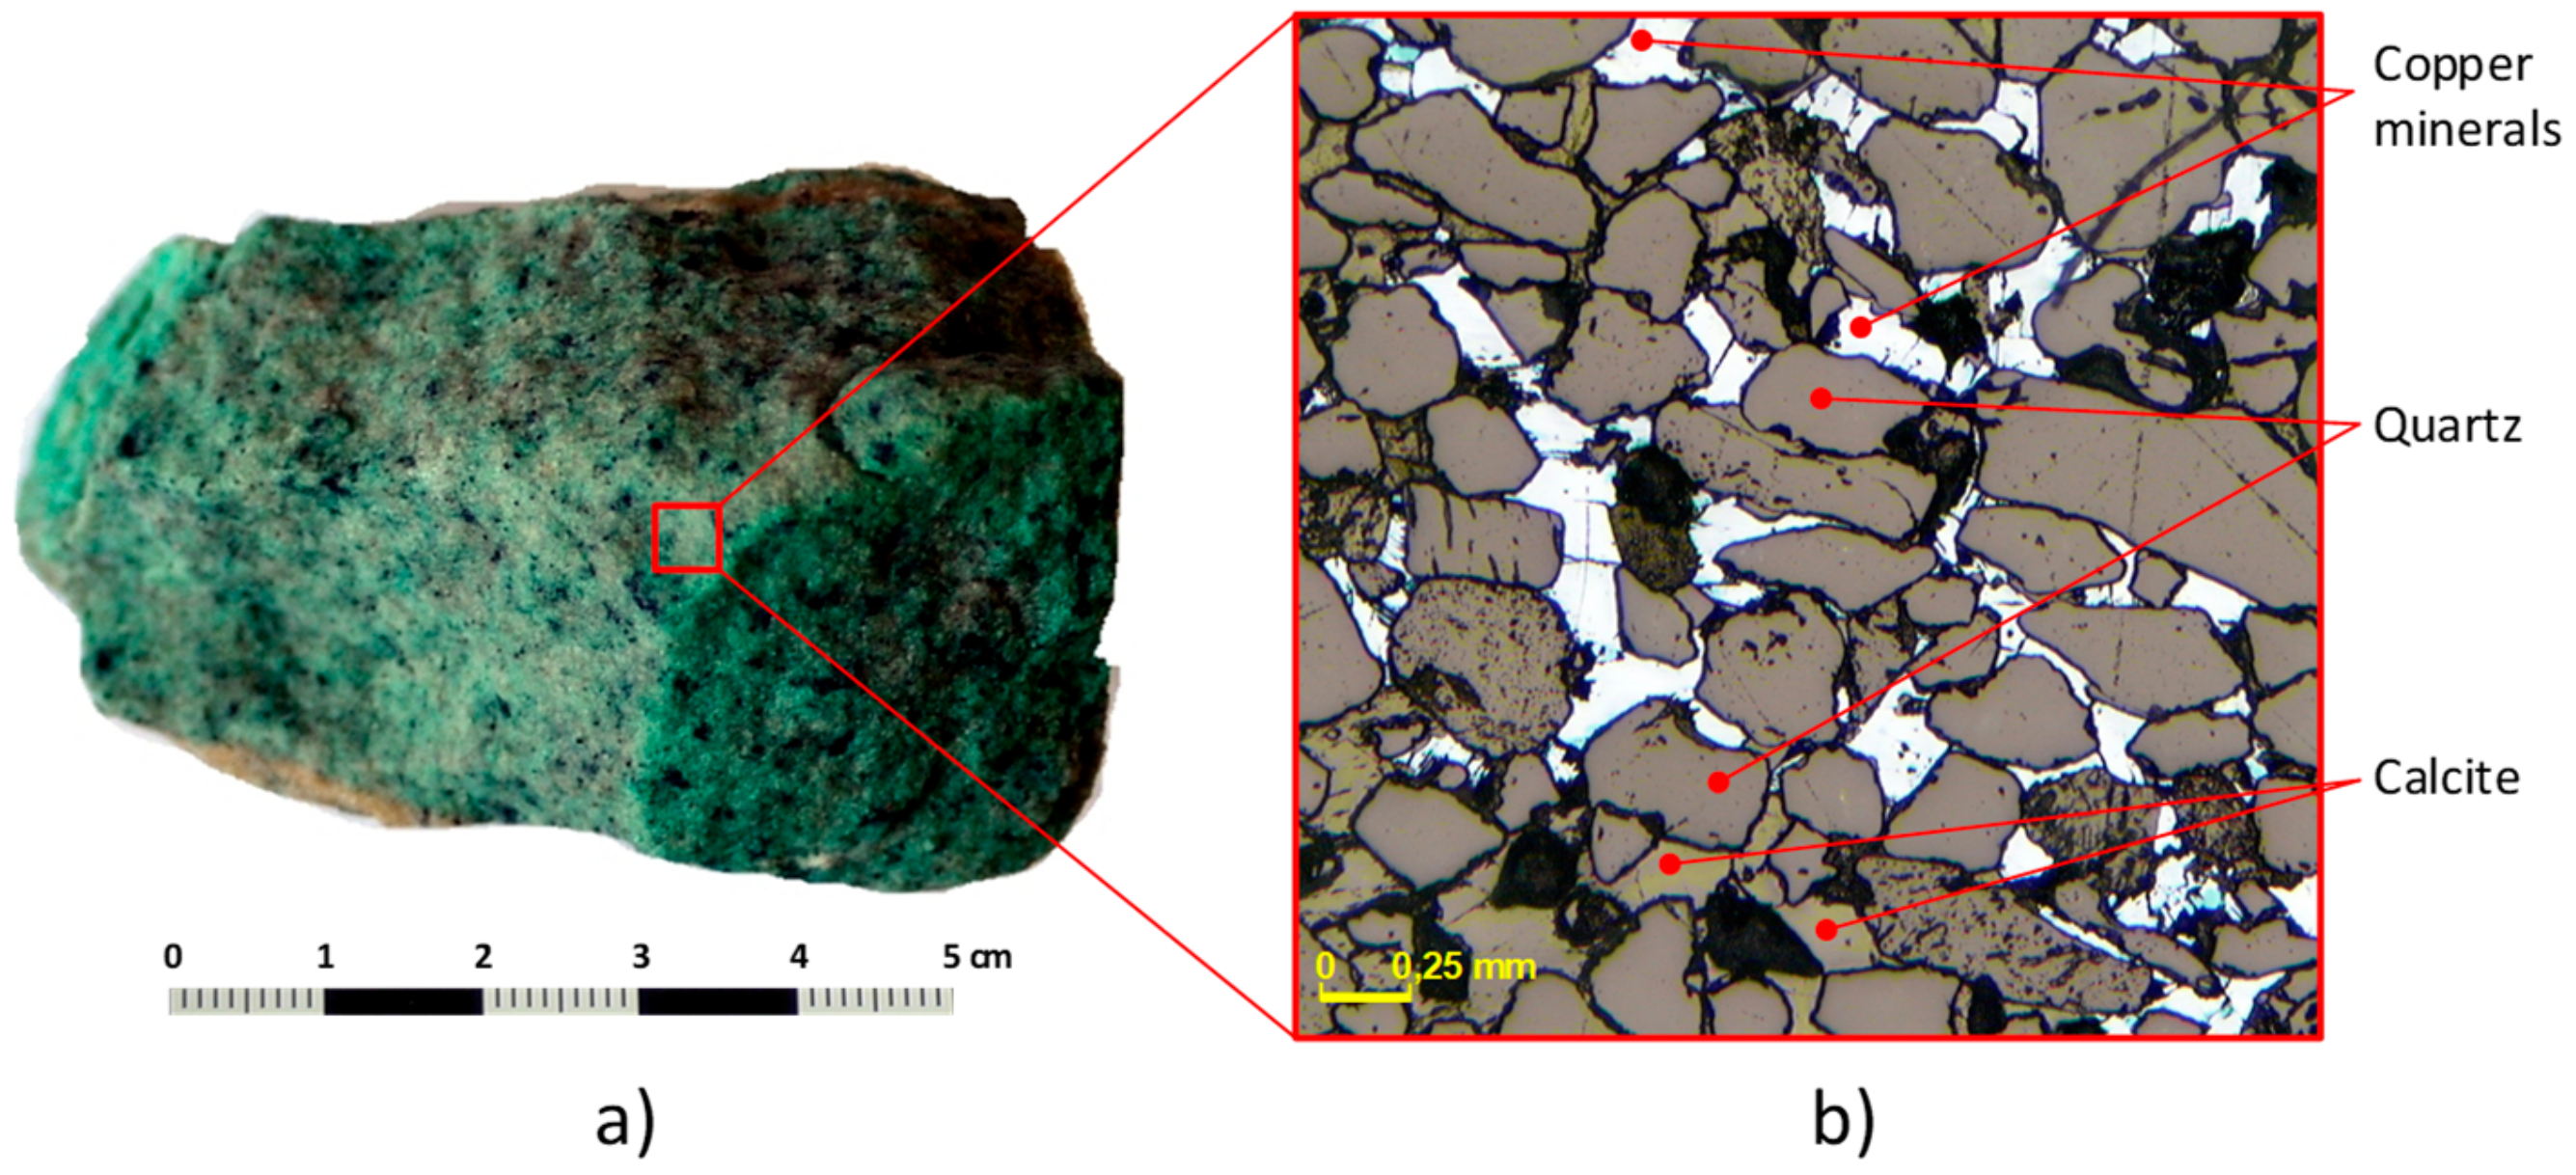
3.1. Copper Ore
3.1.1. QMA Results (Copper Ore)
Mode
Grain Size
Grain Shape
Roughness
Specific Surface Area
Degree of Clustering
Space Filling
3.1.2. CT Results (Copper Ore)
Mode
Grain Size
Grain Shape
Roughness
Orientation
Porosity
3.2. Granodiorite
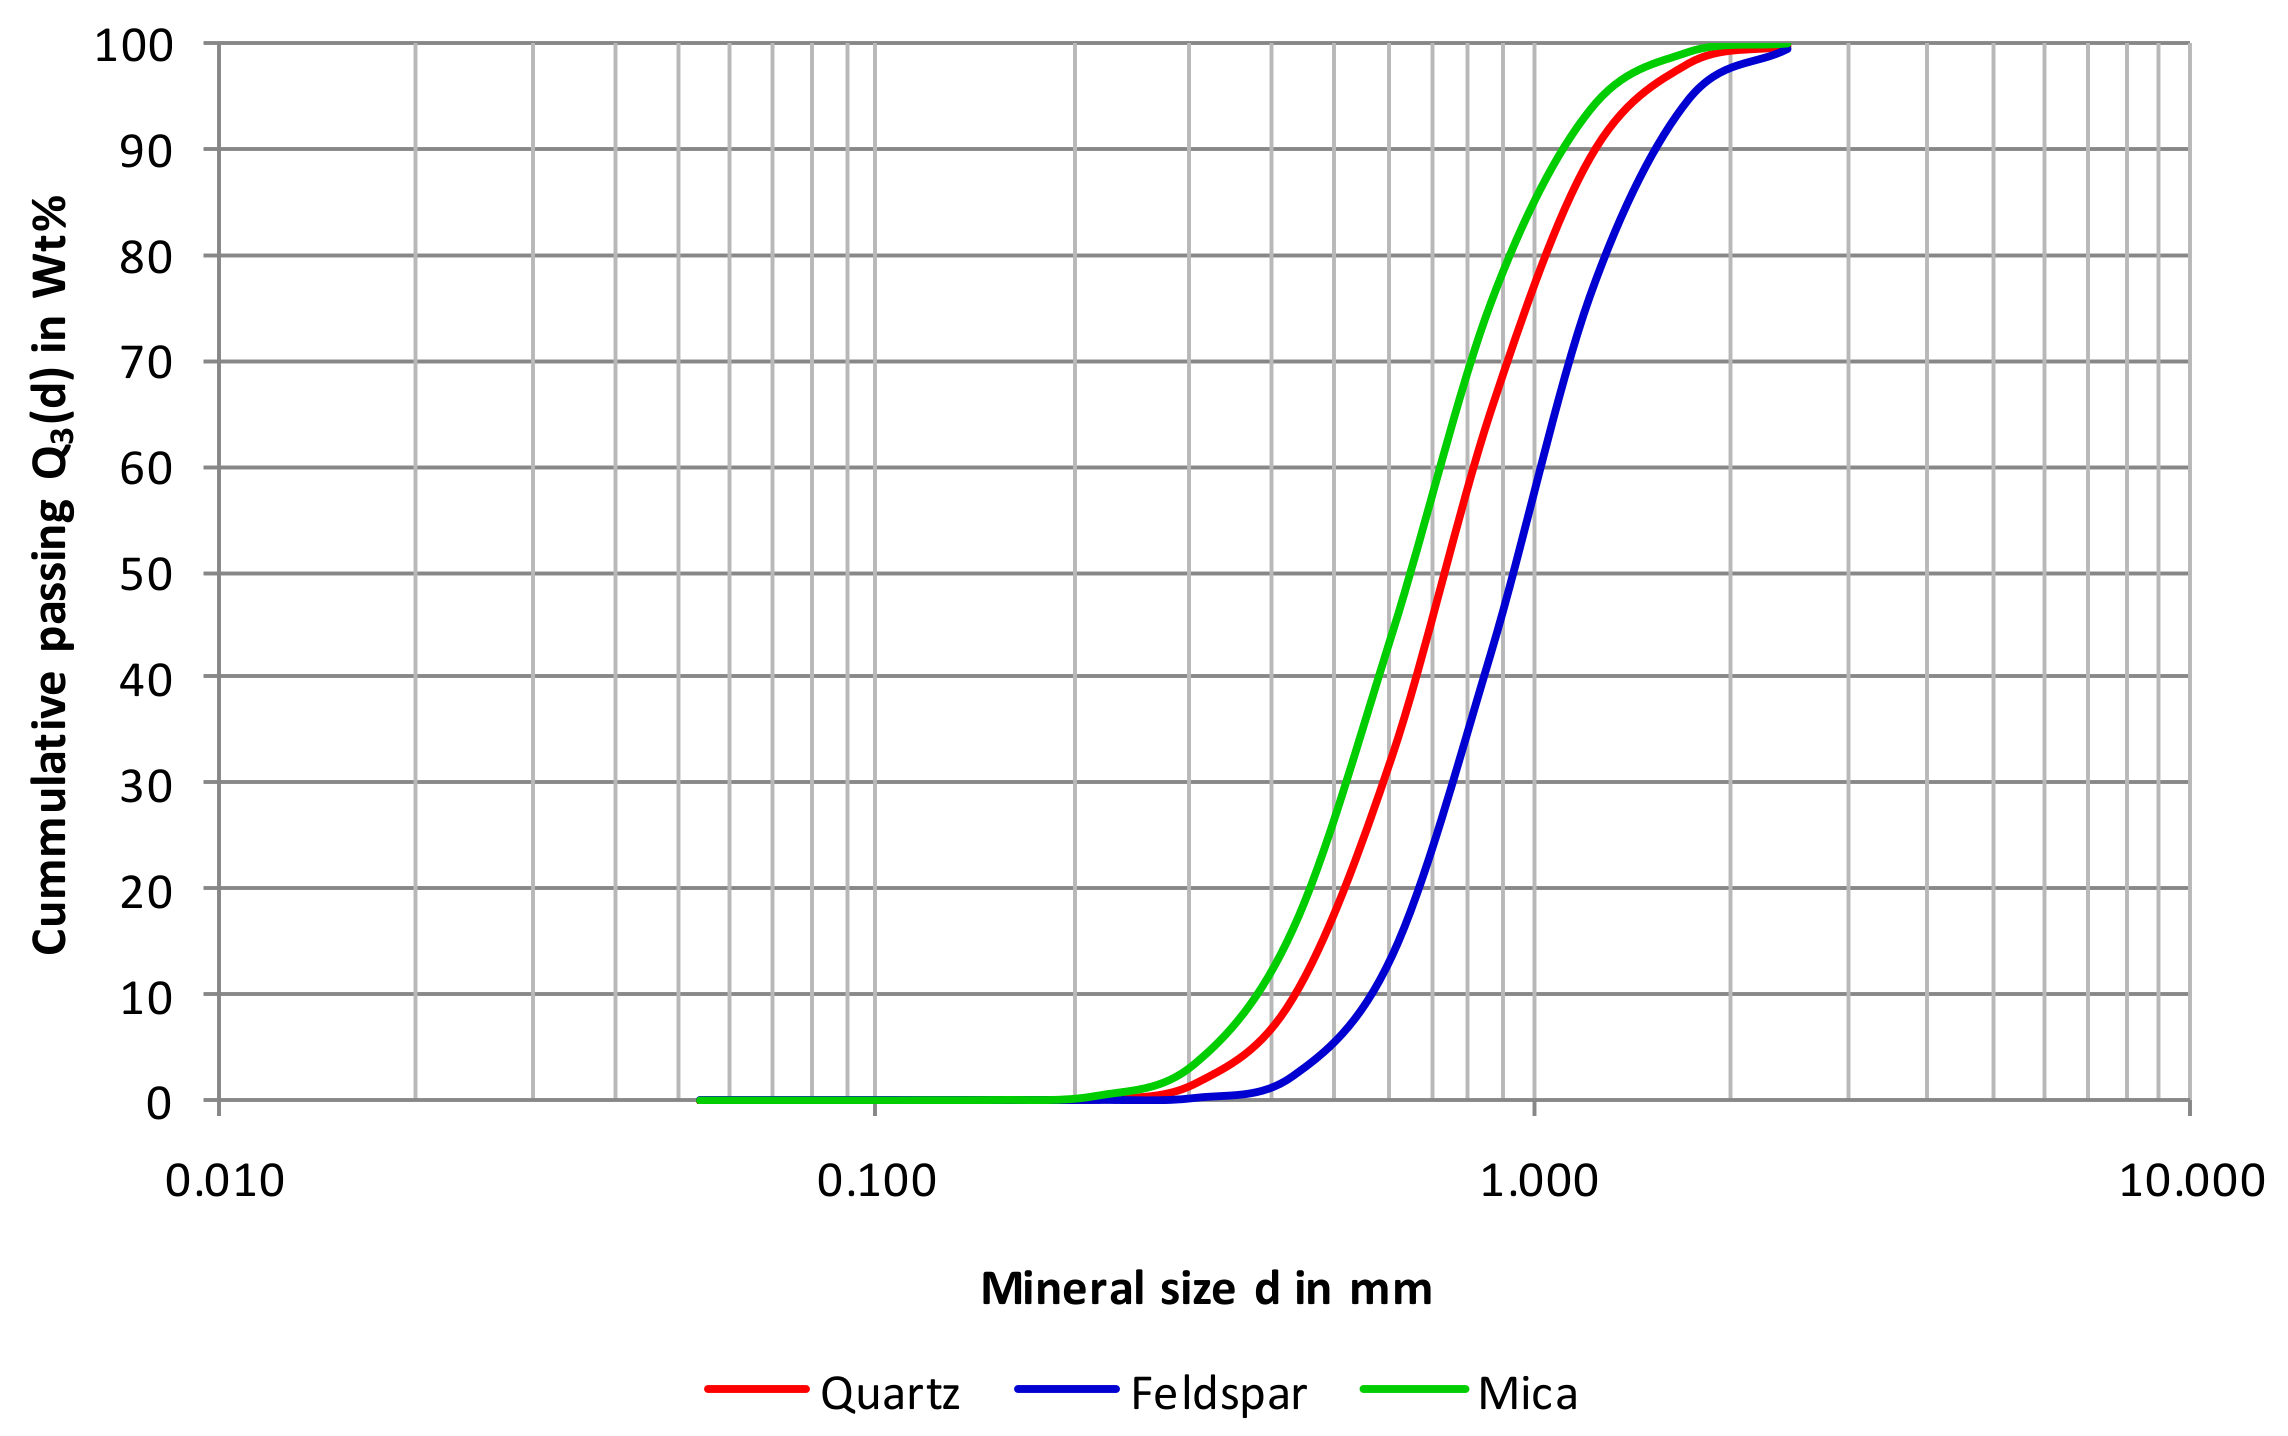
3.2.1. QMA Results (Granodiorite)
Mode
Grain Size
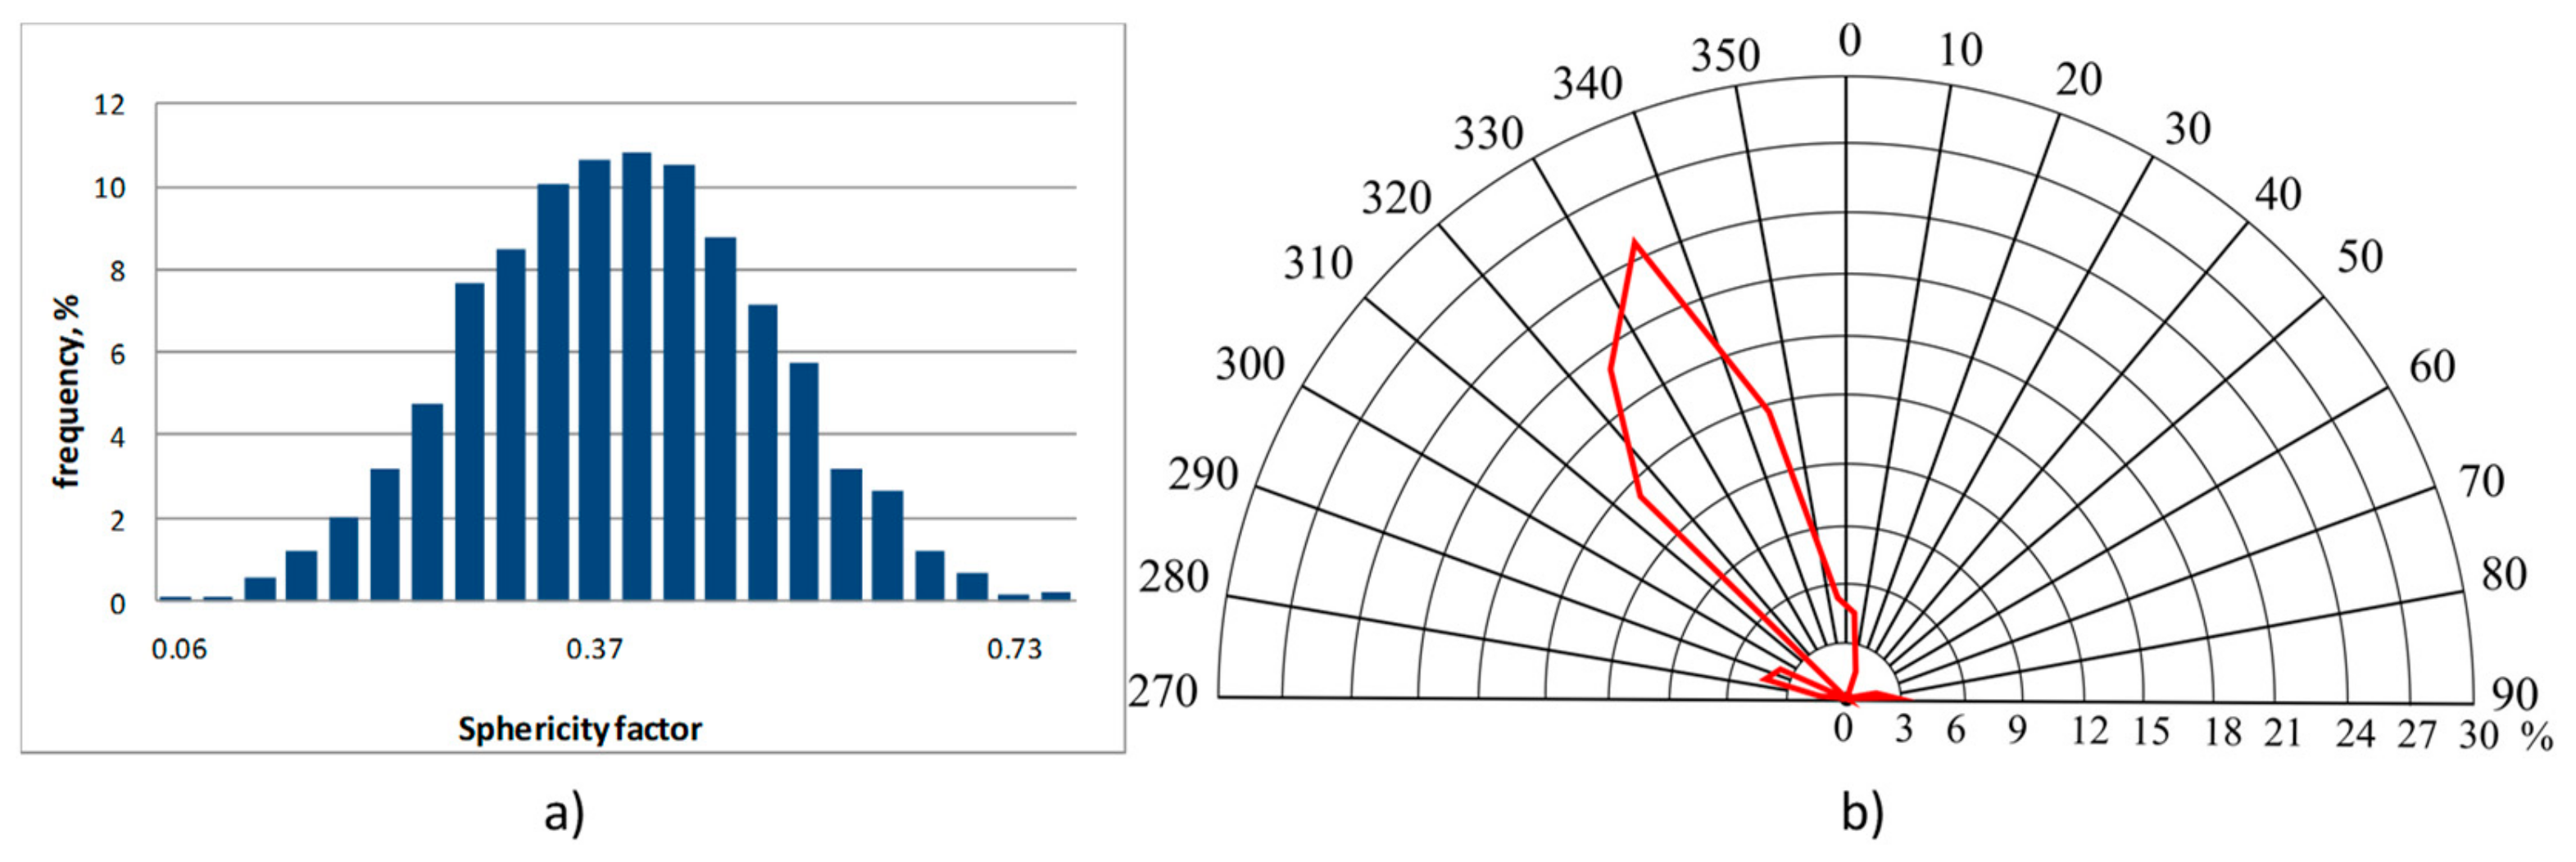
Grain Shape
Roughness
Specific Surface Area
Degree of Clustering
Isotropic Orientation
3.2.2. CT Results (Granodiorite)
Mode
Grain Shape
Specific Surface Area
Isotropic Orientation
Porosity
3.3. Kimberlite
3.3.1. QMA Results (Kimberlite)
Mode
Grain Size
Grain Shape
3.3.2. CT Results (Kimberlite)
Mode
Grain Shape
Specific Surface
Orientation
Clustering
Porosity
4. Discussion
5. Conclusions
Author Contributions
Funding
Conflicts of Interest
References
- Bringezu, S.; Ramaswami, A.; Schandl, H.; O’Brien, M.; Pelton, R. Assessing Global Resource Use: A Systems Approach to Resource Efficiency and Pollution Reduction. 2017. Available online: https://wedocs.unep.org/bitstream/handle/20.500.11822/27432/resource_use.pdf?sequence=1 (accessed on 25 January 2020).
- Schodde, R. Role of Technology and Innovation for Identifying and Growing Economic Resources. In Proceedings of the 12th Biennial Exploration Managers Conference, Hunter Valley, Australia, 26–29 July 2019. [Google Scholar]
- Steinbach, V. E-mobility—The Global Race for High-Tech Metals. In Proceedings of the 100 years IEC, Scientific Colloquium - Solutions for the Carbon Challenge, Berlin, Germany, 10–12 October 2019. [Google Scholar]
- Ballantyne, G.R.; Powell, M.S. Benchmarking comminution energy consumption for the processing of copper and gold ores. Miner. Eng. 2019, 65, 109–114. [Google Scholar] [CrossRef]
- Hesse, M. Selektive Zerkleinerung von Erzen und Industriemineralen bei Prallbeanspruchung; TU Bergakademie Freiberg: Freiberg, Germany, 2017. (In German) [Google Scholar]
- Li, X.F.; Li, X.; Li, H.B.; Zhang, Q.B.; Zhao, J. Dynamic tensile behaviours of heterogeneous rocks: The grain scale fracturing characteristics on strength and fragmentation. Int. J. Impact Eng. 2018, 118, 98–118. [Google Scholar] [CrossRef]
- Aleksandrova, T.N.; Nikolaeva, N.V.; Lvov, V.V.; Romashev, A.O. Ore processing efficiency improvements for precious metals based on process simulations. Obogashchenie Rud 2019, 2, 8–13. [Google Scholar] [CrossRef]
- Popov, O. Beitrag zur Mathematisch-Petrographischen Gefügecharakterisierung für die Beurteilung der Festgesteine Hinsichtlich Ihrer Aufbereitung und Ihrer Produkteigenschaften; TU Bergakademie Freiberg: Freiberg, Germany, 2007. (In German) [Google Scholar]
- Popov, O.; Lieberwirth, H.; Folgner, T. Quantitative Charakterisierung der Festgesteine zur Prognostizierung des Gesteinseinflusses auf relevante Produkteigenschaften und Systemkenngrößen. Teil 1: Anwendung der quantitativen Gefügeanalyse. AT Miner. Process. 2014, 07–08, 76–88. [Google Scholar]
- Popov, O.; Lieberwirth, H.; Folgner, T. Quantitative Charakterisierung der Festgesteine zur Prognostizierung des Gesteinseinflusses auf relevante Produkteigenschaften und Systemkenngrößen. Teil 2: Ausgewählte Beispiele. AT Miner. Process. 2014, 10, 54–63. [Google Scholar]
- Schreiber, S. Beitrag zur Quantitativen Gesteinscharakterisierung zur Beurteilung von Gesteinen hinsichtlich Ihrer Festigkeiten; TU Bergakademie Freiberg: Freiberg, Germany, 2018. (In Germany) [Google Scholar]
- Tromans, D. Crack Propagation in Brittle Materials: Relevance to Minerals Comminution. Int. J. Recent Res. Appl. Stud. 2012, 11, 406–427. [Google Scholar]
- Hesse, M.; Popov, O.; Lieberwirth, H. Increasing efficiency by selective comminution. Miner. Eng. 2017, 103–104, 112–126. [Google Scholar] [CrossRef]
- Mezzetti, M.; Popov, O.; Lieberwirth, H.; Anders, E.; Hoske, P. Electro Impulse Technology for Processing Complex Ores. In Proceedings of the ESCC European Symposium on Comminution and Classification, Izmir, Turkey, 11–14 September 2017. [Google Scholar]
- Zuo, W.; Shi, F.; Manlapig, E. Modelling of high voltage pulse breakage of ores. Miner. Eng. 2015, 83, 168–174. [Google Scholar] [CrossRef]
- Hilden, M.M.; Powell, M.S. A geometrical texture model for multi-mineral liberation prediction. Miner. Eng. 2017, 111, 25–35. [Google Scholar] [CrossRef]
- Napier-Munn, T.; Drinkwater, D.; Ballantyne, G. The CEEC Roadmap for Eco-Efficient Comminution. CEEC/JKTech Workshop on Eco-Efficient Comminution. CEEC the Future. Available online: https://www.ceecthefuture.org/media/downloads/CEECRoadmap.pdf (accessed on 25 January 2020).
- Delaney, G.W.; Morrison, R.D.; Sinnott, M.D.; Cummins, S.; Cleary, P.W. DEM modelling of non-spherical particle breakage and flow in an industrial scale cone crusher. Miner. Eng. 2015, 74, 112–122. [Google Scholar] [CrossRef]
- Johansson, M.; Quist, J.; Evertsson, M.; Hulthén, E. Cone crusher performance evaluation using DEM simulations and laboratory experiments for model validation. Miner. Eng. 2017, 103–104, 93–101. [Google Scholar] [CrossRef]
- Tavares, L.M.; das Neves, P.B. Microstructure of quarry rocks and relationships to particle breakage and crushing. Int. J. Miner. Process. 2008, 87, 28–41. [Google Scholar] [CrossRef]
- Weerasekara, N.S.; Powell, M.S.; Cleary, P.W.; Tavares, L.M.; Evertsson, M.; Morrison, R.D.; Quist, J.; Carvalho, R.M. The contribution of DEM to the science of comminution. Powder Technol. 2013, 248, 3–24. [Google Scholar] [CrossRef]
- Klichowicz, M.; Frühwirt, T.; Lieberwirth, H. New experimental setup for the validation of DEM simulation of brittle crack propagation at grain size level. Miner. Eng. 2018, 128, 312–323. [Google Scholar] [CrossRef]
- Klichowicz, M.; Lieberwirth, H. Modelling of Realistic Microstructures as Key Factor for Comminution Simulations. In Proceedings of the XXVIII International Mineral Processing Congress (IMPC), Québec, QC, Canada, 11–15 September 2016; pp. 1–10. [Google Scholar]
- Kühnel, L. Untersuchungen zur Gutbettzerkleinerung in einer hydraulischen Stempelpresse; TU Bergakademie Freiberg: Freiberg, Germany, 2019. (In German) [Google Scholar]
- Leißner, T.; Hoang, D.H.; Rudolph, M.; Heinig, T.; Bachmann, K.; Gutzmer, J.; Schubert, H.; Peuker, U.A. A mineral liberation study of grain boundary fracture based on measurements of the surface exposure after milling. Int. J. Miner. Process. 2016, 156, 3–13. [Google Scholar] [CrossRef]
- Rahfeld, A.; Kleeberg, R.; Möckel, R.; Gutzmer, J. Quantitative mineralogical analysis of European Kupferschiefer ore. Miner. Eng. 2018, 115, 21–32. [Google Scholar] [CrossRef]
- Evans, C.L.; Wightman, E.M.; Yuan, X. Quantifying mineral grain size distributions for process modelling using X-ray micro-tomography. Miner. Eng. 2015, 82, 78–83. [Google Scholar] [CrossRef]
- Talovina, I.V.; Aleksandrova, T.N.; Popov, O.; Lieberwirth, H. Comparative analysis of rocks structural-textural characteristics studies by computer X-ray microtomography and quantitative microstructural analysis methods. Obogashchenie Rud 2017, 3, 56–62. [Google Scholar] [CrossRef]
- Vaysberg, L.A.; Kameneva, E.E. Vozmozhnosti kompyuternoy mikrotomografii pri issledovanii fiziko-mekhanicheskikh svoystv gornykh porod (The possibilities of computer microtomography in the study of physical and mechanical properties of rocks). Gornyy zhurnal 2014, 9, 85–90. [Google Scholar]
- Vaysberg, L.A.; Kameneva, E.E.; Pimenov, Y.G.; Sokolov, D.I. Issledovaniye struktury porovogo prostranstva granito- gneysa metodom rentgenovskoy tomografii. (The study of the structure of the pore space of granite-gneiss by x-ray tomography). Obogashcheniye Rud 2013, 3, 37–40. [Google Scholar]
- Gasumov, R.A.; Gridin, V.A.; Kopchenkov, V.G.; Galai, B.F.; Dudaev, S.A. Research of Mining and Geological Conditions for Geological Exploration in Pre-Caucasus Region. Zapiski Gornogo instituta 2017, 228, 654–661. [Google Scholar] [CrossRef]
- Ivanov, M.; Burlin, G.; Kalmykov, E. Petrophysic Research Methods of Core Material (Terrigenous Deposits); Book 1; Moscow University Publishing House: Moscow, Russia, 2008. (In Russian) [Google Scholar]
- Shtyrlyaeva, A.A.; Zhuravlev, A.V.; Gerasimova, A.I. Prospects and problems of computer microtomography using for core samples studies. NGTP 2016, 11, 1. [Google Scholar] [CrossRef]
- Willson, C.S.; Lu, N.; Likos, W.J. Quantification of Grain, Pore, and Fluid Microstructure of Unsaturated Sand from X-ray Computed Tomography Images. Geotech. Test. J. 2012, 35, 20120075. [Google Scholar] [CrossRef]
- Ho, S.T.; Hutmacher, D.W. A comparison of micro CT with other techniques used in the characterization of scaffolds. Biomaterials 2006, 27, 1362–1376. [Google Scholar] [CrossRef] [PubMed]
- Ditscherlein, R.; Leißner, T.; Peuker, U.A. Preparation techniques for micron-sized particulate samples in X-ray microtomography. Powder Technol. 2020, 360, 989–997. [Google Scholar] [CrossRef]
- Leißner, T.; Diener, A.; Löwer, E.; Ditscherlein, R.; Krüger, K.; Kwade, A.; Peuker, U.A. 3D ex-situ and in-situ X-ray CT process studies in particle technology—A perspective. Adv. Powder Technol. 2019. [Google Scholar] [CrossRef]
- Duryagina, A.; Talovina, I.; Shtyrlyaeva, A.; Popov, O.; Duryagina, A.; Talovina, I.; Shtyrlyaeva, A.; Popov, O. Application of Computer X-ray Microtomography for Study of Technological Properties of Rocks. Key Eng. Miner. 2018, 769, 220–226. [Google Scholar] [CrossRef]
- Glagolev, A.A. Quantitative analysis with the microscope by the point method. Eng. Min. J. 1934, 135, 339–400. [Google Scholar]
- Unland, G.; Folgner, T. Automatische Kornformbestimmung durch photooptische Partikelanalyse. Die Naturstein-Industrie 1997, 5, 20–28. [Google Scholar]


| Raw Material | Rock Type: Granodiorite | Phase Related Features | Raw Material Features | ||||||
|---|---|---|---|---|---|---|---|---|---|
| Deposit: Kindisch Location: Saxony, Germany | |||||||||
| Mode | Properties | Symbol | Unit | Quartz | Feldspar | Mica | Σ Microbodies | ||
| Content | Volumetric Portion | εV | % | 34 | 48 | 18 | 100 | ||
| Fabric | Texture | Size | Mean diameter | d50,3 | mm | 0.732 | 0.928 | 0.647 | 0.810 |
| Scatter parameter | σln | - | 0.410 | 0.384 | 0.414 | 0.398 | |||
| Grain surface | Specific surface | SV | mm2/mm3 | 7.480 | 5.180 | 11.200 | 7.050 | ||
| Shape | Elongation | E | - | 1.274 | 1.330 | 1.968 | 1.425 | ||
| Flatness | F | - | 1.267 | 1.248 | 1.059 | 1.221 | |||
| Roughness | Rougjness degree | KR | % | 30 | 13 | 38 | 23 | ||
| Structure | Orientation | Degree of linear orientation | Klin | % | 16 | 18 | 42 | 10 | |
| Degree of areal orientation | Kfl | % | 12 | 12 | 3 | 11 | |||
| Degree of isotropic orientation | Kis | % | 72 | 70 | 55 | 79 | |||
| Distribution | Degree of clustering | C | % | 36 | 41 | 13 | 34 | ||
| Space filling | Space filling degree | εVF | % | - | - | - | 100 | ||
| Parameters | Unit | Copper Sandstone | Granodiorite | Kimberlite |
|---|---|---|---|---|
| Accelerating voltage | kV | 100 | 125 | 130 |
| Current rate | mA | 80 | 61 | 61 |
| Resolution | µm | 19.58 | 32.32 | 19.58 |
| Filter | mm | Al 0.1 | Brass 0.25 | Brass 0.25 |
| Rotation step | grade | 0.100 | ||
| Parameter | Copper Ore (Copper Minerals) | Granodiorite (Mica) | Kimberlite (Olivine) | |||
|---|---|---|---|---|---|---|
| QMA | CT | QMA | CT | QMA | CT | |
| Specific surface SV mm2/mm3 | 52.84 | 31.86 | 11.20 | 20.20 | 6.23 | 40.17 |
© 2020 by the authors. Licensee MDPI, Basel, Switzerland. This article is an open access article distributed under the terms and conditions of the Creative Commons Attribution (CC BY) license (http://creativecommons.org/licenses/by/4.0/).
Share and Cite
Popov, O.; Talovina, I.; Lieberwirth, H.; Duriagina, A. Quantitative Microstructural Analysis and X-ray Computed Tomography of Ores and Rocks—Comparison of Results. Minerals 2020, 10, 129. https://doi.org/10.3390/min10020129
Popov O, Talovina I, Lieberwirth H, Duriagina A. Quantitative Microstructural Analysis and X-ray Computed Tomography of Ores and Rocks—Comparison of Results. Minerals. 2020; 10(2):129. https://doi.org/10.3390/min10020129
Chicago/Turabian StylePopov, Oleg, Irina Talovina, Holger Lieberwirth, and Asiia Duriagina. 2020. "Quantitative Microstructural Analysis and X-ray Computed Tomography of Ores and Rocks—Comparison of Results" Minerals 10, no. 2: 129. https://doi.org/10.3390/min10020129
APA StylePopov, O., Talovina, I., Lieberwirth, H., & Duriagina, A. (2020). Quantitative Microstructural Analysis and X-ray Computed Tomography of Ores and Rocks—Comparison of Results. Minerals, 10(2), 129. https://doi.org/10.3390/min10020129