4.1. Prototype Pier
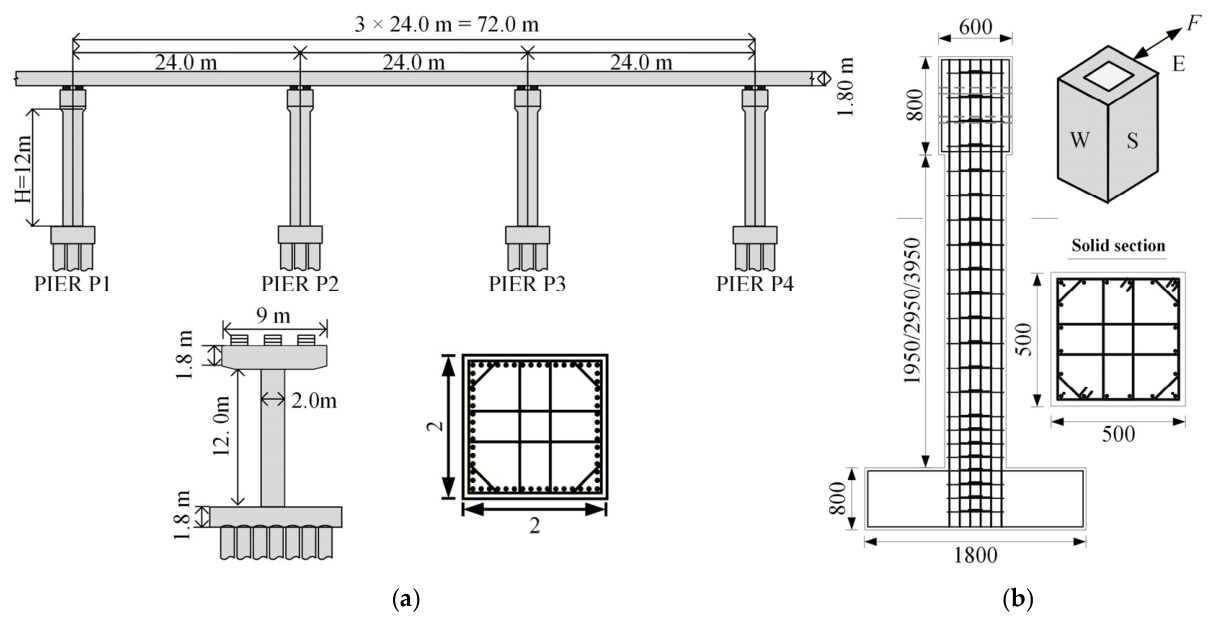
A full-scale analytical prototype model was established based on the prototype urban-rail viaduct from which the quarter-scale pier specimens described in
Section 3.1 were derived. The geometric dimensions, sectional properties, material parameters, mass distribution, and boundary conditions of the prototype bridge were adopted in the full-scale model. A three-dimensional finite-element model was first developed in SAP2000, and modal analysis was conducted to determine the global dynamic characteristics of the bridge. Subsequently, the Fiber and IMK models were established in OpenSees using consistent structural configurations and dynamic parameters. The SAP2000 model was employed as the reference model for evaluating the initial dynamic characteristics of the two OpenSees models.
The prototype deck, pier, and support arrangement is shown in
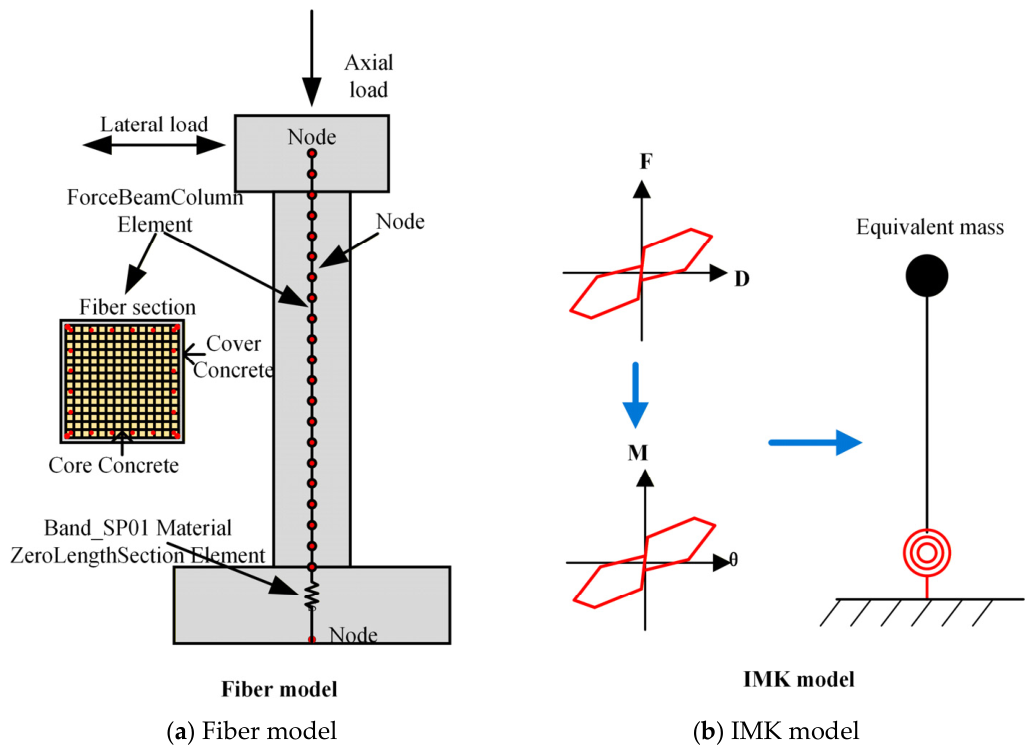
Figure 6a, while the adopted mass distribution and boundary conditions follow the prototype configuration. In the Fiber model, each 12 m pier shaft was discretized into 22 displacement-based nonlinear beam-column elements with three integration points per element. Confined concrete, cover concrete, and longitudinal reinforcement were represented by the sectional fibers described in
Section 2.3. The damping and P-Delta treatments are detailed in
Section 4.3 and
Section 4.2, respectively.
The first three natural periods obtained from the three numerical models are summarized in
Table 4. For the first mode, the natural periods predicted by the IMK, Fiber, and SAP2000 models were 1.274, 1.323, and 1.291 s, respectively. The mean fundamental period was 1.296 s, corresponding to a frequency of 0.772 Hz. Therefore, T1 = 1.296 s was adopted as the representative fundamental period for the subsequent ground-motion classification and seismic-response analyses.
For the second mode, the natural periods predicted by the three models were 0.817, 0.879, and 0.842 s, respectively, with a mean period of 0.846 s and a corresponding frequency of 1.182 Hz. This mode was characterized by the global transverse bending of the bridge. The third-mode periods obtained from the IMK, Fiber, and SAP2000 models were 0.536, 0.594, and 0.574 s, respectively. The resulting mean period and frequency were 0.568 s and 1.761 Hz, respectively. The third mode primarily involved deck torsion coupled with higher-order bending deformation of the piers. Modes 2 and 3 contributed negligibly to the longitudinal response, so the cumulative X-direction mass-participation ratio remained 79.27% throughout the third mode. It reached 91.32% when the first 11 modes were included.
Taking the SAP2000 periods as a reference, the relative differences in the first three periods predicted by the IMK model were 1.32%, 2.97%, and 6.62%, respectively, while those of the Fiber model were 2.48%, 4.39%, and 3.48%. The maximum difference was 6.62%. The three models therefore exhibited consistent periods, providing a common basis for the subsequent comparison of nonlinear response, computational efficiency, and fragility.
4.2. Quasi-Static Benchmarking and Identification of Full-Scale IMK Parameters
Following the comparison of the dynamic characteristics presented in
Section 4.1, reverse-cyclic analyses were conducted to identify the IMK parameters of the full-scale analytical pier and compare its quasi-static response. The Fiber model was generated from specimen A2 using a geometric scale factor of four while preserving material properties, reinforcement ratios, equivalent steel areas, and axial-load ratio. Its first-cycle force–displacement response was then used to identify the equivalent IMK backbone. Accordingly, the Fiber model is a calibration benchmark for the simplified representation at this level, not independent full-scale validation evidence.
The 12 m pier was obtained by geometric scaling while maintaining the material properties, reinforcement ratios, and axial-load ratio of specimen A2. Preserving these principal design ratios provides a reasonable basis for comparing the global flexural responses of the Fiber and IMK models. Nevertheless, possible size effects on bond slip, crack localization, confinement, and cyclic deterioration are not explicitly reproduced. Therefore, transferring the specimen-calibrated hysteretic assumptions to the 12 m pier should be regarded as an analytical modeling assumption.
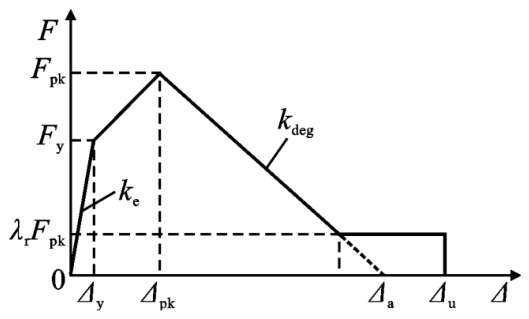
The IMK backbone parameters were extracted from the first-cycle envelope of the Fiber response using the procedure described in
Section 2.2. The positive and negative yield points were (120 mm, 3685.46 kN) and (−120 mm, −3704.72 kN), and the corresponding peak points were (300 mm, 4040.49 kN) and (−300 mm, −4024.58 kN). Linear extrapolation of the post-peak branches gave zero-strength displacement intercepts of 1845.59 and 1723.79 mm. The resulting parameters are summarized in
Table 5.
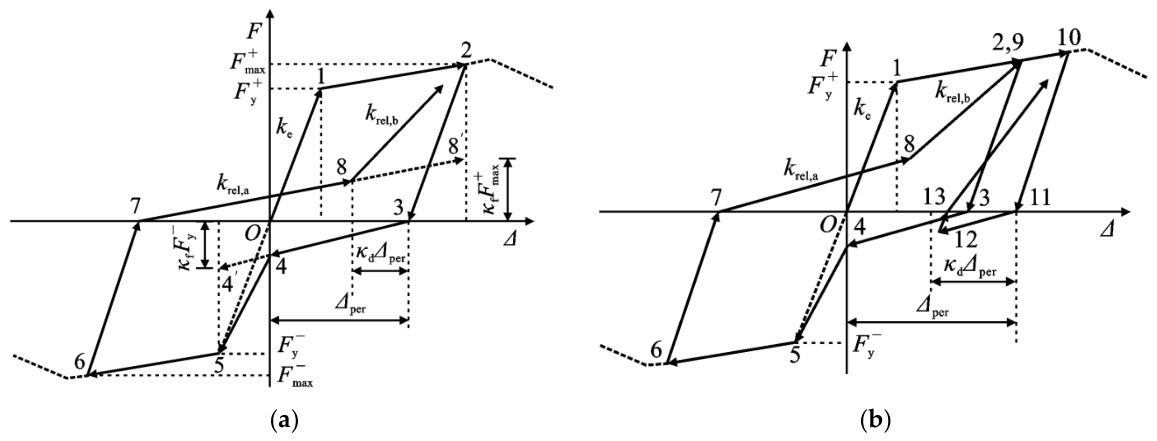
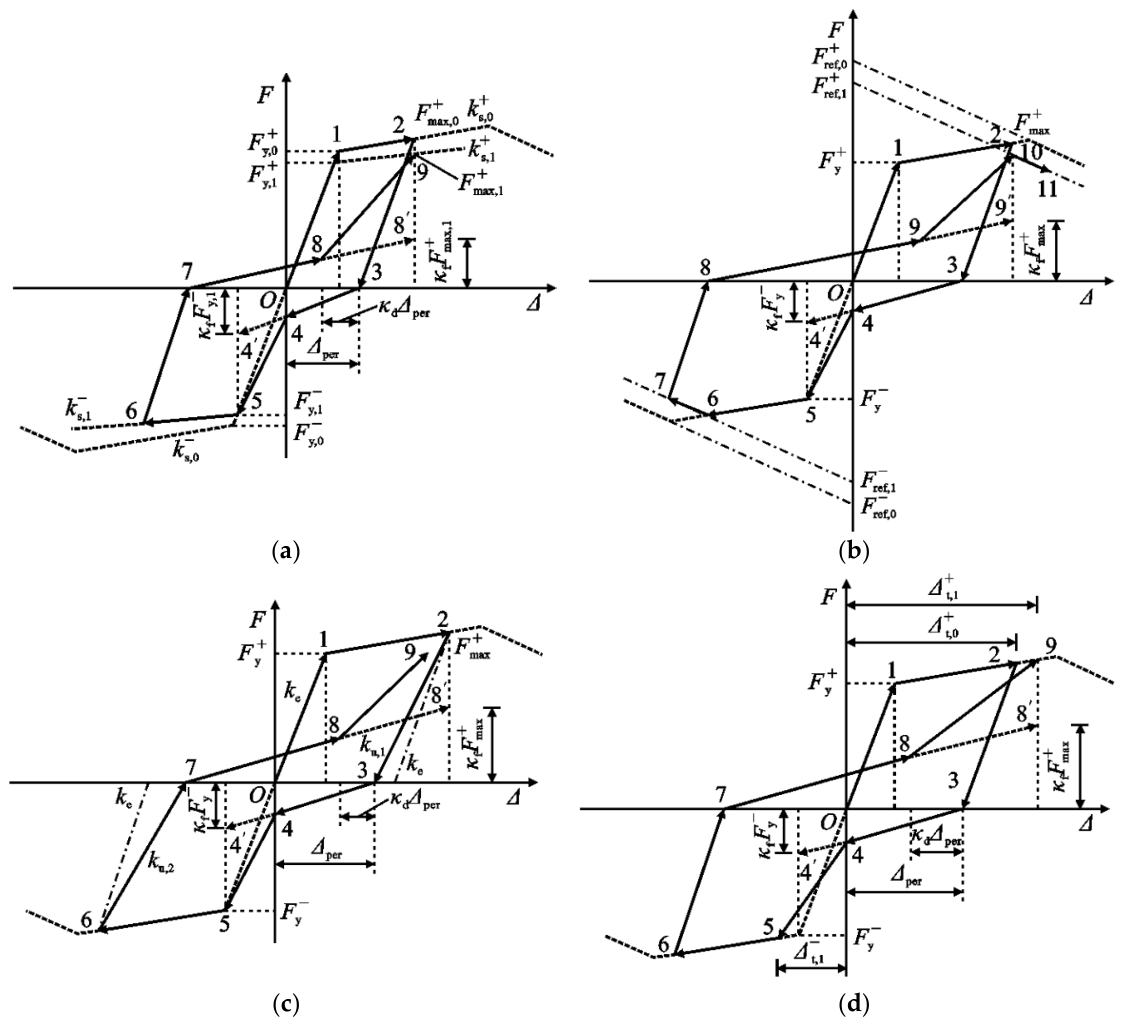
The full-scale IMK model retained the cyclic parameters calibrated for specimen A2: ΛS = ΛC = 500; ΛA = 271; ΛK = 72; cS = cC = cA = 1.0; cK = 0.60; D+ = D− = 1.0; κF = 0.72; and κD = 0.60.
In the Fiber model, P–Δ effects were explicitly included through the OpenSees PDelta transformation under a constant 12.8 MN axial load. The extracted first-cycle backbone therefore incorporated the resulting reduction in lateral restoring force. The equivalent IMK model used a linear transformation without an additional geometric stiffness contribution, so P–Δ was represented once through the calibrated envelope and was neither omitted nor double-counted. This fixed envelope was retained in the dynamic and IDA analyses. However, it cannot update P–Δ effects under variable axial force, bidirectional interaction, or responses outside the calibration domain, for which explicit geometric nonlinearity is required.
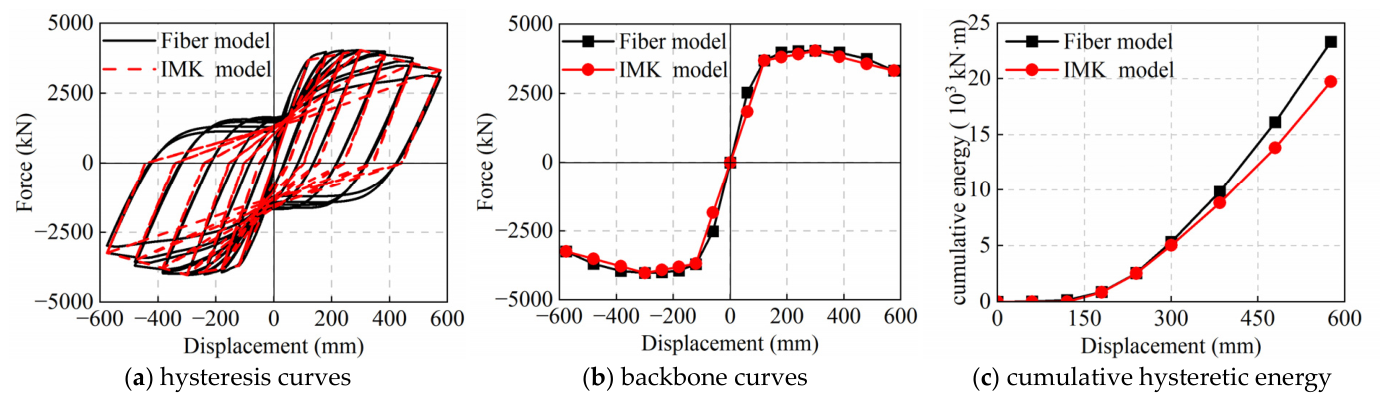
Figure 12 compares the quasi-static responses.
As shown in
Figure 12a, both models reproduce the principal response stages of the full-scale pier, including the transition from the pre-yield response to strain hardening, the attainment of the peak lateral strength, and the subsequent post-peak strength degradation. The maximum lateral strengths of both models occur at a pier-top displacement of approximately 300 mm. The overall hysteresis-loop shapes and force-development trends predicted by the IMK model are consistent with those obtained from the Fiber model, indicating that the simplified concentrated-plasticity model adequately represents the global nonlinear response of the full-scale pier.
The first-cycle backbone curves are compared in
Figure 12b. For displacement levels from 120 to 576 mm, the mean absolute percentage difference between the bidirectional mean peak forces predicted by the two models is 2.24%. The yield, peak, and terminal points were used directly in identification; therefore, the 180, 240, 384, and 480 mm points assess interpolation between calibration controls, not independent full-scale prediction. At these four intermediate levels, the mean absolute percentage difference is 3.83%. At 300 mm, the bidirectional mean peak forces predicted by the Fiber and IMK models are 4032.53 and 4032.12 kN, respectively, a difference of 0.01%. These values quantify internal consistency with the Fiber calibration benchmark.
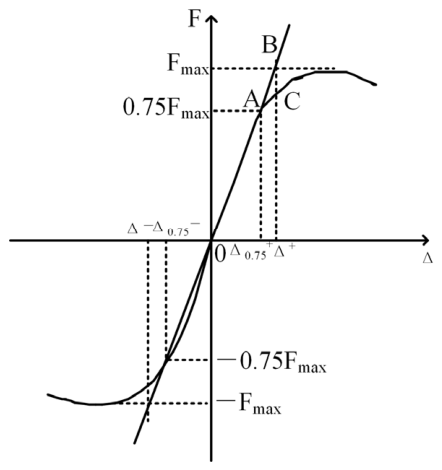
A relatively large difference occurs at the 60 mm loading level. The bidirectional mean peak forces obtained from the Fiber and IMK models are 2526.74 and 1842.70 kN, respectively, and the IMK model underestimates the Fiber-model result by 27.07%. This difference is mainly associated with the representation of the pre-yield response using a single equivalent secant stiffness. Such an idealization cannot simultaneously reproduce the relatively high initial tangent stiffness and the gradual pre-yield stiffness variation predicted by the distributed-plasticity Fiber model. Nevertheless, this discrepancy occurs within the nominally elastic response range and contributes only slightly to the total hysteretic energy.
Differences are also observed in the repeated-cycle response at large displacement amplitudes. At 576 mm, the ratio of the second-cycle to first-cycle mean peak force is 92.19% for the Fiber model, whereas it remains approximately 100% for the IMK model. Therefore, although the IMK model closely reproduces the overall strength envelope, it underestimates the within-amplitude cyclic strength deterioration predicted by the Fiber model.
The cumulative hysteretic-energy responses of the two models are compared in
Figure 12c. The horizontal coordinate represents the imposed displacement amplitude, and each point denotes the cumulative energy after completion of the two loading cycles at the corresponding displacement level. As shown in
Figure 12c, the cumulative hysteretic energy predicted by both models increases continuously with the displacement amplitude. Before yielding, the energy dissipated by the Fiber model is limited, whereas the IMK model exhibits almost no hysteretic energy because its response remains essentially linear elastic and its hysteresis loops have negligible enclosed areas.
After the displacement amplitude reaches 180 mm, the cumulative energies predicted by both models increase rapidly. At displacement amplitudes of 180 and 240 mm, the Fiber model gives cumulative energies of 895.13 and 2559.47 kN·m, respectively, while the corresponding IMK-model results are 863.53 and 2524.63 kN·m. The associated differences are only 3.53% and 1.36%, indicating close agreement during the initial inelastic response.
With increasing displacement amplitude, the difference between the two curves gradually increases. At 300, 384, and 480 mm, the IMK model underestimates the Fiber model’s cumulative energy by 6.08%, 10.26%, and 14.35%, respectively. At the maximum displacement amplitude of 576 mm, the cumulative hysteretic energies obtained from the Fiber and IMK models are 23,328.92 and 19,738.63 kN·m, respectively. Therefore, the IMK model reproduces 84.61% of the cumulative energy predicted by the Fiber model, corresponding to an underestimation of 15.39%.
The increasing energy difference at large displacement amplitudes is associated with the smaller enclosed areas of the IMK model’s loops and its limited reproduction of the repeated-cycle strength deterioration predicted by the Fiber model. The two models nevertheless show consistent cumulative-energy trends within this controlled comparison. Because the IMK backbone was identified from the same Fiber benchmark, the agreement supports subsequent comparative analyses but should not be interpreted as independent full-scale validation. Independent full-scale experimental evidence or a separately developed analytical benchmark would be required for that purpose.
4.3. Dynamic Response and Computational Efficiency
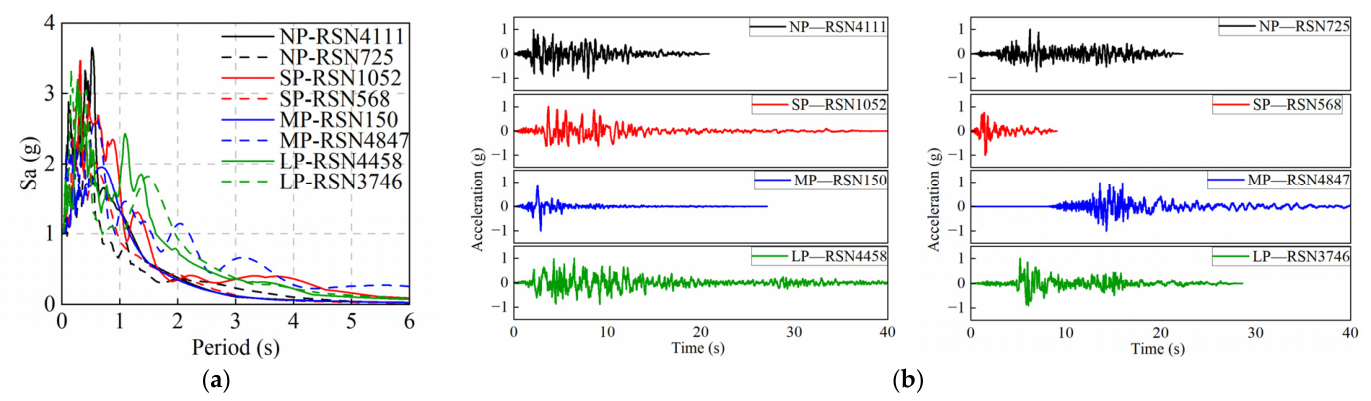
Eight representative ground motions were selected to compare the nonlinear dynamic responses predicted by the Fiber and IMK models. The set comprised two motions from each of the NP, SP, MP, and LP groups. Their principal characteristics are summarized in
Table 6.
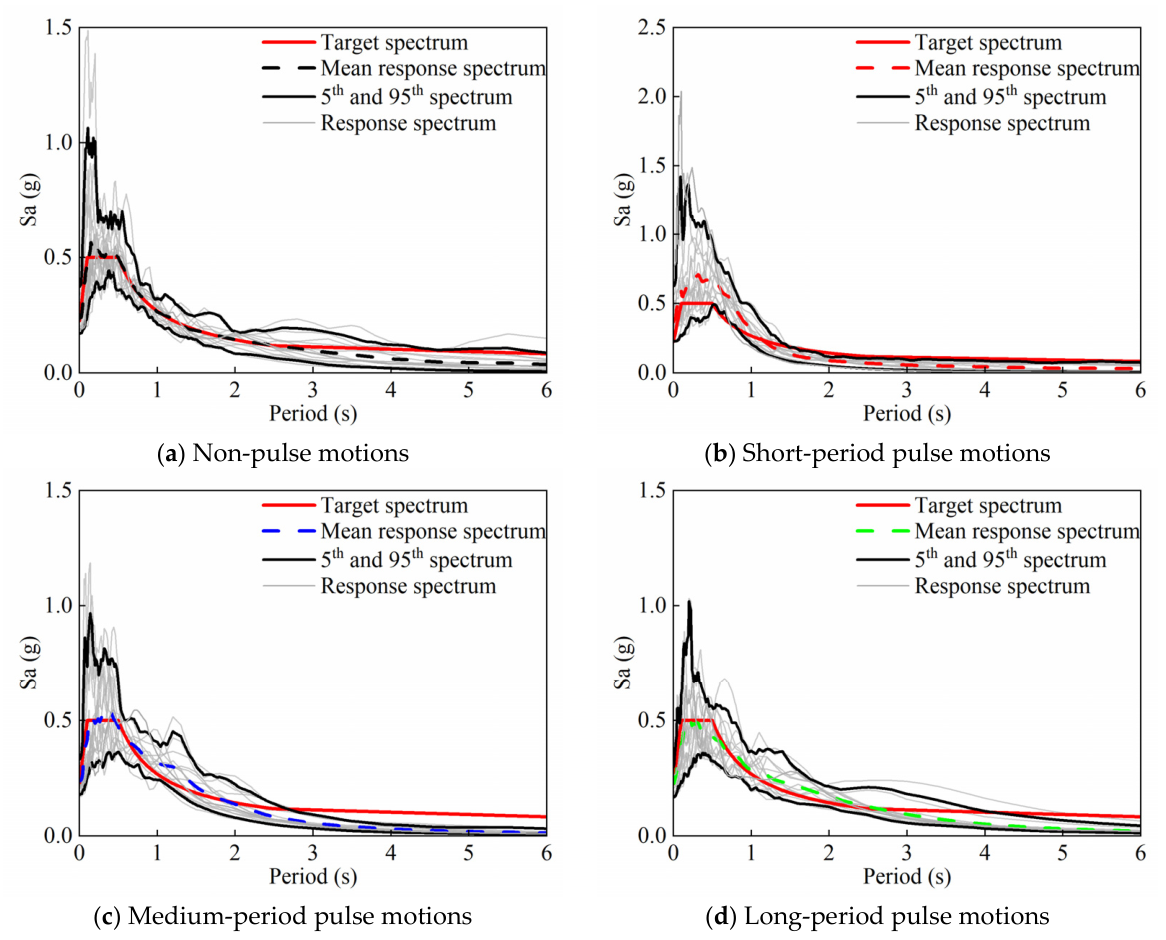
The selected records were scaled to PGA = 1.0 g before being applied to the two numerical models. The corresponding 5% damped acceleration response spectra and acceleration time histories are presented in
Figure 13. A 5% damping ratio was assigned through mass-proportional Rayleigh damping calibrated at the fundamental period T
1 = 1.296 s; no stiffness-proportional damping term was used. For this formulation,
and ξ
n =
. Accordingly, the implied damping ratios of the first three reported modes were 5.00%, 3.26%, and 2.19%, respectively, rather than a uniform 5%. The mass-only formulation avoids stiffness-proportional forces evaluated from a changing tangent stiffness and was applied identically to the Fiber and IMK models.
To examine the sensitivity to the damping implementation at the calibrated mode, supplementary response-history analyses were conducted for the eight representative ground motions at PGA = 1.0 g using a one-mode-compatible 5% modal-damping formulation, while all other modeling and analysis settings were kept unchanged. Relative to the baseline mass-proportional formulation, the mean absolute differences in peak pier-top displacement were 5.13 × 10⁻⁷% and 5.01 × 10⁻¹⁰% for the Fiber and IMK models, respectively, and the corresponding maximum differences were 1.92 × 10⁻⁶% and 1.84 × 10⁻⁹%. For peak base shear, the mean absolute differences were 2.12 × 10⁻¹¹% and 3.59 × 10⁻⁹%, with maximum differences of 1.04 × 10⁻¹⁰% and 7.19 × 10⁻⁹%, respectively. No systematic model- or ground-motion-group-dependent change was observed. The differences are at the level of numerical round-off, indicating that the principal Fiber–IMK response comparison is insensitive to these two one-mode-compatible damping implementations for the selected records and response quantities. This targeted check does not establish equivalence for alternative multi-mode damping targets or systems with stronger higher-mode participation.
To ensure a consistent comparison, the Fiber and IMK models were subjected to identical ground-motion inputs, gravity loads, damping assumptions, analysis durations, and numerical settings. The same local OpenSees executable was used for both models, while MATLAB R2024a was employed to manage the batch analyses and process the numerical results. All simulations were conducted serially using one worker on the same 64-bit Windows computer equipped with an Intel Core Ultra 7 265K processor operating at 3.90 GHz and 32.0 GB of RAM. The external wall-clock time was recorded for each analysis to evaluate computational efficiency.
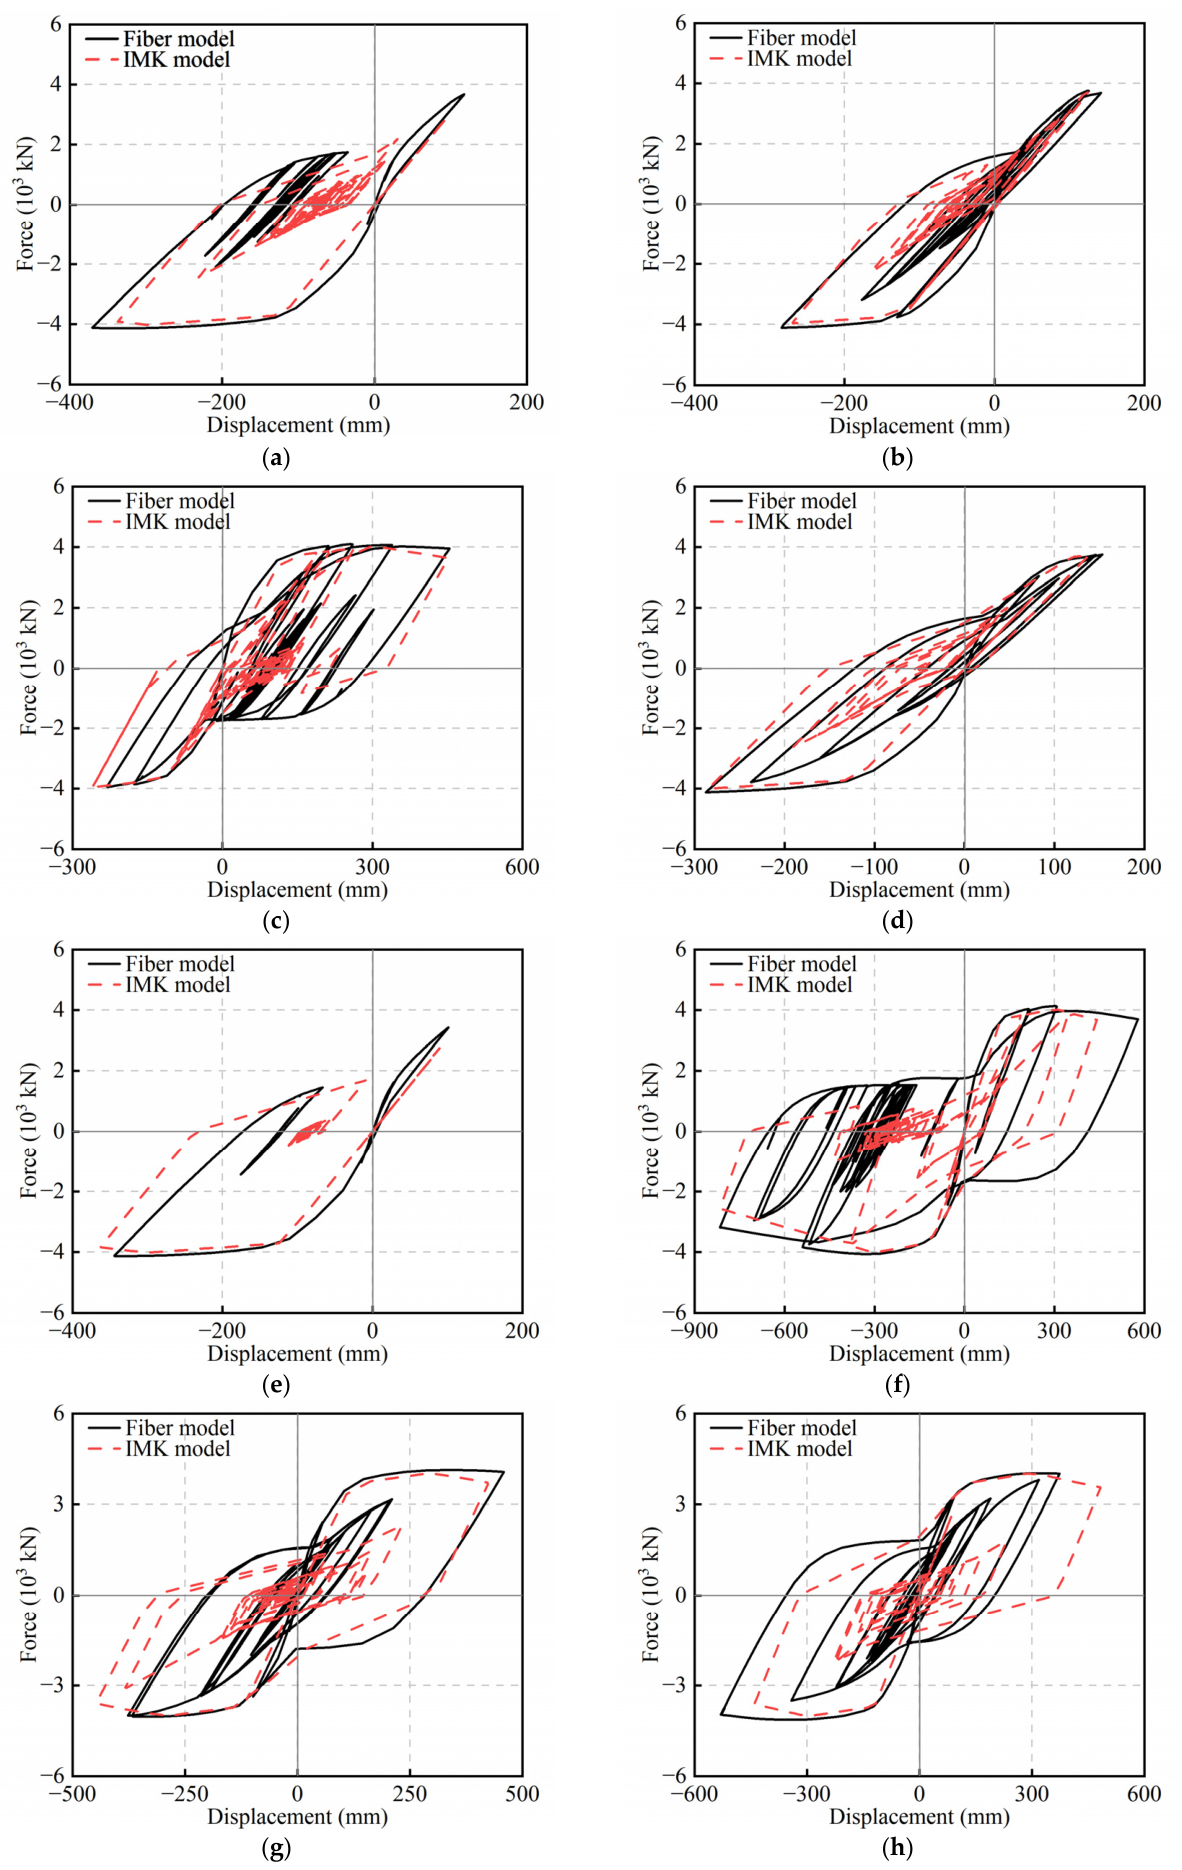
Figure 14 compares the base-shear versus pier-top-displacement hysteretic responses. The IMK model reproduced the global envelope and peak resistance of the Fiber model. The relative differences in peak base shear for the eight records ranged from 1.62% to 3.56%, with a mean of 2.64%.
For RSN568, the peak base shears predicted by the Fiber and IMK models were 4122.9 and 3996.2 kN, respectively, corresponding to a relative difference of 3.07%. The hysteretic energies obtained by integrating the force–displacement responses were approximately and , respectively. Thus, the IMK model underestimated the hysteretic energy under RSN568 by approximately 15.0%. This result indicates that the simplified model reproduced the peak resistance more accurately than the detailed area enclosed by the hysteretic loops.
For the records producing substantial inelastic deformation, the IMK model captured the principal force plateau and overall deformation range. This agreement was particularly evident for MP-RSN4847 and the two LP records. Differences remained in the unloading and reloading branches and in the areas enclosed by the internal hysteretic loops. The Fiber model explicitly represented the distributed cyclic responses of the concrete and reinforcement fibers along the pier. By contrast, the IMK model condensed these effects into a calibrated rotational spring at the pier base. Consequently, the simplified model reproduced the global response envelope more accurately than the detailed evolution of individual hysteretic cycles.
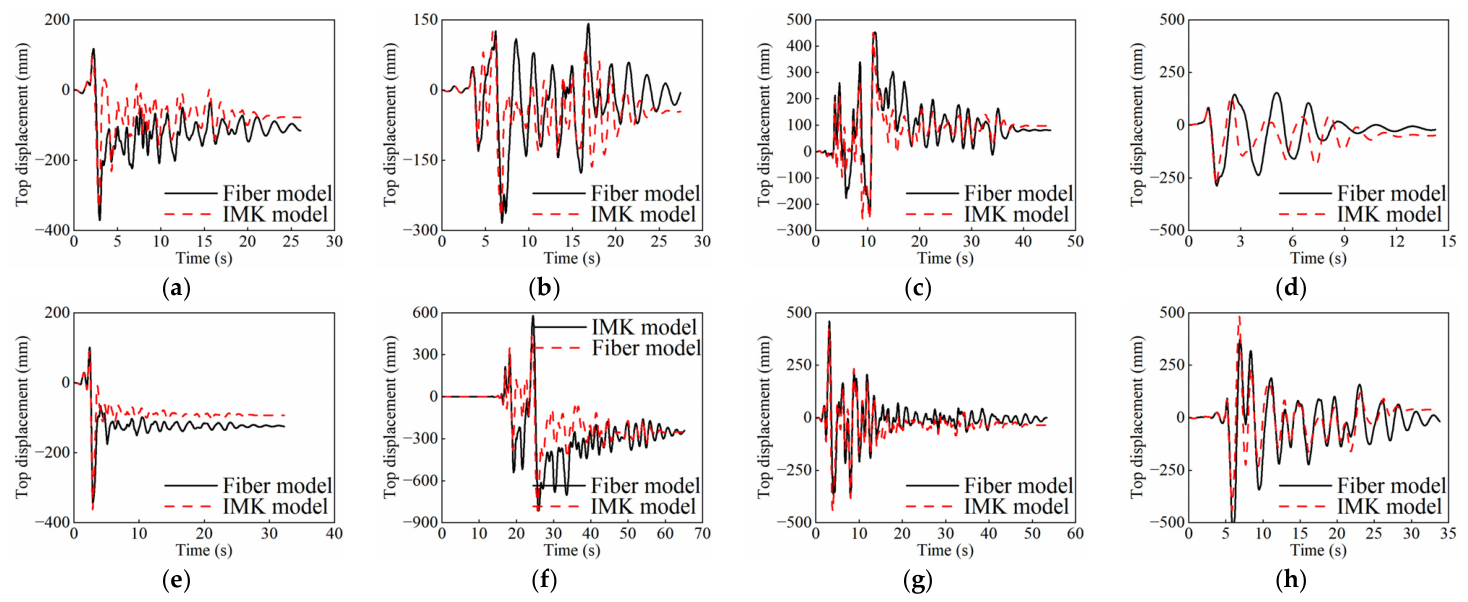
The corresponding pier-top displacement histories are presented in
Figure 15. The maximum absolute pier-top displacement was defined as
The relative error in the peak displacement predicted by the IMK model was calculated as
As summarized in
Table 7, the peak-displacement errors ranged from 0.03% to 9.07%, with a mean value of 4.15%. The mean errors for the NP, SP, MP, and LP records were 7.19%, 0.97%, 2.63%, and 5.82%, respectively. The IMK model predicted lower peak displacements for seven of the eight records, resulting in an overall signed bias of −2.85%. MP-RSN150 was the only record for which the IMK model predicted a higher peak displacement than the Fiber model, with an overestimation of 5.23%.
Among the selected ground motions, MP-RSN4847 generated the greatest displacement demand. The Fiber and IMK models predicted maximum pier-top displacements of 814.7 and 814.4 mm, respectively, with a relative error of 0.03%. This large response coincided with a pulse period close to the fundamental bridge period, but it cannot be attributed to period proximity alone because the selected records also differ in spectral amplitude, velocity content, duration, and other characteristics. The record dependence is evident from the two SP motions, which produced Fiber-model peak displacements of 453.9 and 287.8 mm despite sharing the same pulse-period category.
For RSN568, the maximum pier-top displacements predicted by the Fiber and IMK models were 287.8 and 284.1 mm, respectively, corresponding to a relative error of 1.29%. However, the residual displacements predicted by the two models were −22.47 and −49.77 mm, respectively. Therefore, close agreement in peak displacement did not necessarily indicate identical response phases, oscillation amplitudes, or residual deformations.
Agreement between the complete displacement histories was more variable than agreement between their peak values. The active-response correlation coefficients ranged from 0.346 to 0.918, with a mean value of 0.730. The normalized root-mean-square errors ranged from 9.52% to 32.58%, while the differences between the occurrence times of the peak responses ranged from 0.05 to 0.80 s. RSN568 had a peak-displacement error of only 1.29%, but its displacement-history correlation coefficient was 0.346. This comparison further demonstrates that accurate prediction of the maximum seismic demand does not necessarily imply that the complete nonlinear response history is reproduced with the same level of accuracy.
The computational efficiency of the two models was evaluated using external wall-clock time. The speed-up factor was calculated as the ratio of the Fiber-model time to the corresponding IMK-model time, using the definition given in Equation (48).
As shown in
Table 7, the Fiber analyses required between 9.913 and 31.164 s per record, whereas the IMK analyses required only 0.741–1.208 s. The accumulated wall-clock times for the eight records were 164.356 s for the Fiber model and 7.584 s for the IMK model. The resulting overall speed-up factor was 21.67, corresponding to a 95.39% reduction in computational time. The group-level speed-up factors were 12.69, 17.07, 24.14, and 36.50 for the NP, SP, MP, and LP records, respectively. The larger speed-up factors obtained for the MP and LP records were mainly associated with the increased runtimes of the Fiber model, whereas the runtimes of the IMK model remained close to 1 s.
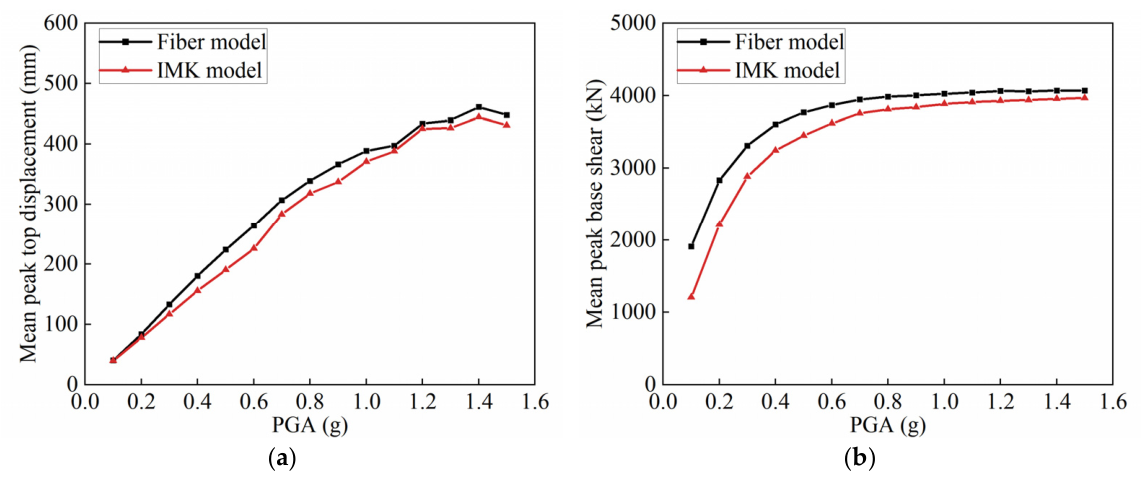
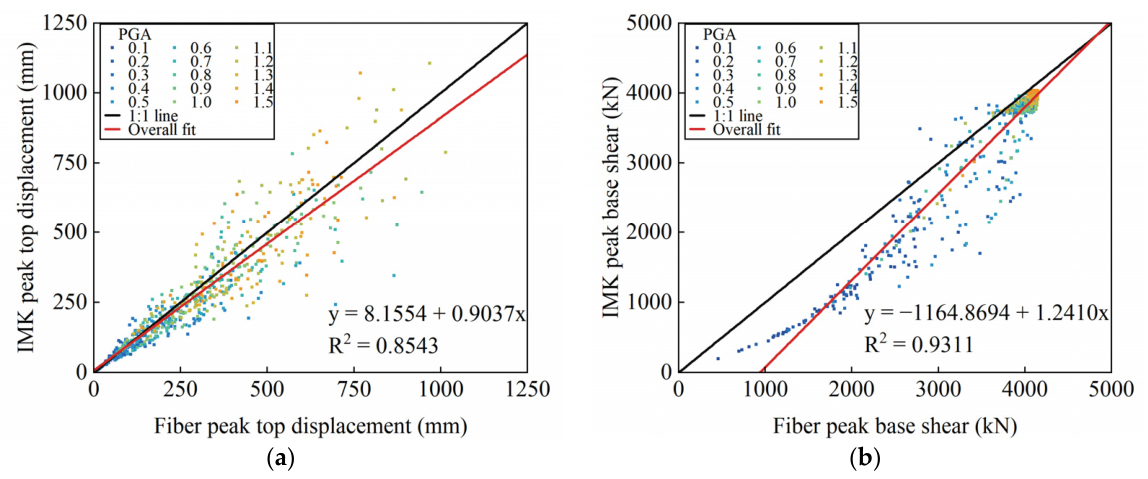
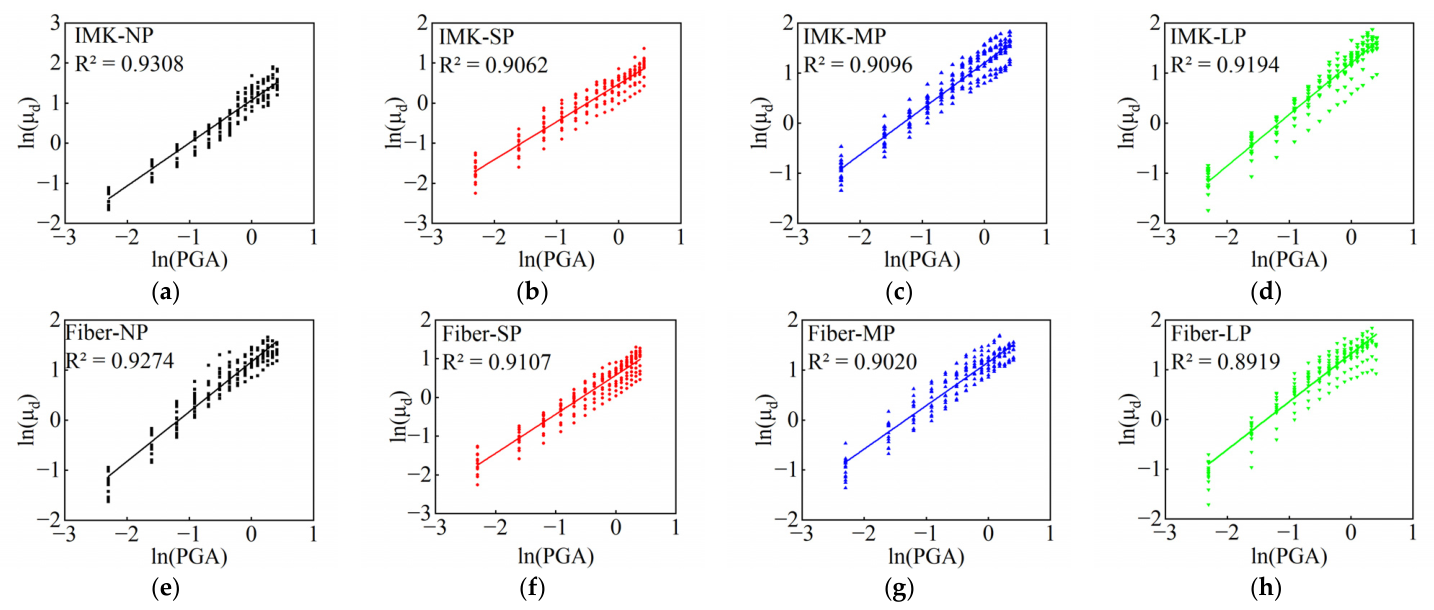
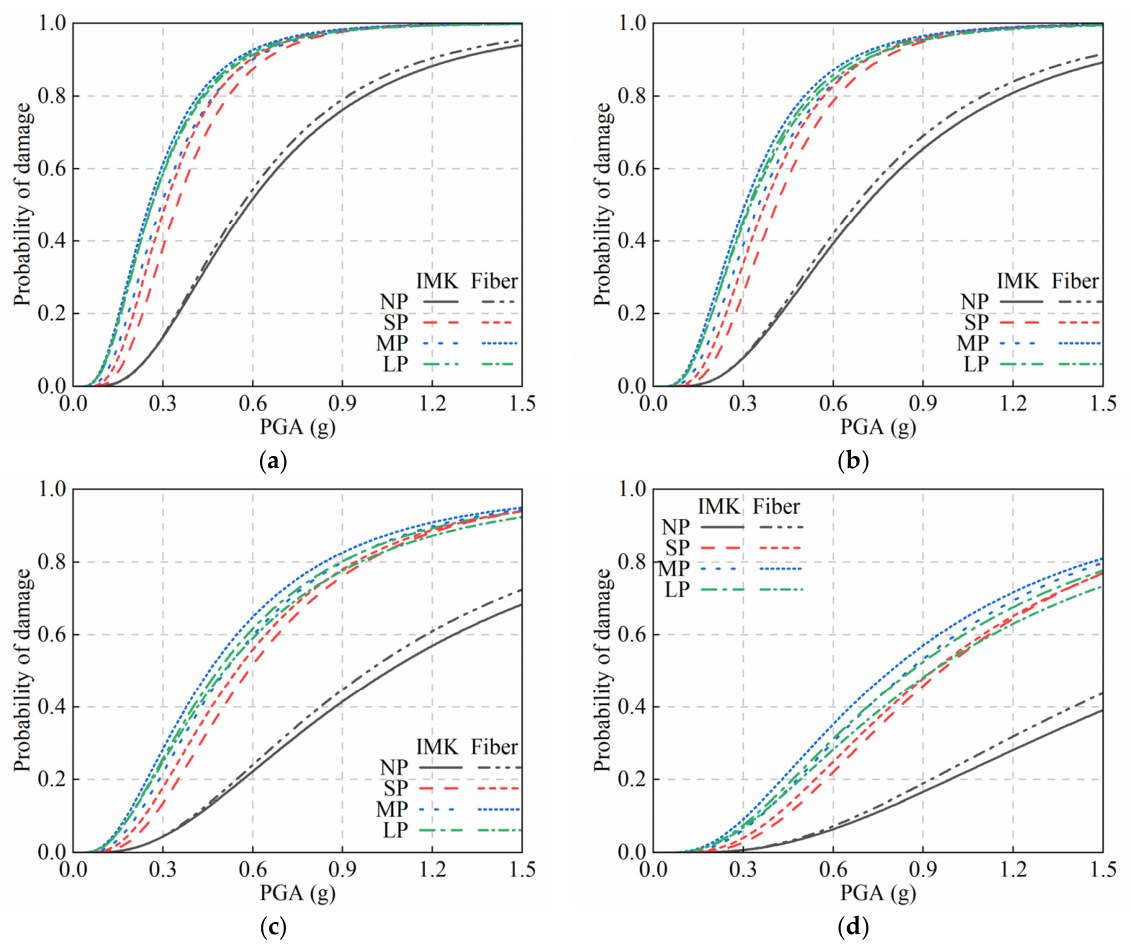
Overall, the IMK model reproduced the principal hysteretic envelope and peak pier-top displacement at a substantially lower computational cost. Its main discrepancies occurred in the unloading and reloading branches and in the detailed evolution of the displacement histories. The simplified model is therefore suitable for large-sample seismic demand and fragility analyses governed by global displacement response. The Fiber model remains preferable when distributed material behavior and detailed cyclic response are required. The eight records examined in this section provide representative response comparisons, while record-set-level errors are further evaluated using the complete IDA results in
Section 5.




 ,
,