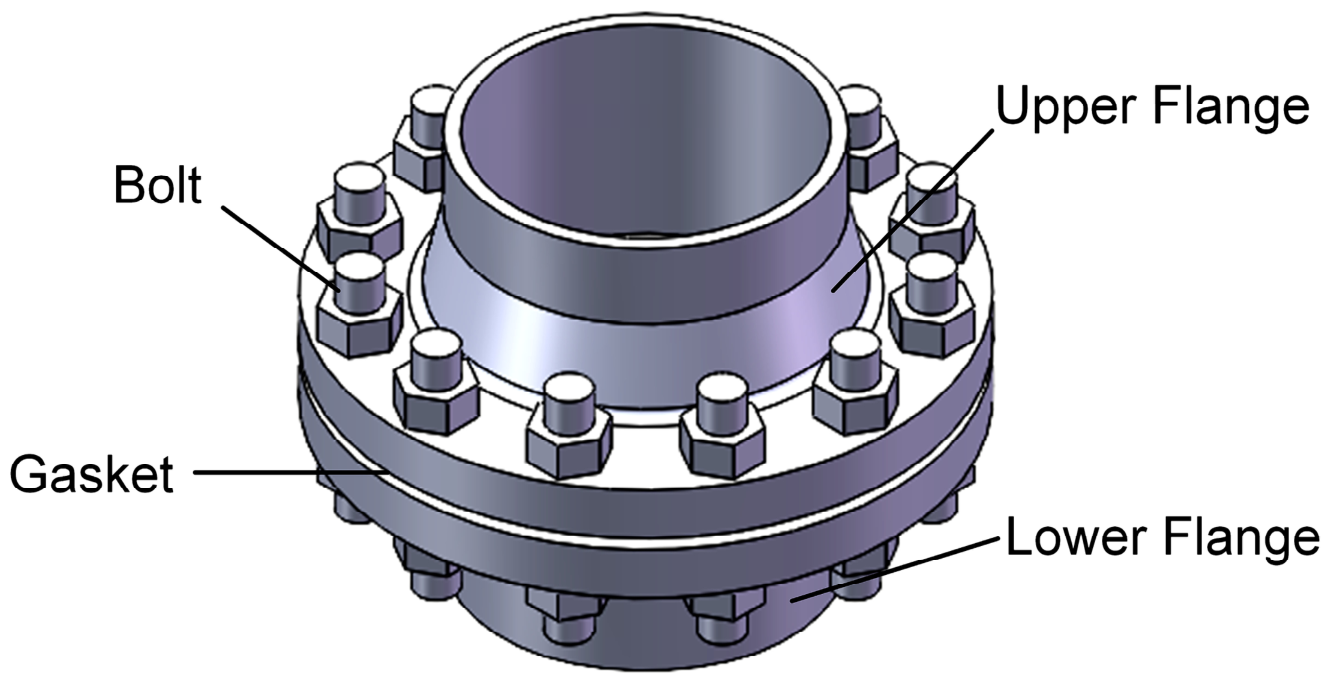
Figure 1.
Three-dimensional assembly model of the flange–bolt–gasket system.
Figure 1.
Three-dimensional assembly model of the flange–bolt–gasket system.
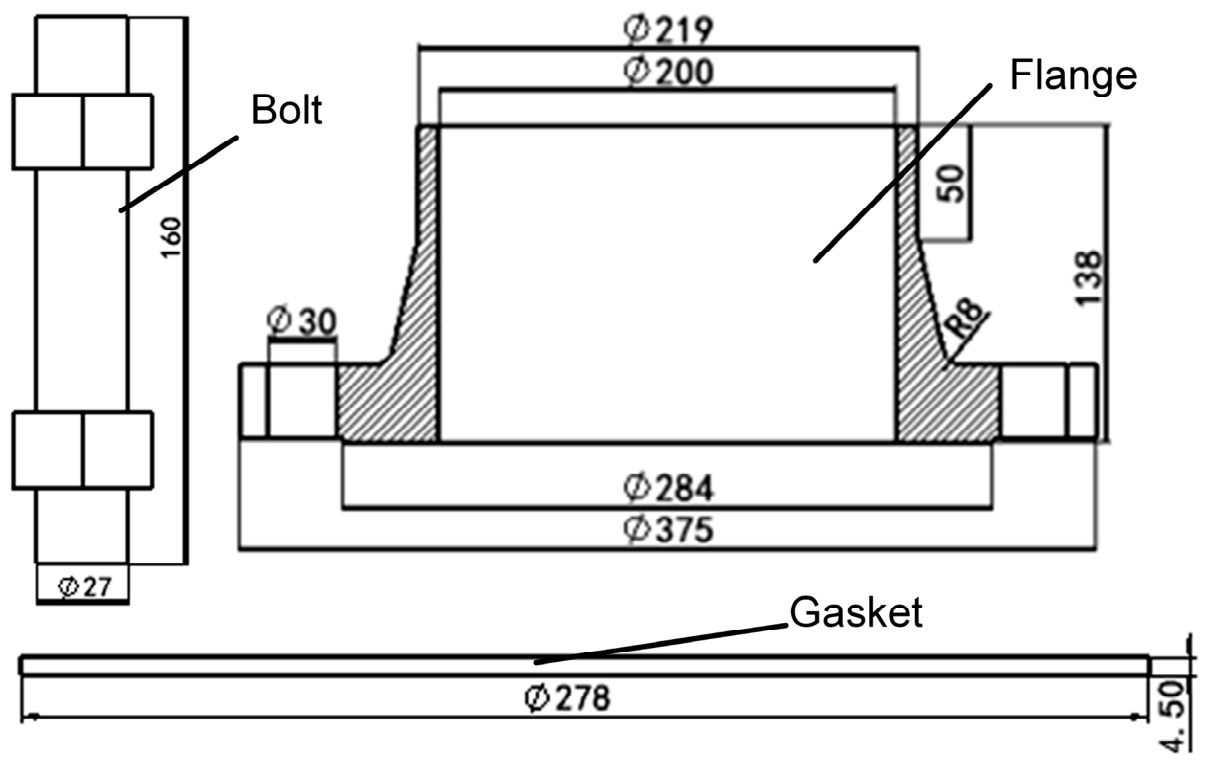
Figure 2.
Annotated geometry of the flange–bolt–gasket system (unit: mm).
Figure 2.
Annotated geometry of the flange–bolt–gasket system (unit: mm).
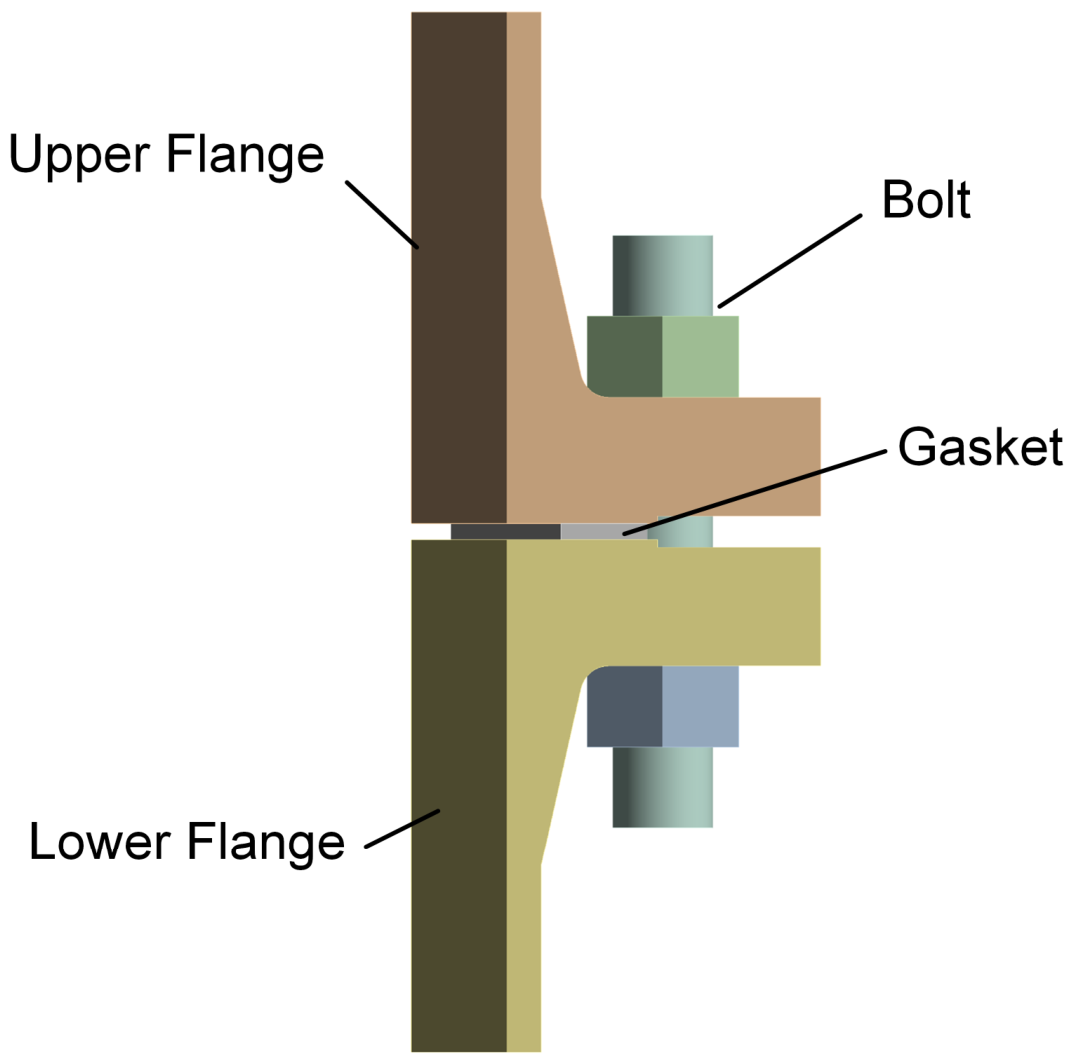
Figure 3.
1/12 periodic sector finite element geometry model.
Figure 3.
1/12 periodic sector finite element geometry model.
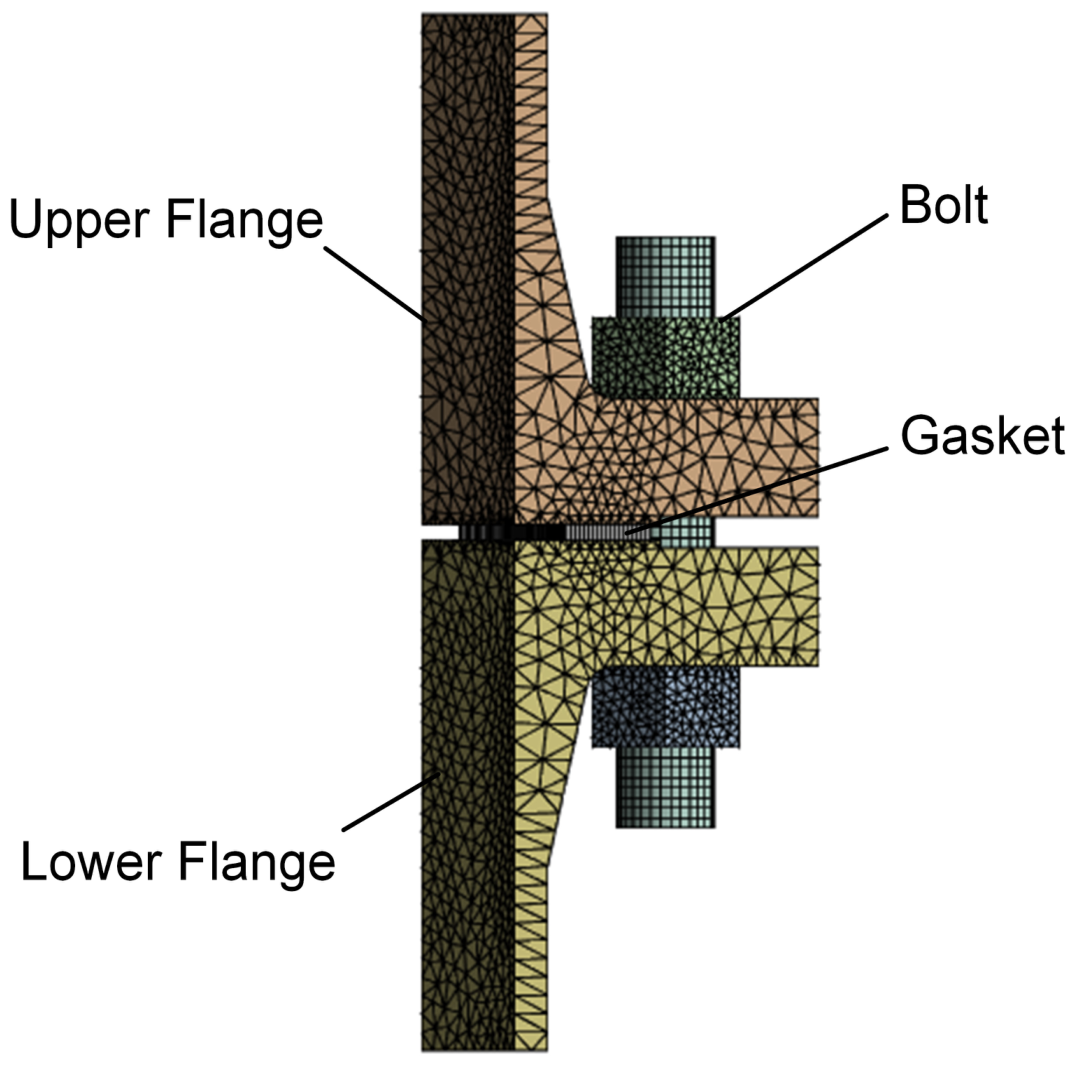
Figure 4.
Finite element mesh of the 1/12 sector.
Figure 4.
Finite element mesh of the 1/12 sector.
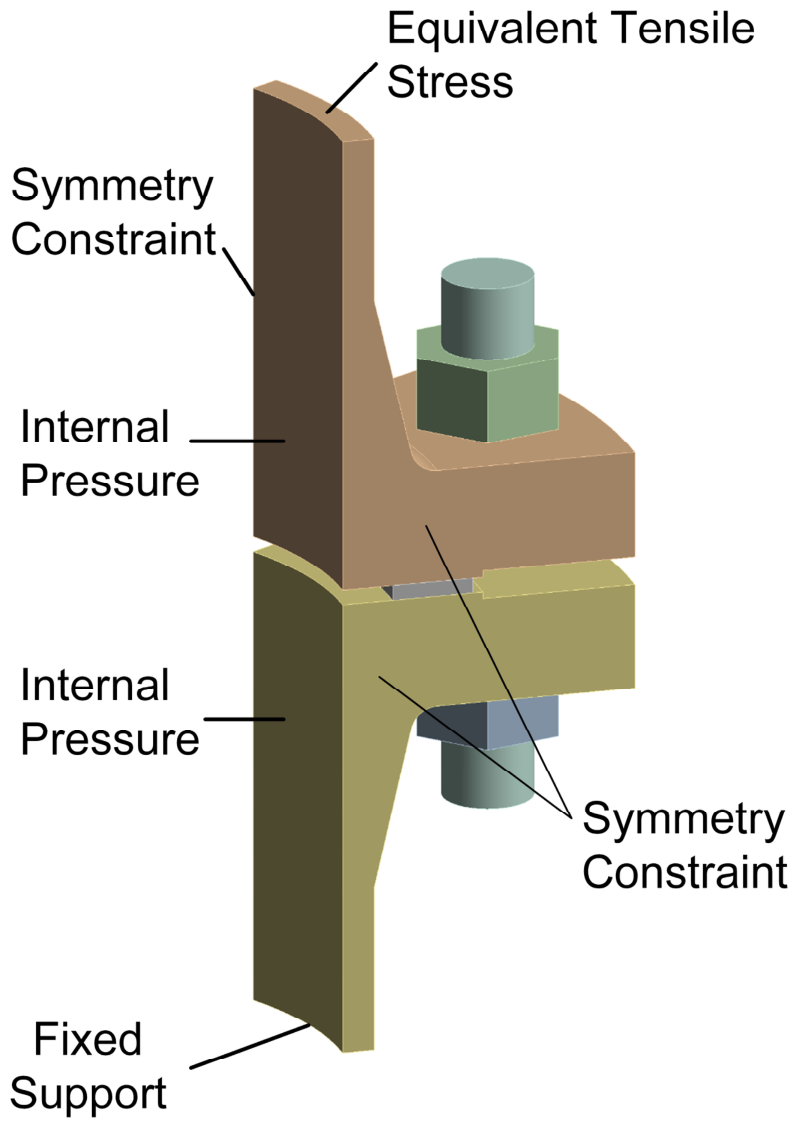
Figure 5.
Schematic of the boundary conditions for the 1/12 model.
Figure 5.
Schematic of the boundary conditions for the 1/12 model.
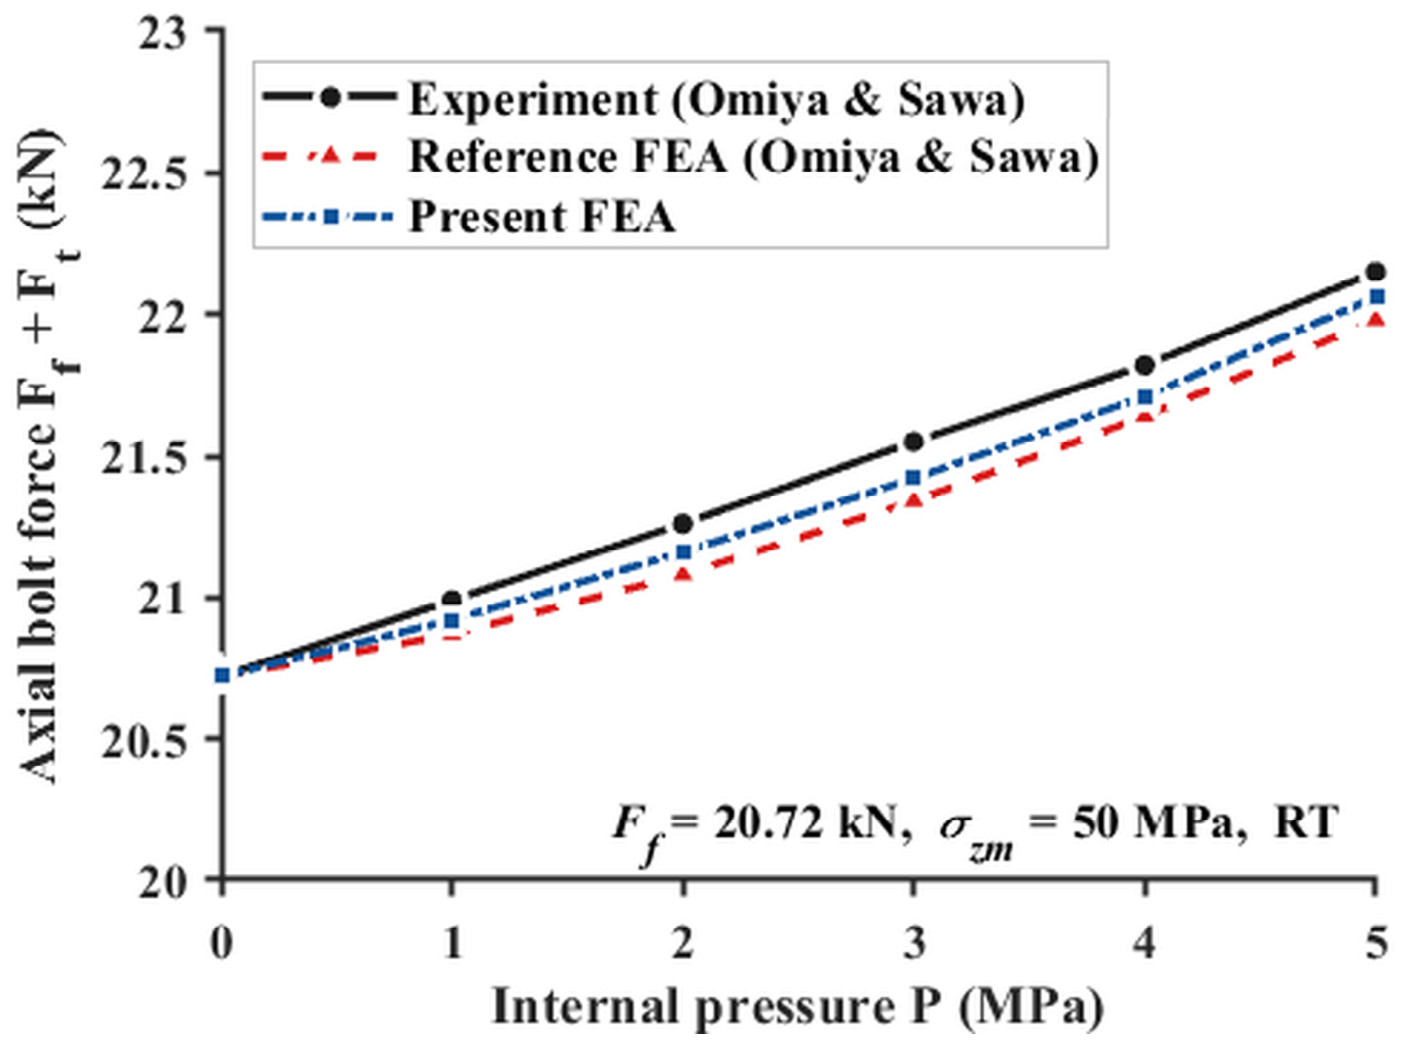
Figure 6.
Comparison of bolt load versus internal pressure P (3-inch flange, ambient temperature).
Figure 6.
Comparison of bolt load versus internal pressure P (3-inch flange, ambient temperature).
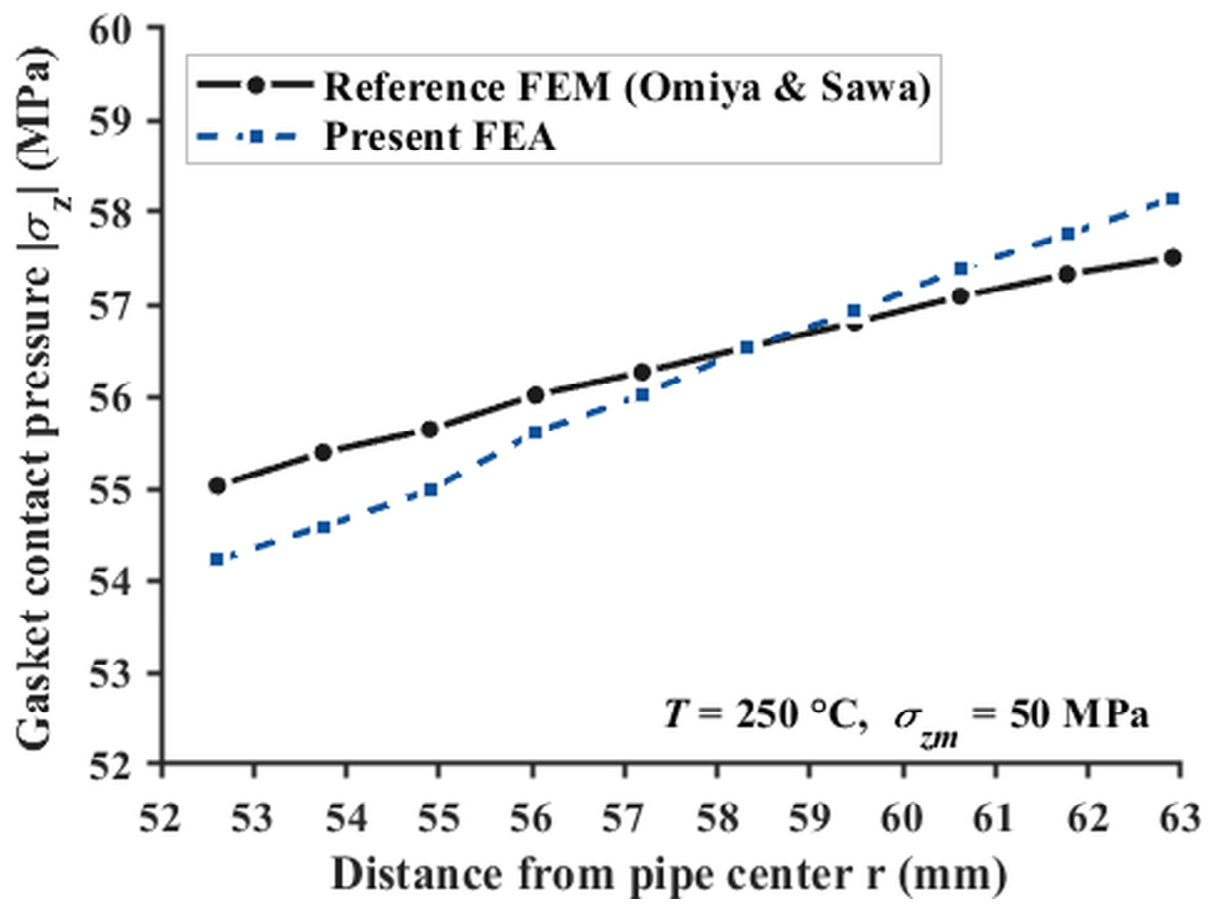
Figure 7.
Comparison of radial gasket contact pressure distribution at 250 °C.
Figure 7.
Comparison of radial gasket contact pressure distribution at 250 °C.
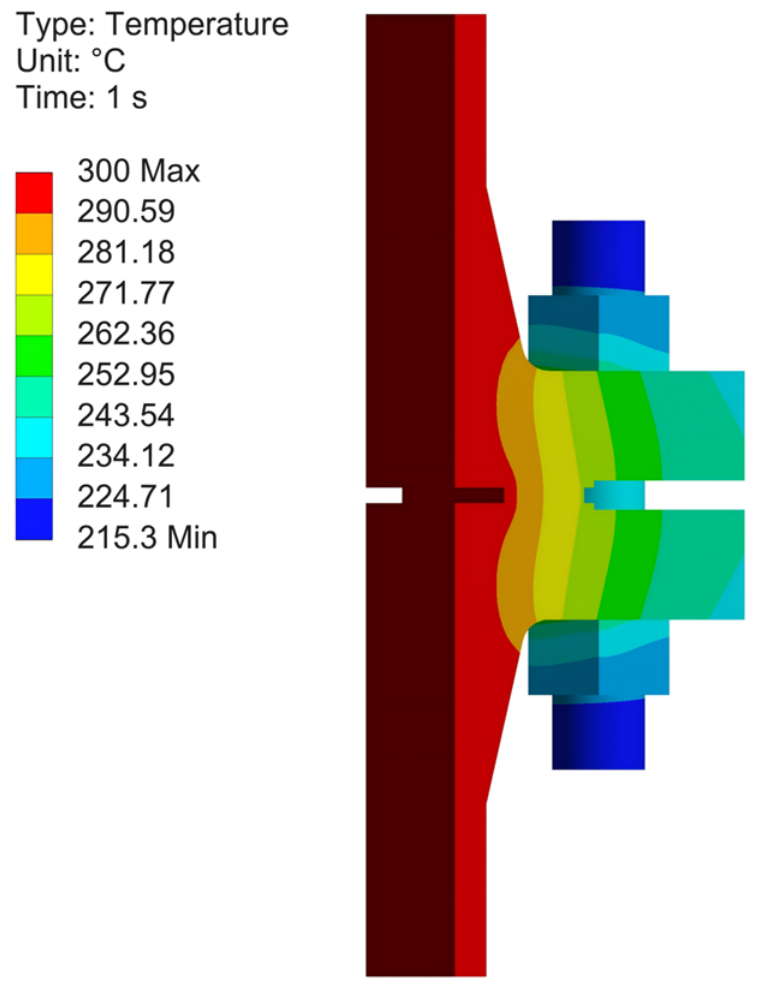
Figure 8.
Steady-state temperature field distribution of the flange–bolt system.
Figure 8.
Steady-state temperature field distribution of the flange–bolt system.
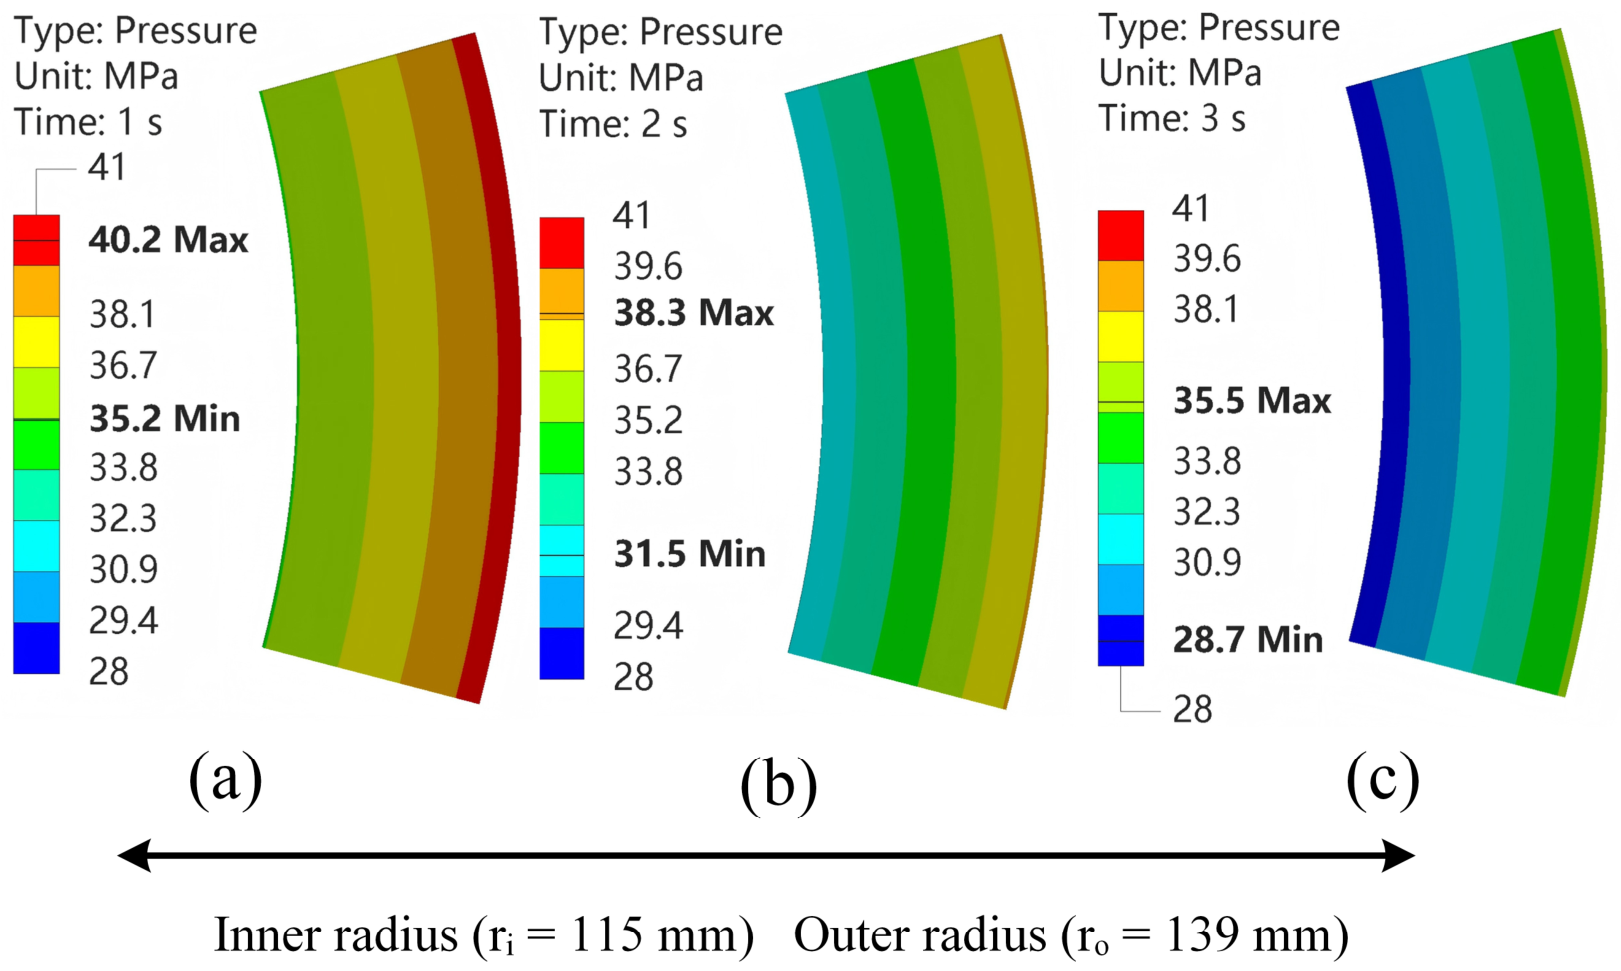
Figure 9.
Evolution of gasket contact pressure distribution across the three loading steps, plotted under a common color scale of 28–41 MPa: (a) Step 1, bolt pretensioning; (b) Step 2, internal pressure application; (c) Step 3, high-temperature operation. In each panel, the left edge corresponds to the gasket inner radius (ri = 115 mm) and the right edge to the outer radius (ro = 139 mm); the radial direction is indicated by the arrow below the panels.
Figure 9.
Evolution of gasket contact pressure distribution across the three loading steps, plotted under a common color scale of 28–41 MPa: (a) Step 1, bolt pretensioning; (b) Step 2, internal pressure application; (c) Step 3, high-temperature operation. In each panel, the left edge corresponds to the gasket inner radius (ri = 115 mm) and the right edge to the outer radius (ro = 139 mm); the radial direction is indicated by the arrow below the panels.
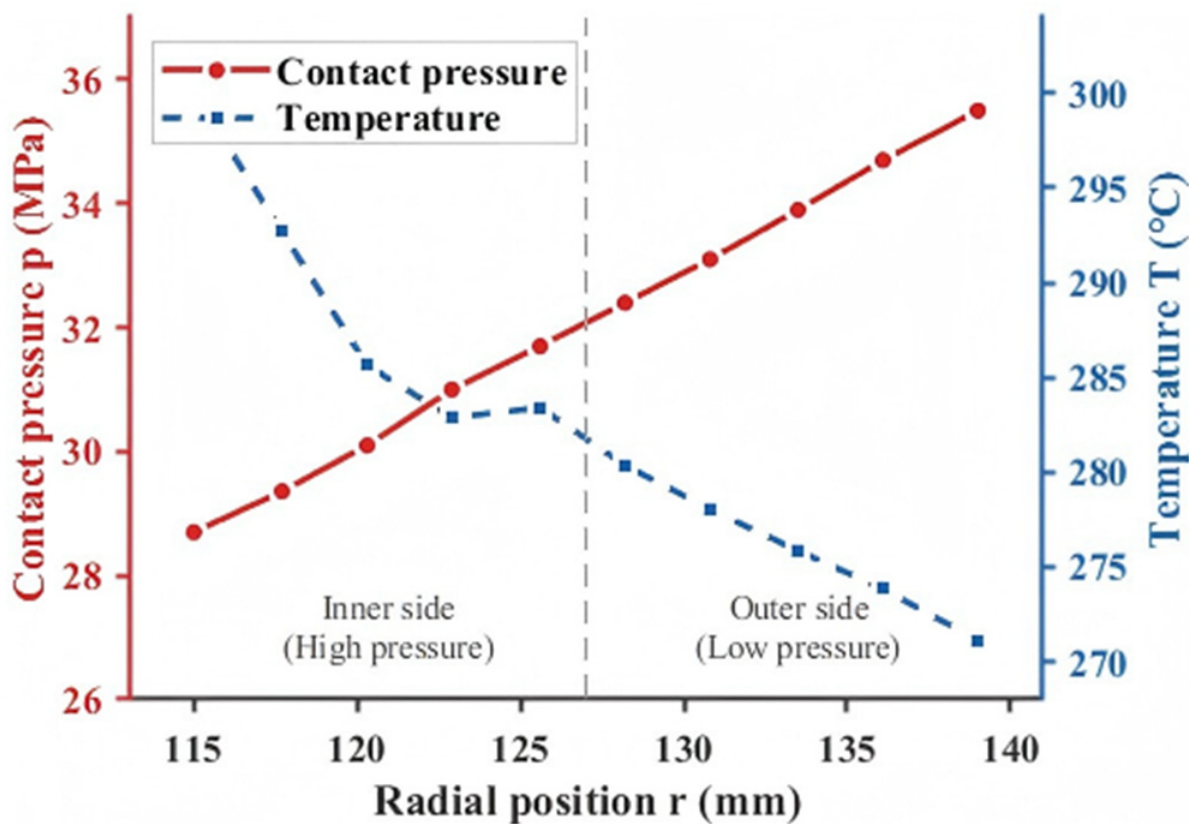
Figure 10.
Radial distribution curves of gasket contact pressure and temperature. The solid red curve denotes contact pressure; the blue dash-dotted curve denotes temperature; and the vertical gray dashed line separates the high-pressure inner side from the low-pressure outer side.
Figure 10.
Radial distribution curves of gasket contact pressure and temperature. The solid red curve denotes contact pressure; the blue dash-dotted curve denotes temperature; and the vertical gray dashed line separates the high-pressure inner side from the low-pressure outer side.
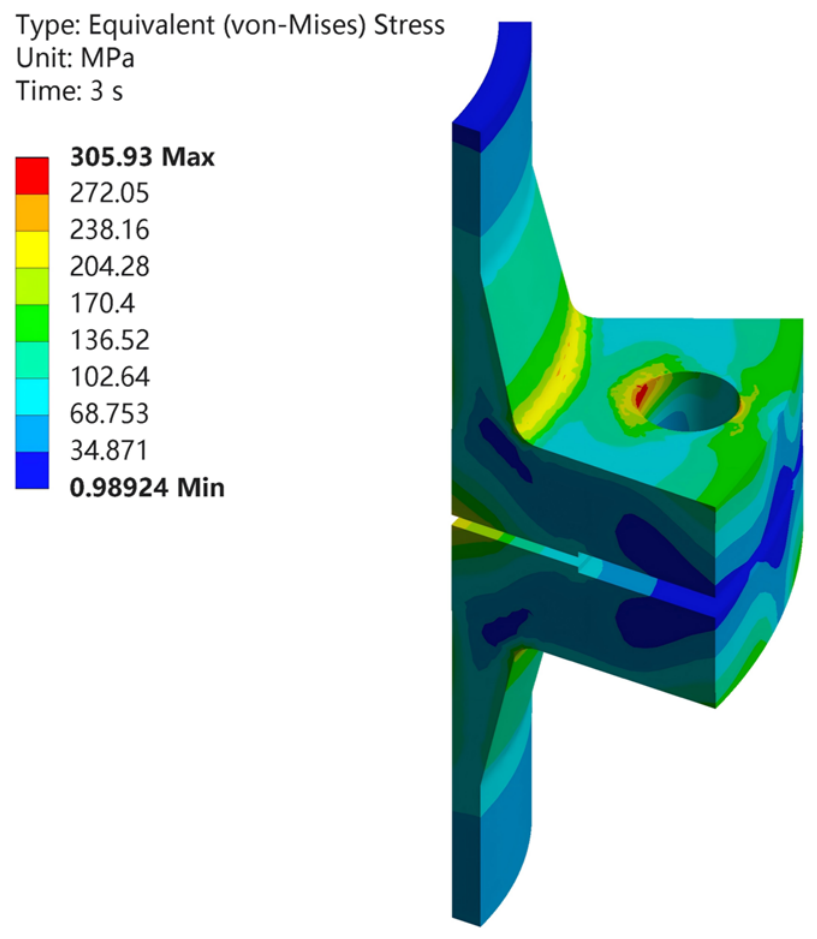
Figure 11.
Von Mises equivalent stress distribution of the flange (Step 3, 300 °C condition). The circular opening is a bolt hole, and the local red region around it denotes a peak-stress concentration.
Figure 11.
Von Mises equivalent stress distribution of the flange (Step 3, 300 °C condition). The circular opening is a bolt hole, and the local red region around it denotes a peak-stress concentration.
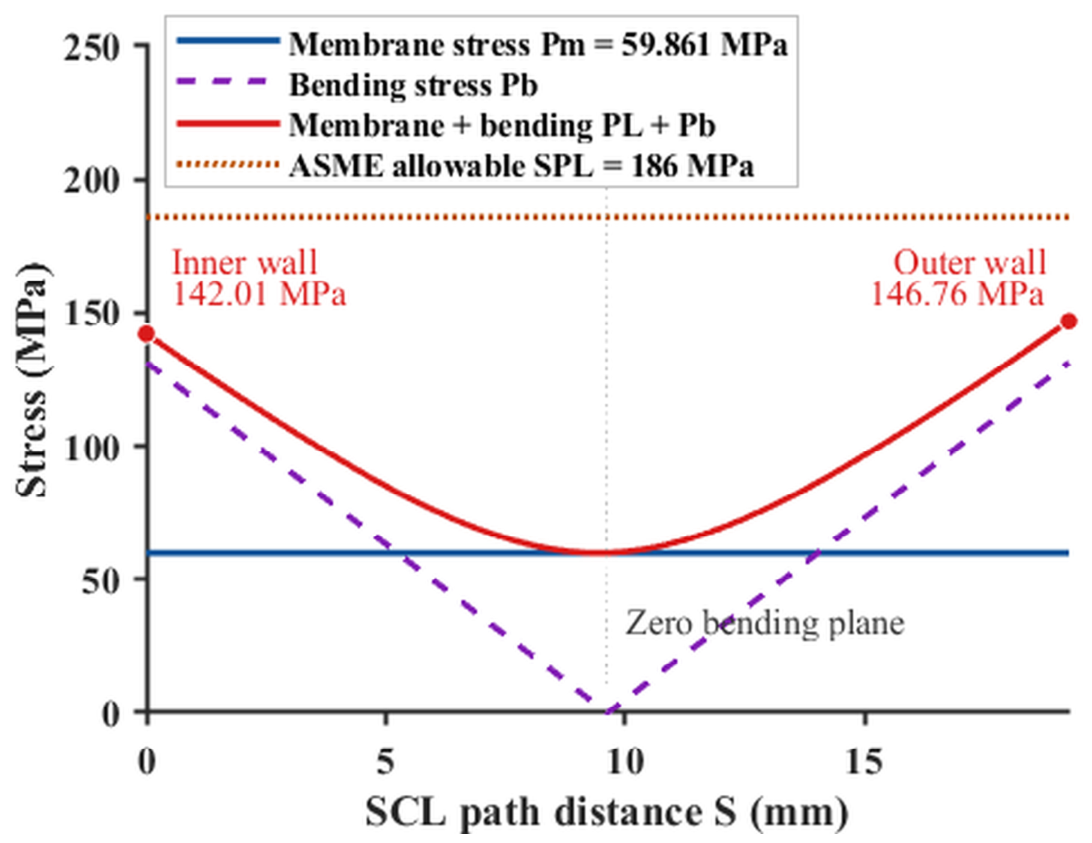
Figure 12.
Membrane and bending stress distribution along the flange SCL path (based on Step 3 stress linearization results). The solid blue, dashed purple, solid red, and dotted brown curves represent membrane stress, bending stress, membrane-plus-bending stress, and the ASME allowable SPL, respectively; the vertical gray dashed line denotes the zero-bending plane.
Figure 12.
Membrane and bending stress distribution along the flange SCL path (based on Step 3 stress linearization results). The solid blue, dashed purple, solid red, and dotted brown curves represent membrane stress, bending stress, membrane-plus-bending stress, and the ASME allowable SPL, respectively; the vertical gray dashed line denotes the zero-bending plane.
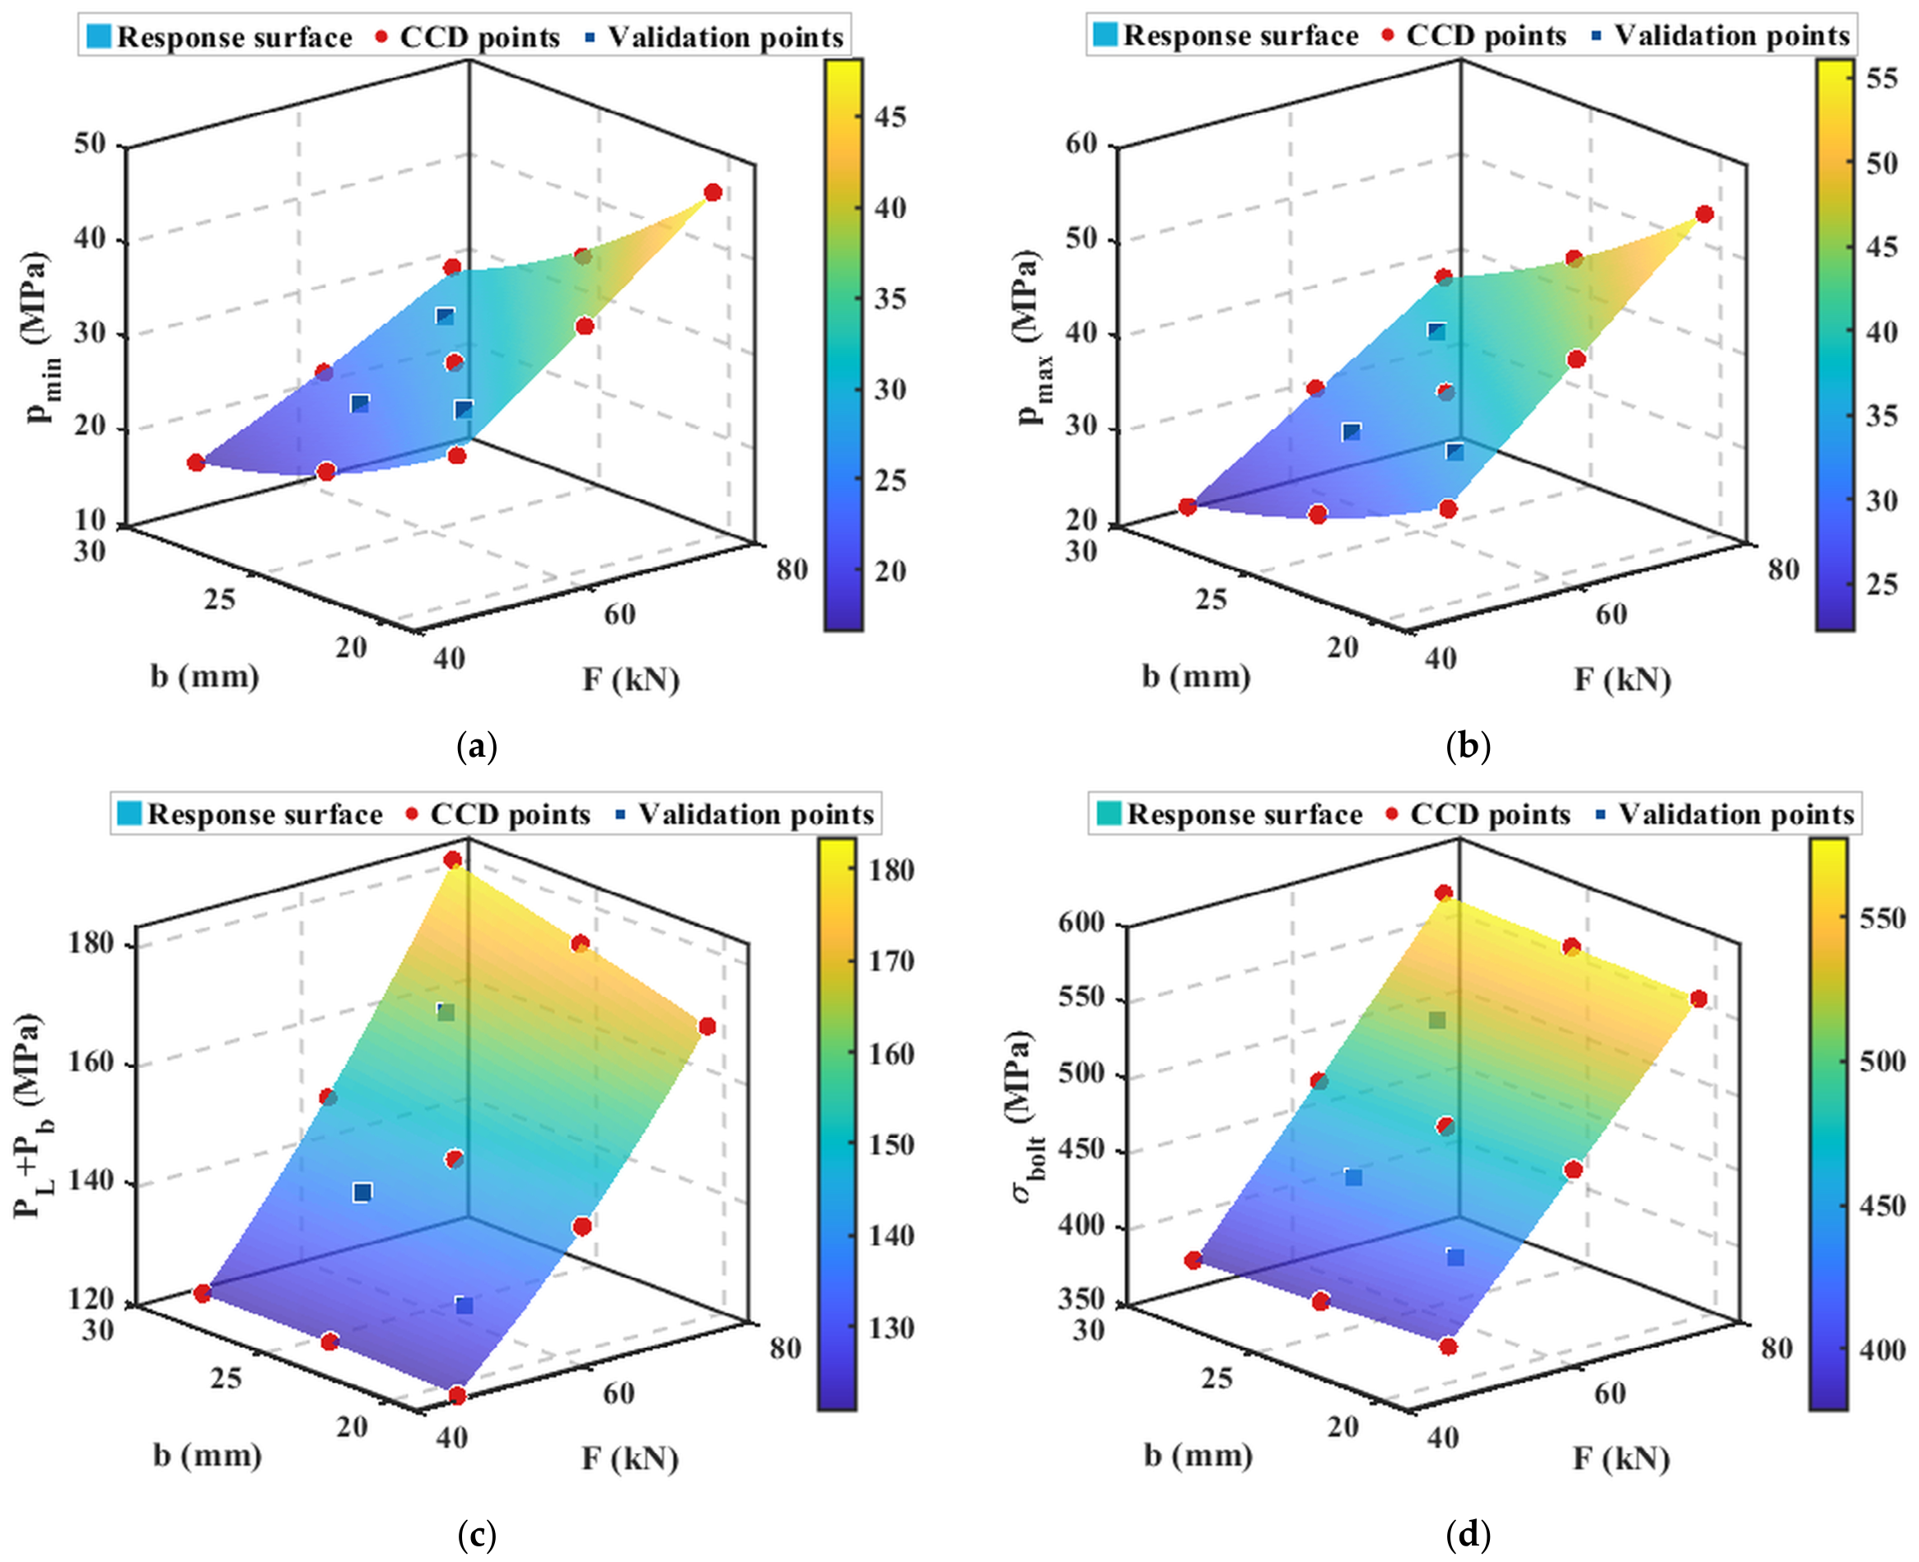
Figure 13.
Second-order RSM fitted surfaces: (a) ; (b) ; (c) ; (d) .
Figure 13.
Second-order RSM fitted surfaces: (a) ; (b) ; (c) ; (d) .
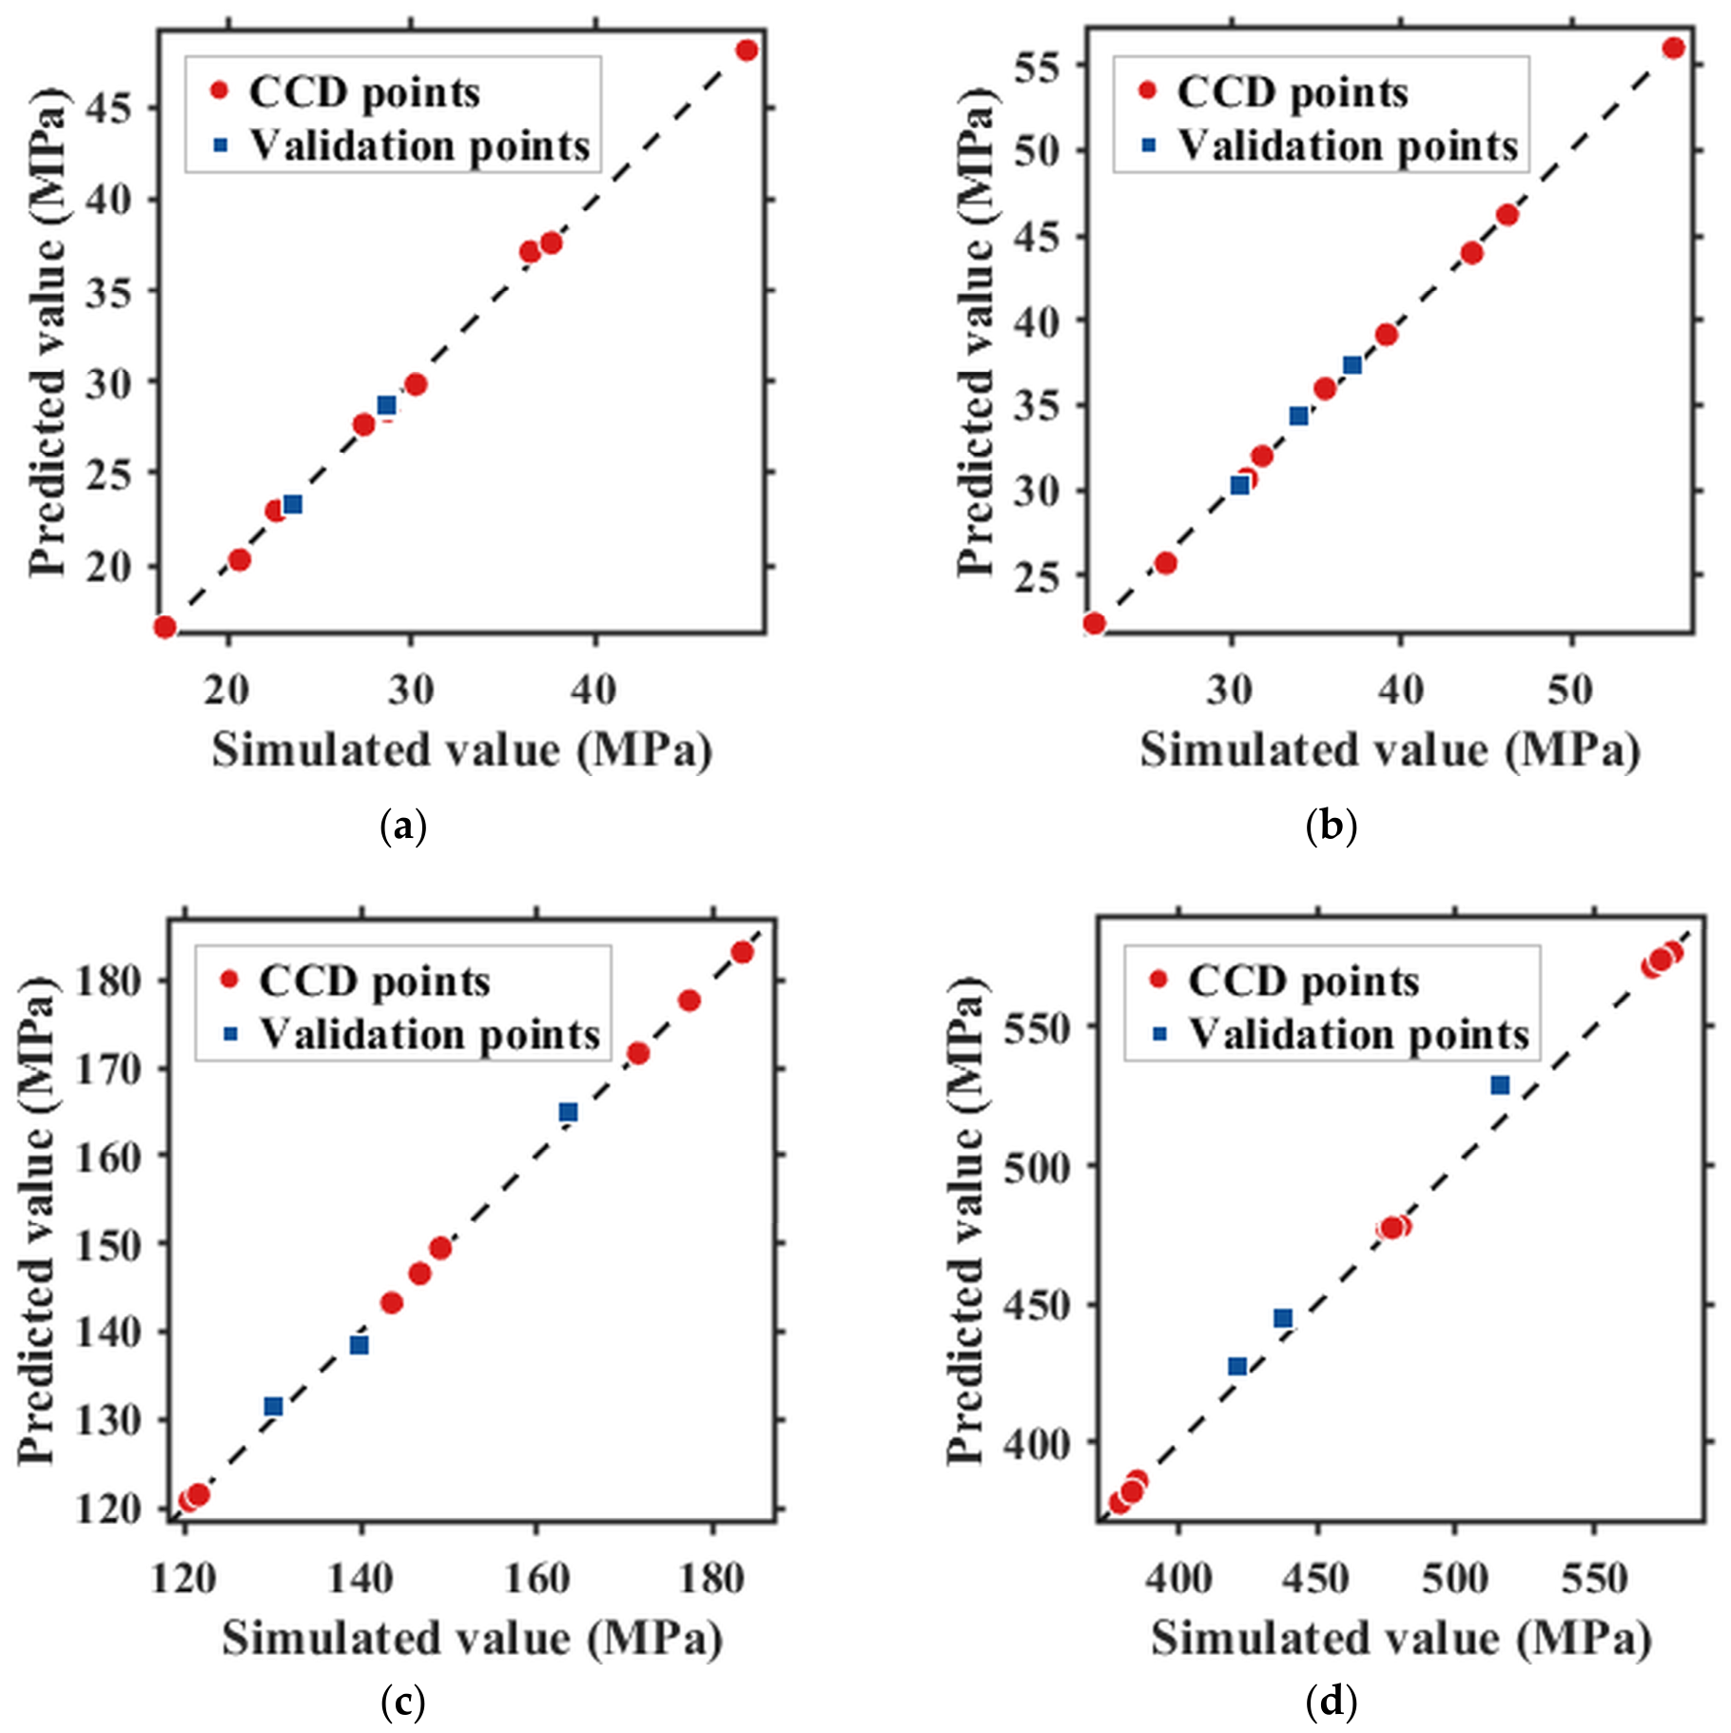
Figure 14.
RSM predicted vs. simulated values: (a) ; (b) ; (c) ; (d) .
Figure 14.
RSM predicted vs. simulated values: (a) ; (b) ; (c) ; (d) .
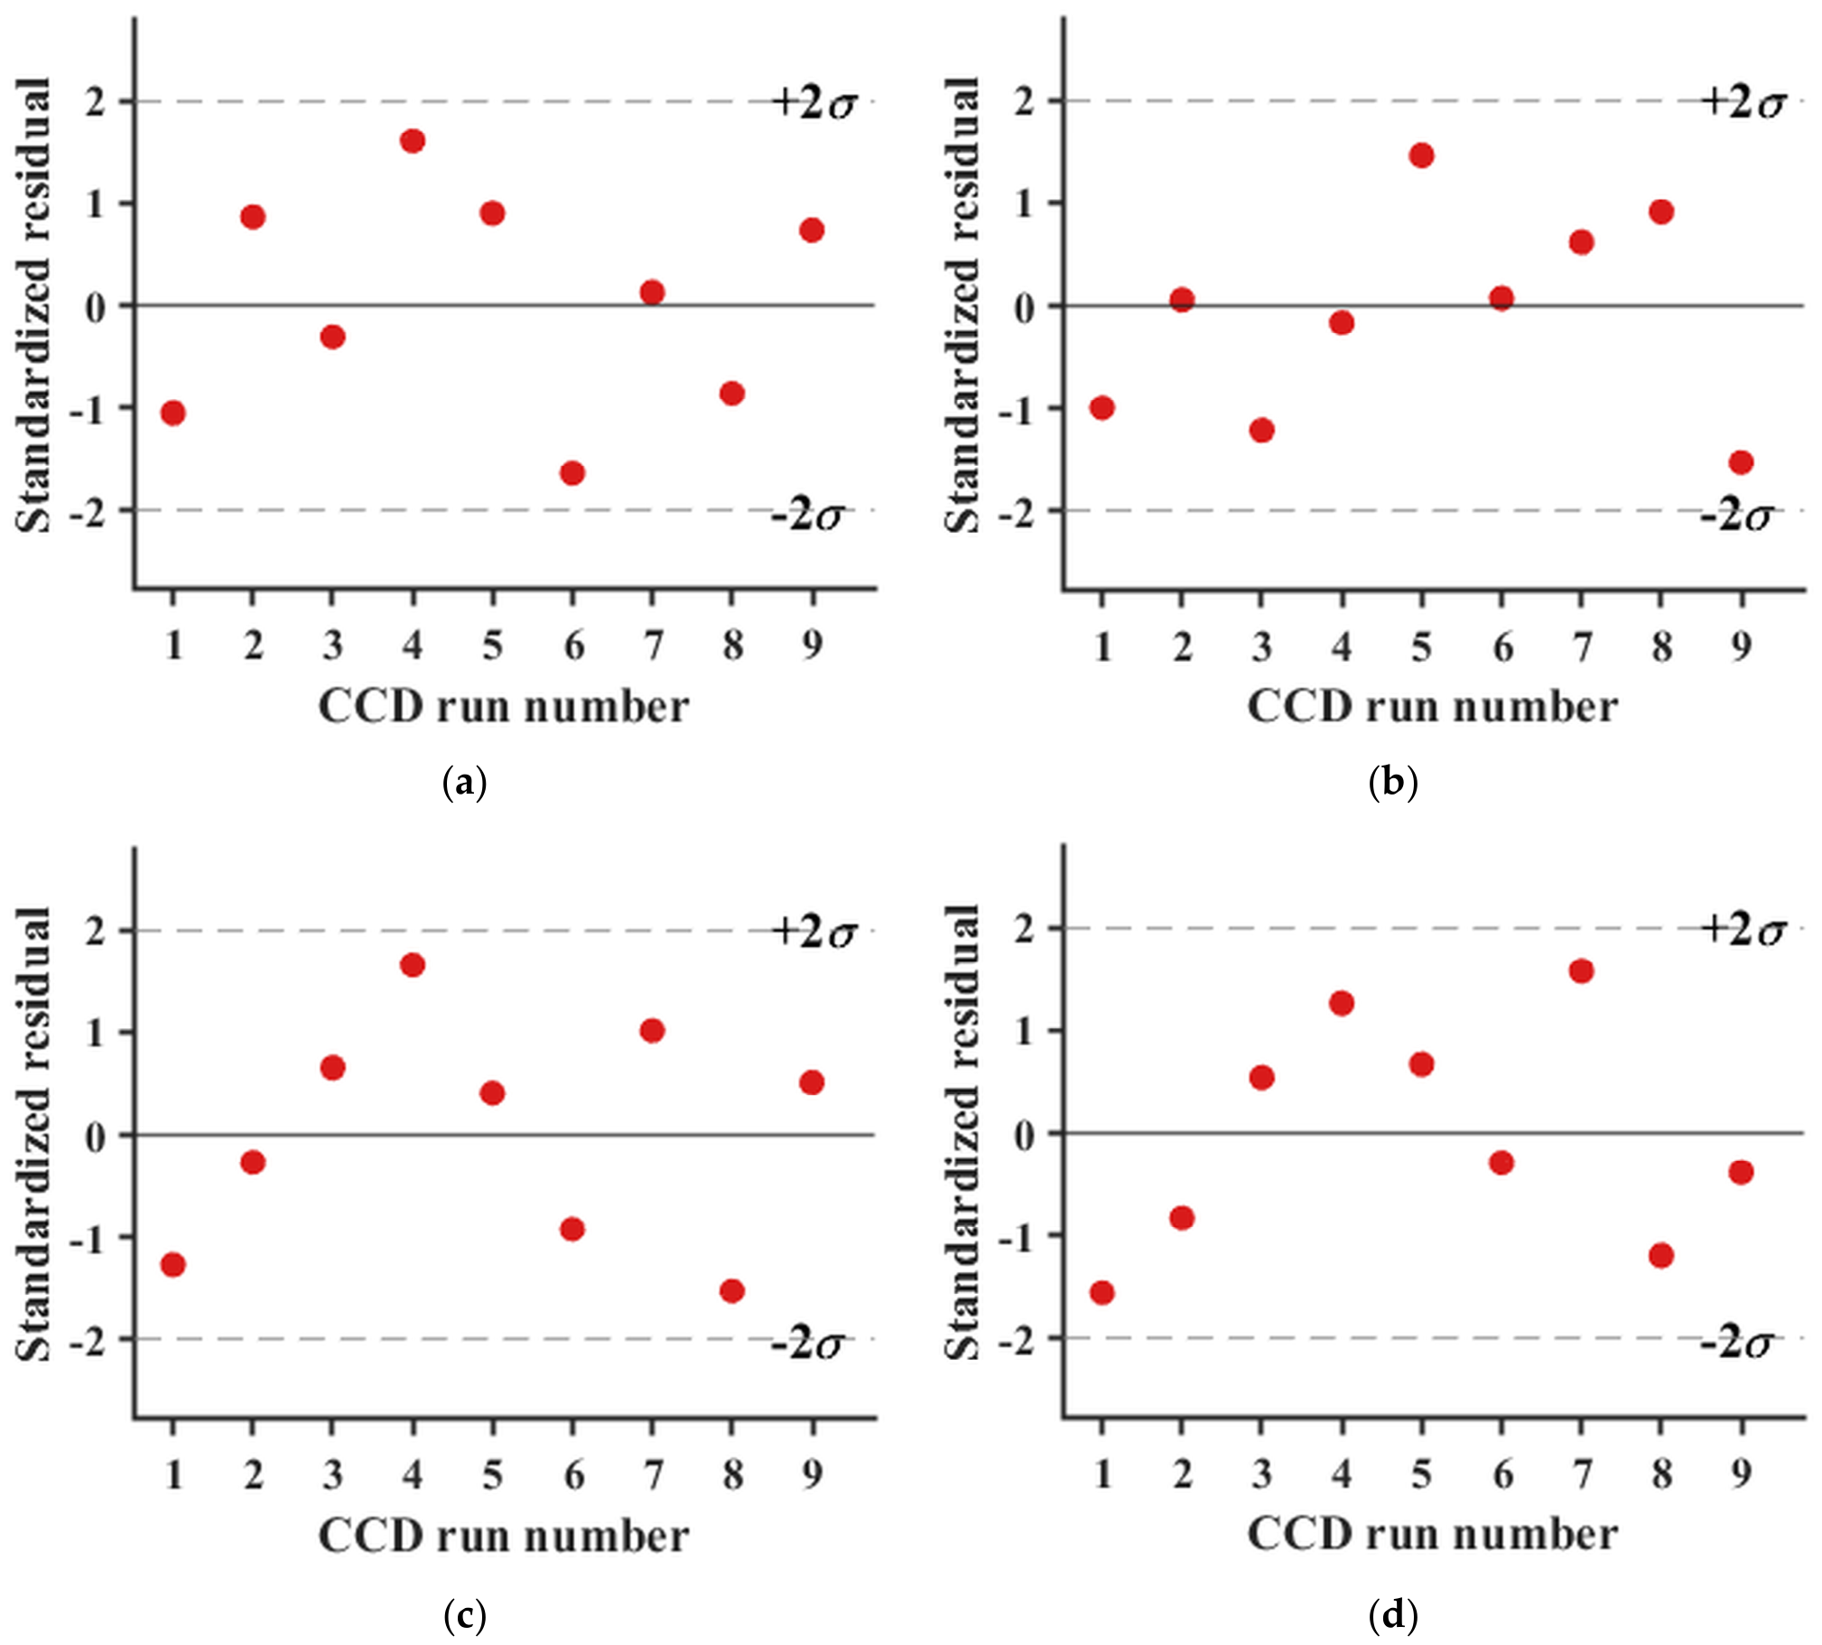
Figure 15.
RSM standardized residual diagnostic plots: (a) ; (b) ; (c) ; (d) .
Figure 15.
RSM standardized residual diagnostic plots: (a) ; (b) ; (c) ; (d) .
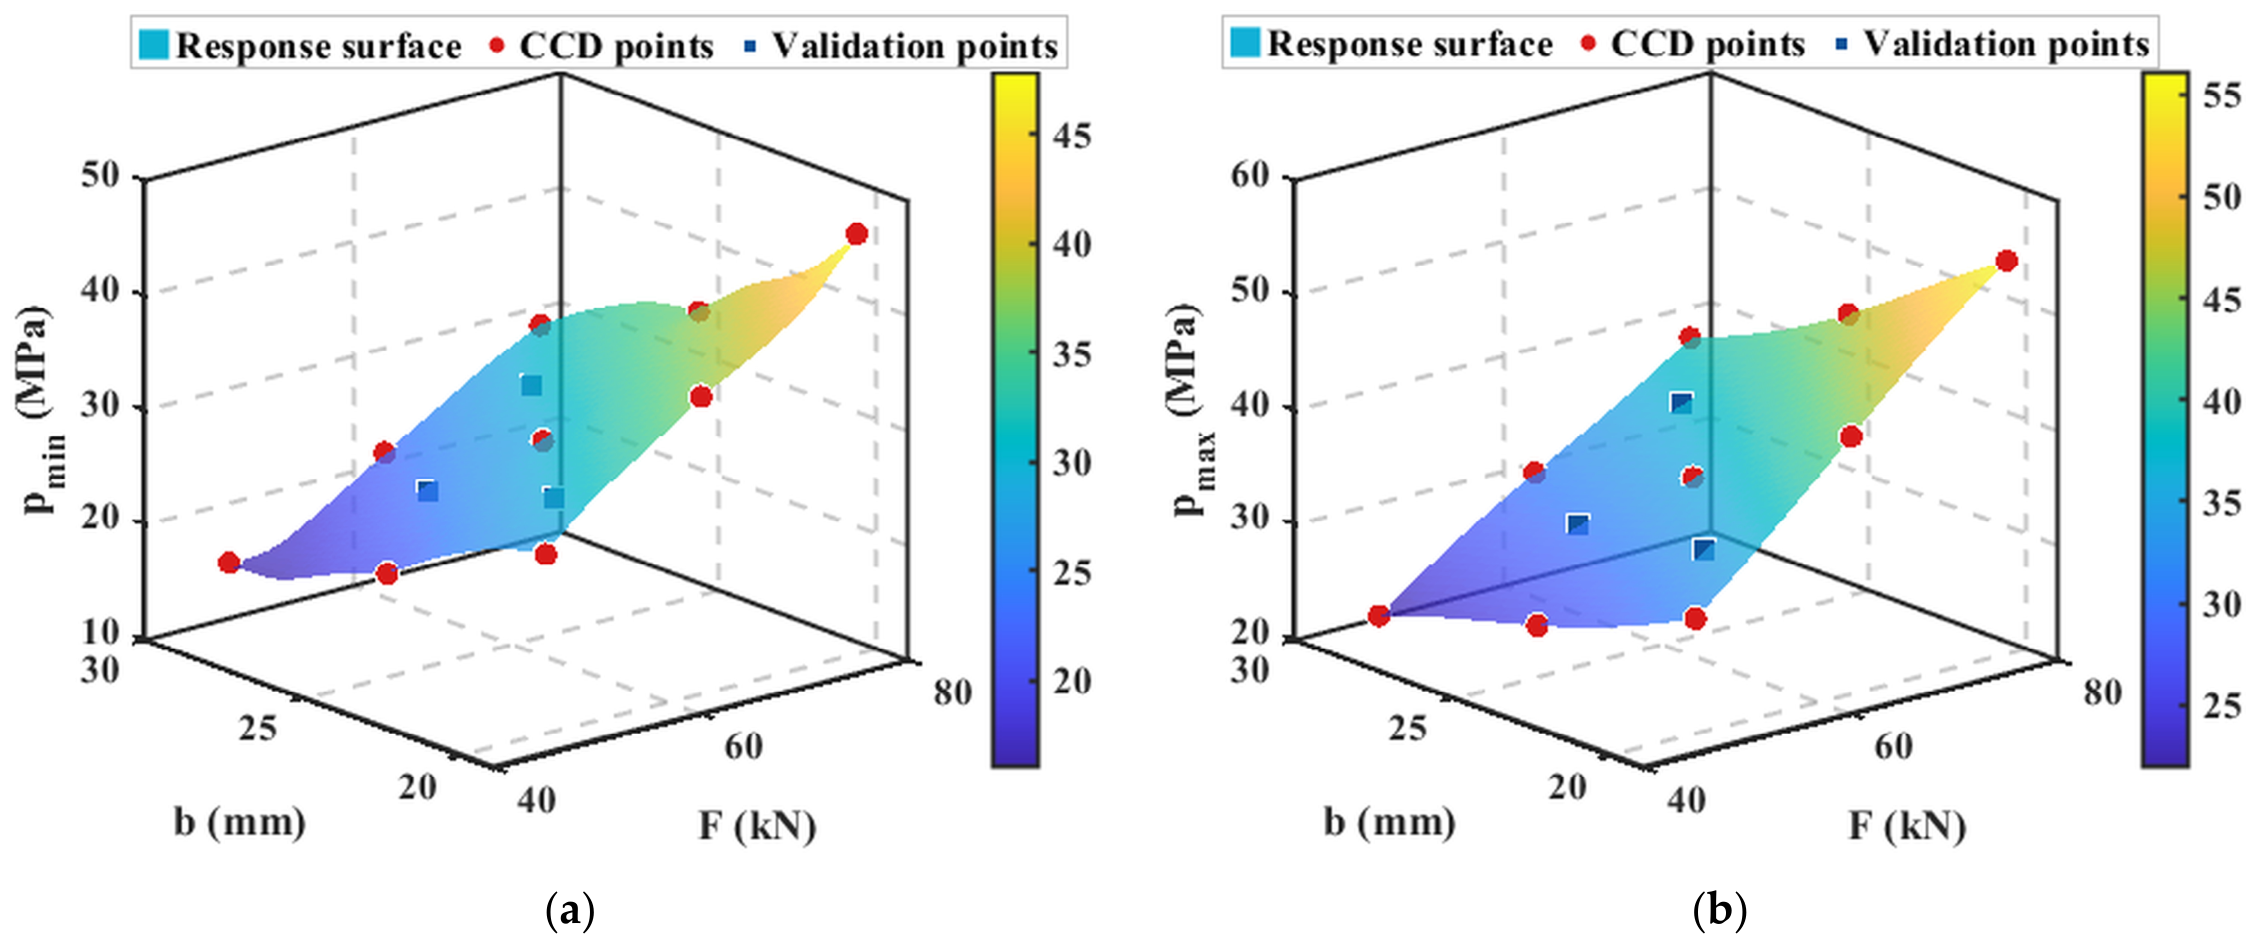
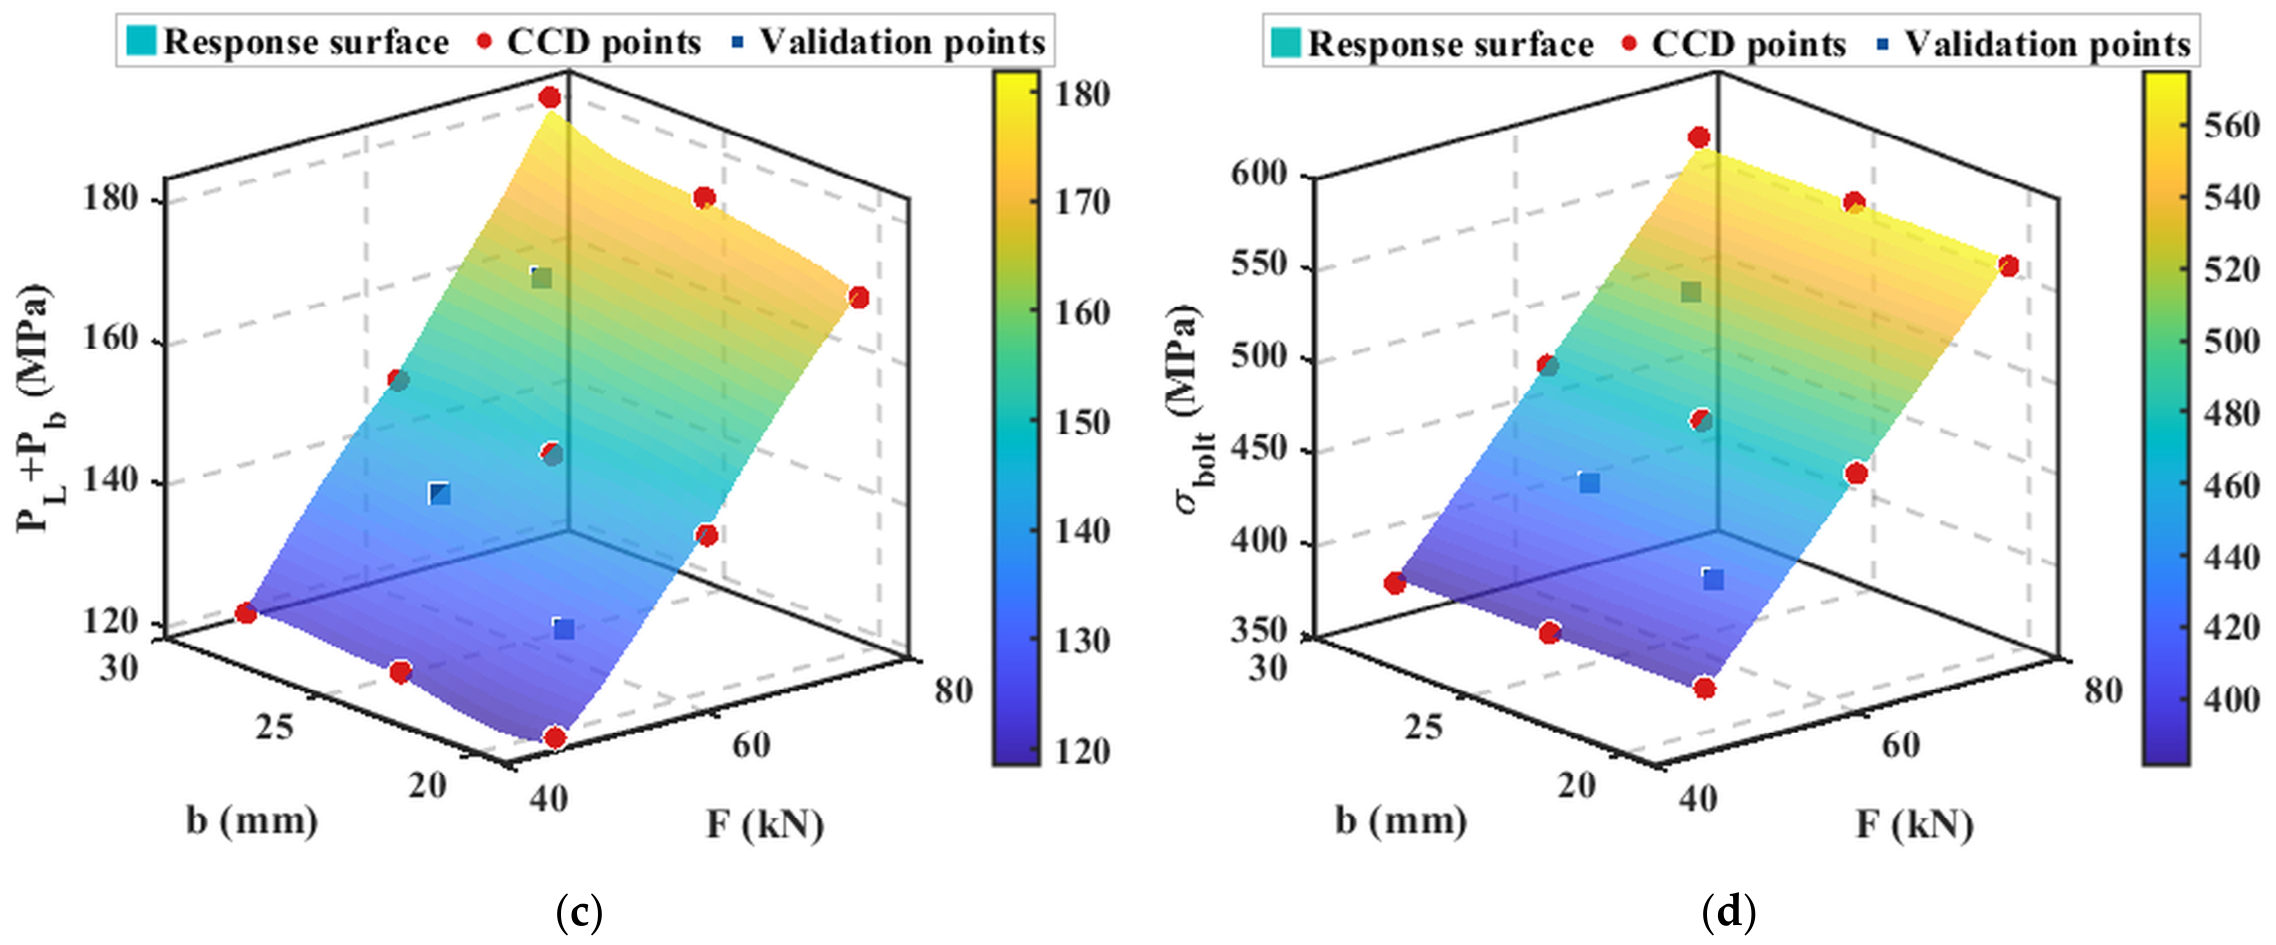
Figure 16.
Kriging fitted surfaces: (a) ; (b) ; (c) ; (d) .
Figure 16.
Kriging fitted surfaces: (a) ; (b) ; (c) ; (d) .
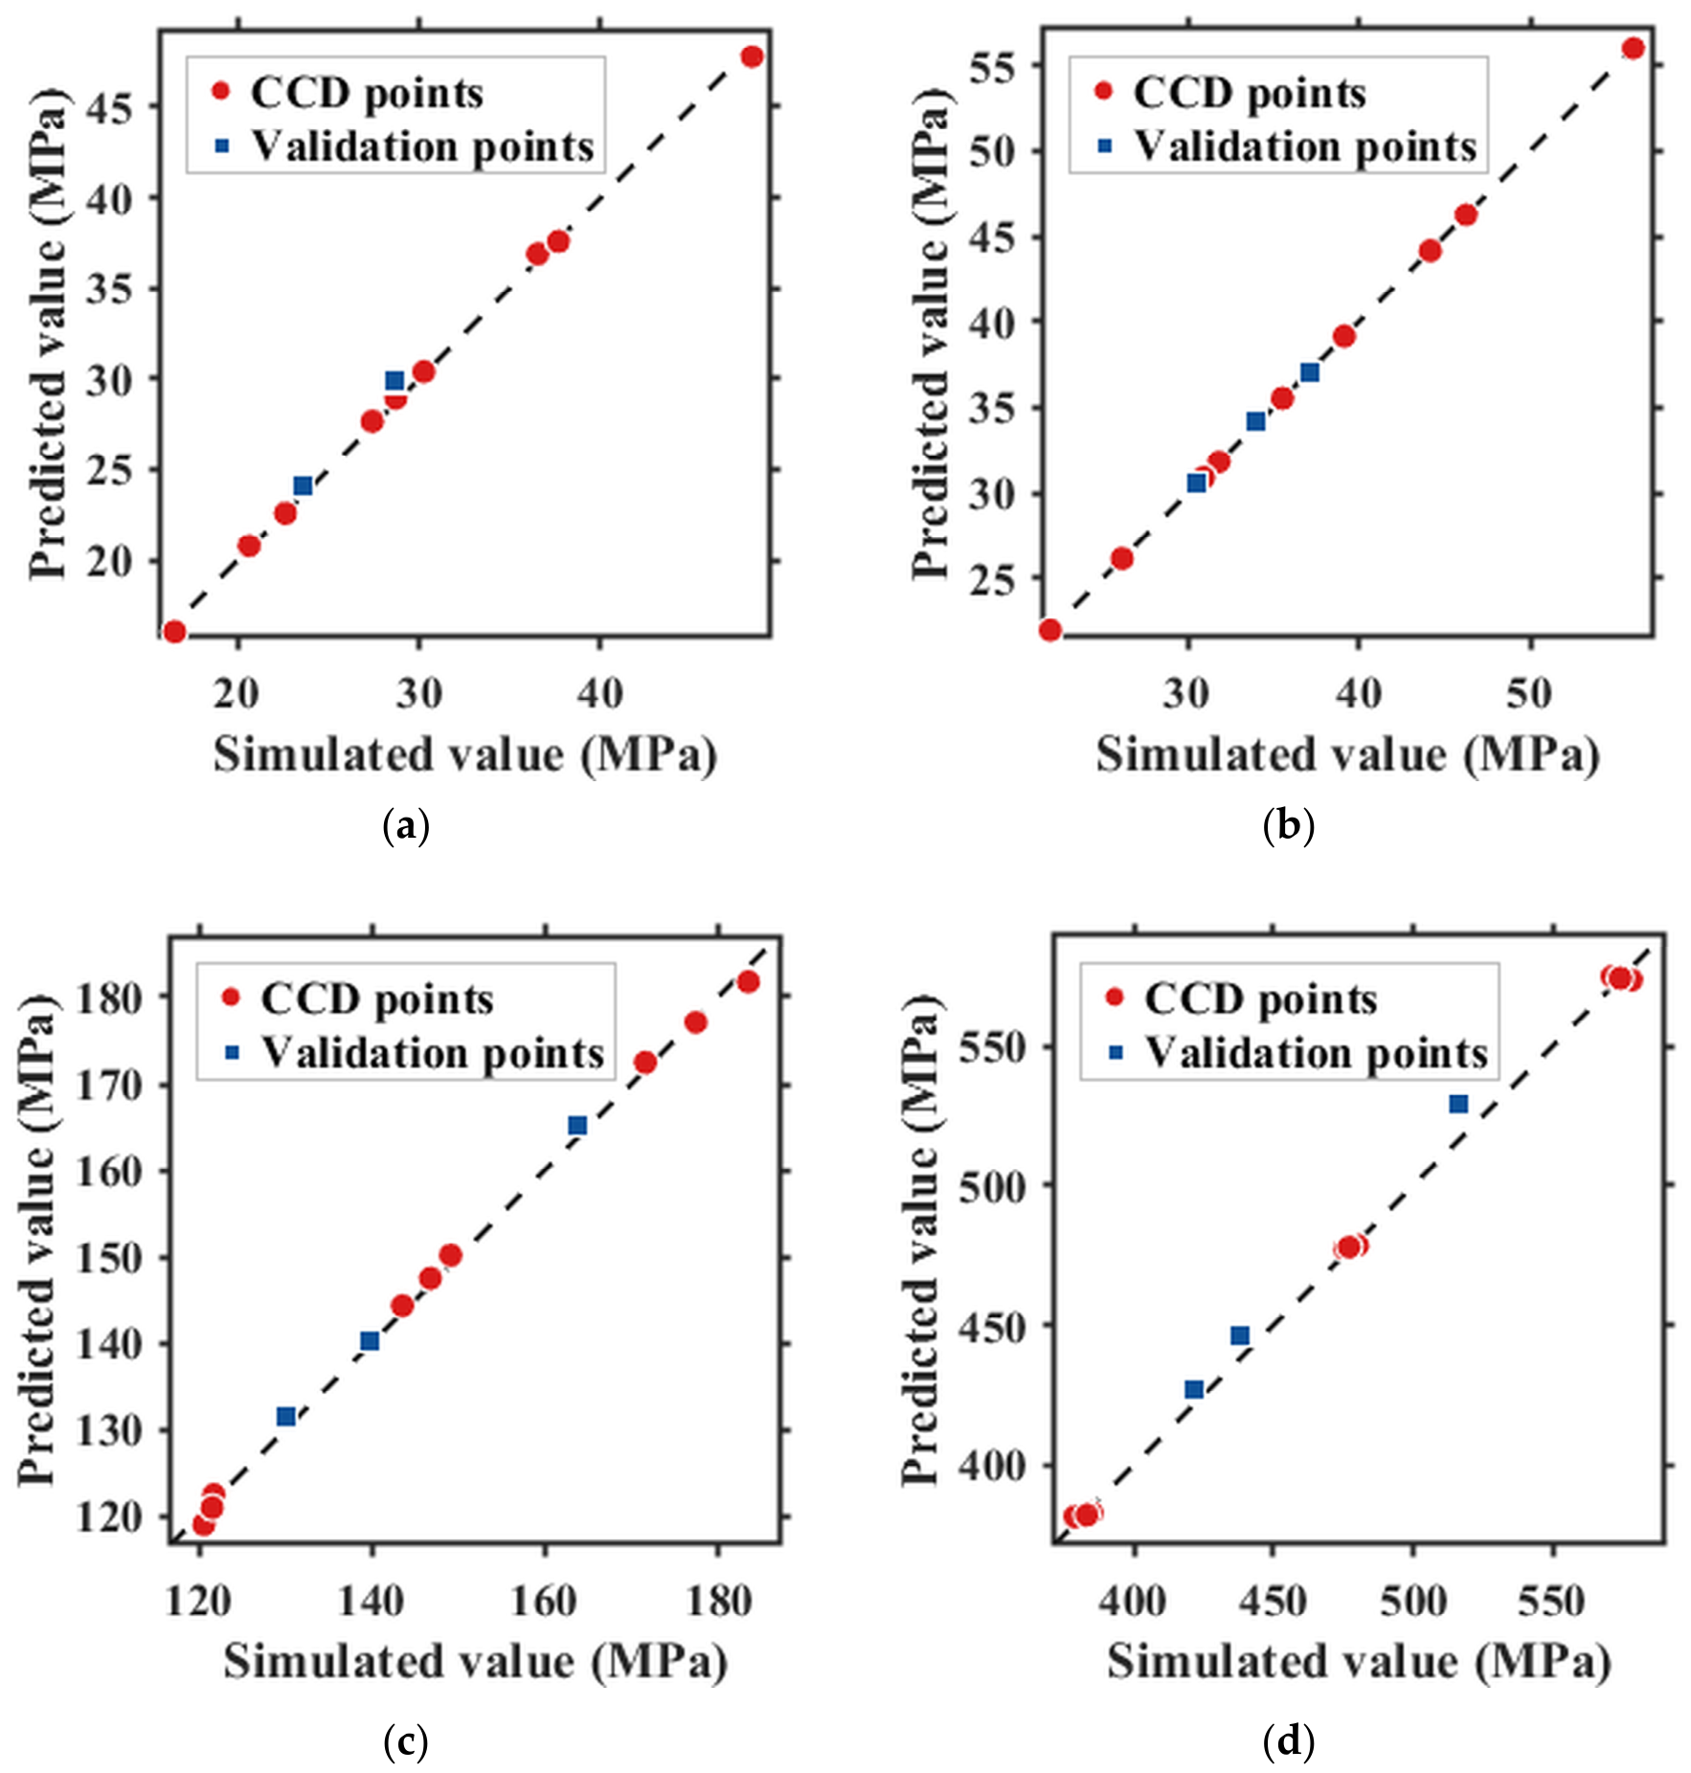
Figure 17.
Kriging predicted vs. simulated values: (a) ; (b) ; (c) ; (d) . The dashed line denotes the ideal agreement line (y = x).
Figure 17.
Kriging predicted vs. simulated values: (a) ; (b) ; (c) ; (d) . The dashed line denotes the ideal agreement line (y = x).
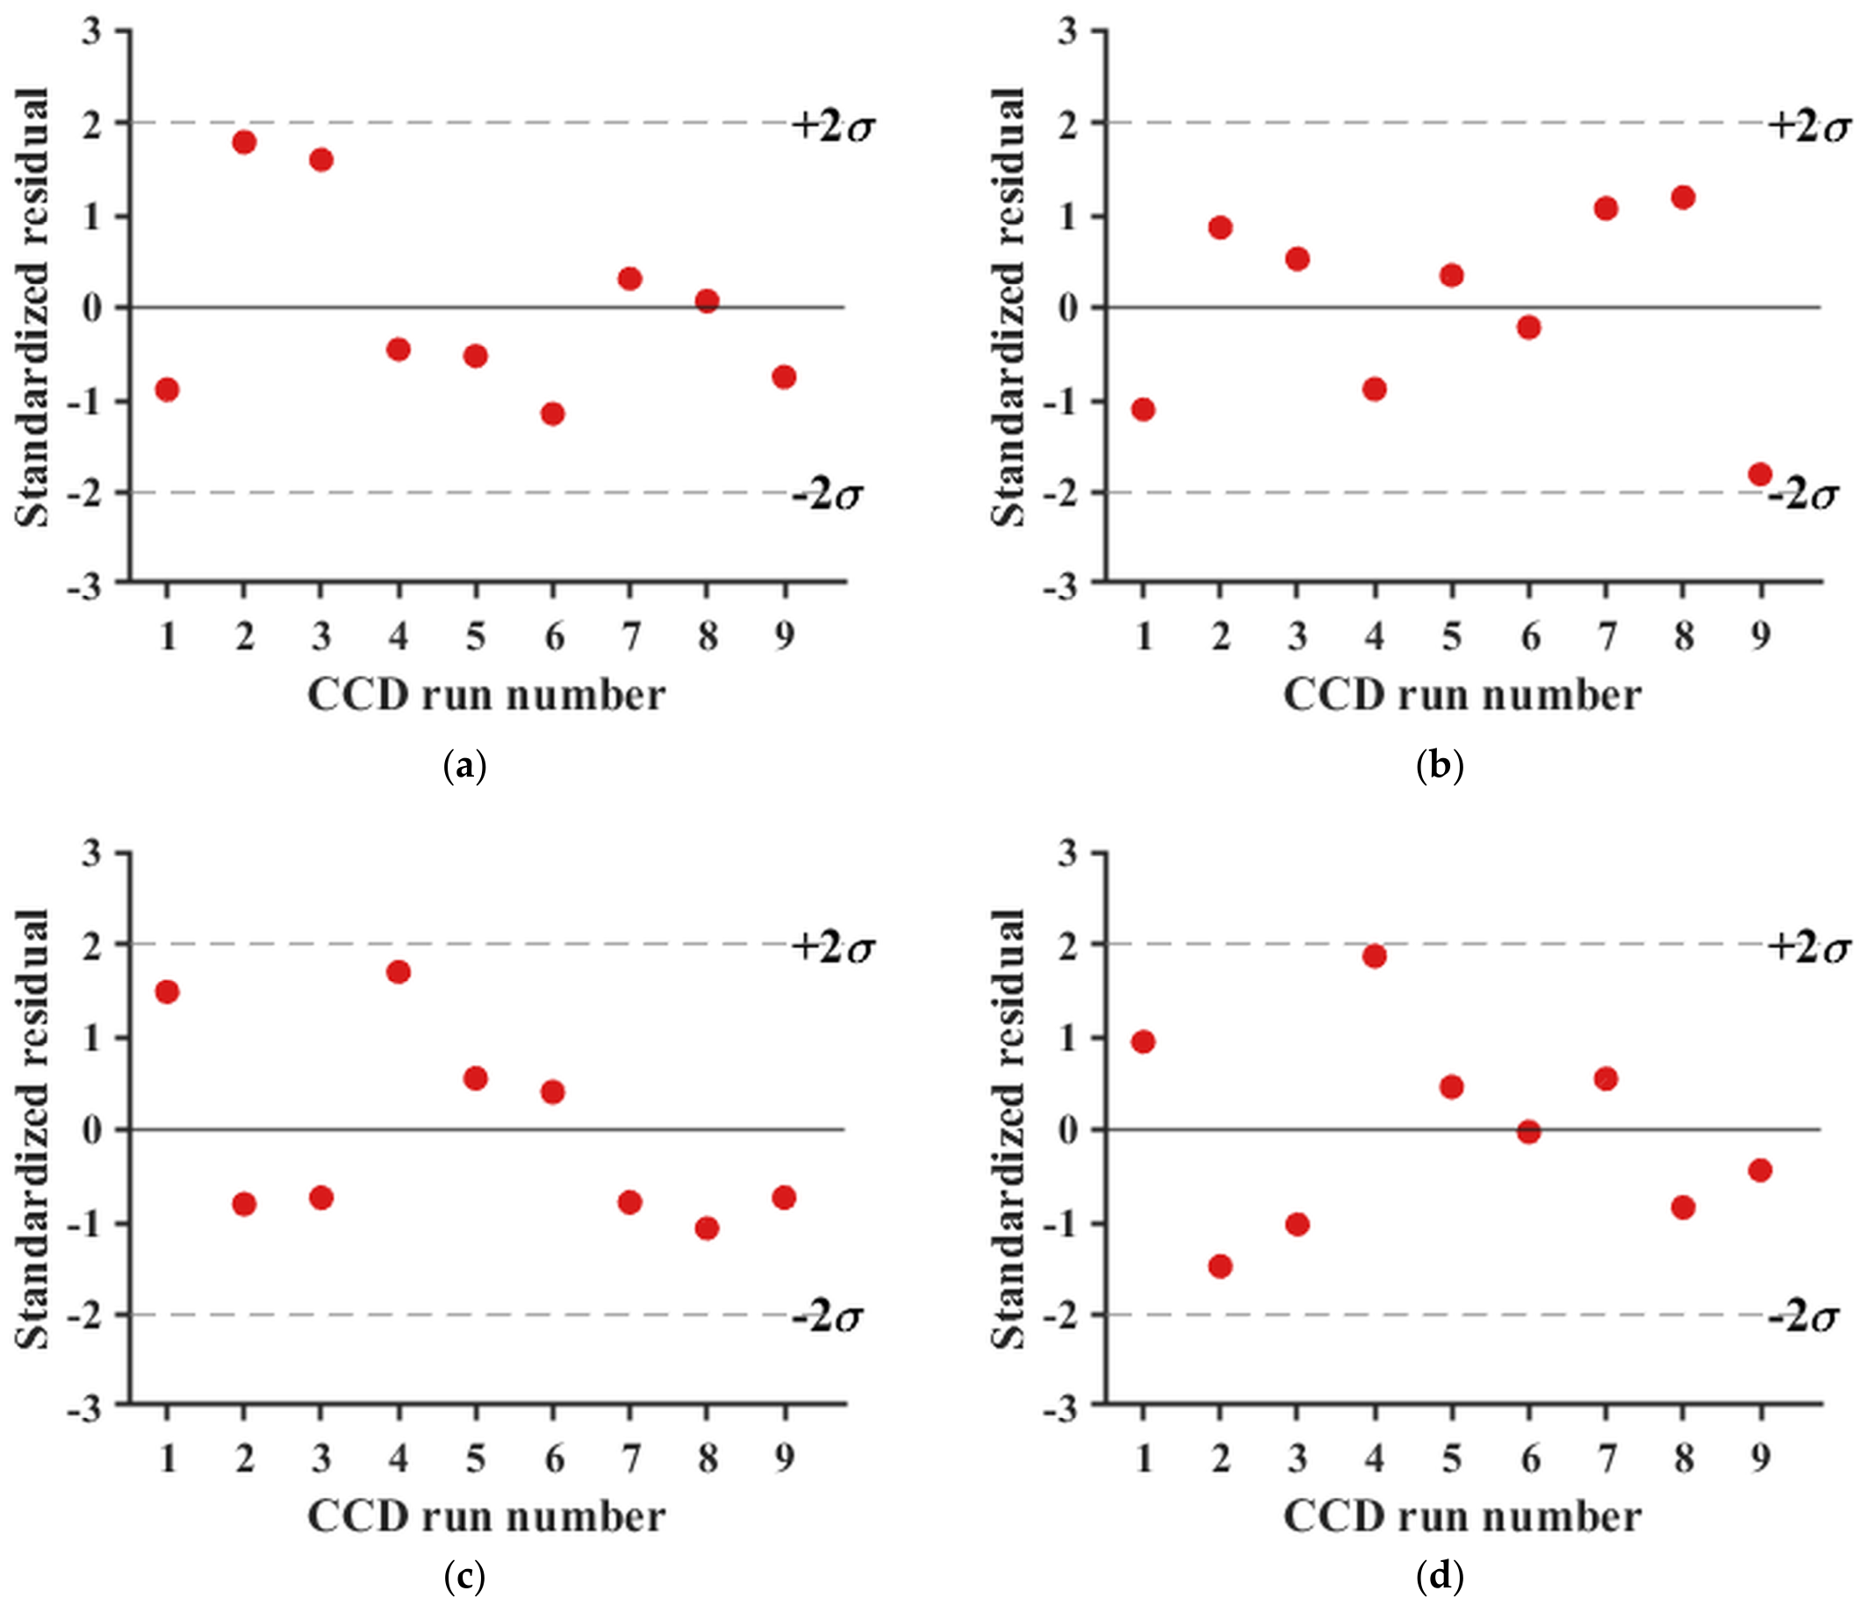
Figure 18.
Kriging standardized residual diagnostic plots: (a) ; (b) ; (c) ; (d) .
Figure 18.
Kriging standardized residual diagnostic plots: (a) ; (b) ; (c) ; (d) .
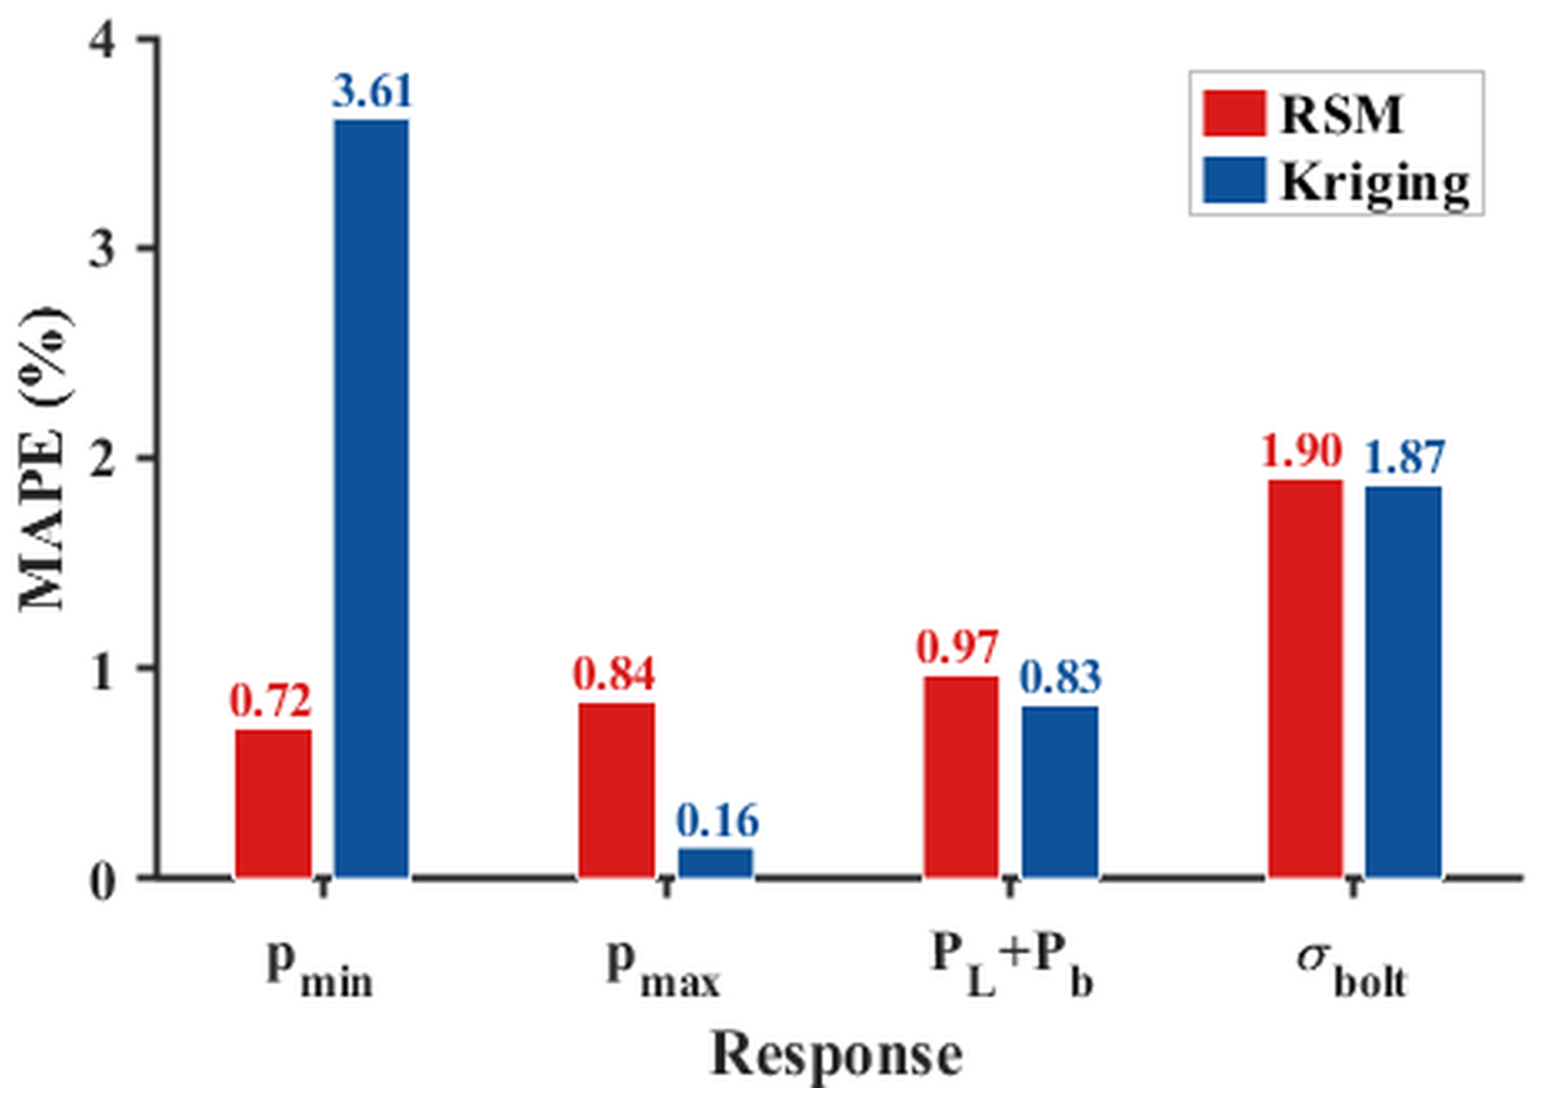
Figure 19.
Bar chart comparison of RSM and Kriging validation-set MAPE.
Figure 19.
Bar chart comparison of RSM and Kriging validation-set MAPE.
Figure 20.
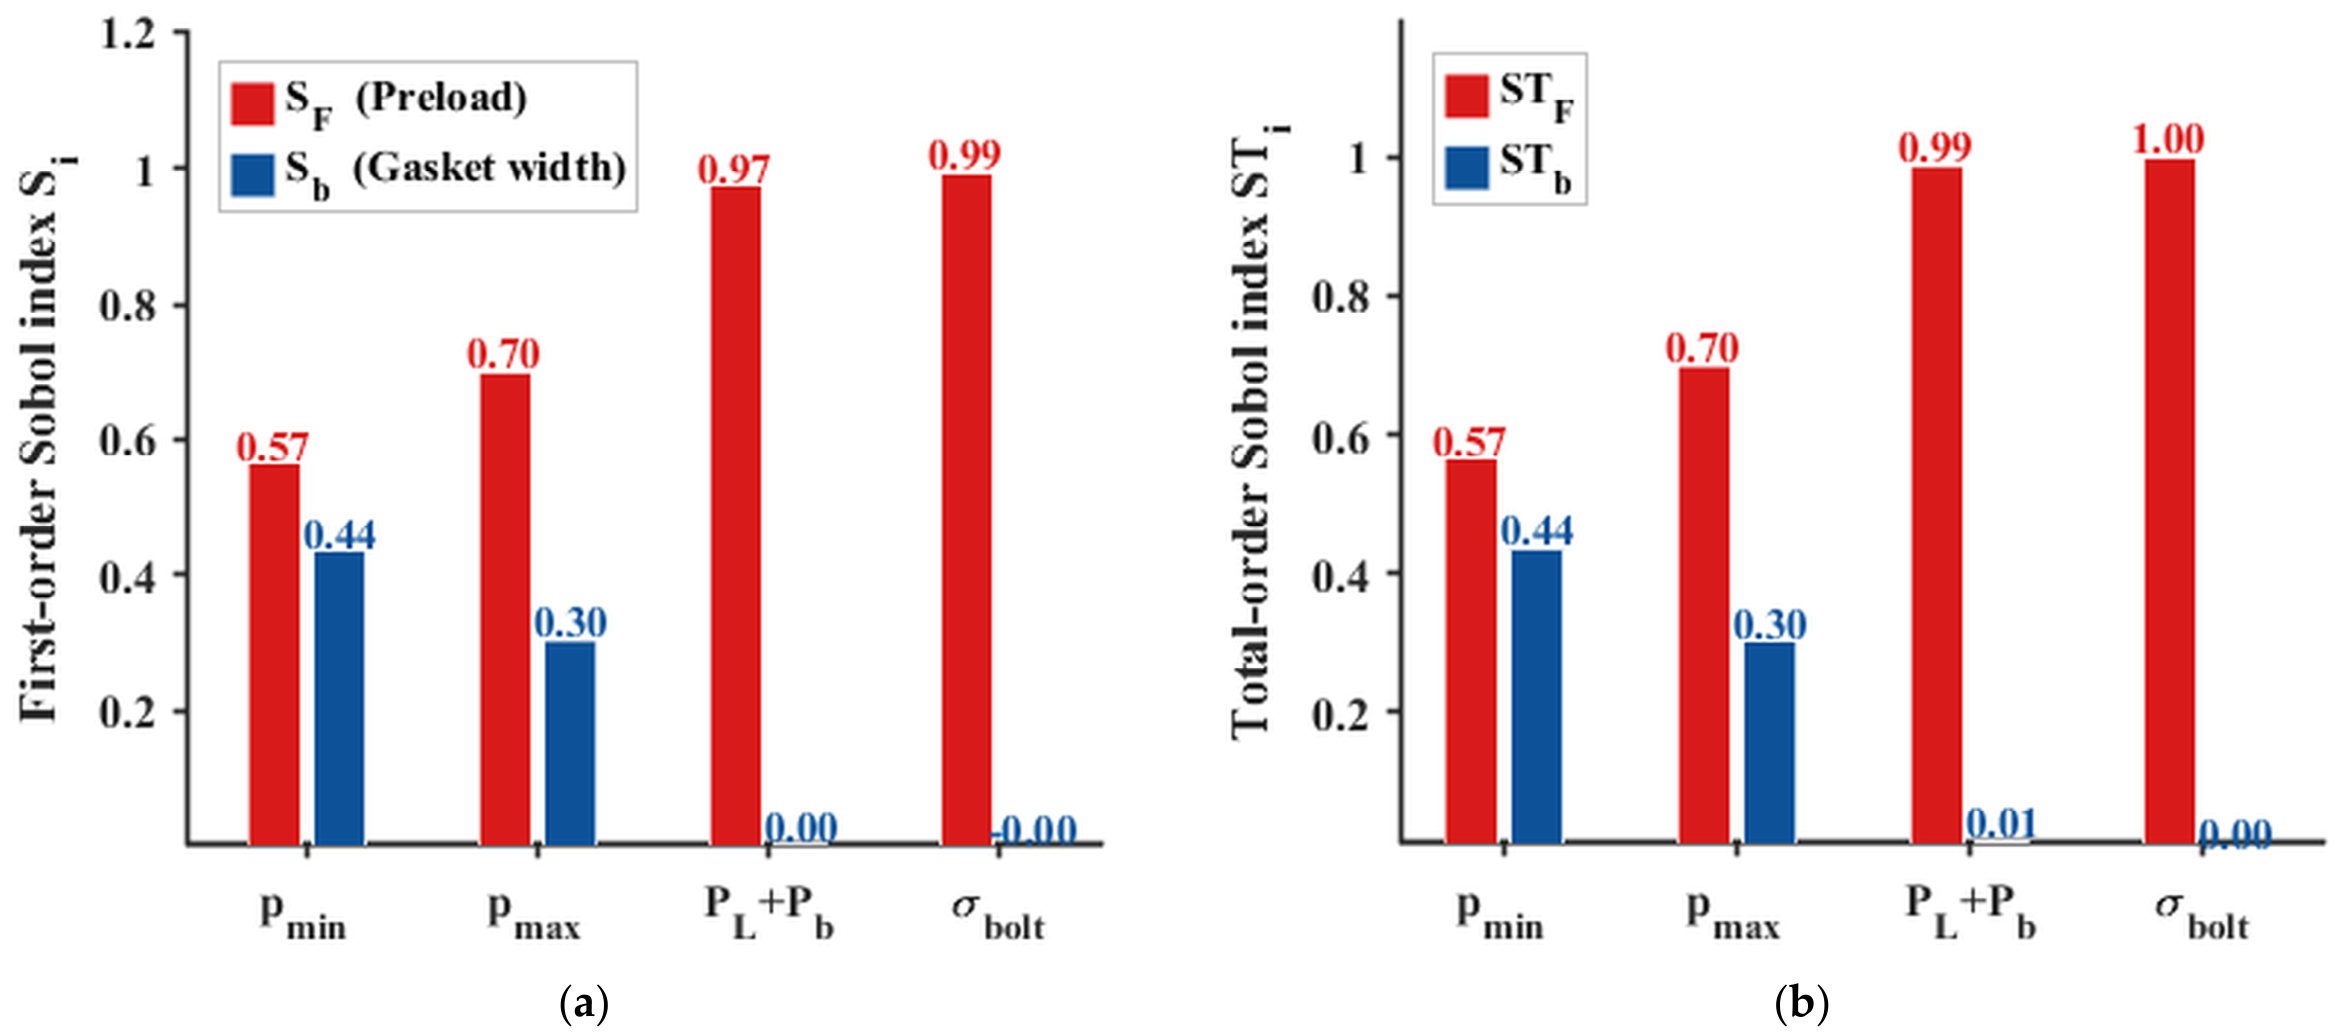
Sobol sensitivity indices: (a) first-order main effects; (b) total effects.
Figure 20.
Sobol sensitivity indices: (a) first-order main effects; (b) total effects.
Figure 21.
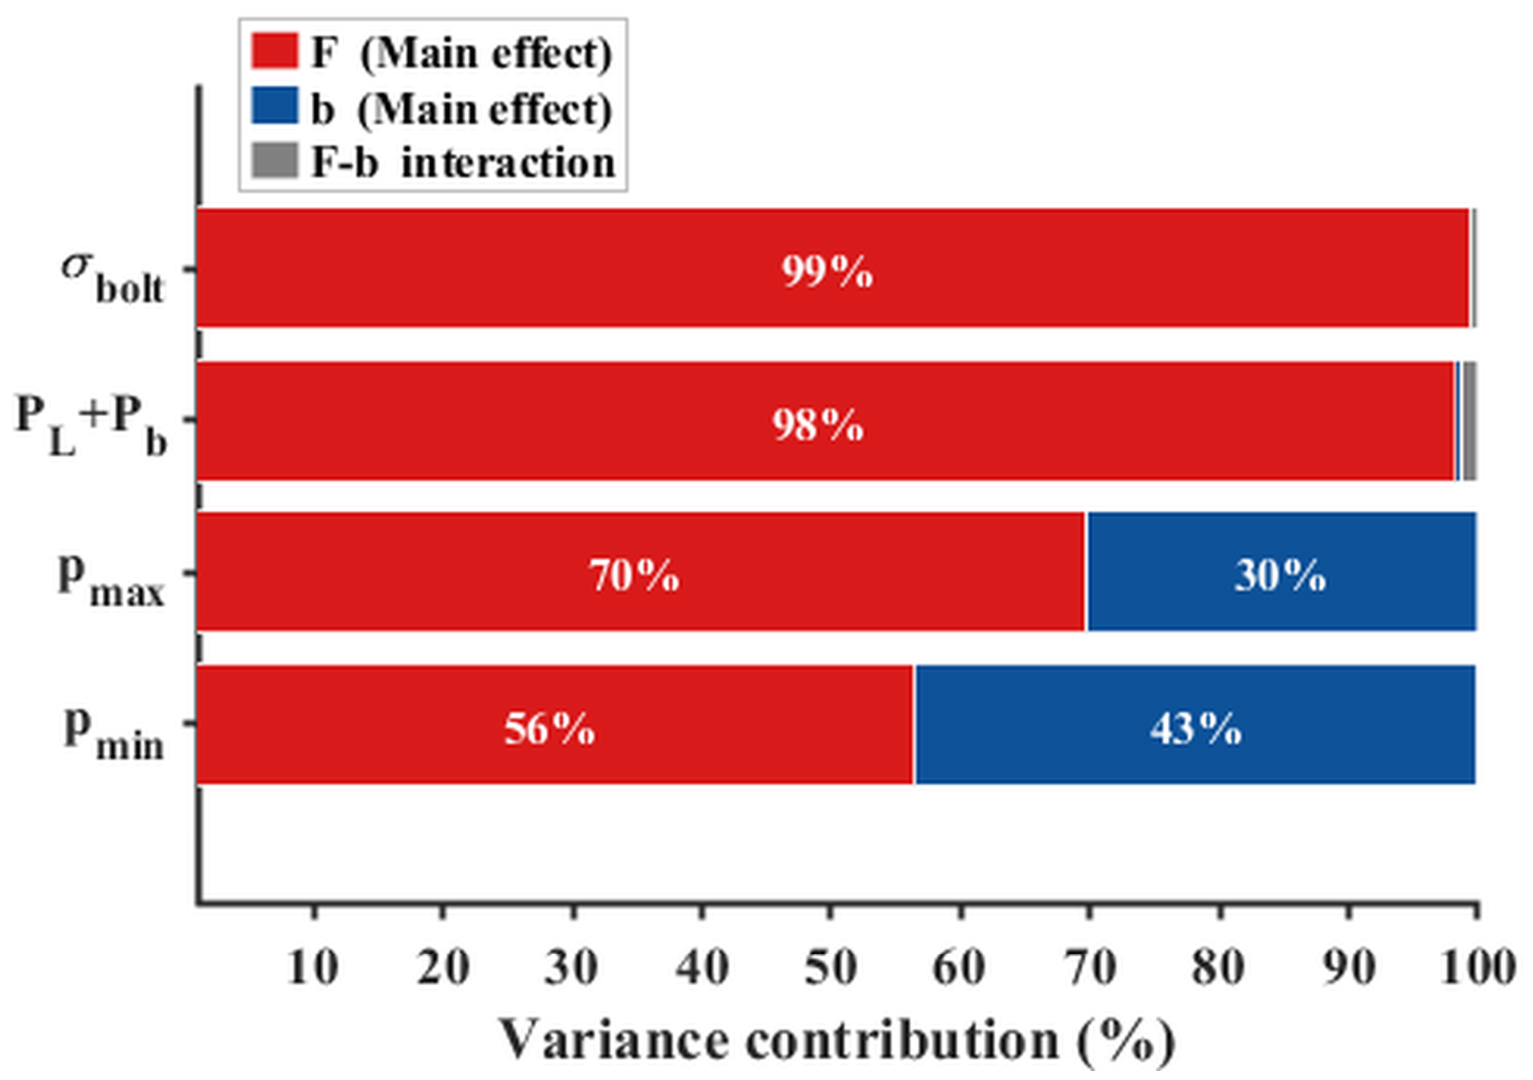
Variance contribution decomposition for each response.
Figure 21.
Variance contribution decomposition for each response.
Figure 22.
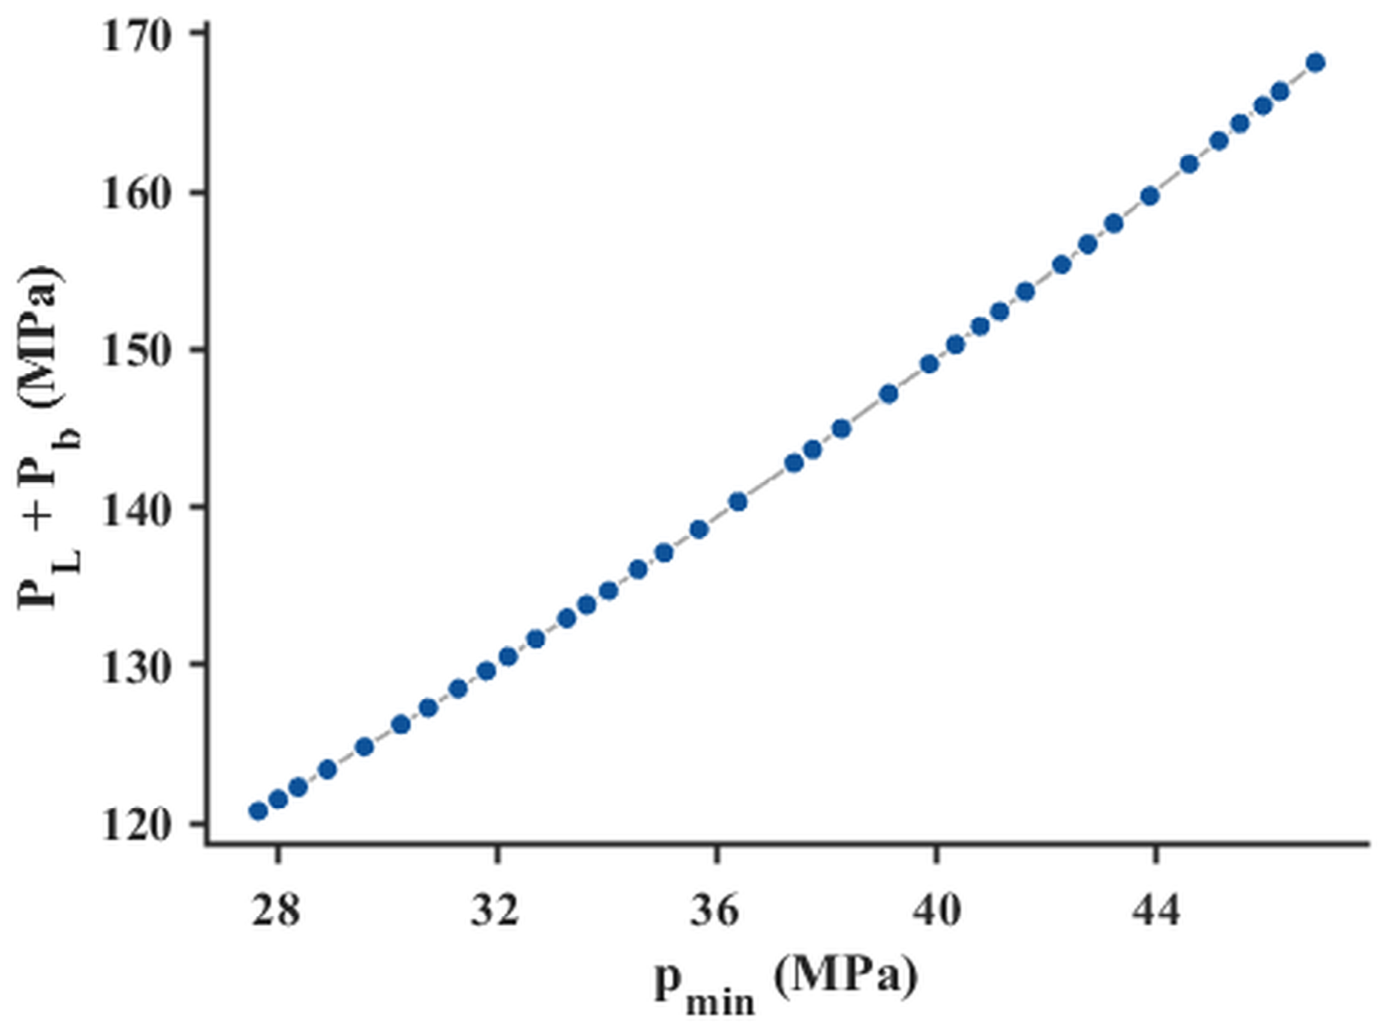
Pareto front obtained by NSGA-II.
Figure 22.
Pareto front obtained by NSGA-II.
Figure 23.
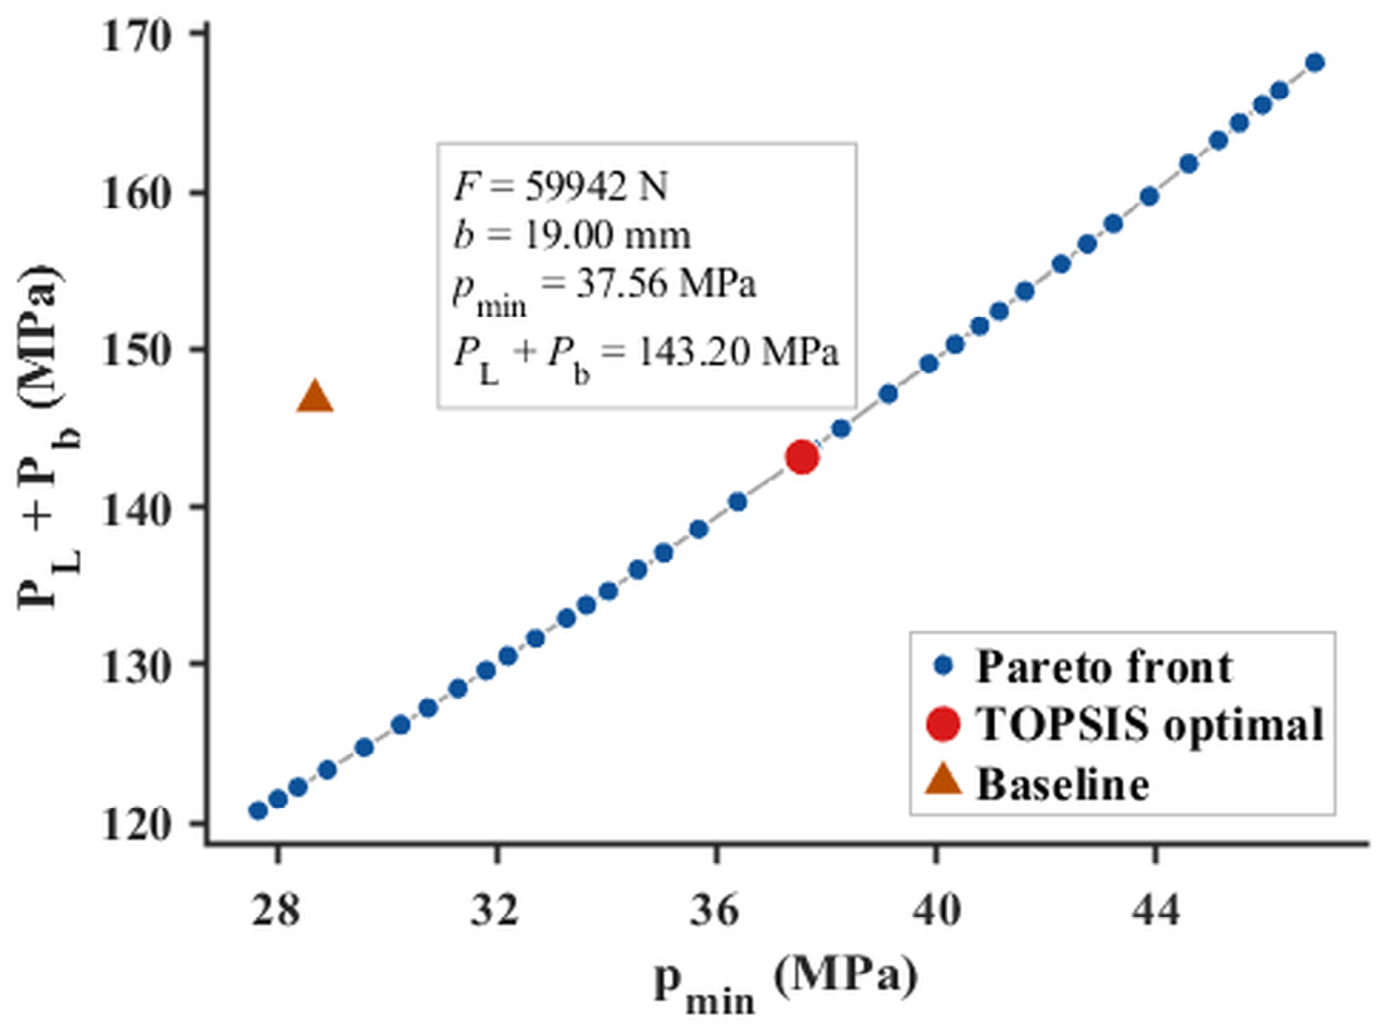
TOPSIS decision results (min-max normalization, equal weights).
Figure 23.
TOPSIS decision results (min-max normalization, equal weights).
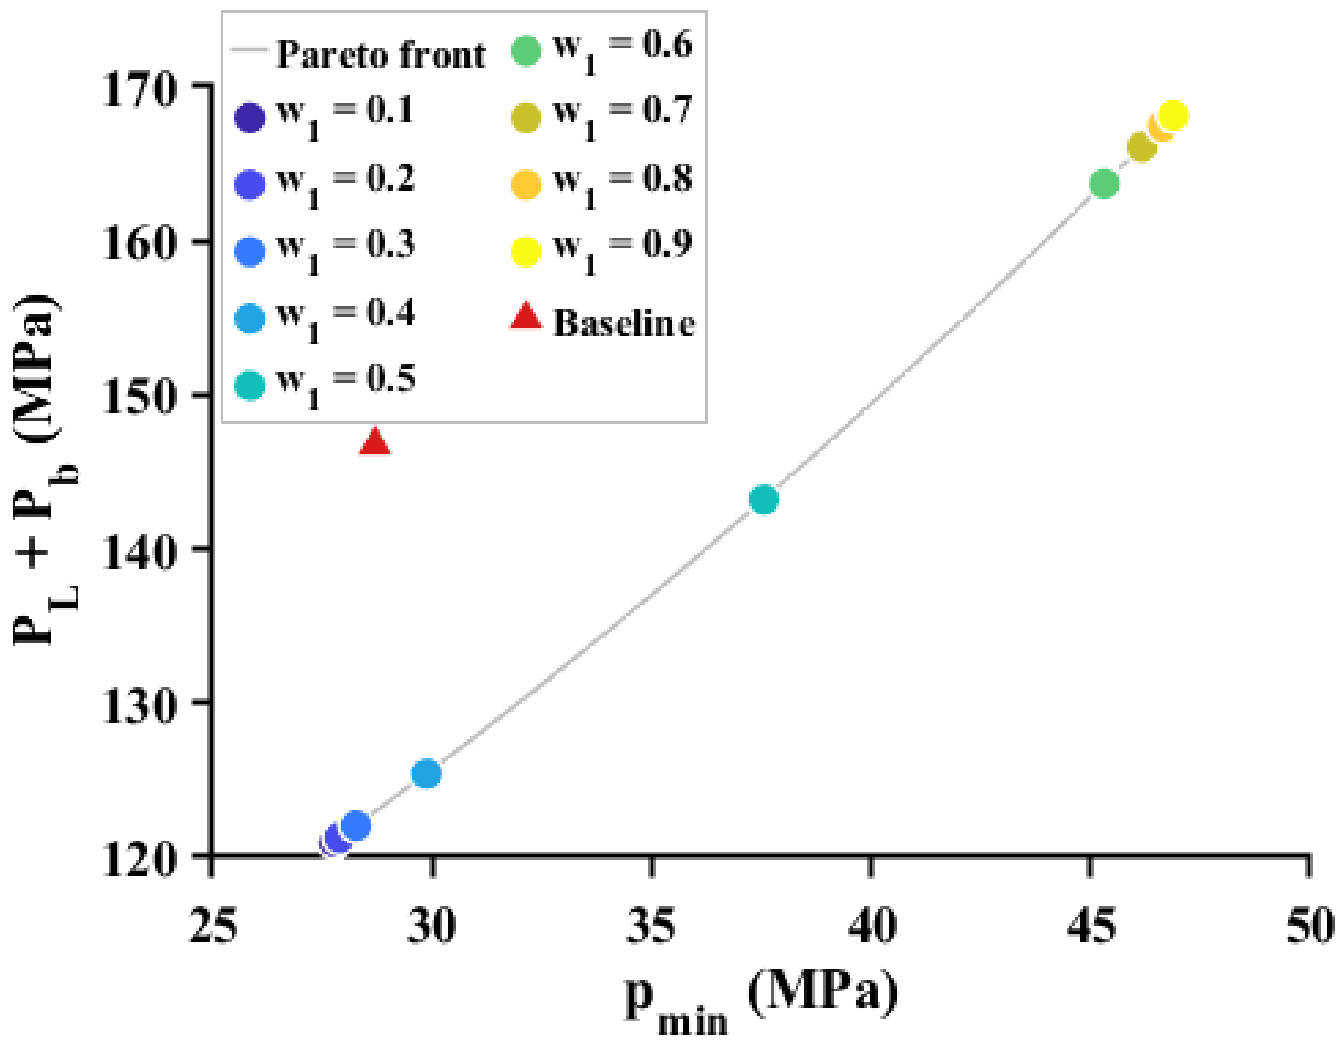
Figure 24.
Distribution of TOPSIS optimal solutions on the Pareto front under 9 weight combinations. The light-gray line denotes the Pareto front; colored circles represent the TOPSIS solutions for w1 = 0.1–0.9, progressing from purple to yellow as w1 increases; and the red triangle denotes the baseline condition.
Figure 24.
Distribution of TOPSIS optimal solutions on the Pareto front under 9 weight combinations. The light-gray line denotes the Pareto front; colored circles represent the TOPSIS solutions for w1 = 0.1–0.9, progressing from purple to yellow as w1 increases; and the red triangle denotes the baseline condition.
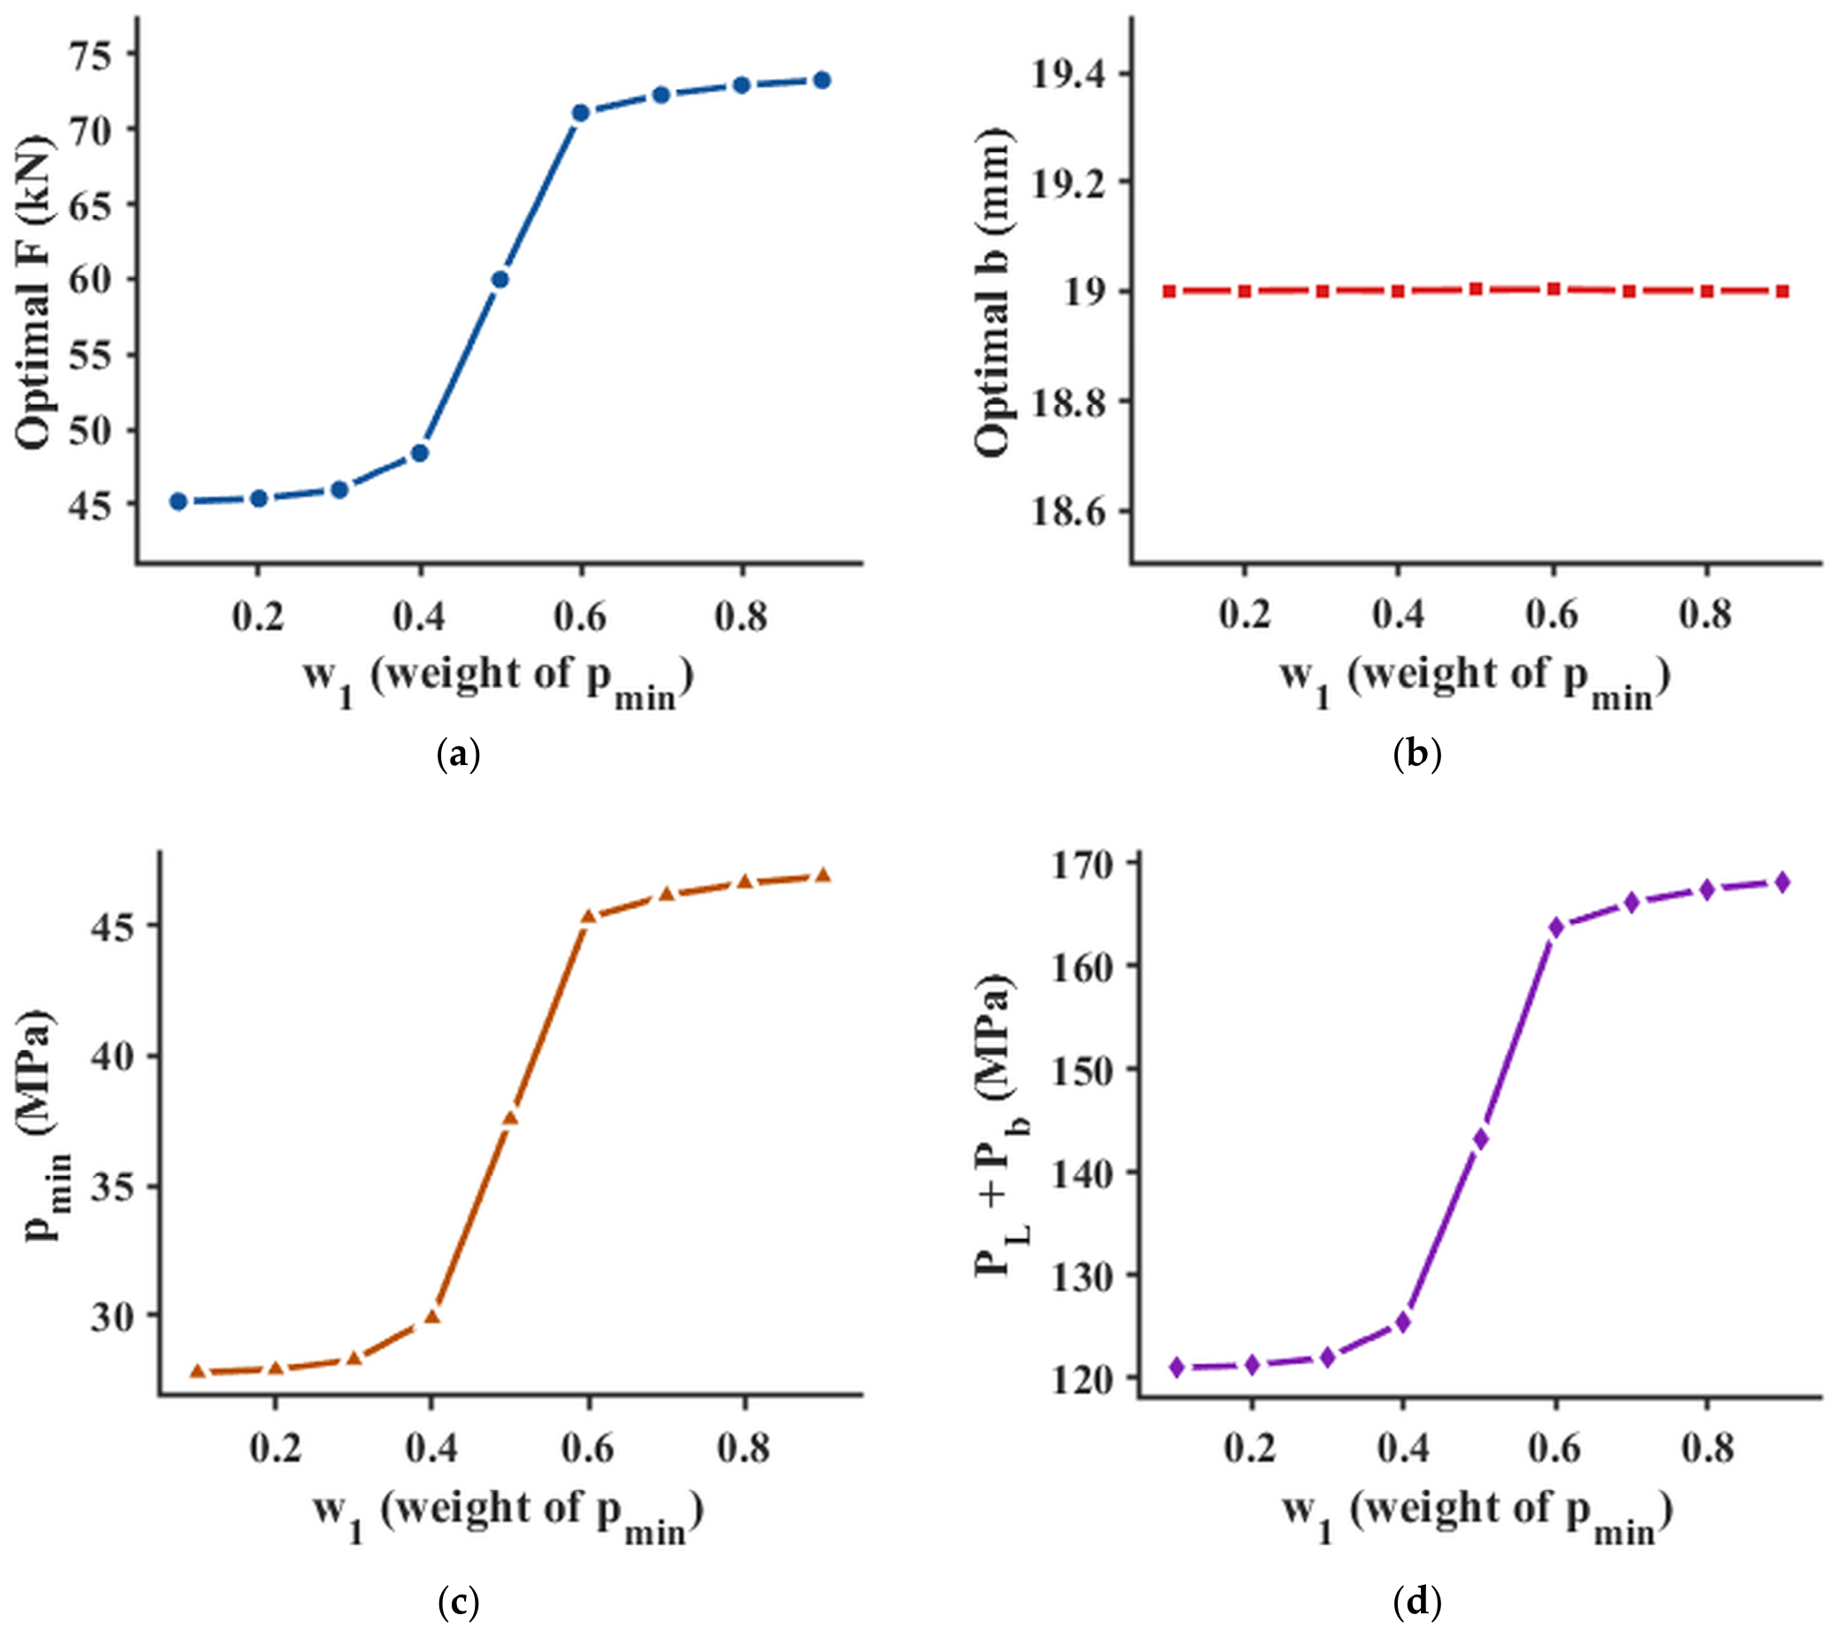
Figure 25.
Optimal design variables and responses as functions of weight w1: (a) optimal preload F; (b) optimal gasket width b; (c) ; (d) .
Figure 25.
Optimal design variables and responses as functions of weight w1: (a) optimal preload F; (b) optimal gasket width b; (c) ; (d) .
Table 1.
Principal geometric parameters of the flange–bolt–gasket system.
Table 1.
Principal geometric parameters of the flange–bolt–gasket system.
| Category | Parameter | Symbol | Value |
|---|
| Flange | Nominal diameter/Nominal pressure | DN/PN | 200 mm/4.0 MPa |
| Flange | Pipe inner/outer diameter | | φ200/φ219 mm |
| Flange | Flange outer diameter | D | φ375 mm |
| Flange | Bolt hole circle diameter | K | φ320 mm |
| Flange | Bolt hole diameter/quantity | /n | φ30 mm/12 |
| Flange | Total flange height/neck fillet radius | H/R | 138 mm/8 mm |
| Gasket | Inner/outer diameter (baseline) | — | φ230/φ278 mm |
| Gasket | Width/thickness | b/t | 24/4.5 mm |
| Bolt | Stud/nut specification | — | M27 × 160 double-end stud/M27 nut |
Table 2.
Temperature-dependent material properties of ASTM A105 flange.
Table 2.
Temperature-dependent material properties of ASTM A105 flange.
| Temperature (°C) | Thermal Expansion Coefficient (×10−6 °C−1) | Young’s Modulus (MPa) | Thermal Conductivity (W·m−1·°C−1) |
|---|
| 15 | 11.5 | 203,000 | 60.5 |
| 100 | 12.7 | 198,000 | 58.0 |
| 200 | 13.8 | 192,000 | 52.8 |
| 300 | 14.9 | 185,000 | 47.9 |
Table 3.
Temperature-dependent material properties of ASTM A193 B7 bolts and nuts.
Table 3.
Temperature-dependent material properties of ASTM A193 B7 bolts and nuts.
| Temperature (°C) | Thermal Expansion Coefficient (×10−6 °C−1) | Young’s Modulus (MPa) | Thermal Conductivity (W·m−1·°C−1) |
|---|
| 15 | 11.2 | 204,000 | 42.4 |
| 100 | 11.9 | 199,000 | 42.2 |
| 200 | 12.5 | 193,000 | 40.5 |
| 300 | 13.1 | 187,000 | 38.0 |
Table 4.
Compression curve of the gasket at various temperatures.
Table 4.
Compression curve of the gasket at various temperatures.
| Compression (mm) | 15 °C (MPa) | 100 °C (MPa) | 200 °C (MPa) | 300 °C (MPa) | 400 °C (MPa) |
|---|
| 0 | 0 | 0 | 0 | 0 | 0 |
| 0.2 | 6.4 | 5.8 | 5.4 | 4.3 | 3.8 |
| 0.4 | 15.2 | 13.2 | 12.1 | 10.7 | 9.1 |
| 0.8 | 48.9 | 44.5 | 40.4 | 37.2 | 34.9 |
| 1 | 78.7 | 74.1 | 68.3 | 63.3 | 59.7 |
| 1.1 | 105.6 | 99.3 | 93.5 | 87.5 | 82.4 |
| 1.2 | 140.1 | 133.2 | 125.8 | 117.4 | 112.5 |
| 1.3 | 185.6 | 176.3 | 166.1 | 156.9 | 149.2 |
Table 5.
Contact pair settings.
Table 5.
Contact pair settings.
| Contact Pair | Type | Friction Coefficient | FKN | Algorithm | Behavior |
|---|
| Gasket ↔ Upper flange | Frictional | 0.15 | 0.35 | Augmented Lagrange | Symmetric |
| Gasket ↔ Lower flange | Frictional | 0.15 | 0.35 | Augmented Lagrange | Symmetric |
| Upper nut ↔ Upper flange | Frictional | 0.15 | 0.10 | Augmented Lagrange | Symmetric |
| Lower nut ↔ Lower flange | Frictional | 0.15 | 0.10 | Augmented Lagrange | Symmetric |
| Upper nut ↔ Stud shank | Frictional | — | — | MPC | — |
| Lower nut ↔ Stud shank | Frictional | — | — | MPC | — |
Table 6.
Evaluation indicator framework.
Table 6.
Evaluation indicator framework.
| Indicator | Category | Criterion | Physical Significance |
|---|
| Objective ① | Maximize | Lower bound of sealing reliability |
| Objective ② | Minimize | Flange structural safety |
| Constraint ① | ≤210 MPa | Gasket crush prevention |
| Constraint ② | ≤580 MPa | Bolt yielding prevention |
| Constraint ③ | ≥12 MPa | ASME minimum seating stress (m·P) |
| Constraint ④ | ≤186 MPa | ASME VIII-2 1.5S limit |
| Auxiliary | — | Contact pressure uniformity |
| Auxiliary | ≥1.0 | Sealing margin |
Table 7.
Mesh independence verification schemes.
Table 7.
Mesh independence verification schemes.
| Scheme | Global Size (mm) | Gasket–Flange Contact (mm) | Nut–Flange Contact (mm) | Nut–Stud Contact (mm) | Flange Fillet (mm) |
|---|
| M1 | 8 | 2.0 | 2.2 | 4.5 | 4.5 |
| M2 | 6.5 | 1.7 | 2.0 | 4.0 | 4.0 |
| M3 | 5 | 1.3 | 1.5 | 3.0 | 3.0 |
| M4 | 4 | 1.0 | 1.2 | 2.5 | 2.5 |
| M5 | 3 | 0.8 | 1.0 | 2.0 | 2.0 |
Table 8.
Mesh independence verification results.
Table 8.
Mesh independence verification results.
| Scheme | Node Count | (MPa) | (MPa) | (MPa) |
|---|
| M1 | 60,962 | 28.669 | 31.947 | 370.96 |
| M2 | 82,534 | 28.687 | 31.962 | 417.44 |
| M3 | 143,849 | 28.700 | 31.972 | 476.98 |
| M4 | 186,442 | 28.710 | 31.979 | 486.24 |
| M5 | 251,022 | 28.713 | 31.982 | 491.52 |
Table 9.
Summary of benchmark validation errors (Level 1: bolt load vs. experiment; Level 2: high-temperature gasket contact pressure vs. reference FEM).
Table 9.
Summary of benchmark validation errors (Level 1: bolt load vs. experiment; Level 2: high-temperature gasket contact pressure vs. reference FEM).
| Validation Level | Compared Quantity | Condition | Reference Value | Simulated Value | Relative Error |
|---|
| Level 1 | | Ambient temperature, internal pressure 5 MPa | 22.15 KN (experimental) | 22.06 KN | −0.43% |
| Level 2 | at inner radius | 250 °C, internal pressure | 55.39 MPa | 54.59 MPa | −1.45% |
| Level 2 | at outer radius | 250 °C, internal pressure | 57.51 MPa | 58.15 MPa | +1.11% |
Table 10.
Sealing performance summary for the three loading steps under baseline conditions.
Table 10.
Sealing performance summary for the three loading steps under baseline conditions.
| Loading Step | (MPa) | (MPa) | (MPa) | Uniformity | Bolt Axial Force (N) |
|---|
| Step 1 | 35.173 | 40.245 | 37.523 | 0.937 | 60,932 |
| Step 2 | 31.480 | 38.257 | 34.688 | 0.907 | 69,317 |
| Step 3 | 28.700 | 35.513 | 31.972 | 0.898 | 64,986 |
Table 11.
Radial distribution of gasket contact pressure and temperature (Step 3, 300 °C condition).
Table 11.
Radial distribution of gasket contact pressure and temperature (Step 3, 300 °C condition).
| Point | Radial Position r (mm) | Contact Pressure P (MPa) | Temperature T (°C) |
|---|
| 1 | 115.0 | 28.70 | 300.00 |
| 2 | 117.7 | 29.36 | 292.69 |
| 3 | 120.3 | 30.10 | 285.64 |
| 4 | 122.9 | 31.00 | 282.88 |
| 5 | 125.6 | 31.70 | 283.41 |
| 6 | 128.2 | 32.40 | 280.37 |
| 7 | 130.8 | 33.10 | 278.04 |
| 8 | 133.5 | 33.90 | 275.86 |
| 9 | 136.1 | 34.70 | 273.84 |
| 10 | 139.0 | 35.50 | 271.13 |
Table 12.
ASME VIII-2 stress intensity assessment results for the flange (reported here as an engineering combined-load metric for optimisation screening; not a formal
vs.
shake-down assessment, see
Section 2.4).
Table 12.
ASME VIII-2 stress intensity assessment results for the flange (reported here as an engineering combined-load metric for optimisation screening; not a formal
vs.
shake-down assessment, see
Section 2.4).
| Assessment Item | Criterion | Simulated Value (MPa) | Allowable Value (MPa) | Safety Margin |
|---|
| General membrane stress | | 59.86 | 124 | 2.07 |
| Membrane-plus-bending stress | | 146.76 | 186 | 1.27 |
Table 13.
Design variable ranges.
Table 13.
Design variable ranges.
| Variable | Symbol | Lower Bound | Baseline | Upper Bound | Basis |
|---|
| Bolt pretension | F (N) | 45,000 | 60,000 | 75,000 | ASME VIII-1/II-D |
| Gasket width | b (mm) | 19 | 24 | 29 | Geometric constraint/uniformity |
Table 14.
CCD design matrix (9 training sample points + 3 independent validation points).
Table 14.
CCD design matrix (9 training sample points + 3 independent validation points).
| Type | ID | F (N) | b (mm) | x1 | x2 |
|---|
| CCD | C1 (corner) | 45,000 | 19 | −1 | −1 |
| CCD | C2 (corner) | 75,000 | 19 | +1 | −1 |
| CCD | C3 (corner) | 45,000 | 29 | −1 | +1 |
| CCD | C4 (corner) | 75,000 | 29 | +1 | +1 |
| CCD | A1 (axial) | 45,000 | 24 | −1 | 0 |
| CCD | A2 (axial) | 75,000 | 24 | +1 | 0 |
| CCD | A3 (axial) | 60,000 | 19 | 0 | −1 |
| CCD | A4 (axial) | 60,000 | 29 | 0 | +1 |
| CCD | M1 (center) | 60,000 | 24 | 0 | 0 |
| CCD | V1 | 52,000 | 21 | −0.53 | −0.60 |
| CCD | V2 | 68,000 | 27 | +0.53 | +0.60 |
| CCD | V3 | 55,000 | 26 | −0.33 | +0.40 |
Table 15.
Second-order RSM regression coefficients (coded space).
Table 15.
Second-order RSM regression coefficients (coded space).
| Response | β0 | β1 | β2 | β12 | β11 | β22 |
|---|
| 28.423 | 8.422 | −7.332 | −1.802 | 0.285 | 1.849 |
| 35.953 | 10.260 | −6.675 | −1.760 | 0.023 | 1.361 |
| 146.63 | 28.122 | 3.095 | 2.680 | 2.938 | −0.242 |
| 477.45 | 96.045 | −0.628 | 3.253 | 0.902 | 0.012 |
Table 16.
RSM goodness-of-fit summary.
Table 16.
RSM goodness-of-fit summary.
| Response | R2 | Adj-R2 | RMSE | F-Statistic | p-Value |
|---|
| 0.9988 | 0.9967 | 0.5647 | 481.82 | 1.49 × 10⁻⁴ |
| 0.9994 | 0.9984 | 0.4317 | 981.71 | 5.12 × 10⁻⁵ |
| 0.9999 | 0.9998 | 0.3777 | 6798.45 | 2.81 × 10⁻⁶ |
| 0.9998 | 0.9995 | 1.8348 | 3290.89 | 8.36 × 10⁻⁶ |
Table 17.
Kriging goodness-of-fit summary (training set).
Table 17.
Kriging goodness-of-fit summary (training set).
| Response | R2 (Training Set) | RMSE |
|---|
| 0.9988 | 0.3136 |
| 1.0000 | 0.0105 |
| 0.9980 | 1.0269 |
| 0.9990 | 2.4504 |
Table 18.
Absolute percentage error (APE) comparison of RSM and Kriging on the validation set.
Table 18.
Absolute percentage error (APE) comparison of RSM and Kriging on the validation set.
| Response | RSM MAPE (%) | Kriging MAPE (%) | Superior Model |
|---|
| 0.72 | 3.61 | RSM |
| 0.84 | 0.16 | Kriging |
| 0.97 | 0.83 | Kriging |
| 1.90 | 1.87 | Kriging |
Table 19.
Sobol global sensitivity indices.
Table 19.
Sobol global sensitivity indices.
| Response | | | | | Interaction |
|---|
| 0.5600 | 0.4315 | 0.5685 | 0.4400 | 0.0085 |
| 0.6955 | 0.2977 | 0.7023 | 0.3045 | 0.0068 |
| 0.9851 | 0.0119 | 0.9881 | 0.0149 | 0.0030 |
| 0.9996 | 0.0000 | 1.0000 | 0.0004 | 0.0004 |
Table 20.
Constraint activation diagnosis on the Pareto front.
Table 20.
Constraint activation diagnosis on the Pareto front.
| Constraint | Upper Limit | Critical Value on Front | Status |
|---|
| ≤ 580 MPa | 580 | 561.00 | Not activated |
| ≤ 210 MPa | 210 | 54.66 | Not activated |
| ≤ 186 MPa | 186 | 168.14 | Not activated |
| ≥ 12 MPa | 12 | 27.66 (min) | Not activated |
Table 21.
TOPSIS optimal solution and top-5 candidate solutions.
Table 21.
TOPSIS optimal solution and top-5 candidate solutions.
| Rank | F (N) | b (mm) | (MPa) | (MPa) | C |
|---|
| 1 | 59,942 | 19.00 | 37.56 | 143.20 | 0.5208 |
| 2 | 59,726 | 19.01 | 37.41 | 142.83 | 0.5206 |
| 3 | 60,010 | 19.01 | 37.60 | 143.31 | 0.5205 |
| 4 | 59,136 | 19.01 | 37.00 | 141.84 | 0.5204 |
| 5 | 60,230 | 19.01 | 37.74 | 143.69 | 0.5204 |
Table 22.
ANSYS back-substitution verification results.
Table 22.
ANSYS back-substitution verification results.
| Response | Baseline | RSM Prediction | ANSYS Verification | Improvement vs. Baseline | Prediction Error |
|---|
| (MPa) | 28.70 | 37.56 | 37.60 | +31.01% | +0.11% |
| (MPa) | 35.51 | 43.94 | 44.11 | +24.22% | +0.40% |
| (MPa) | 146.76 | 143.20 | 143.45 | −2.26% | +0.17% |
| (MPa) | 476.98 | 477.73 | 471.98 | −1.05% | −1.22% |