Article

Flexible Voltage Control Strategy for Photovoltaic Inverters in Distribution Networks Considering Dynamic Cluster Partitioning

State Grid Jiangsu Electric Power Co., Ltd. Research Institute, Nanjing 211103, China
*
Author to whom correspondence should be addressed.
Symmetry 2026, 18(7), 1127; https://doi.org/10.3390/sym18071127
Submission received: 22 May 2026 / Revised: 20 June 2026 / Accepted: 25 June 2026 / Published: 1 July 2026
(This article belongs to the Special Issue Symmetry with Power Systems: Control and Optimization)

Abstract

With the advancement of the carbon peaking and carbon neutrality goals, large-scale grid integration of photovoltaic (PV) systems has become a core trend in the development of distribution networks (DNs). However, this high penetration breaks the inherent spatiotemporal symmetry of power flow in traditional DNs, leading to severe spatiotemporal imbalance issues, including voltage violations, reverse power flow, and a sharp increase in network power loss. To address these challenges, an optimized flexible control method for PV inverters in DNs considering cluster partitioning is proposed in this paper. First, a comprehensive performance index system integrating improved modularity, source-load matching degree, and voltage sensitivity is constructed, which quantifies the electrical coupling symmetry and source-load power symmetry within clusters, providing a rigorous quantitative basis for dynamic cluster partitioning. Moreover, based on a dynamic monitoring mechanism, an improved Particle Swarm Optimization algorithm for cluster partitioning is proposed to achieve the optimal cluster partitioning of DN nodes and the selection of key control nodes. Finally, a Q-V flexible control model of the inverter adapted to cluster control is established; thus, an optimization model with the objectives of minimizing voltage deviation, PV curtailment loss, and PV reactive power output is constructed. The distributed and efficient solution is performed using the Alternating Direction Method of Multipliers algorithm and the GUROBI solver. Simulation results based on the modified IEEE 123-node test feeder show that, compared with traditional methods, the proposed method improves the cluster partitioning effectiveness, ensures that the operating voltage deviation of the control system is within 5%, and reduces the PV curtailment loss of the system.

1. Introduction

The integration of photovoltaic (PV) inverters into distribution networks (DNs) has introduced significant challenges and opportunities for voltage regulation, power sharing, and system stability. Traditional DNs operate under a relatively stable power flow symmetry with unidirectional power transmission from the substation to loads. However, large-scale distributed PV integration breaks this inherent symmetry, leading to bidirectional power flow and complex spatiotemporal power fluctuations. Flexible control has emerged as a widely adopted decentralized strategy for managing the active and reactive power output of PV inverters, enabling autonomous operation without extensive communication infrastructure [1,2]. However, as PV penetration increases, issues such as voltage violations, power losses, and the need for coordinated control become more pronounced [3,4]. To address the above issues, a clustering method and bus voltage control strategy are proposed to reconstruct local power symmetry and enhance the stability of active distribution systems.
The clustering method is used to divide the distribution network into zones considering electrical distance, modularity optimization, community detection, and so on. Ref. [5] divides the reactive and active clusters by improving the community algorithm, considering the power balance and node coupling degree. Ref. [6] proposes a cluster control method for distribution networks with high-penetration PV, which considers the electrical parameters of the distribution network, establishes an electrical weight matrix, and performs adaptive cluster partitioning for photovoltaic distribution networks based on the modularity optimal strategy. Ref. [7] takes active-reactive power complementary aspects as key indicators and incorporates node membership to construct a comprehensive partitioning metric, with enhanced learning modification factor and historical population-based search transfer mechanism to improve optimization performance. Ref. [8] proposes a cluster partition-based two-layer expansion planning method, which adopts a comprehensive cluster partition method considering electrical distance, cluster power balance, and cluster size. Through the clustering method, a DN-related structure is used for power balance to promote local self-sufficiency and reduce inter-cluster reactive flows [9,10]. Ref. [11] proposes an electricity load forecasting method combining PCA-PSO-Kmeans++ clustering with an improved depthwise separable convolution (DSC) integrated with an attention mechanism and residual connection, supported by comprehensive data preprocessing including seasonal decomposition. Ref. [12] explores an adaptive K-means clustering approach for segmenting 24 h load profiles, using Euclidean distance and Cosine similarity as distance measures and evaluating clustering validity via Davies–Bouldin Index, Calinski–Harabasz Index, Silhouette Coefficient, and three newly proposed metrics. Ref. [13] develops an agent-based model on the GAMA platform to predict regional electricity consumption in high-energy-intensity mixed-land-use urban areas, addressing urbanization-induced spatiotemporal and heterogeneity challenges by integrating urban environment, demographics, and energy policy factors. However, traditional clustering algorithms with most cluster partitioning indicators are difficult to simultaneously consider the spatiotemporal source-load matching characteristics and voltage regulation response characteristics, with problems of adapting to the discrete and strongly constrained optimization problem of DN cluster partitioning [5,14]. The bi-level programming approach for joint DG and energy storage planning proposed by Ref. [15] optimizes long-term asset configuration in active distribution networks, but the dynamic cluster division under real-time operation conditions was not taken into consideration.
Existing studies typically achieve bus voltage control in distribution networks by adjusting the active power-frequency (P-f) and reactive power-voltage (Q-V) flexible characteristics of photovoltaic (PV) inverters based on local measurements [16,17]. Ref [18] proposes a scalable decentralized control strategy for photovoltaic inverters in distribution networks, which computes optimal reactive power setpoints via an offline centralized CVaR-based chance-constrained optimal power flow considering PV and load uncertainties. However, regression-based techniques are black-box mappings whose internal representations may be difficult to interpret or validate against engineering requirements. In addition, a regression model trained on one distribution network topology may not transfer to another. Ref. [19] established a distributed control framework: the distributed layer optimizes the volt-var flexible control rate to minimize network loss, while the local layer adaptively adjusts reactive power output to suppress voltage violation and deviation. Ref. [20] proposes a strategy that combines cluster autonomous optimization and distributed inter-cluster coordination optimization for PV inverters. Ref. [21] proposes a multi-objective hierarchically coordinated VVC method with flexible-controlled PV inverters, aiming to minimize average bus voltage deviation and network power loss by optimizing PV inverter reactive power setpoints and flexible control functions simultaneously. Ref. [22] optimizes central inverter reactive power setpoints and local flexible functions simultaneously to realize optimal coordination of the two hierarchies under stochastic PV power generation and load variations. Ref. [23] proposes a novel two-stage stochastic Conservation Voltage Reduction technique for integrated electricity and natural gas systems. After considering uncertainties in the forecasted load and PV power generation, reactive power adjustments from smart inverters through droop control are determined in the second stage. Ref. [24] proposes a hybrid SO-CCG-DLNN approach for droop control-based Battery Storage Systems with hybrid renewable energy sources, which aims to control the state of charge and improve battery power efficiency by integrating renewable energy projection and electricity consumption uncertainty. Ref. [25] presents a multi-functional grid-forming energy router (GFMER) for renewable energy harvesting and reliable electricity supply in industrial microgrids, along with a hierarchical proactive control approach that features an optimized multi-objective droop control mechanism in the lower layer to coordinate PV systems. However, the inherent high computational burden and decoupled execution process between the flexible control function and practical regulation implementation lead to low efficiency in practical voltage regulation scenarios [26,27].
To this end, a flexible voltage control strategy for distributed PVs in DN considering dynamic cluster partitioning is proposed in this paper. The research is divided into the following parts: First, a comprehensive performance index system is constructed to realize efficient dynamic cluster partitioning of the DN. Second, based on a dynamic monitoring mechanism, an improved PSO algorithm for cluster partitioning is proposed to achieve the optimal cluster partitioning of DN nodes and the selection of key control nodes. Third, a flexible control model of the inverter adapted to cluster hierarchical control is established. Taking the rated voltage of the cluster control center as the control objective, the proportional optimal allocation of the reactive power output of PV inverters in the cluster is realized based on the reactive power-voltage sensitivity matrix. Finally, an optimization model with the objectives of minimizing voltage deviation, PV curtailment loss, and PV reactive power output is constructed, and the distributed and efficient solution is performed using the GUROBI solver and ADMM. Numerical examples demonstrate that the proposed method significantly improves the operational economy and voltage stability of the system.
The main contributions of this paper are summarized as follows:
(1)
A comprehensive performance index system integrating improved modularity, source-load matching degree, and voltage sensitivity is constructed for dynamic cluster partitioning of DNs.
(2)
An improved Dynamic Damped Particle Swarm Optimization algorithm for cluster partitioning based on a dynamic monitoring mechanism is proposed. Through the adaptive improvement for discrete variables and the hierarchical infeasible solution repair strategy tailored to DN operation constraints, the proposed algorithm achieves the global optimal cluster partitioning of DN nodes and accurate selection of key control nodes.
(3)
A Q-V flexible control model of PV inverters adapted to cluster hierarchical control is established. A system optimization model with the goals of minimizing voltage deviation, PV curtailment loss, and PV reactive power output is constructed, and the distributed solution of the model is realized based on the ADMM algorithm and GUROBI solver. Without relying on global centralized control, the proposed method can obtain the globally optimal flexible control parameters through autonomous optimization within clusters and collaborative iteration between clusters.

2. Basic Framework

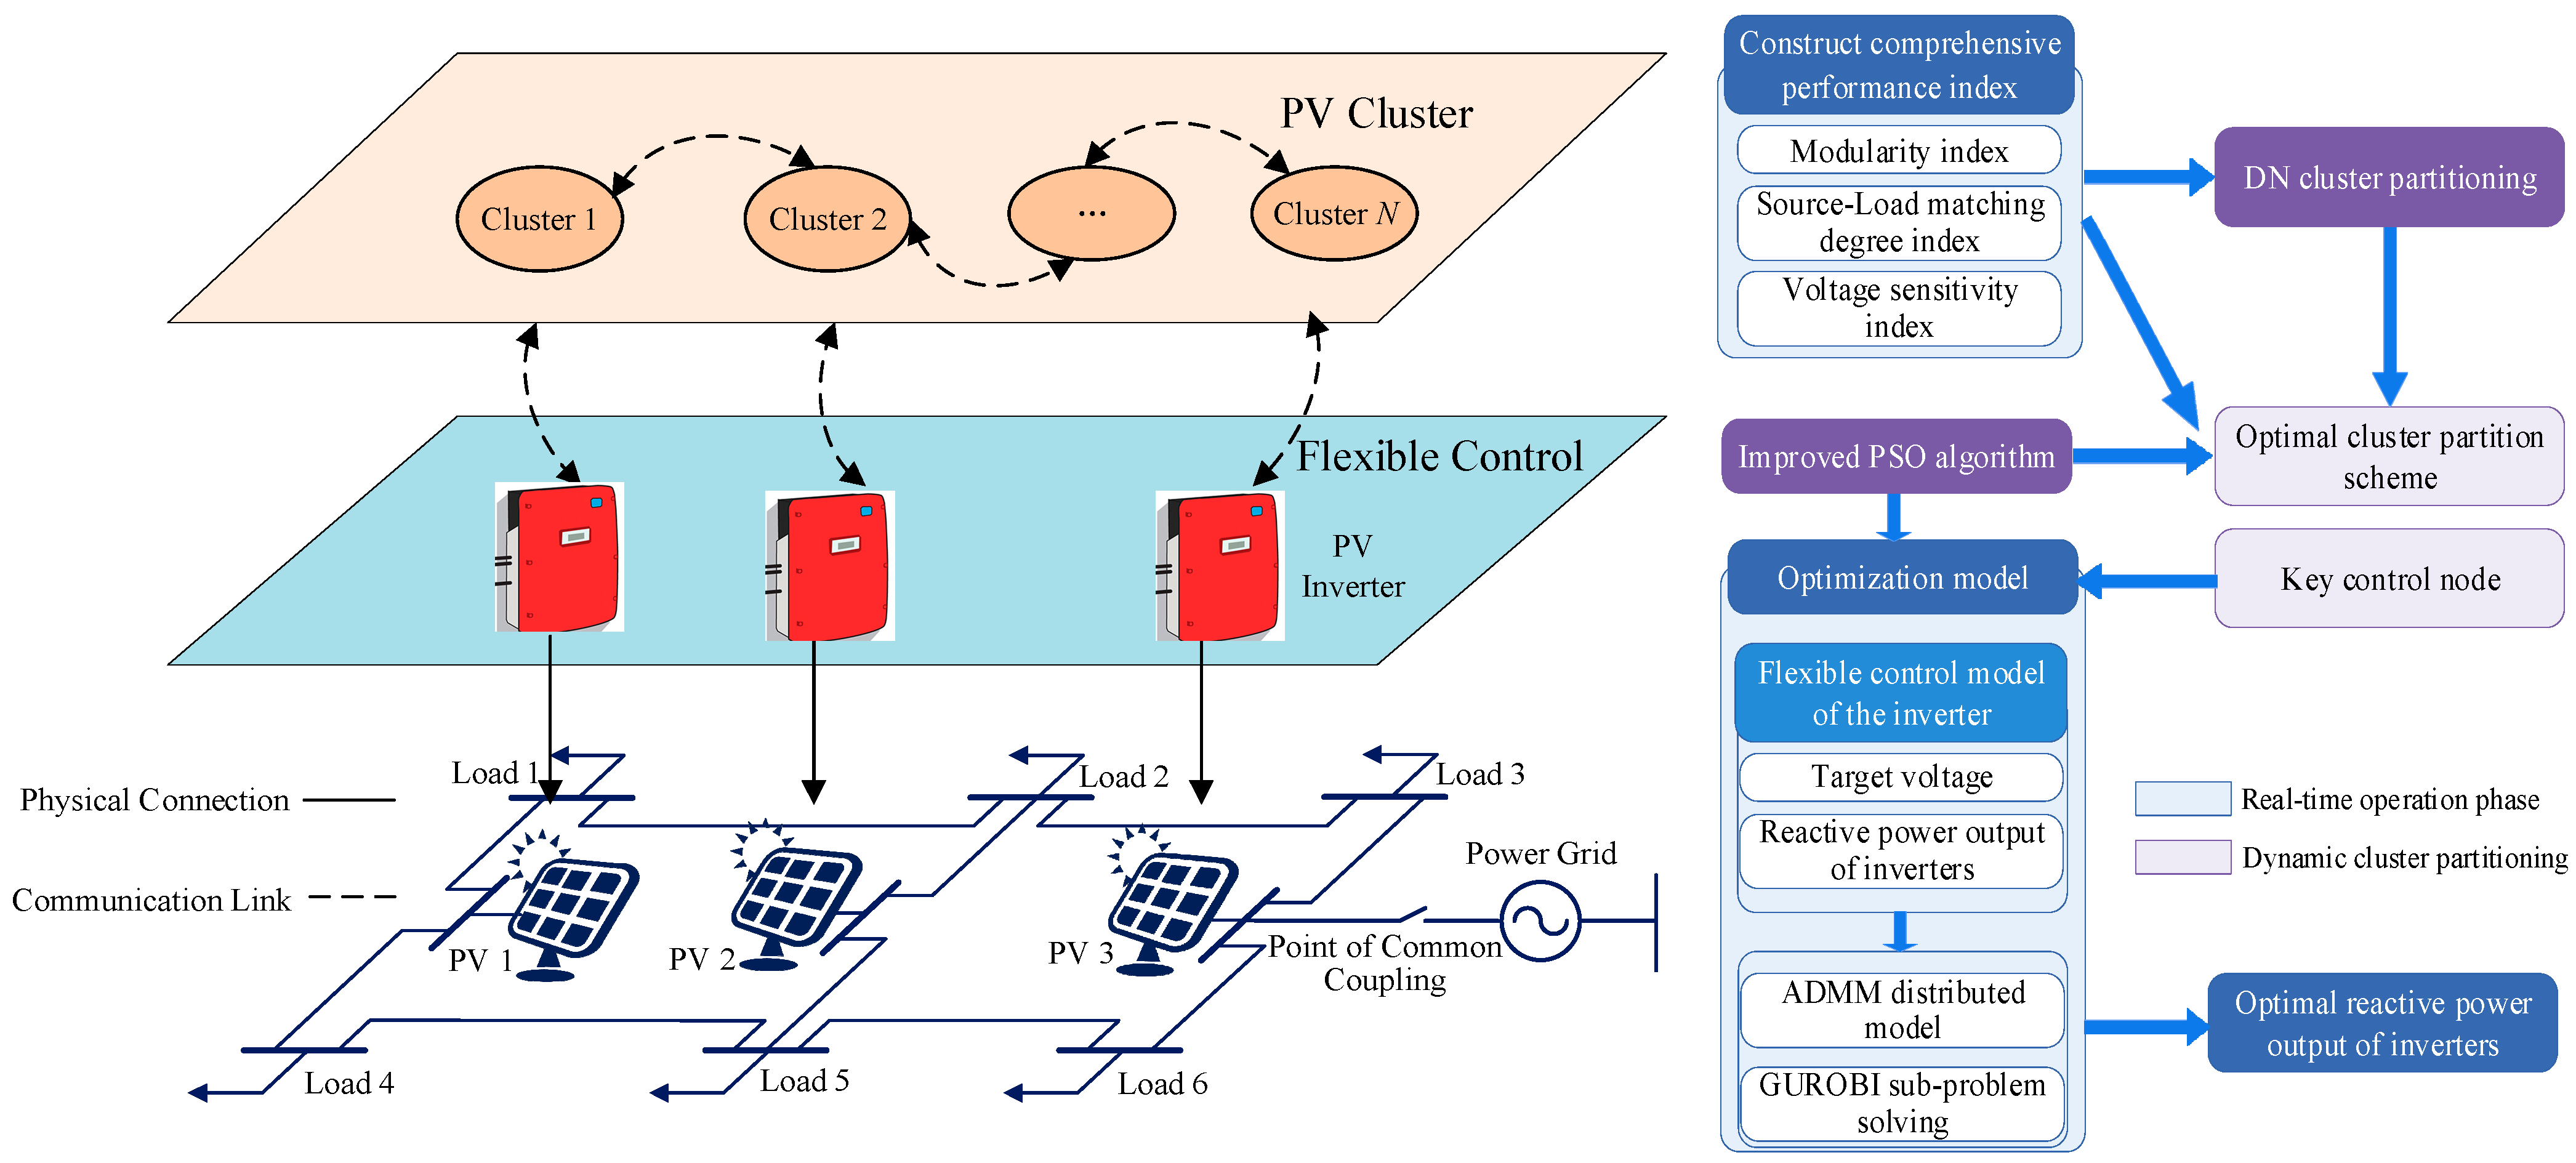
In this paper, a DN station area with distributed PV and loads is studied. The system structure and flow chart are shown in Figure 1. The station area is divided into K PV clusters, each of which contains several distributed PV units and loads. Considering the real-time performance of regulation, the PV inverter of each cluster is taken as the core of cluster control to realize the coordinated regulation of source and load within the cluster.
In the real-time operation phase, a comprehensive performance index is constructed, and the reactive power output of PV inverters within each cluster is determined based on the cluster partitioning results. When the proposed dynamic monitoring mechanism is satisfied, cluster partitioning and control node selection are re-performed.

3. Indexes for Dynamic Cluster Partitioning of Distribution Networks

The fundamental goal of dynamic cluster partitioning for distribution networks is to enable zonal regulation with compact topological structure, coordinated functional capabilities, and superior regulation efficiency, all of which depend on the maintenance of topological, functional, and power symmetry in local zones. To this end, this paper proposes a comprehensive index system tailored for dynamic cluster partitioning that accounts for electrical connectivity, source-load supply-demand matching, and regulation response characteristics, providing a rigorous quantitative basis for achieving balanced and symmetric cluster partitioning.

3.1. Modularity Index

The basis of cluster partitioning is to ensure tight electrical coupling between nodes within the same cluster and weak coupling between different clusters. The traditional modularity index is constructed based on physical distance, which is difficult to reflect the actual electrical correlation between DN nodes. Therefore, an improved modularity index based on electrical distance in period t (t = 1, 2, …, T, T is the total number of time periods) is introduced in this paper, which is defined as Equation (1):
μ mod , t = 1 2 M t a = 1 N b = 1 N w a b φ a , t φ b , t 2 M t δ a b , t
where N is the total number of DN nodes; wab is the edge weight between node a and node b, which characterizes the electrical connection strength between the two nodes and is comprehensively determined by line impedance and power flow distribution characteristics, i.e., wab = 1/Zab (Zab is the line impedance between node a and b); Mt is the sum of all edge weights of the DN; φ a , t and φ b , t are the sum of all edge weights connected to node a and b, respectively; δab,t is the cluster membership indicator variable, where δab,t = 1 if node a and b belong to the same cluster, otherwise δab,t = 0; μ mod , t ∈ [0, 1], and a larger value indicates tighter electrical coupling within clusters, weaker electrical interference between clusters, and better partitioning performance.

3.2. Source-Load Matching Degree Index

The source-load matching degree index is used to evaluate the spatiotemporal matching characteristics between PV output and load demand within a cluster. It is constructed from two dimensions: power amplitude balance and time-series deviation synergy, to realize comprehensive quantification of source-load characteristics. The specific calculation steps are as follows:
(1)
Calculation of the source-load power balance index
The power amplitude balance characterizes the amplitude matching degree between the total PV output and load demand of a cluster in a certain period, which is defined as:
η n , t mag = 1 P PV , n , t P L , n , t max ( P PV , n , t , P L , n , t )
where n is the cluster number (n = 1, 2, …, Kt, Kt is the total number of clusters); τ last is the time period at which the last cluster partitioning was executed; η ¯ n , t mag = 1 / t τ = τ last t η n , τ mag is the average power amplitude balance of the n-th cluster from τ last to period t; PPV,n,t is the total PV output of the n-th cluster in period t; PL,n,t is the total load demand power of the n-th cluster in period t; η n , t mag ∈ [0, 1], and a value closer to 1 indicates better amplitude matching of the source-load power of the cluster in this period.
(2)
Calculation of the time-series deviation synergy index
The time-series deviation synergy characterizes the deviation synchronization between PV output and load demand in the time series, which is calculated using the Pearson correlation coefficient:
η n , t tem = τ = τ last t ( P PV , n , τ P ¯ PV , n ) ( P L , n , τ P ¯ L , n ) τ = τ last t ( P PV , n , τ P ¯ PV , n ) 2 τ = τ last t ( P L , n , τ P ¯ L , n ) 2
where P ¯ PV , n = 1 / t τ = τ last t P PV , n , τ is the average PV output of the n-th cluster from τ last to period t; P ¯ L , n = 1 / t τ = τ last t P L , n , τ is the average load demand power of the n-th cluster from τ last to period t; η n , t tem ∈ [0, 1], and a value closer to 1 indicates more synchronized time-series deviation between PV output and load demand, as well as better source-load synergy.
(3)
Calculation of the comprehensive source-load matching degree index
The comprehensive source-load matching degree in period t is obtained by weighting the time-series average of power amplitude balance and the time-series deviation synergy:
η n , t = α mag η ¯ n , t mag + α tem η n , t tem
where α mag and α tem are weight coefficients.

3.3. Voltage Sensitivity Index

The voltage sensitivity index is used to evaluate the response capability of a node to voltage regulation within the cluster, i.e., the influence of the power injection change of a node on the voltage of other nodes in the cluster, which provides a basis for the selection of key control nodes. The voltage sensitivity matrix is derived based on the P-Q power flow decomposition method. The relationship between node voltage and power injection of the DN can be linearized by the power flow Equation (5):
Δ V t = M P t Δ P t + M Q t Δ Q t
where ΔVt = [ΔV1,t, ΔV2,t, …, ΔVN,t]TRN is the node voltage increment vector (per unit value) in period t; ΔPt = [ΔP1,t, ΔP2,t, …, ΔPN,t]TRN is the active power injection increment vector of nodes in period t; ΔQt = [ΔQ1,t, ΔQ2,t, …, ΔQN,t]TRN is the reactive power injection increment vector of nodes in period t; MPtRN×N and MQtRN×N are the active and reactive voltage sensitivity matrices in period t, respectively, where the elements MPij,t and MQij,t represent the voltage variation of node j when the active/reactive power injection of node i changes by 1 unit in period t.
To unify the value range of the index, the absolute values of all sensitivity elements are normalized by max-min normalization to eliminate the difference in numerical magnitude:
G i j , t = | M P i j , t | + | M Q i j , t | G t max
where G t max is the maximum value of | M P i j , t | + | M Q i j , t | of all node pairs in the whole DN in period t, G i j , t ∈ [0, 1], and a larger value indicates a stronger influence of the power change of node i on the voltage of node j in period t. Then, for the n-th cluster, the cluster voltage sensitivity index Gn,t is defined as the average value of voltage sensitivity between all nodes in the cluster:
G n , t = 1 | Ω n , t | 2 i Ω n , t j Ω n , t G i j , t
where Ωn,t is the node set of the n-th cluster in period t; | Ω n , t | is the number of nodes in the n-th cluster in period t; Gn,t ∈ [0, 1], and a larger value indicates a stronger correlation of voltage response between nodes in the cluster, and efficient optimization of the voltage of the whole cluster can be realized through regulation of the cluster central node.

3.4. Comprehensive Performance Index

To realize multi-objective optimization of cluster partitioning, a comprehensive performance index Jn,t is constructed by fusing modularity, source-load matching degree, and voltage sensitivity index:
J n , t = α mod μ mod , n , t + α η η n , t + α S G n , t
where α mod , α η , and α S are index weights. The objective of cluster partitioning is to maximize the average value of the comprehensive performance indexes of all clusters:
ψ t = n = 1 K t J n , t / K t

3.5. Determination of Two-Level Indicator Weights

Direct subjective assignment of weights lacks scientific basis and verifiability, and cannot handle the logical consistency problem among multiple indicators. As a mature multi-attribute decision-making method, the Analytic Hierarchy Process (AHP) transforms complex decision-making problems into a hierarchical structure, converts expert qualitative judgments into quantitative weight coefficients, and ensures the rationality of judgment logic through a consistency check, which has been widely used in power system planning and operation [28].
This paper constructs a two-level AHP weight system: the first-level weights correspond to the three comprehensive performance indicators in Section 3.4, and the second-level weights correspond to the two sub-indicators of source-load matching degree in Section 3.2. This system can not only scientifically quantify the relative importance of different indicators, but also ensure the repeatability and logical consistency of the weight determination process, avoiding the arbitrariness of subjective assignment.
Five senior experts in the field of distribution network operation and control are invited to conduct independent pairwise comparison scoring using the Saaty 1–9 scale method. The pairwise comparison judgment matrix A1 for the sub-indicators of source-load matching degree is constructed:
A 1 = 1 1 / 3 3 1
where the row/column order is: 1-Power Balance Degree, 2-Time-series deviation Synergy.
The calculation process of indicator weights includes constructing the pairwise comparison judgment matrix, performing column-wise normalization, conducting row-wise summation, normalizing the row sums to obtain the weight vector, calculating the maximum eigenvalue, and carrying out the consistency check [28]. Finally, the weights of the two indicators, power balance degree and time-series deviation synergy, are obtained as 0.25 and 0.75, respectively.
Similarly, the pairwise comparison judgment matrix A2 for the comprehensive performance index is constructed:
A 2 = 1 2 4 1 / 2 1 3 1 / 4 1 / 3 1
where the row/column order is: 1-Modularity Index, 2-Source-load Matching Degree Index, 3-Voltage Sensitivity Index.
Finally, the weights of the three indices, modularity, source-load matching degree, and voltage sensitivity index, are obtained as 0.56, 0.32, and 0.12, respectively.
Compared with conventional modularity-based metrics that only consider the topological electrical coupling strength between nodes, the proposed comprehensive performance index explicitly quantifies the spatiotemporal power supply-demand symmetry within each cluster—a capability that purely topology-based modularity metrics fundamentally lack. In addition, the voltage sensitivity index introduces the voltage regulation response dimension, ensuring that nodes within the same cluster not only have strong electrical coupling but also exhibit high mutual voltage controllability, which directly enhances the efficiency of subsequent reactive power regulation. Moreover, the AHP-based weighting mechanism provides a systematic and verifiable method for balancing these three heterogeneous objectives, unlike conventional methods that either rely on a single metric or use ad hoc weighted sums without rigorous justification.

4. Cluster Partitioning and Key Node Selection

To adapt to the spatiotemporal deviation characteristics of source-load output in the distribution network, a dynamic monitoring mechanism for the improved modularity index is introduced. The dynamic cluster monitoring index Δ ψ t is defined as the core criterion for cluster re-partitioning, with the calculation formula:
Δ ψ t = ψ t ψ t 1 ψ t 1
A re-partitioning threshold Δ ψ th for the modularity index variation is set. When Δ ψ t > Δ τ th is satisfied, it is determined that the comprehensive characteristics of the current cluster partitioning scheme have changed significantly, and the cluster re-partitioning process of the distribution network is triggered. If Δ ψ t Δ ψ th , the current partitioning scheme and key control nodes are retained, and only the reactive power allocation coefficient of flexible control is updated.
Based on the comprehensive performance index system for cluster partitioning constructed in Section 3, the DN cluster partitioning problem is transformed into a multi-attribute combinatorial optimization problem with strong engineering constraints in this paper.
For the scenario with N nodes and a preset total number of clusters Kt in period t, the cluster membership decision matrix is defined as:
U t = [ u i , n , t ] N × K t
where ui,n,t ∈ {0, 1} is a binary decision variable, ui,n,t = 1 if node i belongs to the n-th cluster in period t, otherwise ui,n,t = 0.

4.1. Constraint Conditions

Combined with the physical operation characteristics of the DN and the engineering feasibility of cluster regulation, four types of constraints are set on the basis of satisfying the cluster membership decision of Equation (13):
(1)
Constraint of membership
Each node belongs to one and only one cluster, i.e.,
n = 1 K t u i , n , t = 1 , i = 1 , 2 , N
(2)
Constraint of cluster scale
To avoid the sharp increase in regulation complexity caused by oversized clusters and the loss of zonal regulation value caused by undersized clusters, the upper and lower limits of the number of nodes in a single cluster are set to ensure the balance of cluster scale, i.e.,
N min | Ω n , t | N max , n = 1 , 2 , K t
where Nmin and Nmax are the minimum and maximum number of nodes in a single cluster, respectively.
(3)
Constraint on cluster number
To avoid the regulation difficulties caused by an excessively small or large number of clusters, a constraint on the cluster number is imposed:
K min K t K max
where Kmin and Kmax are the minimum and maximum allowable number of clusters, respectively.
(4)
Constraint of PV nodes
To ensure that each cluster has autonomous voltage regulation capability, each cluster contains at least one distributed PV node to ensure the implementability of the flexible control method, i.e.,
Ω n , t Ω PV 0
where Ω n , t is the set of nodes of cluster n in period t; and Ω PV is the set of distributed PV nodes of the DN.

4.2. Improved PSO Algorithm

The Particle Swarm Optimization (PSO) algorithm realizes optimal solution search by simulating the group cooperative behavior of bird foraging, which has the characteristics of simple principle, fast convergence speed, and strong universality [29]. This paper proposes a Dynamic Damped Particle Swarm Optimization (DDPSO) algorithm to achieve the global optimal cluster partitioning of distribution network nodes and the accurate selection of key control nodes. By mapping the cluster membership directly into the integer-coded particle position, the encoding-decoding overhead required by continuous optimization algorithms is avoided. The infeasible solutions generated during PSO iterations can be efficiently projected back to the feasible region using the three-stage repair mechanism, which is more straightforward than penalty-based or dominance-based constraint handling in other metaheuristics.
The position vector of each particle in the population is defined as an N-dimensional integer vector S = [s1, s2, …, sN], where N is the total number of DN nodes, and si ∈ {1, 2, …, Kt} represents the cluster number to which node i belongs. The particle velocity vector in the discrete space is redefined as V = [v1, v2, …, vN], where vi represents the change tendency of the cluster membership of node i, with a value range of [−vmax, vmax], and vmax is the maximum velocity threshold. Combined with the characteristics of discrete coding, the improved velocity update formula is:
v i , ε + 1 = ω ε v i , ε + c 1 r 1 ( p best , i s i , ε ) + c 2 r 2 ( g best , i s i , ε ) ω ε = ω ε 1 ω damp , ω 0 = 1
where ω ε is the inertia weight at iteration ε , ω damp is the inertia weight damping factor; c1 and c2 are the individual learning factor and social learning factor, respectively, r1 and r2 are random numbers uniformly distributed in the interval [0, 1]; pbest,i is the cluster number of node i in the individual historical optimal solution of the particle, and gbest,i is the cluster number of node i in the global historical optimal solution of the population. Based on the updated velocity, the discrete position update rules are designed as follows:
(1) If | v i , ε + 1 | > λ ( λ is the membership change threshold), the update is performed according to the probability rule: when v i , ε + 1 > 0, v i , ε + 1 is updated to gbest,i with probability P1 = | v i , ε + 1 | / v max , and updated to pbest,i with probability 1 − P1; when v i , ε + 1 < 0, random cluster number assignment is performed with probability P2 = 0.5 to enhance population diversity.
(2) If | v i , ε + 1 | λ , then s i , ε + 1 = s i , ε , and the current cluster membership remains unchanged.
To further enhance the algorithm’s capability to escape local optima and ensure global convergence in the strongly constrained combinatorial search space, an adaptive Cauchy perturbation operator is introduced right after the discrete position update step. It integrates population diversity regulation, iterative scale control, and elite guidance into a unified formulation to comprehensively boost the global search performance.
The perturbation applied to each particle’s cluster assignment is defined as:
s i , ε + 1 = round s i , ε + 1 + Cauchy 0 , 1 ε ε max max 0 , 1 D ( t ) D th g best , i s i , ε + 1
where s i , ε + 1 is the perturbed position; Cauchy ( ) denotes a random sample from the Cauchy distribution whose heavy-tailed property enables large-scale jumps to break through local optimum traps. The perturbation scale is jointly regulated by iteration progress and population diversity D(t): when population diversity drops below the threshold Dth, the amplitude automatically increases to disperse converged particles; as iterations proceed, the scale decays linearly to balance early global exploration and late local exploitation. The round ( ) function ensures the output remains an integer cluster label, consistent with the discrete coding scheme. D(t) is defined as:
D ( t ) = 1 M N i = 1 M j = 1 N I s i , j , ε g best , i
where M is the population size of DDPSO; s i , j , ε is the cluster label of node i in particle j at iteration ε ; I ( ) is the indicator function, which takes the value 1 when the condition in the bracket holds, and 0 otherwise.
After perturbation, the hierarchical infeasible solution repair strategy is executed to guarantee all solutions satisfy practical engineering constraints. A hierarchical infeasible solution repair strategy is designed to directionally repair the infeasible solutions generated during the iteration process, ensuring that all solutions meet the engineering constraints. The specific steps are as follows:
(1) Repair of regulation resource constraints. All clusters are traversed. If a cluster has no distributed PV grid-connected node, the PV node with the closest electrical distance to the cluster and its connected nodes are divided into the cluster to ensure that each cluster has adjustable PV resources.
(2) Repair of cluster scale constraints. For small-scale clusters with the number of nodes less than Nmin, the whole cluster is merged into the adjacent cluster with the closest electrical coupling; for ultra-large-scale clusters with the number of nodes greater than Nmax, secondary splitting is performed based on the improved modularity index to ensure that the number of nodes in all clusters meets the upper and lower limit constraints.
(3) Verification of unique membership constraint. The uniqueness of cluster membership of all nodes is finally verified, and the unique membership cluster is determined for nodes with repeated membership according to the principle of optimal comprehensive index.

4.3. Key Control Nodes Selection

To accurately characterize the electrical distance between nodes, the electrical distance matrix DRN×N is defined, where the matrix element dij,t (electrical distance between node i and j in period t) is cooperatively characterized by the active voltage sensitivity and reactive voltage sensitivity:
d i j , t = ( M P i j , t ) 2 + ( M Q i j , t ) 2
The electrical density ρ i , t of node i is defined as ρ i , t = j = 1 N 1 / d i j , t , and the Kt nodes with the lowest electrical density are selected as the initial clustering centers.
The complete steps of the proposed DDPSO algorithm for solving the DN cluster partitioning problem are shown in Algorithm 1:
Algorithm 1. Flow of the DDPSO algorithm for cluster partitioning.
Input :   Network   topology ,   source - load   data ,   voltage   sensitivity   matrix   MP ,   MQ ,   re - partitioning   threshold   Δ ψ th ,   cluster   range   K min ,   K max ,   cluster   size   limits   N min ,   N max ,   DDPSO   parameters   ( cited   from   Ref .   [ 29 ] :   ε max   =   100 ,   population   size   M =   25 ,   c 1   =   1 , c 2   =   2 ,   ω damp = 0.99), membership change threshold λ
Output: Global optimal cluster partition scheme, optimal cluster comprehensive performance index, key node set
1: Initialize population S = [s1, s2, …, sN]
2: for each particle si do
3:   Repair infeasible solution
4 : Calculate   fitness   ψ t in Equation (9)
5 : Filter   p best , i ,   g best , i
6: end for
7 :   for   ε = 1   to   ε max do
8 :   ω ω × ω damp
9 :   for   each   particle   s i in S do
10:     for i = 1 to N do
11 :   r 1 , r 2 ~ U ( 0 , 1 )
12 :   v i , ε + 1 = ω ε v i , ε + c 1 r 1 ( p best , i s i , ε ) + c 2 r 2 ( g best , i s i , ε )
13:     end for
14:     for i = 1 to N do
15:       if ∣vi,t+1∣ > λ then
16 :   if   v i , ε + 1 > 0 then
17 :   v i , ε + 1   is   updated   to   g b e s t , i   with   prob .   | v i , ε + 1 | / v max , else pbest,i
18:         else
19 : S i , ε + 1 = randint ( 1 , K t ) with prob. 0.5
20:         end if
21:       end if
22:     end for
23:     for i = 1 to N do
24 :   update   s i , ε + 1   with   s i , ε + 1 = round s i , ε + 1 + Cauchy 0 , 1 ε ε max max 0 , 1 D ( t ) D th g best , i s i , ε + 1
25:     end for
26 :   Repair   infeasible   solution ,   calculate   fitness   ψ i , t of solution i
27 :   if   ψ i , t   >   p best , i . fit   ( p best , i . fit   is   the   fitness   of   p best , i ) then
28 :   p best , i s i , t
29:     end if
30:   end for
31 :   if   p best , i . fit > g best , i . fit   ( g best , i . fit   is   the   fitness   of   g best , i ) then
32 :   g best , i p best , i ,   g best , i . fit p best , i . fit
33:   end if
34 :   if   g best , i . fit unchanged for 10 generations then break
35: end for
36 :   Select   all   best   positions   g best , i , select key nodes by electrical density

5. System Optimization Model

5.1. Objective Function and Constraints

Based on the above flexible control function model, a flexible control optimization problem based on PV cluster partitioning is proposed in this paper. The objective is to minimize voltage deviation, PV curtailment loss, and PV reactive power output by controlling the PV inverters at the key control nodes. By solving this problem, the optimal reactive power output setpoints of the centrally controlled inverters and the optimal flexible functions for local control can be obtained by the optimizer.
The objective function of the PV flexible control model in cluster n in period t is shown in Equation (22):
min F n , t = σ 1 Δ V avg , n , t + ( 1 σ 1 ) [ σ 2 P cur , n , t + ( 1 σ 2 ) Q PV , n , t ]
where σ 1 and σ 2 are the adjustable weights used to adjust the importance of voltage and PV loss; Δ V avg , n , t is used to quantify the extent of voltage deviation in cluster n; P cur , n , t is the curtailment of PV nodes in cluster n in period t; and Q PV , n , t is the reactive power output of PV nodes in period t, which satisfies
Δ V avg , n , t = 1 | Ω n , t | i = 1 | Ω n , t | χ V i , t V N Δ V lim P cur , n , t = i = 1 | Ω PV , t | P PV , i , t actual P PV , i , t Q PV , n , t = i = 1 | Ω PV , t | | Q i , n , t |
where all variables in Equation (23) are expressed in per-unit values. Vi,t is the actual voltage of node i in period t, which is calculated by the DistFlow method [30]; VN is the rated voltage of the node; Δ V lim is the allowable limit; P PV , i , t actual and P PV , i , t are respectively defined as the actual active power and the accommodated active power of the PV i in period t; and Q i , n , t is the reactive power output regulation instruction of the i-th PV inverter in cluster n in period t, which is allocated using a flexible control method, as follows.
For the n-th cluster, let the control center node selected by the method in Section 4 be Cn. When the voltage of the control center node deviates from the rated value, voltage correction is required through reactive power injection/absorption of each PV inverter in the cluster. For the i-th PV grid-connected node in cluster n (i ∈ ΩPV,n,t, ΩPV,n,t is the set of PV nodes in cluster n in period t), its reactive power regulation capability for the control center node is characterized by the reactive power sensitivity element M Q i c n , t . The larger the value of this value, the more significant the voltage regulation effect of unit reactive power change in the PV node on the control center, and the higher the voltage regulation efficiency.
ξ i c n , t = M Q i c n , t i Ω PV , n , t M Q i c n , t
where ξ i c n , t is the reactive power output allocation weight of the i-th PV node in cluster n in period t.
On this basis, the reactive power output regulation instruction of the i-th PV inverter in cluster n in period t is:
Q i , n , t = ξ i c n , t Δ V c n , t M Q i c n , t Δ V C n , t = V tar , n , t V C n , t
where V C n , t is the actual operating voltage per-unit value of the control center node Cn in period t.
Unlike traditional PV inverter control strategies, the proposed method allocates reactive power according to the relative voltage regulation capability of multiple PV inverters within each cluster rather than relying on a single sensitivity coefficient. In addition, the dynamic cluster partitioning mechanism updates the cluster structure and key control nodes when the network operating characteristics change, which helps maintain effective voltage regulation under variable PV generation conditions.
χ ( ) in Equation (23) is a function designed to constrain voltage deviation within a narrow range. It is defined as:
χ ( V ) = ln ( 1 V + ε )
When the argument of χ ( ) is small, its function value approaches 0; as the argument approaches 1, the function value tends to infinity. This characteristic achieves the intended penalty effect for voltage deviations of different magnitudes.
For the absolute value term V i , t V N in Equation (23), the auxiliary variable splitting method is adopted to realize complete linearization. Two non-negative auxiliary variables Δ V i , t + , Δ V i , t are introduced to characterize the positive and negative voltage deviations respectively, which satisfies:
V i , t V N = Δ V i , t + Δ V i , t
The absolute value term is equivalently transformed into the linear sum of the two auxiliary variables:
V i , t V N = Δ V i , t + + Δ V i , t
Similarly, the absolute value term Q i , n , t in Equation (21) can be calculated by two non-negative auxiliary variables Q i , n , t + and Q i , n , t :
Q i , n , t = Q i , n , t + + Q i , n , t Q i , n , t = Q i , n , t + Q i , n , t
The constraints of the PV flexible control model are as follows:
(1) Power balance constraint
P PV , n , t + P grid , n , t = P L , n , t + P loss , n , t
where PPV,n,t is the PV power consumed by the n-th cluster in period t; Pgrid,n,t is the exchange power between the cluster and the main grid in period t (positive for absorbing power, negative for injecting power); PL,n,t is the total load power of the cluster in period t; Ploss,n,t is the line power loss inside the cluster in period t.
(2) Voltage deviation constraint
V i , t V N Δ V lim
(3) PV output constraint
0 P PV , i , t P PV , i , t actual
(4) Inverter power factor constraint
cos ϕ 1 Q i , n , t P PV , i , t cos ϕ 2
where cos ϕ 1 and cos ϕ 2 are the lower and upper bounds of the power factor, respectively.
(5) Exchange power constraint
Q i , n , min Q i , n , t Q i , n , max P grid , t min P grid , t P grid , t max
where Qi,n,min and Qi,n,max are the lower and upper limits of its reactive power output, respectively; P grid , t max and P grid , t min are the lower and upper limits of the exchange power between the cluster and the grid in period t, respectively.

5.2. Process of Performing a Distributed Solution

In this paper, the ADMM algorithm is used for the process of performing a distributed solution. The GUROBI solver is adopted to calculate the optimal solution of the objective function for the local optimization sub-problems decoupled from each cluster. As a high-performance mathematical programming solver, GUROBI can efficiently handle linear and nonlinear programming problems with complex constraints, providing reliable local solution support for the distributed iteration of the ADMM algorithm and ensuring the efficiency and accuracy of the global optimization process.
The ADMM augmented Lagrangian function adapted to cluster control is constructed as follows:
L t = n = 1 K t F n , t + y n , t T ( x n , t z t ) + ρ 2 x n , t z t 2 2
where x n , t is the set of local optimization variables of the n-th cluster in period t, including the active power, reactive power, and voltage values of interconnection lines; zt is the set of global shared variables in period t, which has the same dimension, element order, and physical meaning as x n , t ; yn,t is the Lagrangian dual variable corresponding to the n-th cluster in period t; ρ > 0 is the quadratic penalty factor of ADMM, which is used to balance the iterative convergence speed and solution stability; ||·||2 is the 2-norm.
Based on the above augmented Lagrangian function, each iteration sequentially completes the following three core steps, which are executed cyclically until the convergence conditions are met.
(1) With the global shared variables z t h and dual variables y n , t h obtained from the previous iteration fixed (the superscript h represents the iteration number), each cluster independently and in parallel solves the following local sub-problem to obtain the local optimal solution x n , t h + 1 of this iteration:
x n , t h + 1 = arg min x n , t F n , t + y n , t h T ( x n , t z t h ) + ρ 2 x n , t z t h 2 2
(2) Based on the coupling boundary variables in the local optimal solution x n , t h + 1 obtained by each cluster, the arithmetic mean of the corresponding variables of all clusters is taken to complete the update of the global shared variables of this iteration. The update formula is as follows:
z n , t h + 1 = 1 K t n = 1 K t x n , t h + 1
(3) Based on the updated local optimal solution and global shared variables, the subgradient ascent method is used to complete the iterative update of dual variables:
y n , t h + 1 = y n , t h + ρ x n , t h + 1 z t h + 1
The above sub-problems are solved by using the GUROBI solver. After completing the above three steps of update, the convergence of the iteration is judged by the primal residual and dual residual. The calculation formulas of the two residuals are as follows:
ψ t h + 1 = n = 1 K t x n h + 1 z h + 1 2 2 ϑ t h + 1 = ρ K t z n h + 1 z n h 2 2
The iteration termination condition is set as: the primal residual and dual residual are both less than the preset convergence accuracy threshold ε, that is
ψ t h + 1 υ ϑ t h + 1 υ
In this paper, the convergence accuracy threshold υ is set to 10−4. However, in the future, with the increasing scale of distribution networks, as the network size increases, compared with communication overhead, the per-iteration complexity grows sub-linearly. Accordingly, the convergence accuracy threshold can be appropriately raised to limit the number of ADMM iterations to approximately 50.

6. Case Study

To verify the effectiveness and superiority of the proposed optimized flexible control method for PV inverters in DNs, considering cluster partitioning, the standard IEEE 123-node test feeder is selected as the simulation test object. The system model is built based on the MATLAB R2024b simulation platform. The DDPSO algorithm is adopted for cluster partitioning. The target voltage Vtar,n of each cluster is solved, and multi-dimensional simulation tests and result analysis are carried out in combination with the GUROBI solver and ADMM algorithm.

6.1. Cluster Partitioning Results

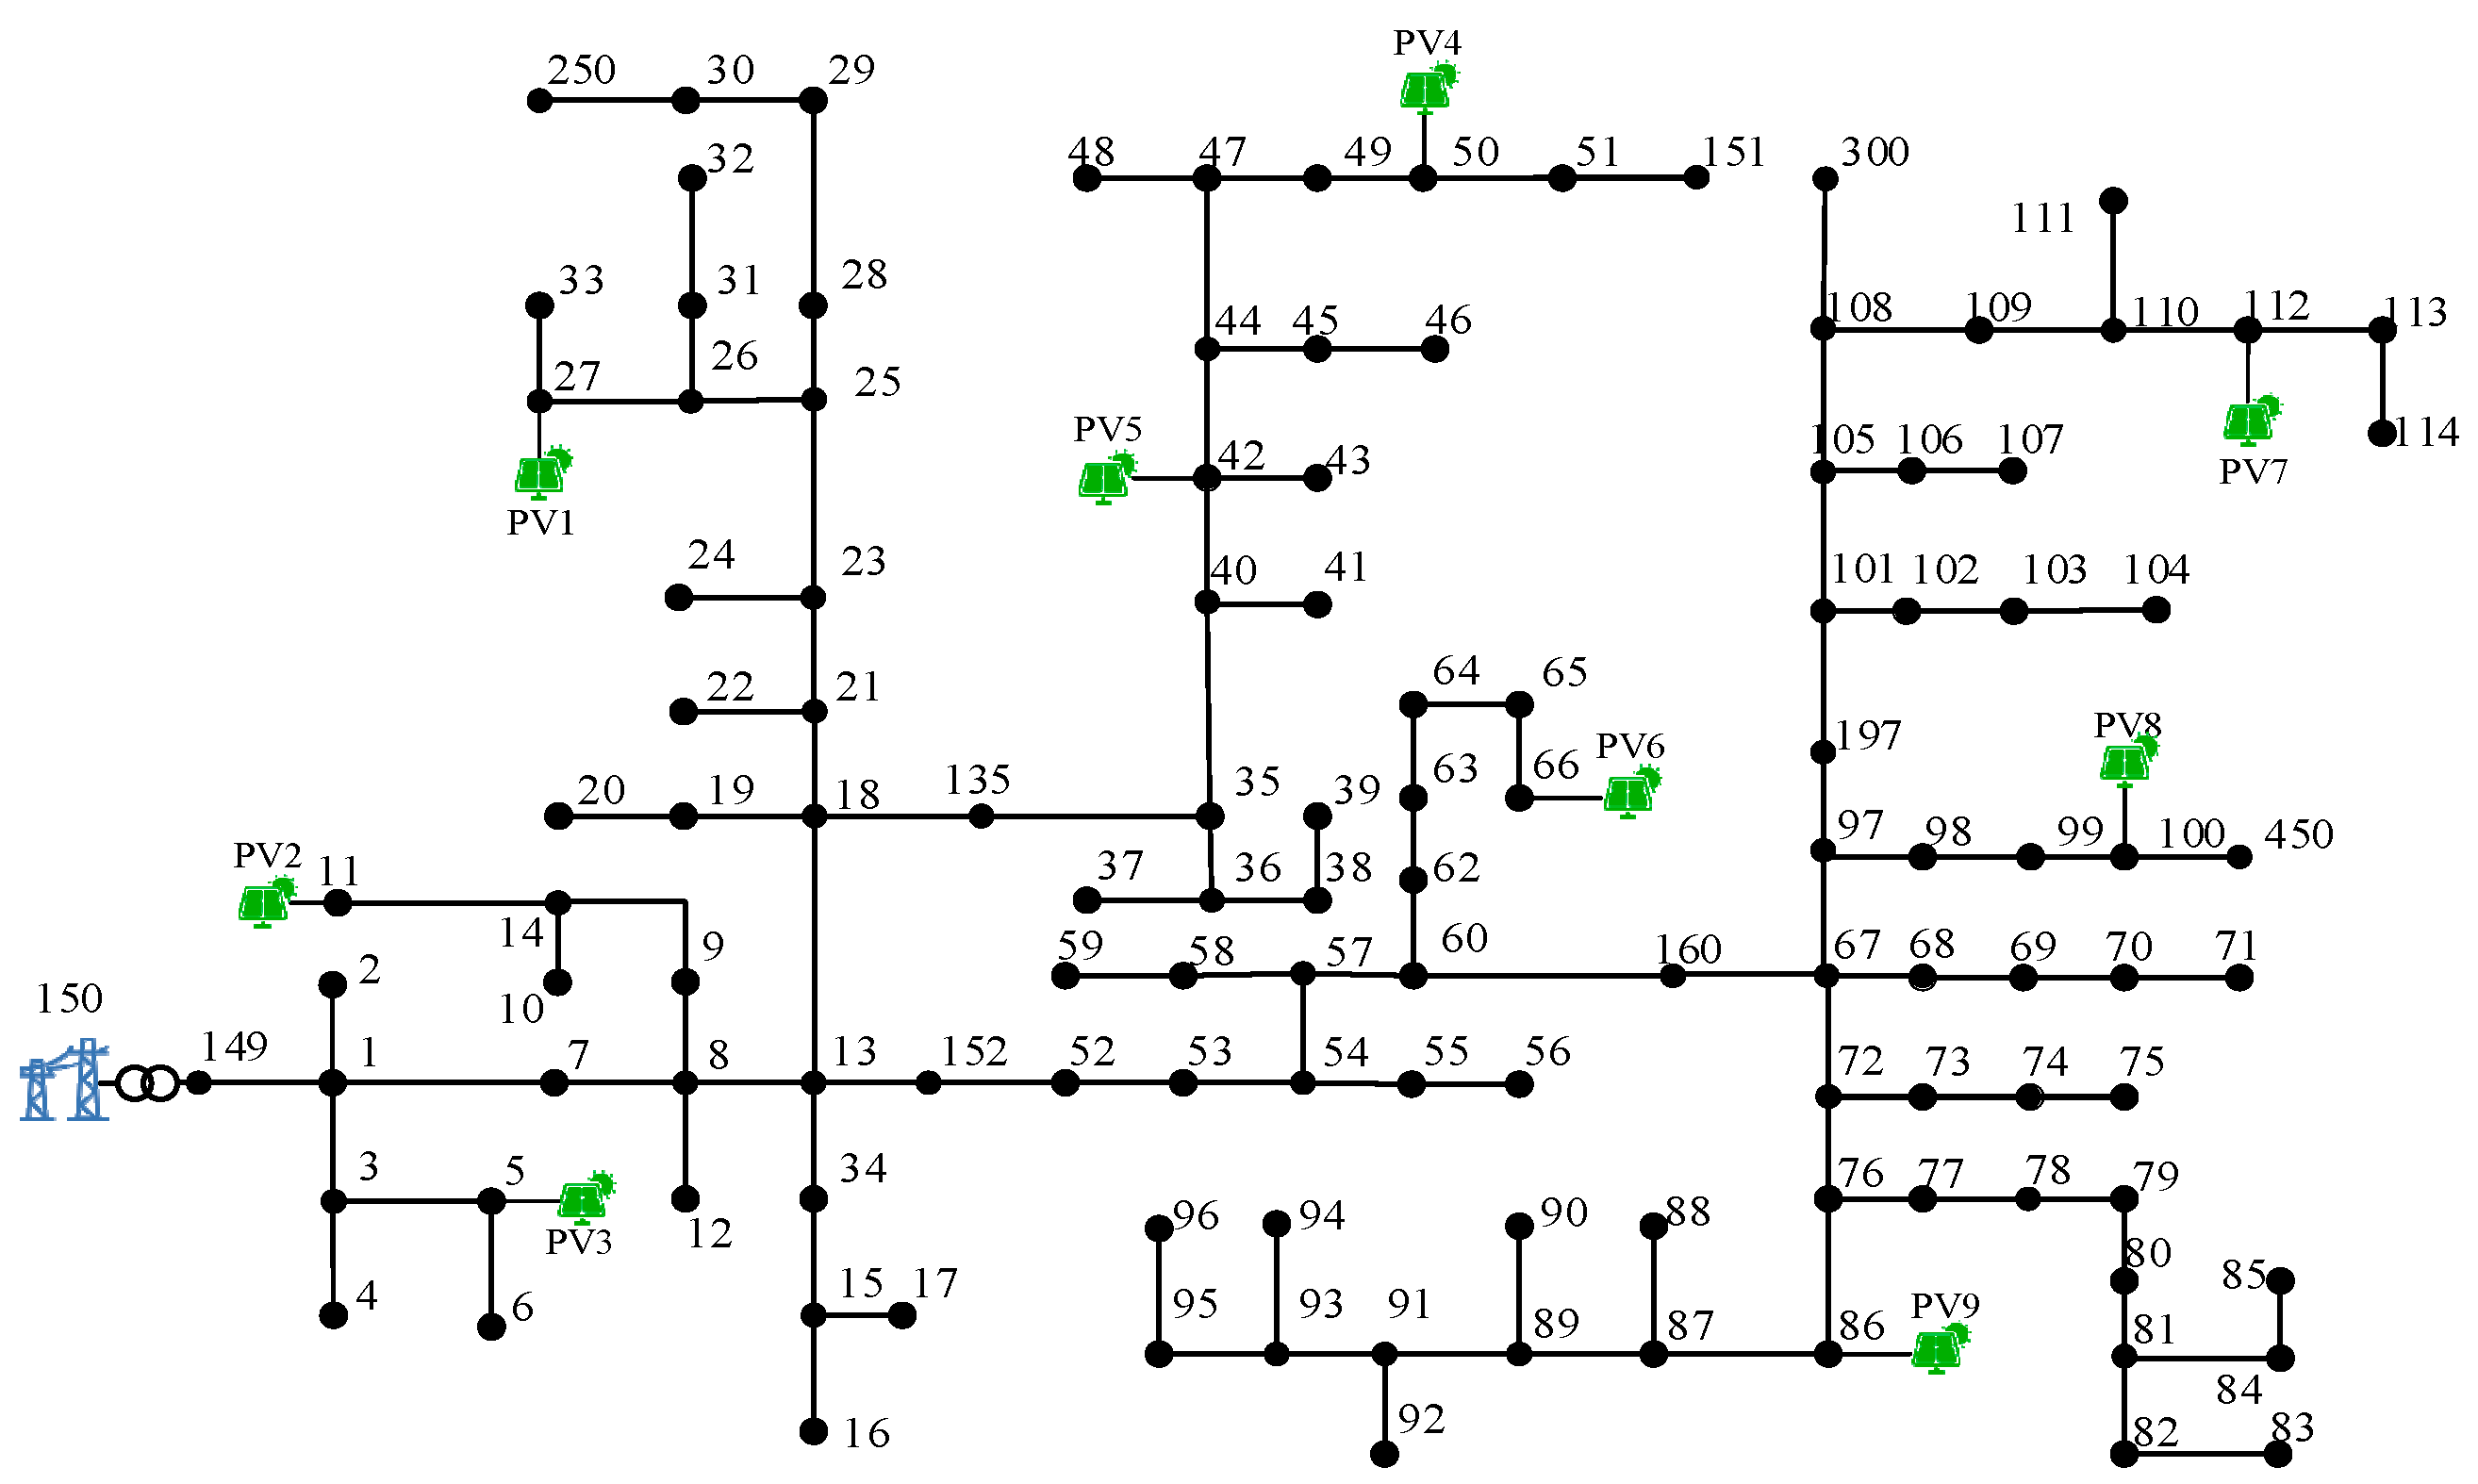
The total number of time periods is set to 24, and the predicted values are adopted for both PV output and load demand. The rated voltage of the IEEE 123-node test feeder is 4.16 kV, the total active load of the system is 12.75 MW, and 9 groups of distributed PV units are connected to nodes 5, 11, 27, 42, 50, 66, 86, 100, and 112, respectively. The rated installed capacity of a single PV unit is 800 kW, the rated capacity of the PV inverter is 1000 kVA, and the power factor adjustment range is 0.85 (leading)~0.85 (lagging). The value of the weight σ 1 and σ 2 in Equation (22) are both set to 0.5. Δ V lim in Equation (23) is set to 1.0 p.u. The network topology is shown in Figure 2.
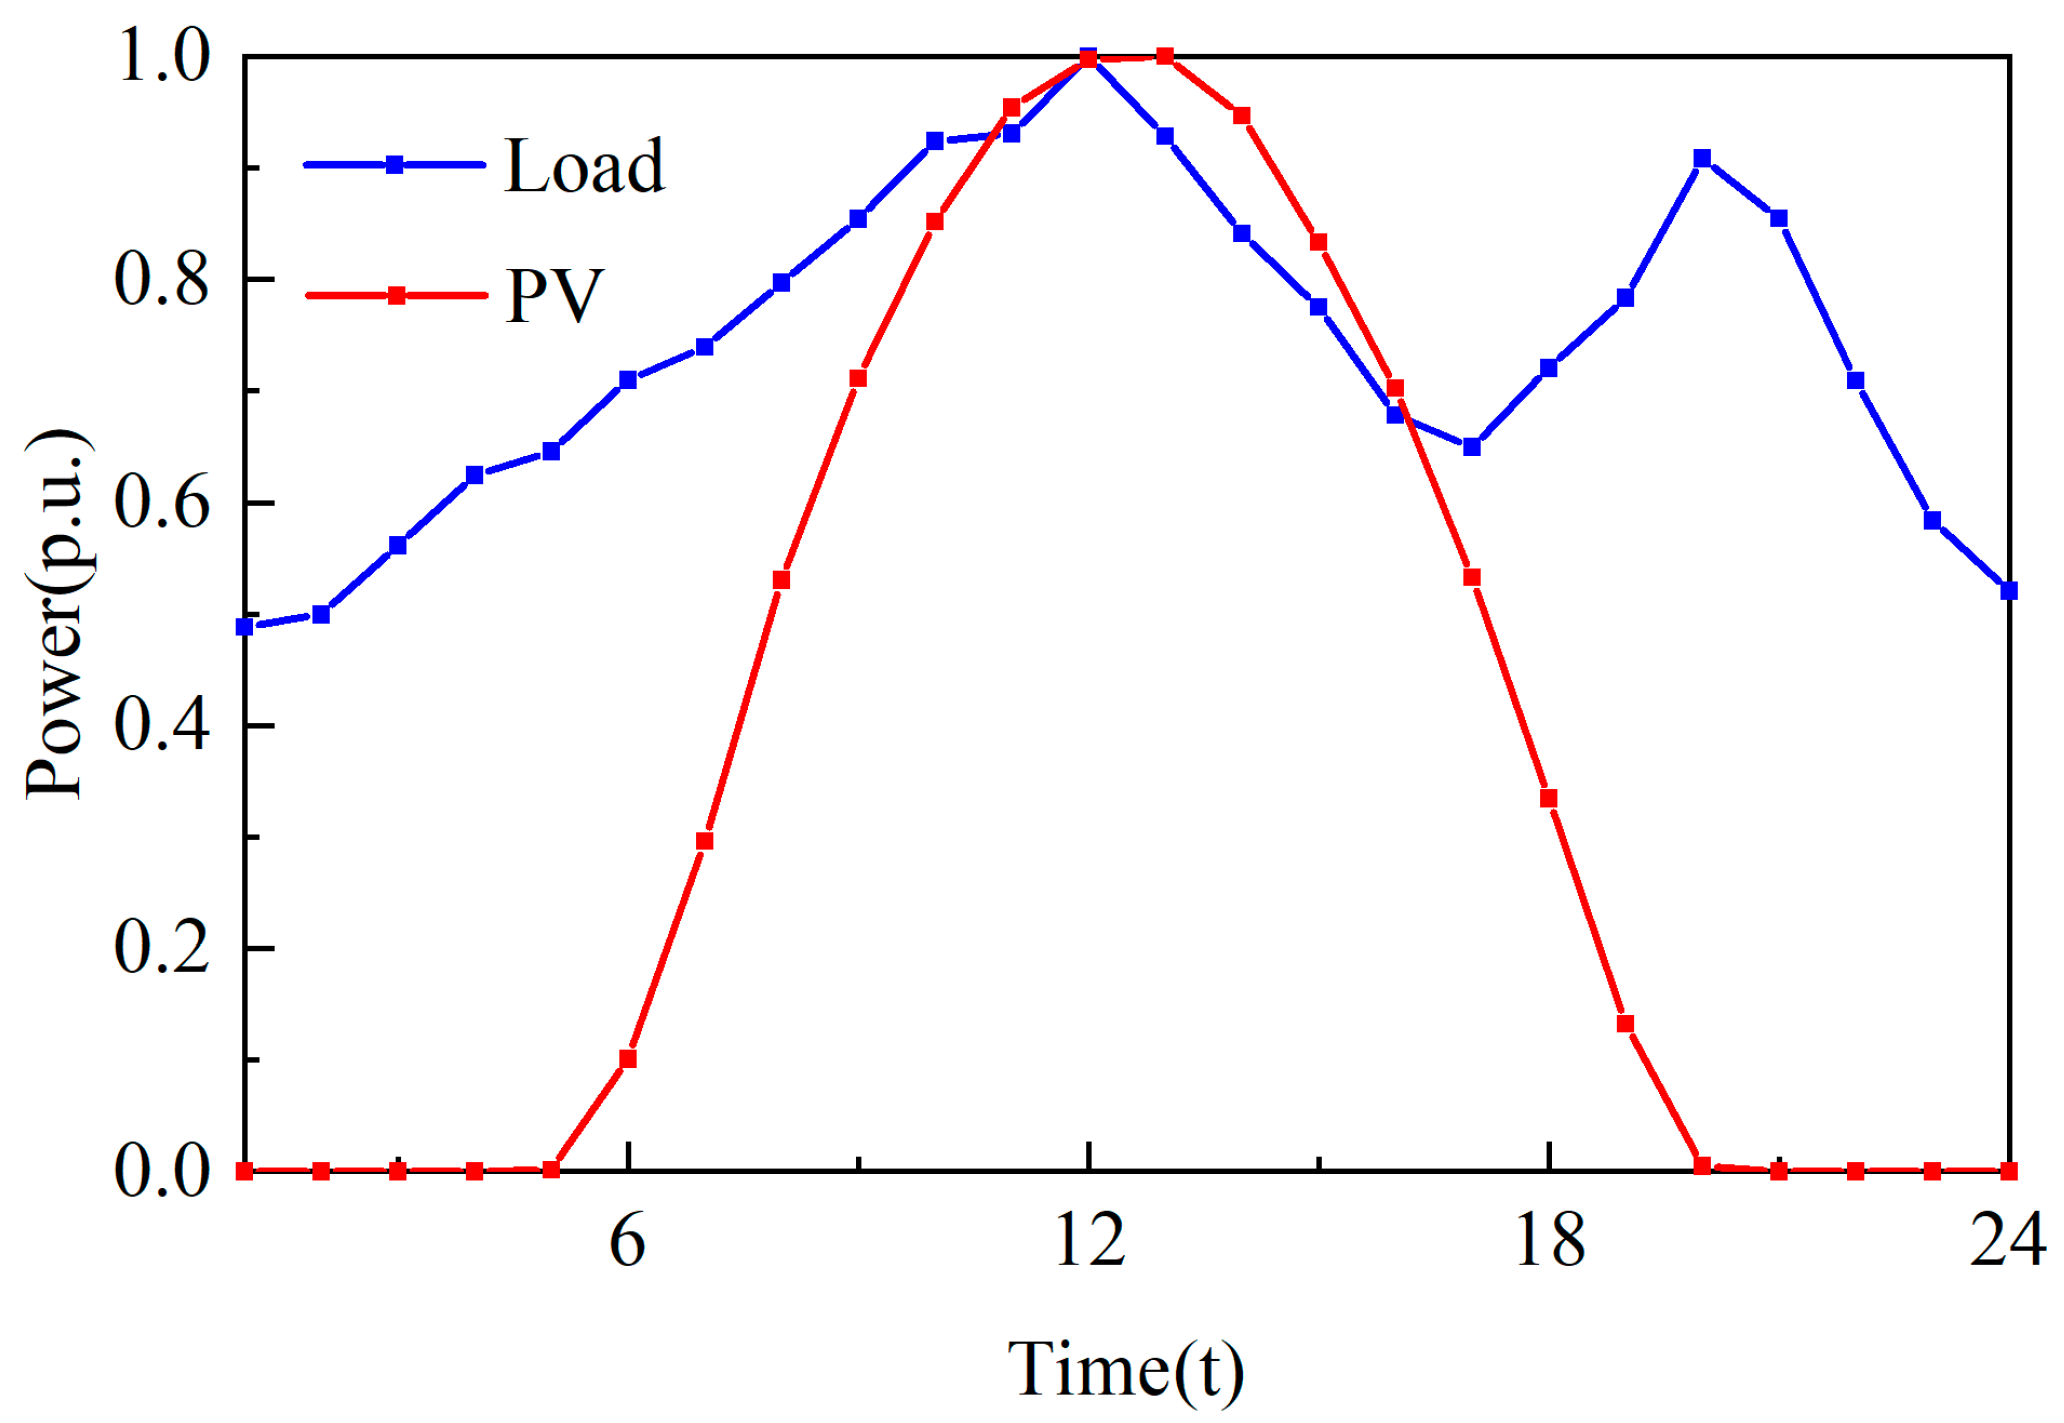
In the simulation, 24 h time-series data of a typical day are adopted, with a time resolution of 1h. The total load curve and PV output curve of the system are shown in Figure 3. The blue line is the total load curve, and the red line is the total PV output curve. The PV output presents a typical daytime unimodal characteristic, with the peak output period from 11:00 to 14:00 at noon, and no output at night; the load curve presents a noon and evening bimodal characteristic, which are 11:00–13:00 and 20:00–22:00, respectively.
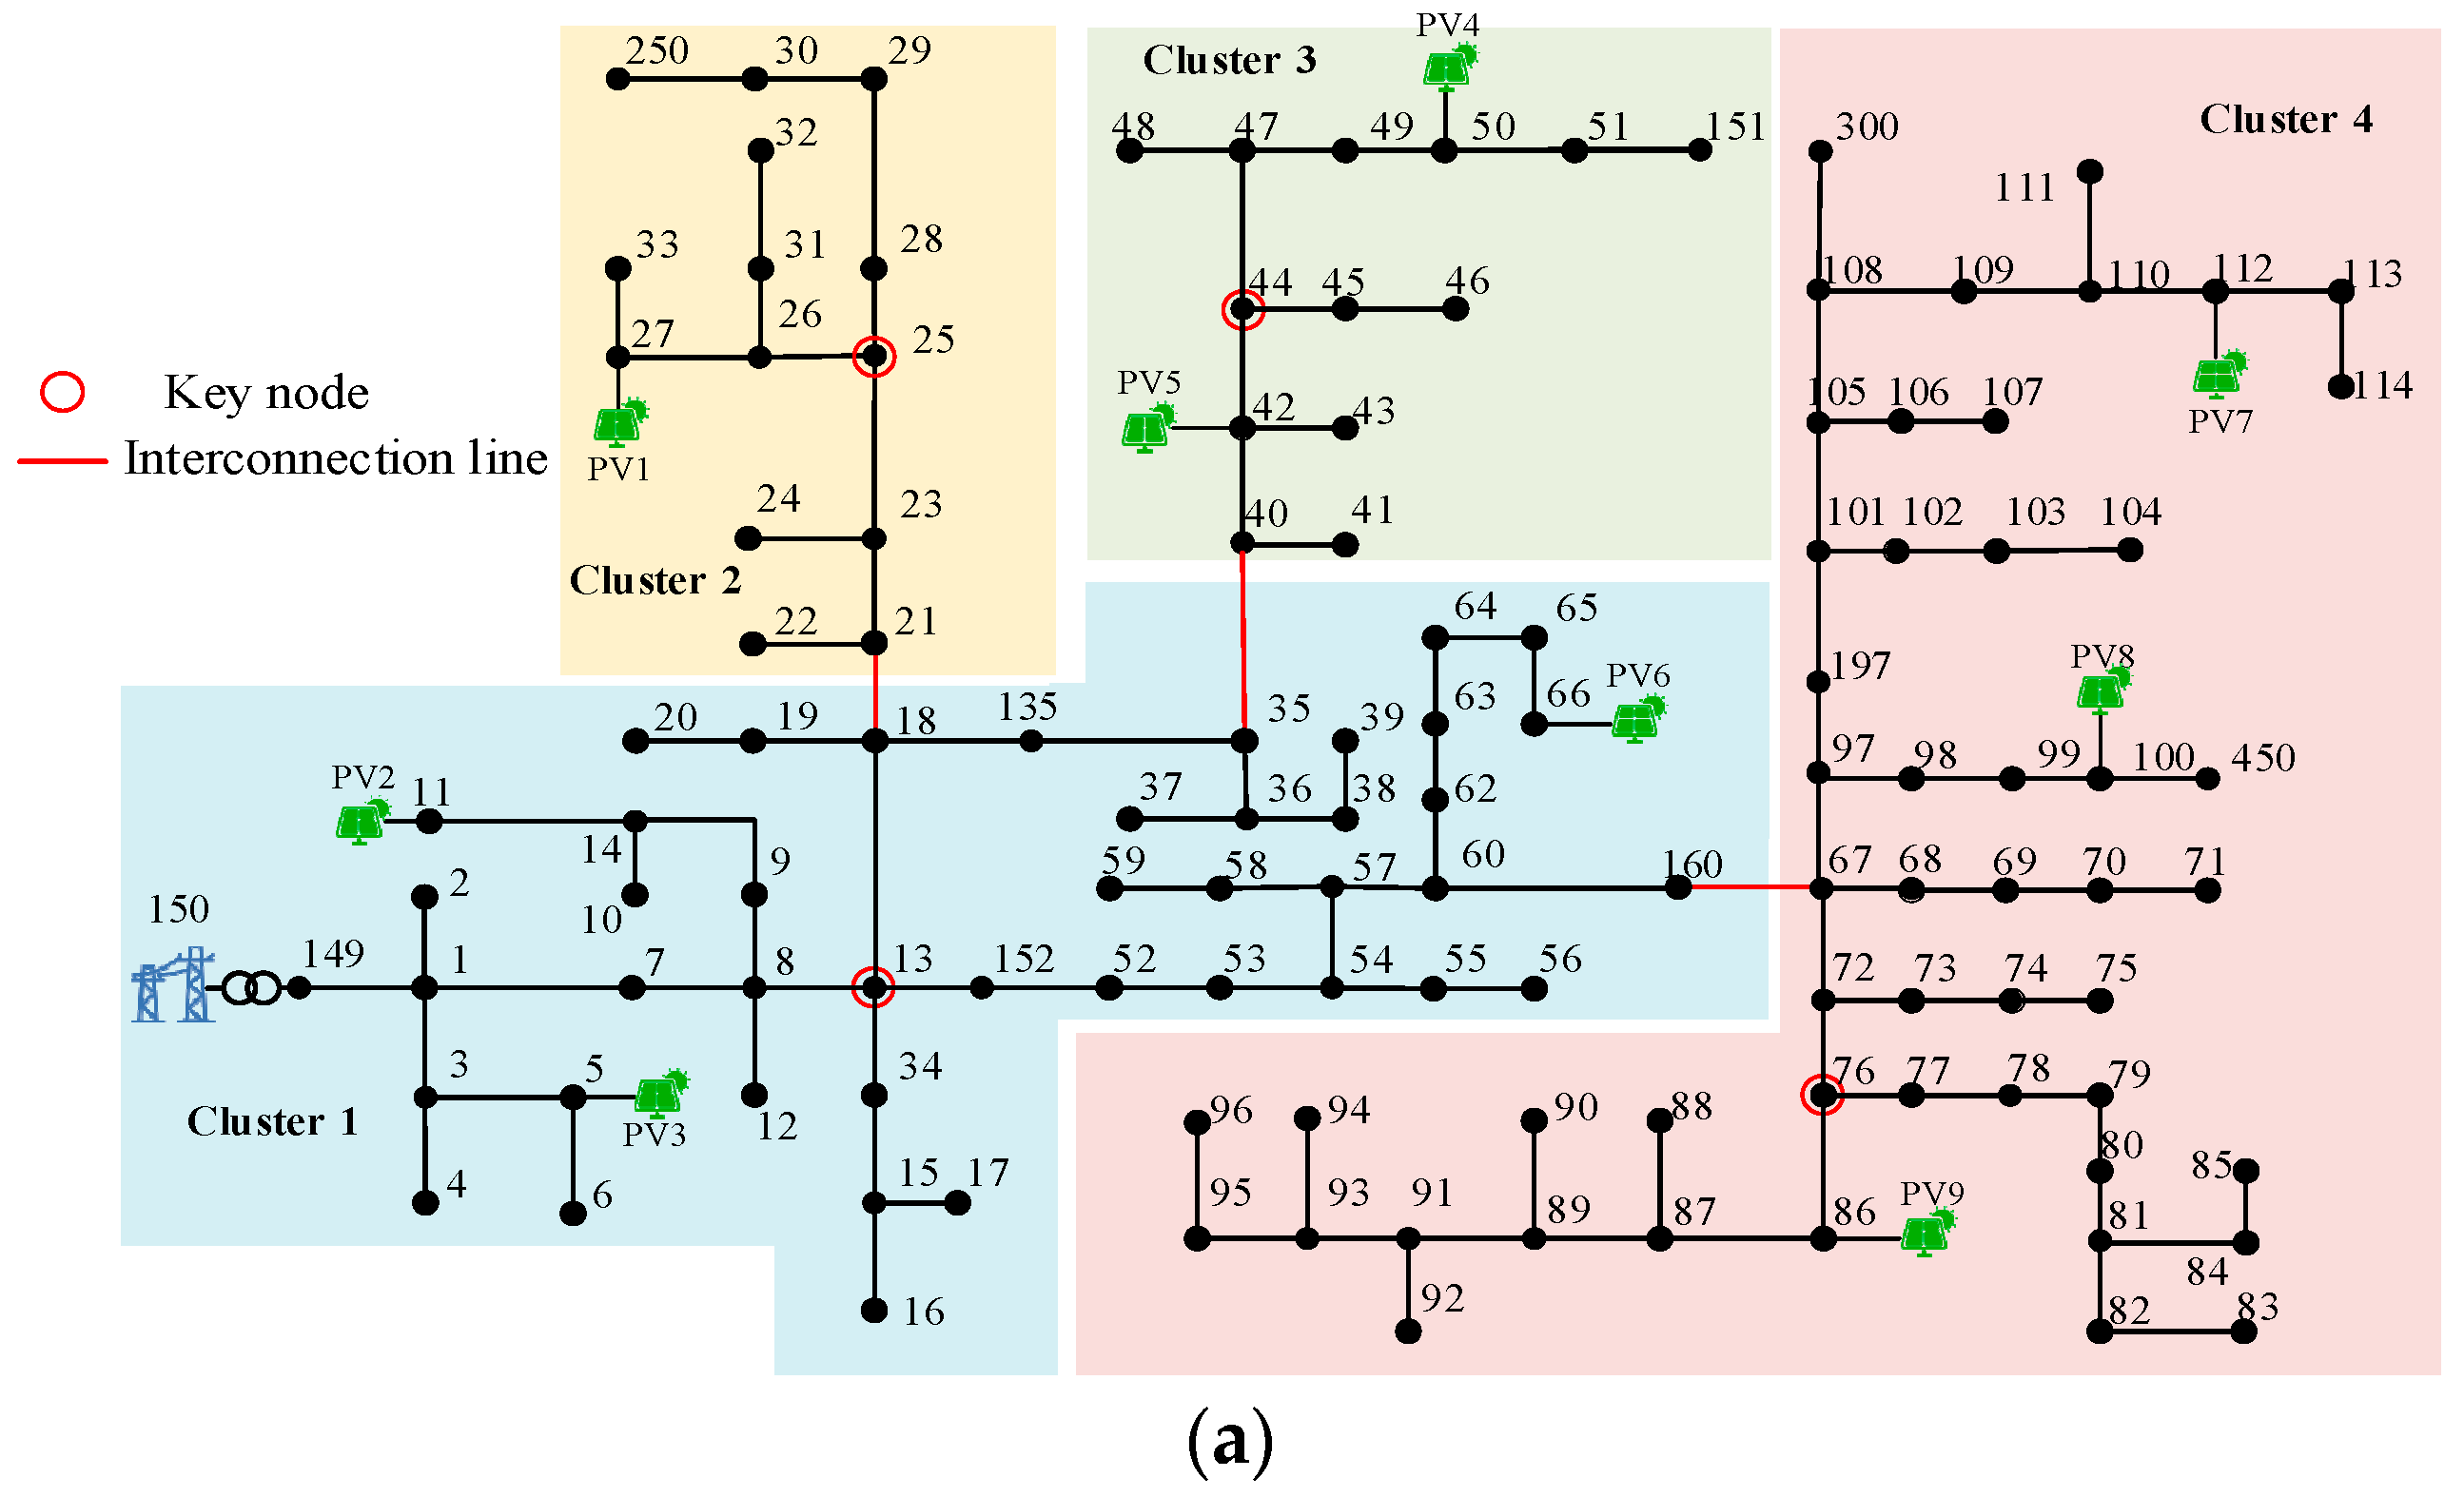
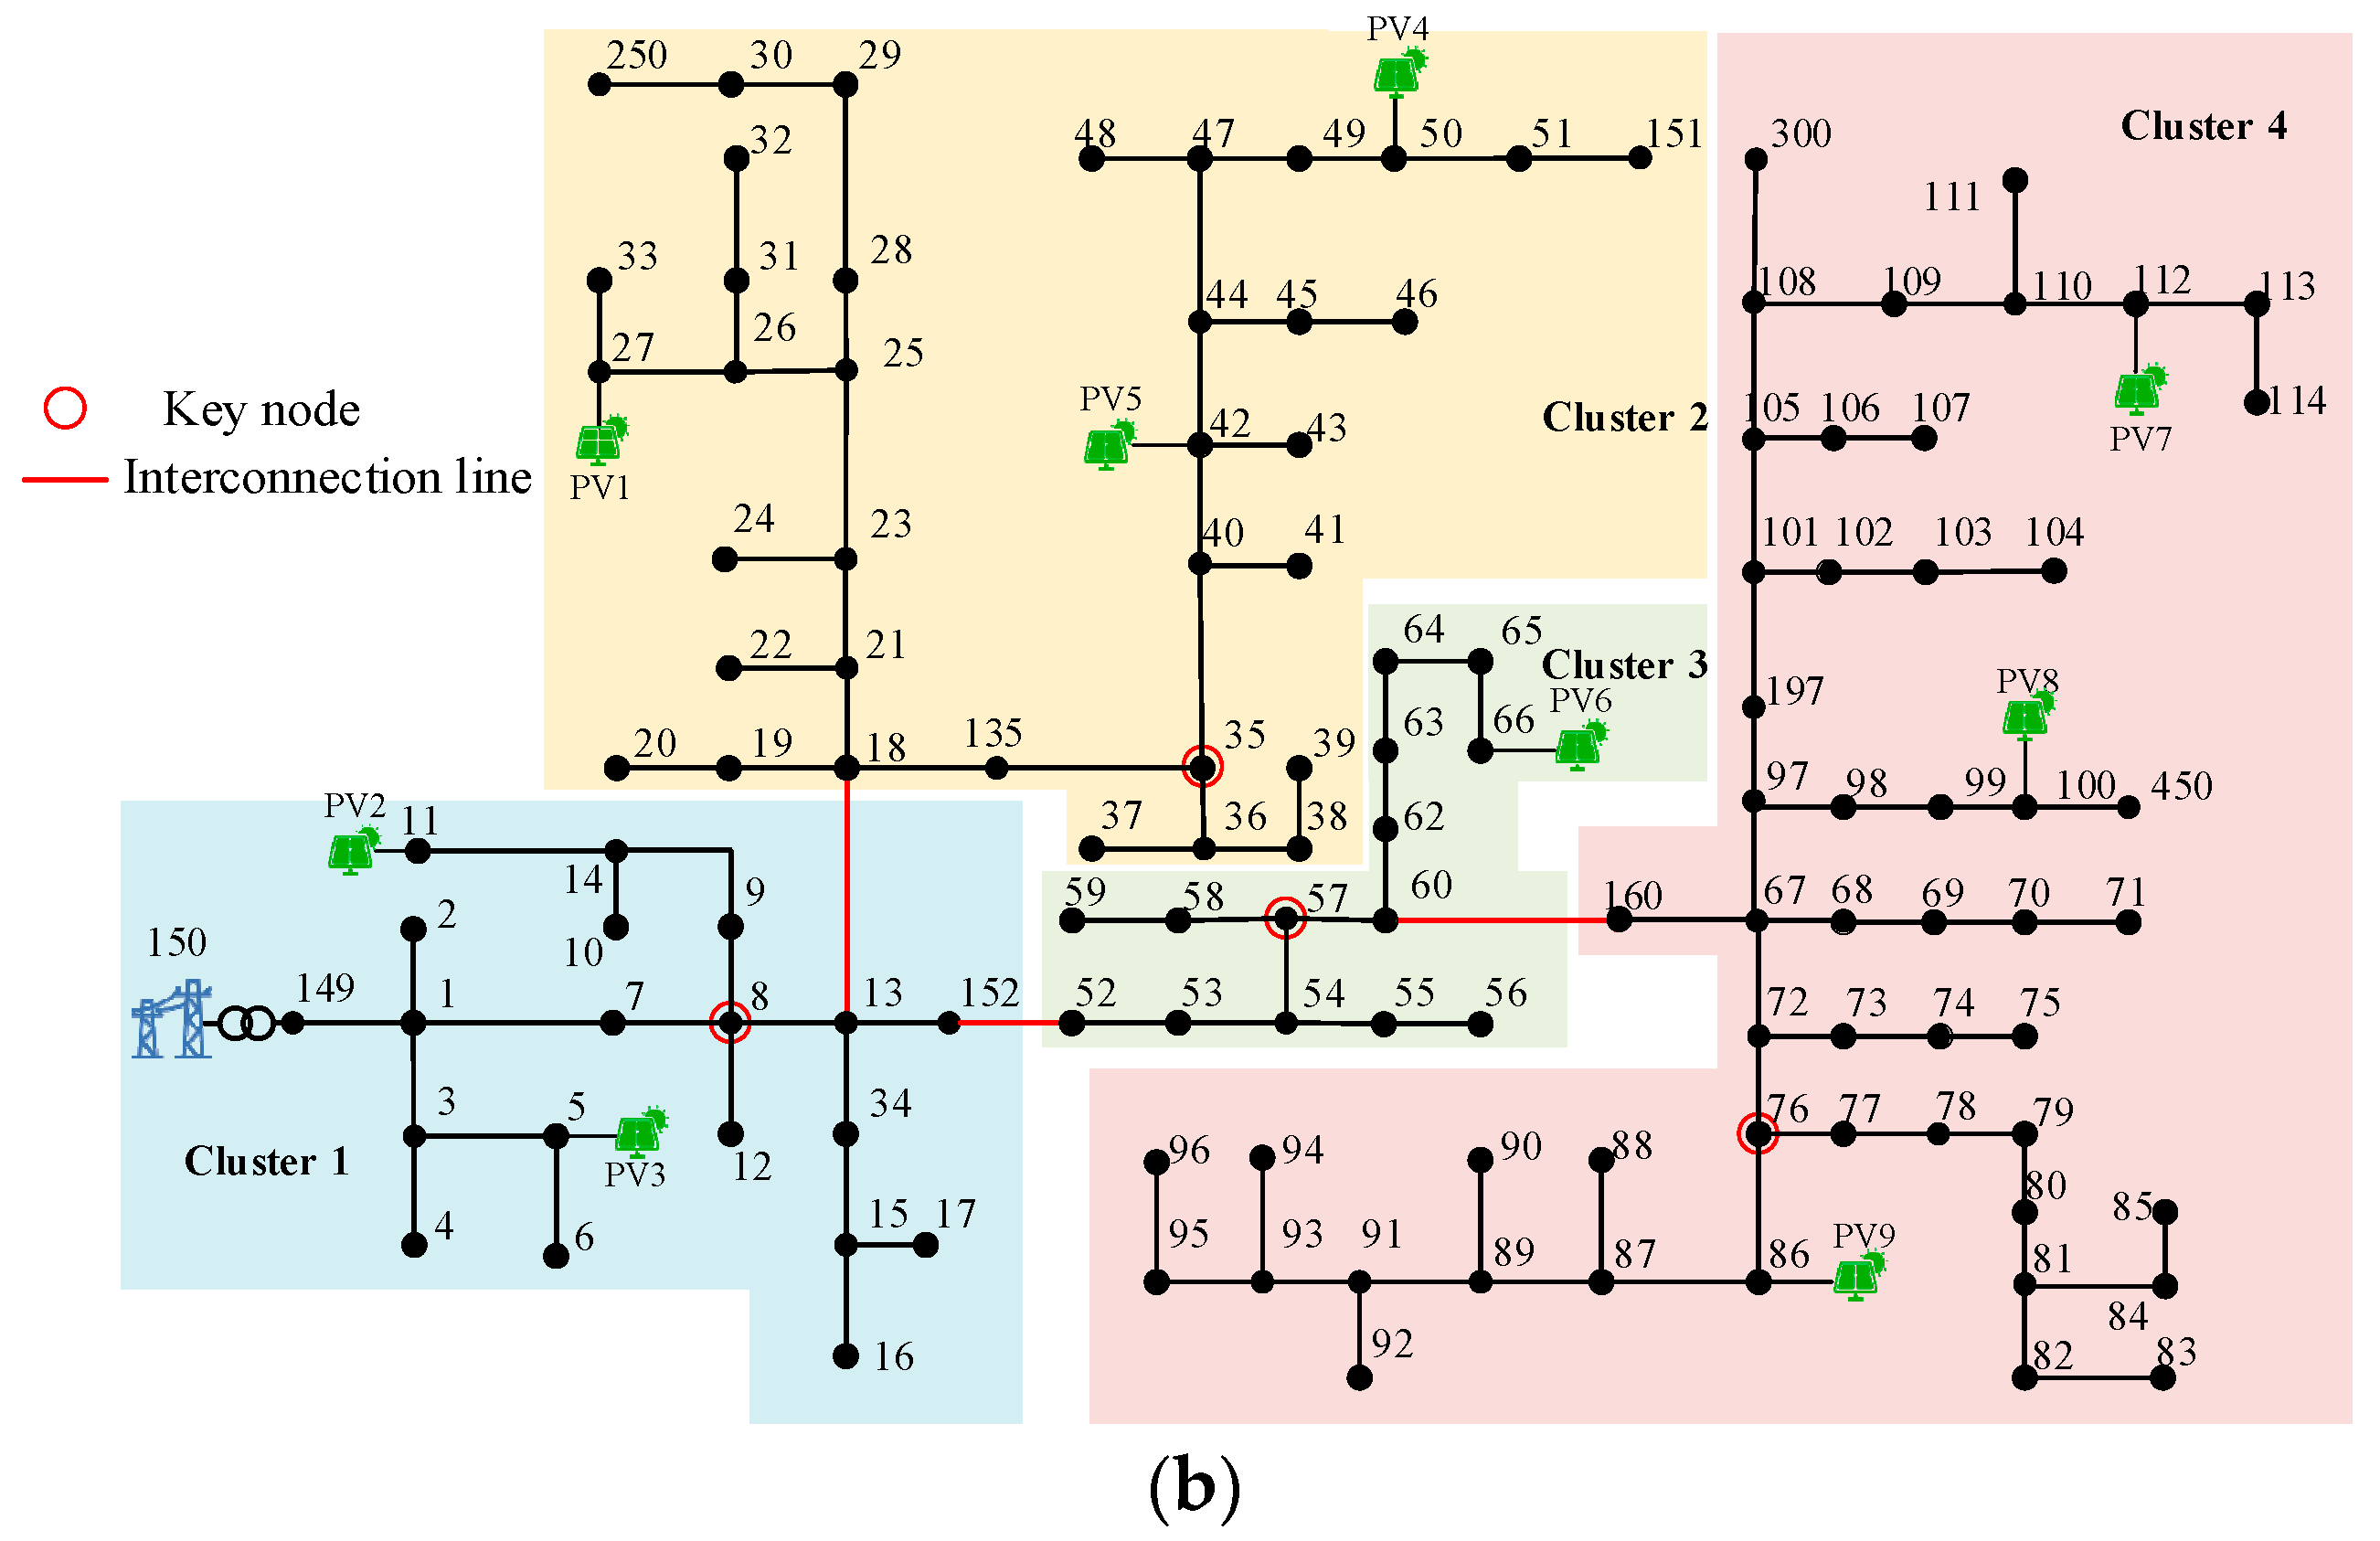
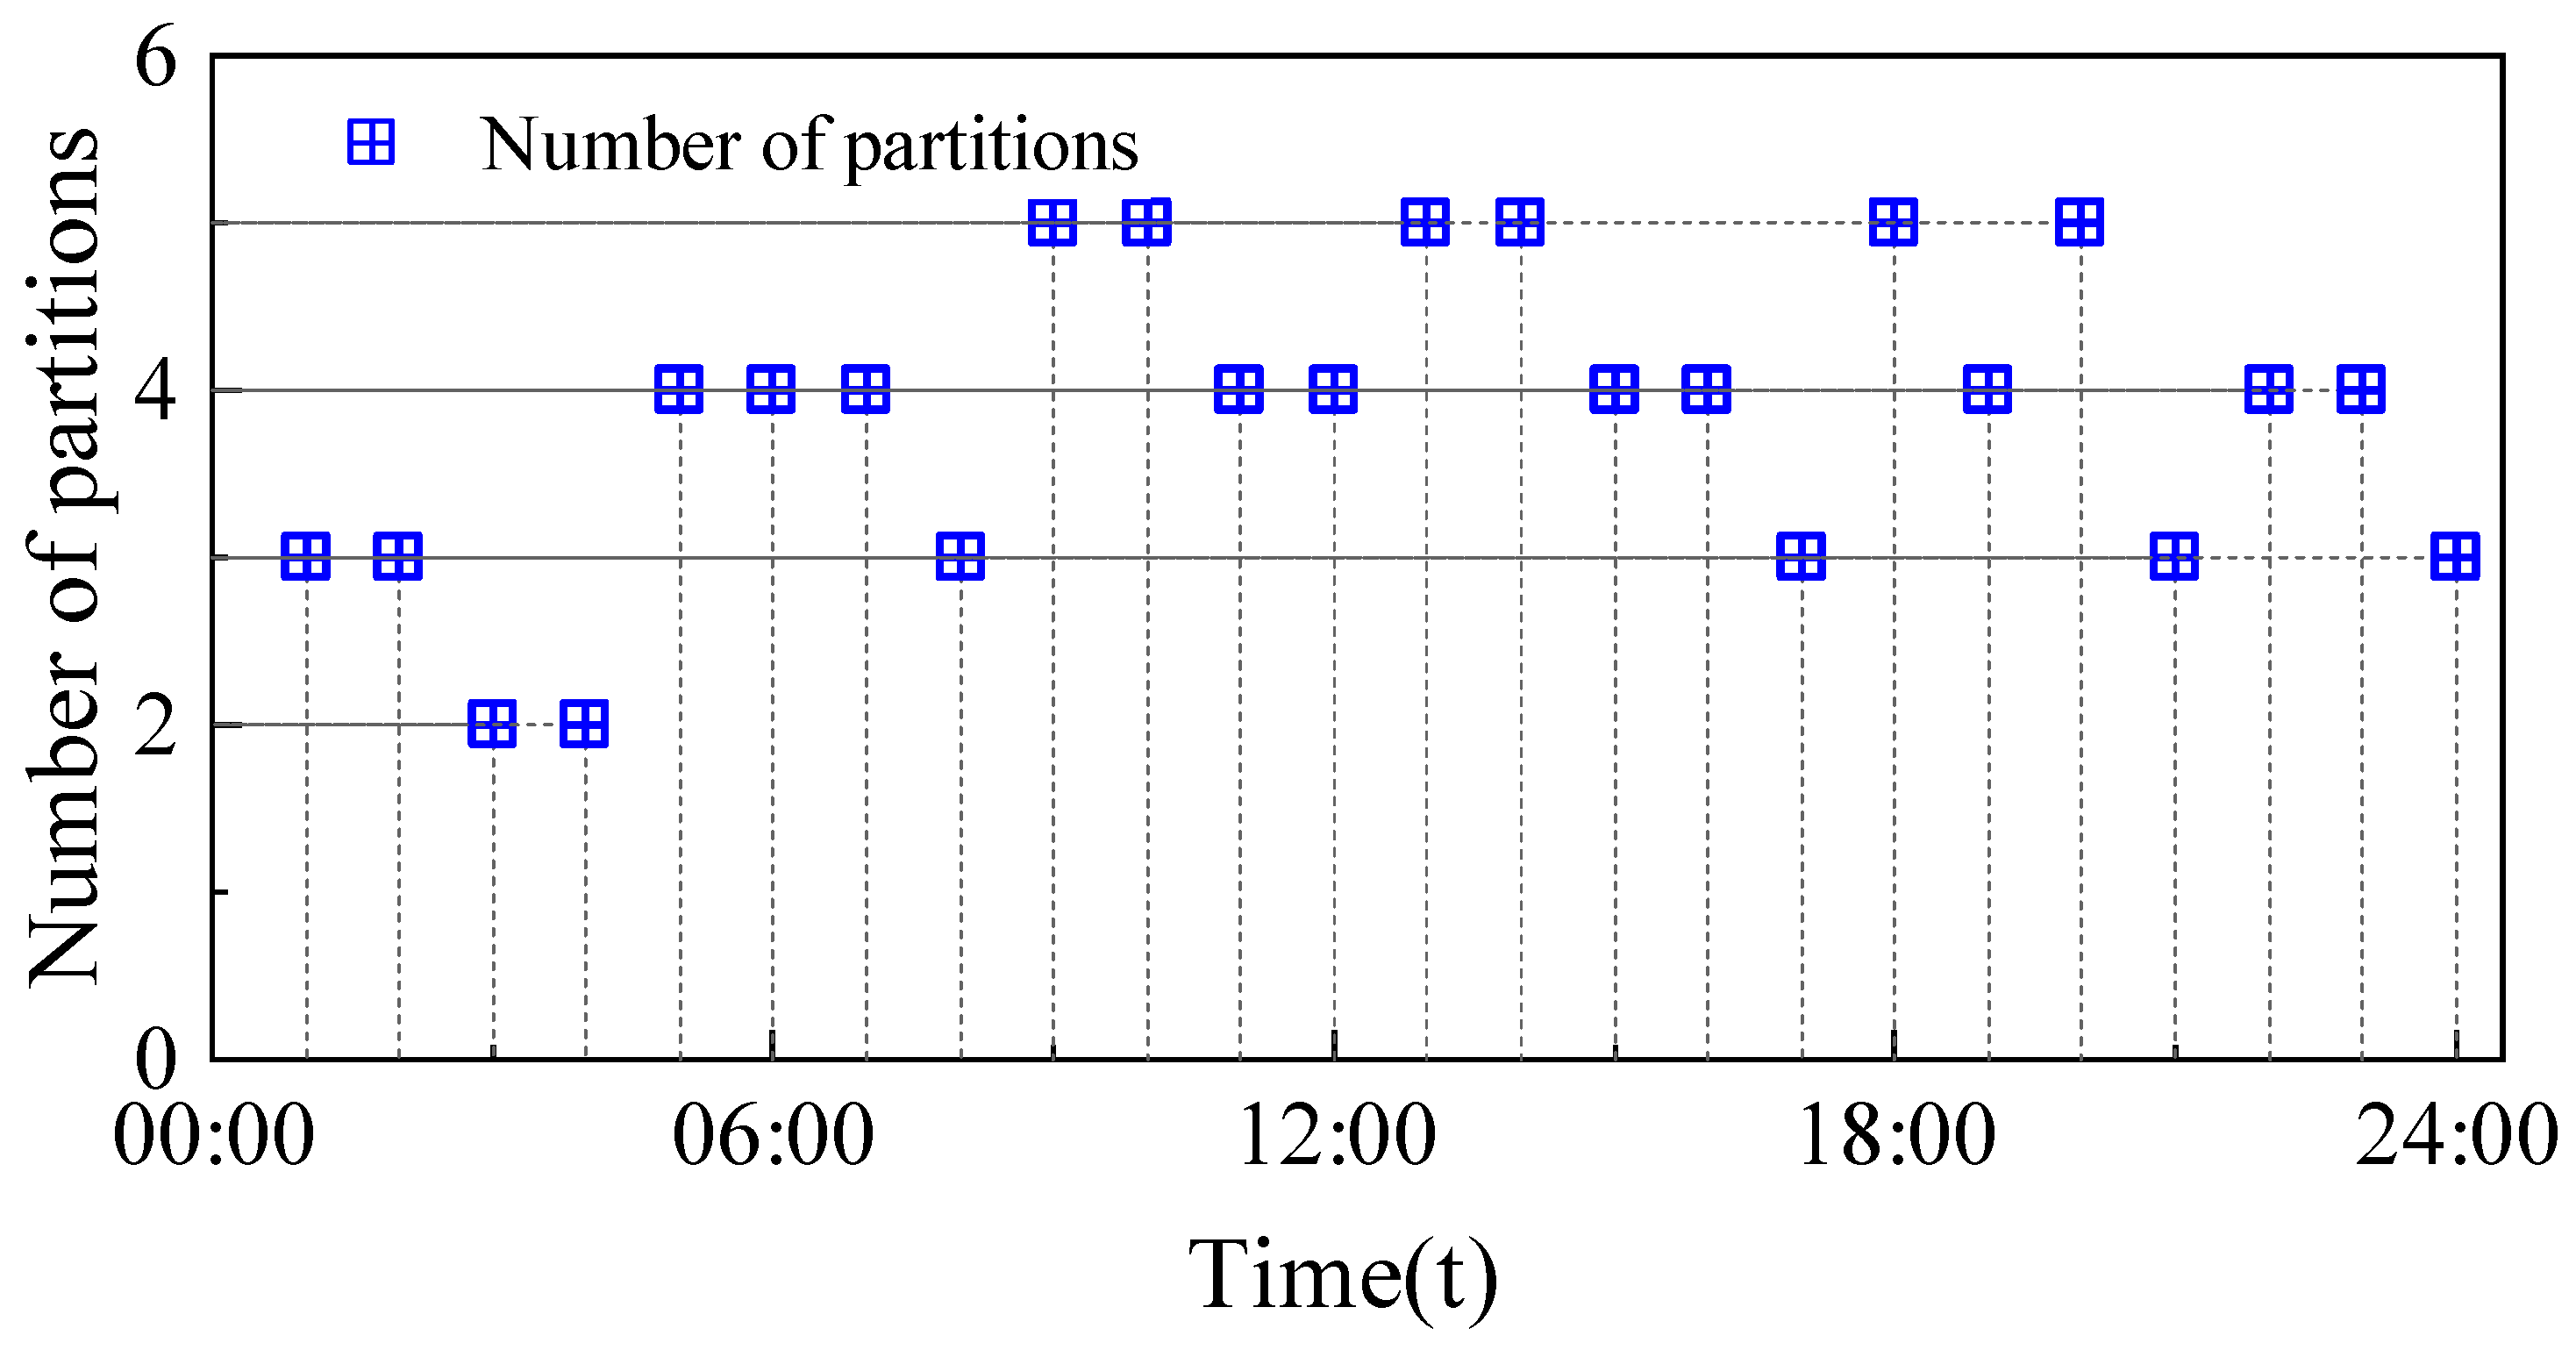
The DDPSO algorithm is adopted, with the maximum iteration number set to 100, and the time step Δt = 1 h. The data at 6:00 and 12:00 are selected to partition the system. The partitioning results are shown in Figure 4. The number of partitions is shown in Figure 5.

6.2. Analysis of Different Clustering Scenarios

To verify the effectiveness of the proposed algorithm, the following scenario comparisons are designed:
Scenario 1: Cluster partitioning using the Adaptive Genetic Algorithm (AGA) algorithm considering the modularity index (AMC);
Scenario 2: Cluster partitioning using the proposed DDPSO algorithm considering the modularity index (DPMC);
Scenario 3: Cluster partitioning using the proposed DDPSO algorithm according to the proposed comprehensive performance index considering electrical distance (DPCC).
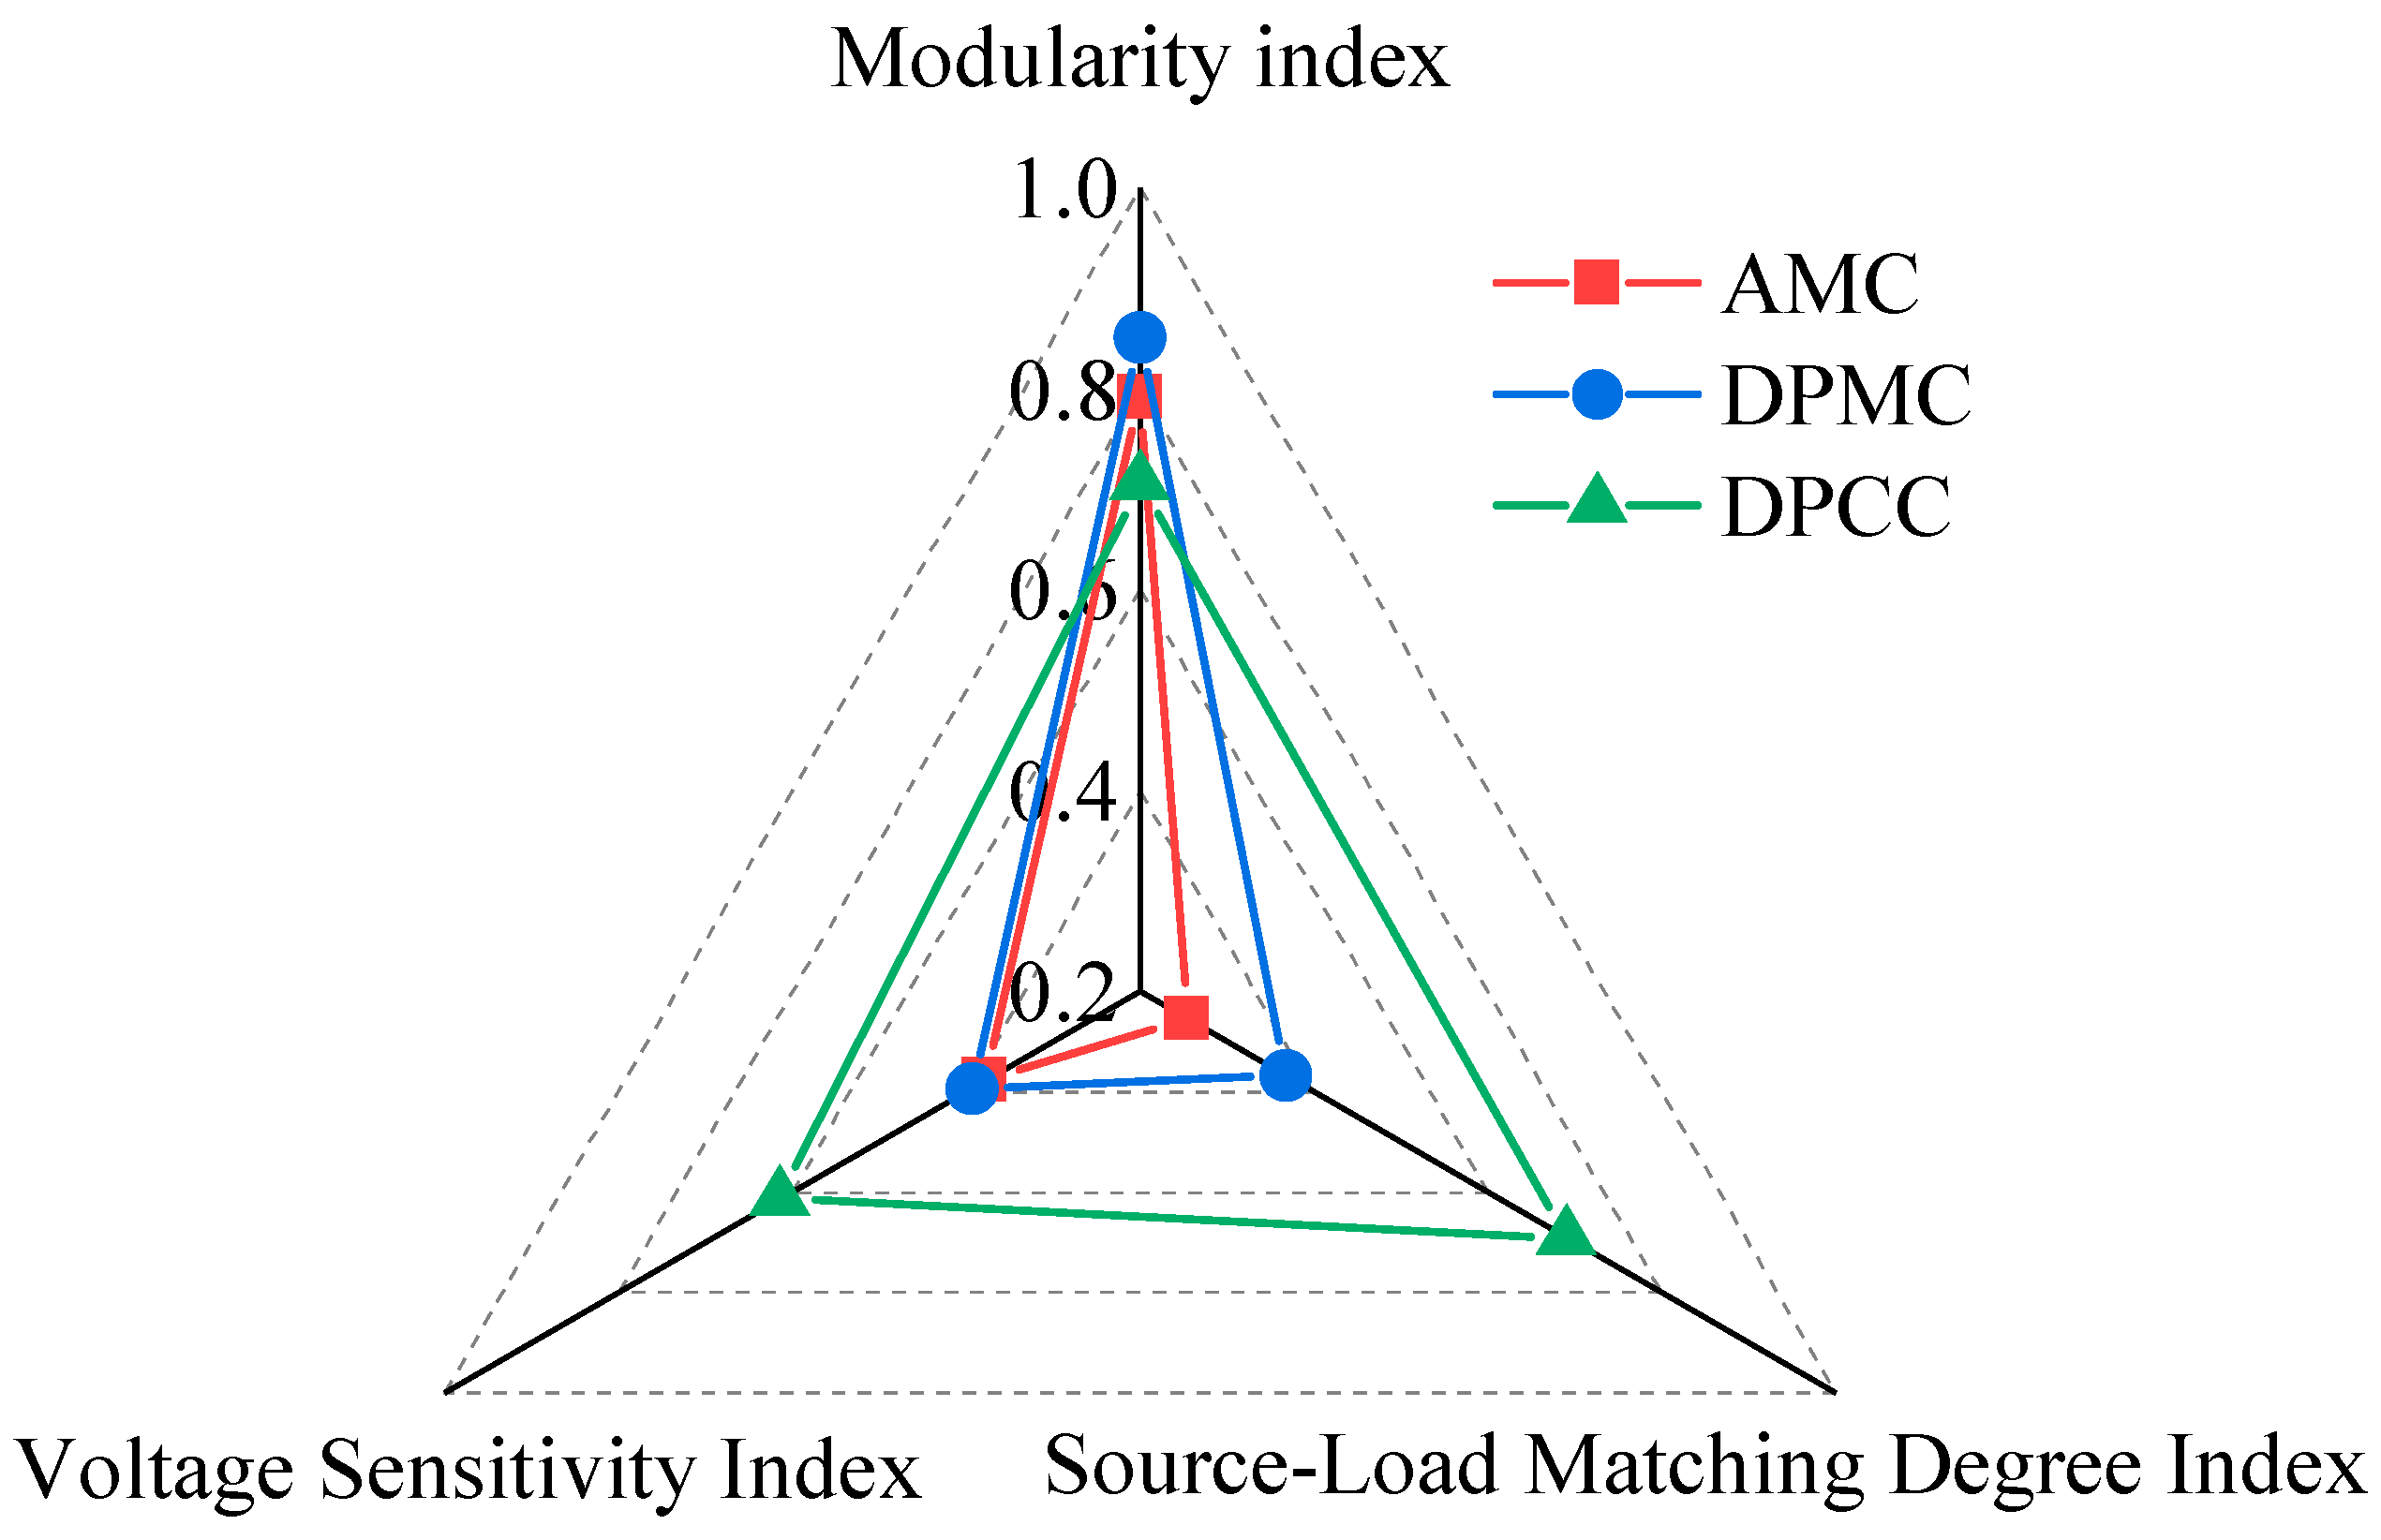
The iteration number is set to 100 times, and the modularity index, source-load matching degree index, and the voltage sensitivity index proposed in Section 3 are adopted to evaluate the cluster partitioning results of the above three scenarios in Figure 6.
In Figure 6, it can be seen that since only the modularity index is considered in Scenarios 1 and 2, their corresponding values are relatively high, with Scenario 2 reaching 0.851. However, the values of the other indexes are low, all below 0.4. Scenario 3 takes multiple cluster partitioning indexes into account simultaneously. Although its modularity index is slightly lower, all of its index values are above 0.6. Scenario 3 has the largest total area of the radar chart, which means that it exhibits excellent performance in both electrical structure and source-load matching.
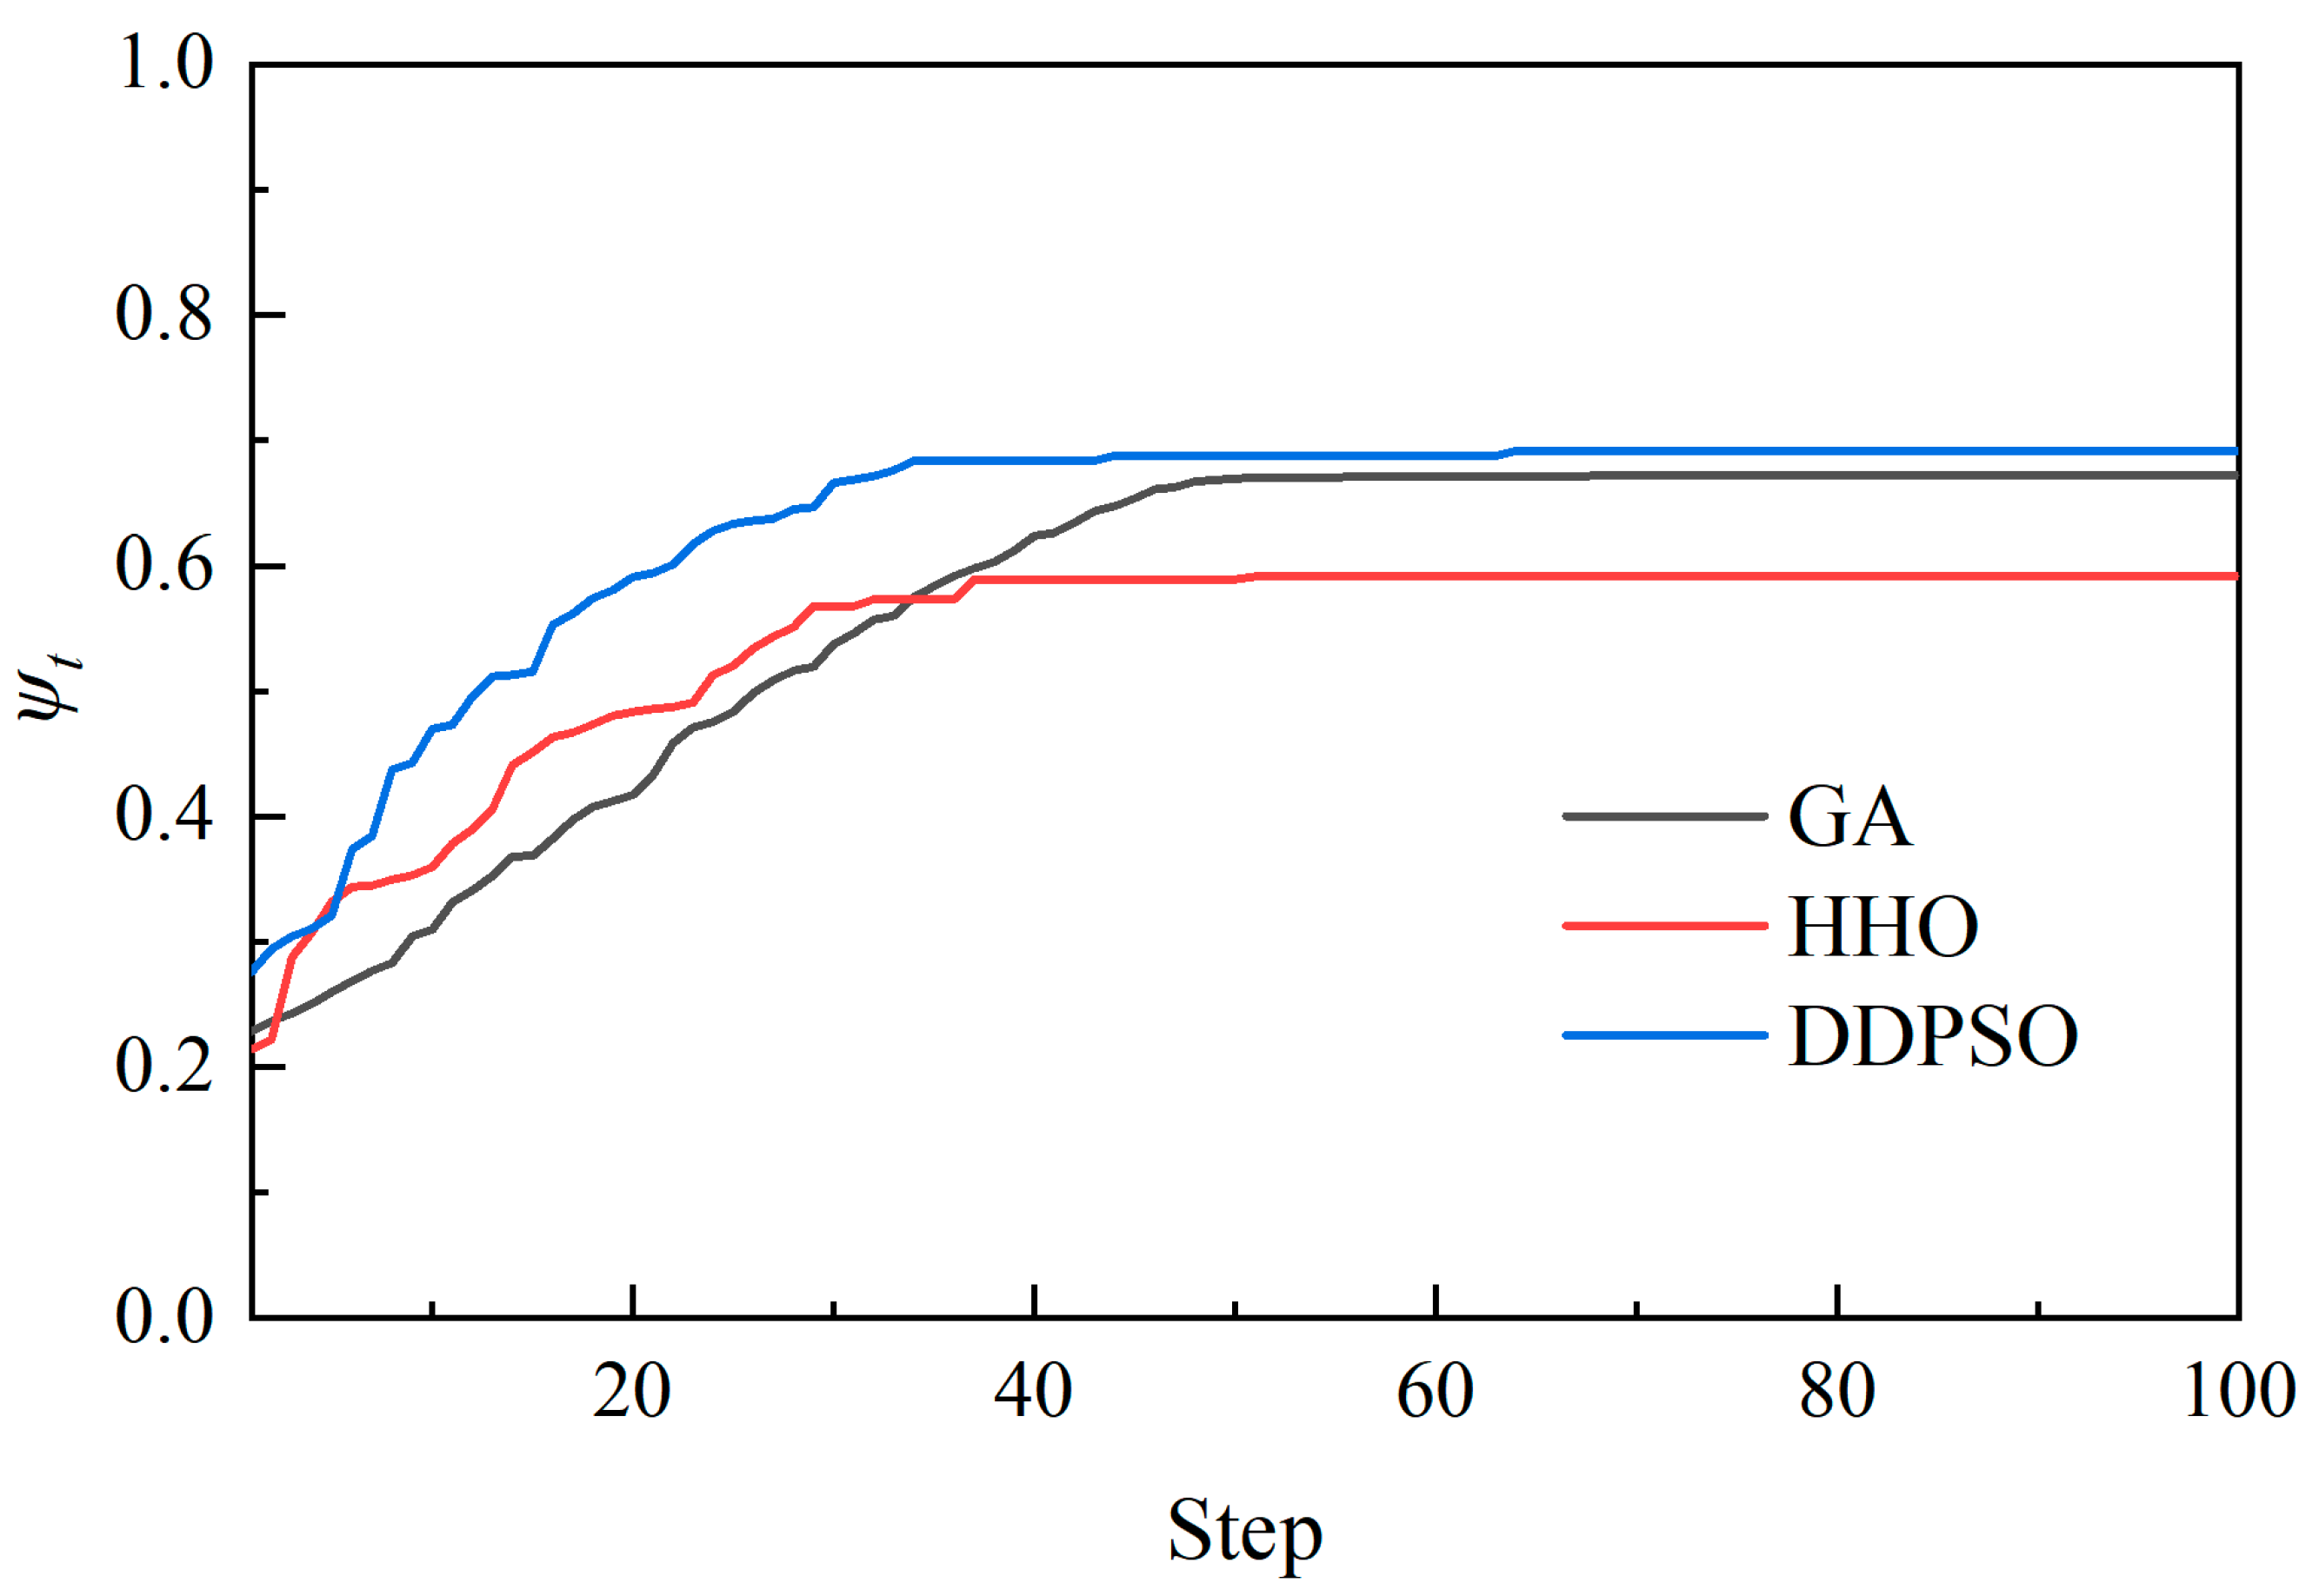
To further validate the effectiveness of the proposed DDPSO algorithm, a comparative analysis is conducted against several advanced metaheuristic algorithms, including the Genetic Algorithm (GA) and Harris Hawks Optimization (HHO). All algorithms are applied to solve the same cluster partitioning problem under identical conditions (population size M = 30, maximum iterations ε max = 100). The statistical results are summarized in Figure 7.
As shown in Figure 7, the proposed DDPSO algorithm and the HHO algorithm both attain convergence at approximately 35 steps, featuring a fast convergence rate. However, the DDPSO algorithm exhibits a stronger capability to escape local optima: its final comprehensive performance index converges to 0.69, while the HHO algorithm only reaches 0.59. For the GA, although it converges to a value of 0.67, its convergence speed is comparatively slow, requiring about 60 steps to reach the optimal solution.

6.3. Analysis of Flexible Control Results

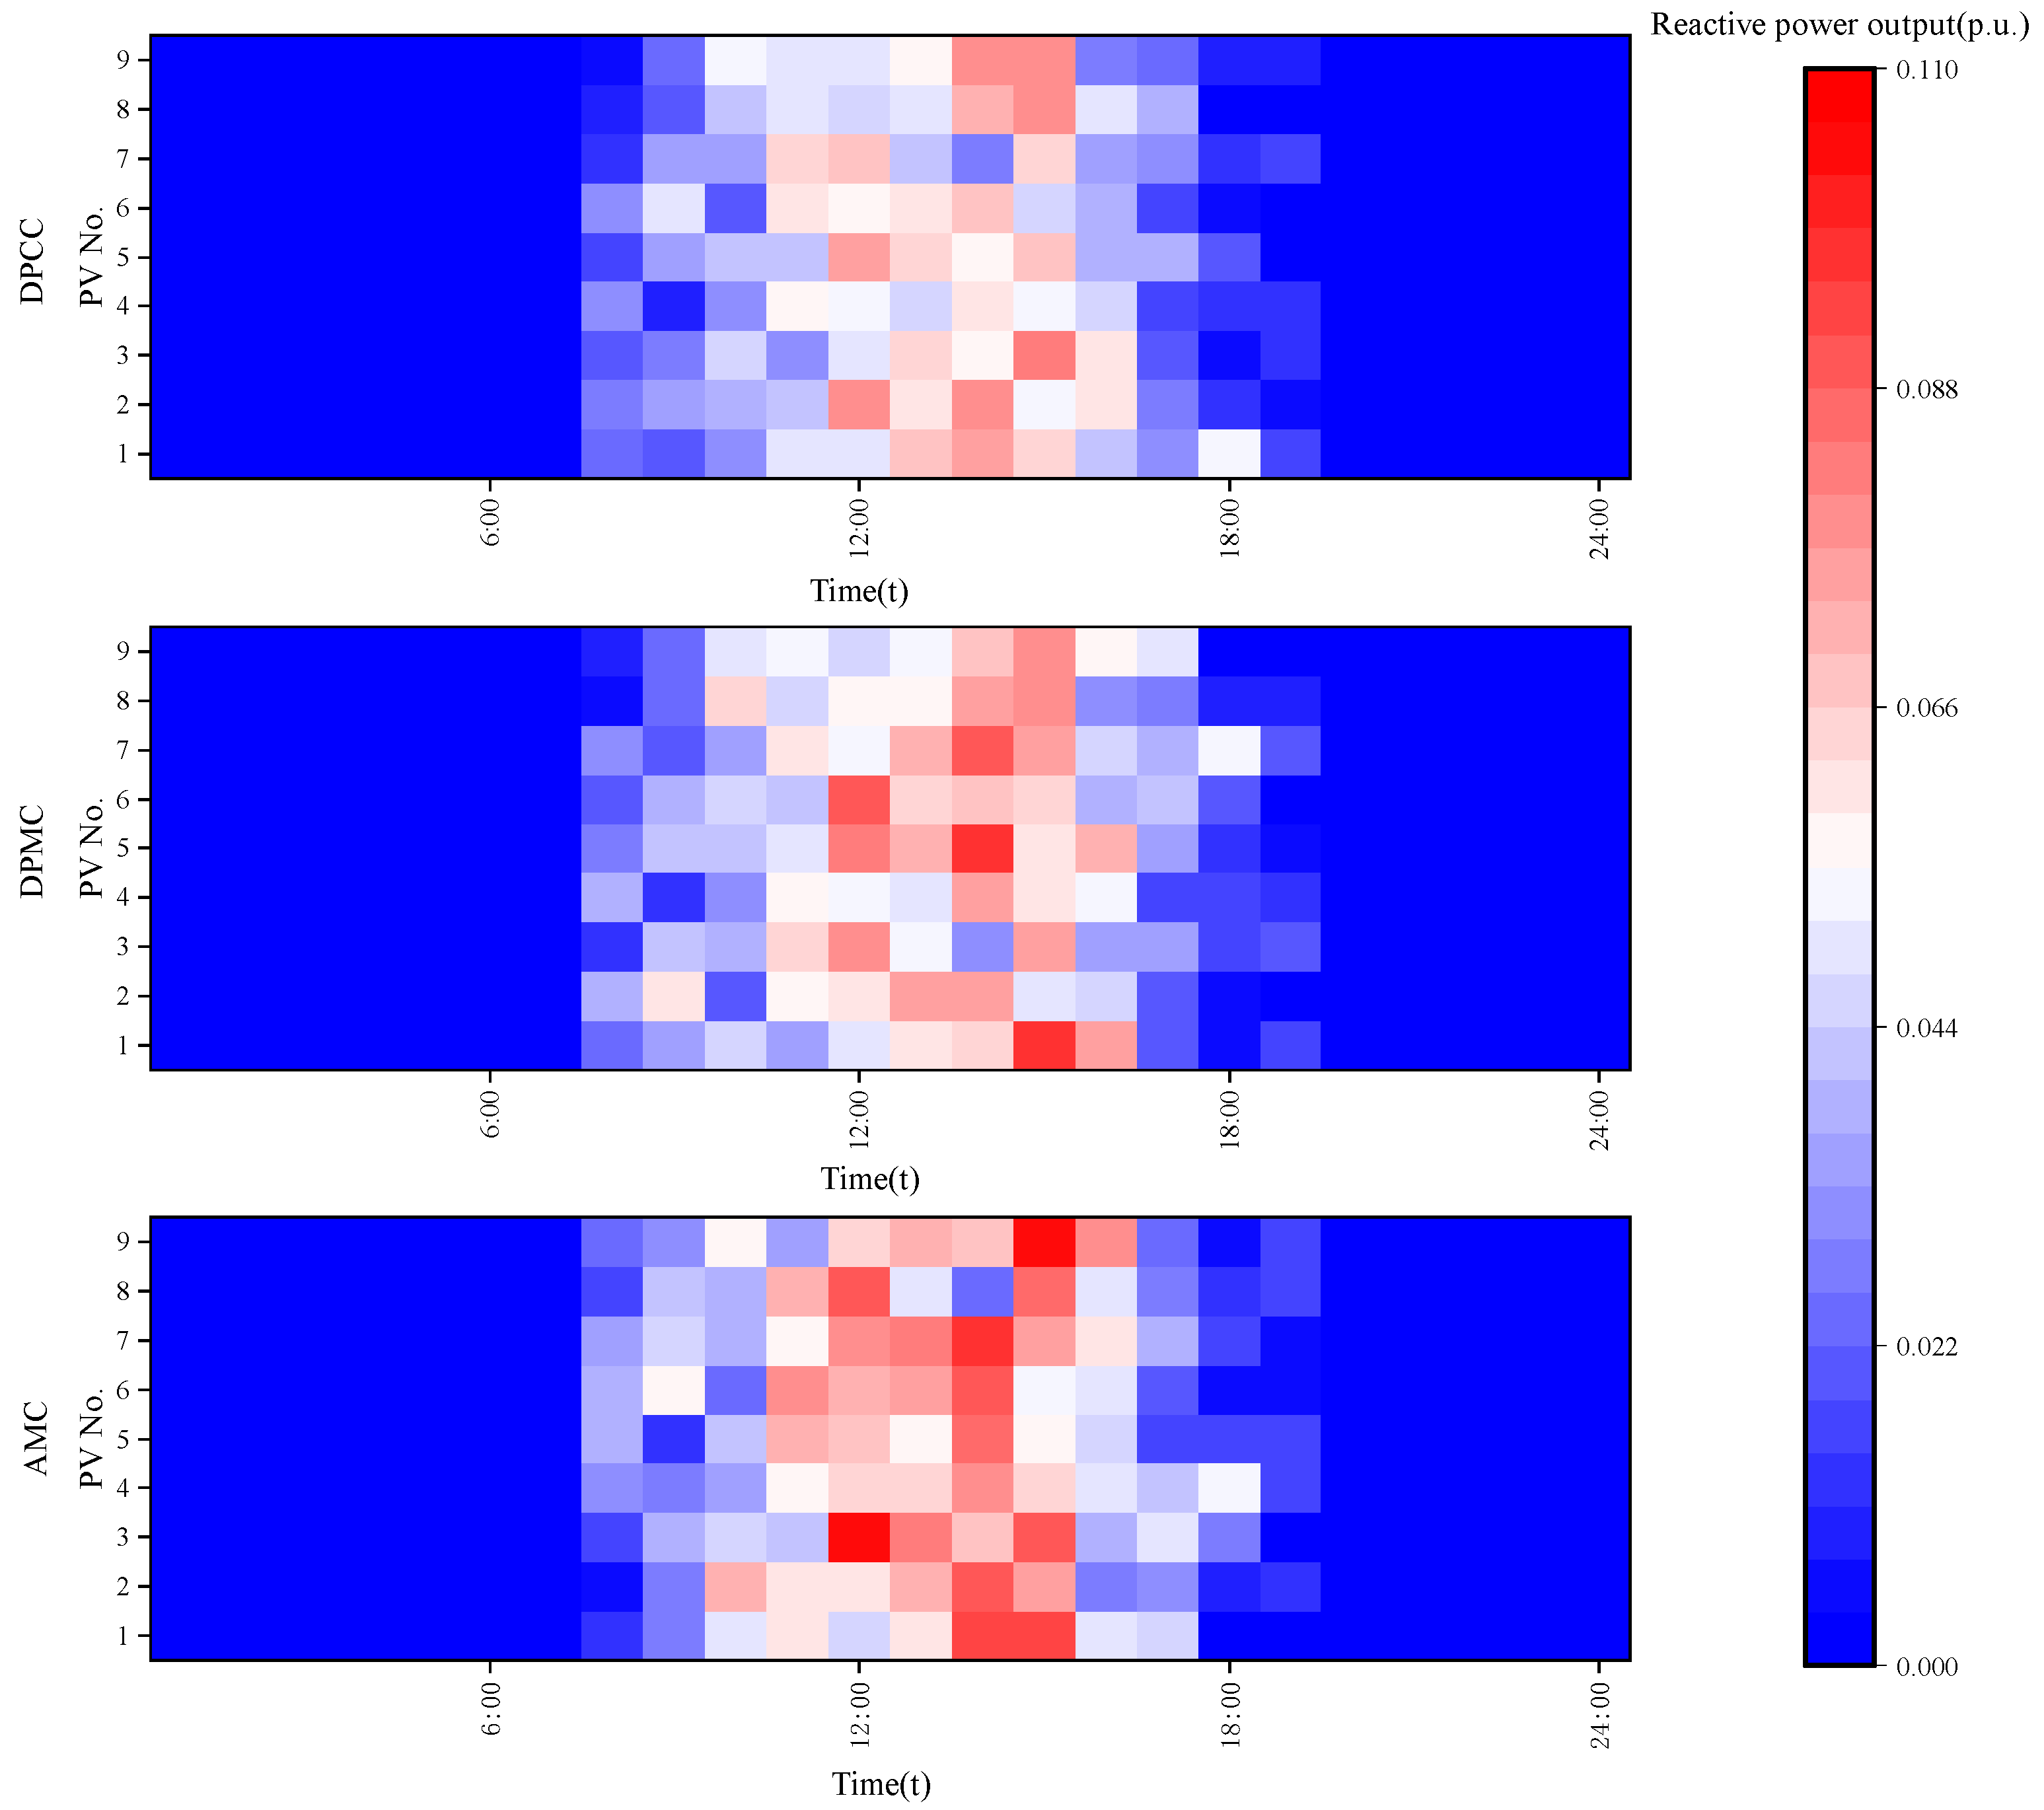
In the model proposed in this paper, a proportional relationship is observed between the reactive power outputs of PV inverters belonging to the same cluster across all time periods. For PV No.5 and No.9, a larger reactive power sensitivity MQ is exhibited due to their short electrical distance to the cluster control center, and correspondingly, higher reactive power outputs are delivered by their inverters. No additional PV nodes are equipped in the cluster where PV No.6 is located, thus a greater reactive power regulation burden is borne by this unit during the period with high PV generation and load levels, namely the time window from 7:00 to 19:00. However, when the droop control strategy is adopted, PV inverters No. 2, 5, 6, and 9 bear excessive reactive power output burden, resulting in heavy operating stress on the local power flow, while the other inverters remain nearly idle, which leads to the waste of regulation resources.
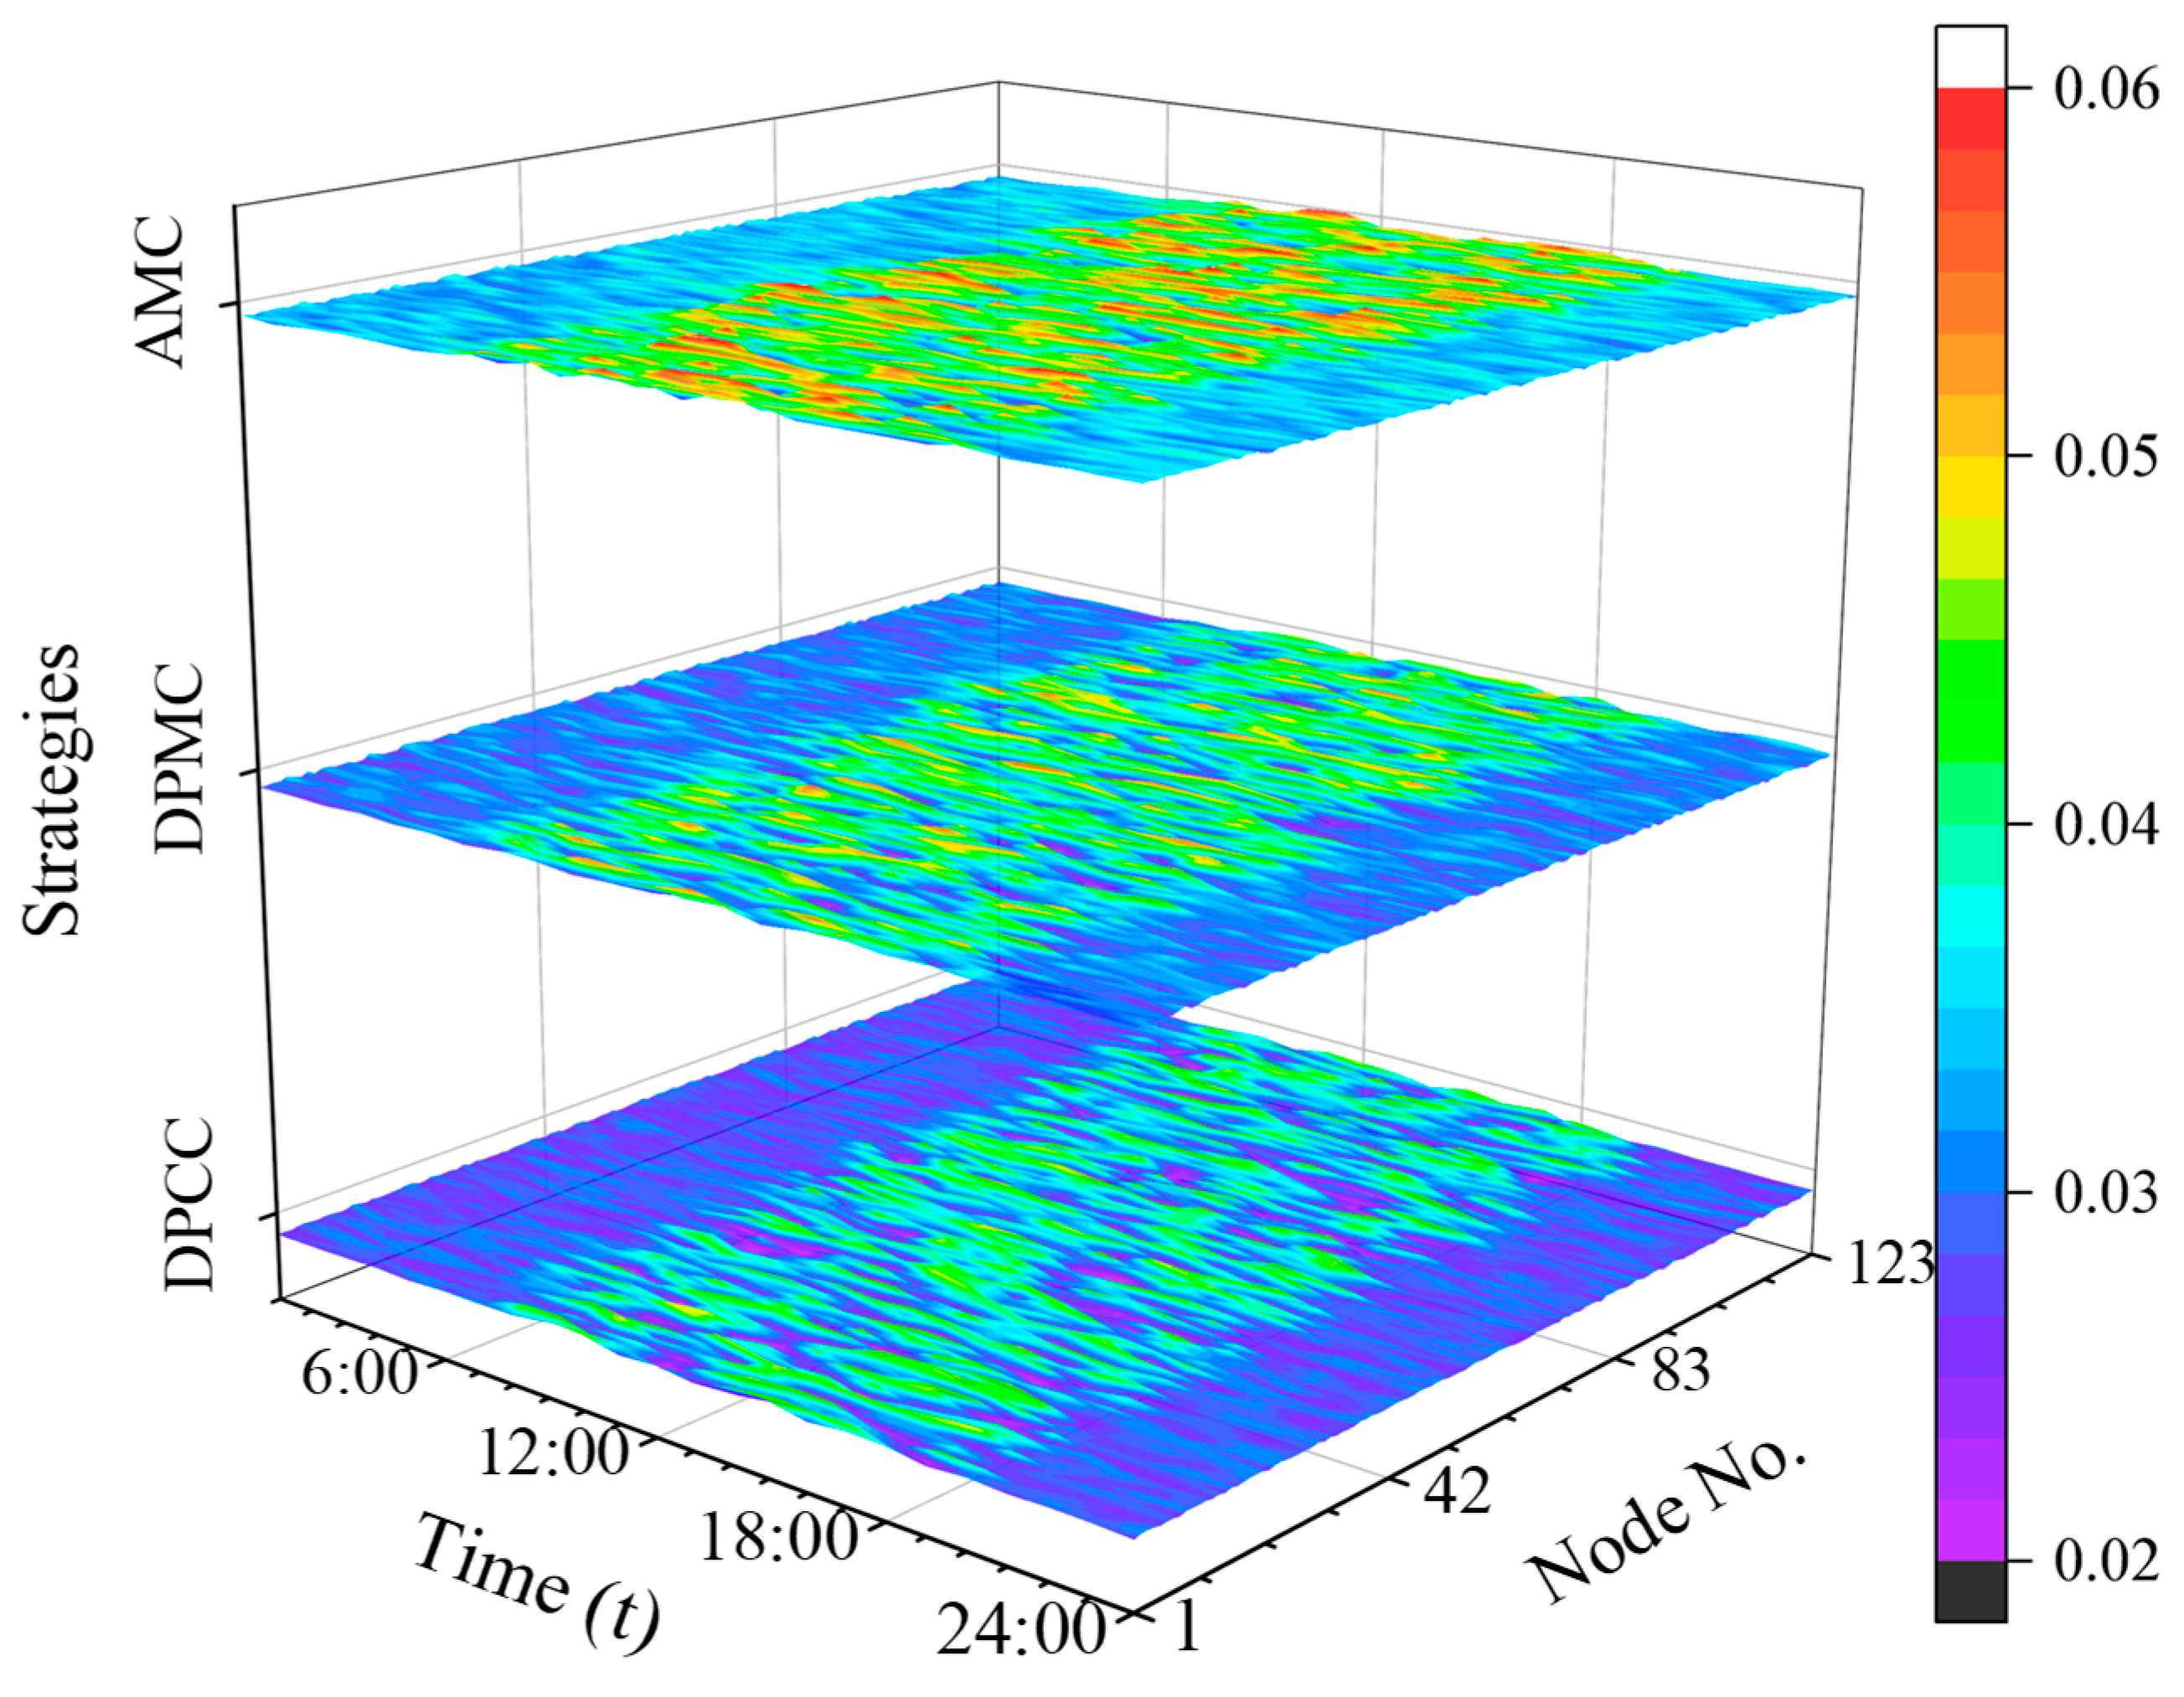
The effectiveness of the proposed model in reducing PV curtailment of PV nodes and maintaining system stability is further studied by analyzing the total PV curtailment and voltage deviation in different time periods. The total PV curtailment in different periods is shown in Figure 8.
It can be seen that there is a certain amount of PV curtailment in the system during the PV output period from 7:00 to 19:00. For the proposed DPCC model in this paper, the PV output is high and the load slightly decreases from 12:00 to 15:00, resulting in the largest PV curtailment in this period, with an average value of 0.060 p.u. and a maximum value of 0.079 p.u. Although the PV output is high from 10:00 to 12:00, the load is also high at the same time, so the average PV curtailment in this period is 0.048 p.u., with a maximum value of 0.073 p.u. In contrast, the AMC and DPMC models have insufficient capacity in source-load matching and voltage regulation through cluster partitioning, resulting in increased PV curtailment at PV nodes. Especially under the AMC algorithm, the maximum PV curtailment at PV nodes reaches 0.104 p.u.
The influence of the proposed model on voltage volatility is further analyzed, as shown in Figure 9.
It can be seen that the absolute value of voltage deviation of the proposed DPCC model in each period is controlled below 5%, which meets the grid requirements for voltage deviation. During the PV output period from 7:00 to 19:00, the voltage deviation value increases slightly, with an average value of 0.0034 p.u. and a maximum value of 0.0048 p.u. In other periods, the system is only powered by the main grid, and the voltage deviation value decreases slightly, about 0.0029 p.u. For the AMC and DPMC models, the difficulty of flexible control increases, resulting in larger voltage deviation. Among them, the voltage deviation of each node of the DPMC model exceeds 5% for 95 times in the whole period, and that of the AMC model exceeds 5% for 325 times.

6.4. Sensitivity Analysis

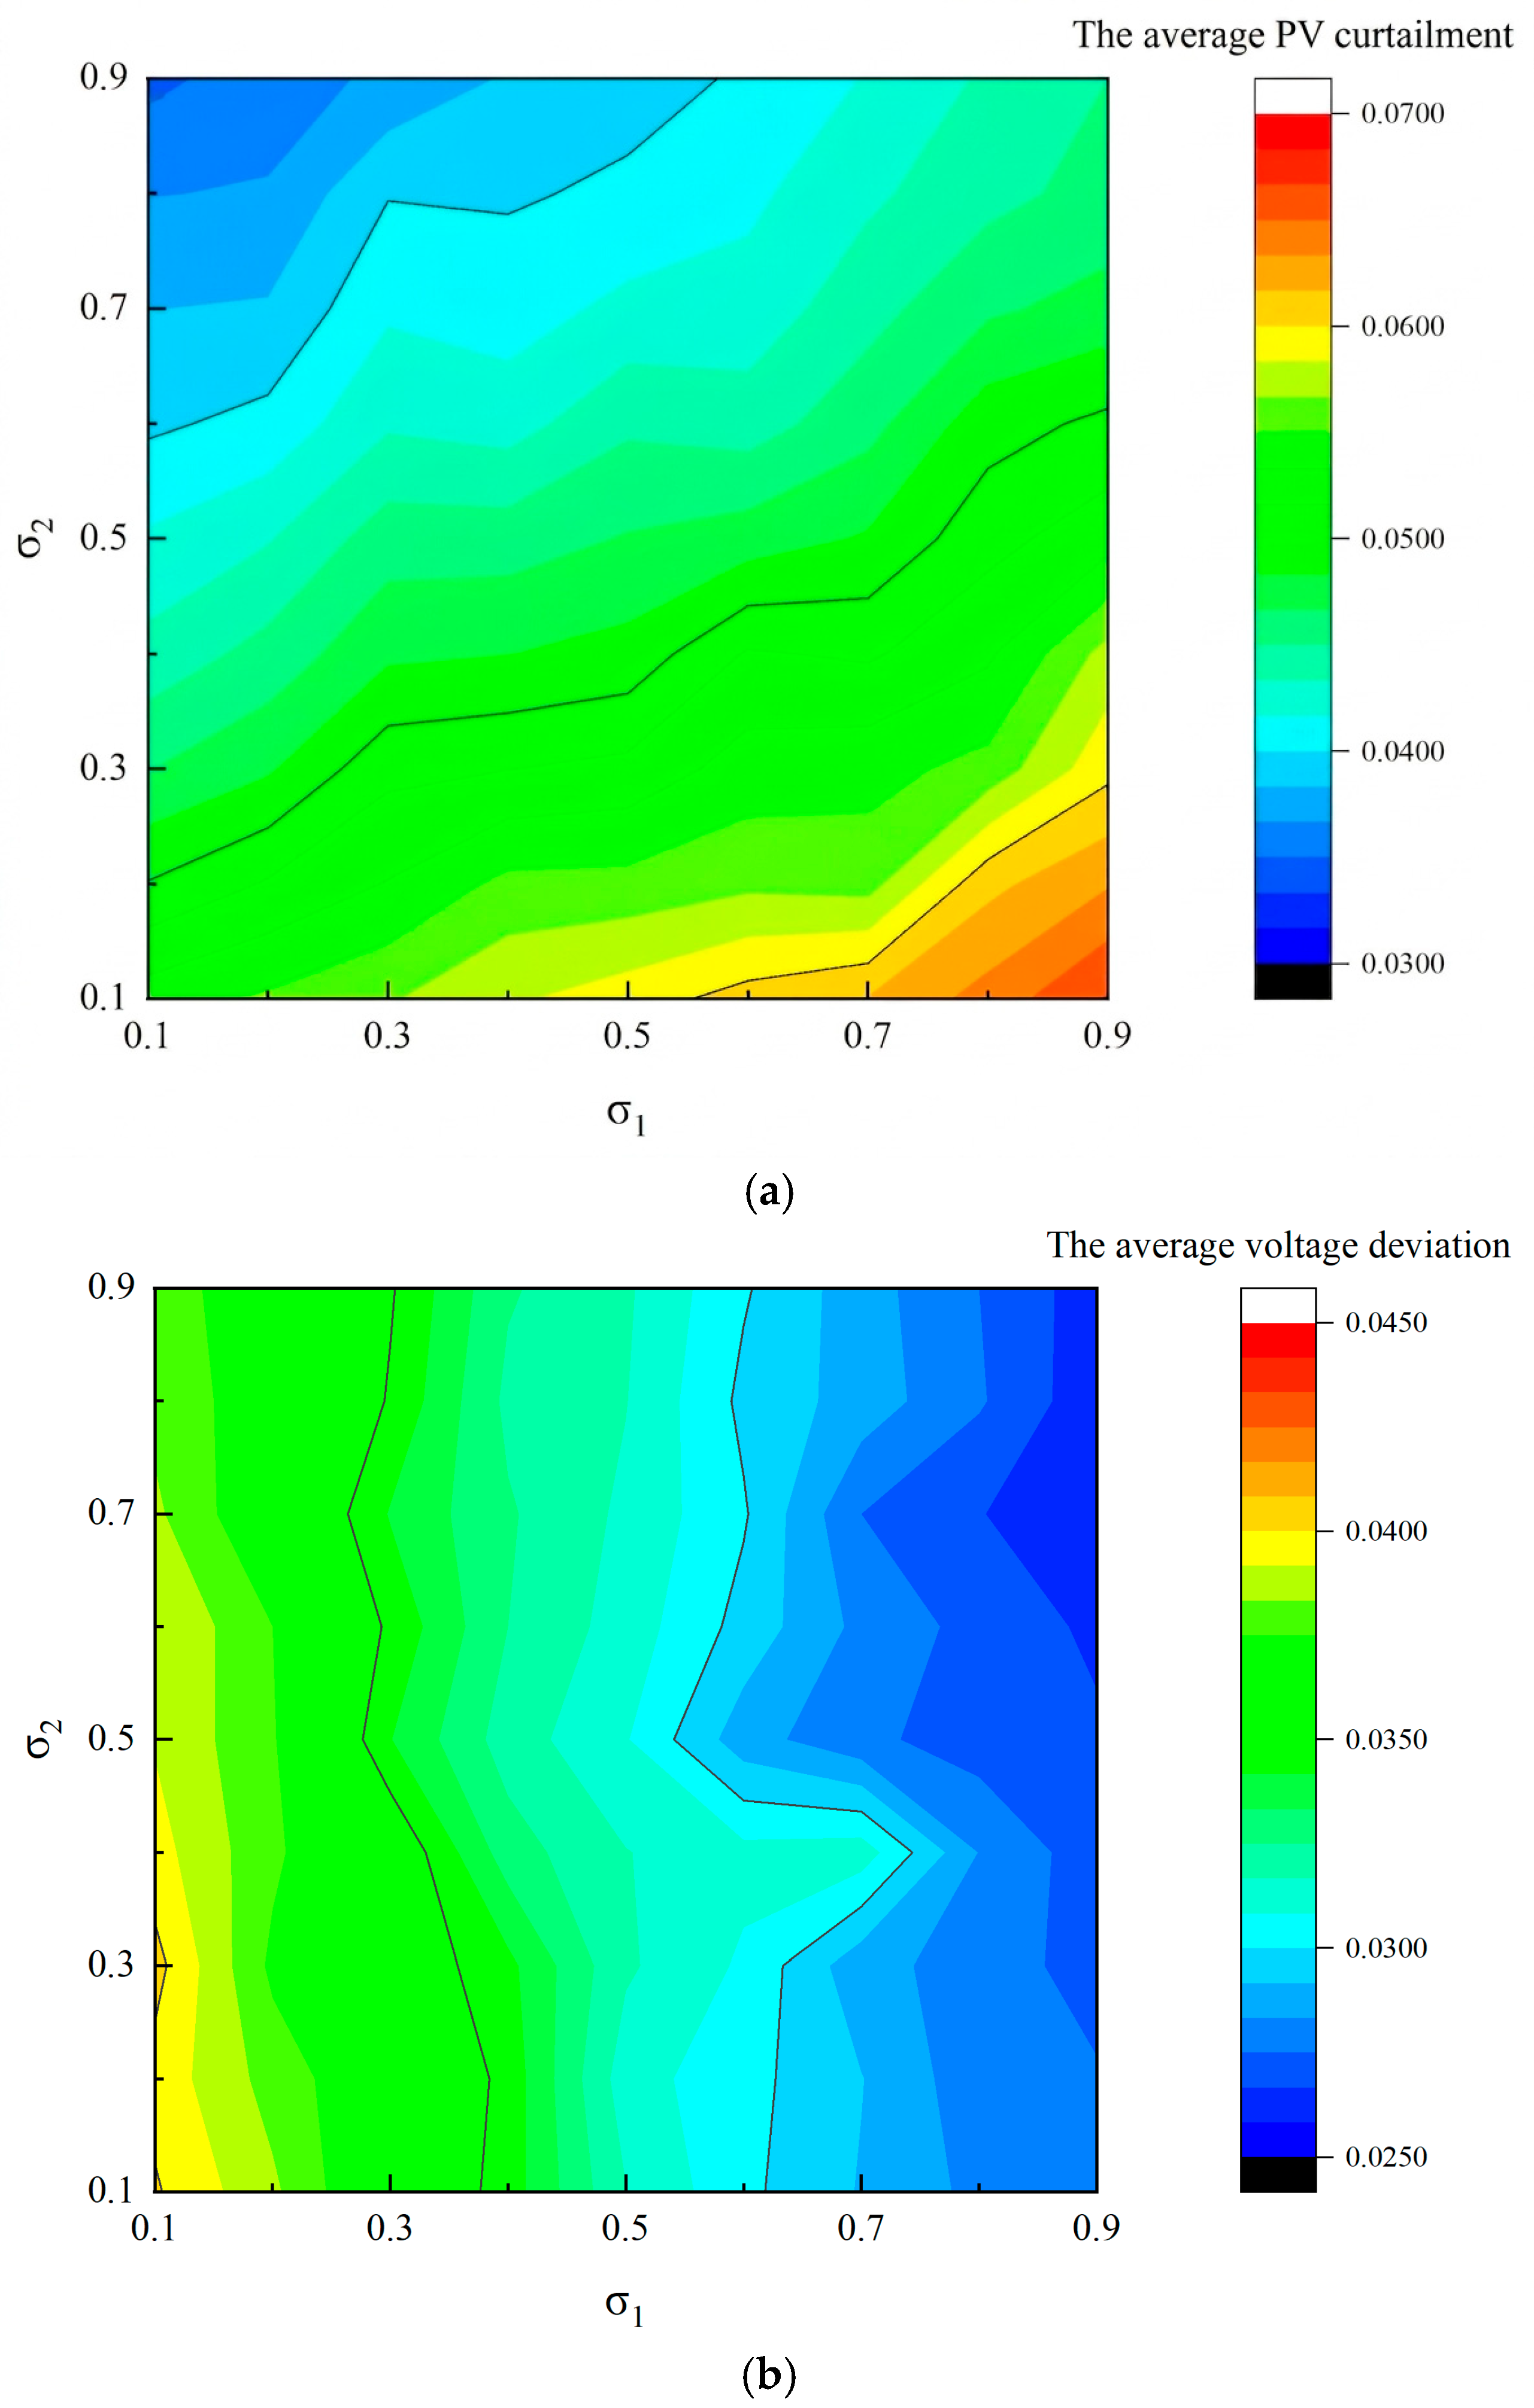
By adjusting the value of the weight σ 1 and σ 2 in Equation (20), the changes in the average PV curtailment and average voltage deviation of PV nodes under different weights are explored, as shown in Figure 10.
In Figure 10, the average PV curtailment increases as parameter σ 1 rises from 0.1 to 0.9 while parameter σ 2 decreases from 0.9 to 0.1. It reaches a maximum value of 0.0669 at σ 1 = 0.9 and σ 2 = 0.1, and attains a minimum value of 0.0345 at σ 1 = 0.1 and σ 2 = 0.9. As σ 1 increases from 0.1 to 0.9, the average voltage deviation decreases gradually, dropping from approximately 0.040 to 0.027. The value of σ 2 has a negligible impact on the average voltage deviation. With the growth of σ 2 , the allowable reactive power output of PV units increases, which enhances the voltage regulation capability of the nodes, thereby resulting in a slight reduction in the average voltage deviation.
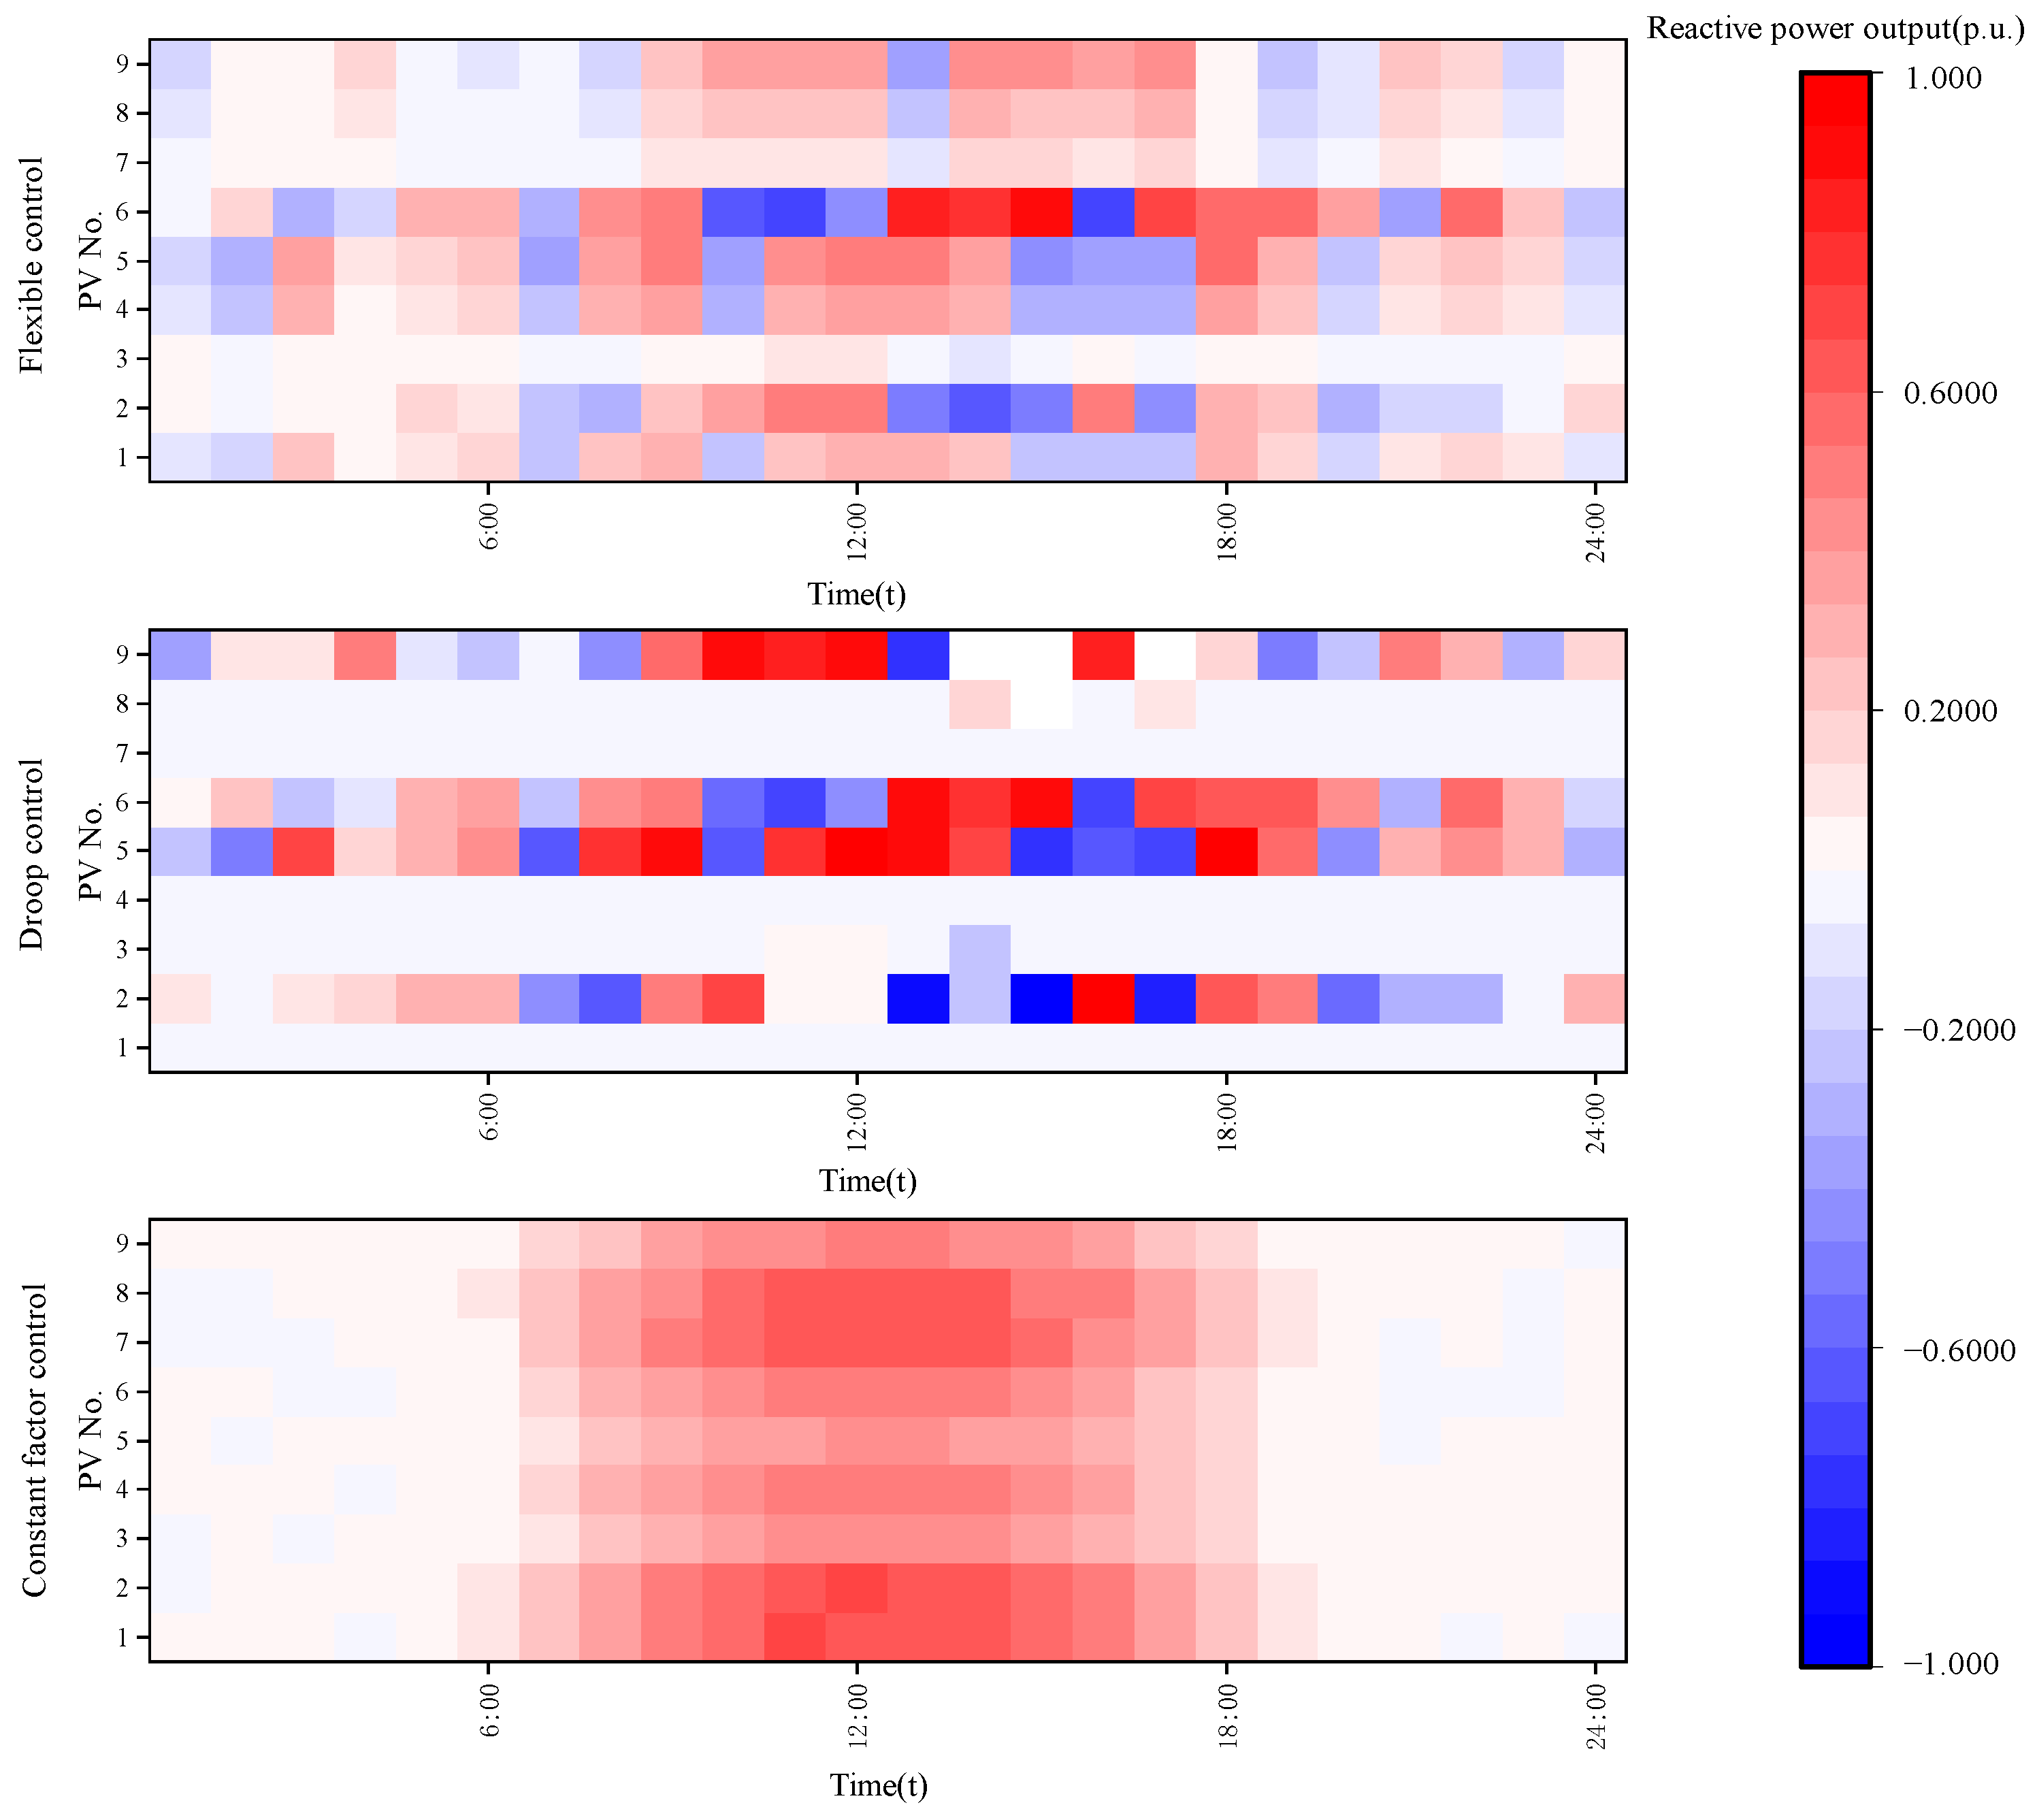
Take the cluster partitioning results at 12:00 as an example. In Figure 4b, node 8, node 35, node 57, and node 76 are determined as key nodes due to their maximum electrical density. At this time, the ADMM algorithm is used for a distributed solution. Meanwhile, two comparative strategies are set up simultaneously: in one strategy, the droop control function of the inverter with the closest electrical distance to the cluster control node is predefined, and the remaining inverters are activated for regulation when the reactive power regulation capacity fails to meet the control requirements; in the other strategy, reactive power is output in a constant power factor mode, with the power factor fixed at 0.9 throughout the operation. The reactive power outputs of the PV inverters at each node under the three scenarios are presented in Figure 11.
It can be seen that the actual output of PV inverters differs significantly under the three control strategies. The reactive power output of PV inverters under the flexible control scheme proposed in this paper is relatively evenly distributed. In contrast, the reactive power output under the droop control strategy is concentrated in only a few inverters, which tends to cause line congestion, increase the output pressure on individual inverters, and result in inefficient use of resources. For the constant power factor control strategy, the PV reactive power output follows the trend of the PV generation curve. However, this scheme only considers the PV output characteristics while ignoring the actual voltage characteristics of the distribution network, making it less reasonable in practical applications.

7. Conclusions

Aiming at the key problems caused by high-proportion distributed PV grid integration, such as voltage violations, reverse power flow, PV curtailment loss, and a sharp increase in network loss in distribution networks, an optimized flexible control method for PV inverters in distribution networks considering dynamic cluster partitioning is proposed in this paper. This method reconstructs the local power symmetry of the distribution network through dynamic cluster partitioning, and ensures the control symmetry between clusters through distributed collaborative optimization of inverter flexible control parameters, realizing the dual objectives of safe and stable operation of the distribution network and efficient consumption of new energy. The main research results and conclusions of this paper are as follows:
(1) A comprehensive performance index system integrating improved modularity, source-load matching degree, and voltage sensitivity is constructed, which fully covers the electrical connection symmetry, source-load power symmetry, and voltage regulation response characteristics of DN cluster partitioning. It provides a scientific and comprehensive quantitative basis for dynamic cluster partitioning, and can effectively ensure the electrical independence, source-load matching, and regulation efficiency of the partitioned clusters.
(2) Built upon a dynamic monitoring mechanism, an improved PSO algorithm for cluster partitioning is proposed, with its core optimization targeting the premature convergence to local optima in conventional PSO. Equipped with enhanced discrete variable adaptability and a dedicated cluster partitioning repair strategy, it also resolves the defects of poor discrete variable processing and weak constraint handling in traditional PSO.
(3) A model for general flexible control of PV inverters is established, and an optimization model with the objectives of minimizing voltage deviation, PV curtailment loss, and PV reactive power output is constructed. The distributed and efficient solution of the model is realized based on the ADMM algorithm. This method does not require global centralized control, and can obtain the globally optimal flexible control parameters through autonomous optimization within clusters and collaborative iteration between clusters, which takes into account both optimization accuracy and solution efficiency.
(4) Multi-dimensional simulation results based on the modified IEEE 123-node test feeder show that the proposed method can strictly control the full-period node voltage deviation of the distribution network within 5% of the rated voltage on the basis of improving the PV consumption rate, and completely solve the voltage violation problem caused by high-proportion PV grid integration.
The proposed method has the characteristics of flexible architecture, high solution efficiency, and strong engineering practicability, which can provide effective technical support for voltage regulation and economic operation of active distribution networks with high-proportion new energy integration. Future research will further consider the stochastic uncertainty of source-load output, integrate multiple adjustable resources such as energy storage and flexible controllable loads, and construct a multi-resource collaborative cluster hierarchical optimization regulation system, so as to further improve the acceptance capacity and operation resilience of distribution networks for high-proportion new energy.

Author Contributions

Conceptualization, S.L. and X.X.; Methodology, X.X. and S.L.; Software, X.X. and W.X.; Validation, W.X., X.L. and Z.G.; Formal analysis, X.X. and W.X.; Investigation, W.X. and Z.G.; Resources, X.L. and Z.G.; Data curation, W.X. and X.L.; Writing—original draft preparation, X.L. and S.L.; Writing—review and editing, S.L., X.X., W.X., X.L. and Z.G.; Visualization, X.X.; Supervision, S.L.; Project administration, S.L. and Z.G.; Funding acquisition, S.L. All authors have read and agreed to the published version of the manuscript.

Funding

This research was funded by the State Grid Jiangsu Electric Power Co., Ltd. Science and Technology Project (J2025004).

Data Availability Statement

The original contributions presented in this study are included in the article. Further inquiries can be directed to the corresponding author.

Conflicts of Interest

The authors, Shukang Lyu, Xiaolong Xiao, Wenqiang Xie, Xiaoxing Lu, and Ziran Guo were employed by State Grid Jiangsu Electric Power Co., Ltd. Research Institute. The authors declare that this study received funding from the State Grid Jiangsu Electric Power Co., Ltd. Science and Technology Project (J2025004). The funder was not involved in the study design, collection, analysis, interpretation of data, the writing of this article, or the decision to submit it for publication.

References

  1. Zhang, W.; Zheng, Z.; Liu, H. Droop control method to achieve maximum power output of photovoltaic for parallel inverter system. CSEE J. Power Energy Syst. 2021, 8, 1636–1645. [Google Scholar] [CrossRef]
  2. Fan, H.; Sun, K.; Ding, Z.; Zhang, Z.; Qiu, W.; Dong, Y.; Sun, Y. Overvoltage suppression strategy after short circuit faults applied to PV systems. In Proceedings of the 2023 IEEE Industry Applications Society Annual Meeting (IAS), Nashville, TN, USA, 29 October–2 November 2023; IEEE: New York, NY, USA, 2023; pp. 1–9. [Google Scholar]
  3. Saimadhuri, K.N.Y.; Janaki, M. Advanced control strategies for microgrids: A review of droop control and virtual impedance techniques. Results Eng. 2025, 25, 103799. [Google Scholar]
  4. Zhao, B.; Xu, Z.; Xu, C.; Wang, C.; Lin, F. Network partition-based zonal voltage control for distribution networks with distributed PV systems. IEEE Trans. Smart Grid 2017, 9, 4087–4098. [Google Scholar] [CrossRef]
  5. Li, H.; Song, K.; Meng, F.; Wang, Z.; Wang, C. Voltage control strategy of a high-permeability photovoltaic distribution network based on cluster division. Front. Energy Res. 2024, 12, 1377841. [Google Scholar] [CrossRef]
  6. Liu, Z.; Zhang, J.; Yue, J.; An, R.; Shu, J.; Wang, H. Research on cluster control of distribution network with high-penetration distributed photovoltaic. In Proceedings of the 2024 IEEE 2nd International Conference on Power Science and Technology (ICPST), Dali, China, 9–11 May 2024; IEEE: New York, NY, USA, 2024; pp. 1600–1605. [Google Scholar]
  7. Liu, Z.; Guo, G.; Gong, D.; Xuan, L.; He, F.; Wan, X.; Zhou, D. Cluster Partitioning Method for High-PV-Penetration Distribution Network Based on mGA-PSO Algorithm. Energies 2025, 18, 1197. [Google Scholar]
  8. Yang, S.; Wang, C.; Sun, S.; Cheng, Y.; Yu, P. Cluster partition-based two-layer expansion planning of grid–resource–storage for distribution networks. Front. Energy Res. 2024, 12, 1390073. [Google Scholar]
  9. Liu, X.; Zhao, P.; Qu, H.; Liu, N.; Zhao, K.; Xiao, C. Optimal Placement and Sizing of Distributed PV-Storage in Distribution Networks Using Cluster-Based Partitioning. Processes 2025, 13, 1765. [Google Scholar]
  10. Meng, T.; Lv, X.; Li, C.; Li, D.; Zhang, Y.; Meng, X. Research on partition method of distributed photovoltaic cluster based on modularity index and absorption ability. In Proceedings of the 2023 2nd International Conference on Smart Grids and Energy Systems (SGES), Guangzhou, China, 25–27 August 2023; IEEE: New York, NY, USA, 2023; pp. 323–327. [Google Scholar]
  11. Zhu, X.; Zhang, Z.; Zhou, H.; Chen, X. Short-Term Electricity Load Forecasting Based on PCA-PSO-Kmeans++ Clustering and Improved DSC. Concurr. Comput. Pract. Exp. 2026, 38, e70549. [Google Scholar]
  12. Prompook, T.; Jittanon, S.; Phumeesut, K.; Termritthikun, C.; Ketjoy, N.; Chamsa-Ard, W.; Meesuk, N.; Madtharad, C.; Suriwong, T. Impact of distance measures in adaptive K-means clustering on load profiles and spatial patterns of distributed substations in Thailand. Sci. Rep. 2025, 15, 21123. [Google Scholar] [CrossRef] [PubMed]
  13. Chen, I.C.; Cheng, K.L. Agent-based modeling framework for predicting regional electricity consumption considering occupant behavior shift and exogenous policy impact. Energy Build. 2024, 324, 114897. [Google Scholar] [CrossRef]
  14. Chai, Y.; Guo, L.; Wang, C.; Zhao, Z.; Du, X.; Pan, J. Network partition and voltage coordination control for distribution networks with high penetration of distributed PV units. IEEE Trans. Power Syst. 2018, 33, 3396–3407. [Google Scholar] [CrossRef]
  15. Li, Y.; Feng, B.; Wang, B.; Sun, S. Joint planning of distributed generations and energy storage in active distribution networks: A Bi-Level programming approach. Energy 2022, 245, 123226. [Google Scholar] [CrossRef]
  16. Tayab, U.B.; Bin Roslan, M.A.; Hwai, L.J.; Kashif, M. A review of droop control techniques for microgrid. Renew. Sustain. Energy Rev. 2017, 76, 717–727. [Google Scholar] [CrossRef]
  17. Shahgholian, G.; Moradian, M.; Fathollahi, A. Droop control strategy in inverter-based microgrids: A brief review on analysis and application in islanded mode of operation. IET Renew. Power Gener. 2025, 19, e13186. [Google Scholar]
  18. Ayyagari, K.S.; Gonzalez, R.; Jin, Y.; Alamaniotis, M.; Ahmed, S.; Gatsis, N. Learning reactive power control polices in distribution networks using conditional value-at-risk and artificial neural networks. J. Mod. Power Syst. Clean. Energy 2023, 11, 201–211. [Google Scholar]
  19. Hu, Y.; Liu, W.; Wang, W. A two-layer volt-var control method in rural distribution networks considering utilization of photovoltaic power. IEEE Access 2020, 8, 118417–118425. [Google Scholar]
  20. Xu, R.; Zhang, C.; Xu, Y.; Dong, Z.; Zhang, R. Multi-objective hierarchically-coordinated volt/var control for active distribution networks with droop-controlled PV inverters. IEEE Trans. Smart Grid 2021, 13, 998–1011. [Google Scholar]
  21. Zhang, C.; Xu, Y. Hierarchically-coordinated voltage/VAR control of distribution networks using PV inverters. IEEE Trans. Smart Grid 2020, 11, 2942–2953. [Google Scholar]
  22. Li, J.; Wang, X.; Guo, Q.; Yang, C.; Chen, Y.; Zhao, R.; Li, M. A cluster-optimized regulation method for distribution networks considering distributed photovoltaic heterogeneous characteristics. Int. J. Electr. Power Energy Syst. 2025, 170, 110857. [Google Scholar] [CrossRef]
  23. Karamdel, S.; Liang, X.; Faried, S.O. A novel stochastic volt/Var/pressure optimization-based conservation voltage reduction technique in integrated electricity and natural gas systems with PV smart inverters. IEEE Trans. Ind. Appl. 2025, 61, 2271–2286. [Google Scholar]
  24. Hemalatha, G.; Thirumoorthi, P. Droop control based energy management of distributed batteries using hybrid approach. J. Energy Storage 2024, 99, 113353. [Google Scholar] [CrossRef]
  25. Zheng, Z.; Li, S.; Huang, C.; Chen, Y.; Ma, J.; Zhang, M.; Xiao, X.; Ren, J.; Fu, Q. Hierarchical proactive control based grid-forming energy router for industrial microgrid. IEEE Trans. Energy Convers. 2024, 40, 2642–2654. [Google Scholar] [CrossRef]
  26. Vergara, P.P.; Salazar, M.; Mai, T.T.; Nguyen, P.H.; Slootweg, H. A comprehensive assessment of PV inverters operating with droop control for overvoltage mitigation in LV distribution networks. Renew. Energy 2020, 159, 172–183. [Google Scholar] [CrossRef]
  27. Lusis, P.; Andrew, L.L.H.; Liebman, A.; Tack, G. The added value of coordinating inverter control. IEEE Trans. Smart Grid 2020, 12, 1238–1248. [Google Scholar] [CrossRef]
  28. Liu, S.; Ma, Y.; Yu, W.; E, X.; Huang, Y.; Liu, J.; Mei, H. Construction of Transmission Line Segments Assessment Model Based on Correlation Analysis and Analytic Hierarchy Process Method. Energies 2026, 19, 1374. [Google Scholar] [CrossRef]
  29. Oladipo, S.O.; Sun, Y.; Amole, A.O. Analysis of the impact of clustering techniques and parameters on evolutionary-based hybrid models for forecasting electricity consumption. IEEE Access 2023, 11, 82838–82856. [Google Scholar] [CrossRef]
  30. Kapoor, S.; Hendriks, J.; Wills, A.G.; Blackhall, L.; Mahmoodi, M. Modified Distflow: Novel Power Flow Model for Distribution Grid. In Proceedings of the 2024 IEEE PES Innovative Smart Grid Technologies Europe (ISGT EUROPE), Dubrovnik, Croatia, 14–17 October 2024; IEEE: New York, NY, USA, 2024; pp. 1–5. [Google Scholar]
Figure 1. Flexible control model and flow chart of PV clusters.
Symmetry 18 01127 g001
Figure 2. Topology of the IEEE 123-node test feeder.
Symmetry 18 01127 g002
Figure 3. System load and PV output curves.
Symmetry 18 01127 g003
Figure 4. (a) Partitioning results at 6:00. (b) Partitioning results at 12:00.
Symmetry 18 01127 g004aSymmetry 18 01127 g004b
Figure 5. Number of partitions.
Symmetry 18 01127 g005
Figure 6. Radar chart of comprehensive indices.
Symmetry 18 01127 g006
Figure 7. Comparison of 3 metaheuristic algorithms.
Symmetry 18 01127 g007
Figure 8. Distribution of PV curtailment at PV nodes.
Symmetry 18 01127 g008
Figure 9. Distribution of the absolute value of voltage deviation at each node.
Symmetry 18 01127 g009
Figure 10. (a) Changes in PV curtailment under different weights. (b) Changes in voltage deviation under different weights.
Symmetry 18 01127 g010
Figure 11. Outputs of three scenarios.
Symmetry 18 01127 g011
Disclaimer/Publisher’s Note: The statements, opinions and data contained in all publications are solely those of the individual author(s) and contributor(s) and not of MDPI and/or the editor(s). MDPI and/or the editor(s) disclaim responsibility for any injury to people or property resulting from any ideas, methods, instructions or products referred to in the content.