Article

Crown Pillar Thickness Optimization with Deformation Symmetry and Simulation Validation in Open Pit to Underground Mining Transition: A Kumusayi Li-Nb-Ta Case Study


1
School of Geology and Mining Engineering, Xinjiang University, Urumqi 830047, China
2
Key Laboratory of Green and Efficient Mining and Ecological Restoration in High-Altitude Arid Regions of Xinjiang, Urumqi 830047, China
3
Xinjiang Green Blasting Engineering Technology Research Center, Changji 831100, China
4
Xinjiang Sanxin Coal Industry Co., Ltd., Yili 835000, China
*
Authors to whom correspondence should be addressed.
Symmetry 2026, 18(6), 928; https://doi.org/10.3390/sym18060928 (registering DOI)
Submission received: 5 May 2026 / Revised: 20 May 2026 / Accepted: 25 May 2026 / Published: 29 May 2026
(This article belongs to the Section Engineering and Materials)

Abstract

Determining the safe thickness of a boundary crown pillar is critical during the transition from open-pit to underground mining, as it directly affects both mining safety and resource recovery. Crown pillar instability is commonly associated with asymmetric stress redistribution, nonuniform deformation, and progressive plastic failure. In this study, the Kumusayi Li-Nb-Ta mine in Xinjiang, China, was selected as an engineering case to optimize the boundary crown pillar thickness and evaluate its deformation characteristics. Four theoretical methods, namely the load transfer intersection method, span-to-thickness ratio method, simplified structural beam method, and Rubeneeite formula method, were first used to determine the feasible thickness range. The calculated thicknesses were 19.99, 14.00, 29.81, and 10.41 m, respectively, yielding an engineering design interval of 14.00–29.81 m. Based on this interval, four thickness schemes of 15, 20, 25, and 30 m were evaluated using FLAC3D simulations in terms of stress redistribution, displacement evolution, surface movement, plastic-zone development, and deformation symmetry. The results show that the 15 m pillar exhibits pronounced stress concentration, asymmetric deformation, and through-going plastic failure, indicating insufficient stability. Although the 20 m pillar improves the load-bearing capacity, a potential connected failure path remains. At 25 m, the high-stress zone becomes localized, the plastic zone no longer penetrates the pillar, and the maximum vertical displacement decreases by approximately 27.0% compared with the 15 m scheme. Increasing the thickness to 30 m provides limited additional improvement, with less than a 2% reduction in maximum vertical displacement compared with the 25 m scheme. Physical similarity model tests further confirm that a 20.8 cm model pillar, corresponding to a 25 m prototype pillar, effectively prevents through-going cracking and overall slope sliding. Therefore, a 25 m boundary crown pillar is recommended for the Kumusayi mine.

1. Introduction

With the gradual depletion of shallow mineral resources and the continuous increase in mining depth, the transition from open-pit mining to underground mining after reaching the economically optimal final pit limit has become an important strategy for the sustainable development of mineral resources [1,2,3]. During this transition, a boundary crown pillar of sufficient thickness must be retained between the open-pit floor and the underground stopes. This pillar is required to support overlying loads, isolate mining-induced disturbances, and prevent geohazards such as surface collapse, water inrush, and mud inrush [4,5]. The rational determination of the safe thickness of the boundary crown pillar is directly related to the stability of open-pit slopes, surface structures, and underground stopes, and is therefore a key technical issue in the design of combined open-pit and underground mining systems [6,7,8,9]. An insufficient pillar thickness may cause through-going roof failure and large-scale surface subsidence [10,11,12], whereas an excessively thick pillar may sterilize a substantial amount of mineral resources and reduce the economic efficiency of mining [13]. Therefore, this study focuses on determining an economically reasonable and mechanically safe boundary crown pillar thickness for open-pit to underground mining transitions.
Szwedzicki conducted a retrospective analysis of surface crown pillar collapses in several metal mines in Western Australia and the Northern Territory, and summarized the characteristics of surface subsidence, crack development, and underground rock mass response before and after pillar failure. The study indicated that crown pillar failure generally evolves from progressive damage to sudden collapse [14]. Flores, focusing on the transition from open-pit mining to underground block caving, systematically investigated stress redistribution and deformation patterns in the overlying strata and crown pillar during the transition process in his doctoral dissertation. His work revealed the full-process response of the rock mass from “flexure–damage–instability” at different mining stages [4]. Based on large-scale microseismic monitoring data from the Palabora copper mine, Glazer and Hepworth conducted an inverse analysis of the crown pillar failure mechanism and proposed that unloading and subsequent reloading may lead to the formation of a destressed zone within the crown pillar, thereby triggering overall instability [15]. Subsequently, from the perspective of major hazard management in cave mining, Flores-Gonzalez further incorporated crown pillar instability into the chain of multiple hazard events associated with caving operations, emphasizing its critical role in hazard evolution [16]. Based on more than 500 cases of stable and failed hard-rock crown pillars, Carter proposed the scaled span empirical chart method, in which scaled span and rock mass quality are used as key parameters, and provided detailed guidelines for assessing the stability of surface crown pillars [17]. Under combined open-pit and underground mining conditions, Bakhtavar et al. further integrated the scaled span method with multivariate regression analysis and established a quantitative relationship between crown pillar thickness and overburden stability between the open-pit floor and the block-caving stope, providing a basis for optimizing crown pillar thickness [18]. To overcome the limitations of purely empirical methods, researchers have gradually developed crown pillar thickness criteria based on rock mechanics and limit equilibrium theory. Lunder and Pakalnis, based on 178 hard-rock pillar cases, proposed the well-known confinement formula, which established a link between rock mass strength theory and empirical statistics and provided a unified strength expression for the design of mine pillars, including crown pillars [19]. Building on this work, Martin and Maybee introduced Hoek–Brown brittle failure parameters and pointed out that hard-rock pillar failure is commonly dominated by progressive sidewall spalling and exfoliation-induced brittle instability, thereby refining the applicability of traditional empirical strength formulas [20]. In the context of the transition from open-pit to underground mining, Zhao et al. established a mechanical model considering the coupled loading between boundary pillars and open-pit slopes. They analyzed the stability of boundary pillars under different geometric parameters and stress conditions, and proposed safe thickness design recommendations applicable to transition mining conditions [21]. Owing to its advantages of low cost, high repeatability, and intuitive visualization, numerical simulation has been widely used to investigate the mechanical behavior of slope rock masses [22,23,24,25,26]. It has also become an important tool for monitoring and determining the appropriate thickness of crown pillars [27,28]. Chen and Mitri, taking a gold mine as an engineering case, developed a three-dimensional numerical model incorporating complex geometric and structural conditions. They systematically analyzed the stress distribution, deformation field, and plastic zone evolution under different boundary crown pillar thicknesses, stope layouts, and mining sequences, and proposed a numerical-modeling-based strategy for surface crown pillar design [29]. Dintwe et al., using an open-pit to underground transition project in a fluorite mine in Mongolia as an example, employed FLAC3D to investigate stress redistribution and instability mechanisms of the crown pillar during underground retreat mining, emphasizing the lateral loading effect exerted by the open-pit wall and stope surrounding rock on the crown pillar [30]. Mehra et al. employed a nonlinear three-dimensional numerical model to parametrically investigate the effects of rock mass strength, joint configuration, and stope geometry on pillar stress concentration, deformation, and yield zone development, thereby establishing a correlation framework for pillar stability response [31]. However, most existing studies have focused on providing a single-point estimate of a reasonable pillar thickness [32,33,34]. Few studies have first established the upper and lower bounds of safe thickness using multiple classical theoretical criteria and then further constrained and optimized this interval through three-dimensional numerical back-analysis. This provides the methodological entry point for the multi-method coupled optimization adopted in this study.
Although substantial progress has been made in theoretical calculation, numerical simulation, and stability assessment of crown pillars during the transition from open-pit to underground mining, most studies have focused on determining a single safe thickness or evaluating overall stability [35,36]. Limited attention has been paid to deformation symmetry and asymmetric failure mechanisms within the slope–crown pillar–underground stope system. Insufficient pillar thickness may induce asymmetric stress redistribution, nonuniform displacement, and through-going plastic failure, whereas an appropriate thickness can promote coordinated deformation and a more symmetric load-bearing state. Therefore, incorporating a symmetry-based perspective is important for improving crown pillar design. In this study, the Kumusayi Li-Nb-Ta mine in Xinjiang, China, is used as a case study. This study introduces deformation symmetry as an evaluation entry point and combines theoretical calculation, FLAC3D simulation, and physical similarity model testing to optimize boundary crown pillar thickness.

2. Model Test on the Safe Thickness of the Boundary Crown Pillar

2.1. Engineering Background

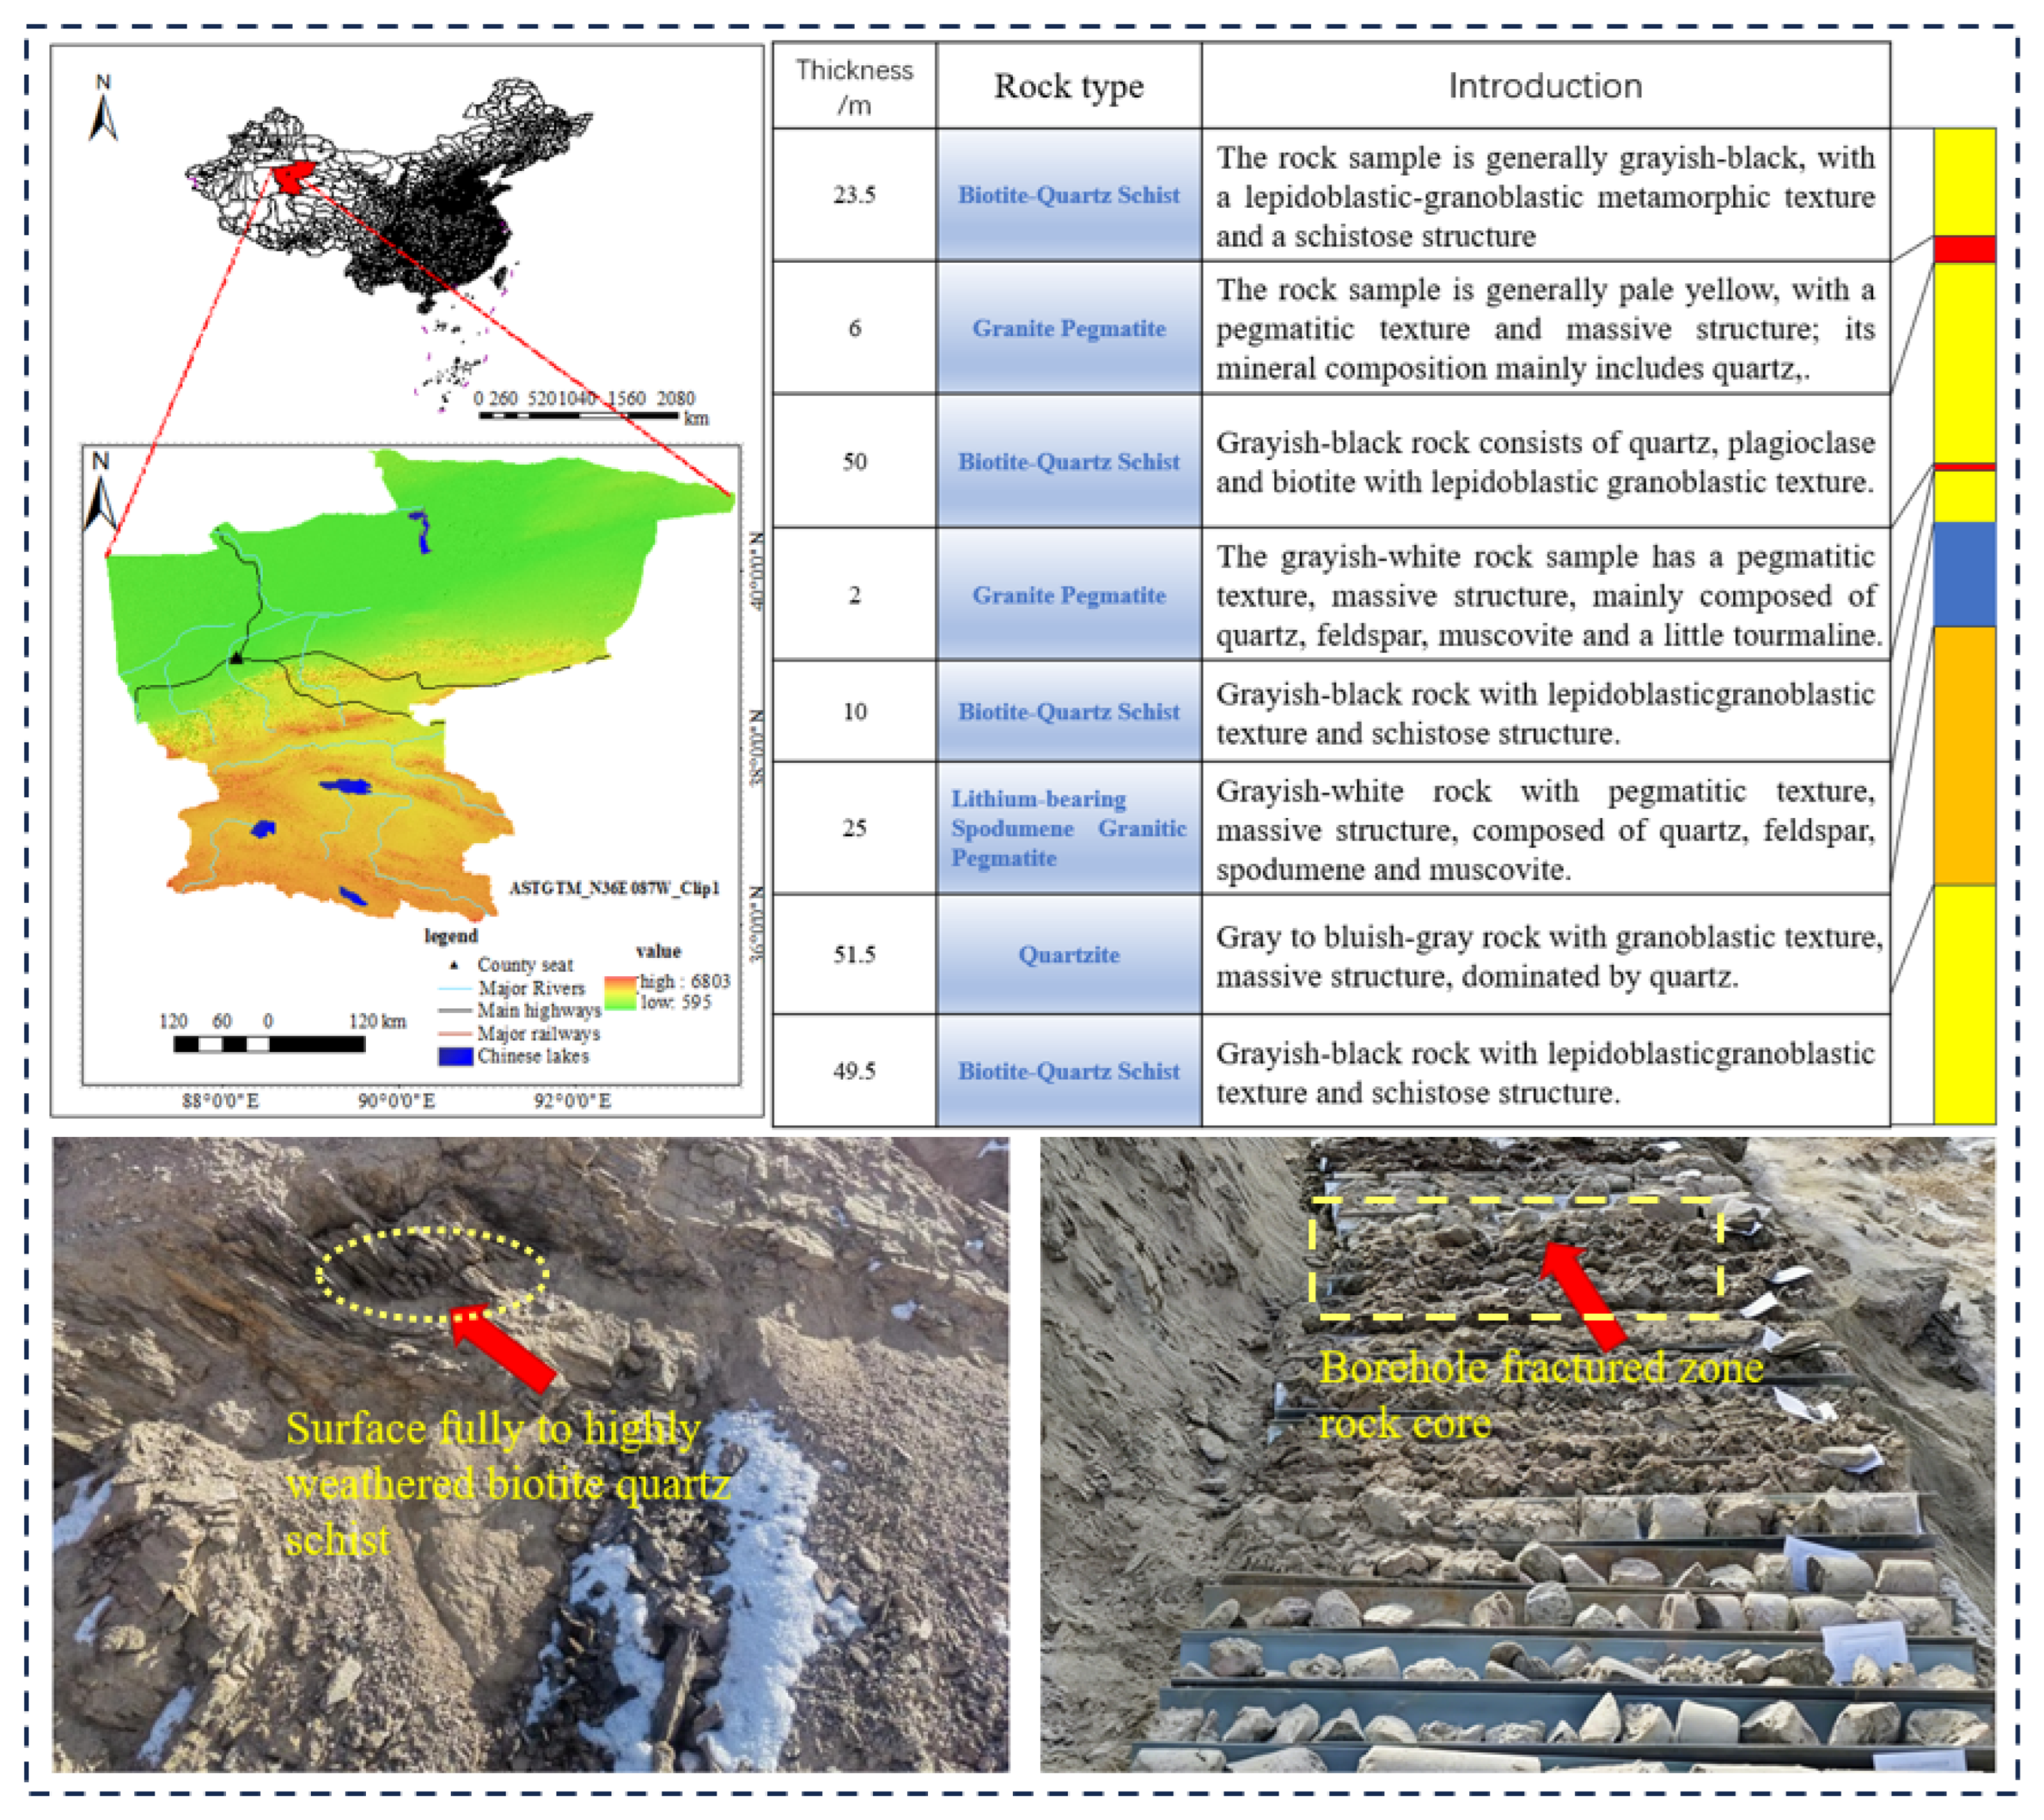
The Kumusayi Li-Nb-Ta rare metal (iron) mine is located in Ruoqiang County, Bayingolin Mongolian Autonomous Prefecture, Xinjiang, China, as shown in Figure 1. The mining area lies in the Gaijike region of the central Altun Mountains. The overall terrain is higher in the east and south and lower in the west and north, with pronounced topographic relief. Except for the flat area in the east, most of the mining area is characterized by moderately to highly mountainous terrain with deeply incised landforms. The deposit is mainly recharged by bedrock fissure aquifers and has relatively simple hydrogeological conditions.
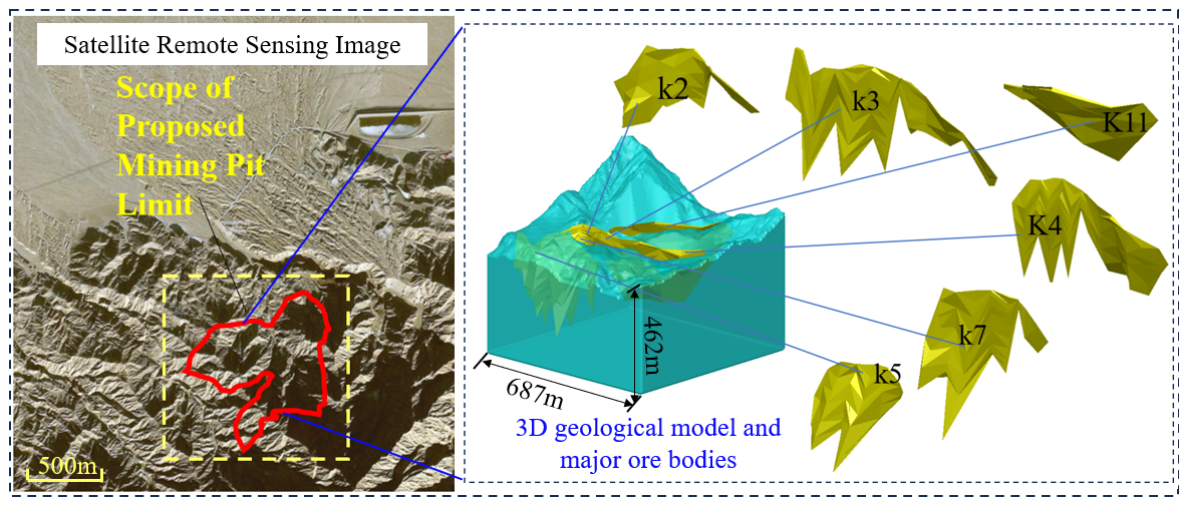
As shown in Figure 2 the overall geological environmental quality of the mining area is poor. Field exposure indicates that the final elevation of the open-pit mining boundary is 1482 m, while the pit bottom elevation is 1286 m. The pit bottom is approximately 80 m long and 50 m wide, and the maximum slope height is 196 m. Underground mining is mainly concentrated within elevations of 1280–1180 m. A total of seven major ore bodies have been delineated in the exploration area, all of which are Li-Nb-Ta ore bodies, numbered K2, K3, K4, K5, K7, K11, and K56. The ore bodies are Li-Nb-Ta-associated ore bodies with surface exposure and can therefore be classified as outcropping deposits. They occur as vein-like bodies within granitic pegmatite veins. The hanging-wall and footwall rocks are mainly biotite–quartz schist, with granitic pegmatite veins locally developed. The occurrence of the ore bodies is generally consistent with that of the pegmatites and is nearly vertical, with dip angles ranging from 63° to 85°. The controlled strike length of the ore bodies is 395 m, and the maximum extension along the dip is 172 m. The main ore bodies occur at elevations of 1022.92–1394.80 m. The ore bodies show good continuity at depth and are generally well connected. No obvious post-mineralization faults causing significant damage to the ore bodies have been identified.

2.2. Theoretical Estimation of Boundary Crown Pillar Thickness

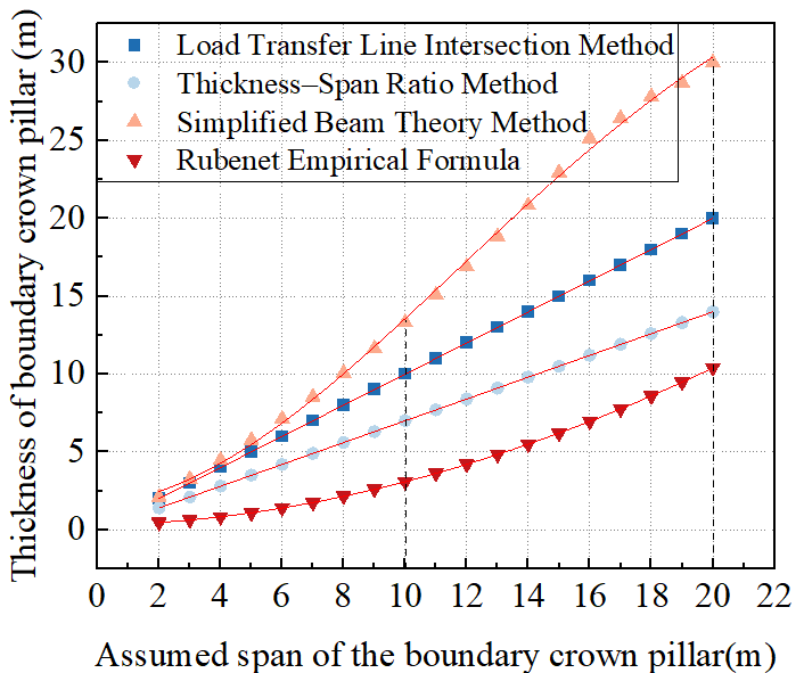
As a key load-bearing structure during the transition from open-pit to underground mining [37,38], the boundary crown pillar involves a fundamental trade-off between mining safety and resource recovery. An excessively thick pillar may lead to unnecessary resource loss, whereas an insufficiently thick pillar may fail to satisfy the stability requirements of the open-pit slope [39], boundary crown pillar, and underground stope system [40,41]. Therefore, a reasonable theoretical thickness interval should first be established before conducting numerical simulation and physical model verification. As shown in Table 1, in this study, four analytical methods were adopted to estimate the preliminary thickness of the boundary crown pillar, namely the load transfer intersection method [42], span-to-thickness ratio method, simplified structural beam method, and Rubeneeite formula method [43]. The four methods were selected because they represent different but complementary mechanical assumptions for crown pillar thickness estimation. The load transfer intersection method was used to describe the diffusion and intersection of overlying load transfer paths above the underground opening. The span-to-thickness ratio method was selected to provide a simple geometric constraint between the unsupported span and the retained pillar thickness. The simplified structural beam method was adopted because the boundary crown pillar can be approximately regarded as a beam-like bearing structure subjected to overlying load. The Rubeneeite formula method was introduced as an empirical strength-balance method that considers the combined effects of rock unit weight, stope span, external load, and rock mass strength. However, these formulas involve simplified assumptions and cannot fully capture complex geological conditions, mining disturbance, and backfilling effects. Therefore, the calculated results were used as preliminary constraints and further verified by FLAC3D simulation and physical similarity testing. Therefore, these four methods were used together to define a theoretical thickness envelope rather than to obtain a single deterministic value. As shown in Figure 3, different empirical and analytical methods provide different thickness estimates because of their different mechanical assumptions and parameter sensitivities.
For the load transfer intersection method [42], the required thickness of the boundary crown pillar is calculated as:
H = K B 2 t a n   β
For the span-to-thickness ratio method [43], the thickness–span relationship is expressed as:
H K B = 0.5
For the simplified structural beam method [43], the boundary crown pillar is simplified as a beam-like bearing structure, and the required thickness is calculated as:
H = K B 4 × r B + r 2 B 2 + 8 σ c q σ C
For the Rubeneeite formula method [43], the required thickness is calculated as:
H = K × 0.25 r B 2 + ( r 2 B 2 + 800 σ B q ) 1 / 2 98 σ B
where H is the calculated thickness of the boundary crown pillar; K is the safety factor; B is the effective span of the underground stope or unsupported roof; β is the load transfer angle; γ is the average unit weight of the overlying rock mass; q is the load acting on the crown pillar; σ c is the allowable strength parameter used in the simplified structural beam method; and σ B is the rock mass strength parameter used in the Rubeneeite formula method. In this study, K was uniformly set to 1.4 to provide a moderately conservative safety reserve and to account for uncertainties in rock-mass conditions, parameter simplification, excavation disturbance, and backfilling effects. The same value was used in all four methods to ensure comparability of the theoretical results.
The calculation results obtained from the four methods are summarized in Table 1. The Rubeneeite formula method gives a calculated thickness of 10.41 m, which can be regarded as a theoretical lower-bound reference. The span-to-thickness ratio method yields a thickness of 14.00 m, which is more suitable as the engineering lower bound. To avoid adopting an overly idealized lower-limit value, the more conservative value of 14.00 m was selected as the lower boundary of the design interval. The simplified structural beam method gives a thickness of 29.81 m, which can be regarded as a conservative upper bound. The load transfer intersection method gives a value of 19.99 m, which falls within the calculated interval and can serve as an intermediate control value. Accordingly, the theoretical design interval of the boundary crown pillar thickness was determined as 14.00–29.81 m.
From the perspective of field engineering experience, the theoretical results were used as interval constraints rather than directly adopted as a single design value. As shown in Figure 2, the Kumusayi mine is characterized by steeply dipping ore bodies and a transition zone affected by both open-pit unloading and underground excavation. Therefore, 10.41 m was used only as a theoretical lower-bound reference, 14.00 m as the engineering lower bound, and 29.81 m as a conservative upper-bound reference.
Based on this theoretical interval, four representative thickness schemes of 15 m, 20 m, 25 m, and 30 m were selected for subsequent FLAC3D three-dimensional numerical simulation and physical similarity model verification. This design allows the stability of different boundary crown pillar thicknesses to be compared under the same engineering geological conditions and excavation sequence.

2.3. Numerical Simulation Method

2.3.1. Selection of Numerical Simulation Profile

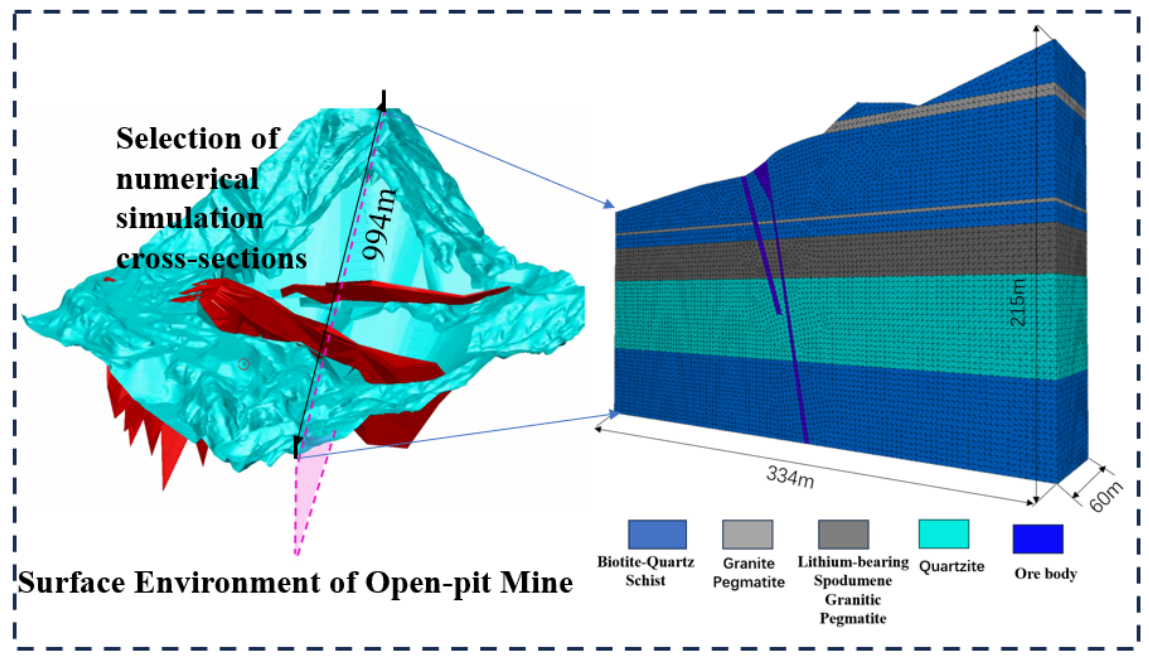
To evaluate the safety and stability of the boundary crown pillar during the transition from open-pit to underground mining, a typical profile was selected to establish a FLAC3D numerical model. The profile selection considered the engineering geological zoning of the open-pit slope, slope zoning, and the distribution of structures near the surface rock movement monitoring line in the Kumusayi Li-Nb-Ta rare metal mine in Ruoqiang County, Xinjiang [44]. As shown in Figure 4, the model was used to simulate the evolution of the stress environment during the transition from open-pit mining to the first underground mining level. In the numerical calculation, the upper surface of the model was treated as a free surface. The lateral boundaries were constrained in the normal direction, and the bottom boundary was constrained in the vertical direction to prevent rigid-body movement. All excavation surfaces formed during open-pit and underground mining were treated as stress-free boundaries. The Mohr–Coulomb constitutive model was adopted to characterize the strength and deformation behavior of different rock strata. Considering both computational efficiency and mesh sensitivity, the model dimensions were set to 334 m × 215 m × 60 m, and approximately 510,000 elements were generated. Local mesh refinement was applied around the open-pit floor, boundary crown pillar, and underground excavation area, while a relatively coarser mesh was used in regions far from the excavation disturbance zone. Before the final simulations, mesh sensitivity was checked by comparing the stress distribution, displacement field, and plastic-zone morphology under different mesh densities. The adopted mesh was considered sufficient because further refinement did not significantly change the main deformation and failure characteristics.
Based on this model, the displacement response, plastic-zone evolution, stress redistribution, and potential failure modes of the boundary crown pillar during the transition from open-pit to underground mining can be systematically analyzed. By comparing different pillar thickness schemes, the load-bearing capacity of the crown pillar can be evaluated, thereby providing a basis for determining a reasonable safe thickness range.

2.3.2. Rock Mechanics Parameters for Numerical Simulation

In numerical simulation, the rational selection of model parameters directly affects the reliability of the calculation results. As a typical heterogeneous and discontinuous medium, the mechanical behavior of rock masses is governed by multiple factors, including joints, fractures, and structural planes. Therefore, mechanical parameters derived from laboratory tests are insufficient to fully characterize the in situ response of rock masses subjected to complex stress conditions, mining-induced disturbances, and stress redistribution. This is particularly important during the transition from open-pit to underground mining, where rock masses often exhibit pronounced nonlinear deformation and progressive failure characteristics. Therefore, based on the laboratory test parameters, the model parameters in this study were calibrated and modified by considering the engineering geological conditions and mining response characteristics, as shown in Table 2. The calibrated parameters can more reasonably characterize the macroscopic deformation, failure modes, and stress–deformation response of the rock mass under complex mining conditions. The specific values are listed in Table 2.

2.3.3. Numerical Excavation Scheme

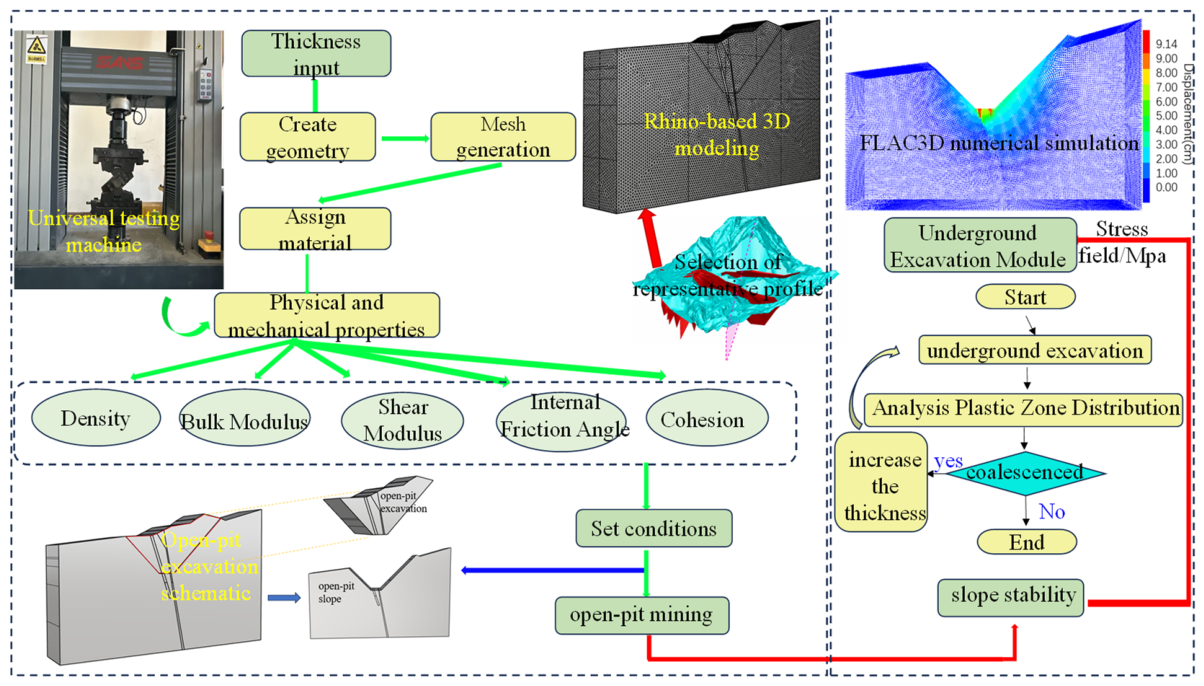
To reveal the stress–deformation evolution and safe thickness control mechanism of the boundary crown pillar under the combined effects of open-pit unloading, underground mining disturbance, and backfilling up to the first sublevel during the transition from open-pit to underground mining, a three-dimensional numerical model was established using FLAC3D. The overall numerical simulation scheme and excavation procedure are shown in Figure 5. The model incorporated the final open-pit slope, boundary crown pillar, first sublevel excavation area, and backfill body.
According to the mining design of the Kumusayi Li-Nb-Ta mine, the whole orebody is mined using the upward horizontal cut-and-fill stopping method. In this method, the orebody is extracted in horizontal slices in an upward sequence, and the mined-out voids are filled to control surrounding-rock deformation and provide a working foundation for subsequent mining. In the present study, underground mining and backfilling were considered up to the first sublevel. Considering that the main purpose of this study is to evaluate the overall stability and deformation response of the boundary crown pillar, the slice-scale mining and filling process was simplified in the numerical model as progressive excavation and equivalent backfilling up to the first sublevel.
To compare the safety performance of different boundary crown pillar thicknesses, four thickness schemes of 15 m, 20 m, 25 m, and 30 m were established by adjusting the vertical distance between the final open-pit floor and the roof of the first sublevel excavation area. As illustrated in Figure 5, full-process numerical simulations were conducted under the same excavation sequence, backfilling procedure, boundary conditions, and mechanical parameters, so that the influence of pillar thickness could be compared under consistent mining conditions.
The numerical excavation sequence was as follows. First, the initial in situ stress field was established and calculated to equilibrium to obtain the initial mechanical state of the model. Second, open-pit excavation was simulated step by step according to the final pit boundary, and the model was recalculated to equilibrium after each excavation stage to reproduce the unloading-induced stress redistribution and initial slope deformation caused by open-pit mining. Third, after the final open-pit configuration was reached, underground excavation was progressively conducted along the designed mining direction until the first sublevel was reached. During this stage, the displacement field, stress redistribution, and plastic-zone evolution of the boundary crown pillar and adjacent slope rock mass were continuously recorded. Fourth, after excavation reached the first sublevel, the mined-out area was backfilled by assigning the corresponding mechanical parameters of the backfill material, followed by recalculation to equilibrium. This step was used to simulate the recovery of confinement and the reconstruction of the load-bearing path after backfilling up to the first sublevel.
The stability of each boundary crown pillar thickness scheme was evaluated by examining whether the plastic zone within the pillar became connected, whether abrupt or accelerated displacement occurred in the pillar and slope, and whether surface settlement, inclination, curvature, and horizontal deformation were significantly amplified. Based on these comparative indicators, the dominant failure mode and critical instability stage were identified, providing a basis for determining the safe thickness of the boundary crown pillar.

2.4. Physical Similarity Model Test Scheme

2.4.1. Physical Model Test System

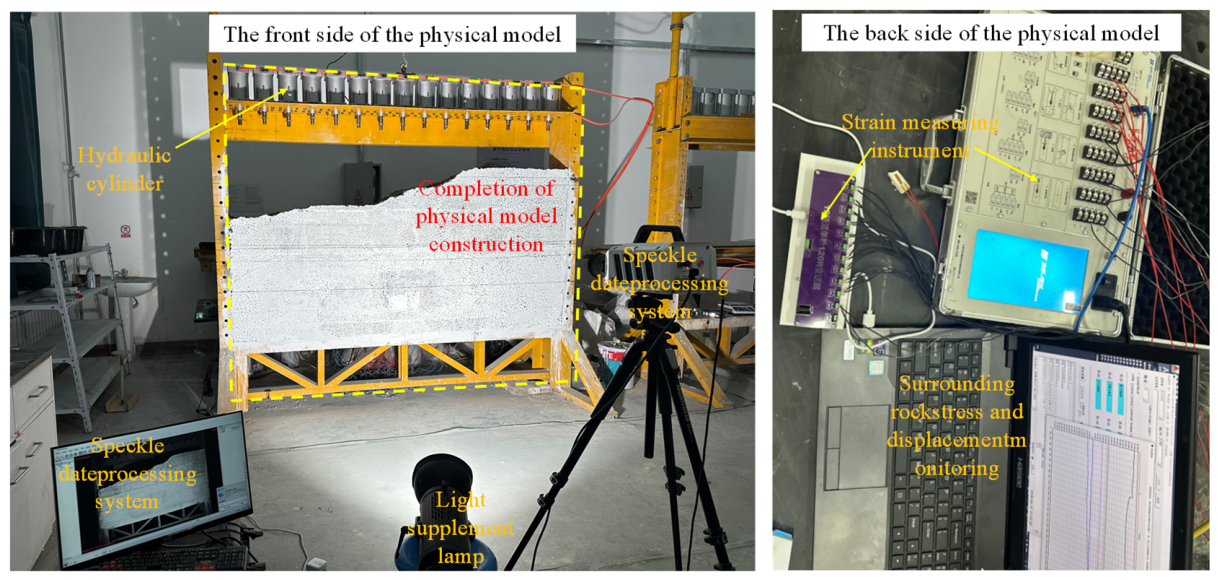
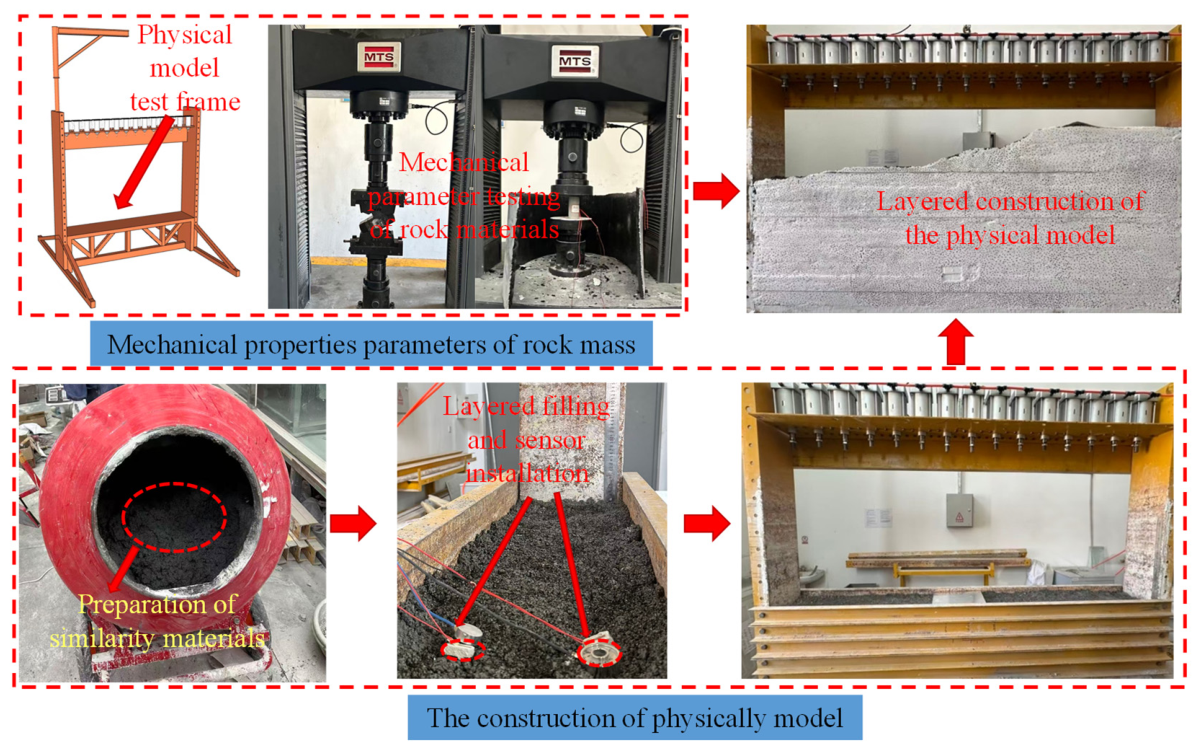
The physical model test system is shown Figure 6. It mainly consists of a model frame, hydraulic control system, hydraulic cylinders, supplementary lighting device, speckle monitoring system, digital acquisition system, and stress monitoring system. During the test, the hydraulic control system and hydraulic cylinders were used to apply loading to the model. The supplementary lighting device and speckle monitoring system were used to capture surface deformation, while the digital acquisition system and stress monitoring system were used to collect internal stress, displacement, and other response data in real time. In the stress monitoring system, BW27R strain-type earth pressure cells were used to measure the internal stress variation of the physical model, and China Haoke Electronic Technology Co., Ltd. (Ningbo, China) BX120-10AA resistance strain gauges were used to monitor local deformation responses. These sensors were connected to the digital acquisition system to obtain synchronous stress–strain data during loading, excavation, and backfilling. This system enables synchronous monitoring of model loading, excavation disturbance, and stress–deformation evolution during the transition from open-pit to underground mining. The dimensions of the physical model were 2500 mm × 2100 mm × 30 mm.

2.4.2. Similarity Ratio

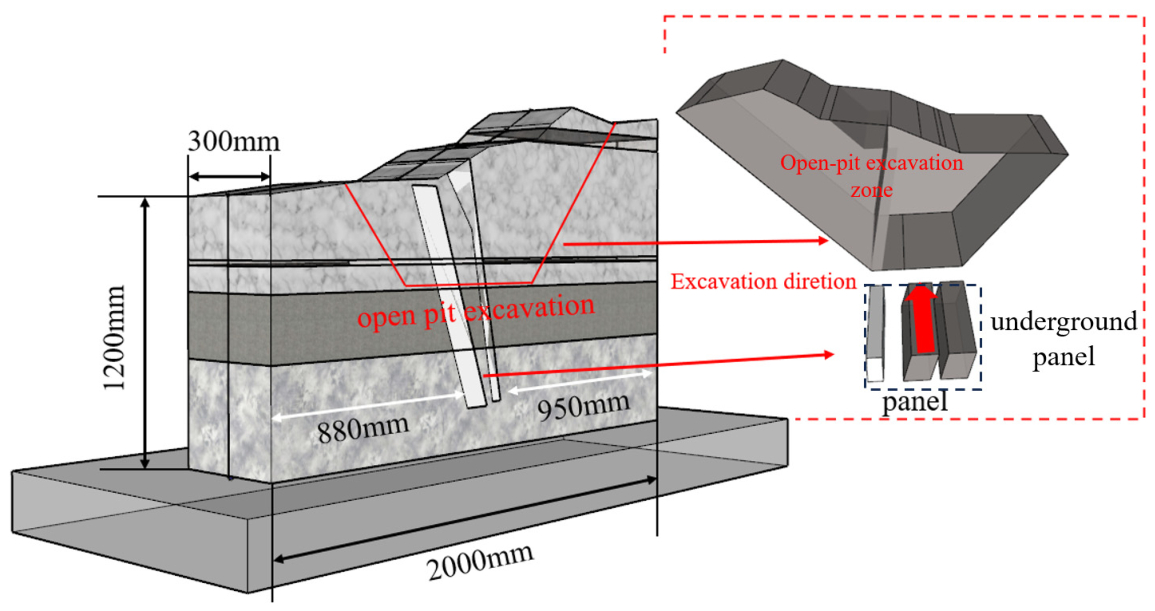
To ensure that the physical model test could realistically reproduce the rock mass structural characteristics and mining response behavior of the study area [45], as shown in Table 3, a prototype geological domain of 240 m × 36 m × 252 m was selected for similarity simulation, considering the dimensional constraints of the test system and the objectives of this study. Based on the requirements of model layout, structural scale relationships, and experimental operability, the geometric similarity ratio was determined as 120. Meanwhile, considering the difference in bulk density between the similarity materials and the actual rock mass, the bulk density similarity ratio was set as 1.5. The similarity material was not selected based only on bulk density. In this study, a cemented granular material composed of sand, gypsum, lime, and water was used to reproduce the macroscopic mechanical response of the prototype rock mass. Different mix proportions were prepared, and the final material scheme was determined through a series of mechanical tests on similarity material specimens. The selection considered density, strength, deformation characteristics, cohesion, and internal friction characteristics rather than density similarity alone. Therefore, the physical model aimed to reproduce the equivalent macroscopic geomechanical behavior of the rock mass under the required similarity ratios. According to similarity theory, the similarity constants of the relevant physical quantities were derived accordingly. The dimensional parameters of the physical model are presented in Table 4.

2.4.3. Physical Model Excavation Scheme

The upper part of the model was first excavated in layers according to the designed slope profile, with unloading performed progressively from top to bottom. After each excavation layer was completed, the model was left undisturbed for 30 min to allow for sufficient adjustment of the internal stress and deformation fields. After the open-pit excavation was completed, the test proceeded to the underground stope excavation stage. As shown in the inset of Figure 7, the underground stope/panel was excavated stepwise along the designed advancing direction. Each excavation step advanced by 100 mm, followed by a 30 min resting period to ensure that the model reached a relatively stable state. The excavation process of the physical model is illustrated in Figure 7.

2.4.4. Physical Model Test Procedure

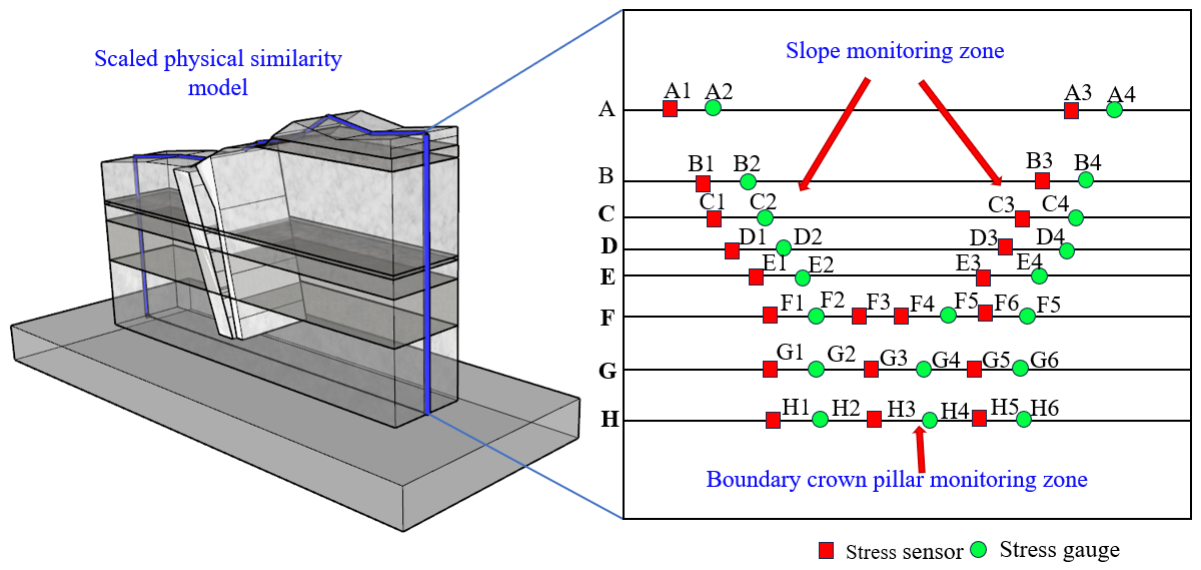
To reveal the damage evolution of slope rock masses and the stress redistribution within the boundary crown pillar during the transition from open-pit to underground mining, a dedicated monitoring section was established in the physical model. Considering that unloading damage and local instability may occur in the slope after open-pit excavation, and that stress adjustment within the boundary crown pillar is further intensified after underground excavation, the monitoring points were mainly arranged in the potential slope instability zone and the influence zone of the boundary crown pillar. As shown in Figure 8, eight monitoring lines, A–H, were arranged along the height of the model on the monitoring section. BW27R, Danmo Electronic Technology Co., Ltd., Nanjing, China strain-type earth pressure cells and China Haoke Electronic Technology Co., Ltd. BX120-10AA resistance strain gauges were installed along each monitoring line to synchronously capture the internal stress variation and local deformation response of the model at different excavation stages. The earth pressure cells were mainly used to monitor stress redistribution induced by open-pit unloading and underground excavation, while the strain gauges were used to record local strain evolution near the slope, boundary crown pillar, and lower surrounding rock. Among them, monitoring lines A–C were mainly used to characterize the stress–deformation response of the open-pit slope and overlying strata; monitoring lines D–F focused on the stress transfer and deformation coordination characteristics of the boundary crown pillar and its adjacent areas; and monitoring lines G–H were used to characterize the disturbance response of the lower part of the boundary crown pillar and the floor surrounding rock after underground ore-body excavation. Through multi-level and multi-point monitoring, the interactions among open-pit excavation unloading, underground mining disturbance, and load-bearing adjustment of the crown pillar can be comprehensively revealed.

2.4.5. Physical Model Construction Procedure

First, the basic mechanical parameters of each prototype rock layer were obtained through rock mechanics tests. Similarity material specimens with different sand–gypsum–lime–water proportions were then prepared, and a series of mechanical tests were conducted to determine the material ratio that satisfied the required similarity criteria. The final mix proportion was selected by comprehensively considering density, strength parameters, deformation characteristics, cohesion, and internal friction characteristics. Therefore, the similarity material was a cemented granular material after curing, rather than a loose granular material, and it was used to reproduce the equivalent macroscopic geomechanical behavior of the prototype rock mass.
Natural cracks and joints were not reproduced individually in the physical model. Their overall influence was considered through the calibrated equivalent mechanical parameters and layered model construction. The water added during preparation was mainly used for mixing, molding, and curing, and seepage effects were not considered in this physical model test because the study area has relatively simple hydrogeological conditions. Future work should further consider hydro-mechanical coupling if field monitoring indicates significant water effects. Subsequently, as shown in Figure 9, the similarity material mixture was prepared according to the determined proportion and placed and compacted layer by layer within the model frame, thereby gradually constructing the stratified structure of the physical model. During model filling, monitoring components such as stress sensors and strain gauges were embedded simultaneously to ensure real-time acquisition of internal stress and deformation responses in subsequent tests. After all rock layers were placed, the overlying strata were further filled layer by layer. The physical similarity model was then completed, providing the basis for subsequent loading, excavation, and monitoring tests.

3. Results and Analysis

3.1. Numerical Simulation Results and Analysis

Based on the boundary crown pillar thickness range obtained from theoretical calculations, four representative thickness schemes of 15 m, 20 m, 25 m, and 30 m were selected for comparative numerical simulation. The objective was to determine the optimal thickness that balances safety, stability, and resource recovery efficiency. To improve the refinement of the scheme comparison, a thickness interval of 5 m was adopted, covering the key range of 15–30 m. The simulation results were evaluated mainly in terms of stress, displacement, and plastic zone development. Stress was used to characterize the internal loading state of the boundary crown pillar and the degree of stress concentration; displacement was used to describe the deformation response of the crown pillar and slope rock mass; and the plastic zone was used to identify the internal failure range and potential instability risk of the pillar. By comprehensively comparing the mechanical responses under different thickness conditions, the relationship between boundary crown pillar thickness and stability was clarified, and the optimal scheme with a relatively small thickness, while satisfying safety requirements, was finally determined.
The novelty of this study lies in the coupled evaluation of boundary crown pillar thickness rather than a single thickness calculation. The four analytical methods summarized in Table 1 were used to define a feasible theoretical interval instead of directly providing a deterministic design value. Within this interval, FLAC3D simulations were conducted to compare stress redistribution, displacement evolution, plastic-zone connectivity, and deformation symmetry under different thickness schemes. The physical similarity model test was then used for further verification. Therefore, the optimized thickness was determined by considering not only overall stability, but also deformation coordination, asymmetric failure control, and resource recovery efficiency.

3.1.1. Safety and Stability Analysis Under Different Boundary Crown Pillar Thicknesses

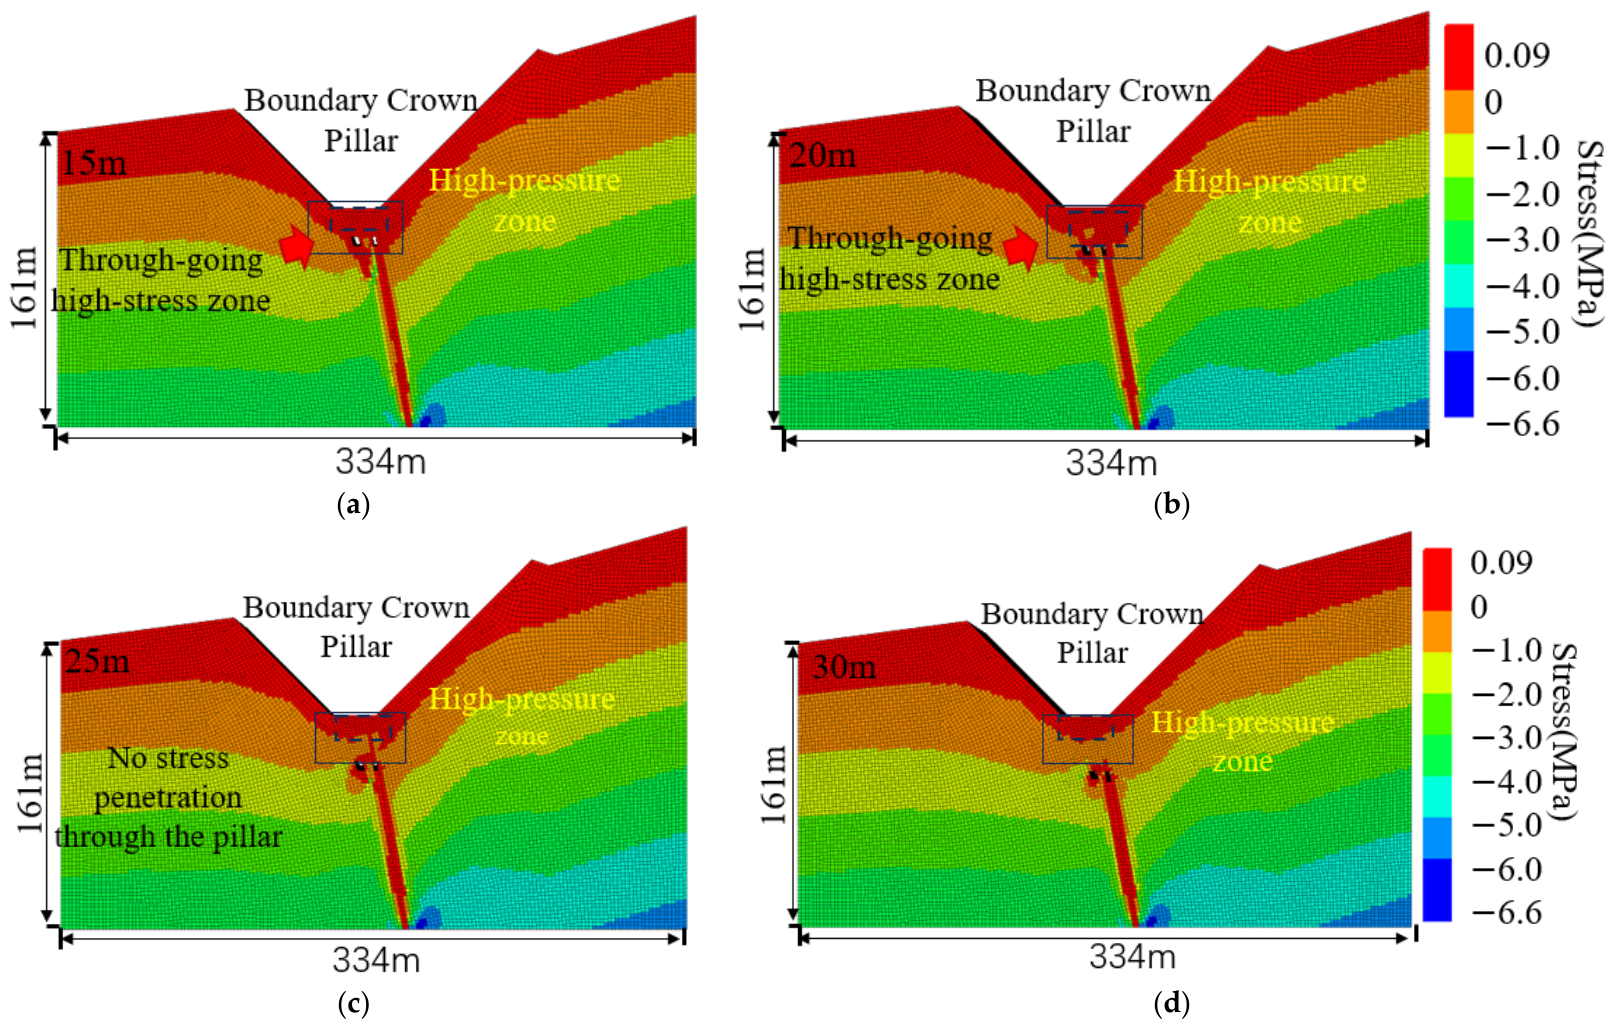
Under excavation conditions, the horizontal stress contours show that stress concentration gradually decreases as the boundary crown pillar thickness increases. As shown in Figure 10a, under the 15 m condition, a through-going high-stress zone forms from the pit bottom to the interior of the crown pillar. The stress is mainly concentrated between 0 and −1 MPa, with local values extending to −2 MPa, indicating that the pillar is most strongly affected by excavation disturbance. As shown in Figure 10b, under the 20 m condition, the extent of the high-stress zone is reduced compared with that under the 15 m condition, but continuous stress transfer remains evident, suggesting that the stress concentration within the pillar has not yet been fully eliminated. As shown in Figure 10c, under the 25 m condition, the high-stress zone is mainly confined to the pit bottom and the roof of the goaf, while the stress distribution in the main body of the crown pillar becomes more uniform, indicating a significant improvement in the overall stress state. As shown in Figure 10d, under the 30 m condition, the high-stress zone is further reduced, and the stress within the crown pillar becomes generally coordinated with that in the surrounding rock mass, suggesting that stress redistribution tends to stabilize.
Overall, as the crown pillar thickness increases from 15 m to 30 m, the high-stress zone gradually changes from a through-going distribution to a localized concentration. Among the tested schemes, the 25 m condition can adequately satisfy the stability requirements. Although the 30 m condition provides a higher safety reserve, the additional improvement achieved by further increasing the pillar thickness becomes limited.
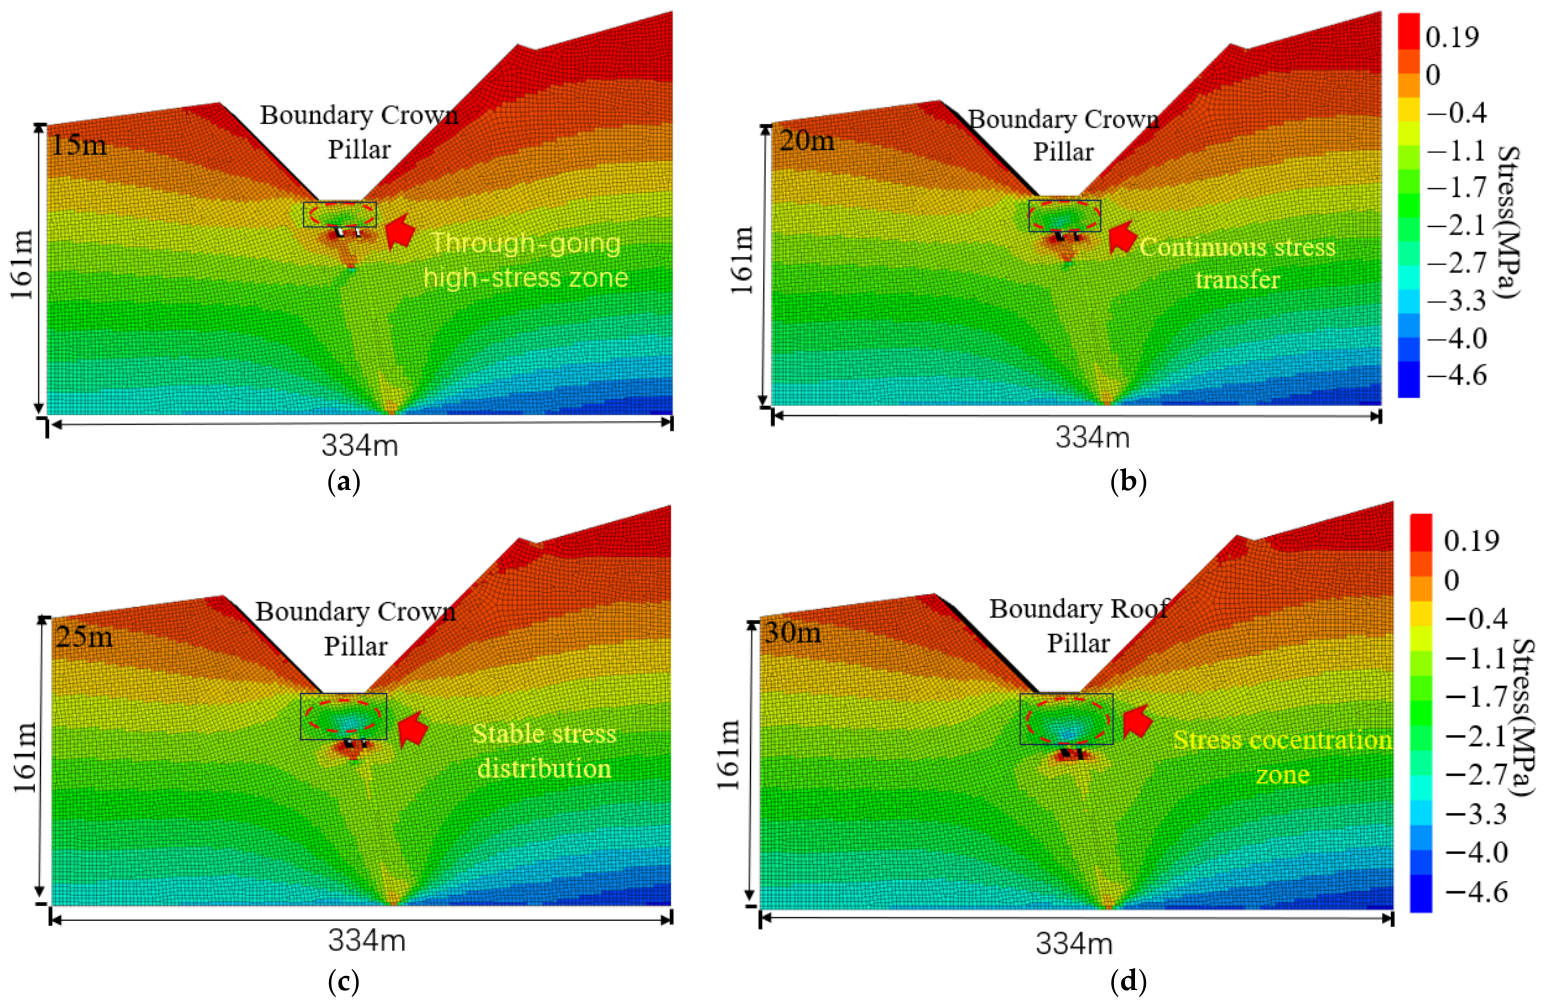
Across the four boundary crown pillar thickness scenarios, a distinct horizontal stress concentration zone was formed within the pillar area, with stress values of approximately 1.7–2.0 MPa. This was significantly higher than the horizontal compressive stress of 0.4–0.7 MPa in the surrounding rock at the same depth, indicating that the boundary crown pillar was subjected to strong lateral compression.
As shown in Figure 11a, under the 15 m condition, the high-stress zone extends almost through the full thickness of the boundary crown pillar, and local stress concentration is the most pronounced. This indicates that mining-induced disturbance is strongly transmitted within the thin pillar, resulting in an unfavorable overall stress state. Under the 20 m condition, Figure 11b, the extent of stress concentration is reduced compared with that under the 15 m condition; however, continuous high-stress transfer remains evident, suggesting that the load-bearing capacity of the pillar is improved but the high-stress zone has not yet become fully localized. When the pillar thickness increases to 25 m, Figure 11c, the high-stress zone is mainly confined to the pit bottom and the goaf roof. The horizontal stress within the main body of the pillar mostly decreases to 1.1–1.7 MPa and gradually becomes consistent with that in the surrounding rock on both sides, indicating that the internal stress redistribution has largely stabilized. When the thickness is further increased to 30 m, Figure 11d, the high-stress zone is further weakened; however, the improvement compared with the 25 m condition is limited. Overall, increasing the boundary crown pillar thickness progressively reduces the horizontal stress concentration, and the 25 m condition can adequately satisfy the stability requirements.

3.1.2. Displacement Evolution Characteristics During Mining at the First Underground Level

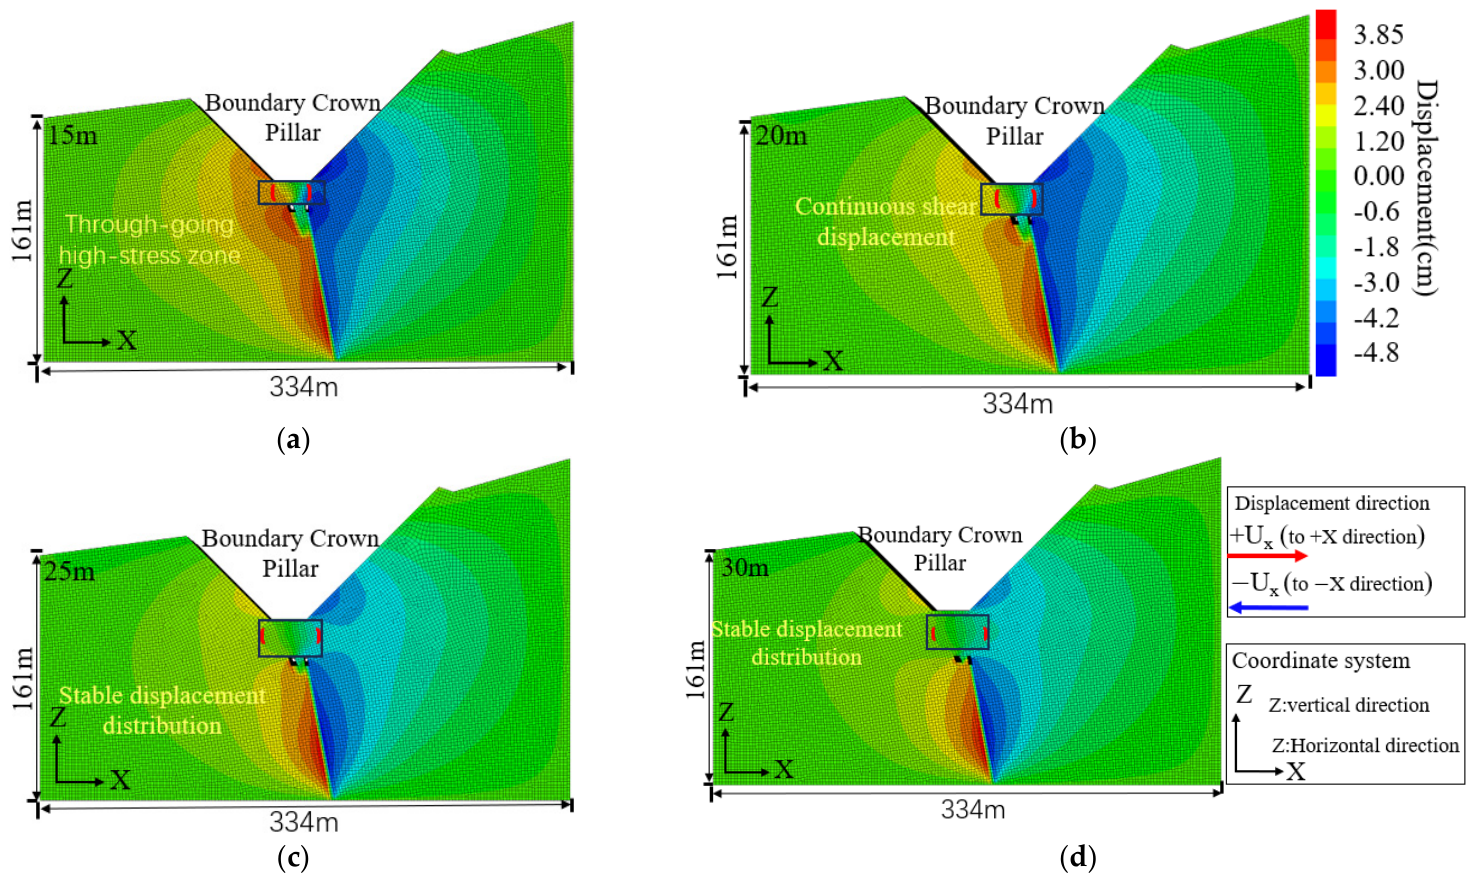
The horizontal displacement contours under different boundary crown pillar thicknesses indicate that pillar thickness exerts a significant control on the lateral deformation of the rock mass during the transition from open-pit to underground mining. Overall, as the pillar thickness increases from 15 m to 30 m, the peak horizontal displacement of the crown pillar and the rock mass adjacent to the goaf gradually decreases, the extent of the high-displacement zone continuously contracts, and the displacement gradient becomes markedly gentler. These changes suggest a progressive improvement in pillar stiffness and shear resistance.
As shown in Figure 12a, under the 15 m condition, a red–blue symmetric horizontal displacement band extends through the full height of the boundary crown pillar. The positive and negative displacement ranges are approximately +3.6–+3.85 cm and −4.2–−4.8 cm, respectively, producing a displacement difference of about 7.5–8.5 cm between the two sides of the pillar. The high-displacement zone extends downward from the pit bottom to the vicinity of the goaf roof, indicating pronounced horizontal bending and shear dislocation. Under the 20 m condition, Figure 12b, the high-displacement zone remains continuously distributed along both sides of the pillar, with displacement extrema of approximately +3.0 cm and −4.0 cm. Although the degree of deformation concentration is reduced compared with the 15 m case, the overall deformation is still dominated by through-going shear displacement. When the pillar thickness increases to 25 m, Figure 12c, the high-displacement zone changes from a full-height through-going pattern to a localized distribution. The displacement in most of the upper part of the pillar decreases to within ±1.2 cm, while the main deformation zone in the middle and lower parts shows displacement ranges of approximately +2.4–+3.0 cm and −3.0–−3.6 cm. This indicates that the overall stiffness of the pillar is significantly enhanced, and the deformation mode gradually shifts from overall instability to localized adjustment. Under the 30 m condition, Figure 12d, the through-going shear displacement band nearly disappears. Most of the upper and middle parts of the pillar are controlled within ±0.6–1.2 cm, and only a localized displacement concentration of approximately ±2.4–3.0 cm remains in the lower part. The displacement contours become smoothly connected with those of the far-field rock mass, suggesting that the boundary crown pillar has entered a relatively stable load-bearing state.
Overall, with increasing boundary crown pillar thickness, the horizontal deformation mode gradually evolves from through-going dislocation to localized deformation. Among the tested schemes, the 25 m thickness is close to the critical value required to satisfy stability requirements, whereas the 30 m thickness provides a higher safety reserve.
The vertical displacement contours under different boundary crown pillar thicknesses show that pillar thickness has a significant controlling effect on settlement at the pit bottom and within the pillar area. As the pillar thickness increases from 15 m to 30 m, the maximum vertical displacement decreases continuously, the extent of the high-displacement zone gradually contracts, and the settlement arch changes from a wide and deep pattern to a narrower and shallower one. These results indicate a progressive improvement in the overall stiffness and bending resistance of the crown pillar.
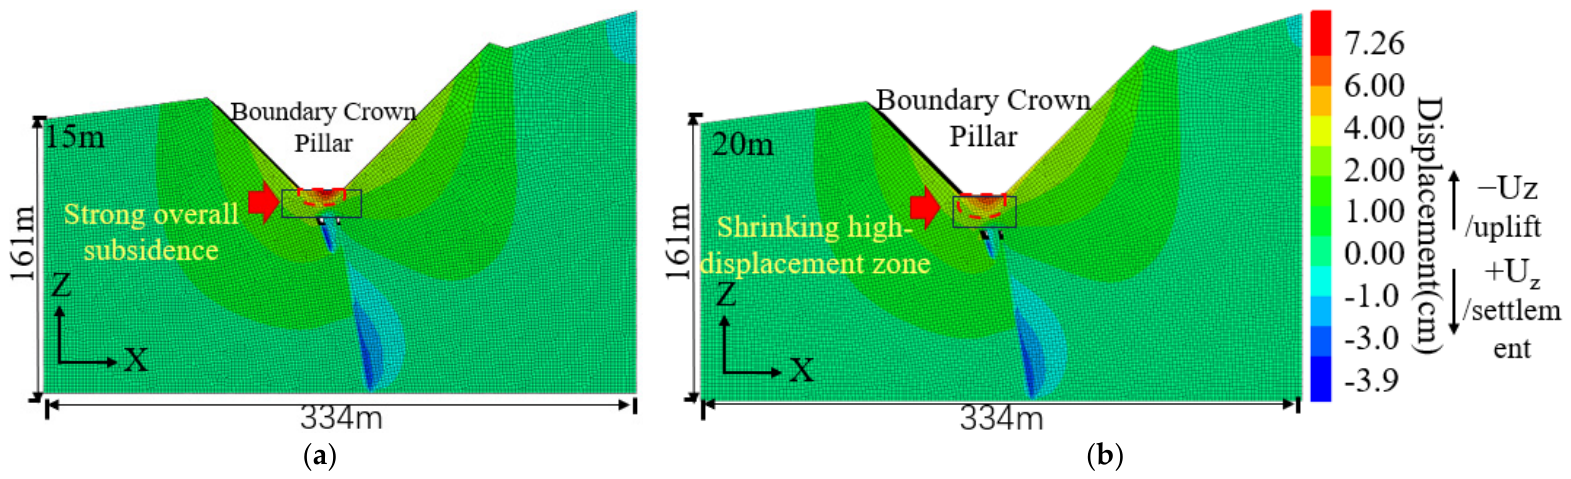
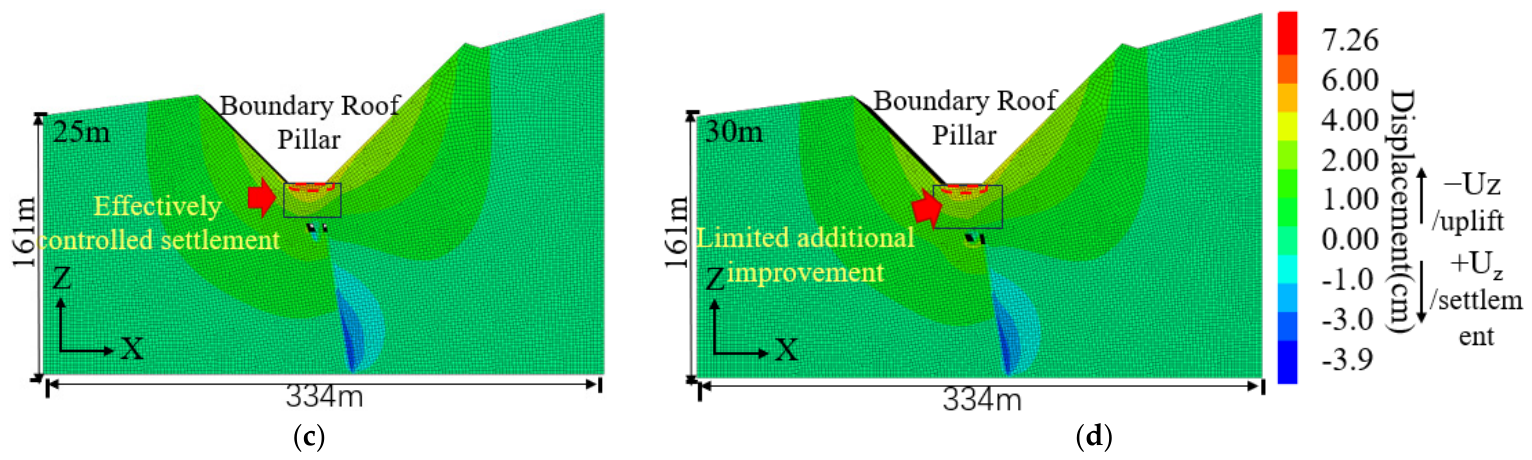
As shown in Figure 13a, under the 15 m condition, a continuous high-displacement zone develops at the pit bottom and in the upper part of the boundary crown pillar, with a maximum vertical displacement of approximately 7.26 cm. The settlement-affected zone extends toward both pit walls, and obvious negative displacement occurs near the goaf roof, indicating pronounced overall subsidence and bending–shear deformation of the thin pillar. Under the 20 m condition, Figure 13b, the maximum vertical displacement decreases to approximately 6.2 cm, representing a reduction of about 14.6% compared with the 15 m condition. Although the high-displacement zone is reduced, concentrated settlement remains at the pit bottom and in the upper part of the crown pillar, suggesting that the settlement is partially controlled, but the overall deformation is still evident. When the pillar thickness increases to 25 m, Figure 13c, the maximum vertical displacement further decreases to approximately 5.3 cm, corresponding to a cumulative reduction of about 27.0% compared with the 15 m condition. At this stage, the high-displacement zone is mainly confined to the pit bottom and the upper edge of the pillar, while deformation in the middle and lower parts of the pillar becomes close to that of the surrounding rock mass, indicating that vertical deformation is effectively controlled. Under the 30 m condition, Figure 13d, the maximum vertical displacement is approximately 5.2 cm, which is less than 2% lower than that under the 25 m condition. This indicates that further increasing the pillar thickness provides only limited improvement in settlement control. Overall, a pillar thickness of approximately 25 m can be regarded as the critical thickness for effectively controlling vertical settlement, whereas the 30 m scheme mainly provides additional safety reserve with limited incremental deformation-control benefits.
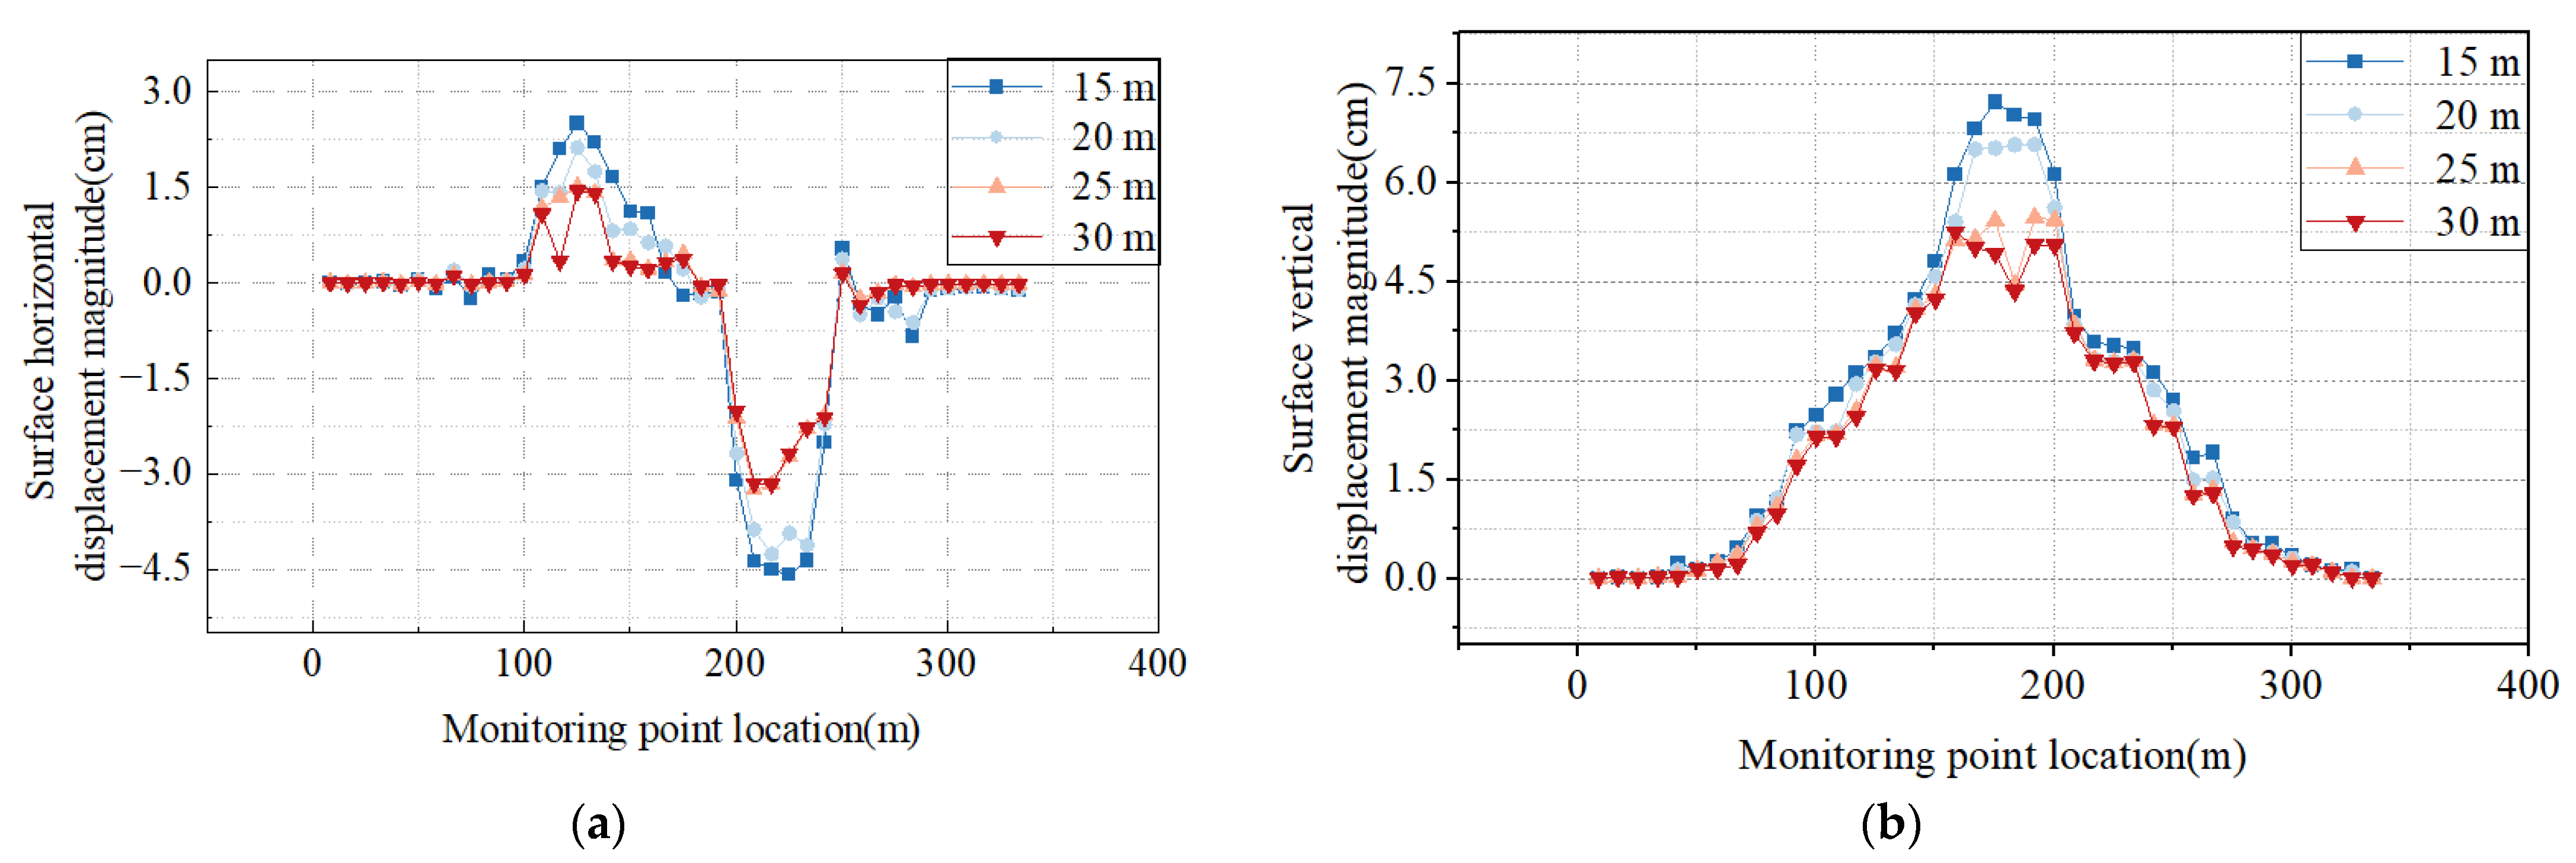
From the perspective of strata movement indicators, the horizontal displacement, vertical displacement, inclination, and curvature under different boundary crown pillar thicknesses all exhibit distinct zonal characteristics. In the surface area of 0–100 m, deformation is relatively small, indicating limited excavation disturbance. The left slope area of 100–200 m and the boundary crown pillar area of 200–250 m are the main deformation concentration zones. In the right slope area of 250–300 m, deformation gradually attenuates, and all indicators approach zero beyond 300 m, suggesting that the influence of strata movement progressively dissipates.
As shown in Figure 14a, the horizontal displacement reaches a positive peak in the left slope area between 100 and 200 m. The peak value is approximately 2.3–2.5 cm under the 15 m condition and decreases to about 2.0 cm under the 20 m condition, further decreasing to approximately 1.5 cm and 1.3 cm under the 25 m and 30 m conditions, respectively. After entering the crown pillar area between 200 and 250 m, the horizontal displacement changes to negative values, reaching approximately −4.5 cm under the 15 m condition, −4.0 cm under the 20 m condition, and converging to about −3.2 cm under the 25 m and 30 m conditions. These results indicate that increasing the boundary crown pillar thickness can effectively restrain lateral deformation.
As shown in Figure 14b, the settlement peak of vertical displacement is mainly located in the left slope and pit bottom area between 100 and 200 m. The maximum settlement is approximately 7.0–7.2 cm under the 15 m condition, about 6.5 cm under the 20 m condition, and decreases to approximately 5.5 cm and 5.0 cm under the 25 m and 30 m conditions, respectively. Compared with the 15 m condition, the maximum settlement under the 25 m and 30 m conditions is reduced by approximately 23% and 30%, respectively. The settlement attenuates rapidly within the crown pillar area, indicating that the boundary crown pillar provides significant support to the overlying strata. When the pillar thickness increases to 25 m, the additional improvement in settlement control achieved by further thickening becomes progressively limited.
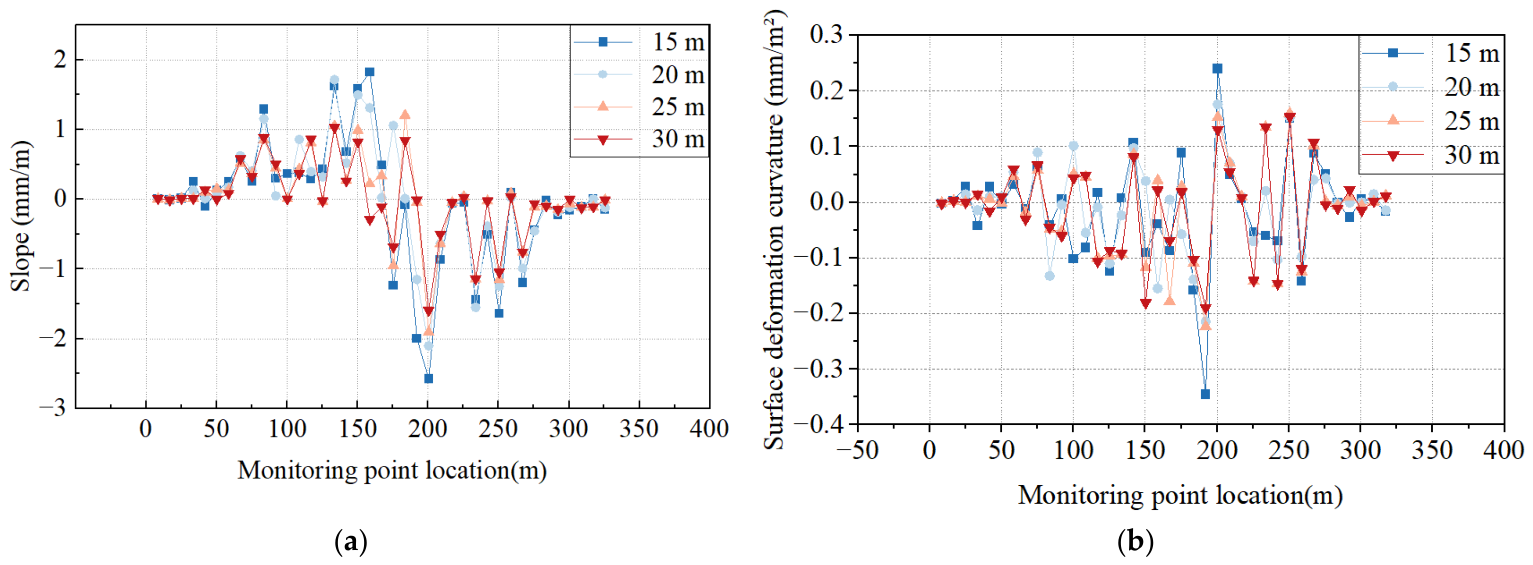
As shown in Figure 15a, surface inclination deformation is mainly concentrated within the range of 100–250 m, indicating pronounced differential deformation in the transition zone between the left slope and the boundary crown pillar. Under the 15 m condition, the local inclination exceeds ±2.0 mm/m, with a sharp change approaching −2.5 mm/m at approximately 200 m. This suggests that uneven surface settlement and local rotation are relatively significant under the thin-pillar condition. Under the 20 m condition, the fluctuation in inclination is reduced. Under the 25 m and 30 m conditions, most monitoring points are controlled within ±1.5 mm/m, indicating that increasing the crown pillar thickness effectively mitigates uneven settlement and local rotational deformation.
As shown in Figure 15b, surface curvature variation is mainly concentrated within the range of 150–250 m, which is generally consistent with the concentrated zone of inclination deformation. Under the 15 m condition, the curvature fluctuates most significantly, with a negative curvature of approximately −0.35 mm/m2 and a positive curvature of approximately 0.24 mm/m2, indicating strong bending deformation of the strata. Under the 20 m condition, curvature fluctuation still exists, but its amplitude decreases. Under the 25 m and 30 m conditions, the curvature is mostly controlled within approximately ±0.15 mm/m2, suggesting that strata bending deformation becomes gentler and that the deformation compatibility of the slope–boundary crown pillar system is significantly enhanced.

3.1.3. Plastic Zone Development Characteristics During Mining at the First Underground Level

The plastic zone distributions under different boundary crown pillar thicknesses indicate that pillar thickness has a significant controlling effect on the connectivity of the plastic zone and the overall stability of the pillar.
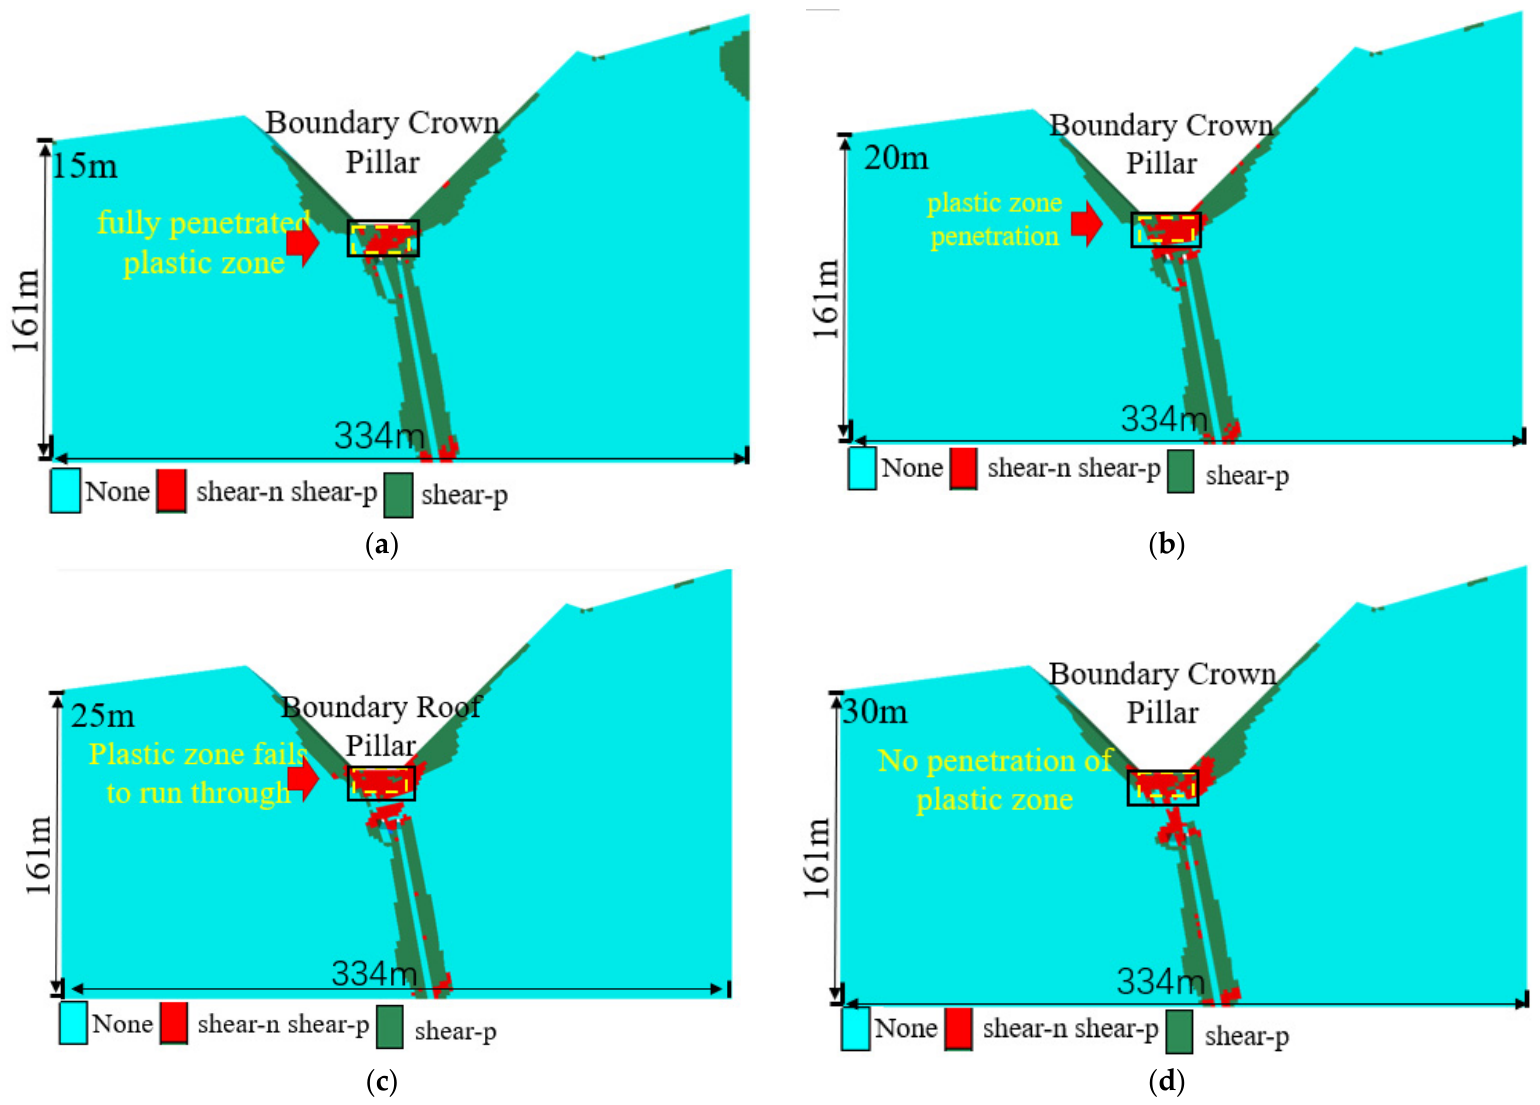
As shown in Figure 16, the development of the plastic zone is strongly controlled by the thickness of the boundary crown pillar. Under the 15 m condition, Figure 16a, the plastic zone is highly concentrated within the pillar and near the goaf roof, exhibiting an obvious through-going failure pattern. This indicates that the bearing section of the thin pillar is insufficient, and that stress concentration promotes the full development of local shear failure, resulting in poor overall stability. Under the 20 m condition, Figure 16b, the extent of the plastic zone is reduced compared with the 15 m condition; however, it still tends to propagate from the goaf roof into the interior of the crown pillar. This suggests that although the load-bearing capacity of the pillar is improved, the potential plastic failure path has not yet been effectively interrupted. When the pillar thickness increases to 25 m, Figure 16c, the plastic zone is markedly restrained and is mainly confined to the vicinity of the goaf roof and local contact areas of the crown pillar, without forming a through-going failure band. This indicates that internal stress concentration is effectively alleviated, the integrity of the load-bearing structure is significantly enhanced, and the overall stability is substantially improved compared with the thinner schemes. When the thickness is further increased to 30 m, Figure 16d, the plastic zone is mainly limited to the vicinity of the goaf roof, while the main body of the boundary crown pillar remains essentially elastic, with no obvious through-going plastic failure. These results demonstrate that increasing the pillar thickness progressively restricts the development of plastic failure, and that the 25 m scheme can already satisfy the stability requirements, whereas the 30 m scheme mainly provides additional load-bearing redundancy and safety reserve.

3.1.4. Quantitative Evaluation of Deformation Symmetry

To further clarify the relationship between boundary crown pillar thickness and deformation coordination, a quantitative evaluation of deformation symmetry was introduced. During the transition from open-pit to underground mining, the stability of the slope–crown pillar–stope system is not only controlled by the magnitude of stress and displacement, but also by whether deformation and load transfer on both sides of the crown pillar remain coordinated. A thin pillar tends to develop asymmetric stress redistribution, opposite horizontal displacement concentration, and through-going plastic failure, whereas a sufficiently thick pillar can interrupt the failure path and promote a more symmetric load-bearing state.
Because opposite horizontal movements are generated on the two sides of the crown pillar, the absolute values of the positive and negative horizontal displacement extrema were used to characterize deformation balance. The displacement asymmetry index is defined as follows:
A I u = u L u R u L + u R + ε
where A I u is the displacement asymmetry index; u L and u R are the representative horizontal displacement extrema on the two sides of the crown pillar, respectively; and ε is a very small positive number used to avoid division by zero. A smaller A I u indicates better deformation symmetry and stronger deformation compatibility. When A I u approaches zero, the horizontal deformation magnitudes on both sides of the pillar are nearly balanced. In contrast, a larger A I u indicates more obvious asymmetric deformation and a higher risk of local instability.
Similarly, the stress asymmetry index can be expressed as:
A I σ = σ L σ R σ L + σ R + ε
where A I σ is the stress asymmetry index, and σ L and σ R are the representative stress values on the two sides of the crown pillar or in corresponding stress concentration zones. In practical application, the displacement asymmetry index, stress asymmetry index, and plastic-zone connectivity can be jointly used to evaluate whether the crown pillar has evolved from asymmetric failure toward coordinated and more symmetric load bearing.
Based on the numerical simulation results, the deformation symmetry characteristics of the four boundary crown pillar thickness schemes are summarized in Table 5. Under the 15 m scheme, the horizontal displacement extrema on the two sides of the pillar reach approximately +3.85 cm and −4.80 cm, respectively, and the displacement difference between the two sides is the largest. At the same time, a plastic zone develops through the pillar, indicating that the pillar is in an asymmetric and unstable deformation state. Under the 20 m scheme, the displacement extrema decrease to approximately +3.00 cm and −4.00 cm. Although the overall deformation is reduced, the plastic failure path still tends to remain connected, suggesting that the pillar is still in a critical state. When the thickness increases to 25 m, the horizontal displacement extrema decrease to approximately +3.00 cm and −3.60 cm, the vertical displacement decreases by approximately 27.0% compared with the 15 m scheme, and the plastic zone no longer penetrates the pillar. This indicates that the deformation mode changes from through-going asymmetric dislocation to localized and coordinated adjustment. When the thickness is further increased to 30 m, the deformation becomes slightly more uniform, but the maximum vertical displacement is only reduced by less than 2% compared with the 25 m scheme, indicating limited additional improvement.
The quantitative and qualitative comparison shows that the increase in boundary crown pillar thickness changes the mechanical response of the system in three stages. First, when the pillar thickness is insufficient, the crown pillar is strongly disturbed by underground excavation, and asymmetric displacement and connected plastic failure dominate the deformation process. Second, with increasing pillar thickness, the stress concentration zone and high-displacement zone gradually contract, and the load transfer path becomes more stable. Third, when the pillar thickness reaches approximately 25 m, the plastic zone is effectively interrupted, the displacement response on both sides becomes more coordinated, and the slope–crown pillar–stope system enters a more symmetric load-bearing state. Therefore, deformation symmetry provides an important mechanical criterion for identifying the optimal crown pillar thickness. Considering deformation control, plastic-zone connectivity, and resource recovery efficiency, 25 m can be regarded as the recommended safe thickness for the boundary crown pillar in the Kumusayi mine.

3.2. Safety Verification of the Optimal Boundary Crown Pillar Thickness

3.2.1. Overlying Strata Movement During Mining at the First Underground Level

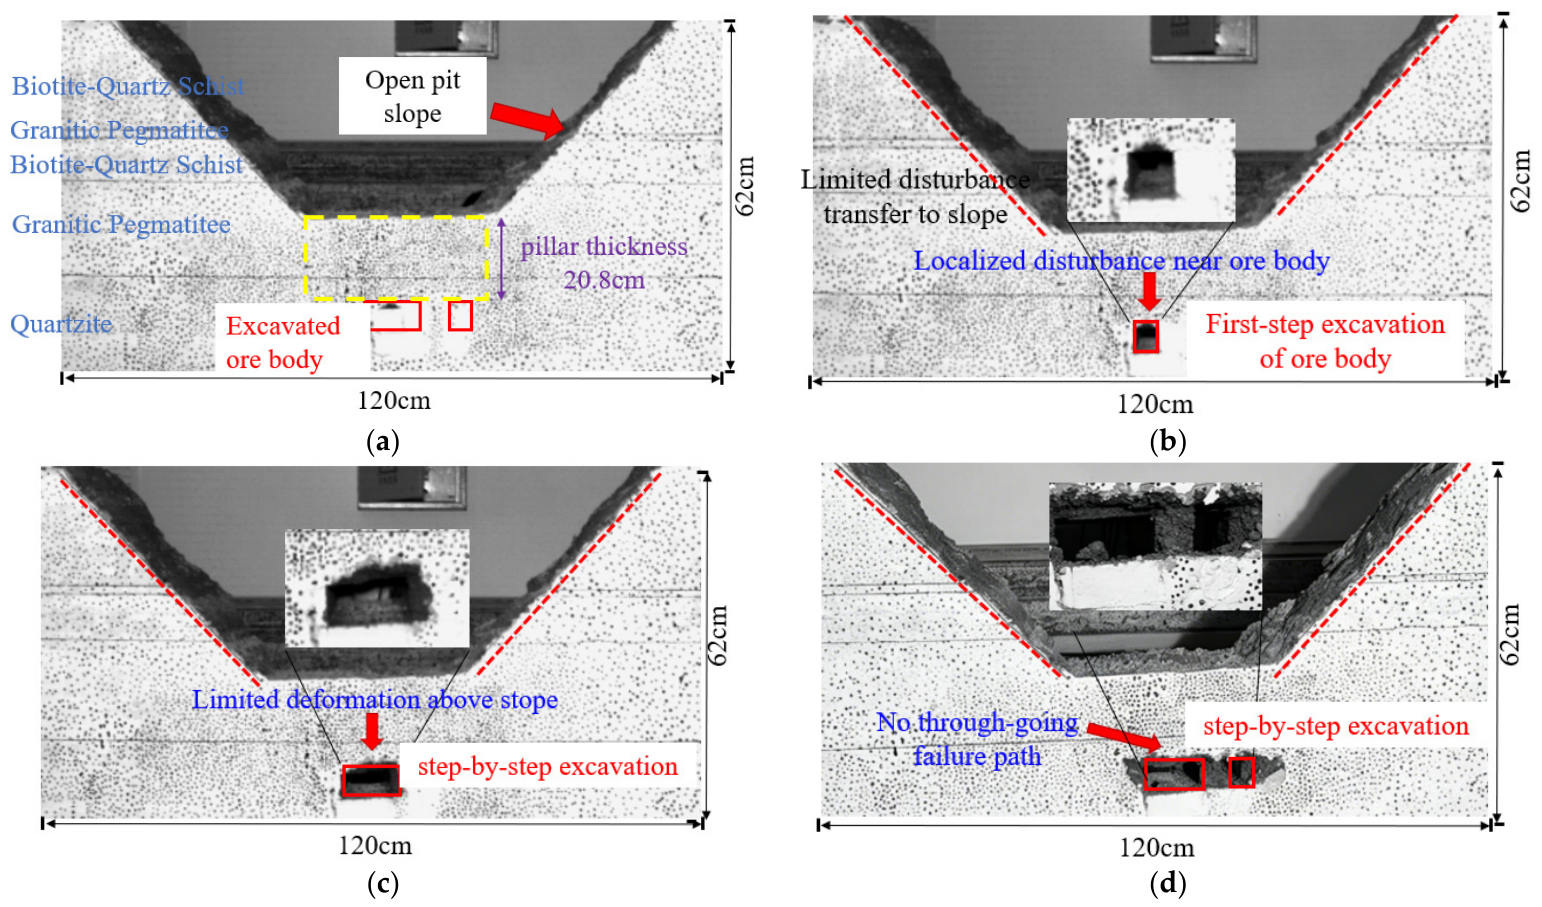
According to the physical model test results, the 20.8 cm boundary crown pillar in the model corresponds to a prototype pillar thickness of 25 m. The overlying strata movement characteristics during the stepwise excavation process from open-pit to underground mining can be summarized as follows:
After completion of the open-pit excavation, Figure 17a, the overall structure of the physical model remained relatively intact, and no obvious through-going cracks or large-scale sliding were observed on the slope surface. The boundary crown pillar, with a model thickness of 20.8 cm, was located between the open-pit floor and the underlying ore body and maintained good structural continuity, indicating that it retained its basic load-bearing function after open-pit unloading. During the initial excavation of the underground ore body, Figure 17b, local disturbance developed around the goaf, but no significant settlement or crack propagation occurred in the upper part of the crown pillar or near the open-pit floor. The excavation-induced disturbance was mainly confined to the vicinity of the ore-body excavation area and did not propagate upward through the pillar, suggesting that the crown pillar provided effective isolation and support for the overlying strata. With the continued advancement of underground excavation, Figure 17c, slight bending and localized deformation appeared in the strata above the goaf; however, these changes were mainly restricted to the goaf roof area. No obvious through-going cracks developed within the crown pillar, and the open-pit floor remained generally stable, indicating that the pillar effectively weakened the transmission of underground excavation disturbance toward the pit floor and open-pit slope. After multi-step excavation, Figure 17d, as the goaf further expanded, local loosening and small-scale collapse occurred in the surrounding rock, with failure mainly concentrated near the lower goaf. Nevertheless, the boundary crown pillar still maintained a continuous load-bearing state, without through-going failure, overall instability, or obvious slope sliding. These observations demonstrate that when the model pillar thickness is 20.8 cm, corresponding to a prototype thickness of approximately 25 m, the boundary crown pillar can effectively coordinate open-pit unloading and underground mining disturbance, control overlying strata deformation, and maintain good overall stability.
In summary, for a prototype boundary crown pillar thickness of 25 m, the overlying strata movement induced by underground excavation is primarily concentrated in the vicinity of the goaf, without forming a failure path that penetrates upward toward the open-pit floor. This indicates that the 25 m boundary crown pillar can satisfy the basic stability requirements during the transition from open-pit to underground mining.

3.2.2. Deformation Characteristics During Mining at the First Underground Level

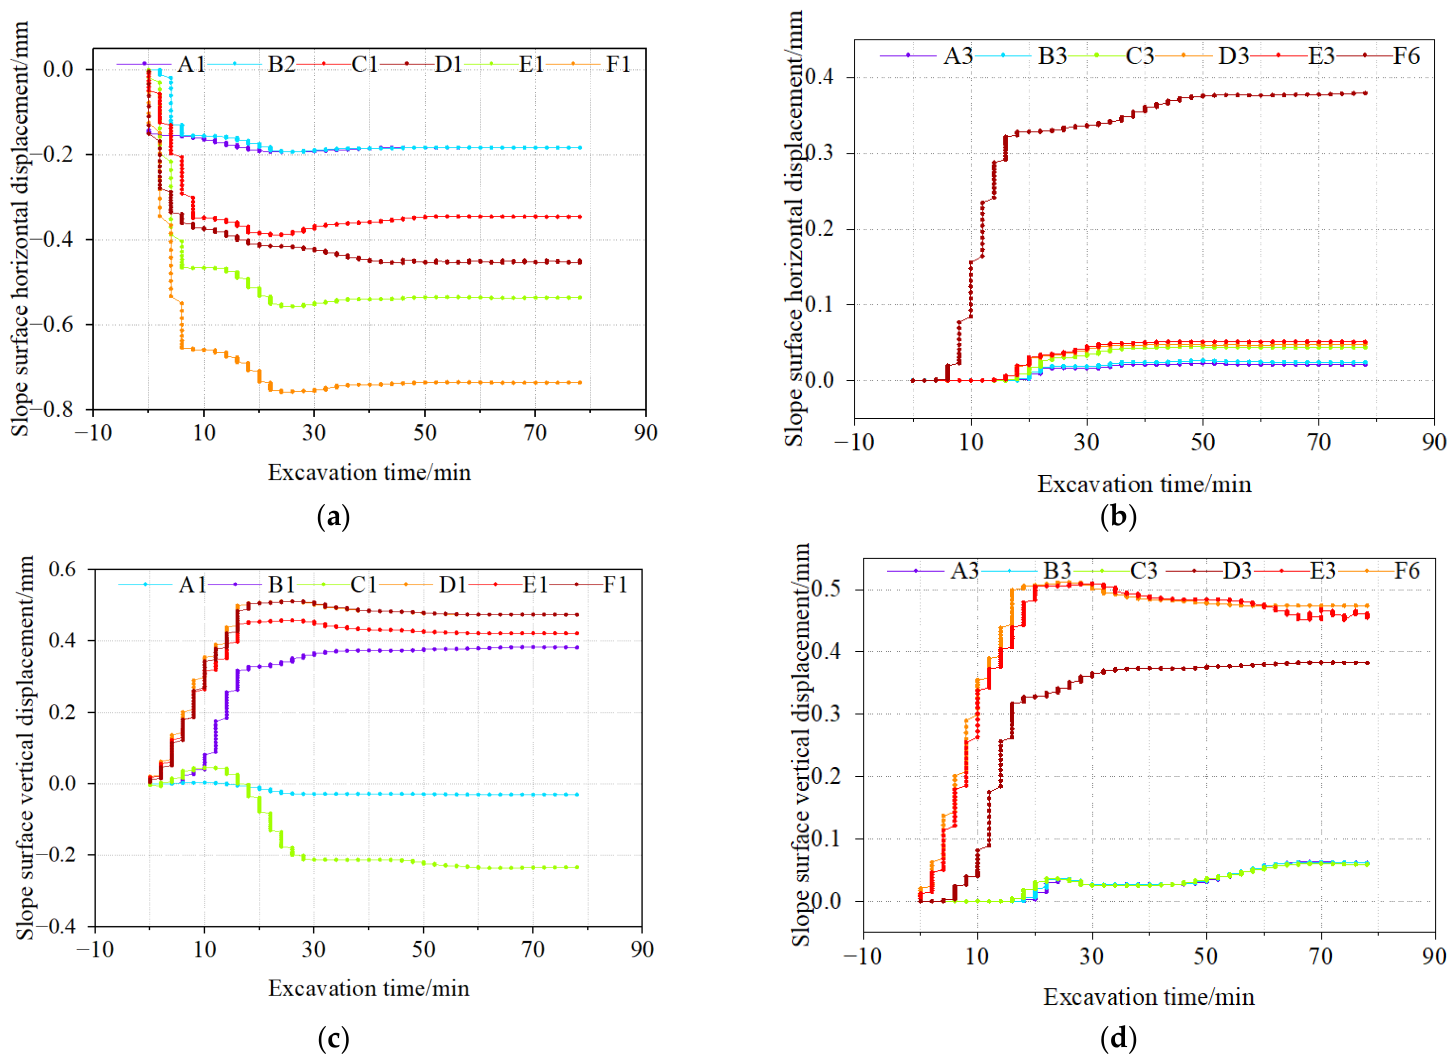
According to the monitoring point arrangement and the displacement time-history curves shown in Figure 18, after underground mining, in the physical similarity model with a 25 m boundary crown pillar, the slope displacement generally exhibits a staged evolution pattern of a rapid response in the initial excavation stage, slow adjustment in the middle stage, and gradual stabilization in the later stage. The deformation of the left and right slopes shows a certain degree of asymmetry. Both slopes exhibit deformation toward the goaf; however, the deformation magnitude and sensitive zones differ significantly between the two sides.
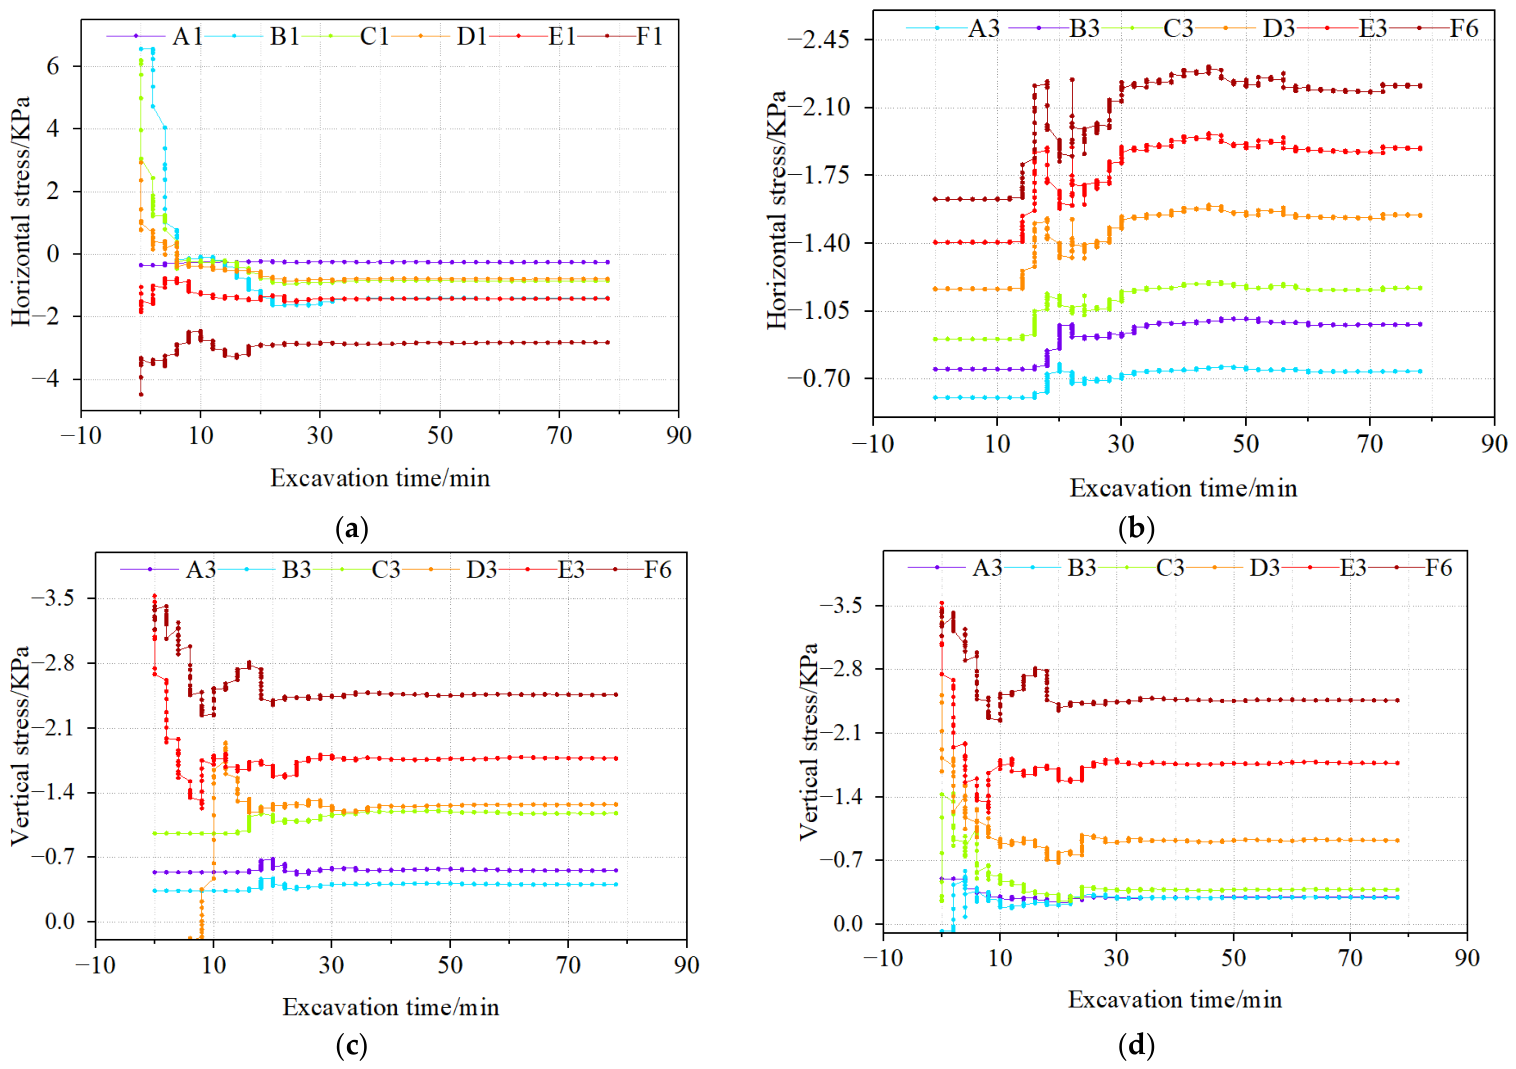
As shown in Figure 18a, the horizontal displacement of the left slope is predominantly negative, indicating displacement toward the goaf. The main deformation occurs during the initial 0–10 min of excavation and then gradually stabilizes. The displacements of A1 and B2 are relatively small, stabilizing at approximately −0.18 to −0.20 mm, whereas C1, D1, and E1 stabilize at about −0.35, −0.45, and −0.54 mm, respectively. F1 exhibits the largest response, reaching a peak displacement of approximately −0.75 mm and later stabilizing at −0.73 to −0.74 mm, indicating that the lower part of the left slope is more sensitive to excavation disturbance. In contrast, the horizontal displacement of the right slope is relatively small, Figure 18b. A3, B3, C3, E3, and F6 stabilize within 0.02–0.05 mm, while only D3 shows a distinct response, increasing rapidly during 10–25 min and finally stabilizing at 0.36–0.38 mm. This suggests that the right-slope horizontal deformation is mainly characterized by localized adjustment rather than continuous displacement development. As shown in Figure 18c, the vertical displacement of the left slope shows rapid initial deformation followed by gradual stabilization. A1 remains close to zero, indicating a weak vertical response. B1 stabilizes at approximately 0.35–0.38 mm, while D1 and E1 reach about 0.47–0.50 mm. In contrast, C1 shows negative displacement, stabilizing at −0.22 to −0.25 mm, indicating spatially differentiated deformation. As shown in Figure 18d, the vertical displacement of the right slope is mainly positive. E3 and F6 exhibit the strongest responses, rapidly increasing within 10–25 min to peak values of approximately 0.48–0.51 mm, followed by slight attenuation and stabilization at 0.45–0.47 mm. D3 stabilizes at 0.37–0.39 mm, whereas A3, B3, and C3 remain within 0.03–0.06 mm. Overall, the slope displacement is mainly concentrated near the goaf and crown pillar, and no accelerated deformation is observed in the later stage.
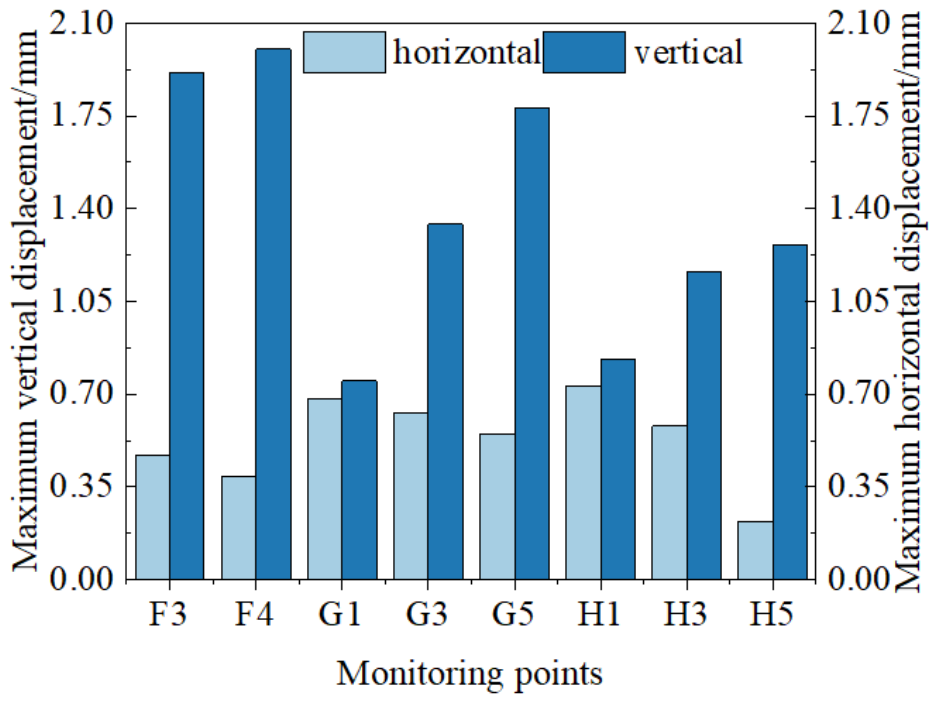
According to the monitoring point arrangement, F3 and F4 are located on the surface of the crown pillar, and Figure 19 mainly reflects the deformation of the pit bottom and the upper part of the pillar. G1, G3, and G5 are located in the middle of the pillar and are used to characterize deformation in the internal load-bearing zone, while H1, H3, and H5 are close to the underground excavation area and reflect the influence of mining disturbance on the lower part of the pillar.
As shown in Figure 19, the vertical displacement at each monitoring point is generally greater than the horizontal displacement, indicating that crown pillar deformation after excavation is dominated by vertical settlement/compression, whereas lateral deformation is relatively weak. The vertical displacements of F3 and F4 on the pillar surface are the largest, reaching 1.85 mm and 2.00 mm, respectively, while their horizontal displacements are only 0.42 mm and 0.38 mm. This indicates that the pillar surface is significantly affected by both pit-bottom unloading and underground mining disturbance, making it the most sensitive zone for vertical deformation.
In the middle of the crown pillar, the vertical displacements at G1, G3, and G5 are 0.75 mm, 1.35 mm, and 1.77 mm, respectively, while their horizontal displacements are 0.68 mm, 0.62 mm, and 0.52 mm, respectively. Among these points, G5 shows relatively concentrated vertical deformation, although its displacement remains lower than that of the surface monitoring points.
Near the excavation area, the vertical displacements at H1, H3, and H5 are 0.82 mm, 1.15 mm, and 1.28 mm, respectively, while their horizontal displacements are 0.73 mm, 0.58 mm, and 0.22 mm, respectively. The relatively large horizontal displacement at H1 indicates a certain degree of local lateral adjustment, whereas the smallest horizontal displacement at H5 suggests that lateral deformation at this position is well controlled.

3.2.3. Stress Evolution During Mining at the First Underground Level

After underground mining in the model with the optimal 25 m boundary crown pillar, the slope stress shown in Figure 20 generally exhibits a staged evolution pattern characterized by rapid disturbance in the initial stage, stress redistribution in the middle stage, and gradual stabilization in the later stage. Most monitoring points show abrupt changes within 0–10 min, complete the main stress adjustment within 10–30 min, and then gradually become stable after 30 min. This indicates that the system progressively reaches a new mechanical equilibrium.
As shown in Figure 20a, the horizontal stress response of the left slope is the most pronounced. During the initial stage, B1 and C1 reach positive peak stresses of approximately 6.0–6.5 kPa, while D1 reaches about 3.0 kPa; these stresses subsequently decrease and gradually shift to negative values. In the later stage, A1 and C1 stabilize at approximately −0.3 to −0.4 kPa, D1 at −0.8 to −0.9 kPa, and B1 and E1 at −1.4 to −1.6 kPa. F1 exhibits the largest stress magnitude, with an initial value of about −4.5 kPa and a later stable value of −2.8 to −3.0 kPa, indicating that the lower part of the left slope is most strongly affected by mining-induced disturbance and represents a sensitive zone for horizontal stress redistribution. In the right slope, Figure 20b, the horizontal stress is generally negative and shows a clear spatial pattern, with smaller values in the upper part and larger values in the lower part. In the later stage, A3, B3, and C3 stabilize within −0.70 to −1.15 kPa, whereas D3, E3, and F6 stabilize at approximately −1.50 to −1.55 kPa, −1.85 to −1.90 kPa, and −2.10 to −2.20 kPa, respectively, suggesting that horizontal stress adjustment is mainly concentrated in the middle and lower parts of the right slope. As shown in Figure 20c, the vertical stress of the right slope fluctuates markedly during the initial excavation stage and then gradually stabilizes. The upper monitoring points A3 and B3 show relatively weak responses, stabilizing at approximately −0.35 to −0.55 kPa, while C3 stabilizes at about −1.1 to −1.2 kPa. D3 stabilizes at approximately −1.2 to −1.3 kPa after short-term fluctuation. In contrast, E3 and F6 exhibit larger stress magnitudes, stabilizing at −1.70 to −1.80 kPa and −2.35 to −2.45 kPa, respectively. This indicates that the slope toe and goaf-adjacent area are the main stress redistribution zones. The vertical stress variation of the right slope, Figure 20d, is generally consistent with that of the left slope. In the later stage, A3, B3, and C3 stabilize at −0.25 to −0.40 kPa, D3 at −0.85 to −0.90 kPa, E3 at −1.70 to −1.80 kPa, and F6 at −2.35 to −2.45 kPa, with the initial minimum value approaching −3.5 kPa. These results indicate that the lower slope is the primary zone of stress adjustment under underground mining disturbance.
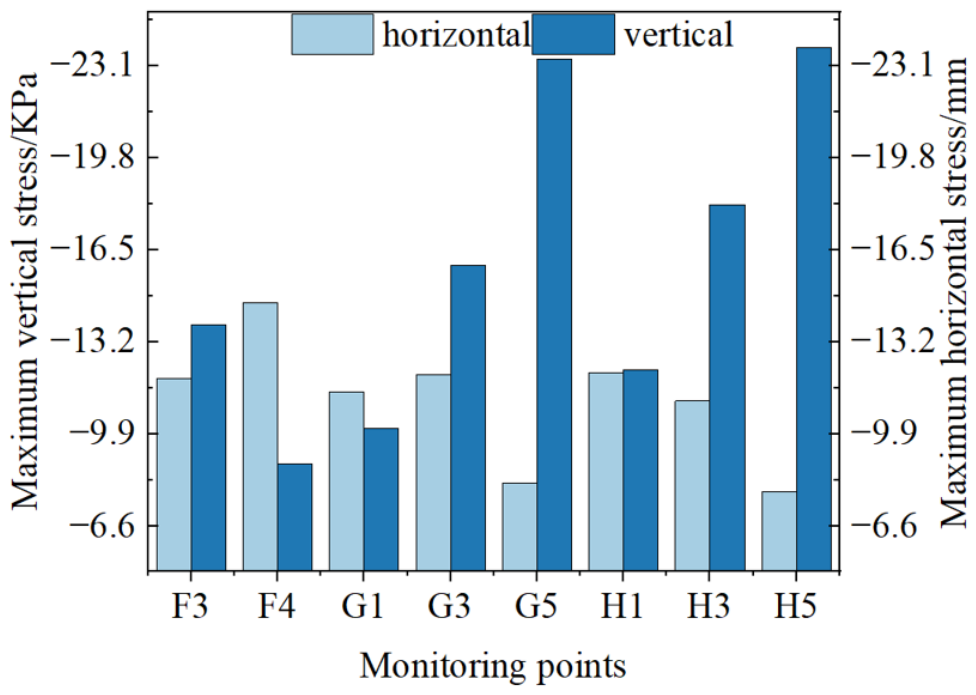
According to the monitoring point arrangement, as shown in Figure 21, F3 and F4 are located on the surface of the boundary crown pillar and reflect the stress response at the open-pit floor; G1, G3, and G5 are located in the middle of the pillar and characterize stress variations in the internal load-bearing zone; and H1, H3, and H5 are close to the underground excavation area and reflect the disturbance effect of mining on the lower part of the pillar. As shown in Figure 21, all monitoring points are subjected to compressive stress, but the stress responses vary significantly with location.
In terms of vertical stress, the maximum values at F3 and F4 on the pillar surface are −13.5 kPa and −9.0 kPa, respectively, indicating that they are strongly affected by overburden load and excavation unloading. The vertical stresses at G1, G3, and G5 in the middle of the pillar are −10.0 kPa, −16.0 kPa, and −23.3 kPa, respectively, among which G5 shows the most pronounced vertical compressive stress concentration. The vertical stresses at H3 and H5 near the excavation side reach −18.0 kPa and −23.6 kPa, respectively, with H5 showing the maximum value in the entire monitoring area. This indicates that underground excavation induces strong vertical compression in the lower part of the pillar.
The horizontal stress is generally distributed between −7.5 and −14.5 kPa. Among the monitoring points, F4 reaches −14.5 kPa, indicating a prominent lateral compression effect and F3, G1, G3, H1, and H3 are mostly concentrated within −10 to −12 kPa, while the horizontal stresses at G5 and H5 are relatively small, approximately −7.5 kPa. These results indicate that the horizontal stress within the pillar does not vary monotonically with depth, but is jointly controlled by the goaf geometry, pillar structure, and local stress transfer.
The numerical simulation and physical similarity model test are generally consistent in identifying the 25 m boundary crown pillar as the optimized scheme. The numerical model compared four thickness schemes and showed that the 25 m scheme interrupted plastic-zone connectivity and improved deformation coordination. The physical model test further verified that the corresponding 20.8 cm model pillar maintained structural continuity and prevented through-going failure and overall slope sliding. However, the two methods have different roles. The numerical model provides quantitative comparison of stress, displacement, and plastic-zone evolution among different schemes, whereas the physical model mainly provides visual verification of crack development, strata movement, and stress response for the optimized scheme. Therefore, the two approaches are complementary rather than completely identical.

4. Conclusions

Taking the open-pit to underground mining transition of the Kumusayi Li-Nb-Ta mine as the engineering background, this study established an integrated theoretical calculation–FLAC3D numerical simulation–physical similarity model testing framework to optimize the boundary crown pillar thickness. The main conclusions and engineering implications are as follows.
(1) The four theoretical methods yielded boundary crown pillar thicknesses of 19.99 m, 14.00 m, 29.81 m, and 10.41 m. No single formula was considered sufficient to independently determine the final pillar thickness because each method is based on simplified assumptions and emphasizes different mechanical aspects. In this study, the Rubeneeite formula was used only as a theoretical lower-bound reference, the span-to-thickness ratio method was treated as the engineering lower bound, the simplified structural beam method was regarded as a conservative upper-bound reference, and the load transfer intersection method was used as an intermediate control value. These values were therefore integrated to define a theoretical constraint interval of 14.00–29.81 m. This indicates that boundary crown pillar design during open-pit to underground mining transition should use theoretical formulas as preliminary interval constraints rather than relying on a single empirical formula.
(2) Numerical simulation showed that increasing the pillar thickness gradually reduces stress concentration, displacement concentration, and plastic-zone connectivity. The 15 m scheme exhibited insufficient stability, while the 20 m scheme remained close to a critical state. At 25 m, the plastic zone was effectively interrupted, the deformation became more coordinated, and the maximum vertical displacement decreased by approximately 27.0% compared with the 15 m scheme. Increasing the thickness to 30 m produced only limited additional improvement, indicating that 25 m provides a suitable balance between stability and resource recovery.
(3) The study demonstrates that deformation symmetry is an important criterion for boundary crown pillar optimization. Compared with traditional evaluations that mainly focus on stress and displacement magnitude, the deformation-symmetry perspective helps identify whether the slope–pillar–stope system changes from asymmetric failure to coordinated load-bearing. From an engineering perspective, this index can support the identification of asymmetric deformation, potential through-going failure risk, and reasonable pillar thickness, thereby providing a more comprehensive basis for stability evaluation and design optimization.
(4) In the physical similarity model test, the 20.8 cm model pillar corresponds to a 25 m prototype boundary crown pillar according to the geometric similarity ratio. The test results show that this pillar thickness can effectively control overlying strata movement, crack propagation, and overall slope instability. Therefore, the recommended 25 m thickness can be regarded as a design-stage optimized value for the Kumusayi mine.
(5) The planning implication of this work is that boundary crown pillar thickness should be determined through a site-specific staged evaluation process for open-pit to underground transition mines. Although the four theoretical formulas can provide useful preliminary lower-bound, upper-bound, and intermediate reference values, no single formula can be generally recommended as sufficient because the result is strongly affected by mine geometry, ore-body occurrence, pit-bottom position, underground sublevel layout, excavation sequence, backfilling, and rock-mass conditions. Therefore, the proposed workflow integrates theoretical interval estimation, numerical simulation, deformation-symmetry evaluation, and physical model verification, providing a practical reference for similar mines that need to balance mining safety, deformation control, and resource recovery. Future field monitoring should be conducted after the long-term stability of the boundary crown pillar begins to be further verified and possible design adjustment is supported through underground mining.

Author Contributions

Conceptualization, X.H., W.G. and X.W.; methodology, X.H., X.W. and H.W.; software, X.H.; validation, X.H., F.J. and H.W.; formal analysis, X.H. and C.Q.; investigation, X.H., C.Q. and F.J.; resources, W.G., X.W., J.H. and D.H.; data curation, X.H.; writing—original draft preparation, X.H.; writing—review and editing, W.G., X.W., C.Q., H.W., M.X., J.H. and D.H.; visualization, X.H. and C.Q.; supervision, W.G., X.W., M.X., J.H. and D.H.; project administration, W.G., X.W., J.H. and D.H.; funding acquisition, W.G., X.W., J.H. and D.H. All authors have read and agreed to the published version of the manuscript.

Funding

This research was funded by the Xinjiang Uygur Autonomous Region Science and Technology Program, grant number 2024A01002-1 (Principal Investigator: Huang Junpeng); Xinjiang Production and Construction Corps Key Areas Science and Technology Research Program, grant number 2025AB026; Natural Science Foundation of Xinjiang Uygur Autonomous Region, grant number 2025D01C259; Science and Technology Plan Project of Kekedala City, the Fourth Division of the Xinjiang Production and Construction Corps, grant number 2025ZR005; Xinjiang Uygur Autonomous Region “Tianshan Talents” Scientific Research Project—Young Top Talents, grant number 2023TSYCCX0081; Xinjiang Uygur Autonomous Region Science and Technology Plan Project—Major Science and Technology Special Project, grant number 2024A03001-2; Xinjiang Talent Development Fund Project, grant number XJRC-2025-KJ-YJ-CXPT-159; Hami City Scientific Research and Technology Development Project of Xinjiang Uygur Autonomous Region, grant number hmkj2025004; and Xinjiang University Outstanding Postgraduate Innovation Project, grant number XJDX2025YJS109.

Data Availability Statement

All data used in this study are presented within the manuscript. Additional information is available from the authors upon request (107552404780@stu.xju.edu.cn).

Acknowledgments

The authors thank all contributors who supported and assisted in the completion of this work.

Conflicts of Interest

The authors whose names are listed below certify that they have no conflicts of interest to declare: Xiaole Han, Weiming Guan, Xin Wang, Meng Xie, Haosen Wang. Defeng Hou was employed by Xinjiang Tianchi Energy Co., Ltd. Cheng Qian was employed by Xinjiang Sanxin Coal Industry Co., Ltd. The remaining authors declare that the research was conducted in the absence of any commercial or financial relationships that could be construed as a potential conflict of interest.

References

  1. Li, X.; Li, Q.; Wang, Y.; Liu, W.; Hou, D.; Zheng, W.; Zhang, X. Experimental study on instability mechanism and critical intensity of rainfall of high-steep rock slopes under unsaturated conditions. Int. J. Min. Sci. Technol. 2023, 33, 1243–1260. [Google Scholar] [CrossRef]
  2. Wang, F.; Ren, Q.; Jiang, X.; Jiang, A.; Zhao, C.; Liu, W. Engineering geology and subsidence mechanism of a mountain surface in the Daliang Lead–zinc Ore Mine in China. Bull. Eng. Geol. Environ. 2022, 81, 488. [Google Scholar] [CrossRef]
  3. Xu, N.; Zhang, J.; Tian, H.; Mei, G.; Ge, Q. Discrete element modeling of strata and surface movement induced by mining under open-pit final slope. Int. J. Rock Mech. Min. Sci. 2016, 88, 61–76. [Google Scholar] [CrossRef]
  4. Flores, G.E. Rock Mass Response to the Transition from Open Pit to Underground Cave Mining. Ph.D. Thesis, The University of Queensland, Brisbane, Australia, 2005. [Google Scholar]
  5. Ross, I.; Stewart, C. Issues with transitioning from open pits to underground caving mines. In Proceedings of the Eighth International Conference & Exhibition on Mass Mining; University of Chile: Santiago, Chile, 2020. [Google Scholar]
  6. Jiang, N.; Zhou, C.; Lu, S.; Zhang, Z. Propagation and prediction of blasting vibration on slope in an open pit during underground mining. Tunn. Undergr. Space Technol. 2017, 70, 409–421. [Google Scholar] [CrossRef]
  7. Leng, D.; Shi, W.; Liang, F.; Li, H.; Yan, L. Stability and deformation evolution analysis of karstified slope subjected to underground mining based on Hoek–Brown failure criterion. Bull. Eng. Geol. Environ. 2023, 82, 174. [Google Scholar] [CrossRef]
  8. Singh, P.; Roy, M.; Paswan, R.K.; Dubey, R.; Drebenstedt, C. Blast vibration effects in an underground mine caused by open-pit mining. Int. J. Rock Mech. Min. Sci. 2015, 80, 79–88. [Google Scholar] [CrossRef]
  9. Salmi, E.F.; Nazem, M.; Deng, K.Z.; Karakus, M. Numerical analysis of a large landslide induced by coal mining subsidence. Eng. Geol. 2017, 217, 141–152. [Google Scholar] [CrossRef]
  10. Bakhtavar, E.; Oraee, K.; Shahriar, K. Assessment of crown pillar thickness between open-pit and block cave mining. In Proceedings of the 29th International Conference on Ground Control in Mining; West Virginia University: Morgantown, WV, USA, 2010. [Google Scholar]
  11. Bakhtavar, E. A study on geotechnical risks in the interaction between open-pit and block caving. In Proceedings of the 30th International Conference on Ground Control in Mining; West Virginia University: Morgantown, WV, USA, 2011. [Google Scholar]
  12. Yardimci, A.; Tutluoglu, L.; Karpuz, C. Crown pillar optimization for surface to underground mine transition in Erzincan/Bizmisen iron mine. In Proceedings of the ARMA US Rock Mechanics/Geomechanics Symposium; ARMA: Houston, TX, USA, 2016. [Google Scholar]
  13. Rybnikova, L.; Rybnikov, P.; Smirnov, A.Y. Flooding of Open Pit and Underground Mines in the Chelyabinsk Coal Field: Consequences, Problems and Solutions. J. Min. Sci. 2023, 59, 497–504. [Google Scholar] [CrossRef]
  14. Szwedzicki, T. Pre-and post-failure ground behaviour: Case studies of surface crown pillar collapse. Int. J. Rock Mech. Min. Sci. 1999, 36, 351–359. [Google Scholar] [CrossRef]
  15. Glazer, S.; Hepworth, N. Crown pillar failure mechanism–case study based on seismic data from Palabora Mine. Min. Technol. 2006, 115, 75–84. [Google Scholar] [CrossRef]
  16. Flores, G. Major hazards associated with cave mining: Are they manageable. In Proceedings of the First International Conference on Mining Geomechanical Risk; Australian Centre for Geomechanics: Perth, Australia, 2019. [Google Scholar]
  17. Carter, T. Guidelines for Use of the Scaled Span Method for Surface Crown Pillar Stability Assessment; Ontario Ministry of Northern Development and Mines: Ontario, ON, Canada, 2014; pp. 1–34.
  18. Bakhtavar, E.; Oraee, K.; Shahriar, K. Determination of the optimum crown pillar thickness between open pit and block caving. In Proceedings of the 29th International Conference on Ground Control in Mining; Department of Mining Engineering, College of Engineering and Mineral Resources: Morgantown, WV, USA, 2010. [Google Scholar]
  19. Lunder, P.; Pakalnis, R. Determination of the strength of hard-rock mine pillars. CIM Bull. 1997, 90, 51–55. [Google Scholar]
  20. Martin, C.; Maybee, W. The strength of hard-rock pillars. Int. J. Rock Mech. Min. Sci. 2000, 37, 1239–1246. [Google Scholar] [CrossRef]
  21. Zhao, X.-D.; Li, L.-C.; Tang, C.-A.; Zhang, H.-X. Stability of boundary pillars in transition from open pit to underground mining. J. Cent. South Univ. 2012, 19, 3256–3265. [Google Scholar] [CrossRef]
  22. Do, T.N.; Wu, J.-H.; Lin, H.-M. Investigation of sloped surface subsidence during inclined seam extraction in a jointed rock mass using discontinuous deformation analysis. Int. J. Geomech. 2017, 17, 04017021. [Google Scholar] [CrossRef]
  23. Li, L.; Kong, D.; Liu, Q.; Cai, H.; Chen, L. Study on law and prediction of surface movement and deformation in mountain area under repeated mining of shallow coal seam. Bull. Eng. Geol. Environ. 2023, 82, 76. [Google Scholar] [CrossRef]
  24. Vyazmensky, A.; Stead, D.; Elmo, D.; Moss, A. Numerical analysis of block caving-induced instability in large open pit slopes: A finite element/discrete element approach. Rock Mech. Rock Eng. 2010, 43, 21–39. [Google Scholar] [CrossRef]
  25. Xu, N.; Kulatilake, P.H.; Tian, H.; Wu, X.; Nan, Y.; Wei, T. Surface subsidence prediction for the WUTONG mine using a 3-D finite difference method. Comput. Geotech. 2013, 48, 134–145. [Google Scholar] [CrossRef]
  26. Wang, X.; Li, L.; Mu, W.; Yang, T.; An, J.; Du, Y. Diffusion mechanism of cement-based slurry in frozen and thawed fractured rock mass in alpine region. Constr. Build. Mater. 2024, 411, 134584. [Google Scholar] [CrossRef]
  27. Ng, C.; Shi, Q. A numerical investigation of the stability of unsaturated soil slopes subjected to transient seepage. Comput. Geotech. 1998, 22, 1–28. [Google Scholar] [CrossRef]
  28. Vyazmensky, A.; Elmo, D.; Stead, D. Role of rock mass fabric and faulting in the development of block caving induced surface subsidence. Rock Mech. Rock Eng. 2010, 43, 533–556. [Google Scholar] [CrossRef]
  29. Chen, T.; Mitri, H.S. Strategies for surface crown pillar design using numerical modelling–A case study. Int. J. Rock Mech. Min. Sci. 2021, 138, 104599. [Google Scholar] [CrossRef]
  30. Dintwe, T.K.; Sasaoka, T.; Shimada, H.; Hamanaka, A.; Moses, D.N.; Peng, M.; Fanfei, M.; Liu, S.; Ssebadduka, R.; Onyango, J.A. Numerical simulation of crown pillar behaviour in transition from open pit to underground mining. Geotech. Geol. Eng. 2022, 40, 2213–2229. [Google Scholar] [CrossRef]
  31. Mehra, A.; Budi, G. 3D Modelling approach to identify parametric configurations for pillar stability in underground metal mine: A case study. Geomat. Nat. Hazards Risk 2024, 15, 2367630. [Google Scholar] [CrossRef]
  32. Yang, Z.; Fan, X.; Yang, Y.; Hou, K.; Du, J.; Chen, X.; Mi, Y.; Jiang, C.; Zhang, J.; Guo, Y. Deformation patterns and failure mechanism of high and steep stratified rock slopes with upper steep and lower gentle style induced by step-by-step excavations. Environ. Earth Sci. 2022, 81, 229. [Google Scholar] [CrossRef]
  33. Villegas, T.; Nordlund, E.; Dahnér-Lindqvist, C. Hangingwall surface subsidence at the Kiirunavaara Mine, Sweden. Eng. Geol. 2011, 121, 18–27. [Google Scholar] [CrossRef]
  34. Xia, K.; Chen, C.; Fu, H.; Pan, Y.; Deng, Y. Mining-induced ground deformation in tectonic stress metal mines: A case study. Eng. Geol. 2016, 210, 212–230. [Google Scholar] [CrossRef]
  35. Jeon, B.; Jeong, H.; Choi, S.; Jeon, S. Assessment of subsidence hazard in abandoned mine area using strength reduction method. KSCE J. Civ. Eng. 2022, 26, 4338–4358. [Google Scholar] [CrossRef]
  36. Lu, Y.; Jin, C.; Wang, Q.; Li, G.; Han, T. Deformation and failure characteristic of open-pit slope subjected to combined effects of mining blasting and rainfall infiltration. Eng. Geol. 2024, 331, 107437. [Google Scholar] [CrossRef]
  37. Liang, J.; Jin, C.; Li, G.; Wang, Q. Instability mechanisms and collapse range prediction of steep high slopes during the open-pit to underground transition: A case study. Eng. Geol. 2026, 365, 108625. [Google Scholar] [CrossRef]
  38. Li, S.; Su, W.; Yin, T.; Dan, Z.; Peng, K. Research progress and typical case of open-pit to underground mining in China. Appl. Sci. 2025, 15, 8530. [Google Scholar] [CrossRef]
  39. Ma, K.; Yang, T.; Zhao, Y.; Gao, Y.; He, R.; Liu, Y.; Hou, J.; Li, J. Mechanical model for calculating surface movement related to open-pit and underground caving combined mining. Minerals 2023, 13, 520. [Google Scholar] [CrossRef]
  40. He, H.; Wang, X.; Liu, C.; Zhao, L.; Lyu, G.; Wu, X. Study on thickness of safety isolation layer in caving-to-backfilling mining. China Min. Mag. 2024, 33, 176–183. [Google Scholar]
  41. Wang, B.; Zuo, Q.; Deng, M.; Yi, Q.; Ruan, D.; Liang, Z. Study on the deformation mechanism of chair-like bedding rock landslides under the coupling effect of geological and hydrological factors. Eng. Geol. 2025, 344, 107832. [Google Scholar] [CrossRef]
  42. Yang, F.; Huang, Z.-W.; Dai, Z.-Y.; Liu, S.-F.; Zhao, L.-H. Stability analysis of multi-stage blasting rock slopes based on the Hoek-Brown criterion considering cumulative disturbance. Eng. Geol. 2025, 352, 108077. [Google Scholar] [CrossRef]
  43. Xu, S.; Suorineni, F.T.; An, L.; Li, Y.H.; Jin, C.Y. Use of an artificial crown pillar in transition from open pit to underground mining. Int. J. Rock Mech. Min. Sci. 2019, 117, 118–131. [Google Scholar] [CrossRef]
  44. Xia, K.; Chen, C.; Deng, Y.; Xiao, G.; Zheng, Y.; Liu, X.; Fu, H.; Song, X.; Chen, L. In situ monitoring and analysis of the mining-induced deep ground movement in a metal mine. Int. J. Rock Mech. Min. Sci. 2018, 109, 32–51. [Google Scholar] [CrossRef]
  45. Liu, X.; Xiong, F.; Zhou, X.; Liu, D.; Chen, Q.; Zhang, J.; Han, Y.; Xu, B.; Deng, Z.; He, C. Physical model test on the influence of the cutter head opening ratio on slurry shield tunnelling in a cobble layer. Tunn. Undergr. Space Technol. 2022, 120, 104264. [Google Scholar] [CrossRef]
Figure 1. Location of the study area and vertical distribution of major rock types.
Symmetry 18 00928 g001
Figure 2. Mining boundary and distribution of major ore bodies.
Symmetry 18 00928 g002
Figure 3. Span-thickness relationship of crown pillars derived from different empirical and analytical methods.
Symmetry 18 00928 g003
Figure 4. Mining boundary and major ore body distribution for numerical modeling.
Symmetry 18 00928 g004
Figure 5. Schematic diagram of the simulation scheme and procedure.
Symmetry 18 00928 g005
Figure 6. Physical model test system.
Symmetry 18 00928 g006
Figure 7. Physical model excavation scheme.
Symmetry 18 00928 g007
Figure 8. Schematic diagram of the monitoring arrangement.
Symmetry 18 00928 g008
Figure 9. Procedure of the physical model test.
Symmetry 18 00928 g009
Figure 10. Horizontal stress distribution under different boundary crown pillar thicknesses: (a) 15 m; (b) 20 m; (c) 25 m; (d) 30 m.
Symmetry 18 00928 g010
Figure 11. Vertical stress distribution under different boundary crown pillar thicknesses: (a) 15 m; (b) 20 m; (c) 25 m; (d) 30 m.
Symmetry 18 00928 g011
Figure 12. Horizontal displacement distribution under different boundary crown pillar thicknesses: (a) 15 m; (b) 20 m; (c) 25 m; (d) 30 m.
Symmetry 18 00928 g012
Figure 13. Vertical displacement distribution under different boundary crown pillar thicknesses: (a) 15 m; (b) 20 m; (c) 25 m; (d) 30 m.
Symmetry 18 00928 g013aSymmetry 18 00928 g013b
Figure 14. Strata movement characteristics under different boundary crown pillar thicknesses: (a) variation in surface horizontal displacement; (b) variation in surface vertical displacement.
Symmetry 18 00928 g014
Figure 15. Surface deformation characteristics under different boundary crown pillar thicknesses: (a) surface inclination deformation; (b) surface curvature deformation.
Symmetry 18 00928 g015
Figure 16. Plastic zone distribution characteristics under different boundary crown pillar thicknesses: (a) 15 m; (b) 20 m; (c) 25 m; (d) 30 m. “Shear-n” denotes zones currently undergoing shear yielding, whereas “shear-p” denotes zones that experienced shear yielding in previous calculation steps.
Symmetry 18 00928 g016
Figure 17. Evolution characteristics of the boundary crown pillar–overlying strata structure during the transition from open-pit to underground mining: (a) completion of open-pit excavation; (b) initial excavation of the underground ore body; (c) stepwise mining of the ore body; (d) final stage of stepwise ore-body mining.
Symmetry 18 00928 g017
Figure 18. Slope displacement variation of the optimal boundary crown pillar: (a) variation in horizontal displacement at A1–F1; (b) variation in horizontal displacement at A3–F6; (c) variation in vertical displacement at A1–F1; (d) variation in vertical displacement at A3–F6.
Symmetry 18 00928 g018
Figure 19. Internal displacement variation within the optimal boundary crown pillar.
Symmetry 18 00928 g019
Figure 20. Slope stress variation of the optimal boundary crown pillar: (a) variation in horizontal stress at A1–F1; (b) variation in horizontal stress at A3–F6; (c) variation in vertical stress at A1–F1; (d) variation in vertical stress at A3–F6.
Symmetry 18 00928 g020
Figure 21. Internal stress variation within the optimal boundary crown pillar.
Symmetry 18 00928 g021
Table 1. Theoretical calculation results of boundary crown pillar thickness [43].
Calculation MethodComputational FormulaSafety FactorIsolation Layer Thickness, H/mDesign Implication
Load Transfer Intersection Method H = K B 2 t a n β 1.419.99Intermediate control value
Span-to-Thickness Ratio Method H K B = 0.5 1.414.00Engineering lower bound
Simplified Structural Beam Method H = K B 4 × r B + r 2 B 2 + 8 σ C q σ C 1.429.81Conservative upper bound
Rubeneeite Formula Method H = K × 0.25 r B 2 + ( r 2 B 2 + 800 σ B q ) 1 / 2 98 σ B 1.410.41Theoretical lower-bound reference
Table 2. Calibrated rock mechanical parameters for numerical simulation.
LithologyDensity (kg·m−3)Bulk Modulus (GPa)Shear Modulus (GPa)Internal Friction Angle (°)Cohesion (MPa)Tensile Strength (MPa)
Biotite–Quartz Schist26006.53.8321.81.5
Granite266045.227.4288.27.4
Lithium-Bearing Pegmatite270012.36.8332.52.2
Spodumene Granite280018.510.2383.02.8
Quartzite275035.018.6424.54.0
Granitic pegmatite265010.15.3312.01.8
Backfill Material19007.23.1271.00.8
Table 3. Similarity constants of physical model experiment.
Similarity ConstantsValue
Geometric similarity scale C L = 120
Bulk density similarity scale C γ = 1.5
Stress similarity scale C σ = C γ C L = 180
Internal friction angle similarity scale C α = 1
Poisson’s ratio similarity scale C μ = 1
Table 4. The size parameters of the physical model.
TypeThe Parameters of GeometricOpen-Pit Slope AngleBoundary Crown Pillar ThicknessThe Parameters of Underground Stope
Prototype Length/cmPrototype Height/cmcmRoadway Height/cmGoaf Span/cm
Engineering field24,00025,2004425005001800
Similar scale1201201120120120
Model experiment2001204420.84.1715
Table 5. Quantitative evaluation of deformation symmetry under different boundary crown pillar thicknesses.
Thickness SchemeHorizontal Displacement Extrema/cmMaximum Vertical Displacement/cmReduction in Maximum Vertical Displacement Relative to 15 mPlastic-Zone ConnectivityDeformation Symmetry Evaluation
15 m+3.85/−4.807.26Through-goingStrong asymmetric deformation; insufficient stability
20 m+3.00/−4.006.2014.6%Potentially connectedDeformation reduced but still in a critical state
25 m+3.00/−3.605.3027.0%DisconnectedCoordinated deformation and more symmetric load-bearing state
30 mApproximately ±3.005.2028.4%DisconnectedSlightly improved symmetry, but marginal additional benefit
Disclaimer/Publisher’s Note: The statements, opinions and data contained in all publications are solely those of the individual author(s) and contributor(s) and not of MDPI and/or the editor(s). MDPI and/or the editor(s) disclaim responsibility for any injury to people or property resulting from any ideas, methods, instructions or products referred to in the content.