Article

Dual-Shaking Table Test of Fault-Crossing Tunnel Structure Model and Rationality Analysis of Seismic Action Modes


State Key Laboratory of Bridge Engineering Safety and Resilience, Beijing University of Technology, Beijing 100124, China
*
Author to whom correspondence should be addressed.
Symmetry 2026, 18(6), 890; https://doi.org/10.3390/sym18060890
Submission received: 11 April 2026 / Revised: 20 May 2026 / Accepted: 22 May 2026 / Published: 24 May 2026
(This article belongs to the Section F: Engineering and Materials)

Abstract

Earthquakes may cause severe damage to engineering structures in the seismogenic fault zone. In near-fault regions, ground motions on the two sides of a fault exhibit significant asymmetry in terms of permanent displacement, velocity pulse, and dynamic displacement amplitude. Taking the Xianglu Mountain Tunnel in the southwest of China as the engineering object, this study designed scaled fault-crossing tunnel-surrounding rock test models and conducted a series of quasi-static and dynamic model tests using a dual-shaking table system with non-uniform ground motion input. The effects of three different earthquake action modes on the responses of tunnel engineering structures crossing seismogenic faults were investigated through five static and dynamic earthquake action modes. The test results indicate that considering only the dynamic effect of ground motion or only the static effect of permanent displacement due to fault dislocation will underestimate the seismic response and damage degree of the surrounding rock and tunnel structure. However, the contribution of dynamic effects of ground motion to tunnel failure is much smaller than that of static fault dislocation. The magnitude of permanent displacement from fault dislocation, the peak displacement of non-uniform ground motion time history, and the peak relative displacement are all important factors affecting the deformation of surrounding rock and the strain of tunnel structures. Traditional static analysis methods will lead to an underestimation of the damage risk of tunnel structures. Compared with the non-uniform earthquake action mode, the deformation within the fracture zone under the static action mode is underestimated by approximately 6.39%, and the peak tensile strain under the static action mode underestimates the damage risk by approximately 40%.

1. Introduction

With the development of the social economy and production, tunnel engineering plays an important role in shortening transportation distances and improving traffic efficiency, thus saving time and energy costs [1,2]. During the entire life cycle of tunnel construction and operation, it is inevitable to encounter seismic impacts, even severe damage [3,4]. China is located at the intersection of the Circum-Pacific and Eurasian seismic belts, making it one of the most seismically active regions in the world [5,6,7,8], especially in western China, where large active faults are widely distributed. The construction of major projects such as highways, railways, water conservancy, and oil and gas pipelines may inevitably cross active fault zones. Therefore, improving the accuracy of failure analysis for fault-crossing tunnel engineering under the combined action of static displacement due to fault dislocation and dynamic force due to ground motion is of great practical significance to provide a scientific basis for seismic fortification [9].
Shaking table tests using scaled models are an important method for investigating the seismic dynamic response of rock tunnels crossing faults [10], which can intuitively demonstrate the failure process and characteristics of tunnel structures, serving not only as a supplement to the findings from post-earthquake field disaster investigations but also as a foundation for verifying and further analyzing the validity of theoretical analyses and numerical simulations [11,12,13]. For specific research objects and geological conditions, materials and conditions similar to the real environment are adopted [14], and the results are often more realistic and reliable. Xu et al. [15] used compacted gypsum, quartz sand, barite powder, and other materials in a rigid box to simulate the surrounding rock, and the boundaries were simulated by foam boards. They investigated the seismic response characteristics of tunnel structures under different burial depths, seismic wave types, and seismic intensities. Shen et al. (2020) [16] used compacted fly ash, river sand, waste engine oil, and other materials in a rigid box to simulate the surrounding rock, and the seismic performance of flexible joints of mountain tunnels crossing normal faults was investigated by shaking table tests. Zhao et al. [17] adopted quartz sand, barite, and mud to simulate the surrounding rock, and the failure modes of segmentally lined tunnels crossing strike-slip faults were investigated based on experimental and numerical methods. Chen et al. [18] conducted shaking table tests on the transition tunnel connecting TBM and drill-and-blast tunnels using foamed concrete to simulate the rock mass surrounding the tunnels. Zhao et al. [19] conducted shaking table tests on fault-crossing tunnels using foamed concrete to simulate the surrounding rock and sand and sawdust to simulate the fault fracture zone.
When designing scaled test models of fault-crossing tunnel structures, it is usually difficult to simultaneously satisfy the complete similarity ratio requirements for material density, elastic modulus, and compressive strength. Most existing shaking table tests use sand mixed with other materials, compacted in rigid model boxes to simulate surrounding rock, but these test models have obvious shortcomings. Rigid model boxes artificially limit the deformation range of surrounding rock, resulting in unreasonable simulation of boundary conditions. The actual surrounding rock is mostly sandstone, basalt, limestone, and other rock masses with high strength [20,21,22], while sand-based cementitious materials can hardly represent the hard solid state of rock masses. Their crack propagation patterns and stress–strain curves are significantly different from those of real rock masses, which affects the accuracy of the test results.
In this study, solid foamed concrete is used to simulate the surrounding rock and fault fracture zone. This material offers the following advantages: (1) it can accurately simulate the peak tensile strain and tensile strength and reasonably capture the key features of the stress–strain curve of rock, and (2) it can be tested without a rigid box, allowing unconfined deformation, which fundamentally avoids the problem of artificially presetting the deformation range of the fracture zone.
The key issue in the seismic response simulation of fault-crossing tunnel structures is the input of earthquake actions. At present, real ground motion records available for the seismic analysis of fault-crossing tunnels are scarce. Gao et al. [23] and Wang et al. [24] designed shaking table tests to investigate the damage laws and seismic measures of tunnels under strike-slip fault dislocation, both of which only considered the static effect of fault dislocation during earthquakes. Song et al. [25,26] studied the seismic response of buried tunnel structures under strong ground motion. Zhang et al. [27] investigated the failure process of tunnel structures and surrounding rock with increasing ground motion intensity. Li et al. [28] considered the damage to fault-crossing tunnels by the vibration effect of ground motion alone. These studies consider the effects of transient ground motion and permanent displacement separately, but they ignore the coupling effect in actual earthquakes, which will underestimate the response and damage of fault-crossing tunnels under earthquake action.
Wang et al. [29], Wang et al. [30], Zhang et al. [31], and Xin et al. [32] conducted shaking table tests on fault-crossing tunnels using a test scheme in which one side of the fault was fixed while the other side was subjected to ground motion input of via a shaking table, and the seismic response characteristics of tunnel structures were investigated. Fan et al. [33] derived relative displacement ground motions from ground motions on two sides of the fault, and to study the seismic response laws of pipeline structures, shaking table tests on fault-crossing pipelines were carried out by adopting a test scheme where one side of the fault was fixed and the other side was applied with relative displacement ground motions via a shaking table. Guo et al. [34] performed shaking table tests on fault-crossing bridges using the same ground motion input scheme as Fan et al. and analyzed the seismic response of bridge structures. These simplified processing methods for fault-crossing ground motion input also differ significantly from the simultaneous movement of two sides of the fault during actual earthquakes, which may underestimate the seismic response of fault-crossing engineering structures [21,35] and lead to deviations between the revealed damage characteristics and actual conditions of engineering structures. These studies simplify the ground motions on both sides of the fault as relative motions and then apply them to the active plate of the fault. This simplification method may change the response characteristics of cross-fault structures.
At present, the following problems exist in the research on the earthquake action mode of fault-crossing rock tunnel: lack of near-fault ground motion records, and few records are available for both sides of a fault simultaneously; absence of clear specifications in seismic design codes for earthquake action inputs; and common use of simplified equivalent earthquake action inputs that neglect the dynamic–static coupling effect. Unreasonable earthquake action modes will lead to an underestimation of tunnel damage, which may cause insufficient repair ranges or even collapse of the lining in future earthquakes. The safety design of fault-crossing tunnel engineering urgently requires an accurate understanding of the influence mechanism of the coupled effect between static displacement due to fault dislocation and dynamic ground motion. Therefore, according to the non-uniform ground motion synthesis method proposed by Li et al. [35], non-uniform ground motions that satisfy the target response spectrum and target permanent displacement on the two sides of the fault are obtained. The rationality of the earthquake action mode adopted in shaking table tests directly determines the engineering applicability of the conclusions. By this earthquake action mode, both the static displacement effect and the dynamic ground motion effect, as well as their coupling effects, are taken into consideration.
The novelty of this study lies in achieving the following two core objectives: (1) for the first time, systematically comparing the seismic response differences of tunnel structures under different earthquake action modes through shaking table tests and demonstrating the necessity of the dynamic–static coupling effect, and (2) adopting an unconfined foamed concrete model to overcome the limitations of conventional soil box tests, avoiding artificial constraints on surrounding rock deformation from rigid boundaries while achieving stress–strain characteristics of the similitude material that are much closer to those of real rock. The main research contents of this paper are as follows. To investigate the effects of different earthquake action modes on fault-crossing tunnels, a dual-shaking table system was used to simulate the response characteristics of fault-crossing tunnel structures under three different earthquake action modes by applying different inputs to the two sides of the fault. By comparing the non-uniform earthquake action mode proposed in this study with the traditional static action mode and the uniform earthquake action mode, the accuracy and applicability of different earthquake action modes were systematically evaluated.

2. Design of the Shaking Table Test

2.1. Engineering Background

The Xianglu Mountain Tunnel project in Yunnan, China, is taken as the research object. As one of the most representative deep-buried long tunnels in the Central Yunnan Water Diversion Project, the tunnel crosses numerous seismic faults. The region along the project is characterized by frequent earthquakes and lies in a zone with high seismic fortification parameters. The total length of the tunnel is about 62.59 km, with a maximum buried depth of 1512 m [12,36,37]. The lining of the Xianglu Mountain Tunnel has a circular cross-section, with a total thickness of 0.85 m, an inner diameter of 8.3 m, and an outer diameter of 10 m. According to the engineering geological survey report (Dali Section I of the Water Conveyance Project) provided by Changjiang Survey, Planning, Design and Research Co., Ltd., Wuhan, China, the three fault zones crossed by the tunnel—Longpan–Qiaohou, Lijian–Jianchuan, and Heqing–Eryuan—are all active faults capable of generating moderate-to-strong earthquakes, all of which have experienced earthquakes of magnitude 6 or above. The peak horizontal ground motion acceleration with a 10% exceedance probability in 50 years in the project area is about 300 gal, and the basic seismic fortification intensity is VIII. The lithology and fault structural characteristics in the region are shown in Table 1. These geological and seismic parameters provide key basic data for the subsequent experimental research.

2.2. Shaking Table Test Equipment

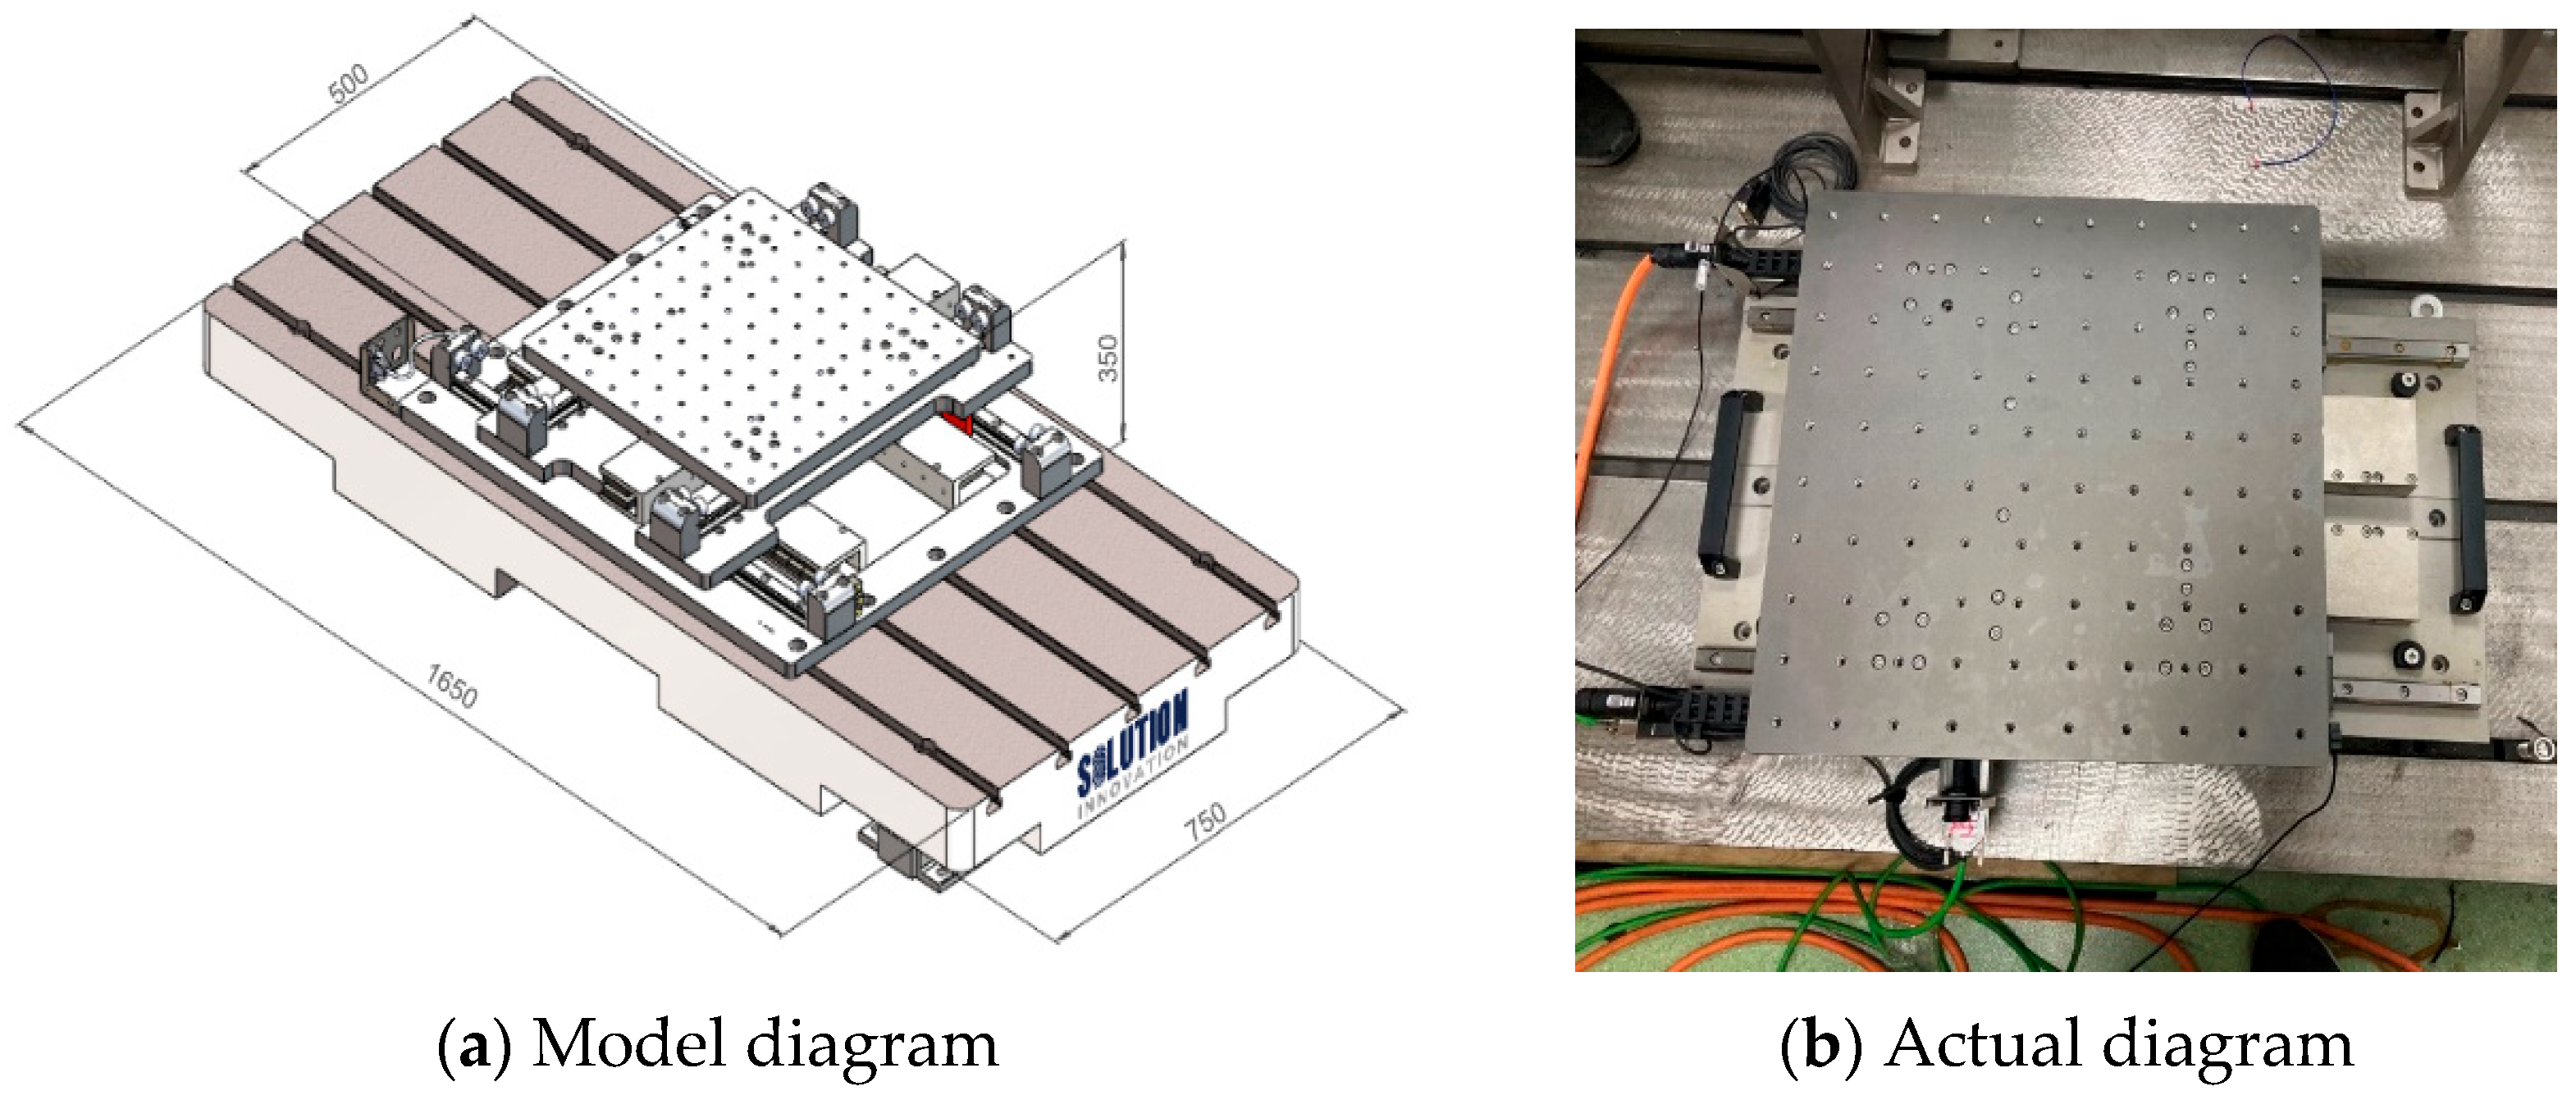
In this test study, the DYS-200-1-05 dual-shaking table system, composed of two electromagnetic shaking tables, was used, which is located in the Key Laboratory of Beijing University of Technology in China. The system was adopted to conduct shaking table tests for simulating the seismic response of fault-crossing rock tunnel structures under the coupled effect of dynamic ground motion and static fault dislocation displacement. The electromagnetic shaking table is shown in Figure 1, and the detailed technical parameters are listed in Table 2.

2.3. Design of the Test Similarity Ratio

Given the load capacity and performance limitations of the shaking table, it is not possible for the entire model to satisfy a complete similarity relationship. This test focuses on relative deformation and dynamic response characteristics of tunnel structures. In fault-crossing tunnel tests, the response of the surrounding rock is dominated by forced deformation rather than inertial forces. Due to the difficulty in achieving complete similarity of all physical quantities in the construction of scaled models for geotechnical–structure interaction tests, a mixed similarity relationship was adopted in the design of the test model, focusing on the unrestricted model boundary conditions and the stress–strain characteristics of similar materials. A complete similarity model considering gravity was used for the tunnel lining, while a model ignoring gravity was adopted for the surrounding rock.
Objectively, ignoring self-weight stress and the initial in situ stress field in the surrounding rock model will weaken the original constraint of the surrounding rock. This may cause earlier cracking of the model surrounding rock and relatively larger crack development and may also introduce some quantitative deviation in the lining strain values compared with the prototype. However, this simplification does not alter the core mechanical response characteristics and is sufficient to meet the objective of this study. This study focuses on the relative comparison of different earthquake action modes under identical similarity conditions. All test cases were conducted under the same similarity scheme. Therefore, the incompleteness of the similarity condition does not introduce systematic bias into the comparative conclusions among different earthquake action modes.
The coordination between different materials and the continuity of displacement response were ensured by unifying the similarity ratios of key physical quantities, including a length similarity ratio of 3/200, a strain similarity ratio of 1:1, and a displacement similarity ratio of 3/200. The detailed similarity relationships are listed in Table 3. Among them, the length similarity ratio controls the size of the scaled model to meet the parameter requirements of the shaking table, the strain similarity ratio ensures that the similar materials exhibit similar fracture characteristics to the surrounding rock and fault fracture zone, the displacement similarity ratio is chosen because the effect of forced displacement governed by the relative stiffness in the tunnel–surrounding rock interaction is far greater than the effect of inertial force governed by density under earthquake action, and the test process of this shaking table is controlled by displacement time-history input.
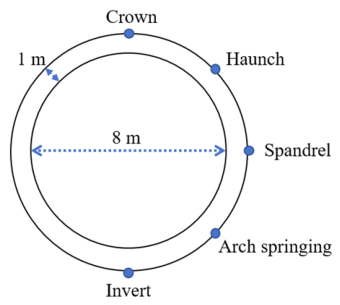
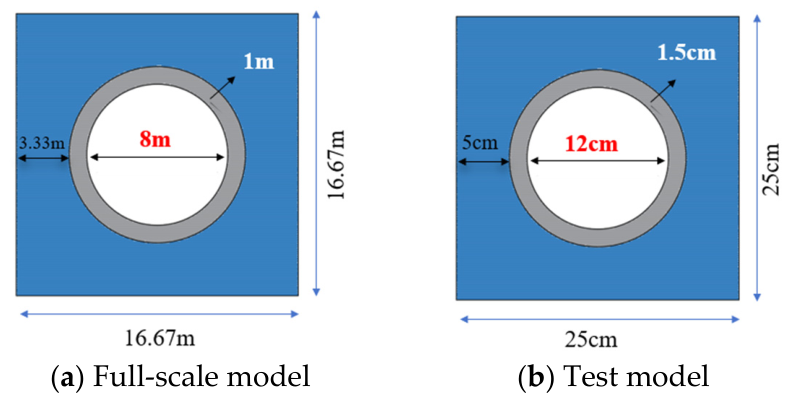
To ensure the manufacturing accuracy of the scaled test model, the prototype dimensions of the tunnel lining structure are set as a thickness of 1 m, an inner diameter of 8 m, and an outer diameter of 10 m, as shown in Figure 2. The dimensions of the surrounding rock in the test model should satisfy both the bearing capacity and boundary effect requirements of the shaking table. On the one hand, the thickness of the surrounding rock should be minimized to meet the maximum bearing capacity of 50 kg for the shaking table. On the other hand, the flexural stiffness and shear stiffness of the surrounding rock should be greater than those of the lining structure to eliminate boundary effects. After multiple rounds of computational analysis and optimization, the final prototype dimensions are determined as follows, width and height of surrounding rock, 16.67 m, length, 73.33 m, fault fracture zone width, 10 m, tunnel lining thickness, 1 m, inner diameter, 8 m, and outer diameter, 10 m, as shown in Figure 3a. The corresponding scaled test model dimensions are as follows, width and height of surrounding rock, 0.25 m, length, 1.1 m, fault fracture zone width, 0.15 m, tunnel lining thickness, 1.5 cm, inner diameter, 12 cm, and outer diameter, 15 cm, as shown in Figure 3b.
In this study, the constant stress similarity criterion was adopted for the lining model, which satisfies Equation (1). The tunnel lining was designed using the dimensional analysis method [38,39,40] considering gravitational acceleration, i.e., the effect of inertial forces, satisfying the similarity relationship given by the Buckingham π theorem [41]. Based on the shaking table performance requirements, the length similarity ratio of the model was determined as 3/200. The similitude materials described in Section 2.4 were selected; the elastic modulus similarity ratio was determined as 1/60, and the density similarity ratio was determined as 2/3 accordingly. Finally, the acceleration similarity ratio was derived according to Equation (1).
S E S ρ S a S l = 1
S T = S l S v
S f = 1 S T
where E is the elastic modulus, ρ is the density, l is the length, a is the acceleration, and S is the similarity ratio.
The similarity ratio design of the surrounding rock is divided into two parts, including the surrounding rock on two sides of the fault and the fault fracture zone, both of which are designed using a gravity-ignored model, i.e., the effect of self-weight stress is not considered. Gravitational acceleration is not considered in the design, allowing S g 1 , S E , S ρ , and S l to be set independently. The other similarity ratios, including time, frequency, velocity, and displacement, are derived from the fundamental dimensional relationships among length, acceleration, displacement, and time based on Equations (2) and (3). Other similarity ratio parameters are listed in Table 3.

2.4. Similarity Materials

The selection of similarity materials must satisfy two requirements: (1) the stress–strain characteristics should accurately simulate the complete response of the prototype materials from the elastic to the plastic stage as precisely as possible and (2) the similarity materials should be in a solid state to avoid the use of a model soil box; that is, without artificially restricting the deformation range, allowing small deformations of the surrounding rock on both sides of the fault.
The prototype tunnel lining is made of C30 concrete, and the mixture ratio of its similar material is river sand:high-strength gypsum:low-strength gypsum:barite powder:water = 12:5:5:19:16. Steel wire mesh with a diameter of 0.6 mm and a grid size of 1.8 cm × 1.8 cm is also used.
The prototype surrounding rock is Class III surrounding rock. According to the strength of commonly used foamed concrete in the industry, foamed concrete with a dry density grade of 1400 kg/m3 was selected. The mix proportion for the similar material of the surrounding rock is fly ash:cement: water:foam = 18:69:30:4 and foaming agent:water = 40:1, and the density of the foam is 40–60 g/L. The prototype of the fracture zone is Class IV–V surrounding rock, and foamed concrete with a dry density grade of 500 kg/m3 was adopted. The mix proportion for the similar material of the fracture zone is fly ash:cement:water:foam = 16:64:35:3.
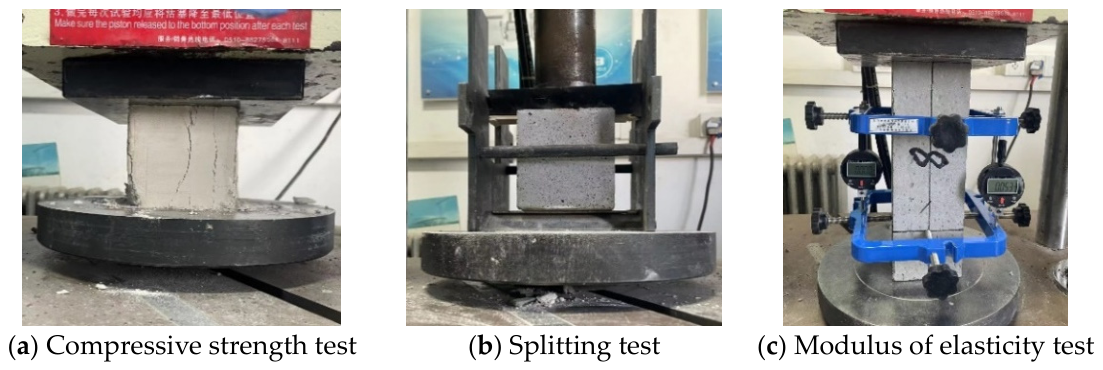
Material property tests were conducted on similar materials in accordance with the Chinese standard “Test Method Standard for Physical and Mechanical Properties of Concrete” (GB/T 50081) [42]. Six cubic specimens were cast for each material. After 28 days of curing under standard conditions (20 ± 2 °C, 95% relative humidity) as specified in the code, the specimens were tested. Compressive strength was measured using cubic specimens of 100 mm × 100 mm × 100 mm, as shown in Figure 4a. Tensile strength was determined by the splitting tensile test on cubic specimens of the same dimensions, as shown in Figure 4b. The elastic modulus was tested using prismatic specimens of 100 mm × 100 mm × 300 mm, as shown in Figure 4c, with the testing procedure ensuring that the difference between the deformation values on the two sides of the specimen remained below 20% of the deformation value. These values were then compared with the prototype materials to verify the scaling ratios. All dynamic similarity ratios satisfy the design requirements. The material properties of the prototype and test model are listed in Table 4.
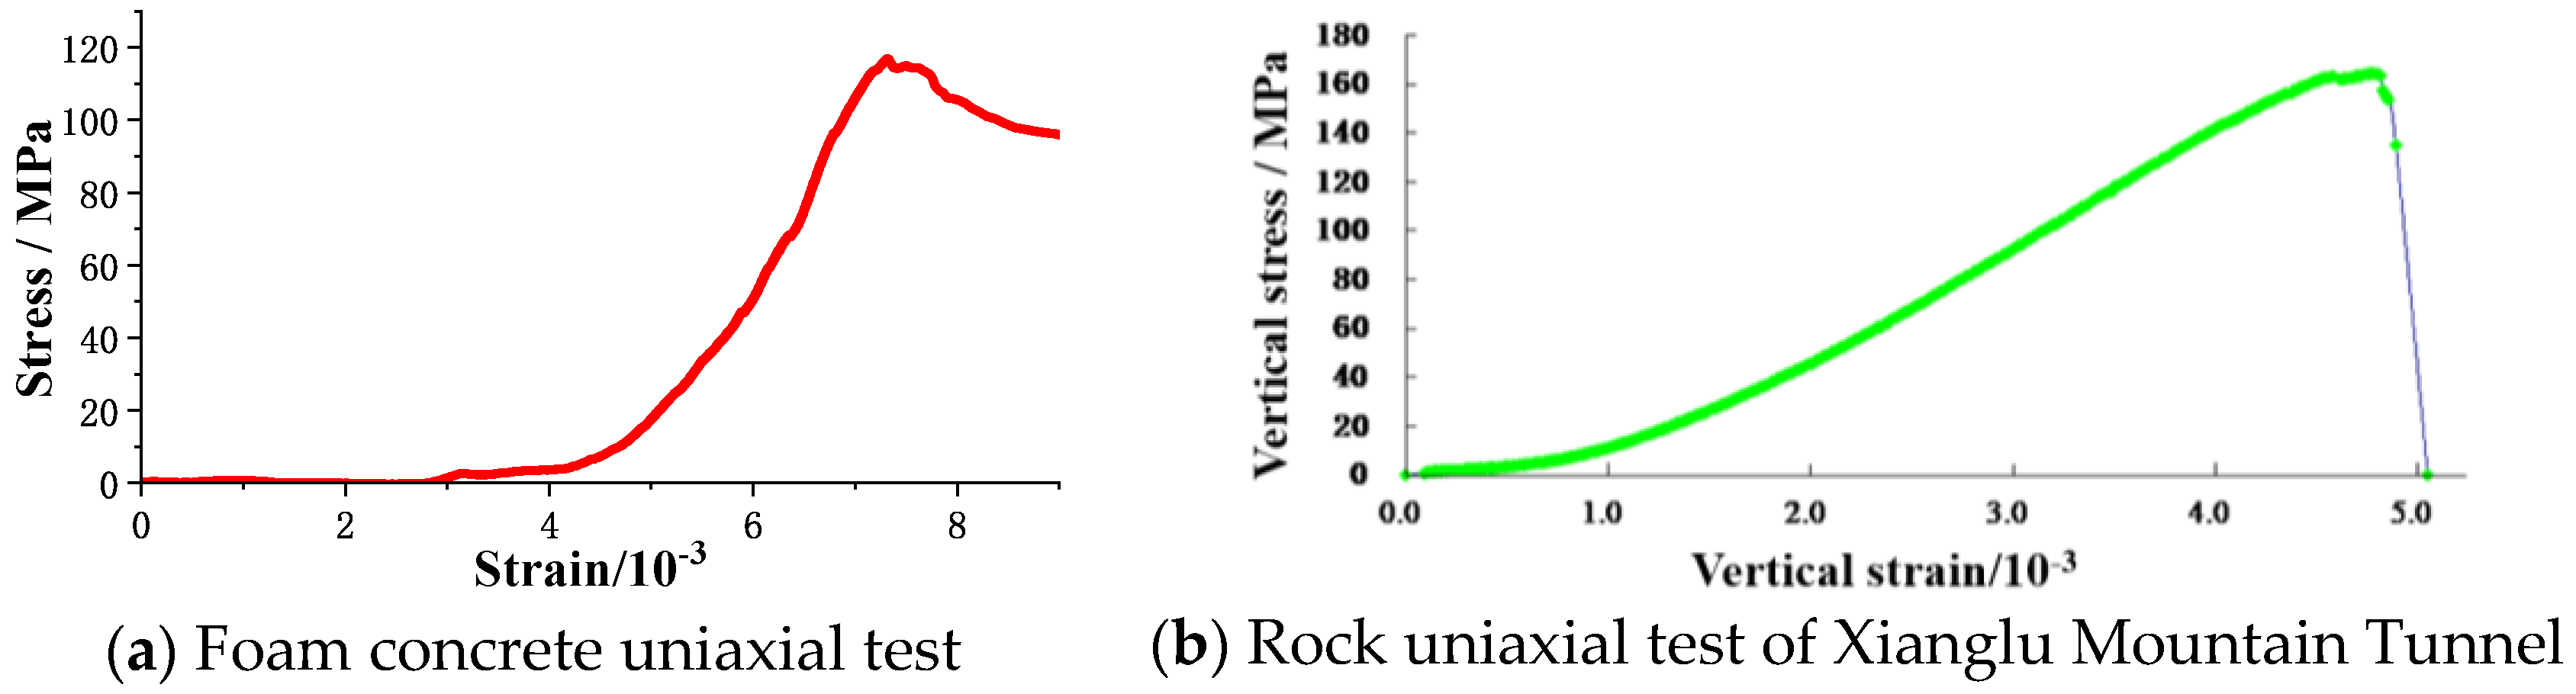
The stress–strain characteristics of the foam concrete and rock are shown in Figure 5. They are a brittle material similar to rock and close in texture, which can accurately simulate the peak tensile strain and tensile strength and reasonably capture the key features of the stress–strain curve of rock, as illustrated in Figure 5. The stress–strain curves of foamed concrete and rock are in good agreement. The strain of foamed concrete in Figure 5a and the rock near the Xianglu Mountain Tunnel in Figure 5b are both approximately 5–6 × 10⁻³.
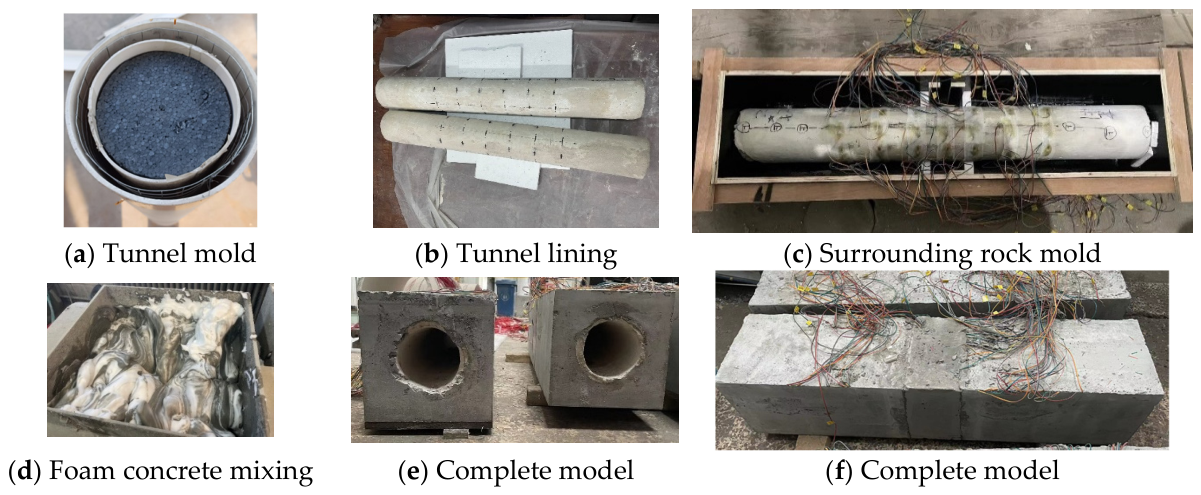
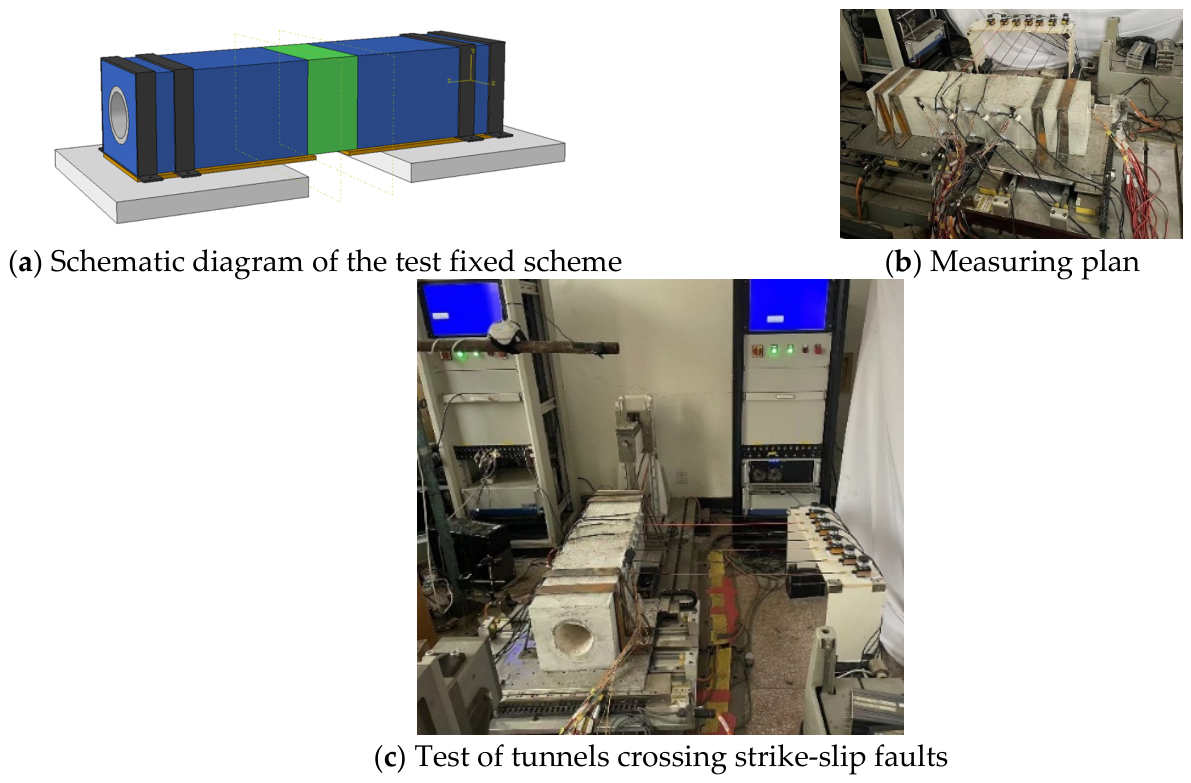
The fabrication process of the test model is shown in Figure 6. Figure 7 presents the on-site photograph of the fault-crossing tunnel test conducted using the dual-shaking table system. The symmetrical shaking table test tunnel model is shown in Figure 7a. The two white blocks are the electromagnetic shaking tables, the blue part is the intact surrounding rock, the green part is the fracture zone, and the gray part is the tunnel. The model was fixed to the shaking tables using four sets of steel frames (black) and bolts. Two wooden boards were placed at the bottom of the specimen, and lubricating oil was applied to both the upper and lower interfaces to achieve low-friction sliding between the test model and the shaking tables, thereby reducing reflections at the boundaries and ensuring that the movement mode of the surrounding rock conforms to the actual fault dislocation behavior. The fracture zone was designed to be suspended without direct contact support at the bottom so as to eliminate the interference of boundary constraints on its deformation. This design can simulate the large deformation of the fracture zone and the small deformation characteristics of the surrounding rock on two sides of the fracture zone in actual engineering.

2.5. Observation Data Acquisition Scheme

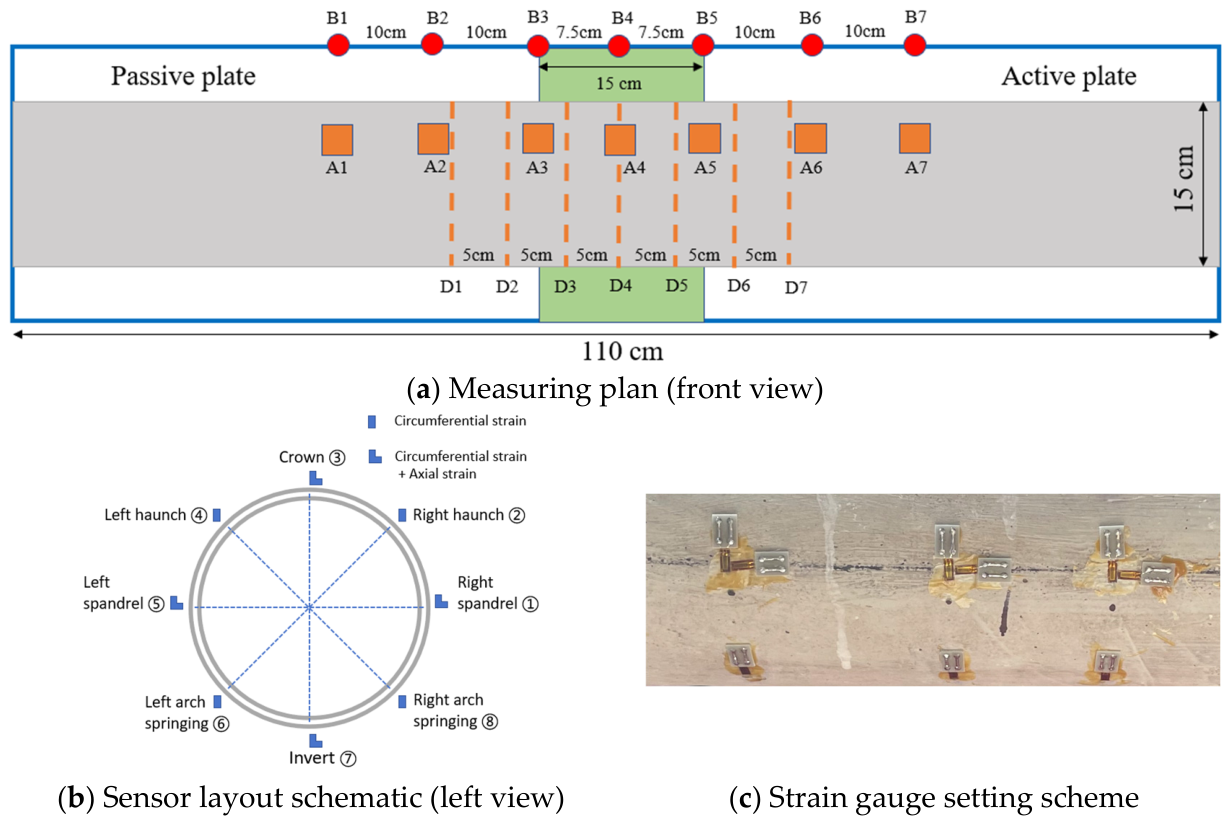
The main observation data in the test include failure phenomena, strain, and displacement data. The detailed sensor layout scheme is shown in Figure 8a, where the active plate of the fault refers to the fault side with permanent displacement, and the passive plate of the fault refers to the fault side without permanent displacement. The lining strain (D1–D7) was measured using BE120-5AA metal strain gauges. A total of seven monitoring cross-sections were installed along the tunnel axis, with a spacing of 5 cm between adjacent sections. At each cross-section, eight strain gauges were arranged circumferentially, as shown, with the layout scheme illustrated in Figure 8b. The strain gauges were pre-embedded on the outer surface of the tunnel model during specimen fabrication, with waterproofing treatment applied to protect the gauges from moisture, as shown in Figure 8c. Displacement and deformation data were comprehensively obtained by laser displacement sensors, WFD20 cable extension displacement transducers, and a non-contact dynamic displacement measuring system, as shown in Figure 7. Among them, the laser displacement sensors recorded the seismic displacement time histories of the two shaking tables; the cable extension displacement transducer (A1–A7) measured the lateral displacement of the surrounding rock; and the visual recognition target (B1–B7) was used to measure the surface displacement.

2.6. Ground Motion Displacement Time Histories and Seismic Loading Implementation Scheme

(1)
Ground motion displacement time histories
Since the dominant load form causing tunnel failure under earthquake action is not seismic inertial force, but the forced displacement motion of the surrounding rock mass on the tunnel structure, this study adopts ground motion displacement time history input to control seismic loading, which can more realistically simulate the seismic response of fault-crossing tunnel structures.
Non-uniform ground motions are obtained through the artificial ground motion synthesis method of Li et al. [35], which generates acceleration time histories matching a target response spectrum while incorporating a target permanent displacement. The method accounts for site-specific spectral characteristics and fault rupture parameters.
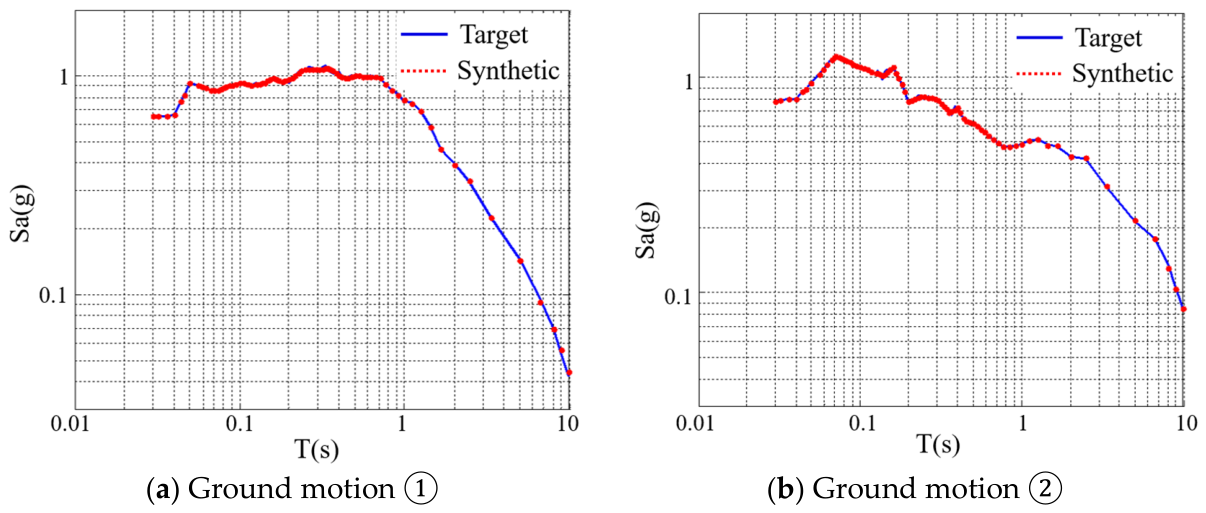
In the synthesis process, the acceleration time history of the seed motion was adjusted in the time domain to match the target peak acceleration, permanent displacement, and response spectrum. The 5%-damped target response spectrum was used, and a monopulse function was applied for time domain adjustment. Through successive iterations and optimization of control point sequences, the fitting accuracy to the target response spectrum was progressively improved.
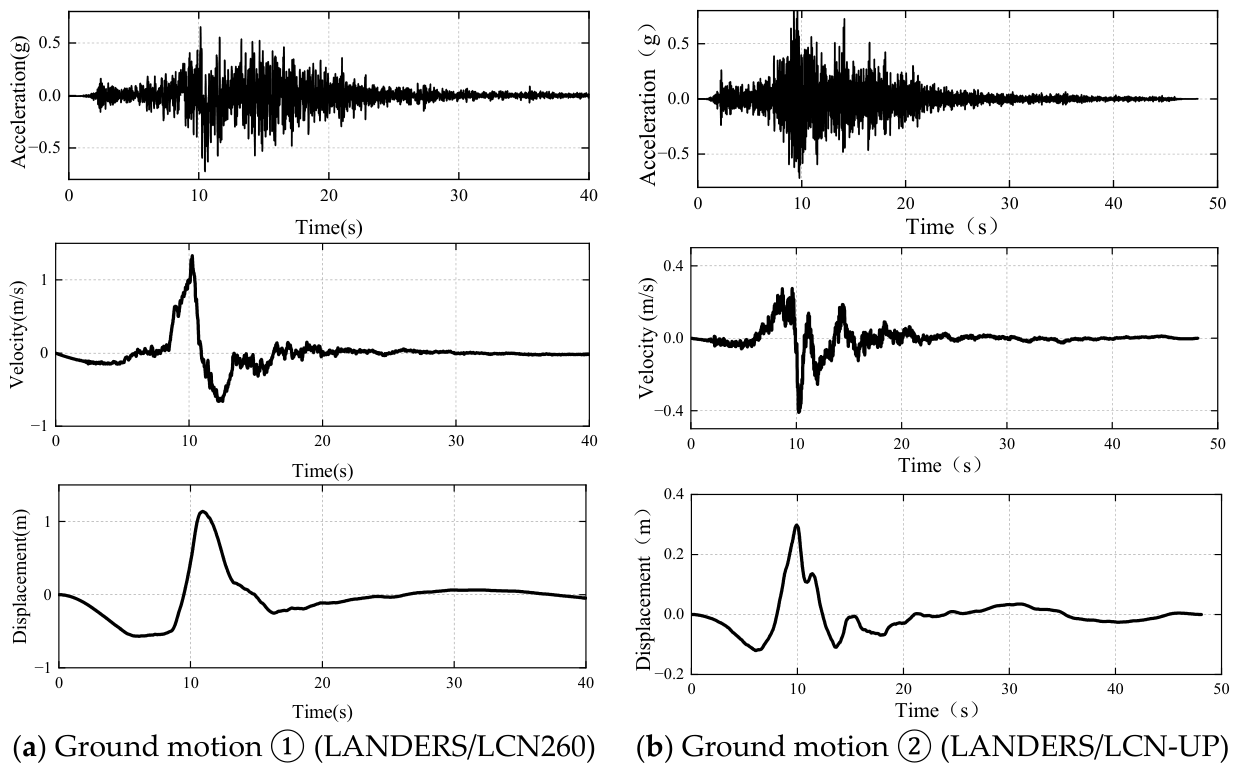
The initial ground motion used for synthesizing the non-uniform inputs was selected from a near-fault record of the 1992 M 7.3 Landers earthquake (No. 879 in the Next Generation Attenuation database). Figure 9 presents the acceleration, velocity, and displacement time histories. The information on the original and adjusted ground motions is listed in Table 5. The Xianglu Mountain Tunnel is located in Yunnan Province, China, where the seismic fortification intensity is VIII. According to the seismic safety assessment report for a major engineering site, the bedrock ground motion parameters for a 2% probability of exceedance in 50 years were derived. The target peak ground acceleration is 0.59 g, the target permanent displacement is 0.80 m, and the corresponding target acceleration response spectrum was defined accordingly.
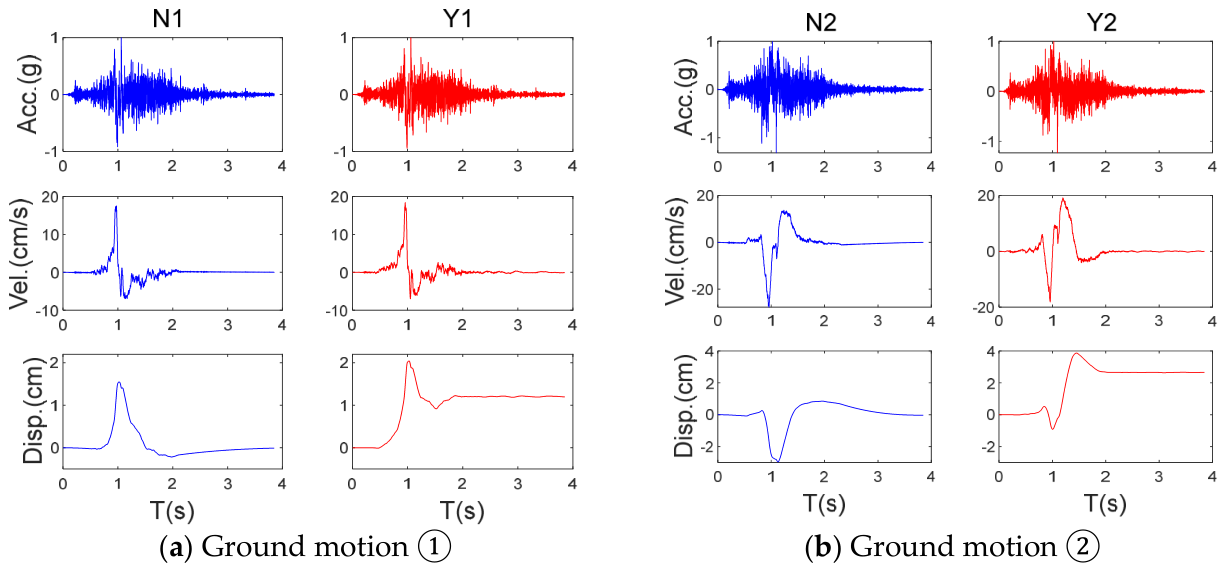
A pair of non-uniform ground motions was synthesized based on the target parameters, with their displacement time histories shown in Figure 10. The response spectra of the synthetic motions agree well with the target spectrum, as shown in Figure 11.
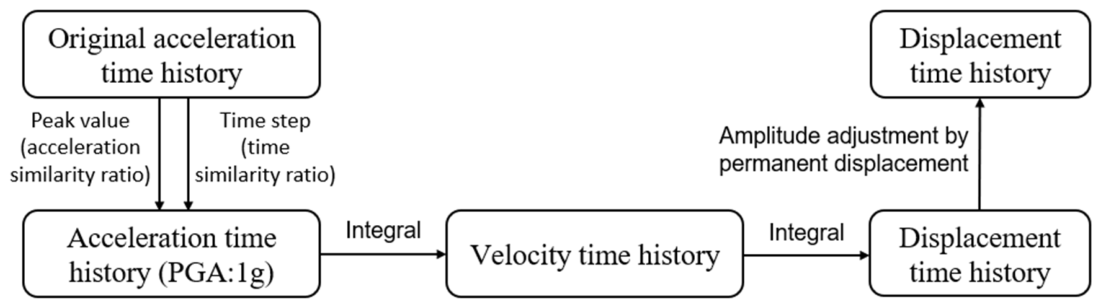
The ground motion acceleration time histories and corresponding displacement time histories required for the test were obtained through the method shown in Figure 12. The acceleration time histories were adjusted according to the time similarity ratio, acceleration similarity ratio, and displacement similarity ratio. (1) The peak accelerations were adjusted from 0.73 g and 0.82 g to 1 g, respectively; the time step was adjusted from 0.005 s to 0.00047 s; and the total duration was shortened from 40.95 s to 3.85 s. (2) The corresponding displacement time histories were obtained by double integration of the acceleration time histories. (3) The two sets of ground motion displacement time histories used in the test were amplitude-modulated according to the permanent displacement. The detailed time histories are shown in Figure 11.
(2)
Testing cases of earthquake action
To investigate the effects of different earthquake action modes, five seismic ground motion input cases were designed in the test based on existing research considerations and the provisions for earthquake actions in engineering design codes, as detailed in Table 6. Based on the information of three faults crossed by the tunnel project, a reference case (Case 3) was designed: strike-slip fault, angle of 90° between the fracture zone and the tunnel, dip angle of 90° for the fracture zone, prototype width of the fracture zone 10 m, and scaled model width of the fracture zone 0.15 m. This case adopts a non-uniform earthquake action mode, in which different displacement time histories reflecting the relative permanent displacement of fault dislocation are input on two sides of the fault so as to simulate the coupled effect of dynamic action and static dislocation. Case 5 also adopts the non-uniform earthquake action, which is the same as Case 3.
Case 1 adopts a static action mode; it represents a pure static fault dislocation mode, in which only the static effect of relative displacement between the two sides of the fault is considered, while the dynamic inertial effect caused by ground motion is ignored. The static loading is controlled by displacement, with a loading rate of 5 mm/min and six loading steps. A displacement of 5 mm is applied at each step until the target fault dislocation between the two sides is reached. Such a low displacement loading rate can eliminate the influence of inertial force and meet the requirements of quasi-static earthquake action. Cases 2 and 4 adopt a uniform earthquake action mode; they represent a pure dynamic ground motion mode, in which only the dynamic inertial effect induced by ground motion is considered, while the static effect of relative fault dislocation is neglected.
Among the above three earthquake action modes, only the non-uniform earthquake action mode represents the real earthquake action in practice, while the other two are simplified earthquake action input methods adopted in the analysis of practical engineering problems. Through comparative analysis of the test results of Cases 1, 2, and 3 and Cases 1, 4, and 5, the influences of different earthquake action modes on the response characteristics of fault-crossing tunnel structures are investigated, and the respective contributions of earthquake dynamic action and relative displacement static action to the structural response of fault-crossing tunnels under the combined effect are discussed. Two sets of tests with different non-uniform ground motion inputs can further demonstrate the influence of ground motions with different characteristics on the structural response of fault-crossing tunnels.
For each working condition listed in Table 6, a separate and newly constructed test model was used. The tests were carried out sequentially according to the order given in Table 6.

3. Test Results and Analysis

3.1. Seismic Response and Damage of Surrounding Rock and Tunnel Structure

(1)
Surrounding rock
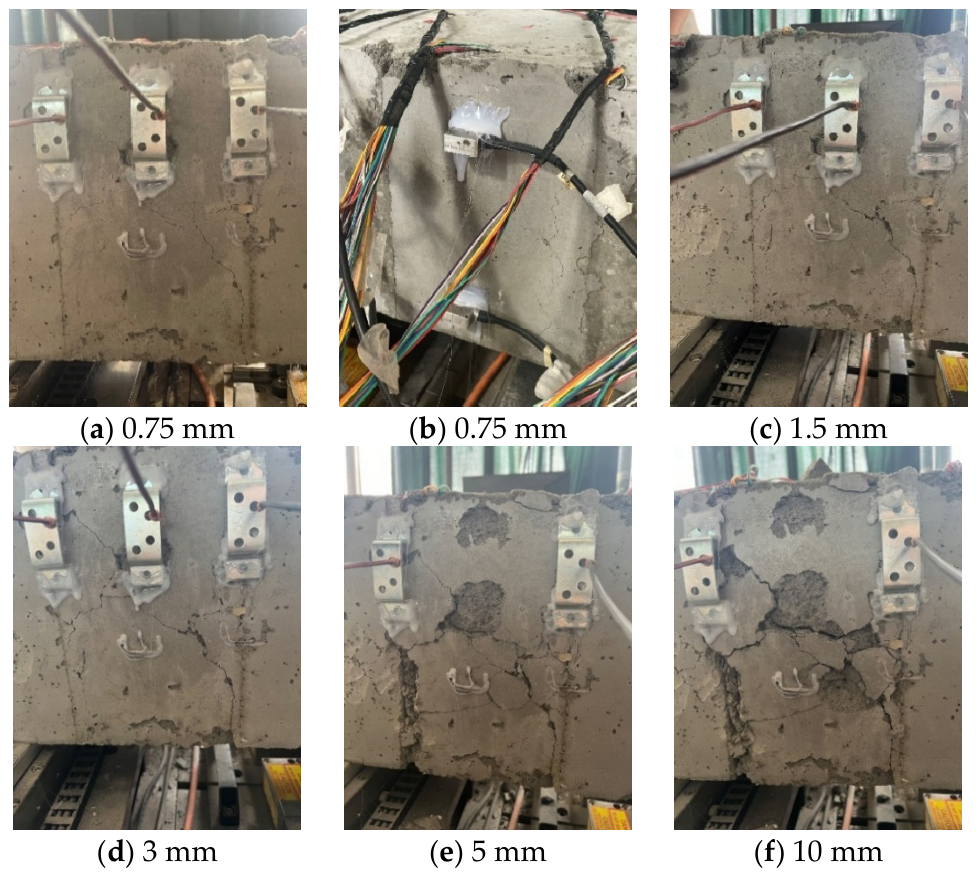
The crack propagation characteristics of Cases 1, 3, and 5 are basically consistent with no obvious differences. Taking Case 3 as an example, the evolution process of surrounding rock damage with the increase in fault dislocation displacement is shown in detail in Figure 13. The difference between the static action mode and the non-uniform earthquake action mode will be compared and analyzed by quantitative indicators in the following sections. Under earthquake action, cracks tend to occur at the interface between the fracture zone and the surrounding rock on both sides of the fault. Vertical cracks appear in the surrounding rock at this location. Cracks at the left spandrel (shown in Figure 8b) are close to the active plate of the fault, as illustrated in Figure 13a, while cracks at the right spandrel (shown in Figure 8b) are close to the passive plate of the fault, as shown in Figure 13b, showing an antisymmetric distribution. With the increase in fault dislocation displacement, the cracks continue to widen and extend obliquely and finally penetrate through the fracture zone. Under strike-slip faulting, initial cracks in the surrounding rock do not first appear inside the fault fracture zone or in the remote intact rock but preferentially develop at the interface between the fracture zone and the intact rock, on both the active and passive sides. The reason is the abrupt changes in stiffness, strength, and deformation capacity across the interface, which cause stress concentration and make the interface a natural mechanical weak plane.
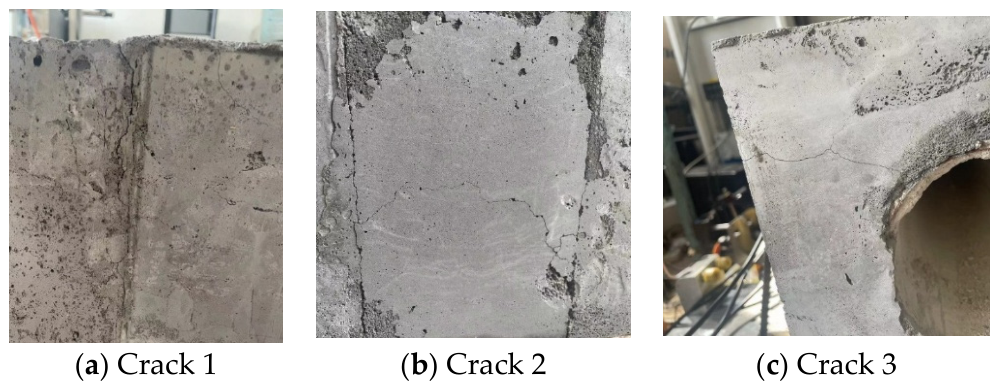
In contrast, the cracks developed in Case 2 and Case 4 are significantly smaller in scale (shown in Figure 14) and appear at random locations. The comparative analysis indicates that the influence of static fault dislocation displacement on the tunnel structure is significantly greater than that of non-uniform earthquake action, such as Case 3 and Case 5. The cracks in these two cases were smaller and more randomly distributed than those in the static action mode and the non-uniform earthquake action mode. This indicates that uniform dynamic shaking alone is not the dominant contributor to fault-crossing tunnel damage. Ignoring the static effect of fault dislocation would severely underestimate the structural response of the tunnel.
(2)
Tunnel structure
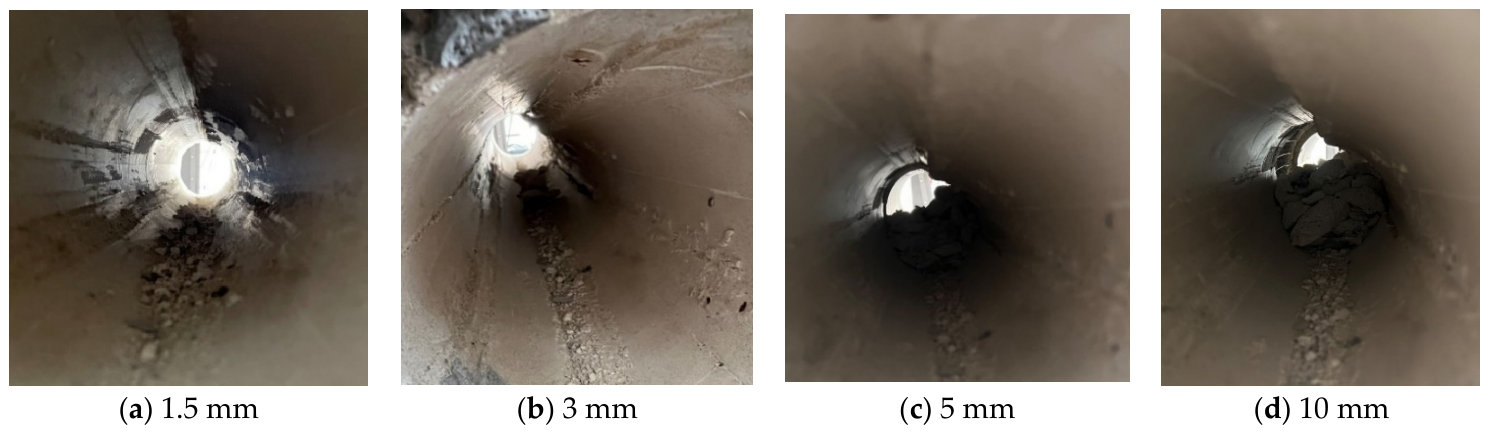
Figure 15 shows the progressive failure process of the tunnel lining with the increase in fault dislocation displacement under the non-uniform earthquake action mode. When the fault dislocation displacement reaches 1.5 mm (corresponding to a prototype fault dislocation of 10 cm), local spalling occurs in the lining (shown in Figure 15a). Tunnels suffering such damage need to be suspended from operation and repaired after the earthquake. When the fault dislocation displacement reaches 10 mm (corresponding to a prototype fault dislocation of 66.67 cm), the tunnel is blocked by fallen lining fragments, and the internal steel wire mesh is clearly exposed (shown in Figure 15c), indicating that the tunnel structure has been severely damaged.

3.2. Displacement Response of Surrounding Rock

The displacement data obtained by the cable extension displacement transducer and the visual recognition system are in good agreement. The average value of the two is adopted in the subsequent analysis as the test displacement so as to investigate the displacement response characteristics and laws of the surrounding rock under different fault dislocation displacements.
To verify the test results, a corresponding numerical model was established based on the geometric dimensions of the test specimens and the constitutive relations of the materials obtained in the preliminary tests, using the same earthquake action modes as in the tests. The ABAQUS finite element model of the fault-crossing tunnel is established, employing the C3D8R solid element. The contact between surrounding rock and lining is modeled as “surface-to-surface contact”. Normal behavior is “Hard contact” to simulate contact pressure. Tangential behavior is “Coulomb friction model with penalty formulation” to transfer shear stress with the friction coefficient μ of 0.4. The Mohr–Coulomb ideal elastic–plastic constitutive model is adopted for the surrounding rock and the fracture zone. The CDP concrete plastic damage constitutive model is adopted for tunnel lining. A global mesh size of 0.8 cm is adopted. Finer mesh is implemented in critical regions, including the fracture zone, tunnel lining, and adjacent tunnel surrounding rocks, where the mesh size is refined to 0.3 cm. A roller boundary is applied at the bottom of the model, and the corresponding displacement time histories are imposed in the permanent displacement direction. All other surfaces of the model are set as free boundaries.
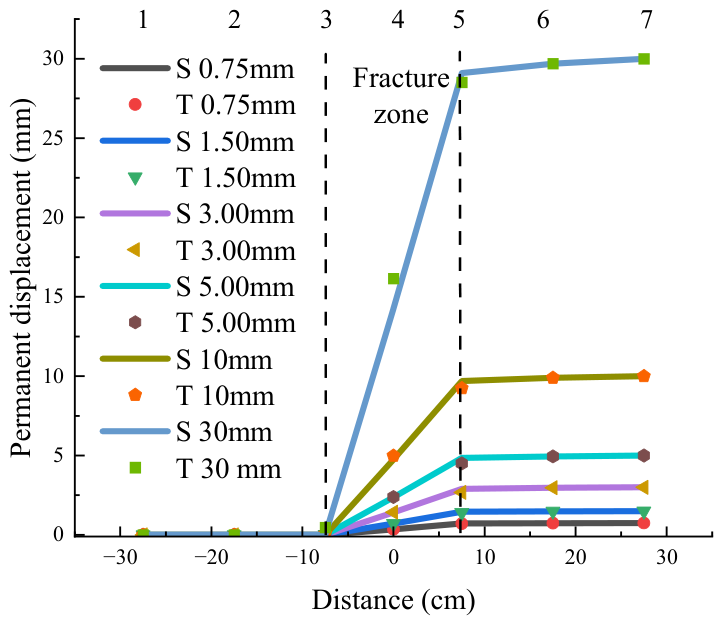
Taking Case 1 as an example, the comparison is shown in Figure 16, where S denotes the numerical simulation and T denotes the test. Under the same permanent fault dislocation displacement, the deformation values from the numerical simulation are slightly larger than those from the test values. This difference may be attributed to the heterogeneity during the preparation and curing of foamed concrete, resulting in the actual strength of the surrounding rock and fracture zone on two sides of the fault being lower than the design value. In addition, the relatively high data measured at point A4 may be related to the locally high foam content and uneven distribution of low-strength zones in the foamed concrete. Nevertheless, the error between the numerical simulation and the test data is within 5%, which preliminarily verifies the reliability of the test data and the numerical model.
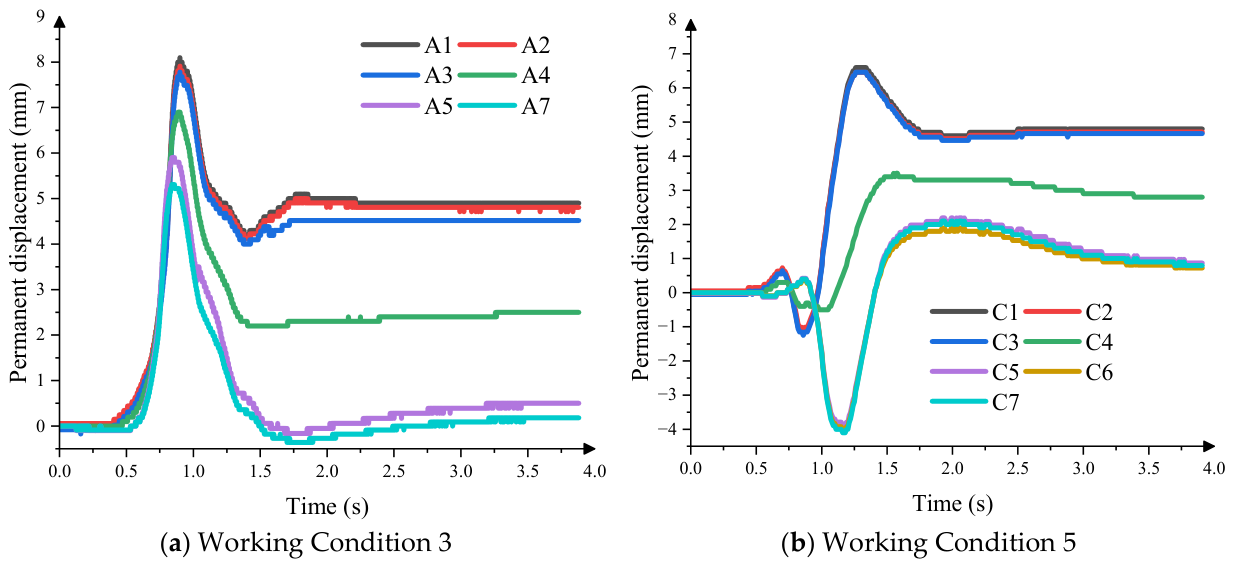
Figure 17 shows the displacement response curves at different measuring points when the permanent displacement difference between the two sides of the fault is 5 mm in Cases 3 and 5. Both sets of displacement time histories are similar in shape to the input displacement time histories of the shaking tables. The displacement time histories recorded at Measuring Points 1, 2, and 3 are closer to the ground motion displacement time histories with permanent displacement, while those at Measuring Points 5, 6, and 7 are more similar to the ground motion displacement time histories without permanent displacement. The data of Measuring Point 1 is very close to that of Measuring Point 2, and the data of Measuring Point 6 is very close to that of Measuring Point 7.
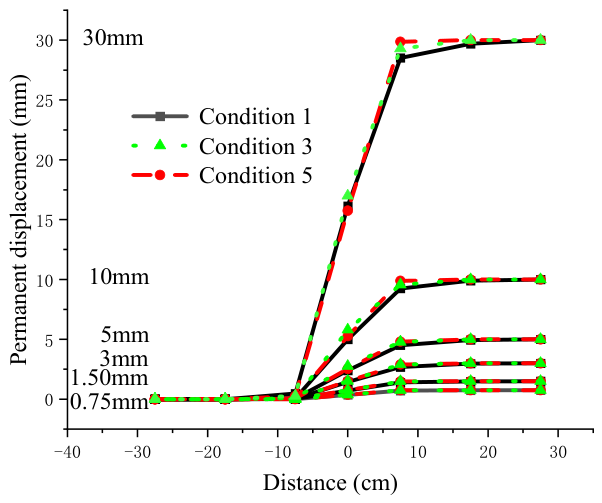
Figure 18 shows the variation of surrounding rock displacement with fault dislocation displacement under different earthquake action modes. It can be seen from the figure that the surrounding rock displacement response under the non-uniform earthquake action mode (Cases 3 and 5) is consistent with that under the static loading mode (Case 1). When the permanent displacement of fault dislocation is considered, the deformation of surrounding rock is mainly concentrated within the fracture zone, and slight deformation also occurs in the surrounding rock on both sides of the fault beyond the fracture zone. With the increase in permanent fault dislocation displacement, the deformation of the surrounding rock becomes more serious. The deformation pattern of the surrounding rock presents an S-shape.
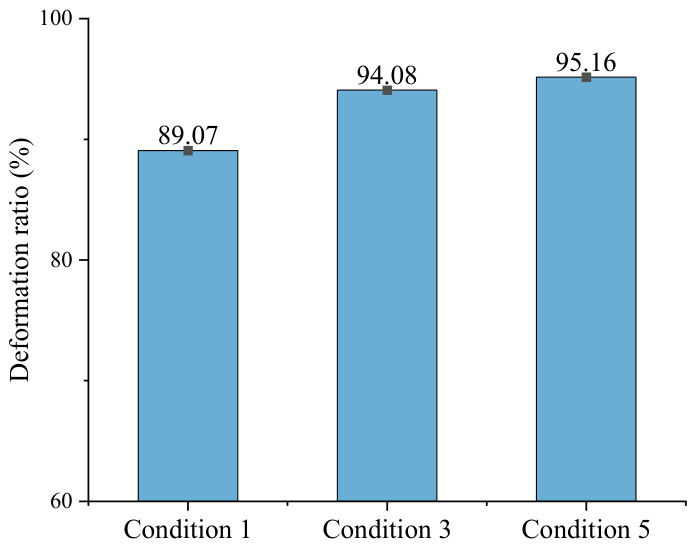
For a more intuitive comparison of the effects of different earthquake action modes, Figure 19 presents the ratio of the displacement difference between Measuring Points 3 and 5 (arranged at the interface between the fracture zone and the surrounding rock on two sides of the fault) to the permanent displacement when the fault dislocation displacement is 30 mm. In Case 3, the displacement difference between Measuring Point 3 and Measuring Point 5 is 28.224 mm; in Case 5, it is 28.548 mm, and in Case 1, it is only 26.721 mm. The proportion of surrounding rock deformation within the fracture zone (i.e., the ratio of the displacement difference across the fracture zone to the total permanent displacement) is 94.08% in Case 3, 95.16% in Case 5, and 89.07% in Case 1. The ratios for Cases 3 and 5 under the non-uniform earthquake action mode are very close and significantly higher than those under the static action mode of Case 1. Compared with the non-uniform earthquake action modes (Cases 3 and 5), the static action mode (Case 1) underestimates the deformation within the fracture zone by approximately 6.39%. Combined with Figure 18, it can be seen that the larger the permanent displacement, the more significant the deformation difference under different earthquake action modes, indicating that the surrounding rock deformation is relatively gentle under the static action mode. These results demonstrate that using the static method to analyze the structural response of fault-crossing tunnels will underestimate the actual response and damage risk of the tunnel structure.

3.3. Strain Response of Tunnel Structure

It should be noted that displacement measurements remained reliable for fault dislocations from 0 to 30 mm, whereas a large number of strain gauge failures occurred when the dislocation exceeded 10 mm. Consequently, displacement results are presented for the range of 0 to 30 mm, while strain analysis is limited to the range of 0 to 10 mm.
(1)
Strain response of tunnel structure at different locations
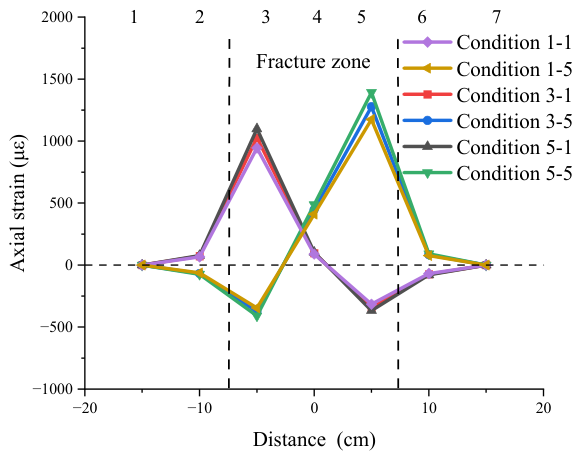
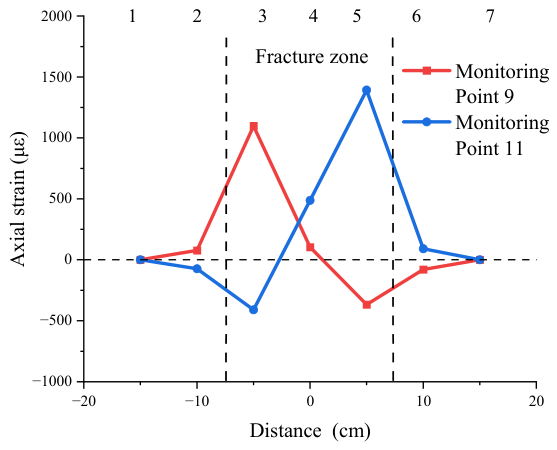
The strain response laws at different positions of the tunnel structure under different earthquake action modes are generally similar, as shown in Figure 20. Taking Case 3 with a permanent displacement of 5 mm as a representative for detailed analysis, the axial strain of the tunnel structure is presented in Figure 21. Combined with the numerical simulation results in Figure 22, in which red areas represent the positions with the maximum strain, it can be concluded that the maximum axial strain of the tunnel occurs within the fracture zone, near the interface between the fracture zone and the surrounding rock on both sides of the fault, indicating that this region is the critical location for stress concentration and damage. The axial tensile strain of the tunnel is much larger than the axial compressive strain. The maximum strain appears at the right spandrel near the passive plate of the fault (Measuring Point 1), where the tensile strain reaches 1099 με; the maximum strain at the left spandrel near the active plate of the fault (Measuring Point 5) reaches 1392 με. Within the same cross-section, the strain values at the left and right spandrels of the tunnel have opposite signs, showing an antisymmetric distribution characteristic, and the strain at the left spandrel is consistently higher. This indicates that the left spandrel of the tunnel at the interface between the fracture zone and the active plate is more prone to damage due to the relatively low tensile strength of concrete, where tensile damage is likely to occur.
The axial strain under the static loading mode (Case 1) is significantly lower than that under the non-uniform seismic loading modes (Cases 3 and 5), as shown in Figure 20. The results indicate that using the static method to analyze the strain of fault-crossing tunnels will underestimate the actual structural response and damage risk of the tunnel, and the underestimation is more obvious for the strain at the key strain concentration locations of the tunnel structure.
The observed phenomena, including the location of surrounding rock cracks, the S-shaped deformation of the tunnel, and the antisymmetric distribution of lining strain, share a common mechanical origin. Under strike-slip fault dislocation, the fault-crossing tunnel model is subjected to combined bending and shearing rather than pure shear. Both rock and concrete have much lower tensile strength than compressive strength. Consequently, tensile stress concentration at the interface between the fracture zone and the intact rock preferentially initiates crack propagation at that interface. The low-stiffness fault fracture zone accommodates most of the relative shear displacement, while the stiffer intact rock on both sides imposes a rigid constraint on the tunnel, forcing it into an S-shaped longitudinal bending deformation. This bending deformation further creates opposite stress states at the left and right spandrels, tension on one side and compression on the other, ultimately resulting in a pronounced antisymmetric distribution of axial strain in the lining.
(2)
Strain response of tunnel structure under different fault dislocation displacements
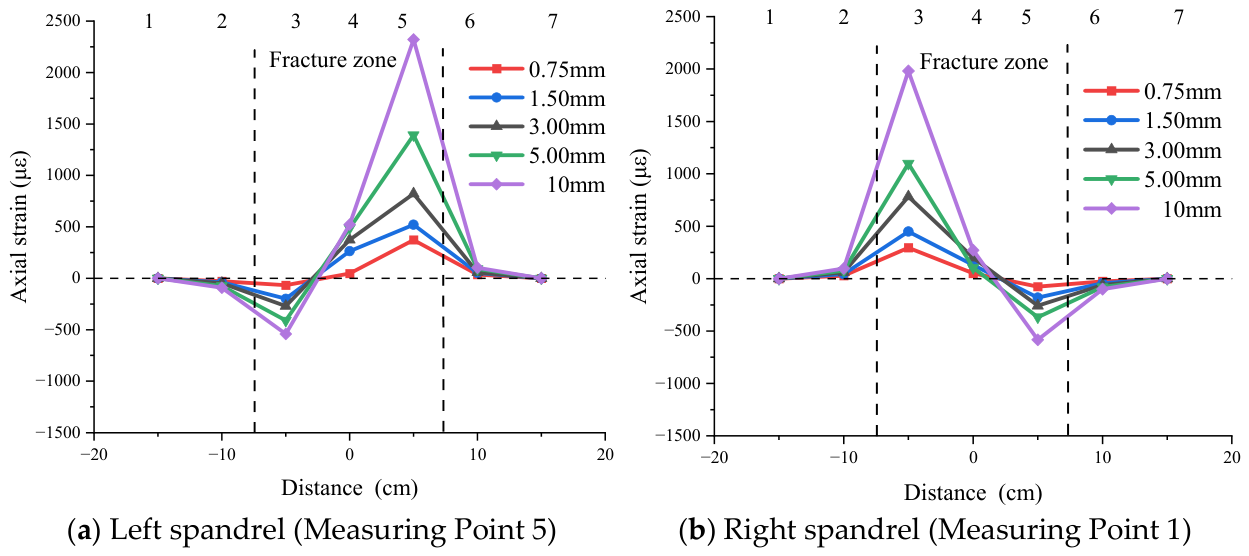
The strain response laws at different positions of the tunnel structure are generally similar. Taking Case 3 as a representative, the strain laws of the left and right spandrels of the tunnel are analyzed in detail, as shown in Figure 23. The distribution characteristics of the axial strain along the tunnel axis under different permanent displacements are similar. The strains at the left and right spandrels exhibit an antisymmetric distribution, and the tensile strain is significantly larger than the compressive strain. The maximum tensile and compressive strains are both located within the fault fracture zone, where the maximum value of the right spandrel is near the passive plate, while the maximum value of the left spandrel is near the active plate.
As the permanent displacement increases, the axial strain also increases, and the growth rate of tensile strain is greater than that of compressive strain, indicating that the tunnel structure is dominated by tensile failure. The maximum tensile strain at the right spandrel increases from 296 με to 1982 με, and the maximum compressive strain increases from 82 με to 583 με. The maximum tensile strain at the left spandrel increases from 373 με to 2321 με, and the maximum compressive strain increases from 68 με to 541 με.
(3)
Strain response of tunnel structure at the time of peak displacement and during the permanent displacement stage
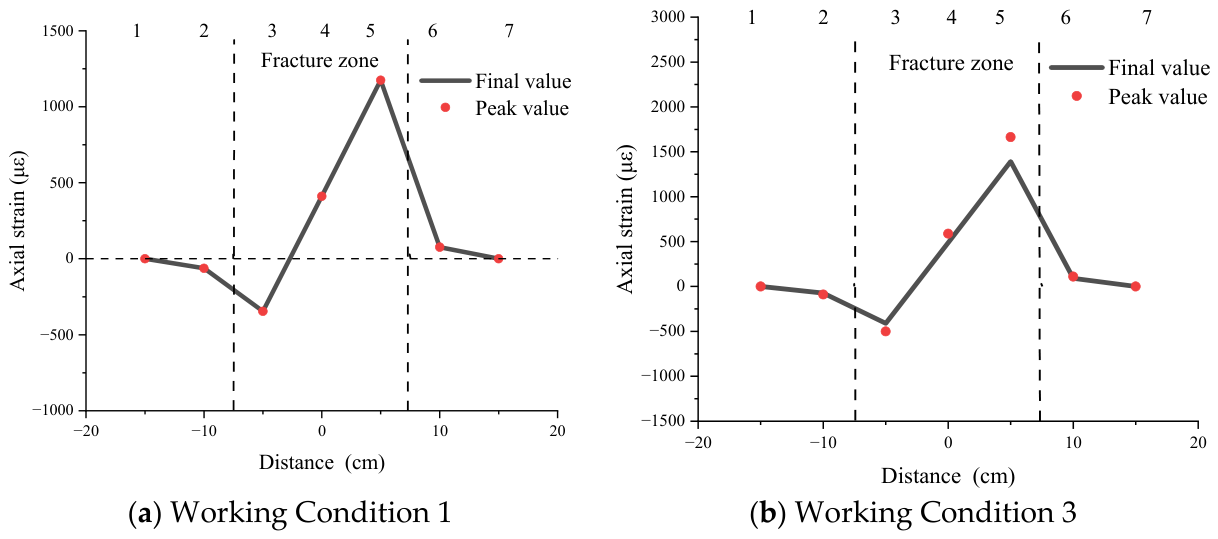
Figure 24 shows a comparison between the peak and final values of the axial strain time history. Under the static action mode, the peak and final axial strains of the tunnel occur simultaneously. In Case 1, the peak strain and final strain of the tunnel structure are identical, as shown in Figure 24a. Under the non-uniform earthquake action mode, the peak axial strain of the tunnel appears at the peak moment of the displacement time history, and the peak axial strain is larger than its final value, as illustrated in Figure 24b. In Case 3, the peak tensile strain at the right spandrel is 1321 με, and the final value is 1099 με, representing a reduction of 20.20%; the peak compressive strain at the right spandrel is 441 με, and the final value is 367 με, representing a reduction of 20.16%; the peak tensile strain at the left spandrel is 1664 με, and the final value is 1392 με, representing a reduction of 19.54%; and the peak compressive strain at the left spandrel is 501 με, and the final value is 410 με, representing a reduction of 22.20%. In Case 5, the differences in the tunnel structural response are more significant. The peak tensile strain at the right spandrel (1431 με) is 39.34% higher than the final value (1027 με), and the peak tensile strain at the left spandrel (1798 με) is 40.80% higher than the final value (1277 με). The amplification effect is attributed to the asynchronous deformation and stress concentration induced by non-uniform ground motion across the fault zone, which leads to transient strain accumulation exceeding the residual deformation level. These results indicate that adopting an earthquake action mode considering only the static fault dislocation displacement will seriously underestimate the potential damage to the tunnel structure. It is recommended to preferentially use the non-uniform earthquake action mode that considers the coupled effect of static fault dislocation displacement and dynamic ground motion displacement.
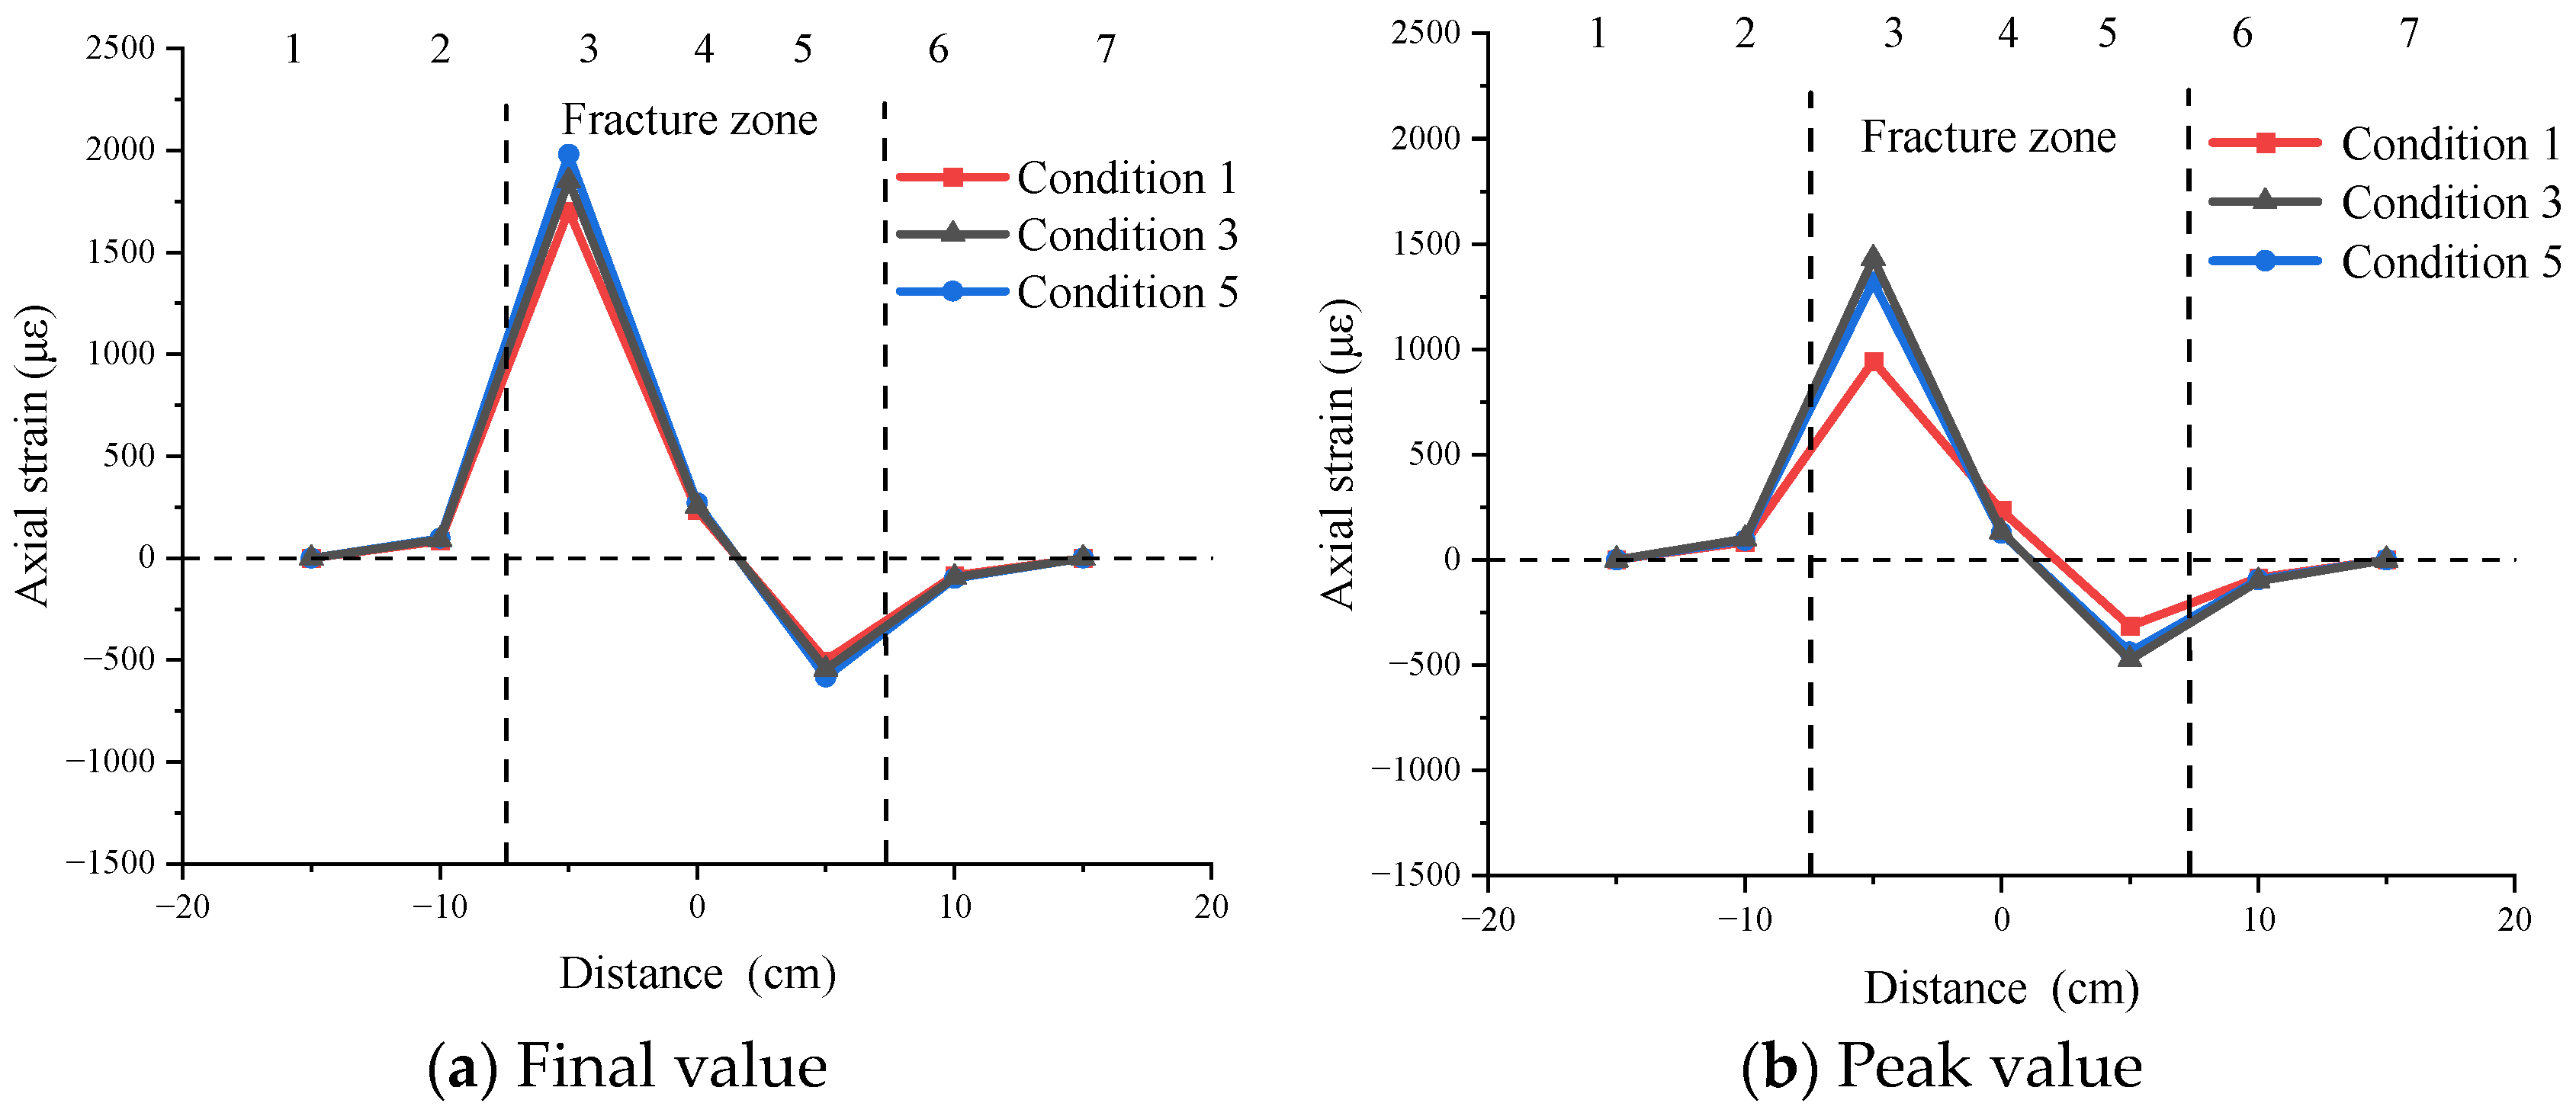
Figure 25 presents a comparison of the final and peak axial strains at the right spandrel of the tunnel under different earthquake action modes when the permanent fault dislocation displacement is 10 mm. The final strains under the non-uniform earthquake action modes (Cases 3 and 5) are close to each other, and both are higher than those under the static action mode (Case 1). According to the previous analysis, under the static action mode, the proportion of deformation within the fault fracture zone is relatively small, the deformation process is relatively gentle, and the strain is also low. These results indicate that the static action mode underestimates the strain response of the tunnel structure, and the dynamic effect of ground motion cannot be neglected. The strain response of fault-crossing tunnels is positively correlated with the relative displacement peak of the input non-uniform ground motion.
In Figure 25b, the axial strain values at the left spandrel of the tunnel in Case 3 and Case 5 are very close, and both reach 140% of that in Case 1, indicating that the static action mode underestimates the strain by 40%. It is seen that when both the dynamic effect of ground motion and the static effect of fault dislocation displacement are considered, the peak strain of the tunnel structure is significantly larger than the final strain, and the peak of the displacement time history is an important factor affecting tunnel damage. This effect is not accounted for in the static analysis method, which inevitably underestimates the potential damage to the tunnel. Notably, the difference between the peak strain and the final strain in Case 5 is considerably larger than that in Case 3, indicating that the strain response is influenced by the displacement characteristics of the ground motion time history. The peak relative ground motion displacement across the two sides of the fault is a more critical factor governing the tunnel response and damage.
It is necessary to strictly distinguish between the final residual strain and the peak transient strain. The final residual strain reflects the permanent deformation demand after fault dislocation, whereas the peak transient strain represents the instantaneous maximum deformation demand during the dynamic–static coupling process induced by non-uniform ground motion input. Because the peak strain can be substantially higher than the final permanent strain, considering only the permanent fault displacement in static analysis will significantly underestimate the maximum tensile demand on the tunnel lining structure. Therefore, seismic design of fault-crossing tunnels should consider not only the residual fault displacement but also the peak relative displacement and the transient strain amplification effect induced by non-uniform ground motions.
In summary, with the continuous increase in the peak relative displacement and permanent displacement between the two sides of the fault under non-uniform ground motion input, the axial strain of the tunnel structure also shows a gradually increasing trend. The strain magnitude is positively correlated with the peak relative displacement of the non-uniform ground motion. Special attention should be paid to the damage to the tunnel structure at the left spandrel at the interface between the fracture zone and the active plate. Therefore, to ensure an accurate evaluation of the seismic response of fault-crossing tunnels and avoid underestimating potential risks, the non-uniform earthquake action mode that can simultaneously consider the coupled dynamic effect of ground motion and the static effect of fault dislocation displacement should be preferentially adopted.

4. Conclusions

This study investigated the seismic response of a fault-crossing tunnel using a dual-shaking table system with foamed concrete to simulate unconfined surrounding rock. Three earthquake action modes were compared: static action mode, uniform earthquake action mode, and non-uniform earthquake action mode. The main research conclusions are as follows:
(1)
During fault dislocation, the static dislocation effect plays a dominant role and cannot be neglected. Under the static mode and the non-uniform earthquake action mode, the deformation patterns are similar: the surrounding rock exhibits an S-shaped longitudinal deformation, and cracks preferentially appear at the interface between the fault fracture zone and the intact rock. Under the uniform earthquake action mode, the deformation of the surrounding rock is minor and randomly distributed.
(2)
During fault dislocation, the dynamic effect and the dynamic–static coupling effect amplify the impact on the tunnel structure and surrounding rock, and neither can be ignored. Compared with the non-uniform earthquake action mode, under the static action mode, the maximum tensile strain of the tunnel structure is underestimated by approximately 40%, and the deformation concentration of the surrounding rock is underestimated by 6.39%.
(3)
The waveform difference of ground motions on the two sides of the fault is an important factor affecting the seismic response of fault-crossing tunnels. The tests show that the deformation of the surrounding rock and the strain of the lining are positively correlated with the permanent fault displacement, the peak displacement on each side, and the relative peak displacement, rather than being determined solely by the permanent displacement.
(4)
Engineering recommendations: To ensure the safety margin of tunnel structural design, it is recommended to preferentially adopt the non-uniform ground motion input on two sides of the fault that considers the coupled dynamic effect of ground motion and the static effect of fault dislocation displacement for the seismic analysis of the tunnel structure-surrounding rock system. Meanwhile, emphasis should be placed on the tensile strengthening design at the interface between the fracture zone and the surrounding rock on both sides of the fault so as to avoid the underestimation of damage risk caused by traditional static analysis methods.
The findings of this study are intended for comparative purposes rather than absolute replication of the prototype. In addition, the number of artificially synthesized ground motions adopted in this paper is limited. Therefore, the quantitative conclusions are not universally generalizable to all fault-crossing tunnel scenarios, but they provide valuable insights into the relative performance of different earthquake action modes.

Author Contributions

Conceptualization, X.L.; methodology, X.L. and R.S.; software, R.S.; formal analysis, R.S.; investigation, R.S. and Y.Y.; resources, X.L.; data curation, R.S. and S.C.; writing—original draft preparation, R.S.; writing—review and editing, X.L.; supervision, X.L.; project administration, X.L.; funding acquisition, X.L. All authors have read and agreed to the published version of the manuscript.

Funding

This research was funded by the National Key Research and Development Program of China, grant number 2023YFC3007400, and the National Natural Science Foundation of China, grant number U2539204.

Data Availability Statement

The original contributions presented in this study are included in the article. Further inquiries can be directed to the corresponding author.

Conflicts of Interest

The authors declare that they have no known competing financial interests or personal relationships that could have appeared to influence the work reported in this paper.

References

  1. Chen, G.; Liu, Y.; Beer, M. Effects of response spectrum of pulse-like ground motion on stochastic seismic response of tunnel. Eng. Struct. 2023, 289, 116274. [Google Scholar] [CrossRef] [Scilit]
  2. Chang, M.; Shen, Y.; Zhang, X.; Gao, D.; Zhang, X.; Zuo, L.-B. A novel flexible joint mechanical model and application in semi-analytical solution for longitudinal response of tunnel subjected to fault movement. Tunn. Undergr. Space Technol. 2025, 162, 106590. [Google Scholar] [CrossRef] [Scilit]
  3. Zhang, D.-M.; Guo, L.; Huang, Z.-K.; Shen, Y.-Y.; Pitilakis, K. Failure mechanism of rock tunnels subjected to combined reversed fault dislocation and subsequent seismic excitation. Comput. Geotech. 2025, 187, 107485. [Google Scholar] [CrossRef] [Scilit]
  4. Wang, T.; Geng, P. Quantitative damage evaluation of tunnel subjected to a subsequent strong seismic after a quasi-static reverse faulting. Eng. Fail. Anal. 2024, 157, 107886. [Google Scholar] [CrossRef] [Scilit]
  5. Yang, Z.; Xu, T.; Liang, J. Towards fast focal mechanism inversion of shallow crustal earthquakes in the Chinese mainland. Earthq. Res. Adv. 2023, 4, 100273. [Google Scholar] [CrossRef] [Scilit]
  6. Yao, C.; He, C.; Wang, T.; Chen, C.; Geng, P.; Dong, W.; Yuan, F.; Xu, G. Damages of highway tunnels during 2022 Luding earthquake (Mw = 6.6). Soil Dyn. Earthq. Eng. 2024, 177, 108357. [Google Scholar] [CrossRef] [Scilit]
  7. Yu, H.; Chen, J.; Bobet, A.; Yuan, Y. Damage observation and assessment of the Longxi tunnel during the Wenchuan earthquake. Tunn. Undergr. Space Technol. 2016, 54, 102–116. [Google Scholar] [CrossRef] [Scilit]
  8. Chen, P.; Geng, P.; Chen, J.; Gu, W. The seismic damage mechanism of Daliang tunnel by fault dislocation during the 2022 Menyuan Ms6.9 earthquake based on unidirectional velocity pulse input. Eng. Fail. Anal. 2023, 145, 107047. [Google Scholar] [CrossRef] [Scilit]
  9. Xin, C.; Feng, W.; Song, D.; Huang, S.; Liu, X. Seismic damage to non-fault-crossing and fault-crossing tunnels: Comparative study of the 2008 Wenchuan earthquake (Mw 7.9) and the 2022 Menyuan earthquake (Mw 6.7). Eng. Fail. Anal. 2024, 166, 108843. [Google Scholar] [CrossRef] [Scilit]
  10. Tsinidis, G.; de Silva, F.; Anastasopoulos, I.; Bilotta, E.; Bobet, A.; Hashash, Y.M.; He, C.; Kampas, G.; Knappett, J.; Madabhushi, G.; et al. Seismic behaviour of tunnels: From experiments to analysis. Tunn. Undergr. Space Technol. 2020, 99, 103334. [Google Scholar] [CrossRef] [Scilit]
  11. Yao, C.; Duan, J.; Liu, Y.; He, C.; Liu, Y.; Yang, W.; Yan, Q.; Luo, W. Tunnels crossing active faults: A review of case histories and modeling methods. Tunn. Undergr. Space Technol. 2026, 168, 107086. [Google Scholar] [CrossRef] [Scilit]
  12. Zhong, Z.; Wang, Z.; Zhao, M.; Du, X. Structural damage assessment of mountain tunnels in fault fracture zone subjected to multiple strike-slip fault movement. Tunn. Undergr. Space Technol. 2020, 104, 103527. [Google Scholar] [CrossRef] [Scilit]
  13. Wen, Y.; Xin, C.; Shen, Y.; Huang, Z.; Gao, B. The seismic response mechanisms of segmental lining structures applied in fault-crossing mountain tunnel: The numerical investigation and experimental validation. Soil Dyn. Earthq. Eng. 2021, 151, 107001. [Google Scholar] [CrossRef] [Scilit]
  14. Kiani, M.; Akhlaghi, T.; Ghalandarzadeh, A. Experimental modeling of segmental shallow tunnels in alluvial affected by normal faults. Tunn. Undergr. Space Technol. 2016, 51, 108–119. [Google Scholar] [CrossRef] [Scilit]
  15. Xu, G.; Gao, F.; Zhang, Z.; Peng, M.; Tan, X.; Wu, W.; Hui, Q. Evaluation and analysis of the ductile dynamic response of mountain tunnels based on shaking table tests. Tunn. Undergr. Space Technol. 2026, 170, 107328. [Google Scholar] [CrossRef] [Scilit]
  16. Shen, Y.; Wang, Z.; Yu, J.; Zhang, X.; Gao, B. Shaking table test on flexible joints of mountain tunnels passing through normal fault. Tunn. Undergr. Space Technol. 2020, 98, 103299. [Google Scholar] [CrossRef] [Scilit]
  17. Zhao, C.; Zhou, H.; Zhang, C.; Liu, W.; Zhang, N.; Tu, H.; Huo, Z. Experimental and numerical investigation on the failure mode and forced response characteristics of segmented lining structure under strike-slip fault movement. Tunn. Undergr. Space Technol. 2025, 163, 106689. [Google Scholar] [CrossRef] [Scilit]
  18. Chen, J.; Yu, H.; Bobet, A.; Yuan, Y. Shaking table tests of transition tunnel connecting TBM and drill-and-blast tunnels. Tunn. Undergr. Space Technol. 2020, 96, 103197. [Google Scholar] [CrossRef] [Scilit]
  19. Zhao, X.; Li, R.; Yuan, Y.; Yu, H.; Zhao, M.; Huang, J. Shaking table tests on fault-crossing tunnels and aseismic effect of grouting. Tunn. Undergr. Space Technol. 2022, 125, 104511. [Google Scholar] [CrossRef] [Scilit]
  20. Mei, X.; Ding, C.; Li, J.; Lou, B.; Cui, Z.; Xu, M.; Sheng, Q.; Song, Y.; Chen, J. The response characteristics of fault-crossing tunnel subjected to different sequential combination actions of strike-slip fault dislocation and seismic wave propagation. Soil Dyn. Earthq. Eng. 2025, 198, 109653. [Google Scholar] [CrossRef] [Scilit]
  21. Tang, J.; He, M.; Qiao, Y.; Bian, H.; Zhu, C. Analytical solution for longitudinal responses of tunnels under combined effects of seismic waves and strike-slip faulting. J. Rock Mech. Geotech. Eng. 2025, 18, 1266–1289. [Google Scholar] [CrossRef] [Scilit]
  22. Varma, M.; Maji, V.; Boominathan, A. Numerical modeling of a tunnel in jointed rocks subjected to seismic loading. Undergr. Space 2019, 4, 133–146. [Google Scholar] [CrossRef] [Scilit]
  23. Gao, J.; Wang, Q.; Wang, R.; Yang, J.; Yang, Y. Model test study on the deformation and failure characteristics of mountain tunnel under a strike-slip fault dislocation. Structures 2024, 60, 105903. [Google Scholar] [CrossRef] [Scilit]
  24. Wang, Z.; Zhong, Z.; Zhao, M.; Du, X.; Huang, J.; Wang, H. Experimental study on mechanical behavior and countermeasures of mountain tunnels under strike-slip fault movement. Undergr. Space 2025, 21, 1–21. [Google Scholar] [CrossRef] [Scilit]
  25. Song, S.; Shen, Y.; Yu, Y.; Li, C.; Zeng, J.; Yang, C.; Liu, T. Shaking table test on seismic response and failure characteristics of buried pipeline-tunnel structure crossing fault fracture zone. Tunn. Undergr. Space Technol. 2026, 167, 107006. [Google Scholar] [CrossRef] [Scilit]
  26. Song, S.; Shen, Y.; Wang, C.; Liu, J.; Yu, J.; Zhan, S.; Feng, T.; Zeng, J. Damping effect of a novel buffer bearing in the pipeline-tunnel structure crossing fault fracture zone: Numerical analysis and shaking table test verification. Eng. Fail. Anal. 2025, 182, 110044. [Google Scholar] [CrossRef] [Scilit]
  27. Zhang, X.; Shen, Y.; Chang, M.; Su, W.; Tao, W. Dynamic response and failure mode of a novel seismic structure for fault-crossing tunnel: Theoretical analysis and shaking table test verification. Eng. Fail. Anal. 2025, 177, 109671. [Google Scholar] [CrossRef] [Scilit]
  28. Li, R.; Zhao, X.; Bilotta, E.; Zhang, J.; Zhao, M.; Huang, J.; Yuan, Y. Shaking table tests on deformation pattern and failure mechanism of fault-crossing tunnels in non-rupture scenario. Soil Dyn. Earthq. Eng. 2024, 180, 108621. [Google Scholar] [CrossRef] [Scilit]
  29. Wang, Q.; Geng, P.; Li, P.; Wang, T.; Sun, W. Failure analysis and dislocation-resistant design parameters of mining tunnel under normal faulting. Eng. Fail. Anal. 2023, 143, 106902. [Google Scholar] [CrossRef] [Scilit]
  30. Wang, T.; Geng, P.; Li, P.; Wang, Q.; Wang, L. Deformation and failure of overburden soil subjected to normal fault dislocation and its impact on tunnel. Eng. Fail. Anal. 2022, 142, 106747. [Google Scholar] [CrossRef] [Scilit]
  31. Zhang, K.; Zhang, Z.; Zhu, X.; Yin, C. Model test and numerical investigation on performance deterioration and failure characteristics of tunnel lining under different fault actions. Tunn. Undergr. Space Technol. 2025, 166, 106969. [Google Scholar] [CrossRef] [Scilit]
  32. Xin, C.; Hu, Y.; Song, D.; Liu, X.; Feng, W.; Zhang, J. Dynamic responses and damping damage of aseismic joints for strike-slip fault-crossing tunnels subjected to excitation. J. Rock Mech. Geotech. Eng. 2025; in press. [CrossRef] [Scilit]
  33. Fan, X.; Zhang, L.; Wang, J.; Ren, Y.; Liu, A. Analysis of faulting destruction and water supply pipeline damage from the first mainshock of the February 6, 2023 Türkiye earthquake doublet. Earthq. Sci. 2024, 37, 78–90. [Google Scholar] [CrossRef] [Scilit]
  34. Guo, K.; Li, X.; Wang, N.; Wen, Z.; Wang, Y. Effect of Soil–Bridge Interactions on Seismic Response of a Cross-Fault Bridge: A Shaking Table Test Study. Buildings 2024, 14, 1874. [Google Scholar] [CrossRef] [Scilit]
  35. Li, X.J.; Sun, J.Y.; Wang, N.; Rong, M.S.; Dong, Q. Analysis of Seismic Response of Bridge across Earthquake Fault with Different Input Modes of Seismic Action. Technol. Earthq. Disaster Prev. 2023, 18, 203–214. (In Chinese) [Google Scholar]
  36. Zhang, N.; Zhou, H.; Gao, Y.; Zhu, Y.; Lu, J.; Zhao, C.; Cheng, G. Deformation and failure mechanism of deep-buried tunnel under the action of fault dislocation and application of nonlocal model in numerical simulation research. Eng. Fail. Anal. 2025, 174, 109496. [Google Scholar] [CrossRef] [Scilit]
  37. Lu, C.; Wu, Y.; Li, X.; Liu, A. Damage analysis of cross-fault tunnels considering fault dynamic displacement modes. KSCE J. Civ. Eng. 2026, 30, 100369. [Google Scholar] [CrossRef] [Scilit]
  38. Zhang, Y.; Zhang, Z.; Yin, C.; Wei, R.; Zhang, H. Experimental study on forced response characteristics and anti-dislocation performance of articulated tunnel structure under dislocation action of normal fault. Structures 2023, 48, 867–881. [Google Scholar] [CrossRef] [Scilit]
  39. Li, Z.; Zhang, R.; Liu, X.; Chen, S.; Li, X. Analysis of seismic response of a large-scale isolated LNG tank considering dynamic soil-pile interaction. Structures 2023, 58, 105460. [Google Scholar] [CrossRef] [Scilit]
  40. Liu, X.; Li, X.; Zhuang, H.; Wang, X.; Tang, B.; Wang, D. Comparison between shaking table test and numerical simulation of transfer and purging rooms in nuclear power plants. Structures 2025, 79, 109325. [Google Scholar] [CrossRef] [Scilit]
  41. Guan, Z.; Zhou, Y.; Gou, X.; Huang, H.; Wu, X. The seismic responses and seismic properties of large section mountain tunnel based on shaking table tests. Tunn. Undergr. Space Technol. 2019, 90, 383–393. [Google Scholar] [CrossRef] [Scilit]
  42. GB/T 50081-2019; Standard for Test Methods of Concrete Physical and Mechanical Properties. China Architecture & Building Press: Beijing, China, 2019.
Figure 1. Electromagnetic shaking table.
Symmetry 18 00890 g001
Figure 2. Simplified model of the Xianglu Mountain Tunnel.
Symmetry 18 00890 g002
Figure 3. Cross-sectional dimensions of the full-scale model and the test model.
Symmetry 18 00890 g003
Figure 4. Material properties test of similar tunnel materials.
Symmetry 18 00890 g004
Figure 5. Stress-strain of foam concrete and rock.
Symmetry 18 00890 g005
Figure 6. Fabrication of the model.
Symmetry 18 00890 g006
Figure 7. Shaking table test of the fault-crossing tunnel.
Symmetry 18 00890 g007
Figure 8. Scheme for measuring plans and sensors.
Symmetry 18 00890 g008
Figure 9. Acceleration, velocity, and displacement time history of the 1992 Landers earthquake.
Symmetry 18 00890 g009
Figure 10. Time histories of acceleration, velocity, and displacement.
Symmetry 18 00890 g010
Figure 11. Fitting of the target response spectrum of ground motion.
Symmetry 18 00890 g011
Figure 12. Adjustment method of displacement time history.
Symmetry 18 00890 g012
Figure 13. Surrounding rock damage phenomena of non-uniform earthquake action mode.
Symmetry 18 00890 g013
Figure 14. Surrounding rock damage phenomena of consistent action mode.
Symmetry 18 00890 g014
Figure 15. Tunnel lining damage phenomena.
Symmetry 18 00890 g015
Figure 16. Surrounding rock displacement with different fault dislocation displacements.
Symmetry 18 00890 g016
Figure 17. Displacement time histories of different measuring points.
Symmetry 18 00890 g017
Figure 18. Surrounding rock displacement of different earthquake action modes.
Symmetry 18 00890 g018
Figure 19. Proportion of surrounding rock deformation within the fracture zone.
Symmetry 18 00890 g019
Figure 20. Tunnel axial strain of different action modes.
Symmetry 18 00890 g020
Figure 21. Tunnel axial strain at different locations.
Symmetry 18 00890 g021
Figure 22. Tunnel axial strain (top view).
Symmetry 18 00890 g022
Figure 23. Axial strain of different permanent displacements.
Symmetry 18 00890 g023
Figure 24. Peak and final axial strain of left spandrel (Measuring Point 5).
Symmetry 18 00890 g024
Figure 25. Tunnel axial strain of different earthquake action modes.
Symmetry 18 00890 g025
Table 1. Mechanical parameters of fault zones along the Xianglu Mountain Tunnel.
NameLongpan–Qiaohou
Fault Zone
Lijiang–Jianchuan
Fault Zone
Heqing–Eryuan
Fault Zone
NumberF10-1F10-2F10-3F11-2F11-3F11-4F12
Fault typeNormal fault with left-lateral strike-slip
Dip angle/°50~826565~808080>7060
Density/kN/m321~25.521~26.521~25
Young’s modulus/GPa0.5~81~201~8
Table 2. Technical parameters of the electromagnetic shaking table.
ParameterValue
Size0.5 m × 0.5 m
Frequency range0.1~60 Hz
Degree of freedomUnidirectional two degrees of freedom
Maximum load50 kg
Maximum acceleration±1.0 g
Maximum displacement100 mm
Table 3. The similarity ratio of lining, surrounding rock, and fracture zone.
LiningSurrounding RockFracture Zone
Geometric dimensionsLength3/2003/2003/200
Material characteristicsElastic modulus1/601/101/10
Density2/3--
Strain111
Stress1/601/101/10
Dynamic characteristicsTime 9 1000 9 1000 9 1000
Frequency 1000 9 1000 9 1000 9
Displacement3/2003/2003/200
Speed 1 40 1 40 1 40
Acceleration1/0.61/0.61/0.6
Table 4. Material parameters of the prototype and the model.
Density
/(kg/m3)
Young’s Modulus
/GPa
Wave
Velocity
/(m/s)
Compressive Strength/MPaTensile Strength/MPa
LiningPrototype (C30)2.50 × 103302.23 × 103302.01
Design1.50 × 1030.50.37 × 1030.50.034
Model1.50 × 1030.570.39 × 1030.560.038
Surrounding rockPrototype (III)2.9 × 1037.51.01 × 10380-
Design1.4 × 1030.750.457 × 1038-
Model1.494 × 1030.820.463 × 1039.09-
Fracture zonePrototype (IV~V)2.1 × 1031.5528.2210-
Design5000.15342.331-
Model5350.18362.531.623-
Table 5. Time history information of ground motion.
ParameterOriginal Ground Motion ①Original Ground Motion ②Ground Motion ①Ground Motion ②
Without Permanent Displacement (N1)With Permanent Displacement (Y1)Without Permanent Displacement (N2)With Permanent Displacement (Y2)
Time (s)40.9540.953.853.853.853.85
PGA (g)0.730.821111
PGV (cm/s)133.3341.0617.518.4127.7419.23
PGD (cm)113.8729.811.552.042.953.87
Permanent displacement (cm)0001.2002.65
Table 6. Earthquake action modes in the test of a fault-crossing tunnel.
Working ConditionTypeGround Motion
Loading Scheme
Permanent Displacement
Passive PlateActive Plate
1Static action modeFixedStatic loading0.75 mm
1.5 mm
3 mm
5 mm
10 mm
2Uniform earthquake
action mode
N1N1
3Non-uniform earthquake action modeN1Y1
4Uniform earthquake
action mode
N2N2
5Non-uniform earthquake action modeN2Y2
Disclaimer/Publisher’s Note: The statements, opinions and data contained in all publications are solely those of the individual author(s) and contributor(s) and not of MDPI and/or the editor(s). MDPI and/or the editor(s) disclaim responsibility for any injury to people or property resulting from any ideas, methods, instructions or products referred to in the content.