Abstract
In this study, the complete discrimination system for the polynomial method (CDSPM) is employed to analyze the integrable Gardner Equation (IGE). Through a traveling wave transformation, the model is reduced to a nonlinear ordinary differential equation, enabling the derivation of a wide class of exact solutions, including trigonometric, hyperbolic, rational, and Jacobi elliptic functions. For example, a bright soliton solution is obtained for parameters , , and . Qualitative analysis reveals diverse phase portraits, indicating the presence of saddle points, centers, and cuspidal points depending on parameter values. Chaos and quasi-periodic dynamics are investigated via Poincaré maps and time-series analysis, where chaotic patterns emerge for values like , , , and . Sensitivity analysis confirms the model’s sensitivity to initial conditions , reflecting real-world unpredictability. Additionally, the energy balance method (EBM) is applied to approximate periodic solutions by conserving kinetic and potential energies. These results highlight the IGE’s ability to capture complex nonlinear behaviors relevant to fluid dynamics, plasma waves, and nonlinear optics.
1. Introduction
Nonlinear partial differential equations (NLPDEs) play a fundamental role in modeling a wide range of complex physical, biological, and engineering systems. Unlike their linear counterparts, NLPDEs can capture intricate behaviors such as soliton formation, shock waves, turbulence, and chaotic dynamics. These equations have become central to understanding time-dependent phenomena in diverse domains, including fluid dynamics, plasma physics, optical fiber communications, quantum mechanics, geophysics, and nonlinear control systems. The ability of NLPDEs to describe localized structures, energy exchange, and wave propagation under nonlinear effects makes them indispensable tools for both theoretical exploration and practical applications [1,2,3]. Many techniques have been developed to obtain various types of solitary wave solutions to NLPDEs. The Ricatti–Bernoulli sub-ODE method [4], homogeneous balance method [5], hyperbolic tangent function method [6,7], CK method [8], Lie symmetry analysis [9,10], and the inverse scattering transform [11] are some of the conventional techniques for determining exact solutions to NLEEs. Although each has advantages, they frequently only produce a small class of solutions, are restricted to integrable systems, or rely on assumed solution forms. On the other hand, many of these drawbacks are addressed by the methodical and algebraic CDSPM.
The CDSPM was first created by Liu and associates [12,13,14] and examines the discriminant structure of the reduced polynomial ODE that is derived from a traveling wave transformation. This enables the full classification of all real-valued solutions—including periodic solutions, solitary waves, and structures based on Jacobi elliptic functions (JEFs)—without presuming their form beforehand. Moreover, the CDSPM allows for a thorough phase portrait analysis when the PDE is converted into a dynamical system, exposing the presence of bifurcations, multi-stability, and parameter-driven transitions. In particular, the FDGM exhibits rich dynamical behavior because of the interaction of damping, dispersion, external forcing, and nonlinearity. The model’s parameter-sensitive structures and polynomial nonlinearities make it a perfect fit for the CDSPM.
Among the most influential models in the field of nonlinear science are the Korteweg–de Vries (KdV) equation, the modified KdV (mKdV), and the Gardner equation—a hybrid model that includes both quadratic and cubic nonlinearities. These models describe wave motion in shallow water, ion-acoustic waves in plasma, and envelope solitons in nonlinear optics. In particular, the Gardner equation provides a unified framework that extends the applicability of both KdV and mKdV equations by capturing rich dynamical structures, including solitons, breathers, and multi-wave interactions [15,16]. The IGE can be connected to the KdV equation via the Miura transformation, which links solutions of integrable systems and reveals the underlying integrability structure. It has direct relevance in modeling internal waves in stratified fluids, nonlinear electric transmission lines, plasma waves, and fiber optics where energy input and losses coexist [17].
The novelty and justification of this research are clearly articulated through the unified and comprehensive application of the CDSPM [18,19], sensitivity analysis, chaos detection [20,21], and the EBM [22,23] tools to the IGE, a combination not previously explored in the literature. This study aims to advance the understanding of nonlinear wave dynamics by not only deriving diverse analytical solutions [24,25] (including trigonometric, hyperbolic, elliptic, and rational forms) but also validating their stability and physical relevance through phase portraits, energy balance analysis, and time-series diagnostics [26,27]. The Introduction section highlights these goals, while Table 1 and Figure 1 contrast this work with earlier studies that focused on more restricted versions of the Gardner equation, lacking damping or forcing effects. Unlike those, our model incorporates broader physical realism. Each step in the solution process is justified by variational principles, energy formulations, and chaos-detecting tools such as Poincaré maps and time-series trajectories. These validations are embedded throughout the manuscript and visually supported by multiple Figure 1, Figure 2, Figure 3, Figure 4 and Figure 5 and Table 1, Table 2, Table 3 and Table 4, ensuring mathematical rigor and physical interpretability.

Table 1.
Summary of previous works related to the IGE.
Table 1.
Summary of previous works related to the IGE.
| Author(s) | Methodology/Contribution | Ref. |
|---|---|---|
| Wang | Founded the traveling wave solutions to Gardner equation in dusty plasmas | [28] |
| Mathanaranjan | Investigated the soliton solutions of deformed nonlinear Schrödinger equations using Ansatz method | [29] |
| Liu et al. | Studied the integrability, bilinearization, Bäcklund transformations, and solutions for a generalized variable-coefficient Gardner equation | [30] |
| Zhang et al. | Explored some non-traveling wave solutions for the IGE | [31] |
| Raur et al. | Discussed a non-autonomous Gardner equation and its integrability: solitons, positons and breathers | [32] |
| Present Work | Derived multiple soliton solutions using the CDSPM, performed phase portrait analysis and sensitivity analysis, and demonstrated chaotic and quasi-periodic dynamics and energy analysis of the IGE model. |
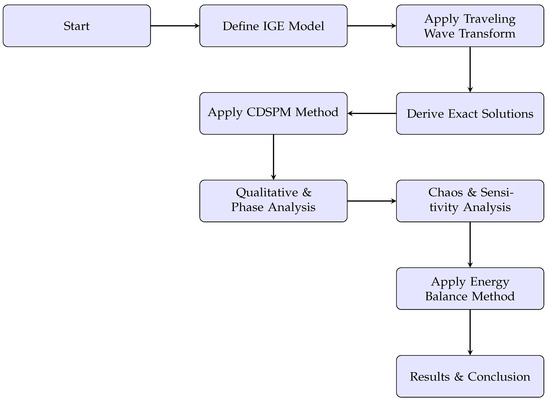
Figure 1.
Enhanced flowchart representing the methodological framework of the study.
The remainder of the paper is structured as follows: Section 2 formulates the IG and performs a detailed qualitative analysis, identifying equilibrium points and bifurcation structures using the discriminant system. Section 2.2 then applies the CDSPM to obtain exact analytical solutions, including trigonometric, hyperbolic, and JEF solutions. Section 3 explores the quasi-periodic and chaotic dynamics of the system by deriving and analyzing a reduced phase space model, revealing intricate patterns of complex behavior. Section 4 conducts a sensitivity analysis by varying initial conditions to assess the robustness and reliability of wave propagation and soliton dynamics under perturbation conditions. Section 5 employs the EBM to investigate the energy evolution of the system, offering insights into periodicity and dynamical balance where exact solutions become intractable. Section 6 presents a detailed graphical discussion and phase portraits to interpret the stability and transition behaviors of the system with varying parameters. Finally, Section 7 concludes the study by emphasizing the novelty of applying the CDSPM and EBM to the IGE, highlighting the discovery of exact solutions, identification of chaotic and periodic regimes, and the enhanced understanding of energy dynamics and nonlinear wave behavior.
2. Mathematical Model
Here, we investigate the well-known IGE [27,33,34,35],
where the function represents the wave profile or amplitude of a nonlinear wave as it evolves in both space x and time t. The term describes the time evolution of the wave, while the spatial derivatives and account for the wave’s local slope and dispersive effects, respectively. The nonlinear coefficients u and v govern the strength of the quadratic and linear nonlinearities within the system, and the parameter w determines the degree of dispersion due to the third-order spatial derivative. While previous studies mainly focused on traveling or non-traveling wave solutions of the IGE, they often overlooked the combined influence of external forcing, damping, and sensitivity to initial conditions. Moreover, limited attention has been given to the chaotic and quasi-periodic dynamics of the IGE. Our work addresses this gap by not only deriving a broader class of soliton solutions using the CDSPM and trial equation method but also by conducting a comprehensive qualitative, sensitivity, and energy-based analysis—thereby advancing the understanding of IGE behavior under realistic physical conditions. To simplify the analysis, a traveling wave transformation is introduced as , where defines a moving frame of reference. Here, represents the wave number (controlling spatial oscillation), denotes the wave speed, and is an initial phase shift. The function characterizes the wave profile in the traveling frame, and its derivatives and capture the slope and dispersive features of the wave in this reduced form.
Integrating Equation (2) once over , where d is the constant of integration, we get the Helmholtz–Duffing equation:
Equation (3) can also be written in the following form.
which is integrated after multiplying Equation (4) by .
where E is the integration constant. Let , , , and , then Equation (5) turns into
By considering , we get
Equation (7) becomes
where , , and .
We now deal with both and cases in Equation (8). The integral form of Equation (8) is
is an integration constant. Here we denote and CDSPM as follows:
The dynamical system of Equation (8) is shown below:
The Hamiltonian and potential energy of the system is mentioned below: Hamiltonian:
Potential energy:
2.1. Qualitative Analysis
It is essential to obtain the roots of to analyze the dynamic characteristics of Equation (9),
We have and . Since
It is demonstrated that the eigenvalues at the unique point are now trivial:
Therefore, if , then represents the saddle point, a center for , and a cuspidal point if . The system’s CDS is given by
Consider the following cases regarding the form:
Case 1: ,
The only equilibrium point is the saddle point , with the conditions .
Case 2:
In the dynamic system, there is just one equilibrium point at . The equivalent GPP may be observed in Figure 2 when and .
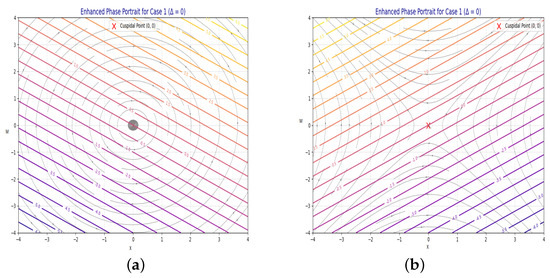
Figure 2.
Global phase portrait (GPP) for Equation (11) in Case 1 with the parameters (a) , (b) .
Case 3: ,
where . In the dynamic system, there are three equilibrium points: , , and . For instance, when , , , , and are present. The GPP is shown in Figure 3.
Case 4: ,
There are two equilibrium points in this dynamic system: and . For instance, when , , , and are present, the corresponding global phase portraits are shown in Figure 4.
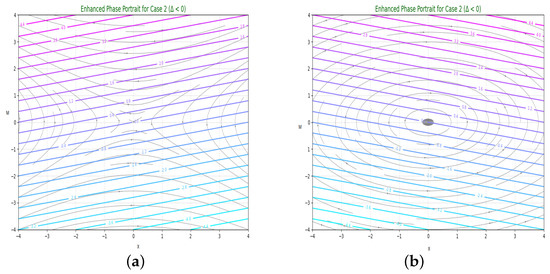
Figure 3.
Equation (11) shows a GPP for Case 2 with parameters (a) , (b) .
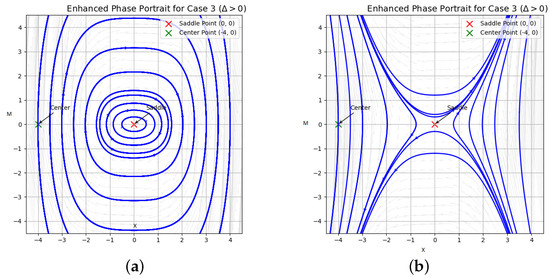
Figure 4.
Equation (11) represents the GPP that illustrates its behavior in Case 3 (a) , (b) .
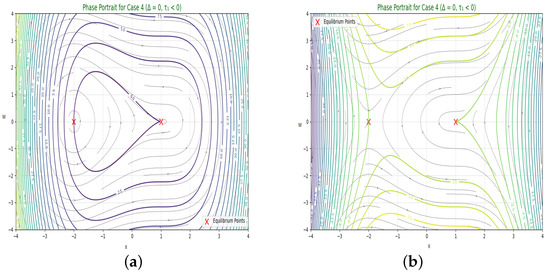
Figure 5.
The dynamical system (11) displays a global phase portrait that exhibits its behavior in Case 4 (a) , (b) .
2.2. Exact Solutions
Case 1: , , and . Since
where , putting Equation (22) into Equation (9) leads to
Therefore, we find the solution
Case 2: , , , and . Since
where , , and , we can get
when , then we have
Therefore, we have the following solutions
and
Case 3: , , and . Then,
Since we have
we get the following solution
Case 4: , , , and . Since
where , , or , , we have
Furthermore, we have two solutions
and

Table 2.
Geometry and physical interpretation of soliton solutions.
Table 2.
Geometry and physical interpretation of soliton solutions.
| Figure | Equation | Geometry Type | Graphical Features | Physical Interpretation |
|---|---|---|---|---|
| Figure 6 | Equation (24) | Shock Soliton | Steep wavefront with sharp incline; prominent localization in contour and 3D surface | Models abrupt transitions in medium properties; applicable in fluid dynamics and optical shocks |
| Figure 7 | Equation (28) | Singular Soliton | Rapid spike formations with infinite-like behavior in 3D and contour projections | Represents finite-time blow-up; occurs in nonlinear optics or plasma singularities |
| Figure 8 | Equation (29) | Kink Soliton | Smooth but steep step-like transition from one level to another | Illustrates domain wall movement or interface propagation between two steady states |
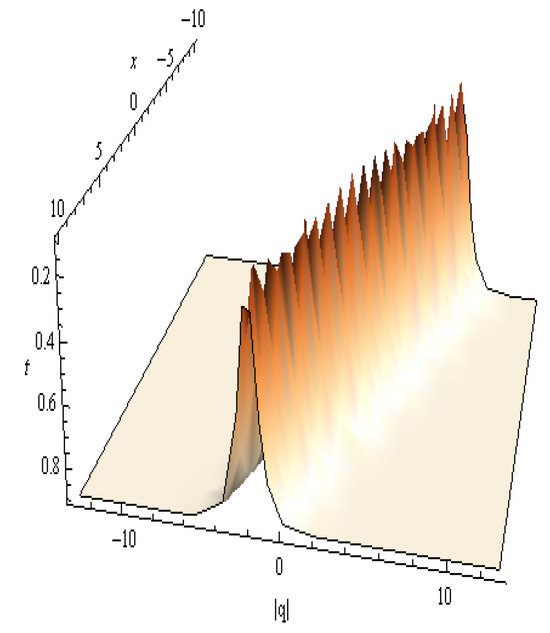
Figure 6.
The 3D visual display of in Equation (24): , , , , , , and .
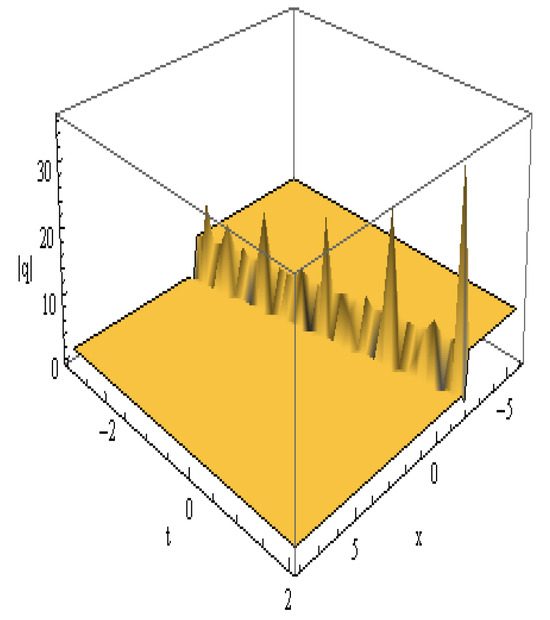
Figure 7.
The 3D plot of in Equation (28): , , , , , , and .
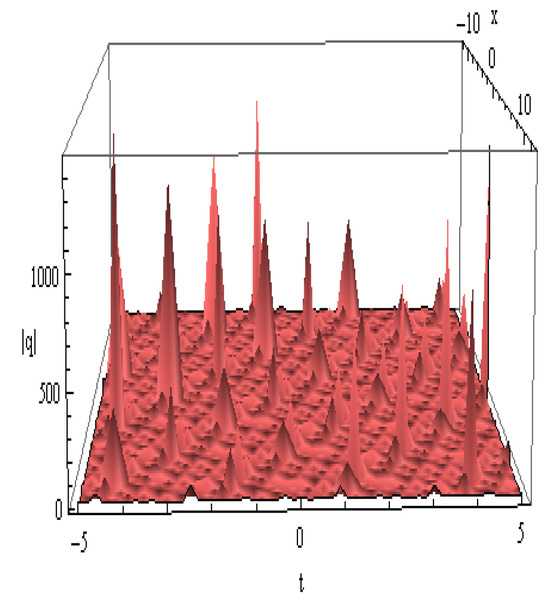
Figure 8.
The 3D graph of in Equation (29): , , , , , , and .
Case 5: , and . Thus,
where , and I are real numbers. Hence, we have
where .
Case 6: , , and . Then, we have
where , and are real numbers and . If or , then we have the following transformations
Similarly, if ,
where . Furthermore, we get the following solution
and
Case 7: , and . So, we have
where , and s are real numbers. If , , then we indicate
Since
where and , we have the following solution
Case 8: , and . Thus,
where , are real numbers and . We express
Then,
where , and . Furthermore, we have
Case 9: , , and . Thus, we have
where , are real numbers, and . If and , then we have
if and , then we have
Consequently, we have
and

Table 3.
Geometry and physical interpretation of soliton solutions (Figure 9, Figure 10 and Figure 11).
| Figure | Equation | Geometry Type | Graphical Features | Physical Interpretation |
|---|---|---|---|---|
| Figure 9 | Equation (44) | Multi-Lobed Soliton | Wavy structure with multi-lobed contours; clearly oscillatory | Indicates nonlinear interference from multiple wave sources in bounded media |
| Figure 10 | Equation (45) | Chaotic Soliton Pattern | Highly oscillatory surface with overlapping wavefronts and cross-directional interference | Describes chaotic or turbulent soliton flows; relevant in plasma or waveguide instabilities |
| Figure 11 | Equation (49) | High-Frequency Oscillatory Soliton | Tightly packed crest-trough wave trains with narrow width | Represents high-frequency energy transport with consistent waveforms in narrow bands |
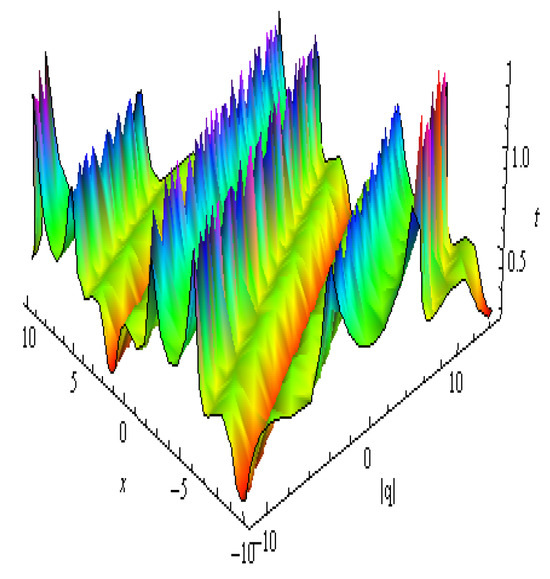
Figure 9.
The 3D shape of in Equation (44): , , , , , , , , and .
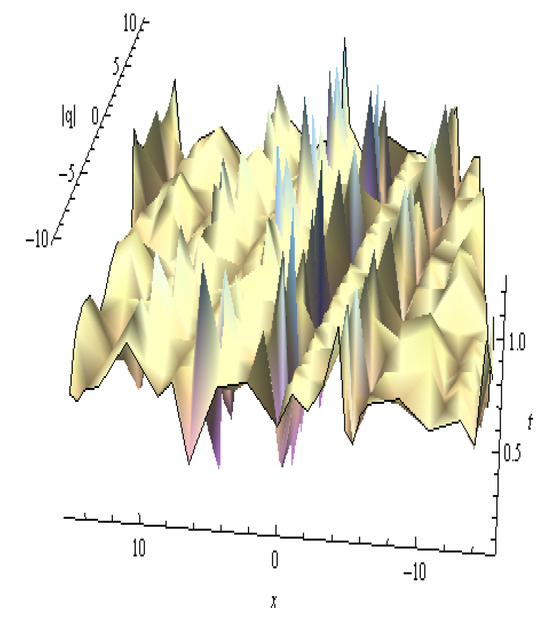
Figure 10.
The 3D shape profile of in Equation (45): , , , , , , , , and .
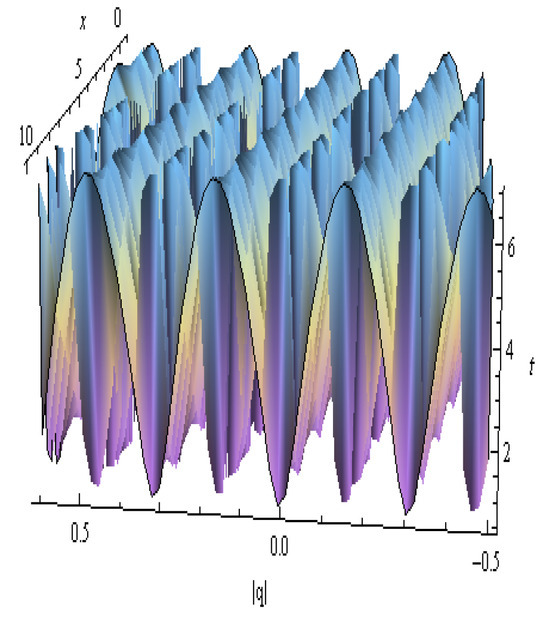
Figure 11.
The 3D figure of in Equation (49): , , , , , , , and .
2.3. Double Hyperbolic Type-I
When is utilized as the limit in Equations (44) and (45), the function turns into
that offers the SW solution:
and
2.4. Double Periodic Type-I
If is the limit in Equations (44) and (45), the function yields
which shows the SW solutions:
and
2.5. Double Hyperbolic-II SW
By having the limit in Equation (49), the function transfers into
which shows the SW solution:
2.6. Double Periodic-II SW
By having the limit in Equation (49), the function transfers into
,
which shows the SW solution:
2.7. Double Hyperbolic Type-III
When is the limit in Equation (62), the functions becomes
and
which exhibit the SW solution
where .
2.8. Double Periodic Type-III
With the limit in Equation (62), the functions convert into
and
that exhibit the SW solution:
where .

Table 4.
Geometry and physical interpretation of soliton solutions (Figure 12, Figure 13, Figure 14 and Figure 15).
| Figure | Equation | Geometry Type | Graphical Features | Physical Interpretation |
|---|---|---|---|---|
| Figure 12 | Equation (59) | Steep Kink Soliton | Sloped wavefronts with sharp kink edges and semi-periodic troughs | Describes nonlinear domain wall formation or soliton interfaces under asymmetric boundary effects |
| Figure 13 | Equation (60) | Multi-Striped Oscillatory Soliton | Layered oscillations forming strip-like modulation bands with regular high peaks | Represents strong nonlinear wave interactions in spatially periodic or layered media |
| Figure 14 | Equation (61) | Banded Periodic Soliton | Uniform amplitude waves aligned with profiles, forming rippled bands | Models repetitive wave propagation in optical or acoustic bandgap structures |
| Figure 15 | Equation (62) | Diagonal Wave Packet Soliton | Diagonal wave trains with periodic high-low structures in contour and surface plots | Suggests anisotropic wave transport across structured media with direction-dependent behavior |
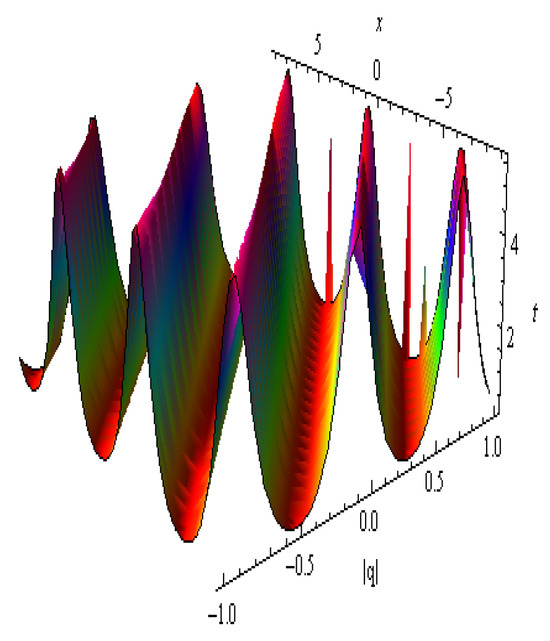
Figure 12.
The 3D graphical representation of in Equation (59): , , , , , , , , and .
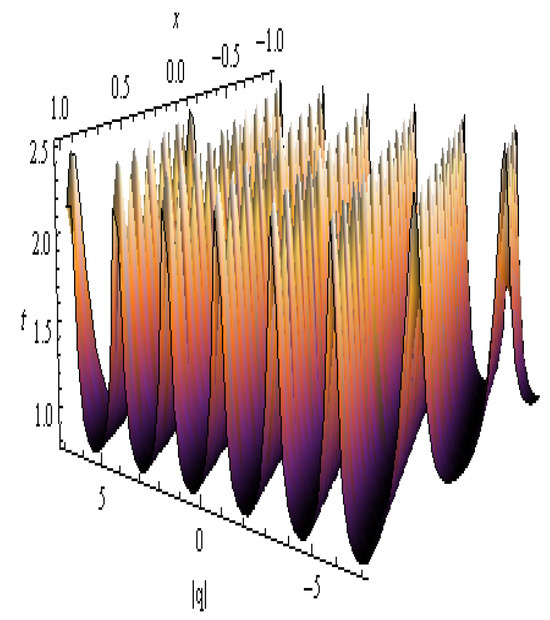
Figure 13.
The 3D plot of in Equation (60): , , , , , , , , and .
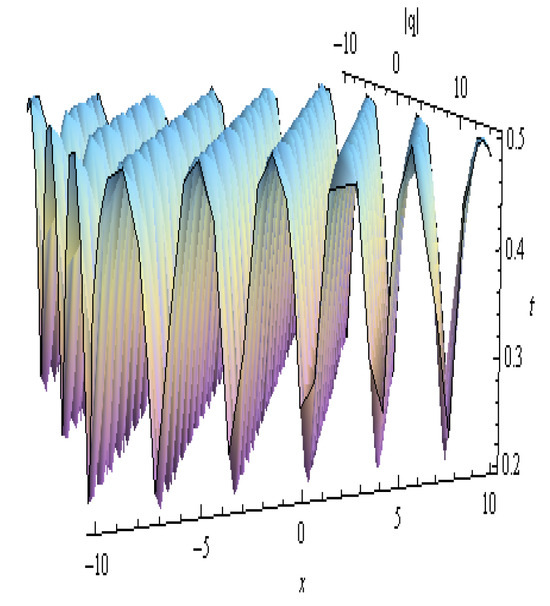
Figure 14.
The 3D shape profile of in Equation (61): , , , , , , , , and .
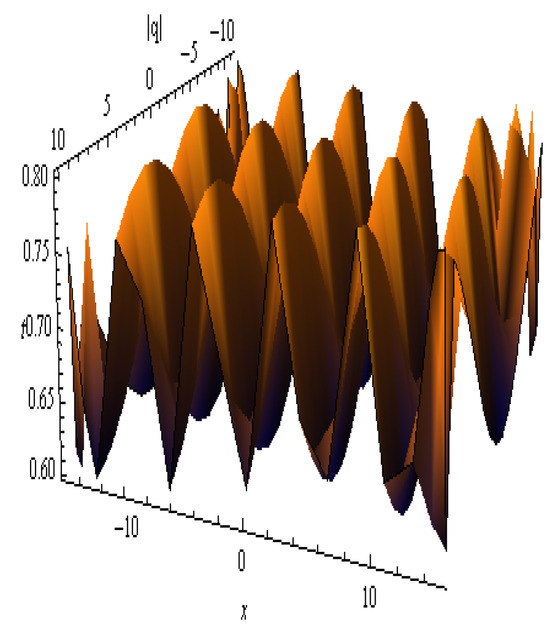
Figure 15.
The 3D figure of in Equation (62): , , , , , , , , and .
3. Phase Patterns for Quasi-Periodic Behavior
Quasi-periodic activity is analogous to a combination of regular and chaotic patterns. It occurs when more than two wavy movements do not link properly. As a result, the pattern deviates from its fundamental structure, becoming complex and non-repetitive. It is not strictly ordered, yet it is also not as chaotic as chaos. We may be able to analyze it by examining certain parts of these patterns and determining a specific structure inside the complexity. The intricate and exact phase patterns of quasi-periodic activity provide a fresh perspective on dynamic systems. Following that, we look at the system’s quasi-periodic and chaotic behavior, which is as follows:
where , , , and , . Here in Equation (67), is the frequency and determines the disruption of strength. The term can refer to a periodic external influence such as wind forcing, electromagnetic waves, or mechanical vibrations, depending on the context in which the FDGM is used. This kind of forcing is often seen in real-world systems such as ocean surface waves, optical pulses in fibers, and plasma waves. To study how external periodic drivers affect soliton formation, wave modulation, or resonance phenomena, as well as how they interact with nonlinear wave behavior, we introduce this term. In order to examine the chaotic and periodic patterns of Equations (11) and (12), system (67) has an external periodic force of . We address this problem using a variety of methods, including time-series profiling, the portrait approach, and phase Poincaré maps. To address the issue from many perspectives, we will explore the effects of the parameters , , , and for different possibilities. We will keep unchanged in the first scenario as we examine the effects of , , and . Also, in the second scenario, we will examine the impact of altering the remaining variables while keeping unchanged.
Figure 16 exhibits time analysis graphs, 2D and 3D phase plots, and Poincaré maps with the following values: , , , and . Figure 17 illustrates time-series profiles, Poincaré maps, and 3D and 2D plots for the following values: , , , and . While quasi-periodic patterns have been described for System (67), the Poincaré section suggests chaotic motion for the given parameters by displaying many chaotic outcomes. For , , , and , Figure 18 provides time-series profiles, Poincaré maps, and 3D and 2D plots, and in Figure 19 we have , , , and . There are several irregular patches in the Poincaré map, which exhibit chaotic activity compared to the quasi-periodic pattern of system (67).
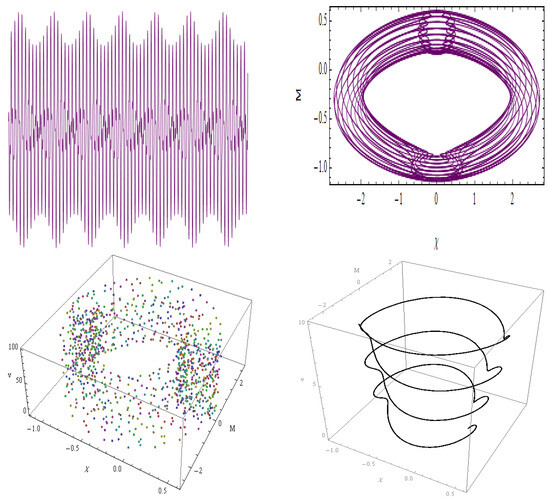
Figure 16.
For , , , and , the nonlinear dynamical system (67) is initiated with the initial condition (0.2, 0.2) set to a range of chaos-detecting techniques.
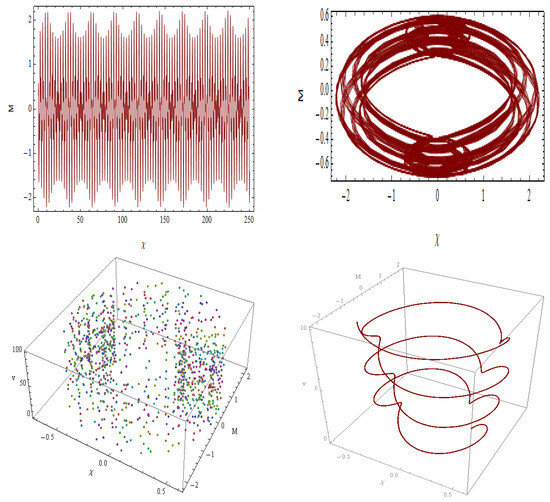
Figure 17.
For , , , and , the nonlinear dynamical system (67) is initiated with the initial condition (0.3, 0.3) set to a range of chaos-detecting techniques.
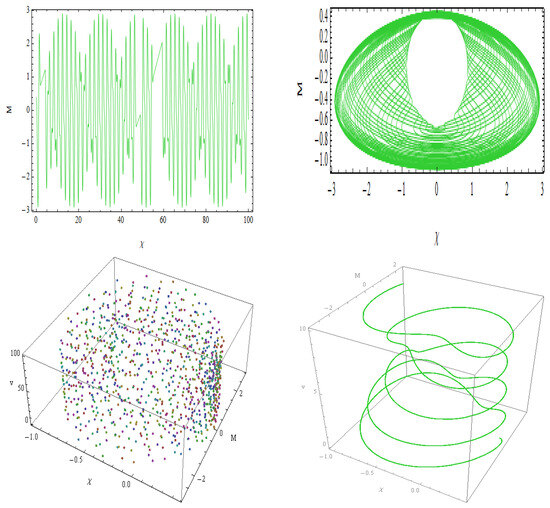
Figure 18.
For , , , and , the nonlinear dynamical system (67) is initiated with the initial condition (0.4, 0.4) set to a range of chaos-detecting techniques.
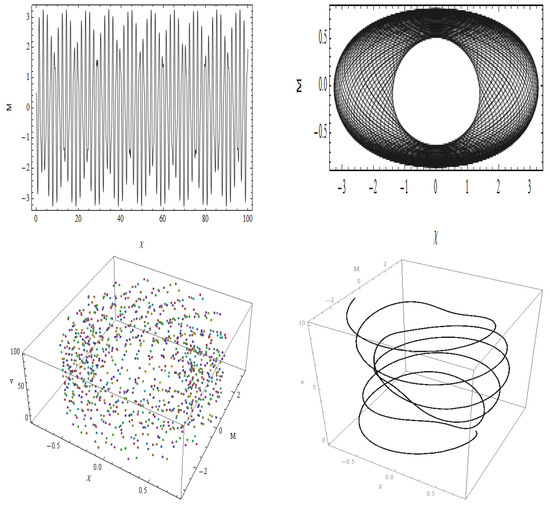
Figure 19.
For , , , and , the nonlinear dynamical system (67) is initiated with the initial condition (0.5, 0.5) set to a range of chaos-detecting techniques.
4. Sensitivity Analysis
Sensitivity analysis plays a vital role in evaluating how variations in initial parameters affect the overall behavior of nonlinear dynamical systems. In the context of the studied model, it helps determine the robustness and reliability of wave propagation patterns, soliton dynamics, and stability under uncertain conditions. Sensitivity analysis rigorously investigates the influence of input parameter changes on model outputs, delivering vital information on system behavior under uncertain conditions. For Equation (67), three initial conditions = (2.2,0), (2.4,0), and (2.6,0) were tested by varying parameters to test the response of the model to perturbations. The sensitivity of wave propagation features, pulse formation dynamics, and pattern stability to variations in initial conditions is shown in the analysis, with divergence of output among the red (2.2, 0), yellow (2.4, 0), and purple (2.6, 0) curves as a measure of this sensitivity. These results show the model to be sensitive to accurate initial conditions while determining its boundaries of robustness, essential for successful use in real-world applications where parameter uncertainties are bound to exist. We assess our model’s sensitivity at this phase:
5. Energy Balance Method
With the EBM, kinetic-like and potential-like energy expressions are equated over a wave cycle to approximate solutions of nonlinear differential equations. Equations such as the Gardner model may have exact solutions, although they are frequently complicated and case-specific. The EBM gives important physical insight into the dynamics of the system and creates simplified, tractable correlations between wave parameters. It is nevertheless helpful for managing perturbed or generalized models, studying periodic behavior, and confirming results in situations where exact solutions are hard to find or explain. To apply the EBM, we first rewrite Equation (4) as [36]:
Its variational principle is as follows:
Now
Here Y is kinetic energy, and W is potential energy, so
Its Hamiltonian invariant is as follows:
Now, we consider the solution of Equation (68) as
We examine the cosine-type trial function in order to investigate periodic behaviors in a more manageable manner. Although this decision was not made directly from the equation’s nonlinear terms, it was driven by the method’s capacity to simplify the energy expressions and approximate periodic waveforms. These trial functions are frequently employed in nonlinear dynamics to strike a balance between physical relevance and analytical simplicity. According to the EBM, the Hamilton invariant is required to be unchanged:
The initial conditions of Equation (74) are
Putting Equation (76) into Equation (75),
Next, putting Equations (74) and (77) into Equation (75), we get
On substituting into Equation (78), we get
Hence, we have
So, the periodic solution of Equation (4) is
6. Results and Discussion
To analyze the qualitative behavior of the system, various phase portraits were generated with different parameter settings. When and , the system reveals a saddle point geometry centered at the origin, as shown in Figure 2a. The hyperbolic trajectories diverging from this point signify instability, indicating that small perturbations grow over time. A similar pattern is observed in Figure 2b for , though the orientation of the flow reverses due to the negative value of A, maintaining instability. In the case where , as in Figure 3, the system exhibits center-type behavior. The closed orbits for both and (Figure 3a,b)) indicate stable oscillations about the center point, demonstrating either periodic or quasi-periodic behavior with bounded perturbations. For , a broader spectrum of behaviors is observed in Figure 4. Specifically, when , the phase portrait consists of both a center and a saddle point. The diagram shows circular loops around the center point, which indicate stable behavior. These loops are surrounded by special curves coming from the saddle point that show unstable behavior. This confirms that both stable and unstable motions exist together in the system. In Figure 4b, where , we see a reversed version of the saddle-center pattern. The gap between the center and saddle paths is larger, showing how changing the sign of the parameter affects the shape of the system. Lastly, Figure 5 reveals mixed phase portraits arising in the degenerate case and , resulting in two equilibrium points. The portraits indicate complex dynamics where trajectories are influenced by both saddle and center characteristics. In Figure 5a, for , saddle-type divergence coexists with closed orbits, while in Figure 5b with , streamlines suggest dominant saddle effects with directionally repelling trajectories. Collectively, these figures emphasize how the sign and magnitude of parameters like A and discriminant govern the system’s geometric structure, stability, and sensitivity to initial conditions.
The nonlinear dynamical system governed by Equation (67) exhibits a rich variety of geometric behaviors depending on parameter variations, as illustrated in Figure 16, Figure 17, Figure 18 and Figure 19. In Figure 19, a toroidal phase surface emerges, showing nested toroidal loops with mild quasi-periodic modulation. This indicates quasi-periodic oscillations commonly driven by external periodic forcing, relevant to systems like mechanical vibrations and electromagnetic wave propagation. Figure 17 reveals densely wound phase coils, suggesting amplified oscillations and heightened sensitivity to initial conditions, signaling proximity to chaotic dynamics typically observed in complex oscillatory frameworks. Figure 18 displays irregular mixed orbit structures with asymmetric loops and scattered points. This configuration reflects a transitional regime between quasi-periodic and chaotic states, implying dynamic instability under nonlinear excitation conditions. Finally, Figure 19 presents circular-lobed quasi-periodic orbits, featuring intricate inner loops and modulated envelopes. This suggests a well-balanced interaction between nonlinearity and periodic external influences, characteristic of moderately perturbed systems. Collectively, these geometric interpretations provide deep insight into the system’s complex temporal evolution and its route from order to chaos.
The sensitivity analysis reveals critical insights into the system’s response to initial perturbations, as governed by Equation (67). In Figure 20, with initial conditions , , and , the overlaid red, yellow, and purple oscillatory curves exhibit minor but noticeable divergence, demonstrating the system’s sensitivity to even slight variations and its robust nature. Figure 21 highlights waveform deformation for initial values , , and shown in green, purple, and orange, where the symmetry and amplitude shift due to nonlinear effects, revealing how small changes can distort pulse dynamics. Figure 22, with initial inputs , , and represented in red, green, and black, shows amplified oscillations and peak deviations, indicating growing instability at higher input energies. Lastly, Figure 23 depicts trajectories for , , and using black, green, and orange, respectively, and captures pronounced high-frequency oscillations and phase separation, signaling critical sensitivity at high-energy states. Overall, the geometric interpretation underlines how overlaid sinusoidal curves, phase shifts, and amplitude changes contribute to understanding the system’s stability, reliability, and nonlinear dynamics under parameter uncertainty conditions.
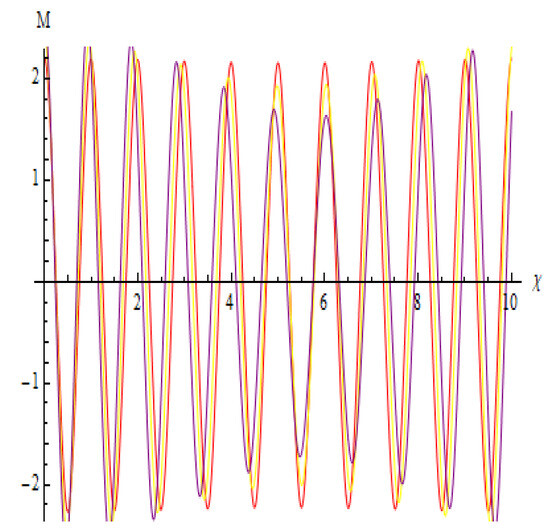
Figure 20.
With initial values of (2.2,0) in red, (2.4,0) in yellow, and (2.6,0) in purple, the system Equation (67) sensitivity profile has the following variables: , , , , and .
The EBM offers a powerful analytical framework for examining nonlinear dynamical systems by equating kinetic and potential energy components over a wave cycle. In the present study, the EBM is applied to Equation (68) to approximate the behavior of the nonlinear model using the trial function . The method simplifies the analysis of complex nonlinearities, enabling derivation of approximate solutions when exact ones are hard to obtain. By evaluating the Hamiltonian and constructing a variational formulation, the method provides insights into system dynamics, energy distribution, and oscillatory behaviors. The resulting analytical profile , shown in Figure 24, reveals tilted wave ridges, parabolic energy curves, and a periodic density distribution. These visualizations confirm spatial–temporal regularity, energy symmetry, and wavefront propagation patterns with specific parameters. The advantage of the EBM lies in its versatility—it allows exploration of perturbative or generalized models and facilitates understanding of periodic phenomena in systems where direct solution techniques may fail. Moreover, it helps validate the consistency and physical realism of the obtained results through energy-based arguments, bridging mathematical abstraction with physical interpretation.
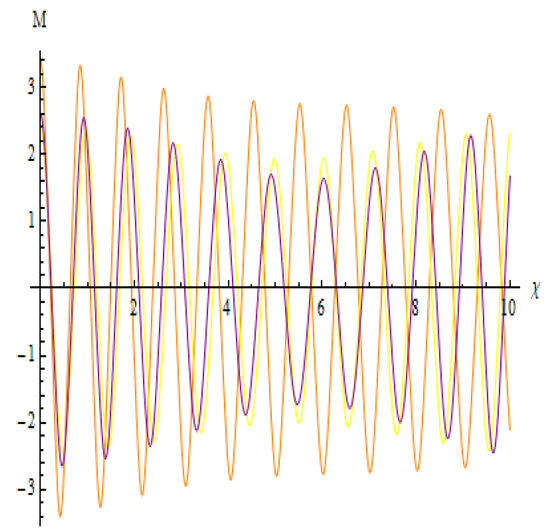
Figure 21.
With initial values of (3.0,0) in green, (3.2,0) in purple, and (3.4,0) in orange, the system Equation (67) sensitivity profile has the following variables: , , , , and .
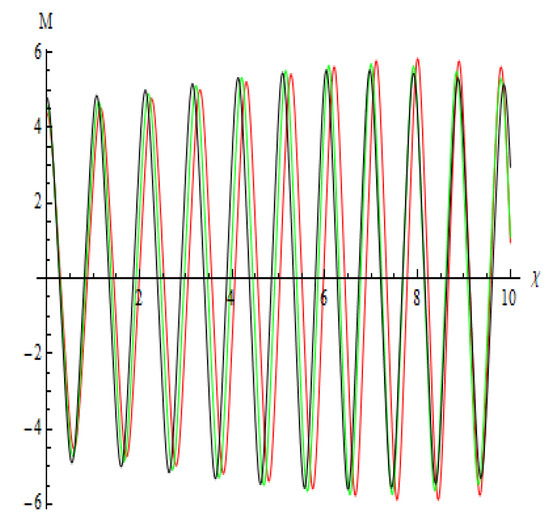
Figure 22.
With initial values of (4.4,0) in red, (4.6,0) in green, and (4.8,0) in black, the system Equation (67) sensitivity profile has the following variables: , , , , and .
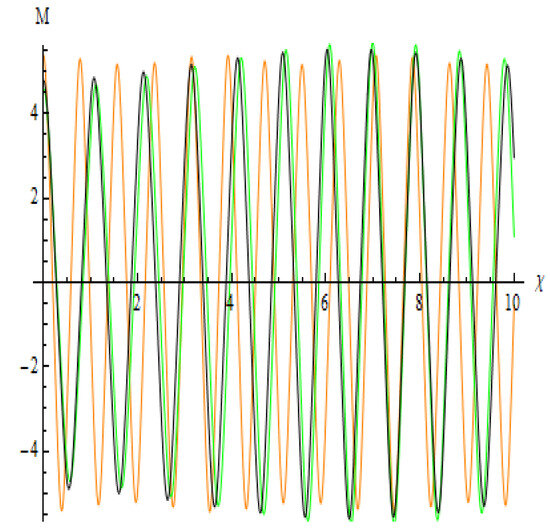
Figure 23.
With initial values of (5.0,0) in black, (5.2,0) in green, and (5.4,0) in orange, the system Equation (67) sensitivity profile has the following variables: , , , , and .
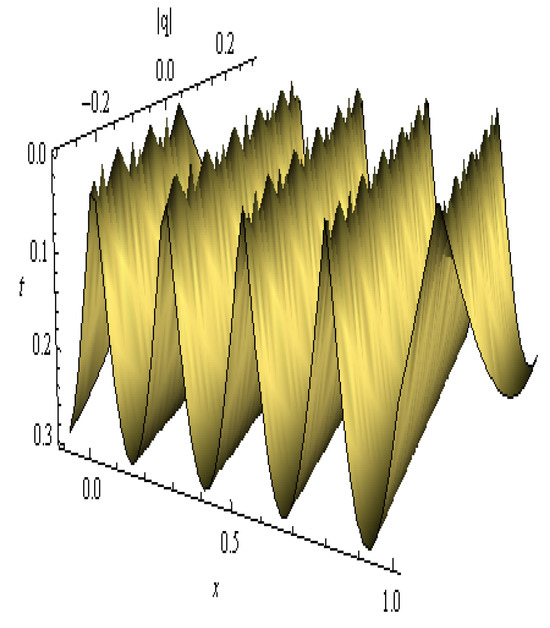
Figure 24.
The figure outline of in Equation (52): , , , , , , , and .
7. Conclusions
In this paper, we thoroughly analyzed the IGE using the CDSPM and the EBM. Through a systematic approach, we derived exact analytical solutions—including periodic, singular, and JEF solutions—which hold significant value in modeling nonlinear wave phenomena in plasma physics, optical fibers, and fluid dynamics. The qualitative analysis provided a deeper understanding of the system’s critical points and phase structures, which are essential in predicting the long-term behavior and stability of nonlinear systems. Our investigation into chaotic dynamics revealed irregular wave behavior sensitive to initial conditions, reflecting real-world complexity in laser systems, weather modeling, and biological rhythms. The sensitivity analysis demonstrated how small perturbations in parameters could drastically alter wave structures, making this study relevant for designing robust communication systems, climate prediction algorithms, and control mechanisms in engineering. Moreover, the application of the EBM enabled an intuitive understanding of energy distribution over wave cycles, offering a useful tool for energy-based control in mechanical and electrical oscillatory systems. Collectively, the integration of the CDSPM and EBM not only advances the theoretical analysis of the IGE but also provides valuable insights and predictive capabilities for real-life applications where nonlinear and complex wave behavior is prominent.
Author Contributions
S.T.R.R. and A.R.S.: Supervision, Conceptualization, Resources, Methodology. I.A. and A.F.H.: Data Curation, Formal Analysis, Software. A.S., Z.I., and A.S.A.-M.: Investigation, Validation, Visualization, Writing—Review and Editing. All authors have read and agreed to the published version of the manuscript.
Funding
This work was supported and funded by the Deanship of Scientific Research at Imam Mohammad Ibn Saud Islamic University (IMSIU) (grant number IMSIU-DDRSP2502).
Institutional Review Board Statement
We hereby declare that this manuscript is the result of our independent creation. This manuscript does not contain any research achievements that have been published or written by other individuals or groups.
Data Availability Statement
The original contributions presented in this study are included in the article. Further inquiries can be directed to the corresponding author.
Conflicts of Interest
The authors confirm that they have no relevant financial or non-financial competing interests. All the authors with the consultation of each other completed this research and drafted the manuscript together. All authors have read and approved the final manuscript.
References
- Drazin, P.G.; Johnson, R.S. Solitons: An Introduction; Cambridge University Press: Cambridge, UK, 1989. [Google Scholar]
- Ablowitz, M.J.; Segur, H. Solitons and the Inverse Scattering Transform; SIAM: Philadelphia, PA, USA, 1981. [Google Scholar]
- Scott, A.C. Nonlinear Science: Emergence and Dynamics of Coherent Structures; Oxford University Press: Oxford, UK, 2003. [Google Scholar]
- Wang, M.L.; Li, X.Z.; Zhang, J.L. The (G′/G)-expansion method and traveling wave solutions of nonlinear evolution equations in mathematical physics. Phys. Lett. A 2008, 372, 417–423. [Google Scholar] [CrossRef]
- Wang, M.; Li, Z. Application of a homogeneous balance method to exact solutions of nonlinear equations in mathematical physics. Phys. Lett. A 1996, 216, 67–75. [Google Scholar] [CrossRef]
- Malfliet, W.; Hereman, W. The tanh method and solitary wave solutions of nonlinear equations. Phys. Scr. 1996, 54, 563–568. [Google Scholar] [CrossRef]
- Cieliski, J.L. The Darboux-Bäcklund transformation without using amatrix representation. J. Phys. A Math. Gen. 2000, 33, L363. [Google Scholar]
- Clarkson, P.A.; Kruskal, M.D. New similarity reductions of the Boussinesq equation. J. Math. Phys. 1989, 30, 2201–2213. [Google Scholar] [CrossRef]
- Bluman, G.W.; Kumei, S. Symmetries and Differential Equations; Springer: New York, NY, USA, 1989. [Google Scholar]
- Ablowitz, M.J.; Segur, H. On the evolution of packets of water waves. J. Fluid Mech. 1979, 92, 691–715. [Google Scholar] [CrossRef]
- Fokas, A.S.; Ablowitz, M.J. On the inverse scattering transform of multidimensional nonlinear equations related to first-order systems in the plane. J. Math. Phys. 1983, 24, 2319–2331. [Google Scholar] [CrossRef]
- Liu, Z. Tunneling Through Black Rings. Commun. Theor. Phys. 2007, 47, 835–842. [Google Scholar] [CrossRef]
- Ma, W.X. A new hierarchy of Liouville integrable generalized Hamiltonian equations and its reduction. Chin. Ann. Math. A 1992, 13, 115–123. [Google Scholar]
- Yomba, E. The generalized auxiliary equation method and its application to nonlinear equations. Phys. Lett. A 2008, 372, 1048–1060. [Google Scholar] [CrossRef]
- Kakutani, T.; Ono, H. Weak non-linear hydromagnetic waves in a cold collision-free plasma. J. Phys. Soc. Jpn. 1969, 26, 1305–1318. [Google Scholar] [CrossRef]
- Seadawy, A.R. Stability analysis for two-dimensional ion-acoustic waves in quantum plasmas. Phys. Plasmas 2014, 21, 052107. [Google Scholar] [CrossRef]
- Grimshaw, R.; Pelinovsky, E.; Poloukhina, O. Higher-order KdV models for internal solitary waves in a stratified shear flow with a free surface. Nonlin. Processes Geophys. 2002, 9, 221–235. [Google Scholar] [CrossRef]
- Tabor, M. Chaos and Integrability in Nonlinear Dynamics: An Introduction; Wiley: New York, NY, USA, 1989. [Google Scholar]
- El, G.A.; Hoefer, M.A. Dispersive shock waves and modulation theory. Phys. D 2016, 333, 11–65. [Google Scholar] [CrossRef]
- Li, J.; Zhang, L. Bifurcations of traveling wave solutions in generalized Pochhammer–Chree equation. Chaos Solitons Fractals 2002, 14, 581–593. [Google Scholar] [CrossRef]
- Ahmed, S.; Hashem, A.F.; Rizvi, S.T.R.; Seadawy, A.R. Characterizing the physical and dynamical properties of lump, rogue waves and their interactions for a cascaded system with spatio-temporal dispersion and Kerr nonlinearity. AIMS Math. 2025, 10, 16498–16525. [Google Scholar] [CrossRef]
- He, J.H. Homotopy perturbation technique. Comput. Methods Appl. Mech. Eng. 1999, 178, 257–262. [Google Scholar] [CrossRef]
- Baillargeon, B.P.; Vel, S.S. Exact solution for the vibration and active damping of composite plates with piezoelectric shear actuators. J. Sound Vib. 2005, 282, 781–804. [Google Scholar] [CrossRef]
- Wazwaz, A.M. Partial Differential Equations: Methods and Applications; Balkema: Lisse, The Netherlands, 2002. [Google Scholar]
- El-Labany, S.K.; Moslem, W.M.; Shnishin, K.A.; El-Tantawy, S.A. Plasma with two-negative ions and immobile dust particles: Planar and non-planar ion-acoustic wave propagation. Eur. Phys. J. D 2011, 61, 409–420. [Google Scholar] [CrossRef]
- El-Tantawy, S.A.; El-Bedwehy, N.A.; Moslem, W.M. Nonlinear ion-acoustic structures in dusty plasma with superthermal electrons and positrons. Phys. Plasmas 2011, 18, 052113. [Google Scholar] [CrossRef]
- El-Tantawy, S.A.; Moslem, W.M. Nonlinear electrostatic excitations in electron-depleted electronegative dusty plasma with two-negative ion species. Astrophys. Space Sci. 2012, 337, 209–215. [Google Scholar]
- Wang, K.J. Traveling wave solutions of the Gardner equation in dusty plasmas. Res. Phys. 2022, 33, 105207. [Google Scholar]
- Mathanaranjan, T. Soliton Solutions of Deformed Nonlinear Schrödinger Equations Using Ansatz Method. Int. J. Appl. Comput. Math. 2021, 7, 159. [Google Scholar] [CrossRef]
- Liu, H.D.; Tian, B.; Feng, S.P.; Chen, Y.Q.; Zhou, T.Y. Integrability, bilinearization, Bäcklund transformations, and solutions for a generalized variable-coefficient Gardner equation with an external-force term in a fluid or plasma. Nonlinear Dyn. 2024, 112, 12345. [Google Scholar]
- Zhang, L.H.; Dong, L.H.; Yan, L.M. Construction of non-traveling wave solutions for the generalized variable-coefficient Gardner equation. Appl. Math. Comput. 2008, 203, 784. [Google Scholar]
- Raut, S.; Ma, W.X.; Barman, R.; Roy, S. A non-autonomous Gardner equation and its integrability: Solitons, positons and breathers. Chaos Soliton Fractals 2023, 176, 114089. [Google Scholar] [CrossRef]
- Demirbilek, U.; Tedjani, A.H.; Seadawy, A.R. Analytical solutions of the combined Kairat-II-X equation: A dynamical perspective on bifurcation, chaos, energy, and sensitivity. AIMS Math. 2025, 10, 13664–13691. [Google Scholar] [CrossRef]
- Rizvi, S.T.R.; Batool, T.; Ahmed, S.; Abdel-Khalek, S.; Seadawy, A.R. Multiple rational solutions for simplified modified Camassa-Holm dynamical model with applications in modern physics. Mod. Phys. Lett. A 2025, 40, 2550080. [Google Scholar] [CrossRef]
- Jlali, L.; Rizvi, S.T.R.; Shabbir, S.; Seadawy, A.R. Study of Optical Solitons and Quasi-Periodic Behaviour for the Fractional Cubic Quintic Nonlinear Pulse Propagation Model. Mathematics 2025, 13, 2117. [Google Scholar] [CrossRef]
- Ahmad, S.; Mahmoud, E.E.; Saifullah, S.; Ullah, A.; Ahmad, S.; Akgül, A.; Din, S.M.E. New waves solutions of a nonlinear Landau-Ginzburg-Higgs equation: The Sardar-subequation and energy balance approaches. Results Phys. 2023, 51, 106736. [Google Scholar] [CrossRef]
Disclaimer/Publisher’s Note: The statements, opinions and data contained in all publications are solely those of the individual author(s) and contributor(s) and not of MDPI and/or the editor(s). MDPI and/or the editor(s) disclaim responsibility for any injury to people or property resulting from any ideas, methods, instructions or products referred to in the content. |
© 2025 by the authors. Licensee MDPI, Basel, Switzerland. This article is an open access article distributed under the terms and conditions of the Creative Commons Attribution (CC BY) license (https://creativecommons.org/licenses/by/4.0/).