Abstract
Side-channel analysis (SCA) poses a persistent threat to cryptographic hardware by exploiting unintended physical leakages. To address the limitations of traditional single-modality SCA methods, we propose a novel multi-modal side-channel analysis framework that targets the recovery of encryption keys by leveraging the imperfections inherent in hardware implementations. The core objective is to extract and classify information-rich segments from power and electromagnetic (EM) signals in order to recover secret keys without profiling or labeling. Our approach introduces a unified pipeline combining joint peak-based segmentation, isometric compression of variable-length trace segments, and multi-modal feature fusion. A key component of the framework is unsupervised clustering, which serves to automatically classify trace segments corresponding to different cryptographic operations (e.g., different key-dependent leakage classes), thereby enabling key byte hypothesis testing and full key reconstruction. Experimental results on an FPGA-based AES-128 implementation demonstrate that our method achieves up to 99.2% clustering accuracy and successfully recovers the entire encryption key using as few as 1–3 traces. Moreover, the proposed approach significantly reduces sample complexity and maintains resilience in low signal-to-noise conditions. These results highlight the practicality of our technique for side-channel vulnerability assessment and its potential to inform the design of more robust cryptographic hardware.
1. Introduction
Cryptographic algorithms are theoretically secure under well-established mathematical assumptions. However, their physical implementations may unintentionally emit side-channel information, which can be exploited by adversaries to recover secret keys. Side-channel analysis (SCA) targets such physical leakages—e.g., power consumption, electromagnetic (EM) emissions, timing, or acoustic signals—produced during cryptographic computations [1,2]. These leakages often correlate with intermediate values processed by the algorithm, enabling key recovery without breaking the cryptographic primitives themselves.
A typical SCA attack involves three main stages: (1) capturing physical traces while a device performs encryption or decryption; (2) constructing leakage models (e.g., Hamming weight or Hamming distance) to estimate internal state correlations; and (3) performing statistical analysis, such as differential power analysis (DPA) or correlation power analysis (CPA), to test key hypotheses and recover subkeys. This attack flow is illustrated in Section 3.
As cryptographic modules are increasingly deployed in embedded platforms—such as Internet of Things (IoT) devices, mobile processors, and automotive control systems—ensuring implementation-level security has become essential. Nevertheless, conventional SCA techniques face several challenges in practice. They typically require a high signal-to-noise ratio (SNR), large numbers of traces, precise alignment, and a priori knowledge of the target architecture. Moreover, modern countermeasures such as masking, shuffling, and noise injection further diminish their effectiveness [3,4,5].
To address these limitations, recent research has explored unsupervised and weakly supervised learning methods, which offer profiling-free alternatives and reduce reliance on labeled data. These techniques have shown promise in identifying key-dependent leakage under constrained conditions. In addition, multi-modal side-channel fusion—especially combining power and EM signals—has emerged as an effective strategy to enhance leakage observability. Nevertheless, most existing methods rely on early-stage fusion or operate directly at the signal level, overlooking issues such as temporal misalignment, operation boundaries, and inter-channel diversity, which are crucial for accurate analysis.
In this work, we propose a novel multi-modal side-channel analysis framework that integrates joint segmentation, isometric compression, and feature-level fusion of power and EM signals. The framework is specifically designed for unsupervised clustering-based key recovery and demonstrates robustness in low-SNR and limited-trace scenarios.
The remainder of this paper is organized as follows. Section 2 reviews prior work on single-channel and multi-modal SCA techniques. Section 3 presents our proposed methodology, including segmentation, compression, fusion, and clustering. Section 4 describes the hardware setup and data acquisition process. Section 5 provides experimental results and ablation studies. Finally, Section 6 discusses and concludes the paper.
2. Related Work
SCA has become a prominent research direction in cryptographic engineering due to its ability to exploit unintended physical emissions from hardware devices. This section reviews the evolution of SCA from single-channel attacks to clustering-based approaches and multi-modal fusion techniques, highlighting the existing research gaps that motivate our work.
2.1. Single-Channel Side-Channel Analysis
Classical side-channel analysis (SCA) techniques such as differential power analysis (DPA), correlation power analysis (CPA), and template attacks (TAs) laid the foundation for exploiting physical leakage in cryptographic implementations [6]. Electromagnetic analysis (EMA) extended the scope of such attacks by capturing localized emissions from specific components of a cryptographic device [7]. However, these approaches often suffer from practical limitations such as sensitivity to noise, trace misalignment, and dependence on a large number of side-channel measurements.
Among these techniques, template attack (TA) is theoretically regarded as the most powerful profiling method under the assumption of multivariate Gaussian leakage [2]. It models the probability distribution of leakages corresponding to each intermediate sensitive value and computes the likelihood of observed traces for key hypothesis testing. To further enhance the performance of TA under noisy and constrained scenarios, several recent works have focused on refining the noise modeling strategies.
In particular, Zhang et al. [8] proposed an enhanced TA framework that exploits the leakage of the squared noise component, rather than the traditional linear noise residual. This variant, referred to as TA-II, constructs statistical templates using the squared deviation of traces from their class-conditional means. Empirical evaluations on publicly available datasets such as DPA Contest v2/v4 and ASCAD further demonstrate that TA-II consistently improves the success rate (SR) of key recovery, especially in cases with limited profiling data or under masking countermeasures.
Complementary to this, Zhang et al. [9] analytically studied the exact mathematical relationship between the success rate of template attacks and key parameters, including the number of profiling traces, the dimensionality of feature vectors, and the signal-to-noise ratio (SNR). They provided closed-form expressions that allow the prediction of attack effectiveness under given conditions. This theoretical work offers valuable guidance for evaluating and comparing TA variants, and it complements practical enhancements such as the squared noise exploitation introduced in [8].
These developments highlight a shift in focus from solely modeling signal leakage to exploiting information embedded in noise characteristics. They also lay the groundwork for more advanced single-channel or multi-channel SCA techniques that benefit from both signal and noise modeling innovations.
2.2. Clustering-Based Side-Channel Attacks
To reduce the dependence on labeled data and profiling devices, clustering-based approaches have been introduced as effective unsupervised alternatives in side-channel analysis. Heyszl et al. [10] were among the first to apply K-means clustering to distinguish cryptographic operations using single-channel electromagnetic traces. Subsequent enhancements by Specht et al. [11] and Perin et al. [12] integrated dimensionality reduction and fuzzy clustering techniques to improve robustness under masking and noise.
More recently, Ramezanpour et al. [11], Wang et al. [13], and Savu et al. [14] leveraged unsupervised and weakly supervised learning techniques to circumvent the need for profiling or labeling, achieving high success rates in key recovery with significantly fewer traces. These approaches have shown particular promise in adapting to trace misalignment and complex leakage scenarios without prior assumptions. Further advancements by Wu et al. [12] and Picek et al. [15] provide a taxonomy of deep-learning-based clustering strategies and highlight their potential in real-world constrained environments.
2.3. Multi-Modal Fusion in Side-Channel Analysis
Multi-modal fusion has emerged as a promising direction in the field of SCA, aiming to exploit complementary leakage characteristics from heterogeneous physical sources such as power, EM signals, timing signals, and even acoustic data [16]. Souissi et al. [17] introduced Kalman filtering to achieve adaptive multi-source signal integration.
More recently, Yang et al. [18,19] developed advanced multi-channel fusion attacks targeting symmetric cryptographic implementations, emphasizing the importance of aligned temporal structures and synchronized leakage. Bai et al. [20] further demonstrated a real-time implementation of dual-channel EM/power attacks based on mutual information metrics. Additionally, Bai et al. [21] introduced the SPERO dataset—a synchronized, dual-channel measurement corpus—designed to support comparative studies across signal modalities under both oscilloscope and real-time acquisition conditions.
Despite these advances, many existing approaches primarily focus on signal-level combination or early-stage fusion, lacking mechanisms to systematically account for temporal misalignments, inter-segment variability, and semantic operation boundaries. These limitations motivate the need for more structured frameworks that can jointly segment, compress, and fuse multi-modal traces in a temporally aware manner.
2.4. Isometric Compression and Combined Clustering
Recent research has also explored signal segmentation and compression strategies to facilitate trace-level analysis. Mao et al. [22] proposed a peak-based segmentation algorithm in which variable-length segments from single-channel RSA traces are compressed via isometric projection into fixed-length vectors. This technique enables consistent feature representation across operations and improves the clustering of modular arithmetic operations.
While effective in modeling amplitude and timing leakages jointly, existing compression-based techniques are typically limited to single-modality signals and lack the flexibility to accommodate temporal misalignments across modalities. Additionally, many do not consider segment-level semantic boundaries such as AES rounds or SBox lookups. These limitations restrict their applicability to symmetric-key scenarios with multi-channel observations. Addressing these issues requires more advanced frameworks capable of synchronizing multi-modal traces while preserving critical timing features.
2.5. Summary and Gap Analysis
While significant progress has been made in profiling attacks, unsupervised clustering, and multi-modal fusion, there remains a lack of unified frameworks that integrate all three aspects in a principled manner. Most existing solutions either focus on single-channel data or overlook temporal segmentation issues critical for cryptographic structure alignment.
In this paper, we fill this gap by introducing a fully unsupervised multi-modal side-channel analysis framework that combines synchronized segmentation, isometric compression, and clustering-based key recovery. This design enables trace-efficient, label-free attacks even under low-SNR and misaligned signal conditions.
3. Proposed Methodology
This section introduces a unified multi-modal side-channel analysis methodology that integrates signal processing, unsupervised learning, and key hypothesis evaluation. The goal is to recover cryptographic keys from noisy power and electromagnetic (EM) signals without profiling. Section 3.1 outlines the overall pipeline. Section 3.2 explains how cryptographic operations are segmented based on signal peaks across modalities. Section 3.3 details the isometric compression method that projects variable-length segments into a fixed-dimensional feature space. Section 3.4 describes feature-level fusion of modalities. Finally, Section 3.5 presents the unsupervised clustering approach for key recovery, including its justification and leakage modeling.
Throughout this paper, a trace is defined as a time series measurement of a device’s physical leakage (e.g., power or EM signal) during one encryption execution. A trace segment refers to a subinterval corresponding to an atomic cryptographic operation (e.g., SubBytes).
3.1. System Overview
As illustrated in Figure 1, the proposed framework consists of the following stages:

Figure 1.
Proposed multi-modal SCA framework.
- Preprocessing and Alignment: Apply denoising techniques such as moving average filters or wavelet thresholding to reduce high-frequency noise in the raw traces. Perform trace normalization (e.g., z-score normalization) to standardize signal amplitudes across different measurements. Additionally, perform temporal alignment—either via fixed triggers or signal-based alignment—to compensate for temporal jitter and ensure that corresponding operations across traces are aligned in time.
- Joint Peak-Based Segmentation: Detect cryptographic operation boundaries (e.g., round transformations or SBox lookups) by identifying local peaks in the average trace computed over all samples. Unlike single-channel segmentation, the peak detection is performed jointly on both power and EM signals to improve robustness against noise and modality-specific distortions. Each identified peak indicates the likely onset of a leakage-relevant segment, which is then extracted for further analysis.
- Isometric Compression: Cryptographic operation segments extracted via peak-based segmentation often exhibit variable lengths due to timing jitter or segmentation imprecision. To enable uniform downstream processing and facilitate clustering, we apply an isometric compression procedure that transforms each variable-length segment into a fixed-dimensional feature vector while preserving its key temporal and amplitude characteristics. Formally, this procedure defines a mapping , where is the original segment length (which may vary for each segment) and d is a predefined constant dimension. The resulting feature vector resides in a low-dimensional Euclidean space, allowing consistent representation and meaningful comparison across segments. To implement , we employ interpolation (e.g., linear or cubic spline) to resample each segment to a standard reference length, followed by normalization (e.g., z-score or min-max) to remove amplitude bias. The resampled signals are then projected into a low-dimensional space using dimensionality reduction techniques such as the discrete cosine transform (DCT) or principal component analysis (PCA). This approach ensures both shape preservation and dimensional consistency, which are critical for clustering-based leakage classification.
- Feature Fusion: To leverage the complementary leakage information contained in power and EM signals, we perform feature-level fusion after segment-wise compression. Specifically, we concatenate the compressed feature vectors from both modalities to form a unified multi-modal representation for each segment. This approach combines the spatial sensitivity of EM measurements with the temporal and aggregate characteristics captured by power traces, thereby enhancing the overall discriminative capability of the features.While the fusion method adopted here—vector concatenation—is relatively simple, it effectively preserves modality-specific patterns and aligns well with the input requirements of downstream clustering algorithms. More sophisticated fusion strategies, such as attention-based weighting or joint embedding learning, may further improve performance and are left for future exploration.
- Unsupervised Clustering: To identify patterns in the fused multi-modal features without requiring labeled training data, we apply an unsupervised clustering algorithm—typically K-means—to group segments exhibiting similar leakage behavior. Each resulting cluster is expected to correspond to a class of intermediate cryptographic operations (e.g., Hamming weights of SubBytes outputs).This clustering step enables fully unsupervised key recovery in settings with low signal-to-noise ratios and temporal desynchronization. The cluster assignments serve as surrogates for true leakage classes, allowing the attacker to compute statistical correlations between predicted leakage models (e.g., Hamming weight of SBox outputs) and the observed cluster indices. By scoring these correlations across different key hypotheses, the correct key byte can be recovered without any profiling phase or supervised labels.
Figure 2 illustrates the complete methodology. From left to right, it shows the hardware setup, signal acquisition, trace alignment, and statistical evaluation leading to key recovery. This pipeline integrates hardware measurements with unsupervised clustering to exploit multimodal leakage sources.

Figure 2.
Overview of the proposed analysis framework. (Left) AES-128 encryption is triggered externally and measured using synchronized dual-channel acquisition. (Middle) Sample traces from the power channel showing distinguishable leakage features. (Right) Key hypothesis evaluation based on the correlation between predicted leakage and observed clustering output. The correct key produces a sharp correlation peak.
3.2. Joint Peak-Based Segmentation
Precise temporal segmentation of side-channel traces plays a fundamental role in isolating cryptographic operations and enhancing the effectiveness of subsequent leakage analysis. However, in real-world measurements, variations in clock jitter, analog noise, and asynchronous hardware execution often lead to temporal misalignment of key operations, making fixed-offset segmentation unreliable. To address this issue, we propose a joint peak-based segmentation strategy that adaptively detects operation boundaries by leveraging the complementary characteristics of power and EM signals.
Single-modality segmentation methods often fail under noisy or masked conditions, where the signal amplitude or derivative may be suppressed or distorted. Power and EM channels, however, exhibit different sensitivities to switching activity and spatial leakage sources. Therefore, exploiting both modalities in a cooperative fashion allows us to capture transitions with higher confidence and resilience to modality-specific interference.
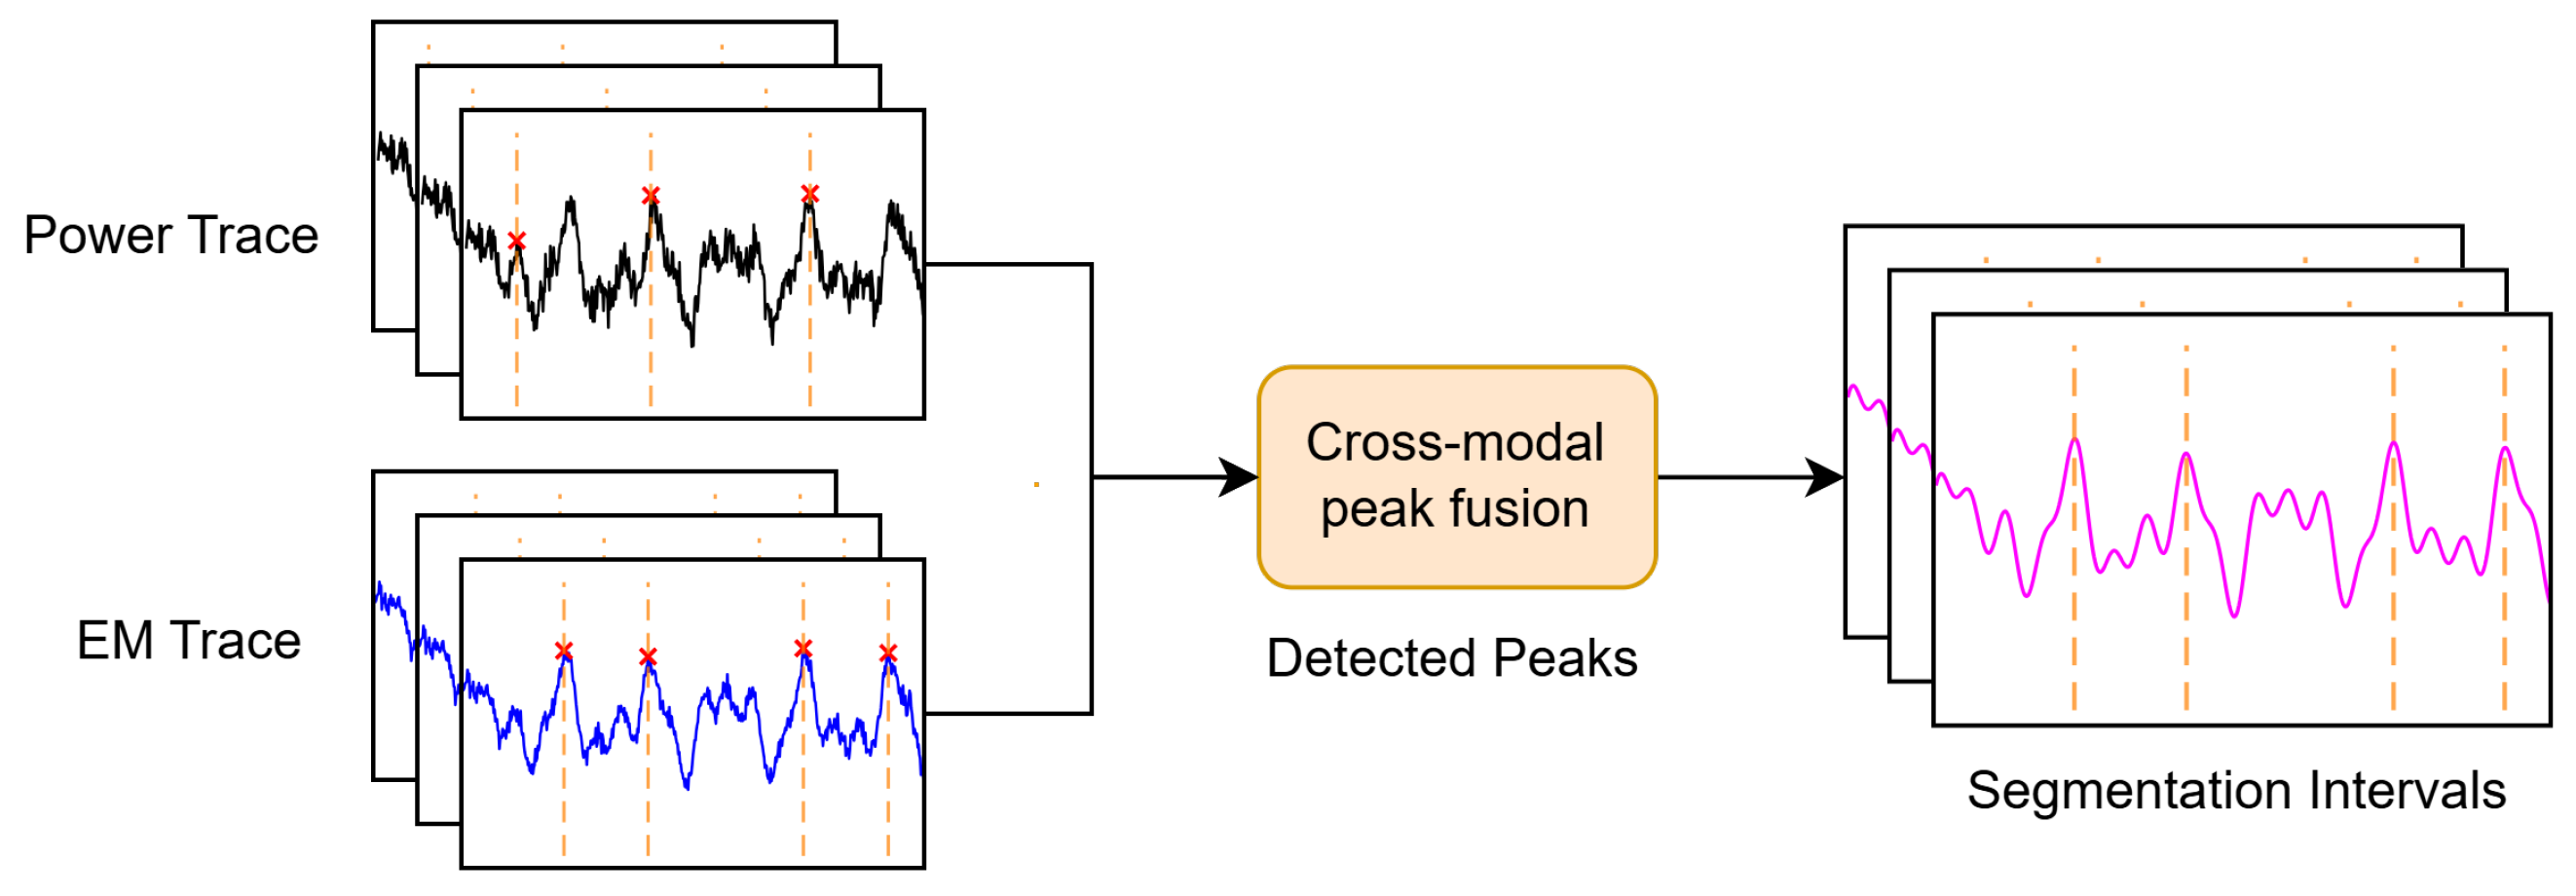
Figure 3 visually summarizes the proposed joint segmentation pipeline, showing the power and EM waveforms with detected peaks overlaid and the resulting segmentation intervals.
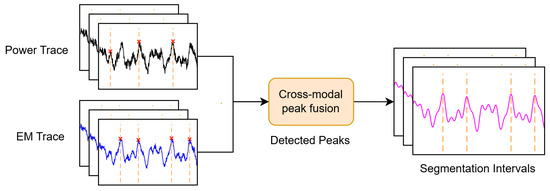
Figure 3.
Illustration of the proposed joint peak-based segmentation. Peaks (red crosses) are detected by observing gradients in both power and EM traces (black and blue curves), followed by cross-modal fusion (magenta curves). The resulting segments (orange vertical dashed lines) are used for subsequent analysis.
Let each trace be represented as a synchronized pair of time series , where and denote power and EM signal values at time t, respectively. A time index is classified as a candidate transition point if it satisfies:
where and are dynamic thresholds derived independently for each modality to adapt to local signal characteristics, and the thresholds and are based on the sample standard deviation of the first-order signal differences, i.e., .
These thresholds are computed as:
Here, and represent the standard deviation of the first-order differences (i.e., gradients) of the respective signals within a sliding window, and is a tunable sensitivity coefficient (empirically chosen, e.g., ) that regulates the peak detection strictness.
To robustly determine transition points, peaks must exhibit consistent behavior across both modalities. We enforce the following fusion constraints:
- Temporal Agreement: A peak is only retained if corresponding peaks appear in both power and EM signals within a tolerance window , and peak pairs are selected only if their temporal difference is within this threshold.
- Prominence Filtering: Among temporally matched peaks, a combined prominence score is calculated using the Euclidean norm of the signal gradients:where and are the gradient magnitudes at the matched peak locations in the power and EM signals, respectively. This score reflects the overall transition intensity across both modalities and is used to rank peak pairs during selection. Peaks are then sorted by descending prominence before selection. This ensures that the most significant signal transitions are prioritized, even in noisy settings.
- Minimum Peak Spacing: To avoid redundant or overly dense segment boundaries, we impose a minimum temporal distance between any two accepted peaks. Only peaks that are sufficiently distant from previously selected ones are added to the final list.
The peak detection and fusion process is formally described in Algorithm 1, which consists of four main steps: derivative estimation, adaptive thresholding, single-modality peak detection, and cross-modal peak fusion.
Complexity Analysis: For each trace of length T, computing first-order differences and standard deviation requires operations per modality. The cross-modal peak matching step runs in time, where M is the number of candidate peaks and is the fusion tolerance window. Sorting candidate peaks by prominence incurs complexity, while enforcing minimum spacing constraints is performed in linear time . Thus, the overall time complexity per trace is bounded by .
The final set of fused peak indices delineates boundaries between operational regions in the trace. Each segment corresponds to a candidate atomic operation (e.g., SBox substitution, XOR, or MixColumns). These segments are subsequently passed to the isometric compression module for normalization and alignment, forming the input for unsupervised feature extraction and clustering.
| Algorithm 1 Joint peak-based segmentation algorithm. |
| Require: Power trace , EM trace , gradient window length N, temporal tolerance , spacing threshold Ensure: Fused peak indices
|
3.3. Isometric Compression of Variable-Length Segments
In side-channel signal analysis, each segment delineated by successive peaks typically corresponds to a distinct cryptographic operation (e.g., one AES round or sub-operation). However, due to inherent timing jitter, instruction-level parallelism, and microarchitectural noise, the temporal lengths of these segments—denoted as —vary considerably across different traces and executions. This variability poses significant challenges for downstream processing tasks such as feature extraction, classification, or statistical leakage detection, which often require input data of uniform dimensionality.
To overcome this inconsistency while preserving the essential leakage characteristics, we introduce an isometric compression operator , which maps each variable-length segment to a fixed-dimensional vector , with . Formally, this transformation is defined as:
The operator is designed to preserve the structural integrity and discriminative content of the original signal segment while compressing it into a low-dimensional embedding space suitable for subsequent analysis. To this end, the compression process comprises the following sequential steps:
- Interpolation: Each segment is first resampled to a standard reference length L using linear or cubic spline interpolation. This step aligns all segments in a common temporal frame, mitigating the effect of temporal distortion.
- Normalization: The interpolated segment is normalized to remove amplitude scale variations. Typical normalization schemes include z-score normalization or min-max scaling, ensuring statistical comparability across segments.
- Dimensionality Reduction: The normalized, length-aligned signal is then projected into a lower-dimensional subspace of dimension d, where . We consider two principal approaches for this step:
- Discrete Cosine Transform (DCT): Captures the most relevant spectral components, preserving energy concentration in a few low-frequency coefficients.
- Principal Component Analysis (PCA): Learns a basis that maximizes variance across the segment set, projecting each signal onto the top d principal components.
This design ensures that is both isometric (in the sense of preserving relevant shape and energy patterns) and compressive (reducing redundancy and dimensionality). Moreover, the compressed representations are now amenable to uniform treatment by machine learning models or statistical tests, facilitating robust leakage detection and key recovery under realistic noise and desynchronization conditions.
To formalize this procedure, we present Algorithm 2, which summarizes the entire isometric compression process, including interpolation, normalization, and dimensionality reduction.
Complexity Analysis: For each segment, interpolation to length L takes ; normalization takes ; DCT or PCA projection to dimension d takes or . Thus, total per-segment complexity is .
This comprehensive visual evidence confirms the efficacy of our method in the following ways:
- Unifying segment length and scale through interpolation and normalization;
- Preserving discriminative structure via spectral embedding;
- Enabling consistent low-dimensional representation across cryptographic operations with naturally varying durations.
| Algorithm 2 Isometric compression of variable-length segments. |
| Require: Raw segments , where , compression length d Ensure: Compressed feature vectors
|
These findings directly support the design rationale of the isometric compression operator, providing a strong foundation for its integration into downstream tasks such as clustering, classification, or statistical leakage detection.
3.4. Multi-Modal Feature Fusion
To fully exploit the complementary leakage characteristics of power and EM signals, we perform feature-level fusion after segment-wise compression. Let and denote the compressed feature vectors derived from power and EM traces, respectively. These vectors are aligned in time and dimensionally consistent due to prior preprocessing and compression steps (e.g., via DCT or PCA). The fused representation is obtained through vector concatenation:
where ‖ denotes the concatenation operation. This simple yet effective strategy combines the amplitude, spectral, and temporal information encoded in both signal modalities. The intuition is that while power traces generally capture global switching activity, EM traces are more sensitive to local current variations, thus offering richer microarchitectural leakage.
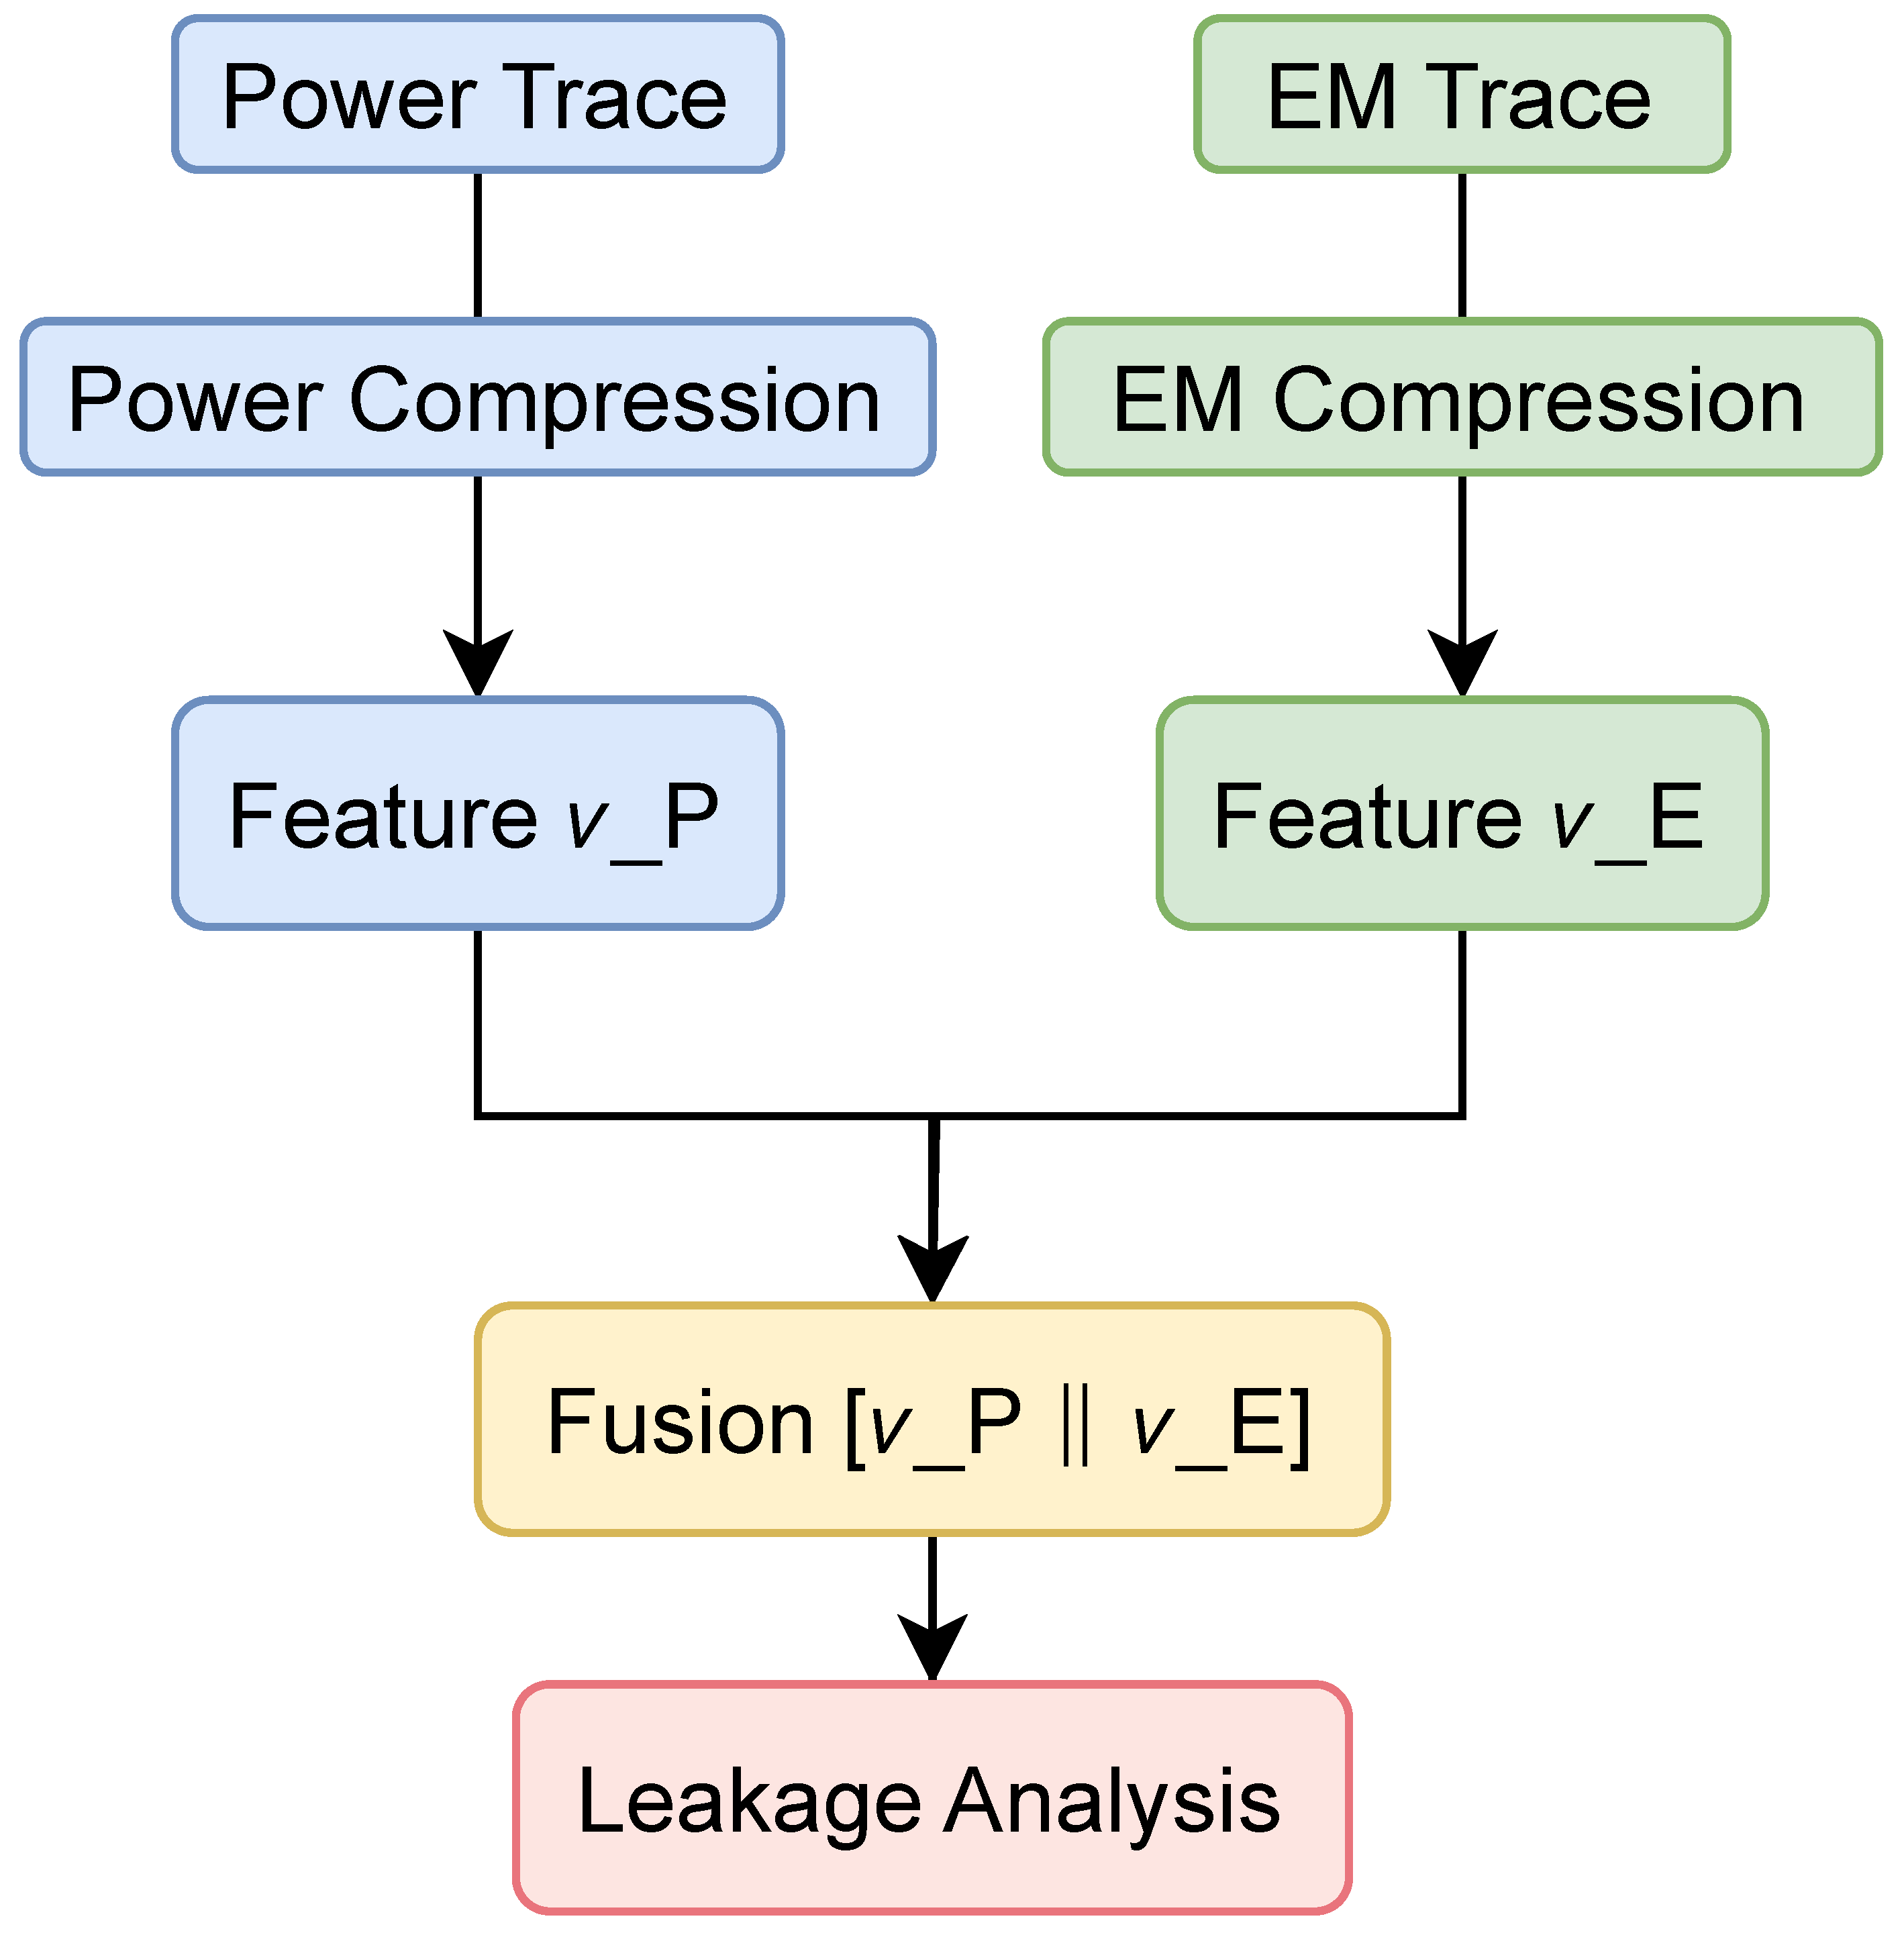
The entire fusion pipeline is depicted in Figure 4, where signal compression, normalization, and fusion operations are systematically integrated before downstream leakage analysis.
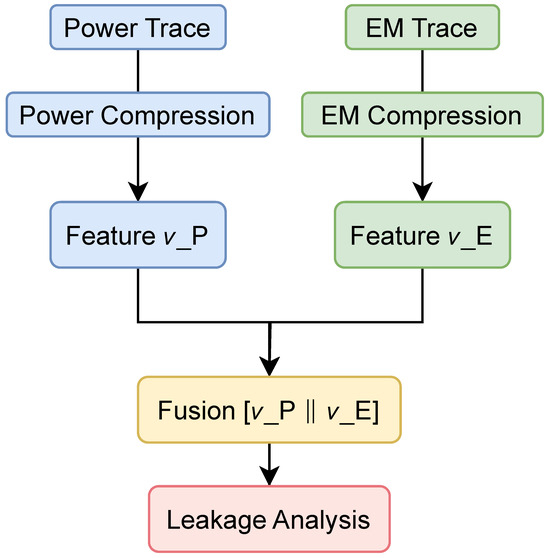
Figure 4.
Multi-modal feature fusion pipeline. Each modality is first compressed to a low-dimensional representation, then concatenated to form the fused vector , which is used for leakage detection or key recovery.
To operationalize the above process, we summarize the fusion procedure in Algorithm 3. This modular design ensures extensibility to more than two modalities or to advanced fusion strategies such as attention-based weighting or joint embedding spaces.
Complexity Analysis: Concatenation of two vectors of length and is . If normalization is applied prior to fusion, total complexity remains linear in feature dimension.
The fused features are then passed to downstream analysis modules, such as leakage point detection, unsupervised clustering, or supervised classification.
| Algorithm 3 Multi-modal feature fusion. |
| Require: Compressed power vector , compressed EM vector Ensure: Fused feature vector
|
3.5. Clustering-Based Key Recovery for AES
The approach leverages fused multi-modal features derived from both power and EM traces, enabling the unsupervised inference of intermediate values such as SubBytes outputs, which are critical for key extraction.
Let denote the fused feature vector extracted from the i-th side-channel trace segment, typically aligned with the first-round SubBytes operation. The full dataset is denoted by:
To group traces with similar leakage characteristics, we apply the K-means algorithm to partition the dataset into K clusters by minimizing the intra-cluster variance:
Here, is the centroid of the k-th cluster, and is the cluster assignment for the i-th trace. The value of K is selected based on the assumed leakage model: 9 for Hamming weight (HW) classes or 16 for raw SubBytes outputs.
In AES, the SubBytes output for the i-th trace is determined by:
where is the known plaintext byte and K is the unknown key byte. Under the Hamming weight leakage model, the side-channel leakage is approximated by:
where denotes noise. Because is not directly observable, we use the cluster assignment as a surrogate for leakage class. For each key hypothesis , the corresponding predicted Hamming weights are computed as:
We then evaluate a correlation-based score between predicted leakages and cluster labels:
The key byte with the highest score is selected as the most likely candidate:
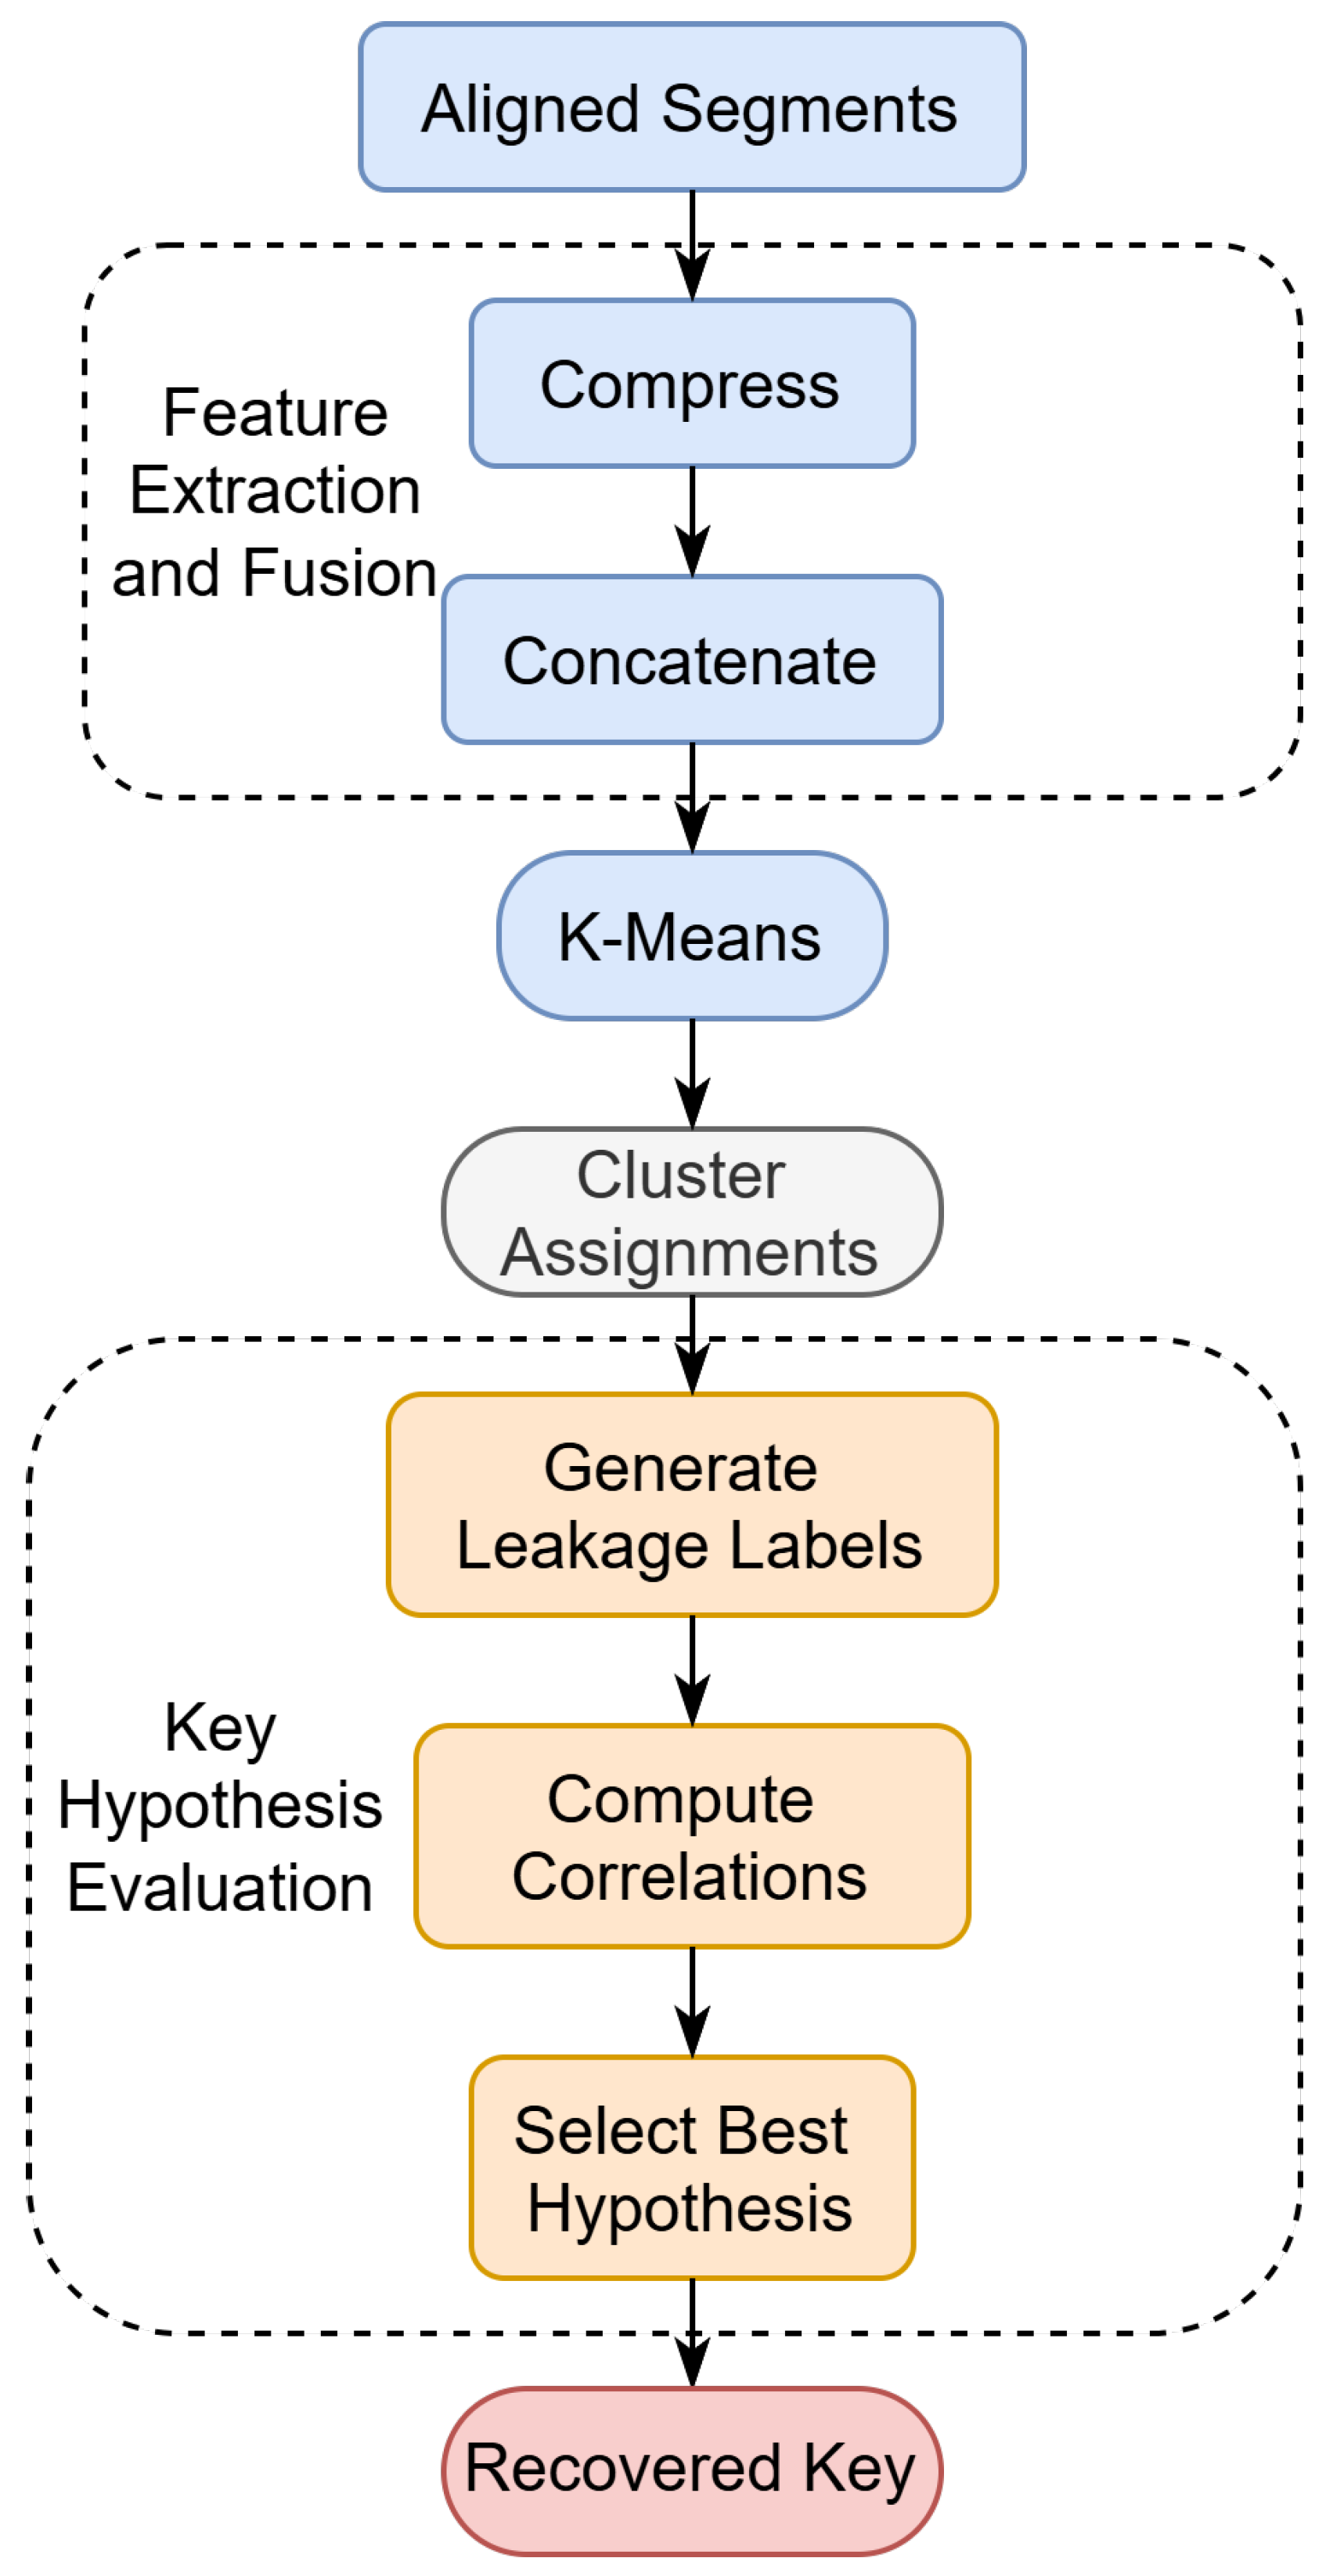
The complete unsupervised recovery pipeline is summarized in Algorithm 4. It includes three primary stages: feature compression and fusion, clustering, and key hypothesis evaluation.
Complexity Analysis: Given N fused feature vectors of dimension d, K-means clustering has a typical complexity of where I is the number of iterations. Correlation-based key scoring for 256 key candidates takes . Thus, the total recovery complexity is .
| Algorithm 4 Unsupervised AES key recovery via multi-modal clustering. |
| Require: Aligned segments (power and EM), known plaintexts , cluster number K ▹ Number of clusters (e.g., 9 or 16) Ensure: Estimated key byte Step 1: Feature Extraction and Fusion
|
The complete recovery pipeline is illustrated in Figure 5. It visually outlines the three stages of our method, emphasizing the interaction between fused multi-modal features, clustering, and key hypothesis scoring. This process enables unsupervised inference of key-dependent transformations without requiring labeled traces.
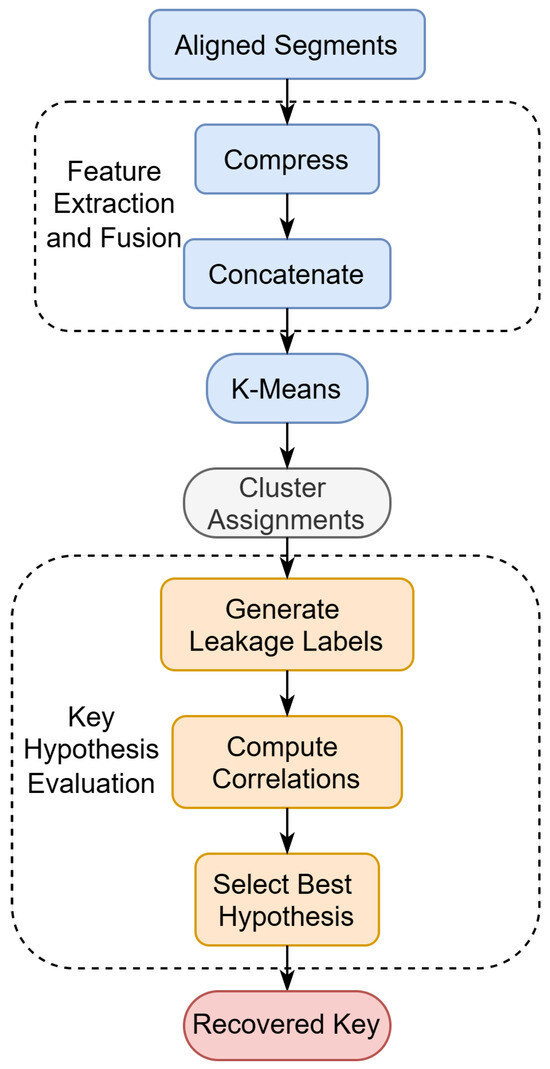
Figure 5.
Flowchart of the unsupervised AES key recovery procedure. The method consists of three main stages: (1) feature compression and fusion from power and EM signals, (2) clustering to identify leakage classes, and (3) hypothesis evaluation to extract the key byte with the highest correlation.
4. Experimental Setup
To validate the proposed multi-modal side-channel analysis framework, we conducted experiments on a custom hardware platform based on the Digilent Nexys 4 DDR development board, which integrates a Xilinx Artix-7 FPGA.
4.1. Target Implementation
We implement the AES-128 encryption core on a Digilent Nexys 4 DDR development board, which integrates a Xilinx Artix-7 XC7A100T FPGA. The encryption circuit operates at a fixed clock frequency of 20 MHz and is designed without any countermeasures such as masking or shuffling. A fixed 128-bit secret key is hard-coded into the FPGA logic, and the device receives plaintexts from a host PC via UART serial communication. Each encryption operation is externally triggered by a GPIO pulse, which also serves as the acquisition trigger for measurement equipment.
To facilitate side-channel signal capture, the board is configured for dual-channel acquisition. Power consumption is monitored via a 10 shunt resistor inserted in the VDD line. Electromagnetic (EM) leakage is measured using a near-field H-field probe (Langer RF-U 5-2) positioned directly above a decoupling capacitor close to the cryptographic core. These two analog signals are simultaneously captured using a Tektronix MDO3104 oscilloscope at 5 GSa/s sampling rate.
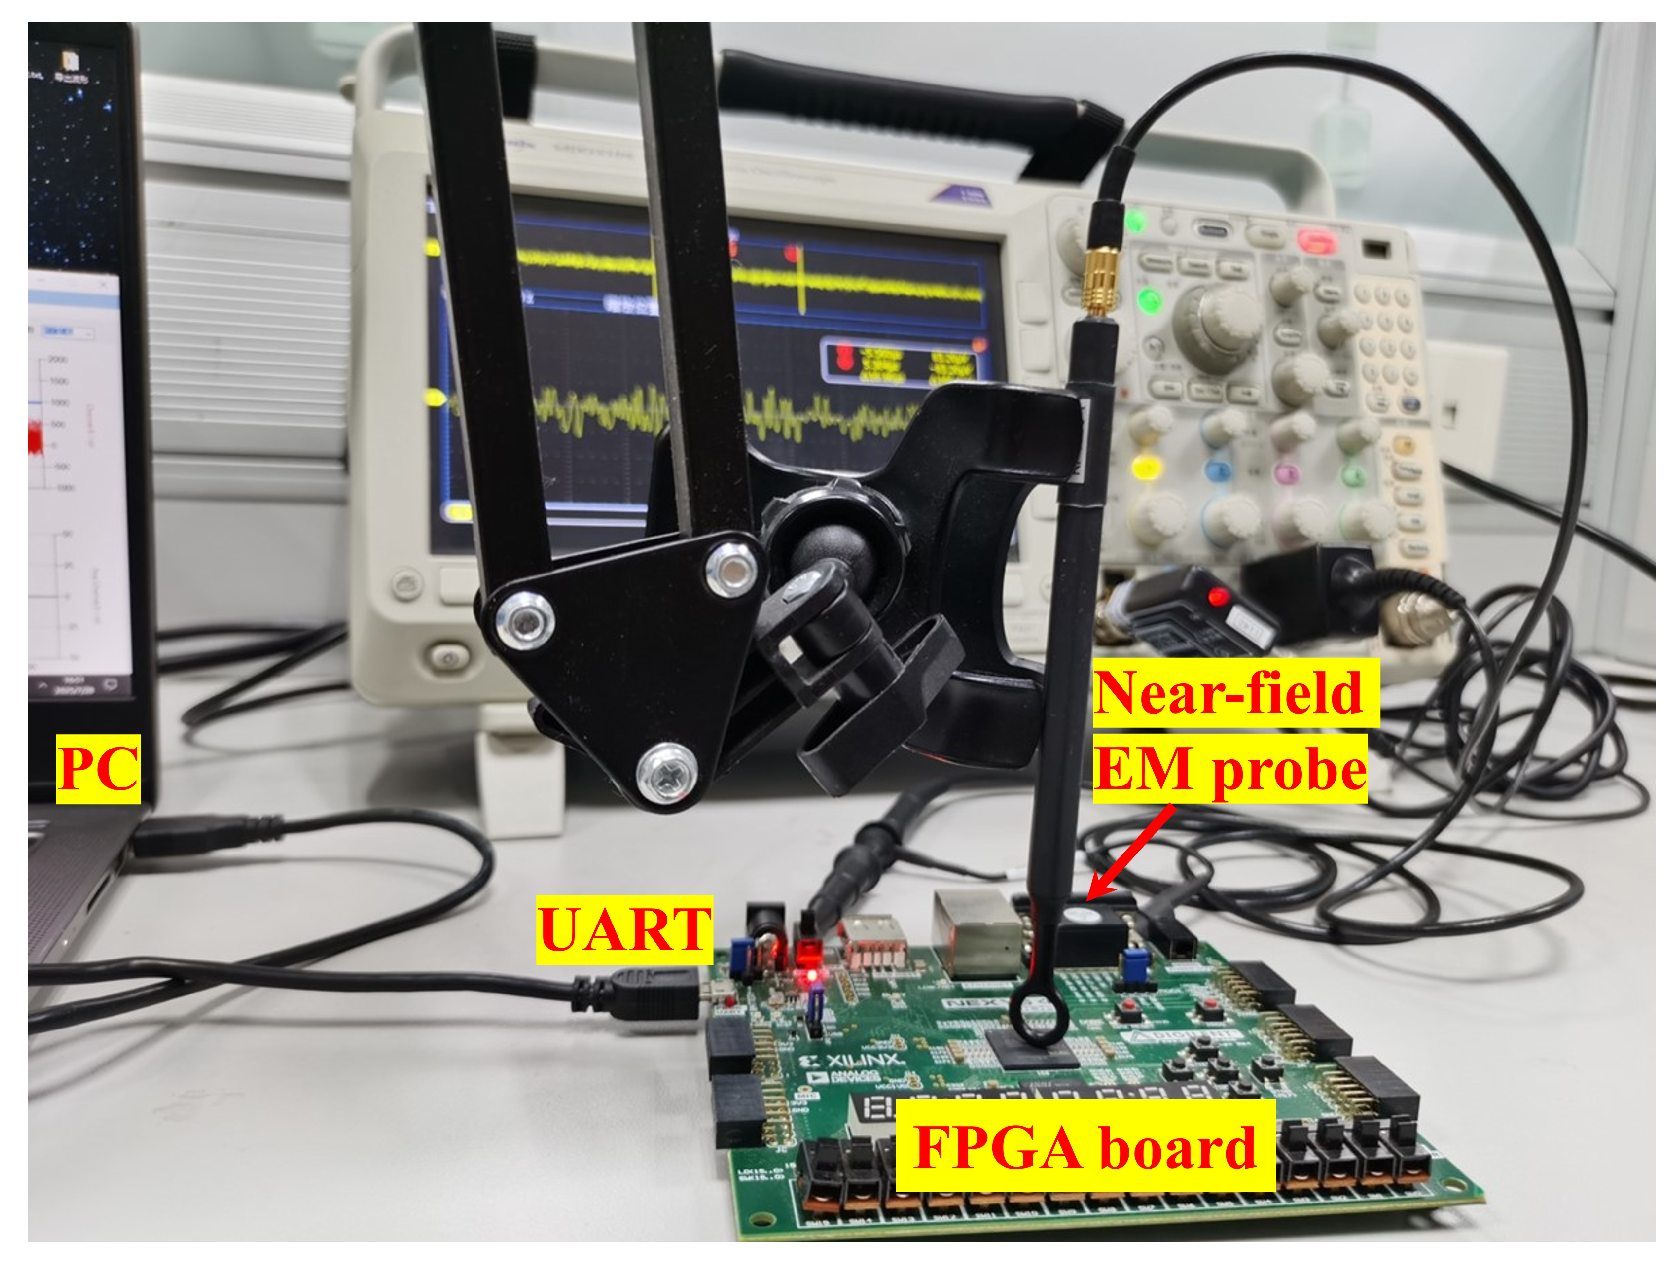
A photograph of the complete experimental setup is shown in Figure 6, highlighting key components including the PC, UART link, EM probe, and FPGA board. Although the term “electromagnetic” may refer to both electric and magnetic field emissions, in this work, EM specifically denotes near-field magnetic (H-field) leakage. Electric field (E-field) signals are not measured.
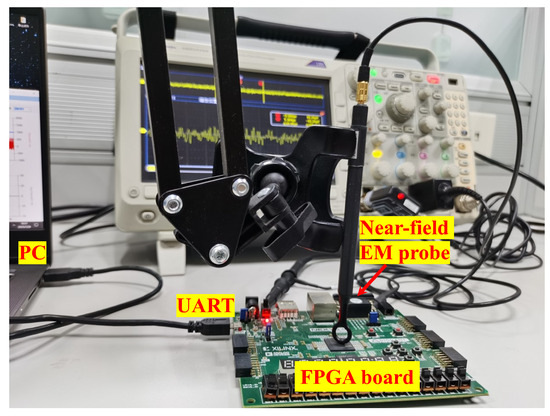
Figure 6.
Photograph of the experimental setup for side-channel signal acquisition. The near-field EM probe is placed above a decoupling capacitor on the FPGA board. The UART connection allows plaintext communication with the PC. Power consumption is monitored via a shunt resistor (not visible from this angle). Both signals are captured by a synchronized oscilloscope.
4.2. Dual-Channel Signal Acquisition
To capture both power and EM leakages, we employed a dual-channel acquisition strategy using a high-precision oscilloscope. The acquisition setup is synchronized via a common trigger, ensuring time alignment between power and EM signals. Both signals were sampled at 5 GSa/s with high bandwidth.
For the power measurement, a 10 shunt resistor was inserted into the VDD power path of the FPGA, and the voltage drop across it was measured to represent instantaneous power consumption.
The EM leakage was measured using a Langer RF-U 5-2 magnetic near-field probe positioned perpendicularly above a decoupling capacitor near the cryptographic core. The captured EM signal was amplified before being digitized. The full hardware and acquisition setup is summarized in Table 1.

Table 1.
Measurement instruments and key specifications for the power and electromagnetic (EM) channels.
4.3. Dataset Collection
A total of 30,000 random plaintexts were encrypted using the fixed AES-128 key. For each encryption, we simultaneously acquired one power trace and one EM trace, each consisting of 10,000 time samples. This resulted in a dual-channel dataset comprising 30,000 power traces and 30,000 EM traces. The leakage behavior for both channels is assumed to follow the Hamming distance model, which is widely used in the side-channel literature.
This dataset was used to evaluate the proposed segmentation, compression, fusion, and clustering-based key recovery methodology under realistic hardware noise and measurement conditions.
Each trace is first normalized using z-score standardization to account for amplitude variations and modality scaling differences. We then compute the average trace across all samples for each modality and apply joint peak detection to locate segment boundaries. These boundaries indicate likely cryptographic operations (e.g., SubBytes).
4.4. Analysis Pipeline
The proposed analysis pipeline comprises five core stages, designed to systematically process dual-channel side-channel traces and enable accurate key recovery under unsupervised settings.
First, joint peak-based segmentation is performed using the average power and EM traces to identify synchronization points. These peaks indicate potential cryptographic operations (e.g., SubBytes or MixColumns), and segmentation boundaries are chosen accordingly across both modalities to ensure temporal alignment.
Next, isometric compression is applied to the extracted segments. Each variable-length trace segment is resampled via interpolation and projected into a fixed-length vector using the discrete cosine transform (DCT), thereby preserving the structural characteristics of the original waveform while enabling uniform dimensionality across samples.
Following this, feature fusion is performed by concatenating the normalized features from both power and EM signals into a single multi-modal representation. This fused vector integrates complementary leakage components—global switching patterns from power and localized emissions from EM—enhancing the distinguishability of intermediate states.
Subsequently, unsupervised clustering is employed on the fused features. Specifically, the K-means algorithm (with K = 9 under the Hamming weight model) is used to group traces that exhibit similar leakage behavior. Each cluster ideally corresponds to a unique Hamming weight class of AES SBox outputs.
Finally, the key recovery stage involves correlating the cluster assignments with predicted leakage templates derived from known plaintexts and candidate key hypotheses. The key byte that produces the highest correlation is selected as the correct guess. This process is repeated independently for all 16 key bytes.
All experiments were conducted on a workstation equipped with an Intel i9 processor and 64 GB of RAM, and the entire pipeline was executed in under one minute for full AES key recovery.
5. Results and Discussion
In this section, we present a comprehensive evaluation of the proposed multi-modal side-channel analysis framework. The effectiveness of each processing stage and the overall key recovery performance are quantitatively assessed using real measurement data. In addition, we discuss comparative results through ablation studies and signal-to-noise ratio (SNR) analysis to demonstrate the benefits of signal fusion.
5.1. Experimental Setup
The experiments were conducted using an AES-128 hardware encryption device. A total of 5000 plaintexts were randomly generated and encrypted, with corresponding side-channel signals captured simultaneously from both power and EM channels. The captured traces are stored in Data_Pow.csv and Data_EM.csv, each containing 30,000 traces of 10,000 sampling points.
Preprocessing included denoising, normalization, and alignment. Following this, joint peak-based segmentation was applied to identify meaningful intervals corresponding to cryptographic operations.
5.2. Key Recovery Accuracy
The proposed framework achieves full key recovery in a non-profiling scenario by combining clustering and correlation-based validation. For each of the 16 key bytes, multi-modal feature vectors are clustered using K-means ( for Hamming weight model), and correlation with Hamming weight templates is computed.
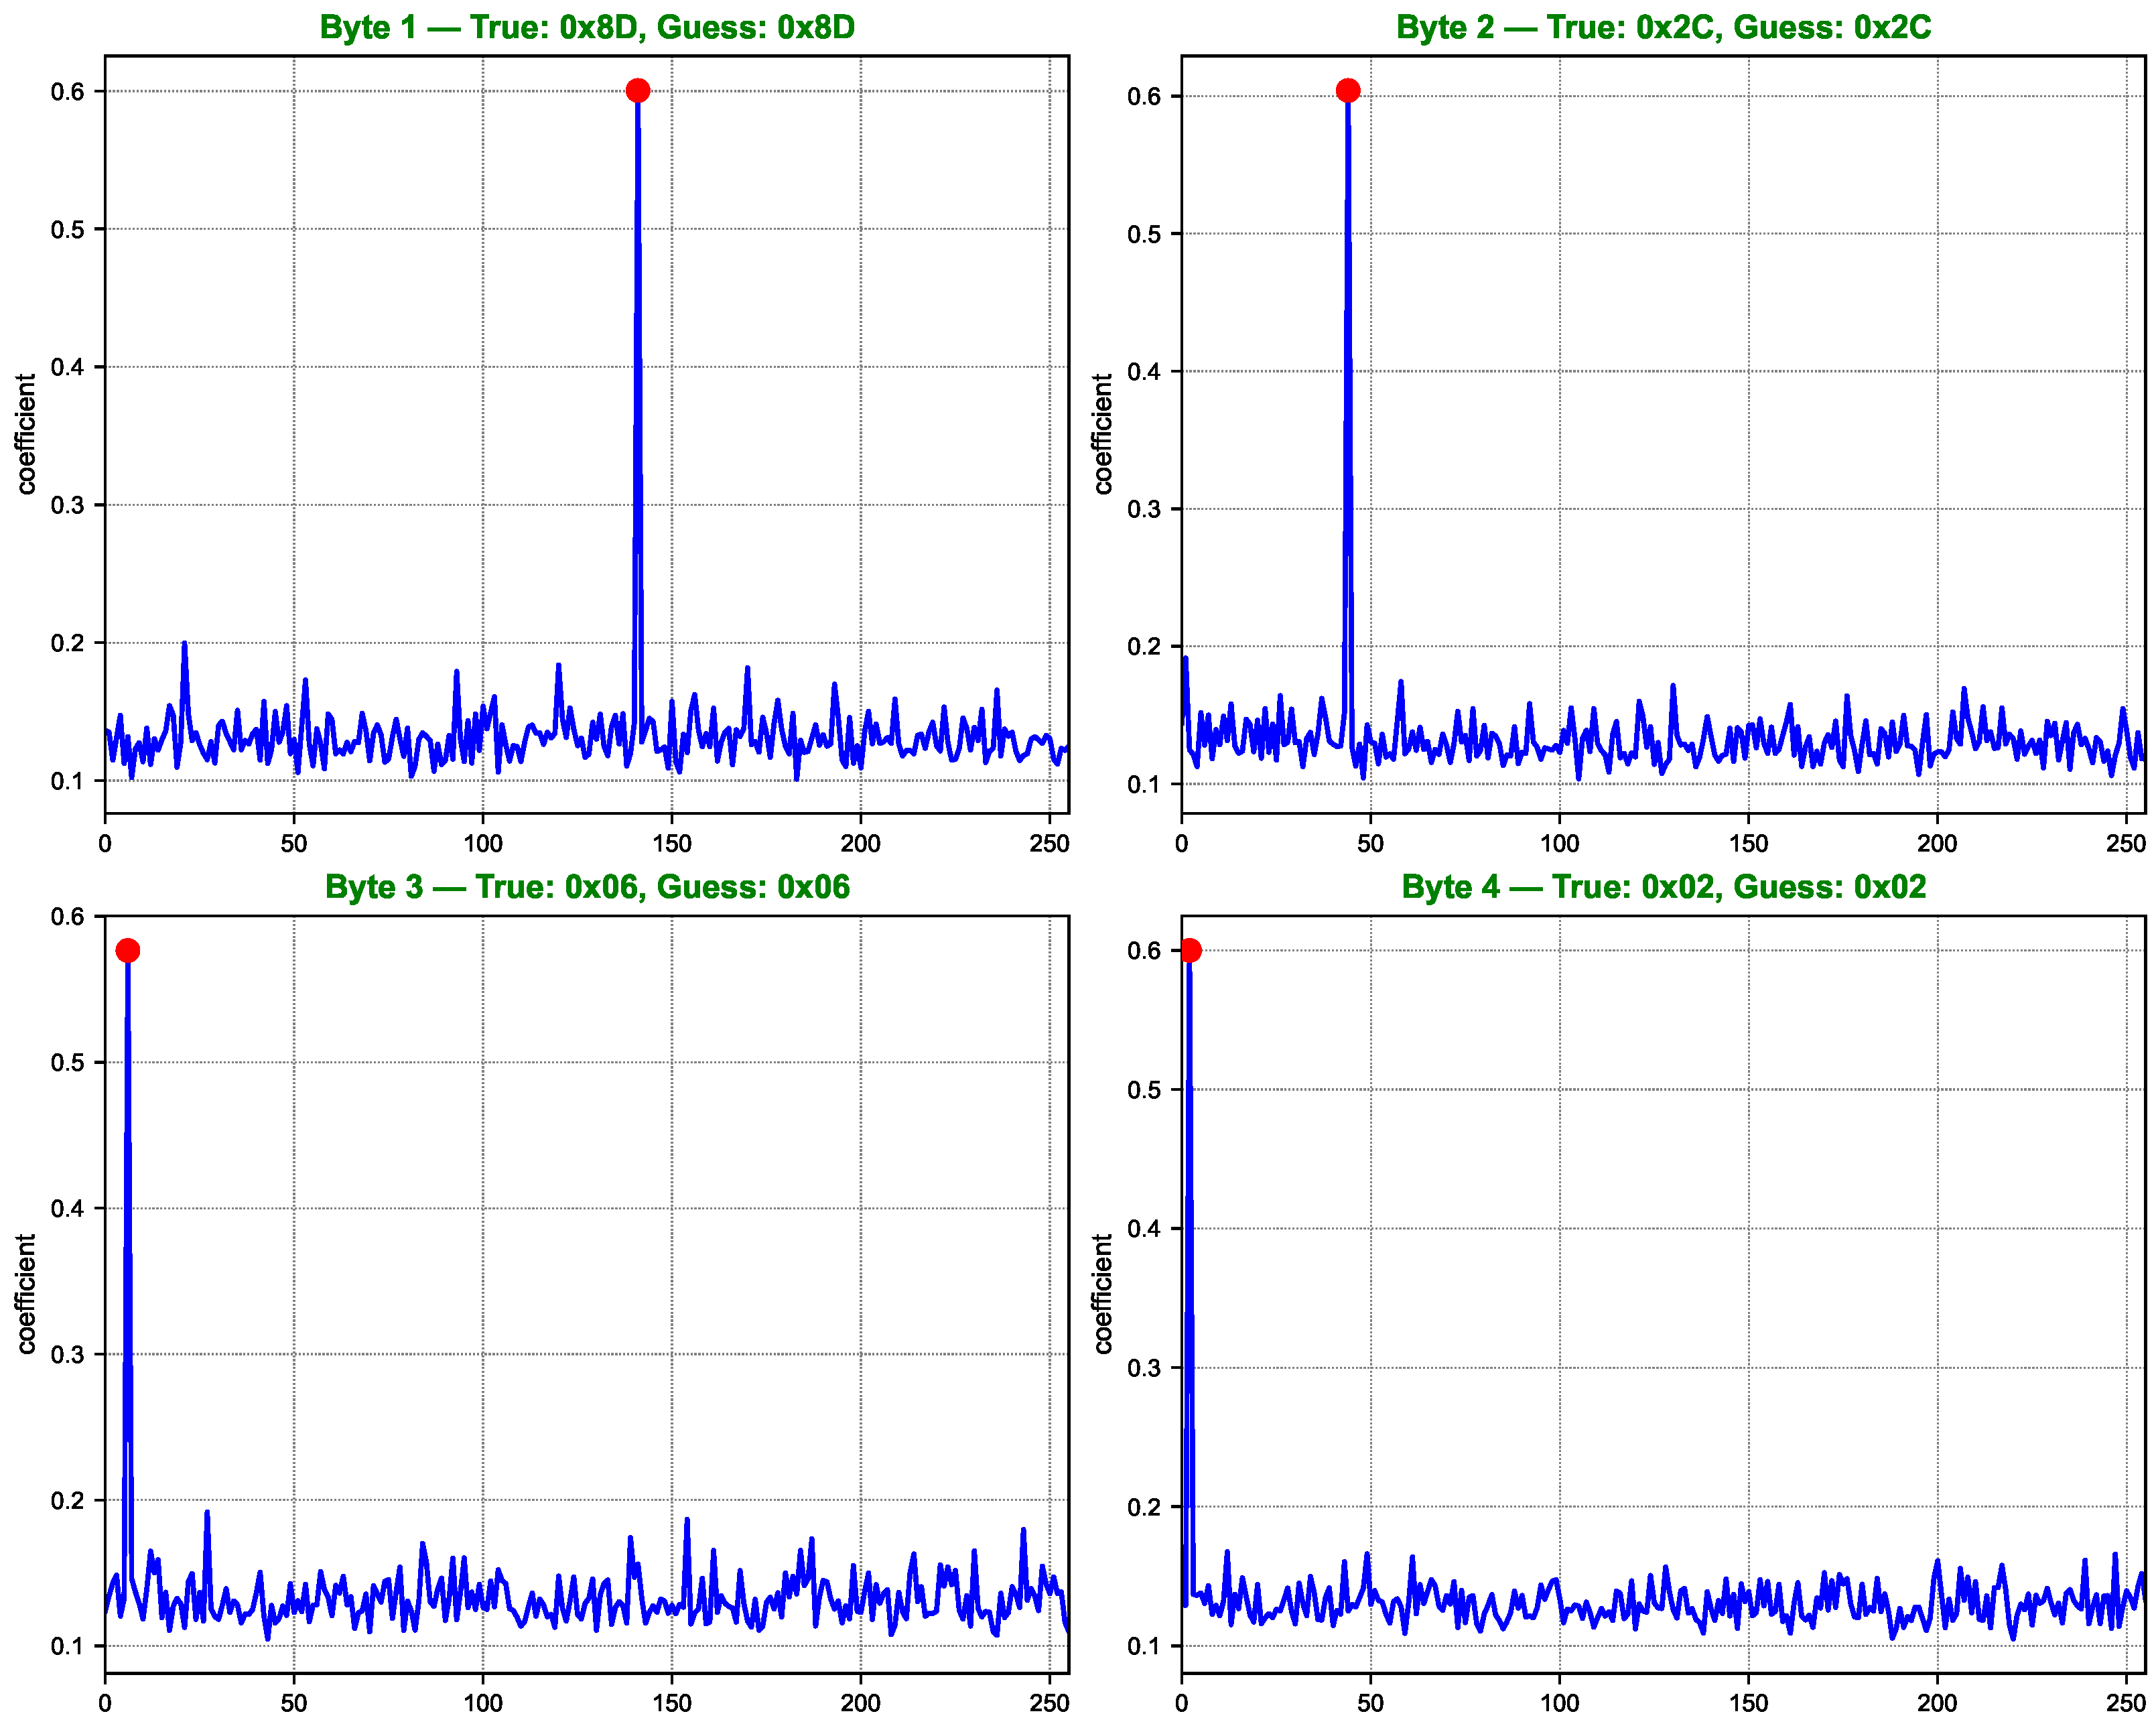
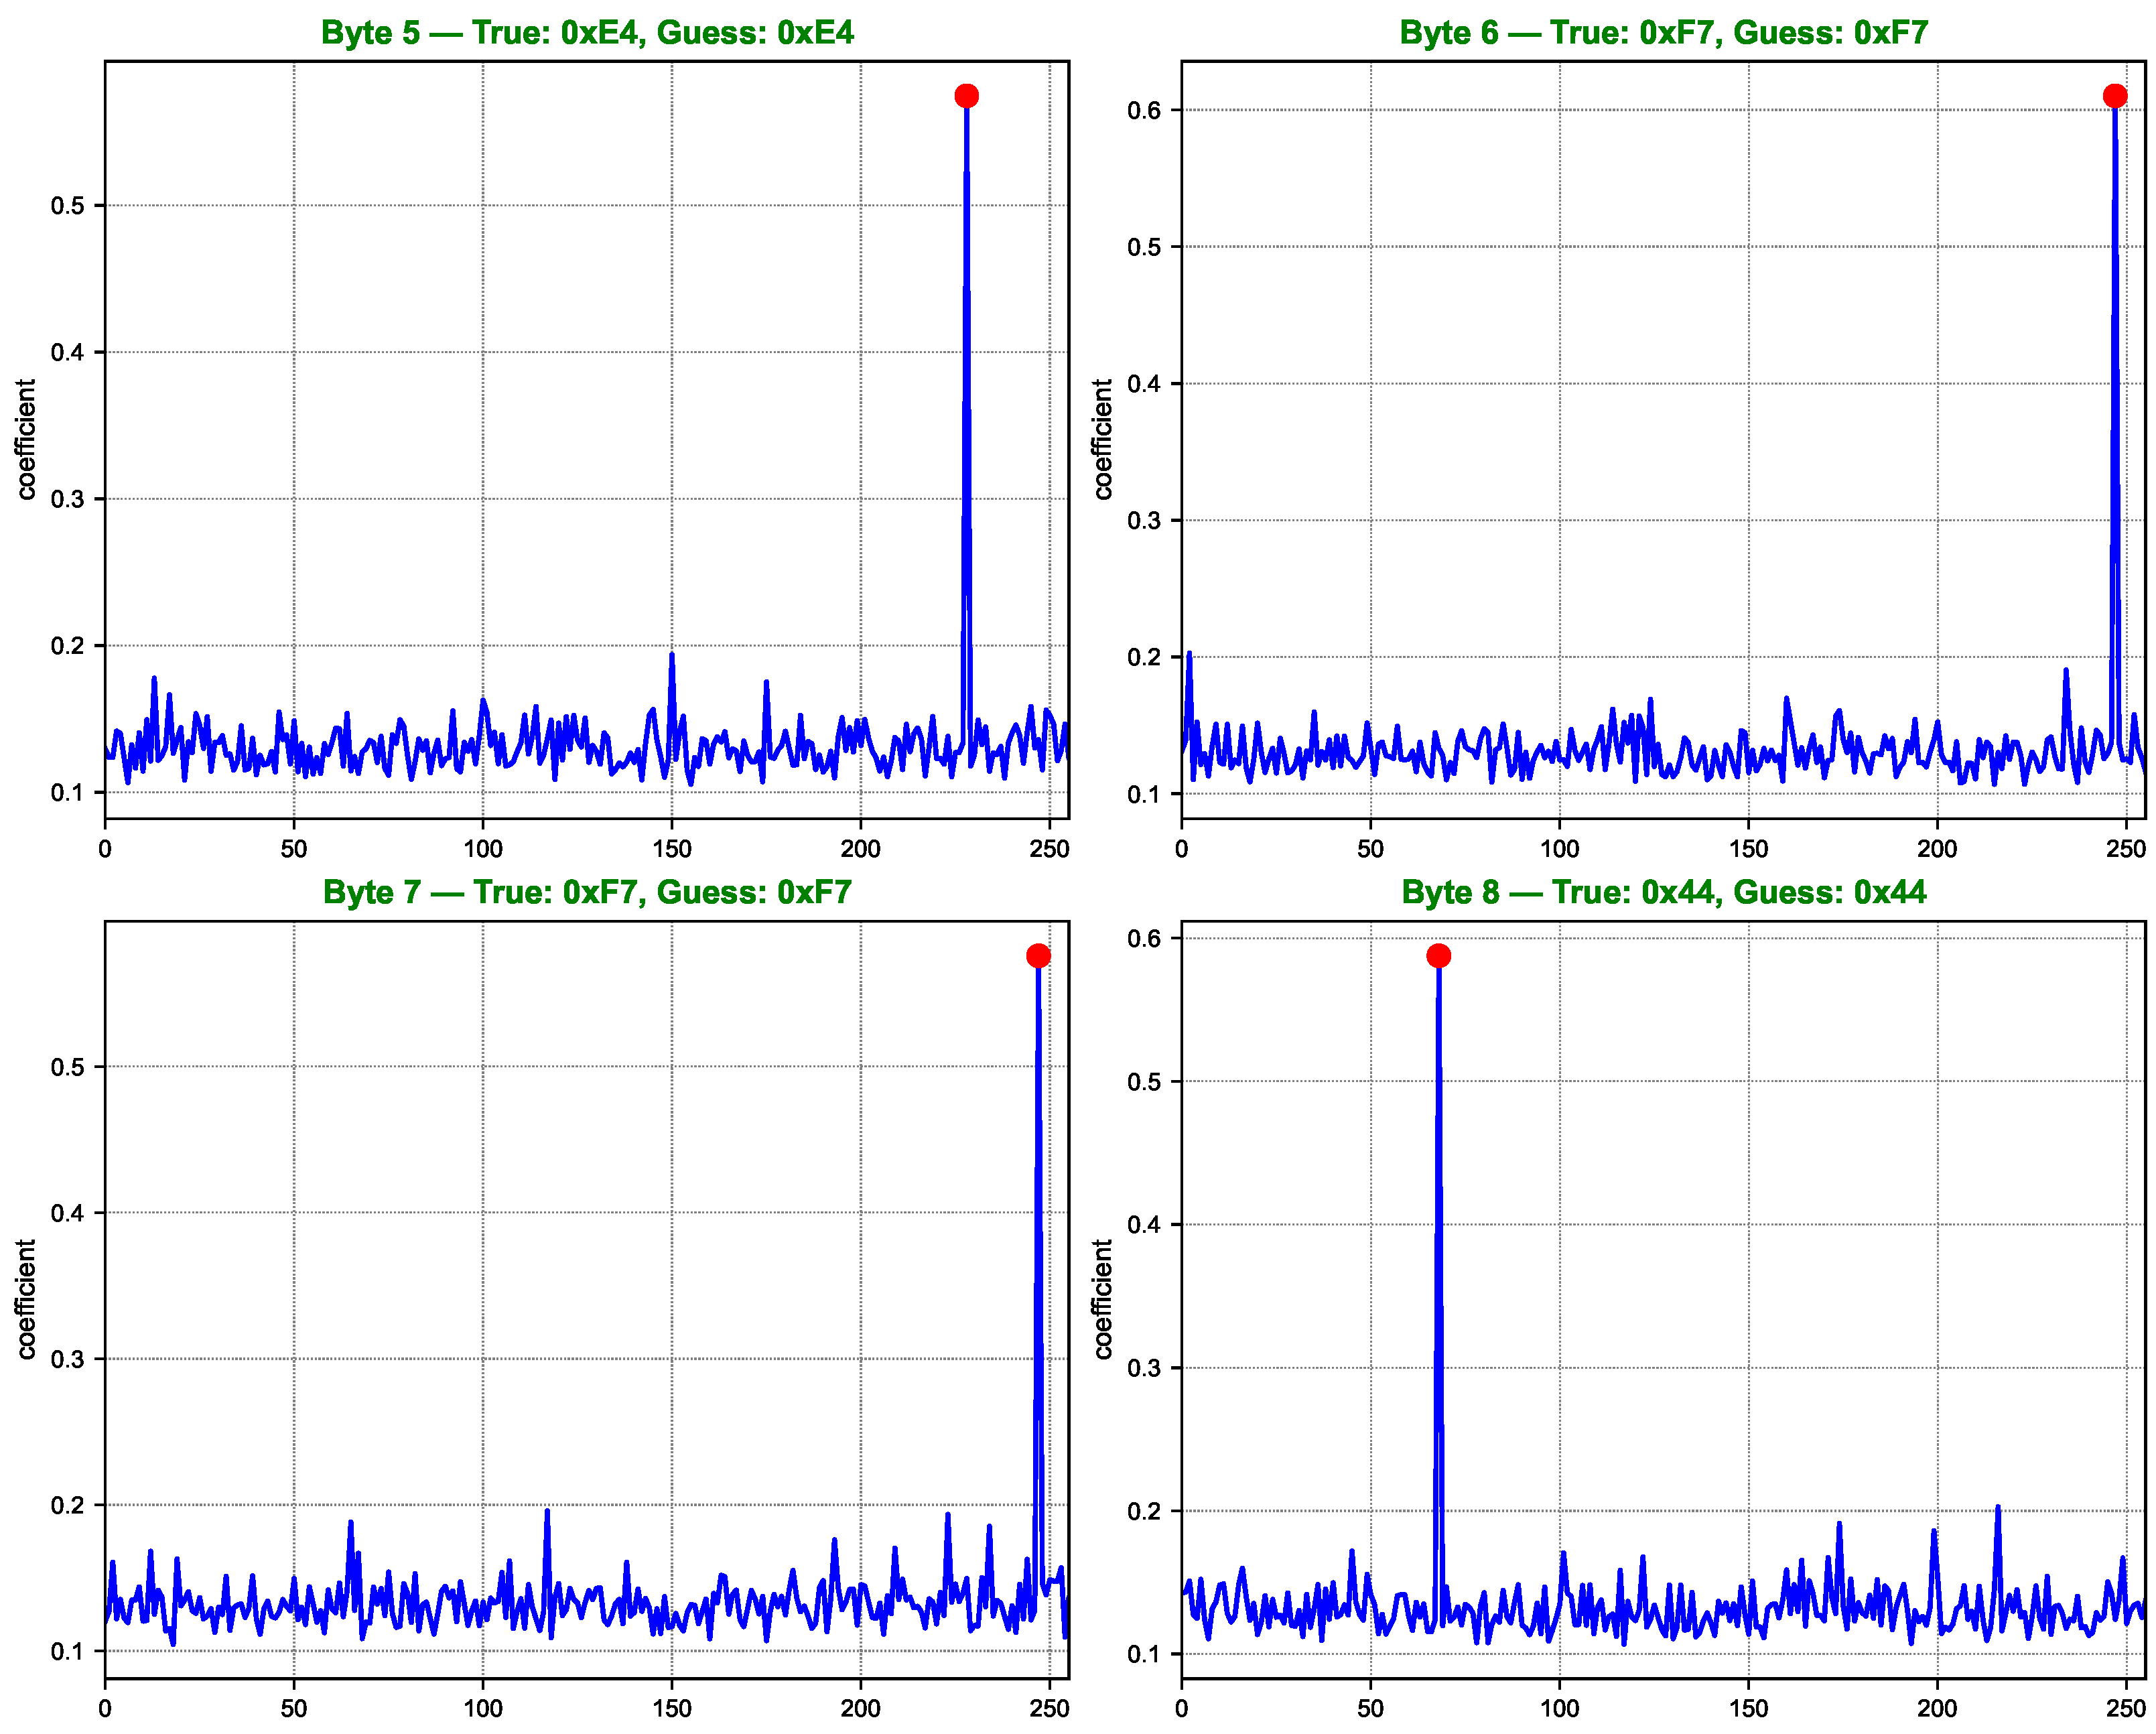
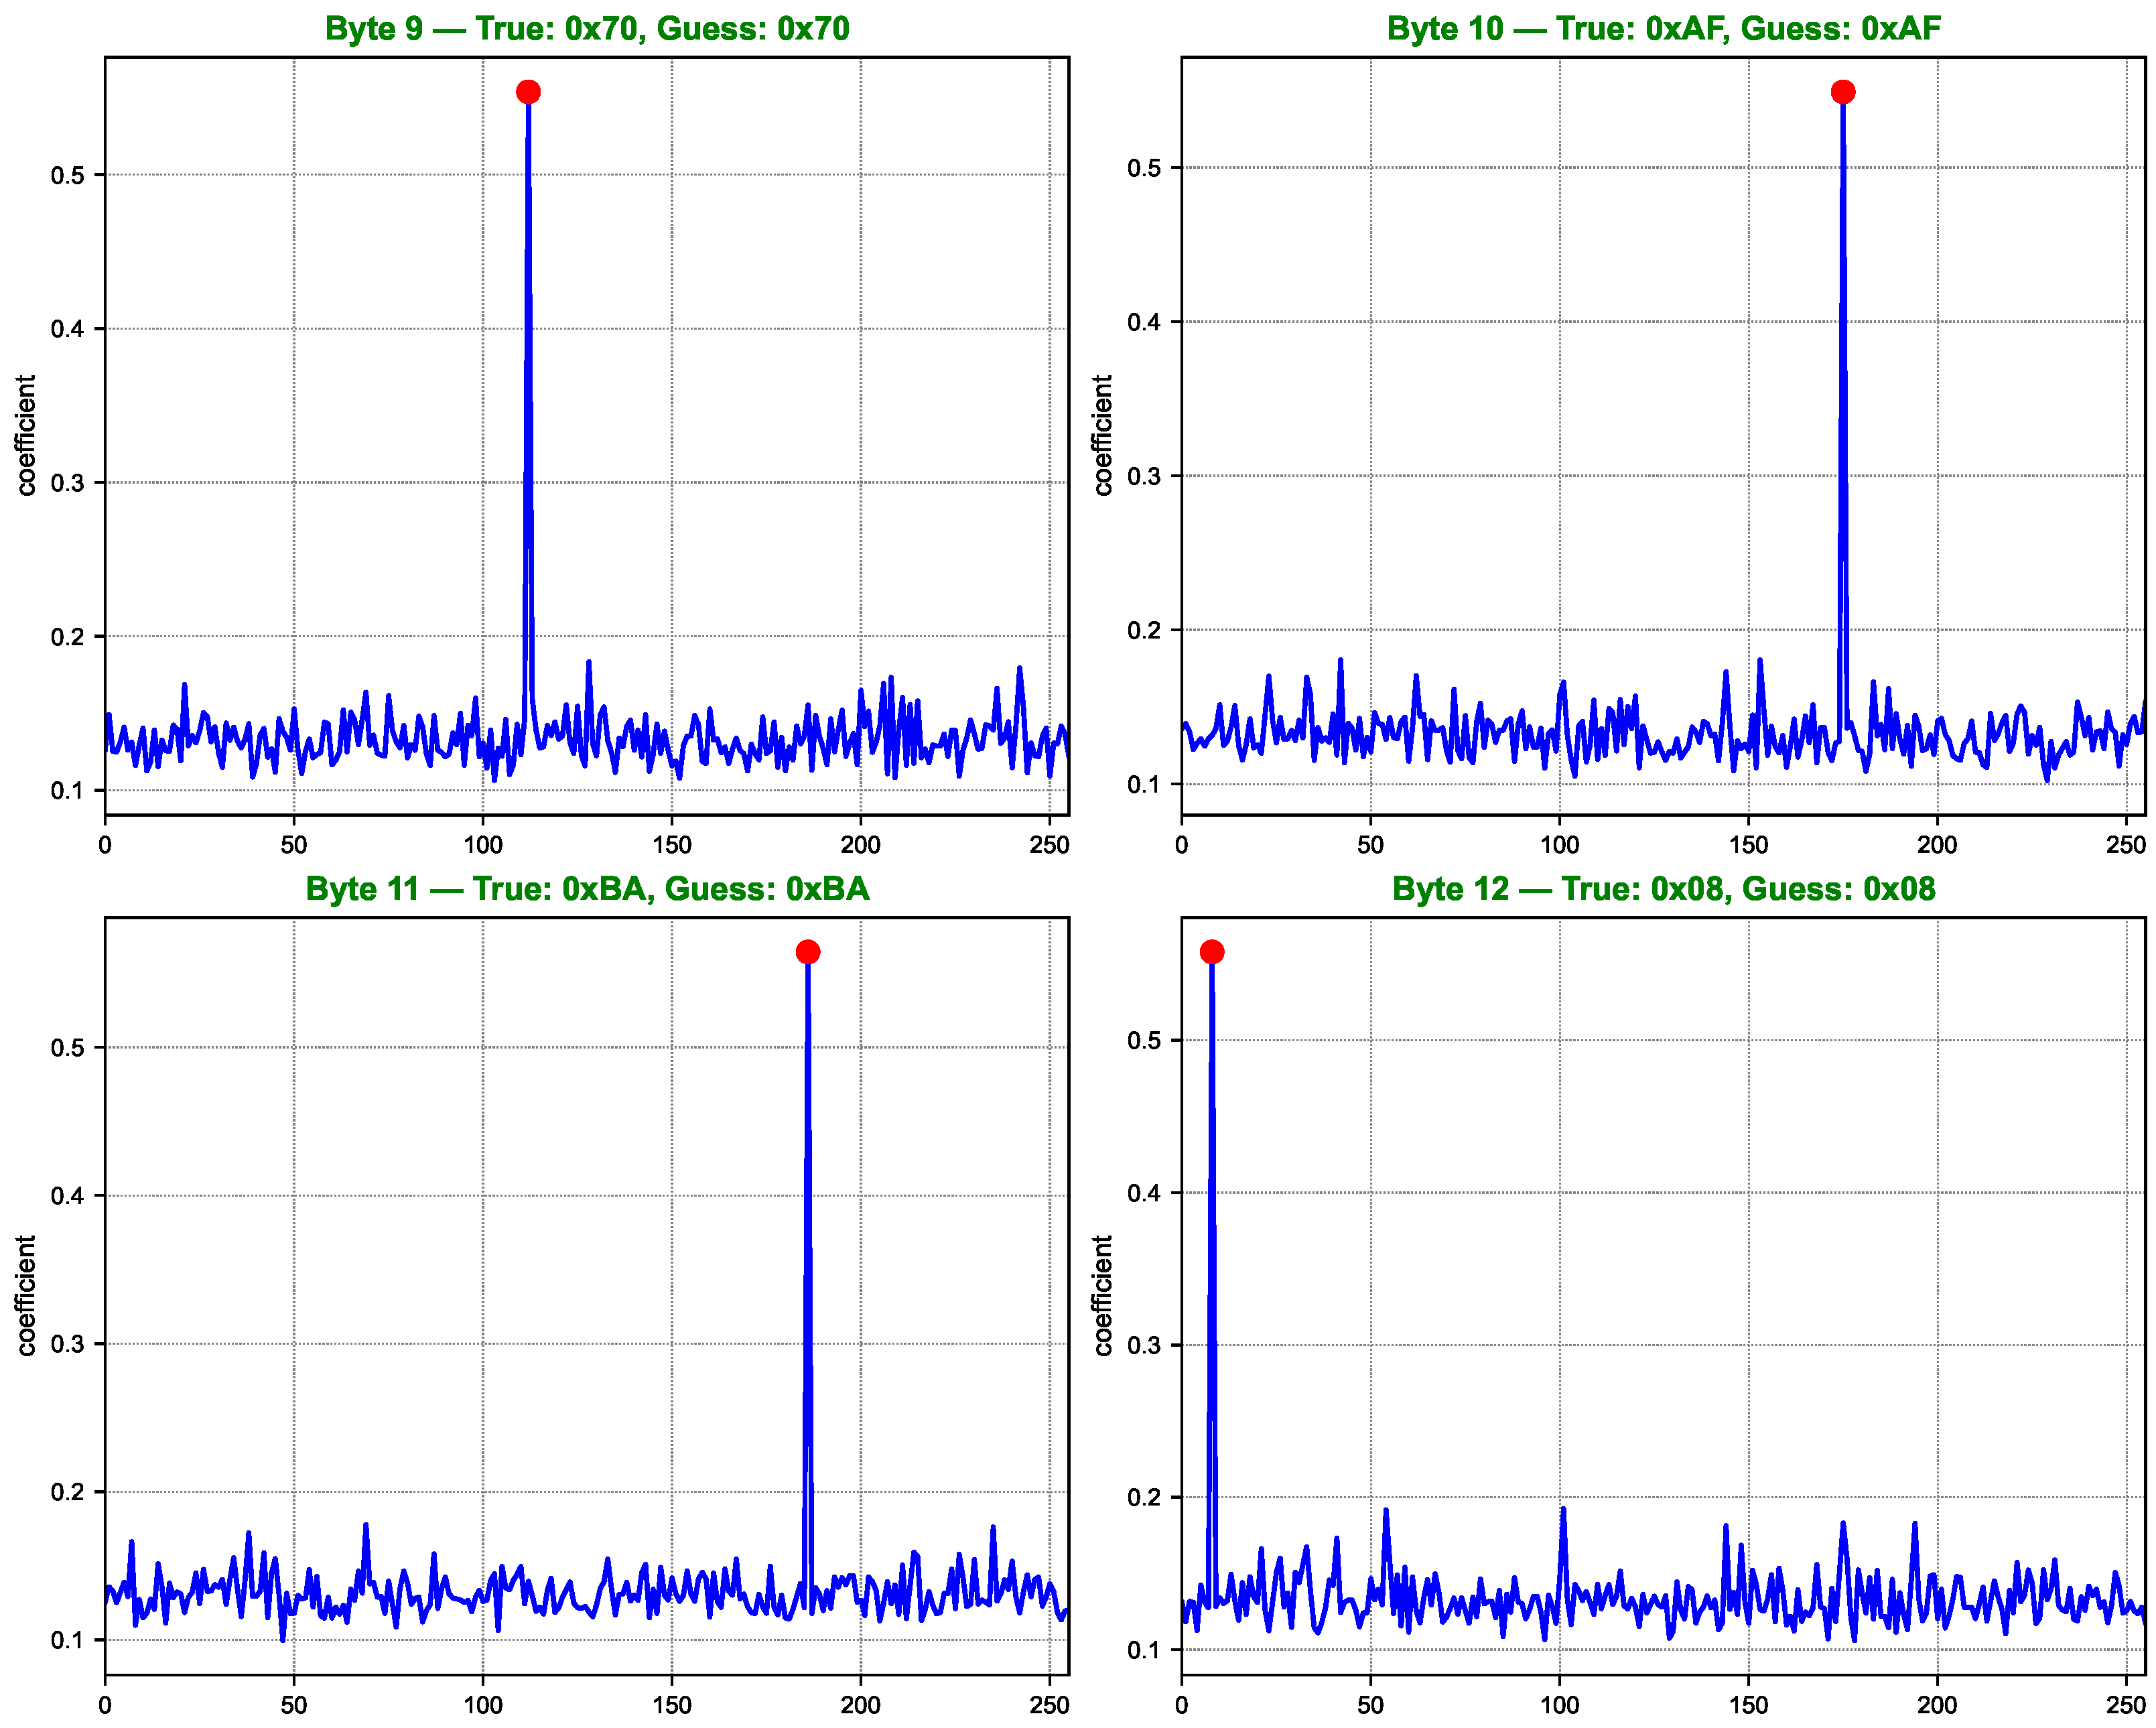
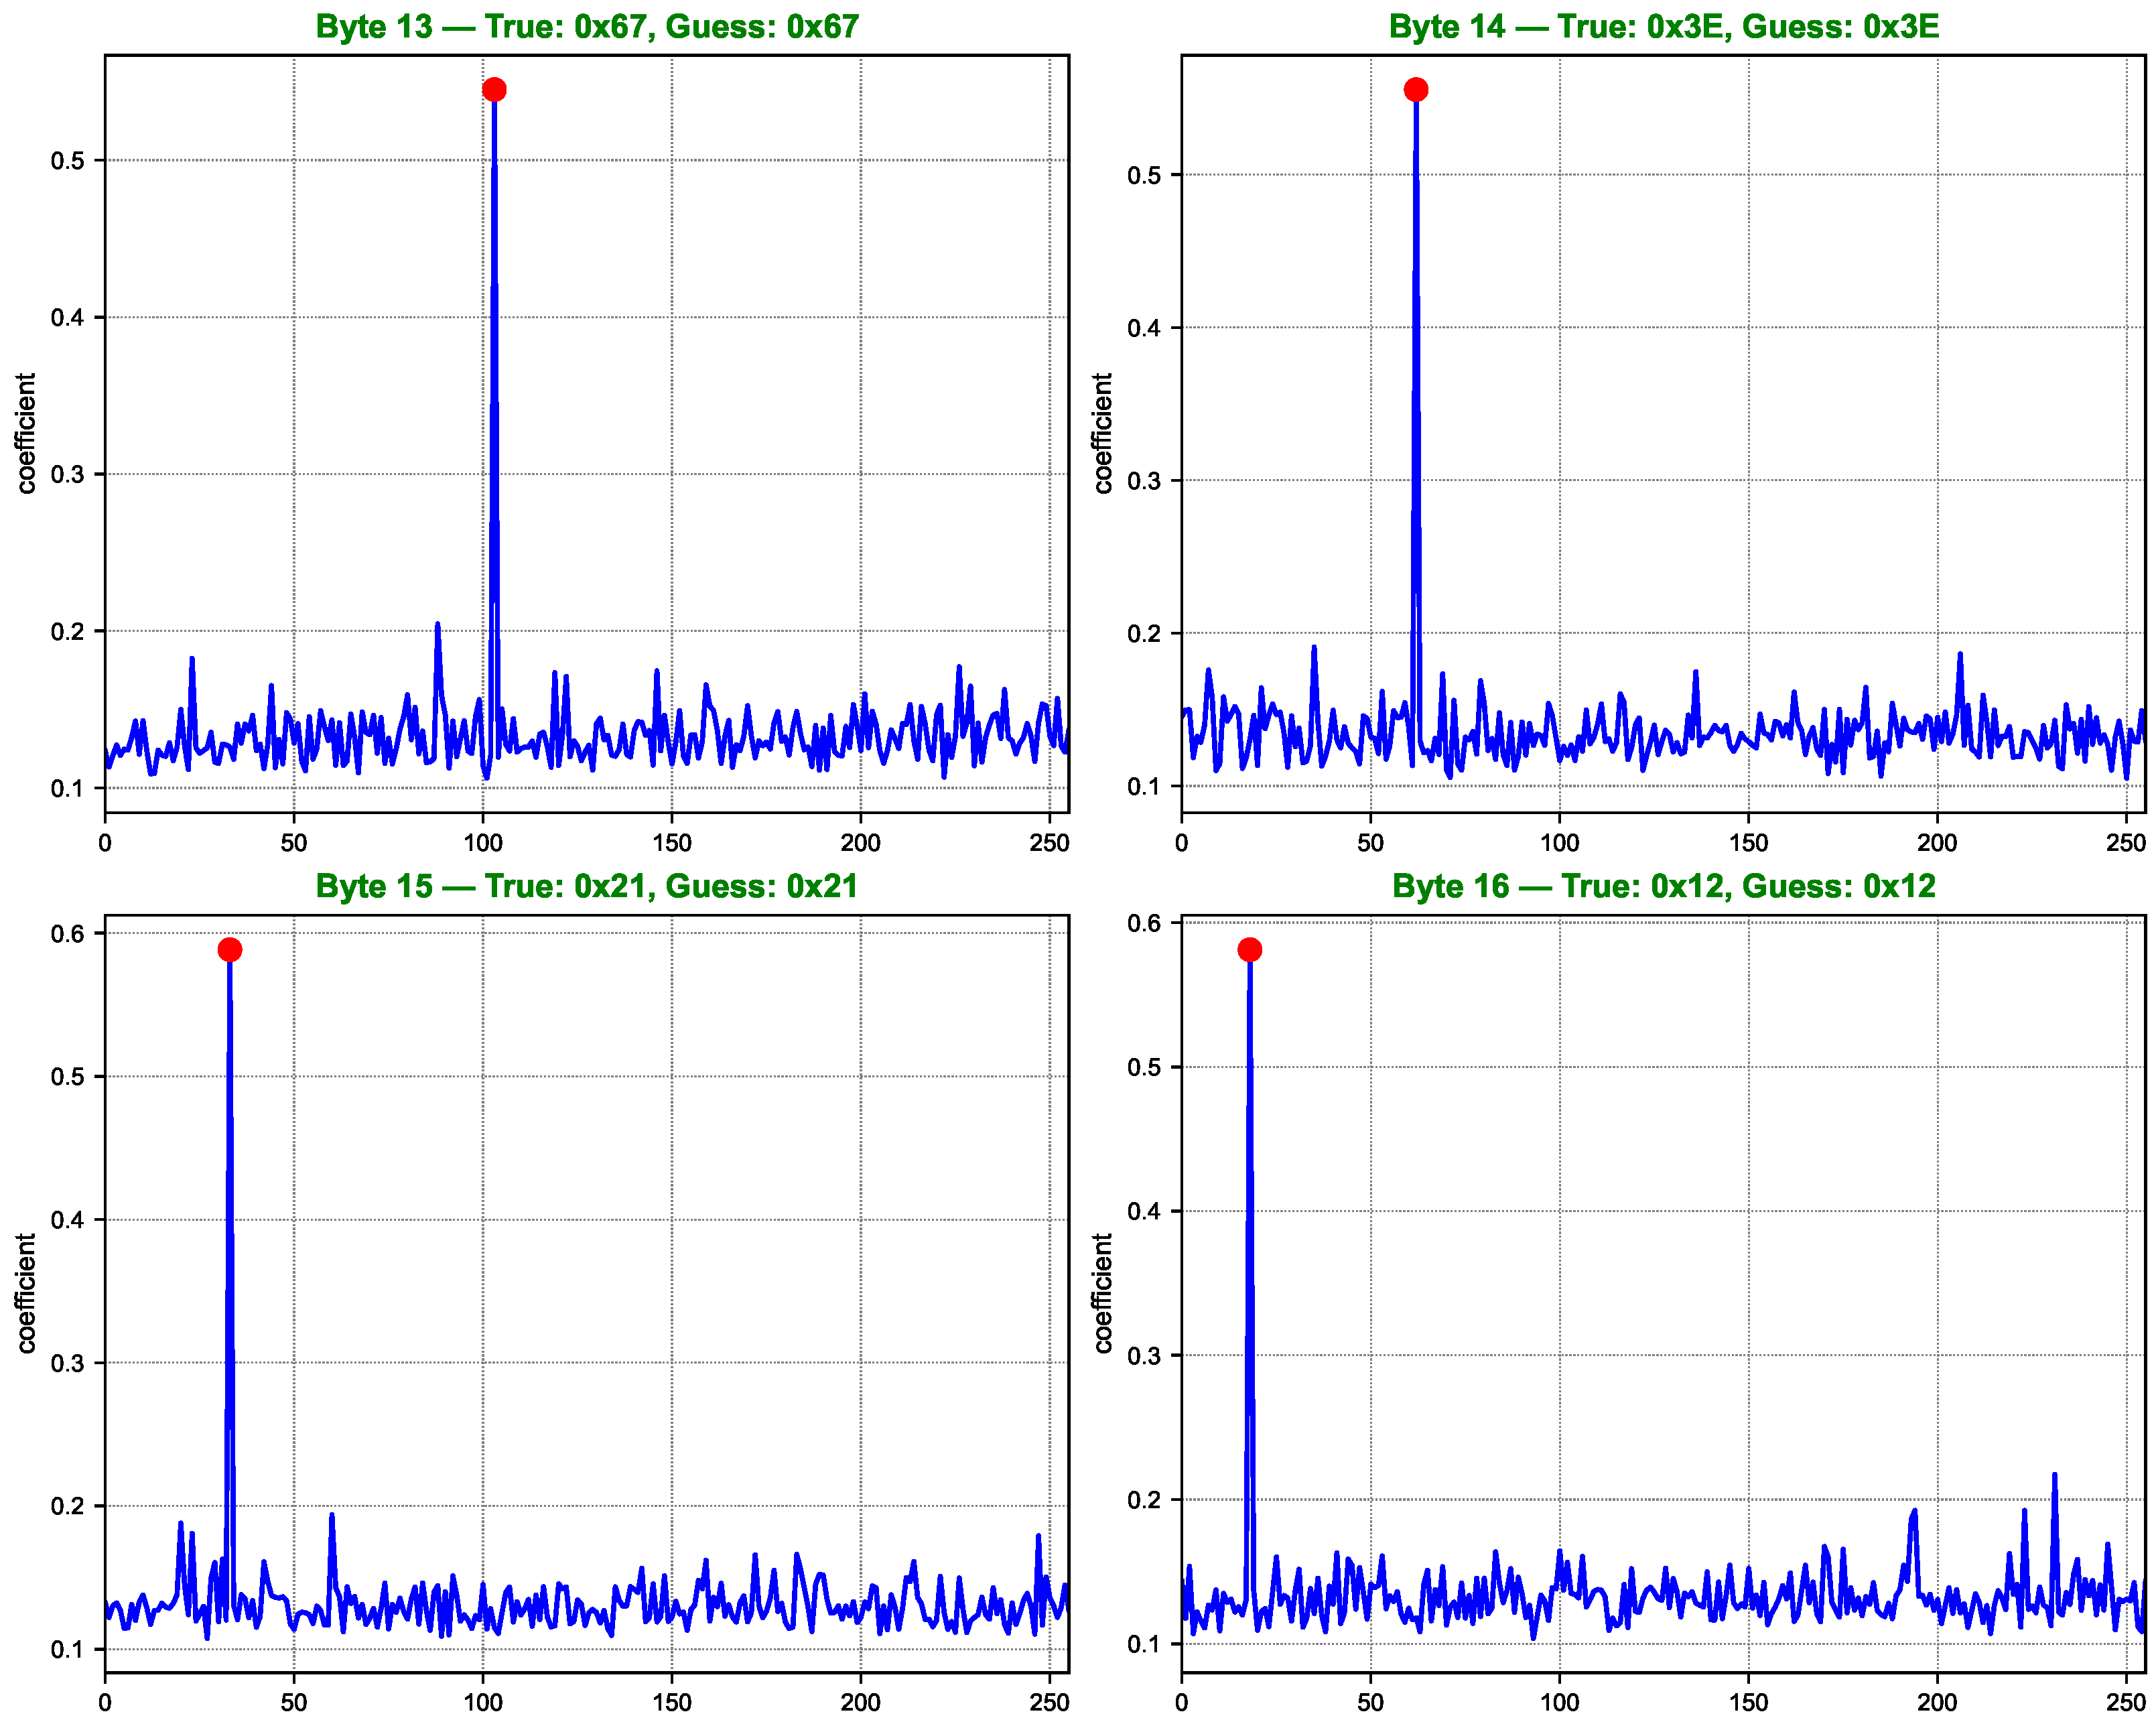
As shown in Figure 7, Figure 8, Figure 9 and Figure 10, the computed correlation coefficients between the cluster centroids and the true Hamming weight profiles of the correct key hypotheses clearly reveal distinguishable peaks. All 16 key bytes are successfully recovered, demonstrating the method’s effectiveness with a 100% overall key recovery accuracy.
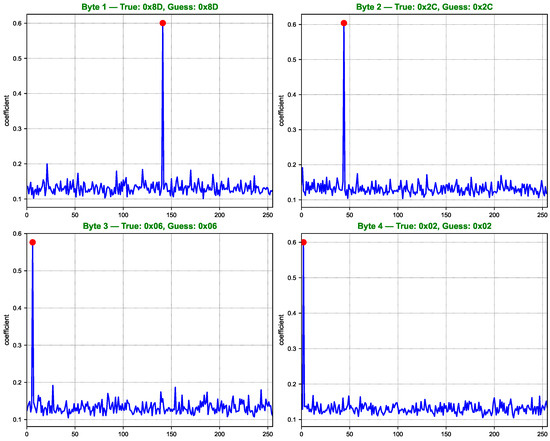
Figure 7.
Key guessing score curves for AES key bytes 1 to 4. Each subfigure displays the correlation between the clustering labels and the Hamming weight of SBox outputs for 256 key hypotheses. The red dot indicates the correlation value corresponding to the true key byte. Higher peaks at the true key position suggest successful key recovery for the corresponding byte.
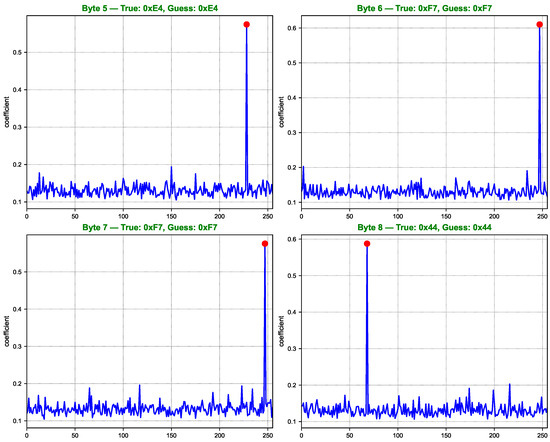
Figure 8.
Key guessing score curves for AES key bytes 5 to 8.
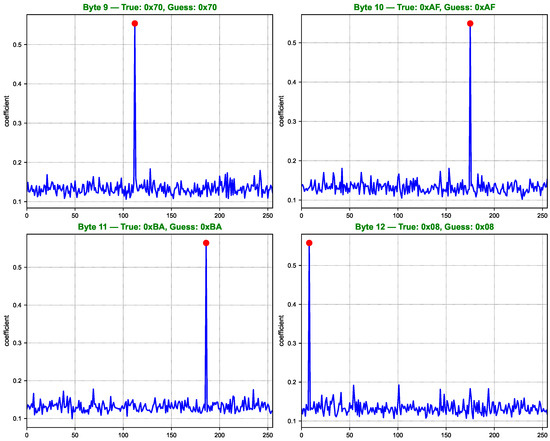
Figure 9.
Key guessing score curves for AES key bytes 9 to 12.
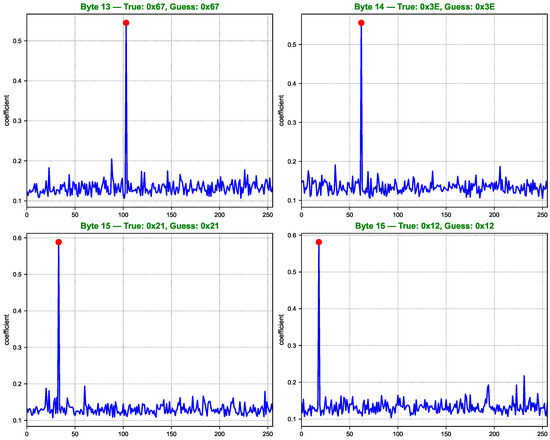
Figure 10.
Key guessing score curves for AES key bytes 13 to 16.
5.3. Ablation Study: Power-Only vs. EM-Only vs. Fusion
Although there are limited directly comparable multi-modal side-channel methods in the current literature, we performed extensive ablation experiments to highlight the advantages of each module in the proposed approach. Given the novelty of our method, no existing benchmark implements clustering-based key recovery on fused power and EM traces in the same manner.
To rigorously evaluate the effectiveness of the proposed multi-modal fusion framework, we conducted an ablation study that isolates the contributions of each signal modality. Specifically, we compare the key recovery performance when using: (1) power traces only, (2) electromagnetic EM traces only, and (3) fused power and EM features. This study aims to quantify the benefits of signal fusion by establishing a baseline with single-modality inputs.
To better understand the contribution of each module in our proposed framework, we conduct an ablation study by selectively removing or modifying key components and observing their impact on clustering accuracy and trace efficiency. Table 2 presents a comparative evaluation of different configurations in terms of clustering accuracy and the number of traces required for successful full key recovery. The proposed method (ours) achieves the highest accuracy of 99.2% with only three traces, demonstrating a significant improvement in both efficiency and robustness.

Table 2.
Number of traces required for successful full key recovery with different methods (Bold indicates the best value).
Among the ablated variants, the joint segmentation configuration, which excludes the isometric compression stage, still maintains a relatively high accuracy of 92.1%, requiring 10 traces to recover the full key. This highlights the effectiveness of our joint segmentation scheme in capturing relevant signal features. Conversely, the isometric compression configuration (without segmentation) yields slightly lower accuracy (89.5%) and requires 15 traces, indicating that compression alone may be insufficient without prior alignment.
In comparison, the single-modality approaches—power-only and EM-only—demonstrate significantly lower performance, with accuracies of 81.2% and 84.5%, and requiring 40 and 35 traces, respectively. These results emphasize the advantages of leveraging both modalities through multi-modal fusion. Notably, even without the full pipeline, intermediate configurations already outperform the single-channel baselines in terms of both accuracy and trace efficiency.
Overall, the results validate the synergistic effect of combining joint segmentation with isometric compression and multi-modal fusion. This combination not only enhances the discriminative quality of extracted features but also significantly reduces the amount of data required for successful key recovery.
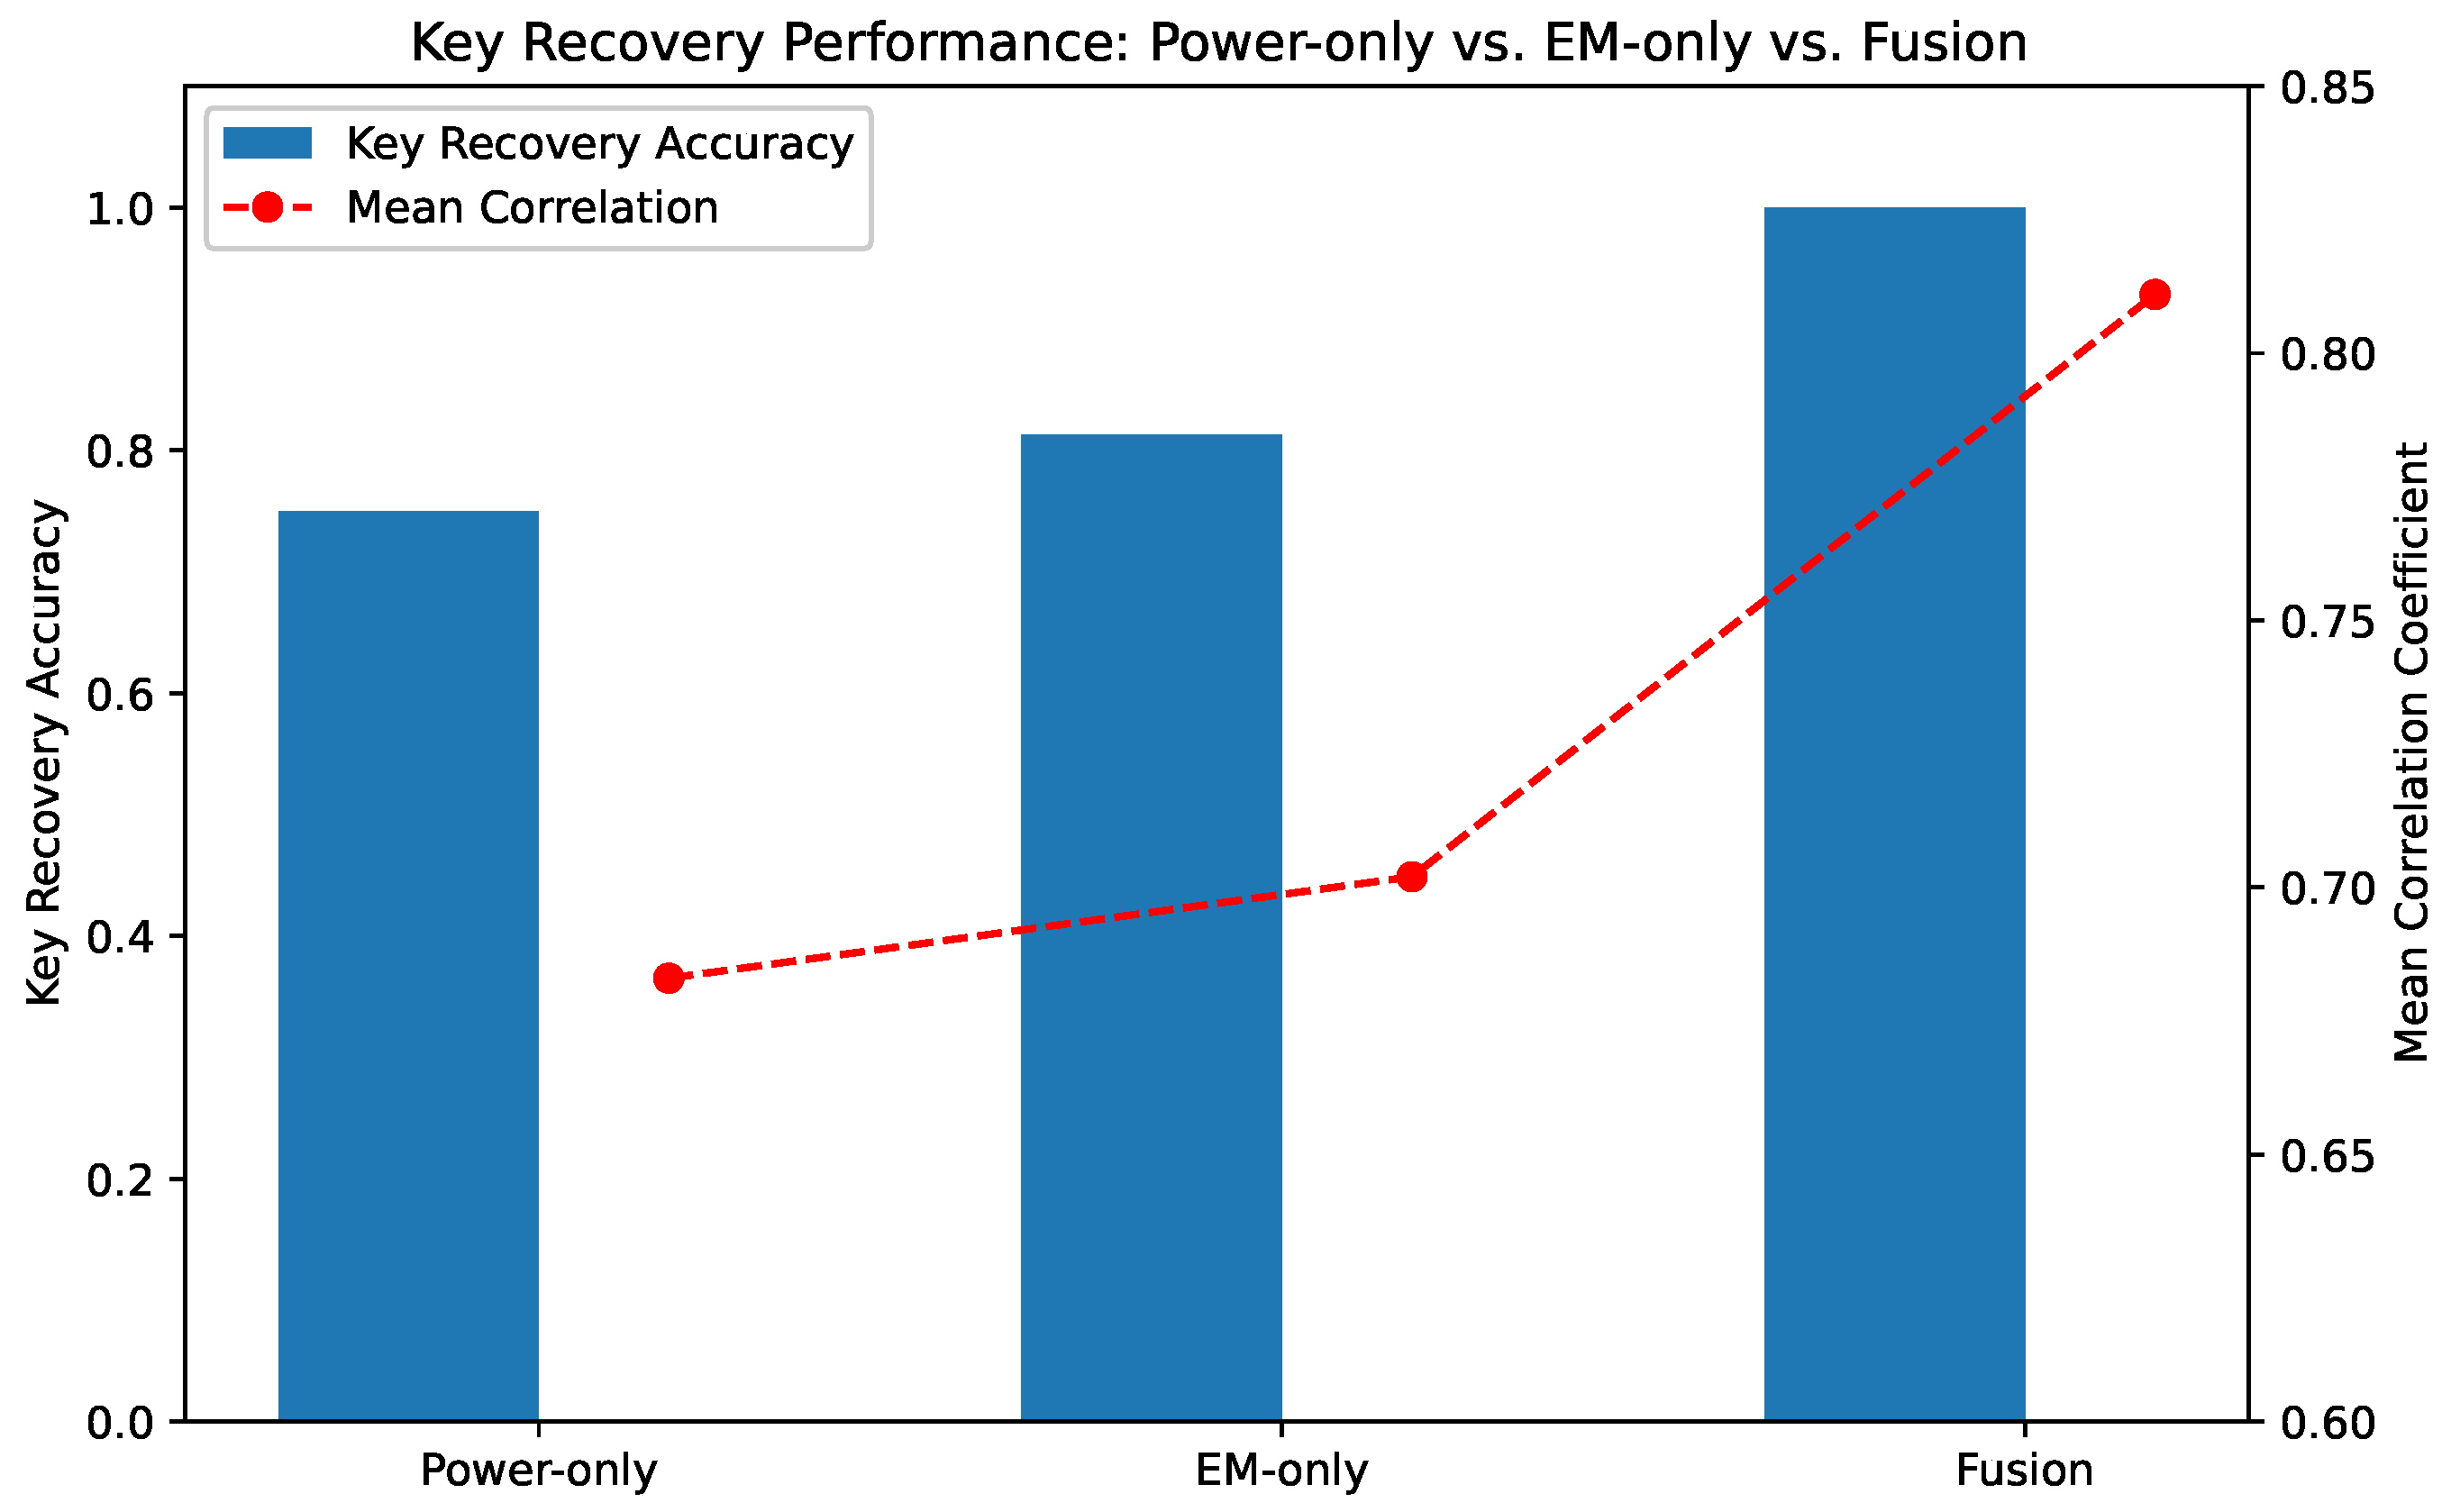
Figure 11 presents the average key recovery accuracy across all 16 AES key bytes for each modality. As shown, the fusion-based approach consistently achieves superior accuracy, demonstrating its ability to extract richer and more complementary side-channel information. Notably, power-only and EM-only models exhibit moderate but distinct leakage characteristics, while their fusion effectively amplifies useful features and suppresses noise.
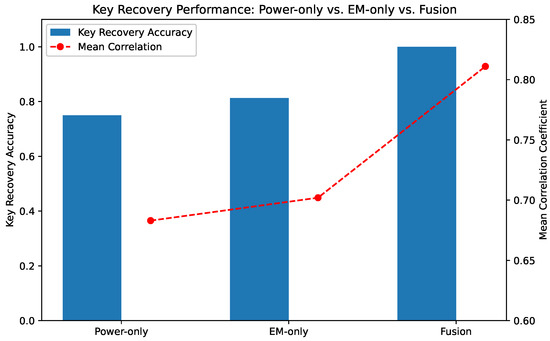
Figure 11.
Comparison of key recovery accuracy using different modalities: power-only, EM-only, and fused signals. The fusion approach outperforms the individual modalities across all bytes.
In addition, Table 3 summarizes key evaluation metrics including mean correlation coefficient, number of correctly recovered key bytes, and average rank of the true key hypothesis. The fusion-based method recovers all key bytes correctly with the highest correlation scores and the lowest average rank, indicating a substantial performance gain over single-modality approaches.

Table 3.
Performance metrics for each input modality (Bold indicates the best value).
These results validate the hypothesis that power and EM signals contain partially independent leakage components, and their combination enables more robust and accurate key recovery. The fusion strategy not only improves SNR but also enhances the separability of key-dependent features, leading to more reliable clustering and correlation outcomes.
5.4. SNR Analysis
To evaluate information leakage, we adopt the signal-to-noise ratio (SNR) as a quantitative metric. Although SNR provides an indirect measurement, it is widely accepted in the SCA community due to its effectiveness in identifying key-dependent variations. Specifically, SNR quantifies the ratio between the variance of the mean traces across different key hypotheses and the average noise variance, thereby reflecting the amount of key-related information leaked at each sampling point.
A higher SNR value indicates stronger leakage, meaning the corresponding point in the trace is more informative and thus more exploitable in subsequent analysis or attacks. Given its computational efficiency and reproducibility, SNR remains a practical and interpretable tool for characterizing leakage behavior.
In our study, we compute point-wise SNR values for both power and electromagnetic (EM) traces over the entire acquisition window. This enables a modality-wise comparison of leakage characteristics and helps to identify regions of interest for downstream fusion and clustering processes. The SNR at each time point is defined as:
where denotes the trace value at time t, and L denotes the sensitive variable (e.g., Hamming weight of intermediate values). The numerator captures the signal power (inter-class variance), and the denominator reflects the noise power (intra-class variance).
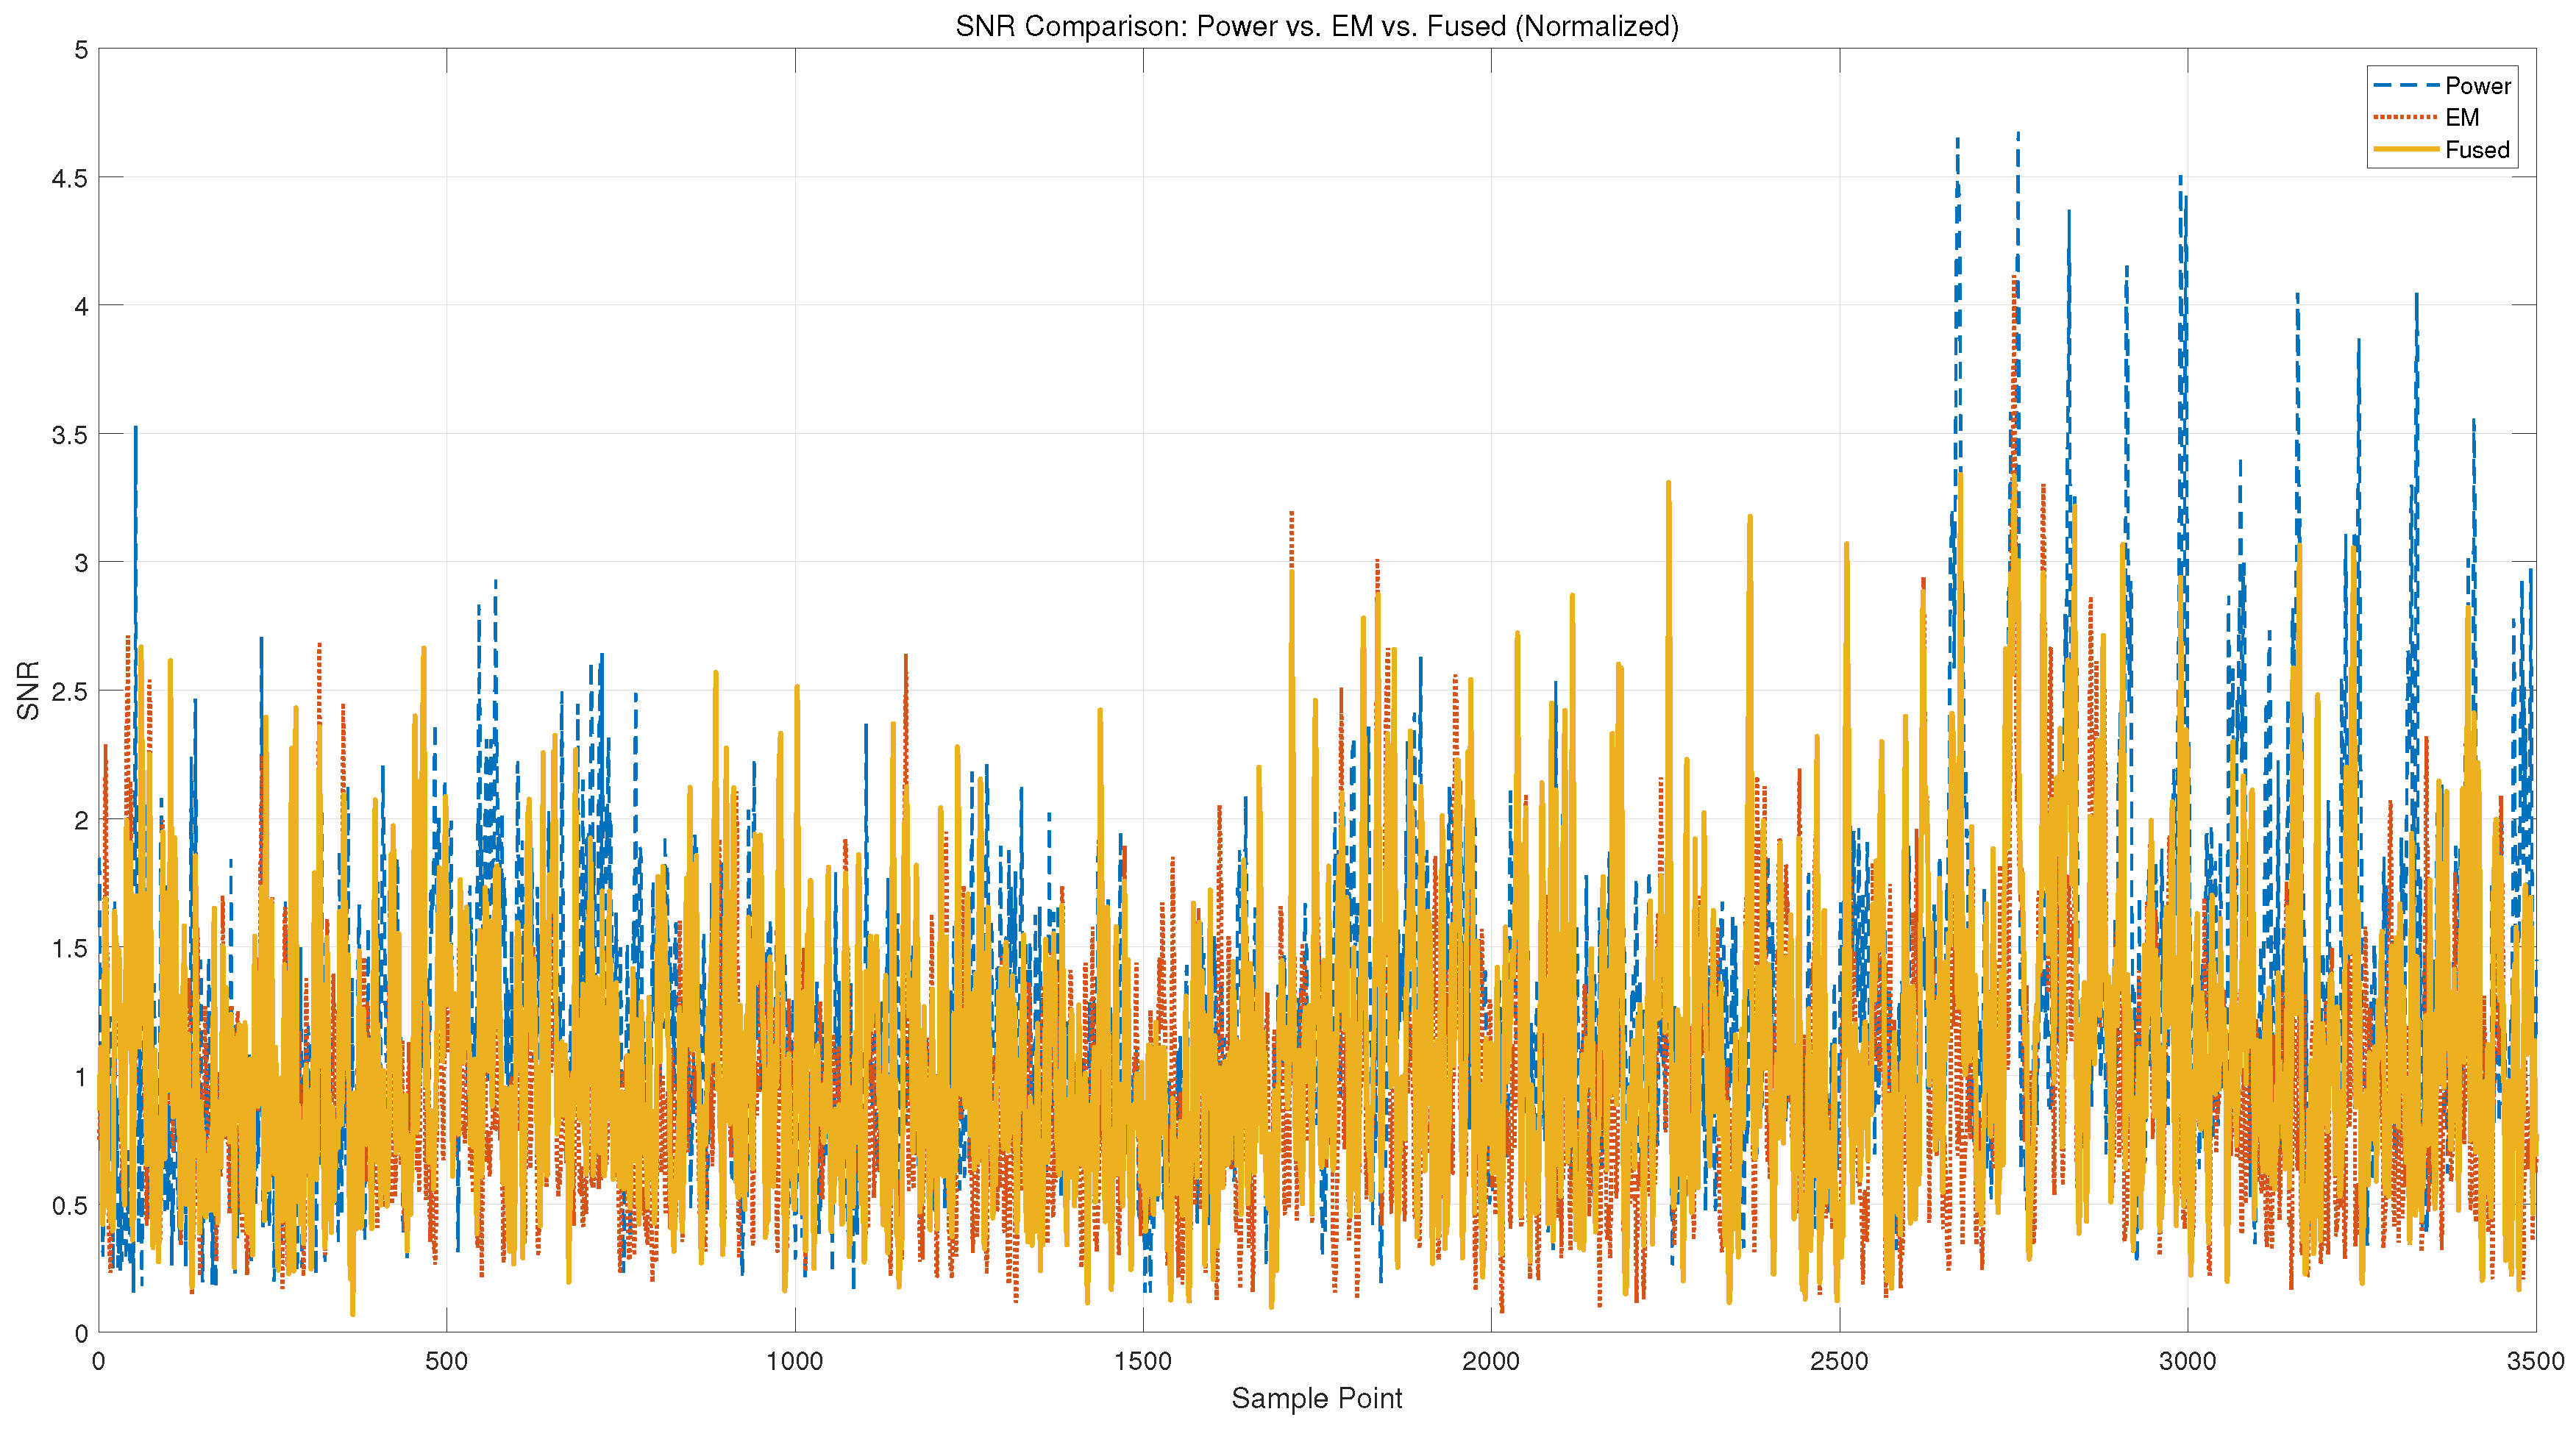
Figure 12 shows the point-wise SNR curves of power, EM, and fused signals. The power channel exhibits sharp peaks, particularly in the later stages of the trace, while the EM channel demonstrates more consistent but lower-magnitude leakage across the trace window. This complementary distribution supports the hypothesis that the two modalities capture distinct aspects of the cryptographic computation.
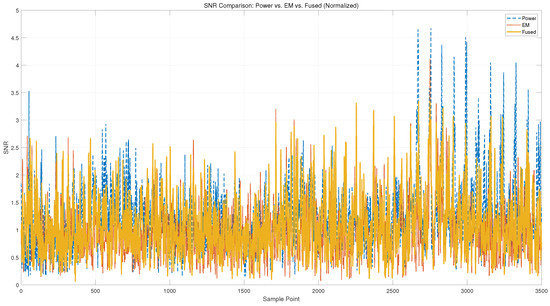
Figure 12.
Point-wise SNR comparison between power and EM channels. EM signals generally exhibit higher leakage intensity, while both modalities contribute complementary peak regions.
Notably, the fused signal achieves a more robust and elevated leakage profile. In many regions where both power and EM individually yield moderate SNR, the fused channel exhibits amplified peaks, indicating that multi-modal fusion enhances the visibility of key-dependent variations. This confirms the effectiveness of signal-level fusion in aggregating complementary leakage and improving trace quality for downstream analysis.
Table 4 summarizes the statistical characteristics of the SNR curves for power, EM, and fused signals. The power channel exhibits the highest average and peak SNR values, with a maximum of 4.24 and a top-5 average of 3.86. In contrast, the EM channel provides lower SNR levels but more consistent leakage. Notably, the fused signal maintains a competitive average SNR (1.12) while achieving the lowest standard deviation (0.47), indicating a more uniform and stable leakage distribution.

Table 4.
SNR statistical comparison of power, EM, and fused signals.
These results suggest that while power traces dominate in peak leakage intensity, the fused signal effectively combines the strengths of both modalities, resulting in balanced and enhanced leakage visibility suitable for downstream analysis.
6. Conclusions
In this work, we proposed a novel multi-modal side-channel analysis framework that combines synchronized power and EM signals via joint peak-based segmentation, isometric compression, and unsupervised clustering. Unlike conventional single-channel or profiling-based methods, our approach is unsupervised, low-sample, and robust to noise, enabling efficient key recovery even with limited measurements.
We introduced a joint peak detection algorithm to segment traces in a modality-consistent manner, followed by isometric compression to transform variable-length signal segments into a unified feature space. Through multi-modal fusion of power and EM signals, we enhanced inter-class separability for unsupervised K-means clustering, enabling reliable identification of cryptographic operations.
Extensive experiments on an AES-128 FPGA implementation demonstrated the effectiveness of the proposed framework. Our method achieved a clustering accuracy of up to 99.2%, full key recovery using as few as three traces, and strong robustness under low signal-to-noise conditions. An ablation study further validated the individual contribution of each module to the overall performance.
Future work will focus on extending the framework to countermeasure-protected implementations, exploring scalable clustering algorithms, and improving synchronization robustness in real-world acquisition settings. Additionally, integrating this methodology into automated key extraction pipelines may enable more practical and autonomous side-channel attacks.
Author Contributions
Conceptualization, X.K.; methodology, X.K.; validation, W.Y.; formal analysis, X.K.; investigation, X.K. and W.Y.; resources, W.Y., G.Z. and L.L.; data curation, W.Y.; writing—original draft preparation, X.K.; writing—review and editing, W.Y. and G.Z.; visualization, X.K.; supervision, W.Y. and G.Z.; project administration, L.L.; funding acquisition, G.Z. All authors have read and agreed to the published version of the manuscript.
Funding
This research was supported by the National Natural Science Foundation of China under Grant Nos. 62272232 and 62172224, and the Fundamental Research Funds for the Central Universities under Grant No. 2025201015, and Henan Key Laboratory of Network Cryptography Technology under Grant LNCT2022-A22.
Data Availability Statement
The data presented in this study are available upon request from the corresponding author. The data are not publicly available due to confidentiality and ethical restrictions.
Acknowledgments
This work was supported by Nanjing University of Science and Technology.
Conflicts of Interest
The authors declare no conflicts of interest.
References
- Kocher, P.; Jaffe, J.; Jun, B. Differential Power Analysis. In Proceedings of the Annual International Cryptology Conference (CRYPTO), Santa Barbara, CA, USA, 15–19 August 1999; pp. 388–397. [Google Scholar]
- Chari, S.; Rao, J.R.; Rohatgi, P. Template Attacks. In Proceedings of the Cryptographic Hardware and Embedded Systems (CHES), Redwood Shores, CA, USA, 13–15 August 2002; pp. 13–28. [Google Scholar]
- Panoff, M.; Yu, H.; Shan, H.; Jin, Y. A Review and Comparison of AI Enhanced Side Channel Analysis. ACM J. Emerg. Technol. Comput. Syst. 2024, 20, 1. [Google Scholar] [CrossRef]
- Ninan, M.; Nimmo, E.; Reilly, S.; Smith, C.; Sun, W.; Wang, B.; Emmert, J.M. A Second Look at the Portability of Deep Learning Side-Channel Attacks over EM Traces. In Proceedings of the 27th International Symposium on Research in Attacks, Intrusions and Defenses, Padua, Italy, 30 September–2 October 2024. [Google Scholar]
- Karayalçin, S.; Krček, M.; Picek, S. A Practical Tutorial on Deep Learning-Based Side-Channel Analysis. J. ACM 2018, 37, 111. [Google Scholar]
- Brier, E.; Clavier, C.; Olivier, F. Correlation Power Analysis with a Leakage Model. In Proceedings of the Cryptographic Hardware and Embedded Systems (CHES), Cambridge, MA, USA, 11–13 August 2004; pp. 16–29. [Google Scholar]
- Gandolfi, K.; Mourtel, C.; Olivier, F. Electromagnetic Analysis: Concrete Results. In Proceedings of the Cryptographic Hardware and Embedded Systems (CHES), Paris, France, 13–16 May 2001; pp. 251–261. [Google Scholar]
- Cheng, S.; Zhang, H.; Hu, X.; Gao, S.; Liu, H. Efficient Exploitation of Noise Leakage for Template Attack. Embed. Syst. Lett. 2023, 15, 161–164. [Google Scholar] [CrossRef]
- Zhang, H. On the Exact Relationship Between the Success Rate of Template Attack and Different Parameters. IEEE Trans. Inf. Forensics Secur. 2020, 15, 681–694. [Google Scholar] [CrossRef]
- Hutter, M.; Kirschbaum, M.; Plos, T.; Schmidt, J.M.; Mangard, S. Exploiting the Difference of Side-Channel Leakages. In Constructive Side-Channel Analysis and Secure Design; Springer: Berlin/Heidelberg, Germany, 2012; pp. 1–16. [Google Scholar]
- Ramezanpour, K.; Ampadu, P.; Diehl, W. SCAUL: Power Side-Channel Analysis with Unsupervised Learning. IEEE Trans. Comput. 2020, 69, 1626–1638. [Google Scholar] [CrossRef]
- Wu, L.; Perin, G.; Picek, S. Weakly Profiling Side-Channel Analysis. IACR Trans. Cryptogr. Hardw. Embed. Syst. 2024, 3, 707–730. [Google Scholar] [CrossRef]
- Wang, C.; Dani, J.; Reilly, S.; Brownfield, A.; Wang, B.; Emmert, J. TripletPower: Deep-Learning Side-Channel Attacks over Few Traces. In Proceedings of the HOST, San Jose, CA, USA, 1–4 May 2023; pp. 167–178. [Google Scholar]
- Savu, I.; Krček, M.; Perin, G.; Wu, L.; Picek, S. The Need for MORE: Unsupervised Side-Channel Analysis with Single Network Training and Multi-Output Regression. In Proceedings of the COSADE, Gardanne, France, 9–10 April 2024; pp. 113–132. [Google Scholar]
- Picek, S.; Perin, G.; Mariot, L.; Wu, L.; Batina, L. SoK: Deep Learning-Based Physical Side-Channel Analysis. ACM Comput. Surv. 2023, 55, 227. [Google Scholar] [CrossRef]
- Lahat, D.; Adali, T.; Jutten, C. Multimodal Data Fusi on: An Overview of Methods, Challenges, and Prospects. Proc. IEEE 2015, 103, 1449–1477. [Google Scholar] [CrossRef]
- Souissi, Y.; Guilley, S.; Danger, J.-L.; Mekki, S.; Duc, G. Improvement of Power Analysis Attacks Using Kalman Filter. In Proceedings of the IEEE International Conference on Acoustics, Speech, and Signal Processing, Dallas, TX, USA, 14–19 March 2010; pp. 1778–1781. [Google Scholar]
- Yang, W.; Xiang, X.; Huang, C.; Fu, A.; Yang, Y. MCA-Based Multi-Channel Fusion Attacks Against Cryptographic Implementations. IEEE J. Emerg. Sel. Top. Circuits Syst. 2023, 13, 476–488. [Google Scholar] [CrossRef]
- Yang, W.; Zhou, Y.; Cao, Y.; Zhang, H.; Zhang, Q.; Wang, H. Multi-Channel Fusion Attacks. IEEE Trans. Inf. Forensics Secur. 2017, 12, 1757–1771. [Google Scholar] [CrossRef]
- Bai, Y.; Park, J.; Tehranipoor, M.; Forte, D. Dual Channel EM/Power Attack Using Mutual Information and Its Real-Time Implementation. In Proceedings of the HOST, San Jose, CA, USA, 1–4 May 2023; pp. 133–143. [Google Scholar]
- Bai, Y.; Acharya, R.Y.; Forte, D. SPERO: Simultaneous Power/EM Side-Channel Dataset Using Real-Time and Oscilloscope Setups. arXiv 2024, arXiv:2405.06571. [Google Scholar]
- Mao, D.; He, S.L.; Rao, H.; Chen, Z.; Wang, Z.; Wang, A. Side-channel Analysis Based on Multi-channel Combination Clustering and Its Application. J. Cryptol. Res. 2022, 9, 1067–1080. [Google Scholar]
Disclaimer/Publisher’s Note: The statements, opinions and data contained in all publications are solely those of the individual author(s) and contributor(s) and not of MDPI and/or the editor(s). MDPI and/or the editor(s) disclaim responsibility for any injury to people or property resulting from any ideas, methods, instructions or products referred to in the content. |
© 2025 by the authors. Licensee MDPI, Basel, Switzerland. This article is an open access article distributed under the terms and conditions of the Creative Commons Attribution (CC BY) license (https://creativecommons.org/licenses/by/4.0/).


