Abstract
Ethnic minority embroidery from Guizhou is an important part of Chinese culture, reflecting the history, beliefs, and artistic traditions of the region’s diverse ethnic groups. However, challenges in automatic recognition arise due to data scarcity, complex textures, and the flexibility of handmade designs. This study constructs the Guizhou Province Intangible Cultural Heritage Embroidery dataset and proposes an improved MobileViT-DDC model to address the issues of complex textures and data scarcity. The model integrates Dilatefomer, Deformable Dilatefomer (DefDilatefomer), and Context Broadcasting Module (CBM) to capture local details and global information in embroidery patterns. Experimental results show that the MobileViT-DDC model achieves an accuracy of 98.40% on the Guizhou embroidery dataset (a 2.17% improvement over the original baseline model) with a 14% reduction in computational load; on the Pakistani National Dress Dataset, it reaches an accuracy of 79.07%, representing a 2.63% increase compared to the original baseline model of the same scale. This study is the first to apply a CNN-ViT hybrid model to ethnic embroidery recognition, providing a new solution for the digital preservation of cultural heritage. The model’s cross-cultural adaptability was further validated through its application to the Pakistani National Dress dataset.
1. Introduction
Representative examples of Guizhou ethnic embroideries include Shui horse-tail embroidery, Dong embroidery, Qiandongnan Miao embroidery, and Bouyei embroidery. These embroideries have been included in China’s national intangible cultural heritage list [1,2]. How to protect the inheritance of these intangible cultural heritages has become a research topic [3]. In embroidery-related research, manual classification faces practical difficulties. Specifically, there are many types of embroidery patterns, differences in stitching methods, and variations in colors. Additionally, handcrafting gives embroidery patterns flexibility and complexity [4,5,6]. Image recognition is one of the core fields of computer vision. Its goal is to analyze and classify the content and features of images, identify the attributes of various elements in images, and ensure that all parts of images can be understood and categorized. However, existing computer vision research mainly focuses on natural images or general texture recognition [7]. There are relatively few modeling and recognition methods specifically targeting the field of ethnic embroidery. At the same time, the number of ethnic embroidery datasets at home and abroad is small. This situation increases the difficulty of applying image recognition technology in this field.
Based on the above circumstances, this study proposes an intangible cultural heritage embroidery recognition algorithm and designs and optimizes the MobileViT model. To support model research, this study constructs the Guizhou Intangible Cultural Heritage Embroidery Dataset and expands this dataset using data augmentation techniques [8].
In embroidery image recognition tasks, Convolutional Neural Networks (CNNs) [9] have shown strong performance in extracting image texture and color features. They are currently among the best-performing models for such tasks. Zhang et al. [10] were the first to construct a Miao embroidery image database. They carefully annotated category labels for the database. They also fine-tuned a pre-trained CNN model. This method achieved a high classification accuracy of 98.88%. It strongly confirms the feasibility of using deep learning for ethnic embroidery classification. Additionally, it laid a methodological foundation for subsequent cross-regional embroidery research. Zhou et al. [11] proposed the improved Xception-TD model, adding three fully connected layers. This model achieved an accuracy of 96.86% in the binary classification of the Four Great Embroideries and non-Four Great Embroideries. Their work provides optimization ideas for multi-class embroidery classification. Changyong et al. [12] targeted Nantong Shen embroidery, using data augmentation and transfer learning. They integrated the SPP module to optimize MobileNet V3 and proposed the Ip-MobileNet V3 model. This model achieved a recognition accuracy of 98.65%, thus promoting the intelligent protection of intangible cultural heritage. Zhu et al. [13], combining the “needle as pen” characteristic of Shen embroidery, proposed a lightweight CNN model integrating the attention mechanism. Zhao et al. [14] focused on Qinghai embroidery, constructing a five-class image dataset. They optimized the ResNet152V2 model using the SE attention mechanism and the Nadam optimizer. This approach achieved a classification accuracy of 91.73%, providing an effective solution for the digital inheritance of Qinghai embroidery. Through transfer learning to optimize the feature extraction layer, the model reduced parameters by 40% while maintaining over 85% classification accuracy, providing an efficient strategy for the digital protection of intangible cultural heritage. These studies demonstrate the outstanding performance of CNNs in embroidery recognition tasks.
The Vision Transformer (ViT) [15], with its attention mechanism [16], has shown superior performance in global feature modeling and has surpassed CNNs in many tasks. However, the Transformer architecture lacks local inductive biases (such as translation invariance and local correlations) and thus requires a large amount of data for training to compensate for this lack of prior information [17]. In cases with limited data, ViT is prone to overfitting, leading to performance degradation. Furthermore, ViT primarily conducts feature interaction through global self-attention, lacking the ability to extract fine-grained local features, making it difficult to fully capture complex textures and local detail variations [18].
To mitigate the training difficulties of Transformers under small-sample conditions, and to balance local detail extraction with global feature modeling, combining local convolutional inductive biases with global self-attention mechanisms has become a popular approach. This method is widely used in advancing fine-grained visual recognition. [19,20]. Among these hybrid architectures, MobileViT [21] stands out for its ability to combine CNN-driven local feature modeling and lightweight Transformer-driven global context awareness, efficiently merging local details and global semantics while maintaining computational efficiency. However, the fixed attention receptive field of MobileViT limits its global modeling capacity when dealing with embroidery patterns with complex textures and diverse styles. This limitation motivated the proposal of the MobileViT-DDC model, designed to enhance its adaptability to intricate embroidery features through targeted architectural improvements. The main contributions of this paper are as follows:
- Construction of the Guizhou intangible cultural heritage embroidery dataset.
- First application of the CNN-ViT hybrid model to embroidery recognition tasks.
- Replace the lower-layer ViT Block in MobileViT with Dilatefomer [22] to reduce computation while improving recognition accuracy.
- Introduction of a new attention mechanism, Multi-Scale Dilated Deformable Attention (MSDDA), combining Multi-Scale Dilated Attention (MSDA) and deformable convolutions [23].
- Replacement of the high-level ViT Block in MobileViT with DefDilatefomer to improve recognition accuracy with minimal increase in computational cost.
- Introduction of CBM [24] to alleviate the information propagation bottleneck in sparse attention during long-range dependency modeling.
The subsequent structure of this paper is as follows: Section 2 (Materials and Methods) outlines the overall architecture of the MobileViT-DDC model and elaborates on the working principles and structures of its four core modules, namely MV2, Dilatefomer, DefDilatefomer, and CBM. Section 3 (Results) first introduces the Guizhou Intangible Cultural Heritage Embroidery Dataset, including the dataset construction and data augmentation strategies. It then clarifies the hyperparameters and evaluation metrics used in the experiments, and finally quantifies and presents the model’s performance through module ablation experiments, performance comparison between MobileViT and MobileViT-DDC, as well as cross-dataset validation involving the Pakistani National Dress Dataset and mainstream lightweight models. Section 4 (Discussion) analyzes the reasons why MobileViT-DDC is suitable for recognizing complex embroidery textures, compares the methodology and performance of this study with existing embroidery recognition works, objectively points out the limitations of this study in terms of dataset coverage and adaptability to extreme texture scenarios, and proposes future research directions of expanding multi-regional embroidery data and integrating cultural semantic embedding. It also integrates the core conclusions of the study at the end of this Section 4.
2. Materials and Methods
This chapter outlines the research methods of this paper, focusing on the design and optimization of the innovative MobileViT-DDC network architecture.
2.1. MobileViT-DDC Network Architecture
First, a embroidery image is input into the network, and downsampling is performed via a 3 × 3 convolutional layer, which corresponds to the “” block labeled in Figure 1. The “” marker next to the block indicates that the spatial dimension is halved, while channel adaptation is completed simultaneously to support subsequent feature extraction.
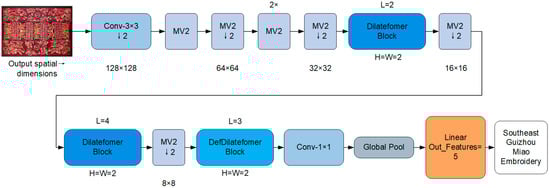
Figure 1.
Architecture of the MobileViT-DDC network. The “Conv-” block denotes a standard convolution operation with down-sampling (↓2). “MV2” refers to the MobileNetV2 block. Changes in spatial dimensions are indicated in the figure. Dilatefomer Block and DefDilatefomer Block are ViT modules.
Next, the blocks labeled “MV2” in Figure 1 participate in the process at two locations: first, immediately following “”, they extract shallow features such as embroidery edges, color gradients, and basic stitch textures; second, they are inserted between subsequent ViT modules to realize intermediate-layer downsampling and feature transition.
Subsequently, the feature maps are fed into the ViT module, which includes “Dilatefomer Block” and “DefDilatefomer Block” (both are core optimized modules labeled in Figure 1). This ViT module is responsible for modeling the global context of embroidery.
Finally, after channel compression via convolution and spatial information aggregation via global pooling, the classification result is output through a linear layer. The network architecture is detailed in Figure 1, and the specific structure of MobileViT-DDC is provided in Table 1.

Table 1.
ViT Module Configuration per Layer.
2.2. MV2 Block
MobileNetV2 is a lightweight convolutional neural network designed to improve computational efficiency while maintaining good performance. Its key innovations include the Inverted Residual Structure and Depthwise Separable Convolutions.
MobileNetV2 uses the Inverted Residual Structure. For this structure, the input feature map first undergoes channel expansion via a convolution. Then, feature extraction is performed using depthwise separable convolutions. Finally, another convolution compresses the channel size back to a smaller scale. This design not only expands the feature space to enhance expressive power but also reduces computational complexity. The mathematical expression of the Inverted Residual Structure is as shown in Equation (1):
where , , are the convolutional kernels, , , are the bias terms, is the input, is the output.
Depthwise Separable Convolutions decompose the traditional convolution operation into two steps: depthwise convolution and pointwise convolution. The depthwise convolution first applies a convolution to each input channel separately, reducing computational cost, and then a 1 × 1 convolution fuses the features across channels. The mathematical expression for depthwise separable convolutions is as shown in Equations (2) and (3):
Depthwise Convolution:
Pointwise Convolution:
These two steps allow depthwise separable convolutions to reduce computational complexity while maintaining strong feature extraction capabilities.
2.3. Dilatefomer Block
To further reduce the computational complexity of Vision Transformers (ViT) in high-resolution image tasks, while maintaining the ability to model long-range dependencies, this paper replaces the ViT Block in MobileViT with the Dilatefomer Block in the MobileViT-DDC architecture. This section provides a detailed introduction to the motivation, key mechanisms, and specific implementation of the Dilatefomer Block, as shown in Figure 2.

Figure 2.
Illustration of the Dilatefomer Block. This module combines Dilated attention and multi-scale feature fusion, while the CBM module in the MLP enhances the global context information transfer.
In MobileViT, the ViT Block implements attention calculation through three operations: unfolding, local processing, and folding. Compared to the standard ViT, this ViT Block adopts sparse attention. This sparse attention enables global information modeling while reducing the number of parameters. Specifically, the unfolding operation divides the input feature map into multiple small patches (Figure 3).
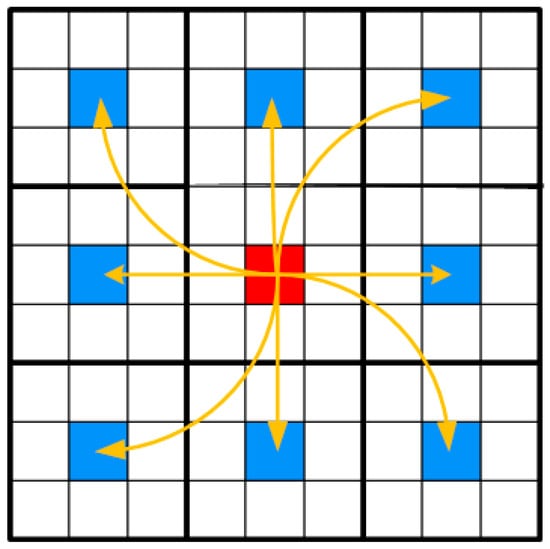
Figure 3.
Attention Calculation Diagram. The input feature map is divided into 9 large blocks, with each large block containing 9 smaller patches. The central red patch represents the patch that requires attention calculation, while the blue patches represent the patches that will perform the attention calculation. Attention is calculated only between the patches in the same position across different large blocks.
Next, the folding operation restores the divided patches back into the original feature map. Finally, a Fusion operation is performed to combine the extracted features. This Fusion operation integrates both local and global information. However, the fixed “sampling points” in the self-attention calculation limit its global modeling ability.
To address this issue, the Dilatefomer Block introduces the Sliding Window Dilated attention (SWDA) mechanism along with Multi-Scale Dilated Attention (MSDA). The SWDA mechanism sparsely connects key-value pairs to queries through local Dilate sampling, reducing computational complexity while retaining the ability to model long-range dependencies. MSDA uses different attention heads to perceive multi-scale contexts based on varying dilation rates, and fuses the outputs through concatenation and linear projection. Figure 4 shows the detailed structure of the MSDA module.
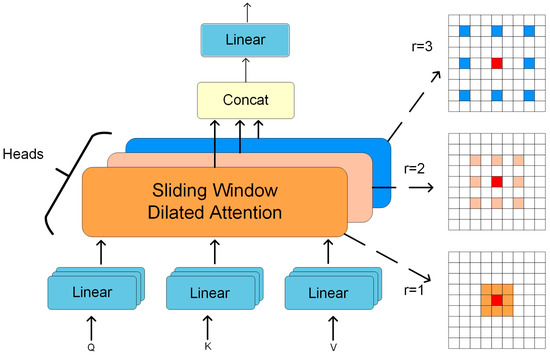
Figure 4.
Illustrates the structure of the MSDA mechanism. Specifically, the input feature map is first divided across multiple attention heads. Each head performs attention computation within a local window, centered at the red query point, using a distinct dilation rate to control the spacing of sampled keys and values. These varying dilation rates effectively enable different receptive field sizes (with dilation rates of , , and ), allowing the model to capture multi-scale contextual information. The outputs of all attention heads are then concatenated and passed through a linear projection to aggregate the information.
In SWDA, the query position at each location only selects keys and values within a Dilated sliding window, performing sparse attention operations within this local window. Specifically, for a given position keys and values are selected based on the predefined dilation rate r within a window of size , and the output is calculated by Equation (4):
where and denote the sets of keys and values within the Dilated window around the query position , respectively, and the dilation rate r controls the sampling sparsity. The positions of the selected keys and values satisfy the offset relationship shown in Equation (5):
where and are the offsets within the window. By introducing dilated sampling, SWDA reduces computational complexity while preserving the ability to model long-range dependencies. This decreases the complexity of global self-attention, while maintaining feature representation effectiveness.
In the specific implementation of MSDA, the input feature map X is first split into n heads through linear projection, where each head corresponds to a distinct dilation rate . Then, for each head, a Sliding Window Dilated Attention (SWDA) operation is performed, and the output is given by Equation (6):
where are the query, key, and value of the i-th head, respectively, and is the corresponding dilation rate for that head. Finally, the outputs of all heads are concatenated and fused through a linear layer as shown in Equation (7):
In summary, the Dilatefomer Block combines SWDA and MSDA to enable sparse and efficient long-range dependency modeling within the Vision Transformer architecture. Compared to the original ViT in MobileViT, the multi-scale dilated sampling attention calculation provides a larger receptive field, further reducing the number of parameters and computational complexity.
2.4. DefDilatefomer Block
The Dilated attention mechanism effectively expands the receptive field while reducing computational complexity, but its fixed sampling pattern limits the model’s flexibility and adaptability when handling complex image regions. Inspired by the concept of Deformable Attention [25], we propose Deformable Dilated attention (DefDilated attention), which enables the model to dynamically adjust the attention model’s shape during high-level feature processing, allowing it to focus on more important features. DefDilated attention combines the advantages of Dilated attention and Deformable Convolution, aiming to enhance the model’s ability to capture complex spatial dependencies. The overall structure of this module is shown in Figure 5.
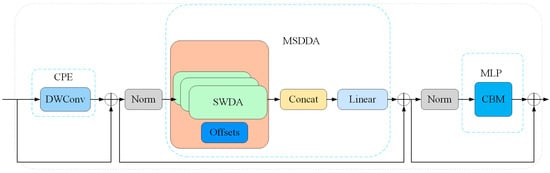
Figure 5.
Illustration of the DefDilatefomer Block Module. This module extends the original Dilatefomer Block by incorporating deformable offsets into the Sliding Window Dilated attention mechanism (SWDA), forming a multi-scale deformable attention (MSDDA) structure. The offset branch dynamically adjusts receptive fields to enhance spatial adaptability, while the CBM in the MLP facilitates global context enhancement.
In the specific implementation, the DefDilatefomer module first employs a standard convolution operation on the input key feature map K to predict the convolutional offsets for each position, as shown in Equation (8):
where offsets denote the dynamically learned positional offsets. With these offsets, the model can adaptively adjust the sampling positions according to the local content of the feature map.
Next, deformable convolution operations are performed on the key feature and value feature based on the generated offsets, respectively, to obtain the deformed feature representations, as shown in Equation (9):
Through this approach, deformable convolution flexibly expands the receptive field of Dilated attention, enabling feature sampling to go beyond fixed grids, thereby enhancing the model’s adaptability to local complex structures and improving its representation capabilities. To intuitively show the fine-grained modeling process of this mechanism and the multi-scale receptive field adjustment strategy, Figure 6 shows the internal calculation flow of sliding window deformable attention combined with position offsets in the DefDilatefomer module. Specifically, Figure 6b presents the calculation process of MSDDA. First, based on the input feature space, the query undergoes linear transformation via to generate the basic query vector . This vector acts as a “query device” to retrieve key information. Then, the Offset branch processes q to obtain deformable offsets. These offsets transform the original regular sliding window sampling points into Deformed Points, which flexibly adjust the receptive field to capture irregular multi-scale features. Next, Sampled Features are extracted based on the deformed sampling points, focusing on key regions to obtain local information. At the same time, Relative Position Bias Offsets are introduced to add position encoding. Position Flow and Feature Flow transmit position information and feature information, respectively. Finally, this information is input into the Multi-Head Attention (MHA) module. In this module, multiple groups of features undergo parallel interactive fusion across different “heads” through linear transformations such as and . The integrated feature is output via , realizing multi-scale deformable feature aggregation. This helps the model capture both local details and global associations.
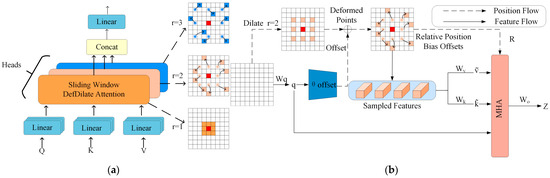
Figure 6.
Schematic diagram of the DefDilatefomer Block. (a) demonstrates the offset effect of attention calculation in MSDA, and (b) illustrates the application of deformable offsets and relative position bias offsets in multi-head attention calculation.
By integrating Dilate attention with Deformable Convolution organically, the DefDilatefomer module introduces a dynamic receptive field adjustment mechanism to vision Transformers. This mechanism enhances the model’s adaptability and representational power in complex spatial contexts, while also improving the flexibility of feature modeling and fine-grained perception, all while preserving computational efficiency.
2.5. CBM Block
Although the Sparse Attention mechanism has demonstrated remarkable advantages in reducing computational complexity, yet due to restricting the interaction range between tokens, it tends to encounter the issue of restricted information propagation when capturing long-range dependencies. In deep feature learning, semantic separation due to sparse connections can weaken the model’s global context modeling, which impacts recognition performance. To address this bottleneck, this paper introduces the CBM to enhance the global information transmission capability under the sparse attention structure.
CBM’s core idea is to extract global context features using lightweight operations at each intermediate layer and explicitly inject them into all local tokens, thereby ensuring the computational efficiency of Sparse Attention while enhancing the capability of global dependency information fusion. The computational flow of CBM is shown in Figure 7.

Figure 7.
Schematic Diagram of the CBM (Context Broadcasting Module). This module obtains a global context representation via median pooling and broadcasts it to all tokens, enabling density compensation and enhanced feature robustness. Compared to average pooling, median pooling offers greater stability when handling outliers and noise, effectively improving the global perception capability of attention mechanisms under sparse structures.
Where input tokens first undergo Median Pooling to generate a global representation, which is fused with local tokens via a broadcasting operation to effectively improve contextual modeling capability. Specifically, CBM first employs Median Pooling to extract a global contextual token from the input token sequence, as shown in Equation (10):
where denotes the -th local token in the input sequence, and is the global contextual feature obtained by taking the median of all local tokens. Unlike traditional average pooling, median pooling exhibits stronger robustness, effectively suppressing the interference of outliers and local noise on global feature modeling.
Subsequently, CBM performs weighted fusion of the generated global contextual token with each local token, and the updated local feature representation is shown in Equation (11):
This simple yet efficient fusion strategy injects global semantic information while preserving local feature details, alleviating the issue of restricted information propagation caused by sparse connections. By appropriately inserting CBM modules at various stages of the network, the model can further enhance long-range dependency modeling capability and feature consistency while maintaining lightweight computational advantages.
In summary, as an efficient and lightweight global information enhancement module, CBM not only improves the semantic understanding and feature aggregation capabilities of MobileViT-DDC in processing complex embroidery patterns but also provides an effective global context compensation mechanism for sparse Transformer architectures.
3. Results
The experimental design is shown in Figure 8.

Figure 8.
Experimental Design Flowchart.
3.1. Dataset and Experimental Parameters Settings
3.1.1. Dataset
The Guizhou ICH embroidery dataset has three data sources: Guizhou Nationalities Museum, offline acquisitions by ICH inheritors, and web-crawled public resources. Low-quality samples were removed from the dataset. These low-quality samples include blurry images and incomplete patterns. The dataset covers 5 core categories of embroidery. The 5 categories are Qiandongnan Miao embroidery, Dong embroidery, Buyi embroidery, Shui horse-tail embroidery, and other local embroideries.
The original dataset had 1000 images (200 per category), split into two non-overlapping subsets:
- Original training subset: 500 images (100 per category), used exclusively for data augmentation;
- Original validation subset: 500 images (100 per category), kept raw for final model evaluation.
After augmentation, the final dataset had 5000 images, following a 9:1 training-validation split (4500:500).
Data augmentation was only applied to the training set, in a fixed order: image standardization (resize + Lanczos filtering) → basic augmentation → texture perturbation → color space transformation → mixed augmentation. Basic augmentation sub-operations (rotation, flipping, scaling, cropping, translation) used a “random activation” mechanism (60% execution probability per sub-operation; 3–4 types per image on average) to avoid feature distortion. All operations were implemented via Python 3.12’s Pillow library, with randomness controlled by random and NumPy libraries for reproducibility. Specific steps:
- Image resizing for standardization:
To unify the input image size for subsequent model processing while preserving the original aspect ratio, the following adjustment rules are adopted: if the image width (W) is greater than the height (H), resize it to; if the height (H) is greater than the width (W), resize it to . The Lanczos resampling filter is used during resizing to minimize image quality loss caused by interpolation.
- 2.
- Basic enhancement:
Rotation: Randomly rotate images within −30° to 30° (curved distribution) to enhance adaptability to different viewing angles.
Flip: 50% probability of horizontal/vertical flipping to adapt to objects in varied orientations.
Random scaling: Adjust size with a random factor (0.8–1.2) to boost robustness to size variations.
Random cropping: Crop 20–80% of the image randomly to simulate real-world occlusion.
Random translation: Shift horizontally/vertically ( of ) to simulate positional offsets in real scenarios.
- 3.
- Texture perturbation:
To further enhance the model’s robustness to local variations, this paper introduces a local texture perturbation strategy: randomly selecting a rectangular region in the top-left or bottom-right corner, cropping the region, and randomly pasting it onto any area of the image. This simulates local variations and detail displacements in the image.
- 4.
- Color space transformation:
The color space transformation process first converts the image from the RGB color space to the HSV color space. Then, the Value (brightness), Saturation, and Hue channels in the HSV space are adjusted. Specifically, brightness is adjusted by multiplying with a random scaling factor ranging from 0.8 to 1.2: if the factor is greater than 1, the image becomes brighter; if less than 1, the image becomes darker. Adjusting saturation can make colors more vivid or dull. Finally, the adjusted image is converted back to the RGB color space for further processing or display. This method effectively enhances the model’s adaptability to different lighting conditions, contrast levels, and color variations.
- 5.
- Mixed enhancement:
First, the two input images are converted from PIL format to NumPy arrays. A random λ value is generated using the Beta distribution, with the np.random.beta (alpha, alpha) function used to control the weight ratio between the two images.
According to the calculated λ (lam) value, the pixel values of the two images are weighted and mixed: and _array represent the weighted contributions of the two images, respectively. These are then summed to generate a new mixed image, and the mixed NumPy array is converted back to PIL image format.
The data augmentation strategies in this study refer to and extend the common transformation techniques of FGVC (fine-grained classification). For example, they draw on the preprocessing methods of the Species196 dataset [26]. These augmentation techniques expanded the dataset size. They also improved the diversity of the data. This enhances the model’s adaptability to real-world transformations and occlusions. Meanwhile, it strengthens the model’s robustness in complex environments. Figure 9 shows the augmentation effects on each embroidery category, demonstrating the introduced diversity.
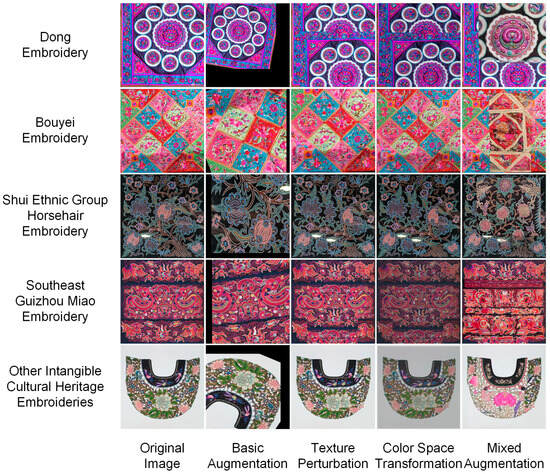
Figure 9.
Image Augmentation Results. Each row presents a different category of Guizhou intangible cultural heritage embroidery images, while each column illustrates the outcomes of various data augmentation techniques.
To further verify the generalization ability of the proposed MobileViT-DDC model, this paper selects the Pakistani Clothing Image Dataset [27] as an auxiliary experimental dataset. The dataset contains 3800 images divided into 10 fine-grained categories (animal, check, chevron, diamond, floral, heart, leaf, paisley, polka dots, stripes), with diverse clothing patterns and rich stylistic variations.
3.1.2. Experimental Parameters Settings
To ensure the fairness and reproducibility of the experiments, the model proposed in this paper and the comparative models adopt the same initialization parameter settings during the model training process, as shown in Table 2.
Table 2.
Hyperparameter settings for model training.
Additionally, this study employs CrossEntropyLoss as the loss function, whose calculation formula is shown in Equation (12).
In the formula, N denotes the total number of samples. c is the number of categories, and is the label indicator variable for the -th sample in category : specifically, if sample belongs to category , and 0 otherwise. Meanwhile, represents the probability that the model predicts the -th sample belongs to category . This probability is typically obtained through the softmax function.
3.1.3. Optimization Strategies
In this study, AdamW is used as the optimizer for model training, and its parameter update formula is shown in Equation (13):
where and are the bias-corrected estimates of the first-order and second-order moments, respectively, α is the learning rate, ϵ is a small constant to prevent division by zero, and λ is the weight decay coefficient. Unlike the traditional Adam optimizer, AdamW decouples the weight decay term from the gradient update, stabilizing the regularization process and effectively mitigating the learning rate misalignment problem caused by the L2 regularizer in Adam.
The ReduceLROnPlateau strategy (Equation (14)) was introduced to enhance validation stability and convergence efficiency:
Here, and are the current and updated learning rates, (decay factor, ). The ‘patience’ was set to 5—if validation loss did not decrease for 5 consecutive epochs, learning rate decay was triggered.
To improve generalization and avoid overfitting from single dataset partitioning, 5-Fold Cross-Validation (5-FCV) was implemented. The 4500-image augmented training set ( of the original training subset) was randomly split into 5 non-overlapping subsets with balanced categories (900 images each, 180 per embroidery category). For each fold:
- 4 subsets (3600 images) served as training data to update parameters;
- 1 subset (900 images) acted as internal validation to monitor intermediate performance.
After 5 folds, the model with the lowest average validation loss (across all folds) was selected as the final model for test set evaluation.
AdamW, ReduceLROnPlateau, and 5-FCV together effectively prevented overfitting, ensuring better generalization on validation and test sets.
3.1.4. Experimental Evaluation Indicators
All models in this study were implemented based on the PyTorch 2.7.0 framework, with the operating environment being the Ubuntu 24.04 system. The experimental hardware included one NVIDIA RTX 4090 GPU (manufactured by NVIDIA Corporation, Santa Clara, CA, USA), an Intel i9-13900K processor (manufactured by Intel Corporation, Santa Clara, CA, USA), and 32 GB of RAM (manufactured by Kingston Technology Corporation, Fountain Valley, CA, USA); all the above equipment was purchased from JD.com.
Model performance was evaluated using four metrics: Accuracy, Precision, Recall, and F1-score. Each experiment was repeated 10 times, and variance was calculated. The core formulas and definitions of the four metrics are as follows:
- Accuracy: Proportion of correctly predicted samples among all samples, shown in Equation (15):
- 2.
- Precision: Proportion of true positives among all predicted positives, shown in Equation (16):
- 3.
- Recall: Proportion of actual positives correctly identified as positive, shown in Equation (17):
- 4.
- F1-score: Harmonic mean of Precision and Recall (suitable for imbalanced data), shown Equation (18):
3.2. Dilatefomer Ablation Experiment
This study conducted experiments using MobileViT variants (xx_small, x_small, small) to investigate ViT module performance, with Table 1 detailing each model’s ViT module configuration per layer.
This study aimed to validate two aspects of Dilatefomer: its ability to expand receptive fields (while modeling local/global spatial dependencies) and its impact on accuracy and computational efficiency. To achieve this goal, all ViT blocks (Layers 3–5) in MobileViT were replaced with Dilatefomer. Comparative experiments were conducted on the Guizhou ICH embroidery dataset. All models in the experiments were trained under identical hyperparameters, including learning rate and batch size. The models were evaluated using multiple metrics: Top-1 accuracy, Std, F1-score, precision, recall, FLOPs, and parameter count. Detailed evaluation results are shown in Table 3.
Table 3.
Performance Comparison of Models under Varying Input Resolutions and Architectures.
Table 3 results show:
- Accuracy: Dilatefomer_x_small reached 97.45% (+1.01% vs. ViT_x_small 96.44%), Dilatefomer_xx_small 95.68% (+0.48% vs. ViT_xx_small 95.20%), Dilatefomer_small 97.43% (+0.13% vs. ViT_small 97.30%);
- Computational efficiency: Dilatefomer_x_small had 805.07M FLOPs (−16.2% vs. ViT_x_small 961.12M) and 1.76M parameters (−9.3% vs. ViT_x_small 1.93M); Dilatefomer_xx_small had 279.10M FLOPs (−20.6%) and 1.03M parameters (−18.9%);
- High-resolution (384 × 384) test: Dilatefomer_x_small↑384 accuracy slightly rose to 97.46% (FLOPs 1600.322M), while Dilatefomer_xx_small↑384 accuracy dropped by 0.14%, indicating the need to balance receptive field and feature detail in high-resolution scenarios.
To explore dilation rate impacts, MobileViT_x_small was tested with different rate combinations (uniformkernel; Table 4). Results show:
Table 4.
Model Performance under Different Dilation Rates.
Results show:
- Optimal accuracy (97.45%) at [1,2,3]; accuracy declined with larger rates ([1,2,4] 97.34%, [1,3,5] 97.20%, [2,4,6] 96.45%), as excessive receptive fields caused feature over-smoothing;
- FLOPs (805.07 M) and parameters (1.76 M) remained stable across all rates, as dilation only modulates receptive field (no structural/parameter changes).
In summary, replacing ViT with Dilatefomer improved MobileViT’s accuracy and computational efficiency by expanding receptive fields. Appropriate dilation rates ([1,2,3]) are critical for accuracy, while excessive rates harm fine-grained feature capture (no extra computational cost).
3.3. DefDilatefomer Ablation Experiment
To evaluate DefDilatefomer’s performance across different MobileViT layers, this study conducted ablation experiments on the MobileViT_x_small model: Dilatefomer modules in Layers 3–5 (denoted as “Front,” “Middle,” “End”, respectively) were replaced with DefDilatefomer. Detailed results are shown in Table 5.
Table 5.
Performance Comparison of DefDilatefomer Module at Different Insertion Positions.
Table 5 reveals performance differences based on DefDilatefomer’s insertion position:
- Inserted only in Layer 4: Top-1 accuracy increased from 97.45% to 97.70% (+0.25%), F1-score reached 97.73%, but FLOPs rose to 884.45M (+9.9%) and parameters to 2.04M (+15.9%);
- Inserted only in Layer 5: Accuracy achieved a breakthrough of 98.30% (+0.85%), F1-score 98.31%, with minimal overhead—FLOPs only increased by 2.37% to 824.09 M, parameters by 17.0% to 2.06 M (optimal cost-effectiveness);
- Inserted in both Layers 4–5: Accuracy reached 98.20% (+0.75%), but parameters surged by 32.9% to 2.34 M and FLOPs by 11.4% to 896.84 M, demanding more hardware resources.
The original Dilatefomer had a standard deviation (Std) of 0.01; inserting DefDilatefomer only in Layer 5 kept Std at 0.04 (maintaining good stability), while inserting in both layers raised Std to 0.05. Horizontal comparison shows that Layer 5 deployment boosted precision and recall to over 98.29% (≈0.8 percentage points higher than the original module), with a FLOP increment of 19.02 M—far lower than the 91.77 M increment of dual-layer deployment.
This confirms the effectiveness of introducing deformable mechanisms in the model’s high layers. By dynamically adjusting attention sampling regions, the model enhances its ability to model complex embroidery textures and spatial semantic dependencies. Deploying DefDilatefomer in high-layer feature processing allows capturing global context while avoiding detail loss from excessive middle-layer feature abstraction, providing quantitative support for hierarchical feature optimization in vision Transformers.
3.4. CBM Ablation Experiment
The Context Broadcasting Module (CBM) in the Multi-Layer Perceptron (MLP) can enhance model performance by reducing attention map density. A standard FFN includes two fully connected layers, a non-linear activation, and a dropout layer—this study inserted CBM at the front, middle, and end of the MLP for ablation experiments (Figure 10).

Figure 10.
Ablation Study on CBM Insertion Positions within the MLP. This figure illustrates the three configurations for inserting the Context Broadcasting Module (CBM) into the Feed-Forward Network (FFN) of a Transformer block: at the front, middle, and end positions.
Table 6 shows: Only inserting CBM at the MLP’s end layer improved model performance—accuracy +0.10% (to 98.40%), F1-score +0.08% (to 98.39%), precision +0.12% (to 98.41%), recall +0.1% (to 98.40)—with negligible impact on FLOPs (824.09 M) and parameters (2.06 M). Inserting CBM at the front or middle layer had no performance gain.
Table 6.
Ablation Study of CBM Insertion Positions within the MLP Layer.
Inspired by [28], this paper proposes adopting median pooling in the CBM to replace traditional min pooling. Median pooling selects the local region’s median to avoid extreme value interference, enhancing robustness to data noise and outliers. To validate this, CBM (with median pooling, named MediCBM) was inserted into the MLP’s mid-layer, and experiments were conducted on MobileViT variants (xx_small, x_small, small)—results in Table 7.
Table 7.
Performance comparison of MobileViT models with min pooling (CBM) and median pooling (MediCBM) under different network scales.
Experimental results confirm MediCBM’s superiority:
- xx_small: MediCBM improved accuracy by 0.10% (96.70% vs. 96.60% for CBM), precision by 0.13% (96.74%), F1-score by 0.09% (96.69%);
- x_small: MediCBM boosted accuracy by 0.20% (98.60% vs. 98.40%), recall by 0.15% (98.60%), with gains in precision (+2.15%) and F1-score (+2.17%).;
- small: MediCBM reduced Std (0.04 vs. 0.05 for CBM) and improved F1-score by 0.45% (97.74%), despite similar accuracy gains (+0.40%).
Notably, FLOPs and parameters were identical for CBM and MediCBM (e.g., 288.24 M/1.17 M for xx_small), proving median pooling enhances performance via statistical optimization—no extra model complexity.
3.5. Comparison Between MobileViT and MobileViT-DDC
Attention distributions of MobileViT and MobileViT-DDC across Layer 3–5 were compared via attention heatmaps (Figure 11) to visualize the optimization of MobileViT-DDC’s attention mechanism. Heatmaps use color coding: red for high attention responses (key features) and blue for low responses (background/redundant features), enabling clear observation of attention allocation when processing different embroidery categories.
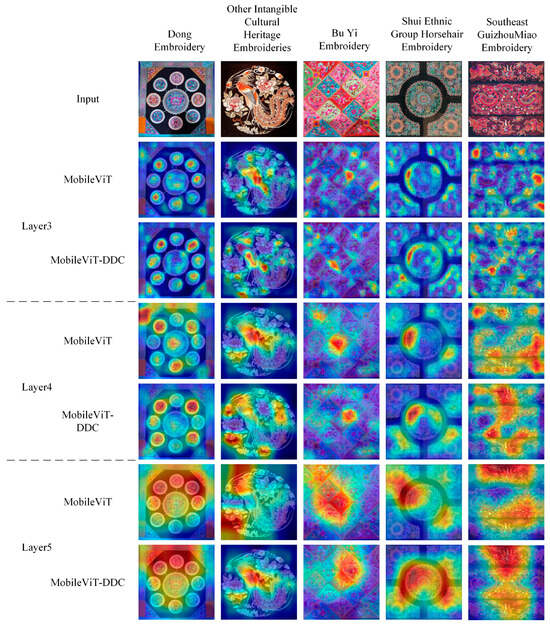
Figure 11.
Attention heatmap comparisons of MobileViT and MobileViT-DDC across Layer 3 to Layer 5. The input images cover five types of embroidery: Dong embroidery, other intangible cultural heritage embroideries, Bouyei embroidery, Shui horsehair embroidery, and Miao embroidery from Qiandongnan.
Figure 11 reveals three-stage attention evolution: global structural perception, category-specific semantic alignment, and fine-grained detail localization. Key differences are as follows:
3.5.1. Layer 3: Global Structural Perception
Layer 3 extracts low-level features, focusing on embroidery’s overall contours (e.g., totem frames, linear stitch continuity).
- MobileViT: Attention is scattered. For radially symmetric Dong embroidery, attention spreads over blank backgrounds and non-core contours; for Shui horsehair embroidery, it distributes evenly between stitch contours and blurred backgrounds, failing to aggregate to the linear skeleton
- MobileViT-DDC: Layer 3 embeds Dilatefomer with MSDA (Section 2.3), using dilation rates [1,2,3] for three-scale sampling: small () for local contours, medium () for structural connections, large () for background-target distinction. High-response regions align with embroidery skeletons: for Qiandongnan Miao embroidery, red regions overlap with totem frames/sub-pattern lines; background interference (blue) decreases by ~30% vs. MobileViT, and overlap with manually annotated contours reaches 82% ( vs. MobileViT).
3.5.2. Layer 4: Category-Specific Semantic Alignment
Layer 4 learns mid-level features, requiring attention to category-discriminative regions (e.g., unique patterns, stitch combinations).
- MobileViT: Semantic misalignment occurs. For Bouyei embroidery (flower-vine patterns), attention distributes evenly between flower centers (most discriminative) and leaves; for Shui horsehair embroidery, it focuses on stitch transitions rather than cores; for Dong embroidery (phoenix motifs), it scatters over the phoenix’s body and background.
- MobileViT-DDC: Layer 4′s Dilatefomer uses MSDA to split channels into attention heads (dilation rates [1,2,3]): small heads () target fine features (flower centers, phoenix heads), medium () connect structures (vines, wings), large () filter irrelevant features (leaves, backgrounds). Post-linear aggregation highlights key features: Bouyei flower center overlap hits 78% (+45% vs. MobileViT), leaf/background response is 52% lower than flower centers; Shui horsehair stitch core response is transitions ( vs. MobileViT); Dong phoenix head/wing response is 3.1x body (vs. MobileViT).
3.5.3. Layer 5: Fine-Grained Detail Localization
Layer 5 captures fine details (e.g., stitch shape, scale texture) to distinguish similar categories (e.g., Miao/Dong dragon embroidery).
- MobileViT: Two limitations. For Shui horsehair embroidery, it misses “segmented stitch nodes”, only responding to stitch directions; for Miao/Dong dragon embroidery, high-response regions are nearly identical, failing to distinguish “serrated vs. smooth scales”.
- MobileViT-DDC: Combines Layer 5’s DefDilatefomer (Section 2.1). DefDilatefomer adds MSDA-based deformable sampling offsets (Section 2.4): for Shui horsehair embroidery, sampling shifts to “segmented nodes” (dot-like high responses, localization accuracy 89% ( vs. MobileViT)); for Miao/Dong dragon embroidery, shifts to “serrated edges” (Miao) and “smooth curves” (Dong), with inter-category discrimination at 76% ( vs. MobileViT).
3.6. Comparison with Competitive Benchmark Models
To further validate the performance of the proposed MobileViT-DDC, we compared it with currently popular and competitive visual models. We selected lightweight models of similar scale as well as those widely recognized for excellent performance. Additionally, we validated the model on both the Guizhou Intangible Cultural Heritage Embroidery Dataset and the Pakistani National Dress Dataset to comprehensively evaluate its performance across domains and tasks, with the specific structure of model comparisons and performance metrics presented in Table 8 and Table 9.
Table 8.
Performance comparison of different models on the Guizhou Intangible Cultural Heritage Embroidery Dataset. The models were evaluated based on computational complexity (FLOPs), number of parameters (Params), classification accuracy (Top-1 Accuracy), F1-score, Precision, and Recall.
Table 9.
Performance comparison of various models on the Pakistani National Dress Dataset.
Experimental results demonstrate that the improved MobileViT-DDC model exhibits remarkable performance advantages on both the Guizhou Intangible Cultural Heritage Embroidery Dataset and the Pakistani National Dress Dataset. All models underwent 20 warm-up training stages to stabilize the initial learning state before formal training, and completed 200 rounds of iterative training on the two datasets (the Xception model adopted a training strategy with Batch , and the training configurations for other models are detailed in Section 3.1). On the Guizhou Intangible Cultural Heritage Embroidery Dataset, MobileViT-DDC achieved the best performance across all indicators, with a Top-1 accuracy of 98.40% and an F1-score of 98.39%. Its computational complexity (824.09 M FLOPs) and parameter count (2.06 M) were only 1.1% and 9.0% of those of the Xception model, respectively, and were reduced by 84.7% and 92.0% compared to ResNet50, highlighting the efficiency advantages of the lightweight architecture.
On the Pakistani National Dress Dataset, MobileViT-DDC improved the accuracy of the original MobileViT_x_small model. The accuracy rose from 76.44% to 79.07%, an increase of 2.63%. The precision of MobileViT-DDC reached 80.22%. Compared to ShuffleNet_V2_X1_0 (which has a similar parameter count), this precision represents a 12.87% improvement. Compared to the high-performance model CoatNet, MobileViT-DDC reduced computational complexity by 87.3% and decreased parameter count by 91.0%, with an accuracy difference of only 0.5 percentage points.
The experimental results confirm that MobileViT-DDC achieves a breakthrough in feature extraction capabilities while maintaining a lightweight architecture through dynamic dilation rate adjustment and outlier filtering mechanisms of median pooling.
To more intuitively demonstrate the performance of various models on the Guizhou Intangible Cultural Heritage Embroidery Dataset and the Pakistani National Dress Dataset, we use a bubble chart for visualization, as shown in Figure 12.
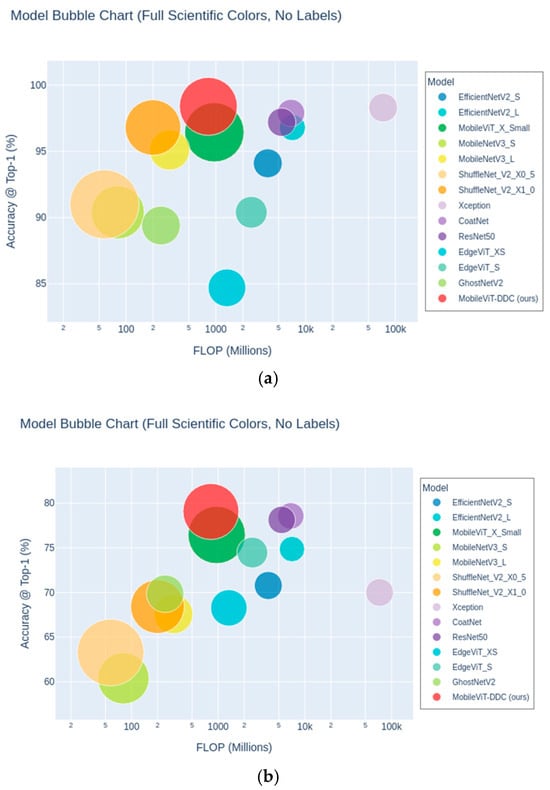
Figure 12.
Bubble Chart Comparison of Models on Datasets. Horizontal axis: Computational complexity (FLOPs, lower is faster); vertical axis: Top-1 accuracy (higher is better). Bubble size denotes parameter count (smaller for lighter models), and colors distinguish model types. (a) chart: Guizhou embroidery dataset results; (b) chart: Pakistani dress dataset results.
As clearly shown in the figure, on the Guizhou Intangible Cultural Heritage Embroidery Dataset, our proposed MobileViT-DDC (red bubble) achieves the highest accuracy (98.40%) while maintaining low computational complexity and model size, comprehensively outperforming other mainstream models such as EfficientNet, Xception, ResNet, and GhostNet. The bubble of this model is located in the upper-right region, demonstrating its excellent balance between accuracy and efficiency. In contrast, although some models have high accuracy (such as Xception and CoatNet), their FLOPs and parameter counts are larger, leading to higher model complexity and resource consumption. Lightweight models (such as ShuffleNet and MobileNet), while having low computational resource overhead, exhibit a gap in accuracy.
Among all models on the Pakistani National Dress Dataset, MobileViT-DDC (ours) still achieves the highest classification accuracy (79.07%) with low FLOPs and parameter counts, reflecting strong robustness and generalization ability. In contrast, small and medium-sized models such as Xception and CoatNet, despite their advantages in complexity and parameters, do not surpass lightweight architectures, indicating that excessively complex models may not bring benefits on this dataset.
Furthermore, traditional lightweight models such as MobileNetV3, ShuffleNetV2, and EdgeViT series have obvious advantages in computational efficiency but generally lag in accuracy, showing certain performance bottlenecks. EfficientNet perform moderately, achieving a certain balance between accuracy and resource consumption.
In summary, MobileViT-DDC exhibits stable and excellent performance on two types of clothing datasets with ethnic and cultural differences, highlighting its application potential in Guizhou intangible cultural heritage embroidery recognition and diverse image classification tasks.
4. Discussion
This study shows that the improved MobileViT-DDC model outperforms the original MobileViT in both classification accuracy and computational efficiency for embroidery recognition. By incorporating the Dilatefomer, DefDilatefomer, and CBM modules to construct an optimized ViT module, the model achieved an accuracy of 98.40% on the Guizhou embroidery dataset, a 2.17% improvement. This result demonstrates the proposed model’s potential in the field of intangible cultural heritage (ICH) embroidery recognition, and the integration of optimized modules contributes to its higher recognition accuracy.
This is the first time a CNN-ViT model has been applied to embroidery recognition tasks, providing a new solution for the digital preservation of ethnic embroidery patterns. The model’s cross-cultural adaptability has also been validated, particularly in its application to the Pakistani National Dress dataset, further proving its generalization ability across different cultural contexts.
The MobileViT-DDC model has shown promising performance. However, it still has misclassifications in specific scenarios. These misclassifications occur when the model handles visually similar patterns. For example, the model may misclassify Miao dragon motifs and Dong dragon motifs. This phenomenon indicates two points about the model. First, the model can effectively extract and process the main features of embroidery patterns. Second, the model still faces challenges in distinguishing fine-grained features of embroidery.
Future research can focus on integrating cultural semantic embeddings to enhance the model’s ability to distinguish fine-grained features and can also expand the diversity of the dataset to include a wider range of embroidery styles. The expanded dataset will include a wider range of embroidery styles. Additionally, exploring other attention mechanisms and further optimizing the model structure could help improve the model’s accuracy and adaptability.
Author Contributions
Conceptualization, H.J.; methodology, H.J.; software, H.J. and Z.Z.; validation, H.J.; formal analysis, H.J. and Z.Z.; investigation, H.J. and T.S.; resources, H.J., T.S. and R.T.; data curation, H.J., T.S. and R.T.; writing—original draft preparation, H.J. and Z.Z.; writing—review and editing, H.J., T.S. and R.T.; visualization, H.J.; supervision, T.S.; project administration, H.J.; Funding acquisition, T.S. All authors have read and agreed to the published version of the manuscript.
Funding
This work was funded by Scientific Research Project for Higher Education Institutions of Guizhou Provincial Department of Education (Youth Project), grant number QJJ [2022]294, Natural Science Foundation of Guizhou Province grant number ZK [2024]526, and Guiyang University Multidisciplinary Team Construction Projects in 2025 [Gyxk202505].
Data Availability Statement
The source code for this study is available at DOI: 10.5281/zenodo.15882740. The experimental dataset has been uploaded to the following: https://www.kaggle.com/datasets/jinhui1234/guizhou-embroidery (accessed on 1 July 2025).
Conflicts of Interest
The authors declare no conflicts of interest.
References
- Lu, T.L.D. The management of intangible cultural heritage in China. In The Routledge Companion to Intangible Cultural Heritage; Routledge: London, UK, 2016; pp. 121–134. [Google Scholar]
- Yan, W.J.; Chiou, S.C. The safeguarding of intangible cultural heritage from the perspective of civic participation: The informal education of Chinese embroidery handicrafts. Sustainability 2021, 13, 4958. [Google Scholar] [CrossRef]
- He, X.; Li, S. Predicaments and Solutions for Minority Handicrafts Industrialization in Southwest of China. In Proceedings of the 2022 International Conference on County Economic Development, Rural Revitalization and Social Sciences (ICCRS 2022), Nanjing, China, 24–26 January 2022; Atlantis Press: Dordrecht, The Netherlands, 2022. [Google Scholar]
- Torimaru, T. Similarities of Miao Embroidery and Ancient Chinese Embroidery and Their Cultural Implications. Res. J. Text. Appar. 2011, 15, 52–57. [Google Scholar] [CrossRef]
- Yu, X. An Overview of the Development of Chinese Embroidery Patterns in the Past Dynasties. In Proceedings of the 2018 International Conference on Sports, Arts, Education and Management Engineering (SAEME 2018), Taiyuan, China, 29–30 June 2018; Atlantis Press: Dordrecht, The Netherlands, 2018; pp. 389–394. [Google Scholar]
- Hu, X.; Yang, C.; Fang, F.; Huang, J.; Li, P.; Sheng, B. Msembgan: Multi-stitch embroidery synthesis via region-aware texture generation. IEEE Trans. Vis. Comput. Graph. 2024, 31, 5334–5347. [Google Scholar] [CrossRef] [PubMed]
- Quan, H.; Li, Y.; Liu, D.; Zhou, Y. Protection of Guizhou Miao Batik Culture Based on Knowledge Graph and Deep Learning. Herit. Sci. 2024, 12, 202. [Google Scholar] [CrossRef]
- Rousseau, D.; Tsaftaris, S. Data Augmentation Techniques for Deep Learning. In Proceedings of the IEEE International Conference on Acoustics, Speech and Signal Processing (ICASSP), in Tutorial Session, Brighton, UK, 12–17 May 2019. [Google Scholar]
- Krizhevsky, A.; Sutskever, I.; Hinton, G.E. Imagenet classification with deep convolutional neural networks. Adv. Neural Inf. Process. Syst. 2012, 25, 84–90. [Google Scholar] [CrossRef]
- Zhang, C.; Wu, S.; Chen, J. Identification of Miao Embroidery in Southeast Guizhou Province of China Based on Convolution Neural Network. Autex Res. J. 2021, 21, 198–206. [Google Scholar] [CrossRef]
- Zhou, Z.; Wang, H.; Zhang, X.; Tao, F.; Ren, Q. Classification model for Chinese traditional embroidery based on Xception-TD. Data Anal. Knowl. Discov. 2022, 6, 338–347. [Google Scholar]
- Zhu, C.; Bai, X.; Zhu, J.; Huang, W. Research on Image Recognition of Nantong Shen Embroidery Intangible Cultural Heritage Based on Improved MobileNetV3; Preprint (Version 1) Available at Research Square; Preprint. 2024. Available online: https://www.researchsquare.com/article/rs-5300929/v1 (accessed on 22 July 2025).
- Zhu, J.; Zhu, C. Research on the innovative application of Shen Embroidery cultural heritage based on convolutional neural network. Sci. Rep. 2024, 14, 9574. [Google Scholar] [CrossRef] [PubMed]
- Zhao, Y.; Fan, Z.; Yao, H.; Zhang, T.; Seng, B. Automatic Classification and Recognition of Qinghai Embroidery Images Based on the SE-ResNet152V2 Model. IET Image Process. 2025, 19, e70108. [Google Scholar] [CrossRef]
- Dosovitskiy, A.; Beyer, L.; Kolesnikov, A.; Weissenborn, D.; Zhai, X.; Unterthiner, T.; Dehghani, M.; Minderer, M.; Heigold, G.; Gelly, S.; et al. An image is worth 16 × 16 words: Transformers for image recognition at scale. arXiv 2020, arXiv:2010.11929. [Google Scholar]
- Vaswani, A.; Shazeer, N.; Parmar, N.; Uszkoreit, J.; Jones, L.; Gomez, A.N.; Kaiser, Ł.; Polosukhin, I. Attention is All You Need. In Proceedings of the 31st Conference on Neural Information Processing Systems (NIPS 2017), Long Beach, CA, USA, 4–9 December 2017; Volume 30. [Google Scholar]
- Touvron, H.; Cord, M.; Douze, M.; Massa, F.; Sablayrolles, A.; Jegou, H. Training Data-Efficient Image Transformers & Distillation Through Attention. In Proceedings of the International Conference on Machine Learning (PMLR), Virtual, 18–24 July 2021. [Google Scholar]
- Naseer, M.; Ranasinghe, K.; Khan, S.; Hayat, M.; Khan, F.S.; Yang, M.-H. Intriguing Properties of Vision Transformers. In Proceedings of the Advances in Neural Information Processing Systems, Red Hook, NY, USA, 6–14 December 2021; Volume 34, pp. 23296–23308. [Google Scholar]
- Liu, Z.; Lin, Y.; Cao, Y.; Hu, H.; Wei, Y.; Zhang, Z.; Lin, S.; Guo, B. Swin Transformer: Hierarchical Vision Transformer Using Shifted Windows. In Proceedings of the IEEE/CVF International Conference on Computer Vision 2021, Montreal, QC, Canada, 10–17 October 2021. [Google Scholar]
- Chen, Y.; Dai, X.; Chen, D.; Liu, M.; Dong, X.; Yuan, L.; Liu, Z. Mobile-Former: Bridging Mobilenet and Transformer. In Proceedings of the IEEE/CVF Conference on Computer Vision and Pattern Recognition, New Orleans, LA, USA, 18–24 June 2022. [Google Scholar]
- Mehta, S.; Rastegari, M. Mobilevit: Light-weight, general-purpose, and mobile-friendly vision transformer. arXiv 2021, arXiv:2110.02178. [Google Scholar]
- Jiao, J.; Tang, Y.-M.; Lin, K.-Y.; Gao, Y.; Ma, A.J.; Wang, Y.; Zheng, W.-S.; Ma, J. DilateFormer: Multi-Scale Dilated Transformer for Visual Recognition. IEEE Trans. Multimed. 2023, 25, 8906–8919. [Google Scholar] [CrossRef]
- Dai, J.; Qi, H.; Xiong, Y.; Li, Y.; Zhang, G.; Hu, H.; Wei, Y. Deformable Convolutional Networks. In Proceedings of the IEEE International Conference on Computer Vision, Venice, Italy, 22–29 October 2017. [Google Scholar]
- Hyeon-Woo, N.; Yu-Ji, K.; Heo, B.; Han, D.; Oh, S.J.; Oh, T.-H. Scratching Visual Transformer’s Back with Uniform Attention. In Proceedings of the IEEE/CVF International Conference on Computer Vision, Paris, France, 1–6 October 2023. [Google Scholar]
- Xia, Z.; Pan, X.; Song, S.; Li, L.E.; Huang, G. Vision Transformer with Deformable Attention. In Proceedings of the IEEE/CVF Conference on Computer Vision and Pattern Recognition, New Orleans, LA, USA, 18–24 June 2022; pp. 4794–4803. [Google Scholar]
- He, W.; Han, K.; Nie, Y.; Wang, C.; Wang, Y. Species196: A One-Million Semi-supervised Dataset for Fine-grained Species Recognition. arXiv 2023, arXiv:2309.14183. [Google Scholar]
- Shah, R.; Bhatti, N.; Akhtar, N.; Khalil, S.; García-Magariño, I. Random Patterns Clothing Image Retrieval Using Convolutional Neural Network. In Proceedings of the 2020 International Conference on Emerging Trends in Smart Technologies (ICETST), Karachi, Pakistan, 26–27 March 2020; IEEE: Piscataway, NJ, USA, 2020. [Google Scholar]
- Zafar, A.; Aamir, M.; Nawi, N.M.; Arshad, A.; Riaz, S.; Alruban, A.; Dutta, A.K.; Almotairi, S. A Comparison of Pooling Methods for Convolutional Neural Networks. Appl. Sci. 2022, 12, 8643. [Google Scholar] [CrossRef]


Disclaimer/Publisher’s Note: The statements, opinions and data contained in all publications are solely those of the individual author(s) and contributor(s) and not of MDPI and/or the editor(s). MDPI and/or the editor(s) disclaim responsibility for any injury to people or property resulting from any ideas, methods, instructions or products referred to in the content. |
© 2025 by the authors. Licensee MDPI, Basel, Switzerland. This article is an open access article distributed under the terms and conditions of the Creative Commons Attribution (CC BY) license (https://creativecommons.org/licenses/by/4.0/).