Article

Discrete Memristor-Based Hyperchaotic Map and Its Analog Circuit Implementation

1
Guizhou Key Laboratory of Artificial Intelligence and Brain-Inspired Computing, College of Mathematics and Big Data, Guizhou Education University, Guiyang 550018, China
2
School of Artificial Intelligence, Guangzhou University, Guangzhou 510006, China
3
Faculty of Information Science and Technology, Universiti Kebangsaan Malaysia, Bangi 43600, Malaysia
*
Author to whom correspondence should be addressed.
These authors contributed equally to this work.
Symmetry 2025, 17(8), 1358; https://doi.org/10.3390/sym17081358
Submission received: 11 July 2025 / Revised: 14 August 2025 / Accepted: 16 August 2025 / Published: 19 August 2025
(This article belongs to the Special Issue Symmetry/Asymmetry in Chaos Theory and Application)

Abstract

In this paper, control parameters are incorporated into the absolute discrete memristor (A-DM) map proposed by Bao, and its dynamic characteristics are analyzed. Subsequently, the A-DM is introduced into the traditional sine map via parallel coupling to construct a new sine A-DM hyperchaotic map (SAHM). The dynamics of SAHM are investigated using Lyapunov exponent spectra and bifurcation diagrams, with additional analysis on its multi-stability and symmetry properties. Circuit simulations successfully realize the attractors corresponding to SAHM under typical parameters. Evaluations of SAHM’s complexity, performance comparisons, and its application to pseudorandom number generators (PRNG) demonstrate that SAHM is well-suited for secure encryption scenarios.

1. Introduction

In 1971, Professor Chua proposed that memristors are the fourth fundamental component in electronic circuits after resistors, capacitors, and inductors [1]. The nonlinear characteristics of memristors make them of great value in constructing novel chaotic systems. In 1976, Chua introduced the ideal memristor model into the study of generalized memristor dynamics systems and found that memristors exhibit typical compression hysteresis loop characteristics on the voltage current plane under periodic signal excitation [2]. However, it was not until HP’s Williams team successfully developed the first solid-state memristor made of Pt/TiO2/Pt material that physical memristors were truly realized. Due to their non-volatile and unique nonlinear characteristics, memristors have been widely used in various fields such as secure communication [3,4,5], image encryption, neural networks [6,7,8,9,10], and chaotic systems.
Memristors can be divided into continuous memristors and discrete memristors. Discrete memristors are obtained by discretizing continuous memristors [11], and their model structure is relatively simple, making them more advantageous to implement. Compared with continuous memristive chaotic systems, discrete memristive maps only require two dimensions to generate chaotic behavior [12], making them more attractive in theoretical research and practical applications. In recent years, significant progress has been made in the application of discrete memristors in chaotic systems. For example, in 2020, a research team extended the chaotic region of the Hénon map and enhanced its complexity by introducing a second-order charge-controlled discrete memristor [13]. Peng proposed a high-dimensional hyperchaotic map that couples discrete sine memristors. By changing the coupling position of the memristor, different dynamic behaviors can be generated. This method not only expands the chaotic region and improves system complexity but also switches chaotic maps according to application scenario requirements [14]. Professor Ma first proposed a discrete locally active memristor and coupled it with a generalized square map to obtain a new map with a wider hyperchaotic region [15]. Lazaros Laskaridis of Thessaloniki proposed a discrete memristive hyperchaotic map with a modulus function, which exhibits a wide range of hyperchaotic behavior [16]. In the same year, Du implemented a discrete memristor model with multi-channel feedback control, which exhibited special chaotic behavior such as parameter control offset, initial value offset, multi-vortex volume, separation structure, transient similarity, spatial expansion and contraction, symmetry, etc. [17].
With the in-depth research on discrete memristors, their application scope has gradually expanded to the fields of neurons and neural networks [18,19,20,21,22]. Li proposed coupling hyperbolic tangent memristors in a discrete Rulkov neuron model to form a new m-Rulkov neuron. This model not only has rich chaotic dynamic behavior but also better describes the actual discharge activity of biological neurons [23]. Li applied discrete hyperbolic tangent memristors to Rulkov neurons and constructed a memristive Rulkov neuron model with local amplitude control, offset control, and initial offset control, which helps to better understand signal processing and information encoding in brain-inspired computing [24]. In addition, Lai used locally active memristors to simulate electromagnetic radiation stimulation of neurons and constructed a discrete neural network model with coexisting heterogeneous attractors and richer complex chaotic dynamics [25].
As a classic discrete-time dynamical system, the sine map exhibits chaotic behavior within a specific parameter range [26,27]. However, its chaotic interval is relatively narrow, and it has disadvantages such as low complexity and insufficient sensitivity to initial values. These limitations limit its widespread use in practical applications. Although previous studies have attempted to couple memristors into sine maps to enhance their chaotic properties, most of these studies have focused on theoretical simulations and lack verification through analog circuits [28]. He proposed a fractional-order discrete memristor modeling method and coupled it to a sine map, thereby increasing the complexity of nonlinear chaotic maps and enhancing their multi-stability [29]. At present, sine maps have problems such as narrow chaotic intervals, low complexity, and insufficient sensitivity to initial values, which limit their widespread use in practical applications. To address this issue, we coupled a simple discrete memristor into a sine map and implemented it through numerical simulation and analog circuits to observe the changes in its dynamic behavior. The research results indicate that this coupling structure significantly broadens the chaotic range of the sine map, providing new ideas for improving the performance of the sine map and offering potential application value for fields such as secure communication and image encryption that require high complexity and robustness.
The main contributions and highlights in this paper are as follows:
(1)
Controllable parameters are integrated into the A-DM map, enabling in-depth investigation of its global and local amplitude control characteristics—with circuit-level validation of the discrete map achieved via analog circuit simulation.
(2)
A novel hyperchaotic map—featuring multi-stability, symmetry, high complexity, and an extensive chaotic region—is constructed via parallel coupling operation of the A-DM and sine map.
(3)
Circuit simulation with a step power supply provides initial values for SAHM, validating analog circuit realization of coexisting attractors. The NIST test passage of PRNs generated by SAHM confirms its applicability to secure encryption scenarios.
The rest section is arranged as follows: Section 2 describes the mathematical modeling, simulation circuit design, and circuit simulation verification of discrete memristors. In Section 3, the chaotic map based on a discrete memristor is analyzed, including its dynamic behavior, amplitude control, multi-stability, and analog circuit implementation. In Section 4, the discrete memristor is coupled with the sine map to construct a new hyperchaotic map, and its dynamic characteristics, symmetry, and circuit realization are investigated. Section 5 introduces the complexity analysis of the proposed chaotic maps and compares their performance with other existing systems. The conclusion is drawn in the last section.

2. Discrete Memristor Chaotic Map

According to the discrete mathematical representation of the memristor A-DM map [30], and to increase its parameter controllability, parameters a and h are added, so the absolute value of its ideal charge control discrete memristor can be expressed as Equation (1)
v n = M ( q n ) i n = ( a q n h ) i n q n + 1 = c i n + q n
where in is the current of the memristor, vn is the voltage of the memristor, and qn is the charge variable. The memristor function M(qn) = k (a|qn| − h) is chosen as an absolute value function.
Referring to Ref. [31], Fu proposed an analog circuit scheme that can be used to implement discrete memristors. A circuit that can adjust the A-DM circuit of discrete memristors is designed, which consists of 11 resistors (R1R11), four operational amplifiers (U1U4), three input power supplies (V1, V2, Vq(0)), and two sample and hold devices (S1, S2), two multipliers (M1, M2), and an inverter. V1 represents the sampling input of two sample-and-hold devices. It is a square wave voltage source as well as a sine signal source. Vq(0) means the initial value of the state variable qn, which is input through a step voltage source [32]. The circuit implementation is in PSIM 2024, and the drawing tool is Origin 2024.
According to Kirchhoff’s law, the circuit equation described in Figure 1 can be expressed in mathematical form as
V v ( n ) = R 8 R 11 R 7 R 9 V q ( n ) V I R 10 R 11 V I V q ( n + 1 ) = R 2 R 6 R 5 R 1 V q ( n ) + R 2 R 6 R 1 R 4 V I + R 3 R 1 V q ( 0 ) .
Since the parameters in Equation (1) are all set to 1, Figure 1 should correspond to the parameters in the memristor equation, that is, Rx = 10 KΩ (x = 1, 2, …, 16).
In Figure 1, an analog circuit design is presented, which is intended to emulate the functionality of a discrete memristor. The nonlinear characteristics of memristors are simulated by a carefully designed combination of resistors, operational amplifiers, and memristor elements [32,33]. Simulation experiments were conducted to verify the effectiveness of the circuit design.
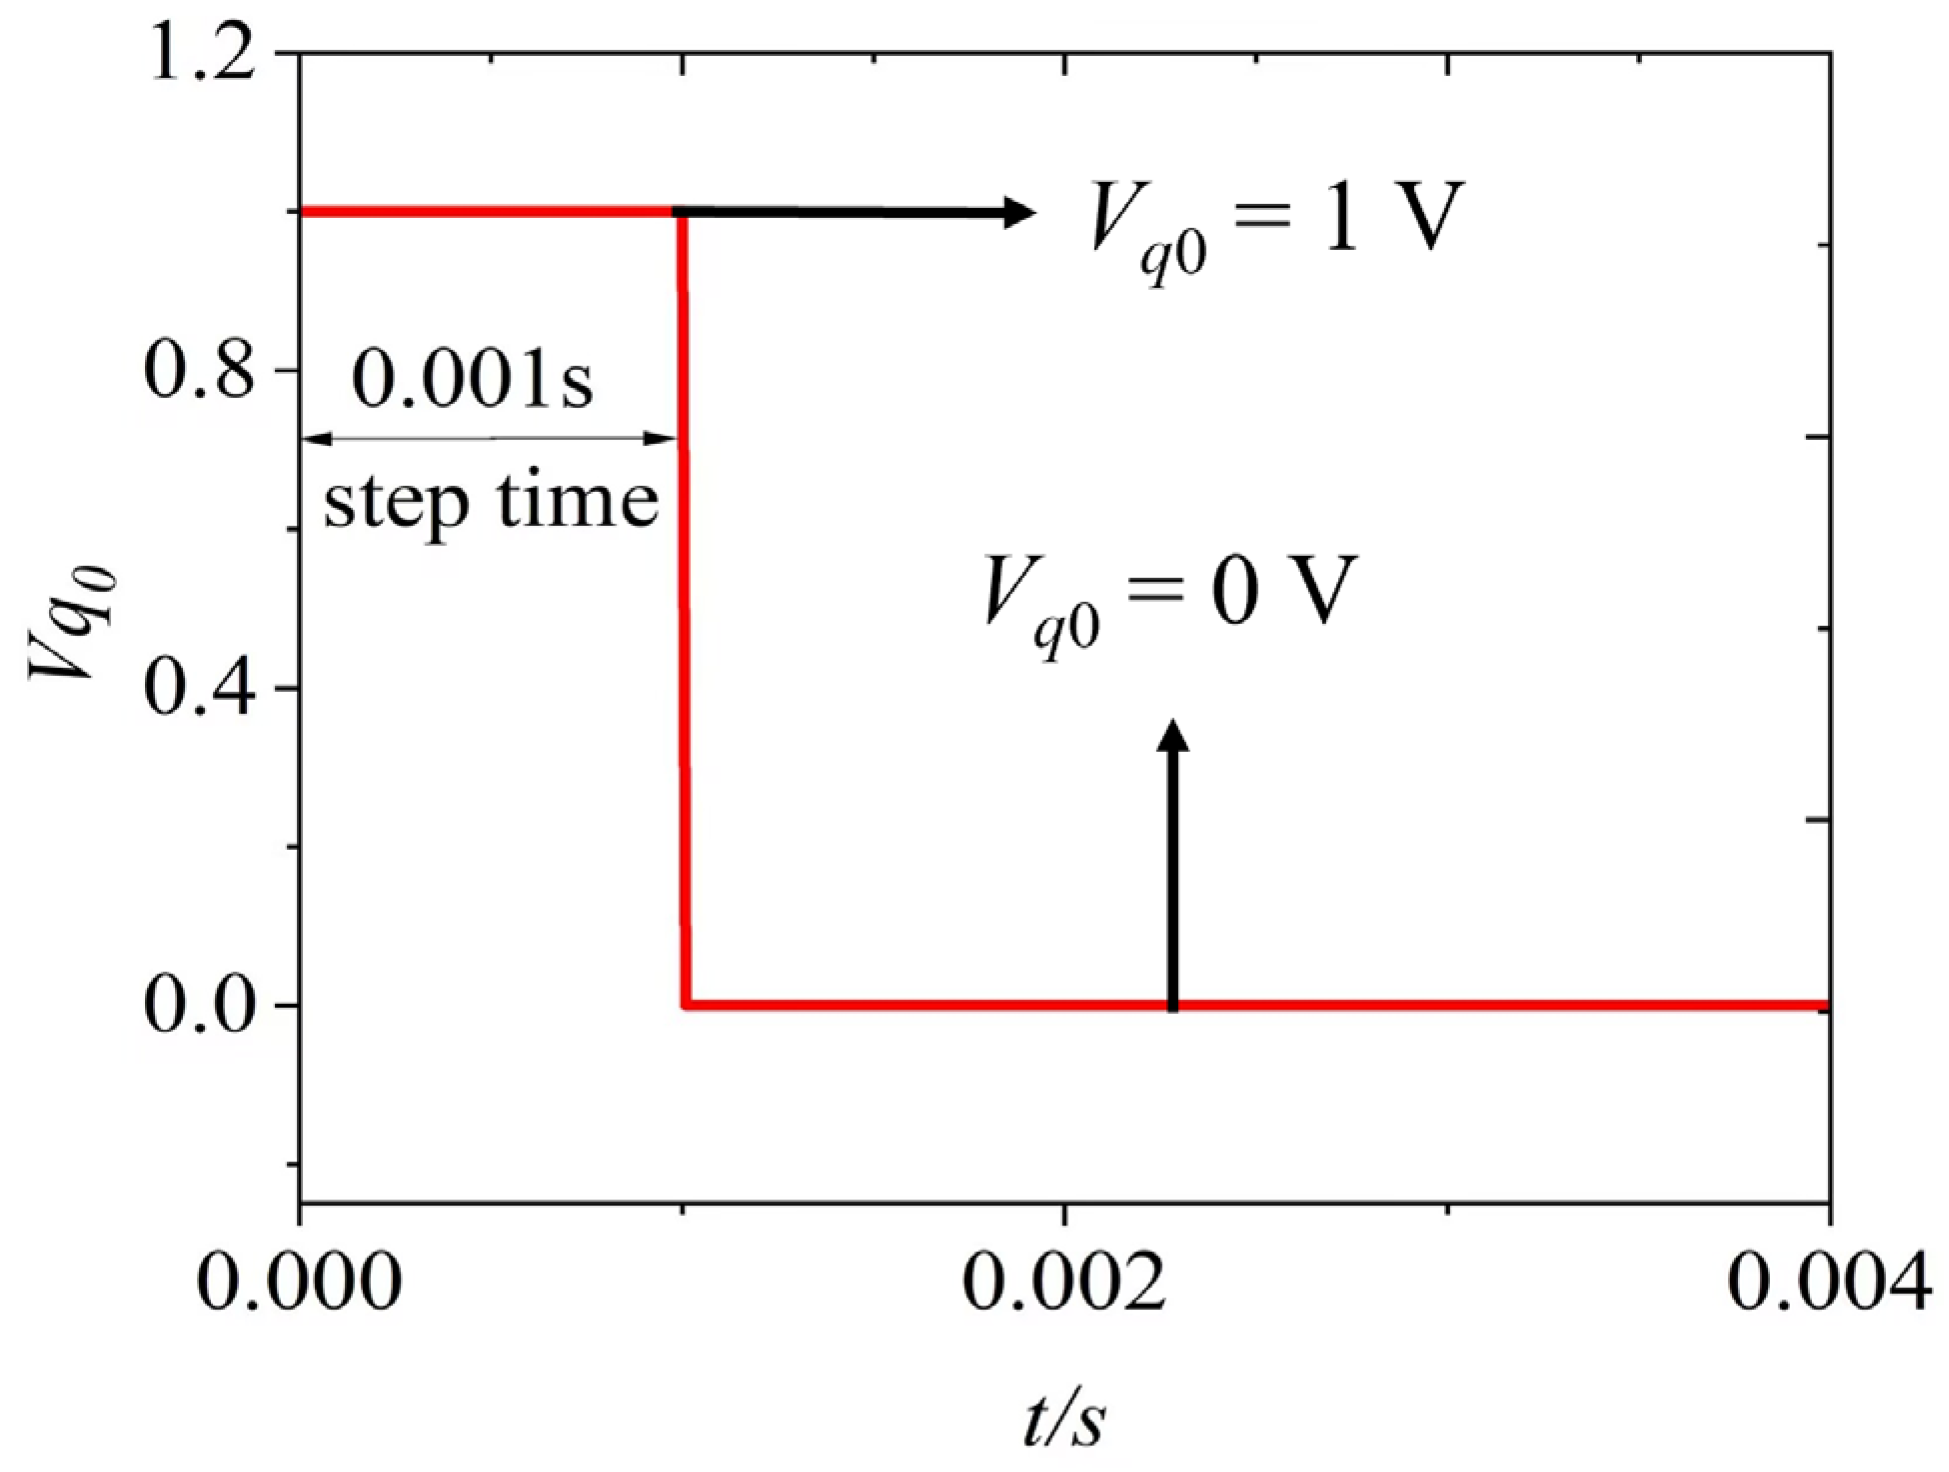
When the initial voltage is 1 V, the waveform of Vq(0) is shown in Figure 2. It can be observed that Vq(0) has a step time of 0.001 s and then returns to 0 V. The step time is consistent with the sampling interval tSH, which is determined by the frequency of the input square-wave voltage source Vi. Therefore, the Vq(0) provides the initial voltage only for the first sampling period without affecting subsequent iterations. This is also consistent with the definition of initial values for discrete iterations.
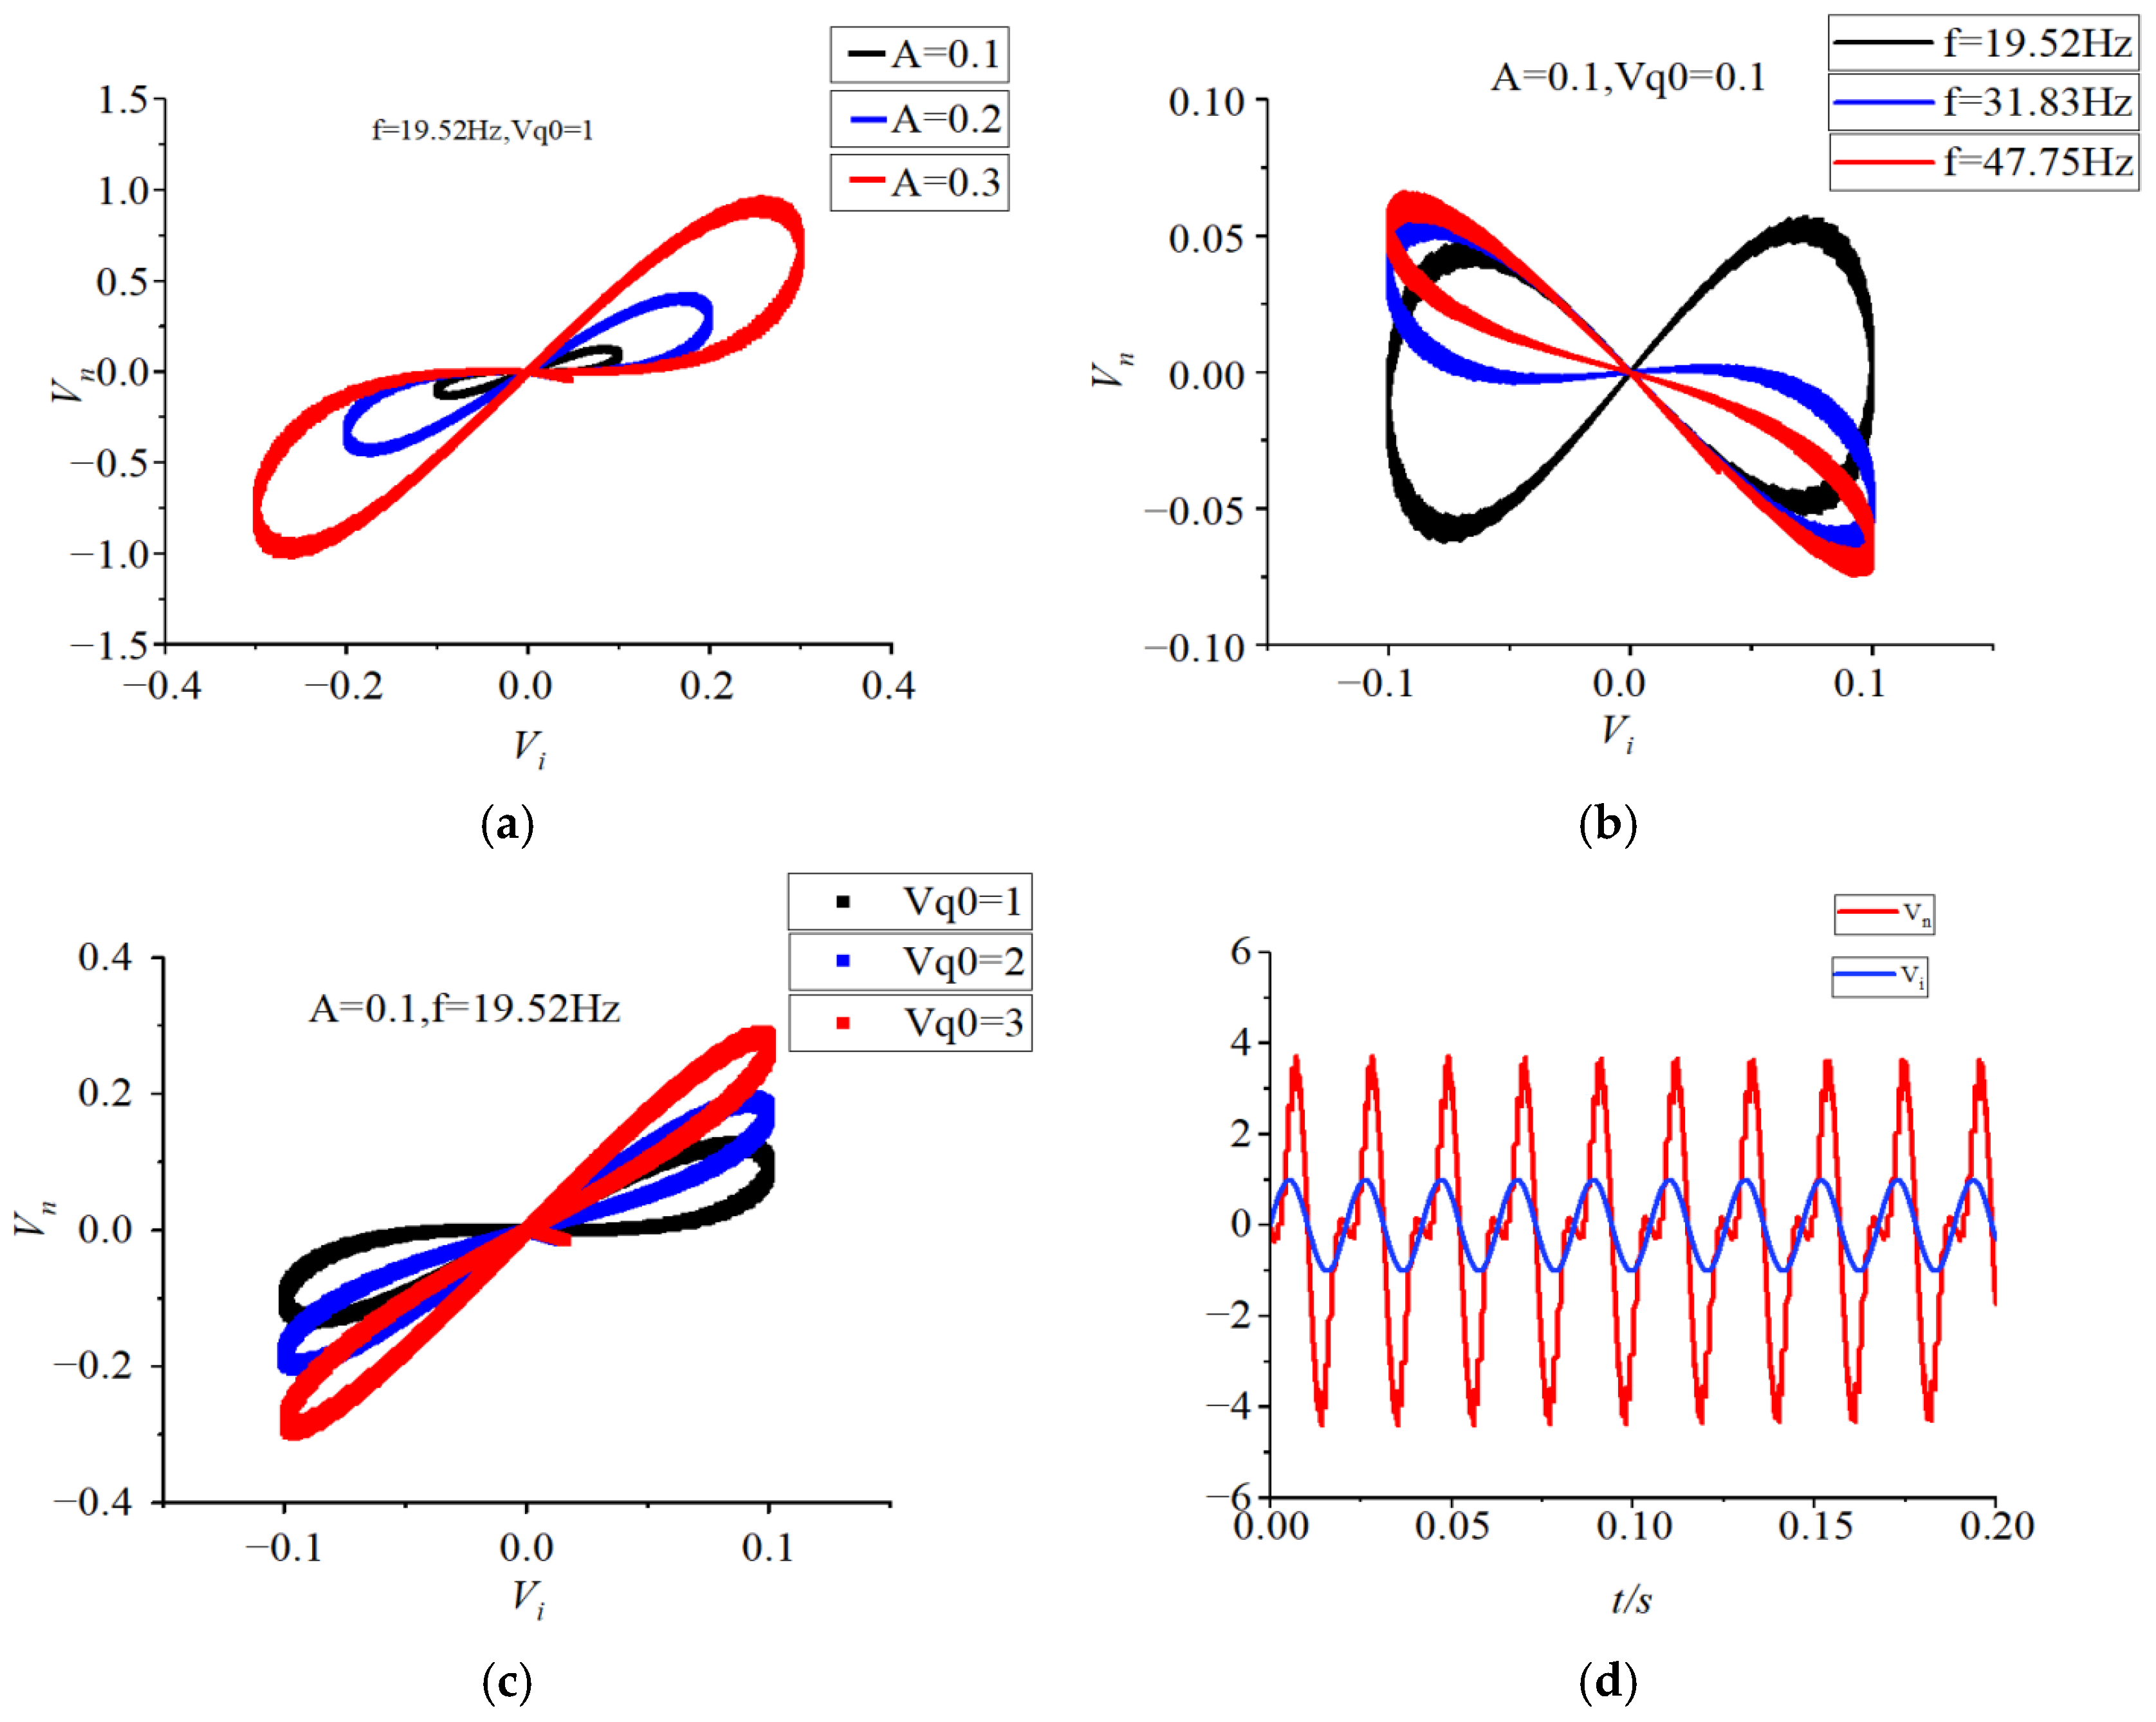
Then, Figure 3 shows the hysteresis curve of the memristor obtained through a circuit simulation. The simulation results are highly consistent with the circuit simulation results, which further proves the accuracy and reliability of the circuit design. The relationship between circuit input and output can form an 8-shaped hysteresis curve. As the amplitude of the input sine signal changes, the hysteresis curve in Figure 3a will scale according to the amplitude; as the frequency of the input signal increases, the sidelobe area of the hysteresis curve in Figure 3b will decrease; as the initial value changes, the hysteresis curve in Figure 3c will also change accordingly. In addition, it can be seen from the input timing waveform that there is a nonlinear relationship between the input and output in Figure 3d. Therefore, this circuit can simulate absolute value memristors.

3. Memristor Chaotic Map and Its Dynamic Analysis

3.1. Memristor Chaotic Map

According to the above proposed ideal charge-controlled A-DM [30], denote yn as qn and xn as in. Suppose that vn serves as both the output and the next input of the map. Meanwhile, we can add controllable parameters a, c, k, and h to the existing memristor to obtain Equation (3).
x n + 1 = k ( a y n h ) x n y n + 1 = c x n + y n

3.2. Dynamic Behavior Analysis of A-DM Map

We describe the dynamic characteristics of the newly designed absolute value memristor map by analyzing the dynamic behavior and the distribution of LE on the two-dimensional parameter plane [34,35]. This method allows us to more accurately distinguish and refine the dynamic behavior of the map. We study the dynamic behavior of the absolute memristor map by changing the different combinations of four adjustable parameters (a, c, k, and h).
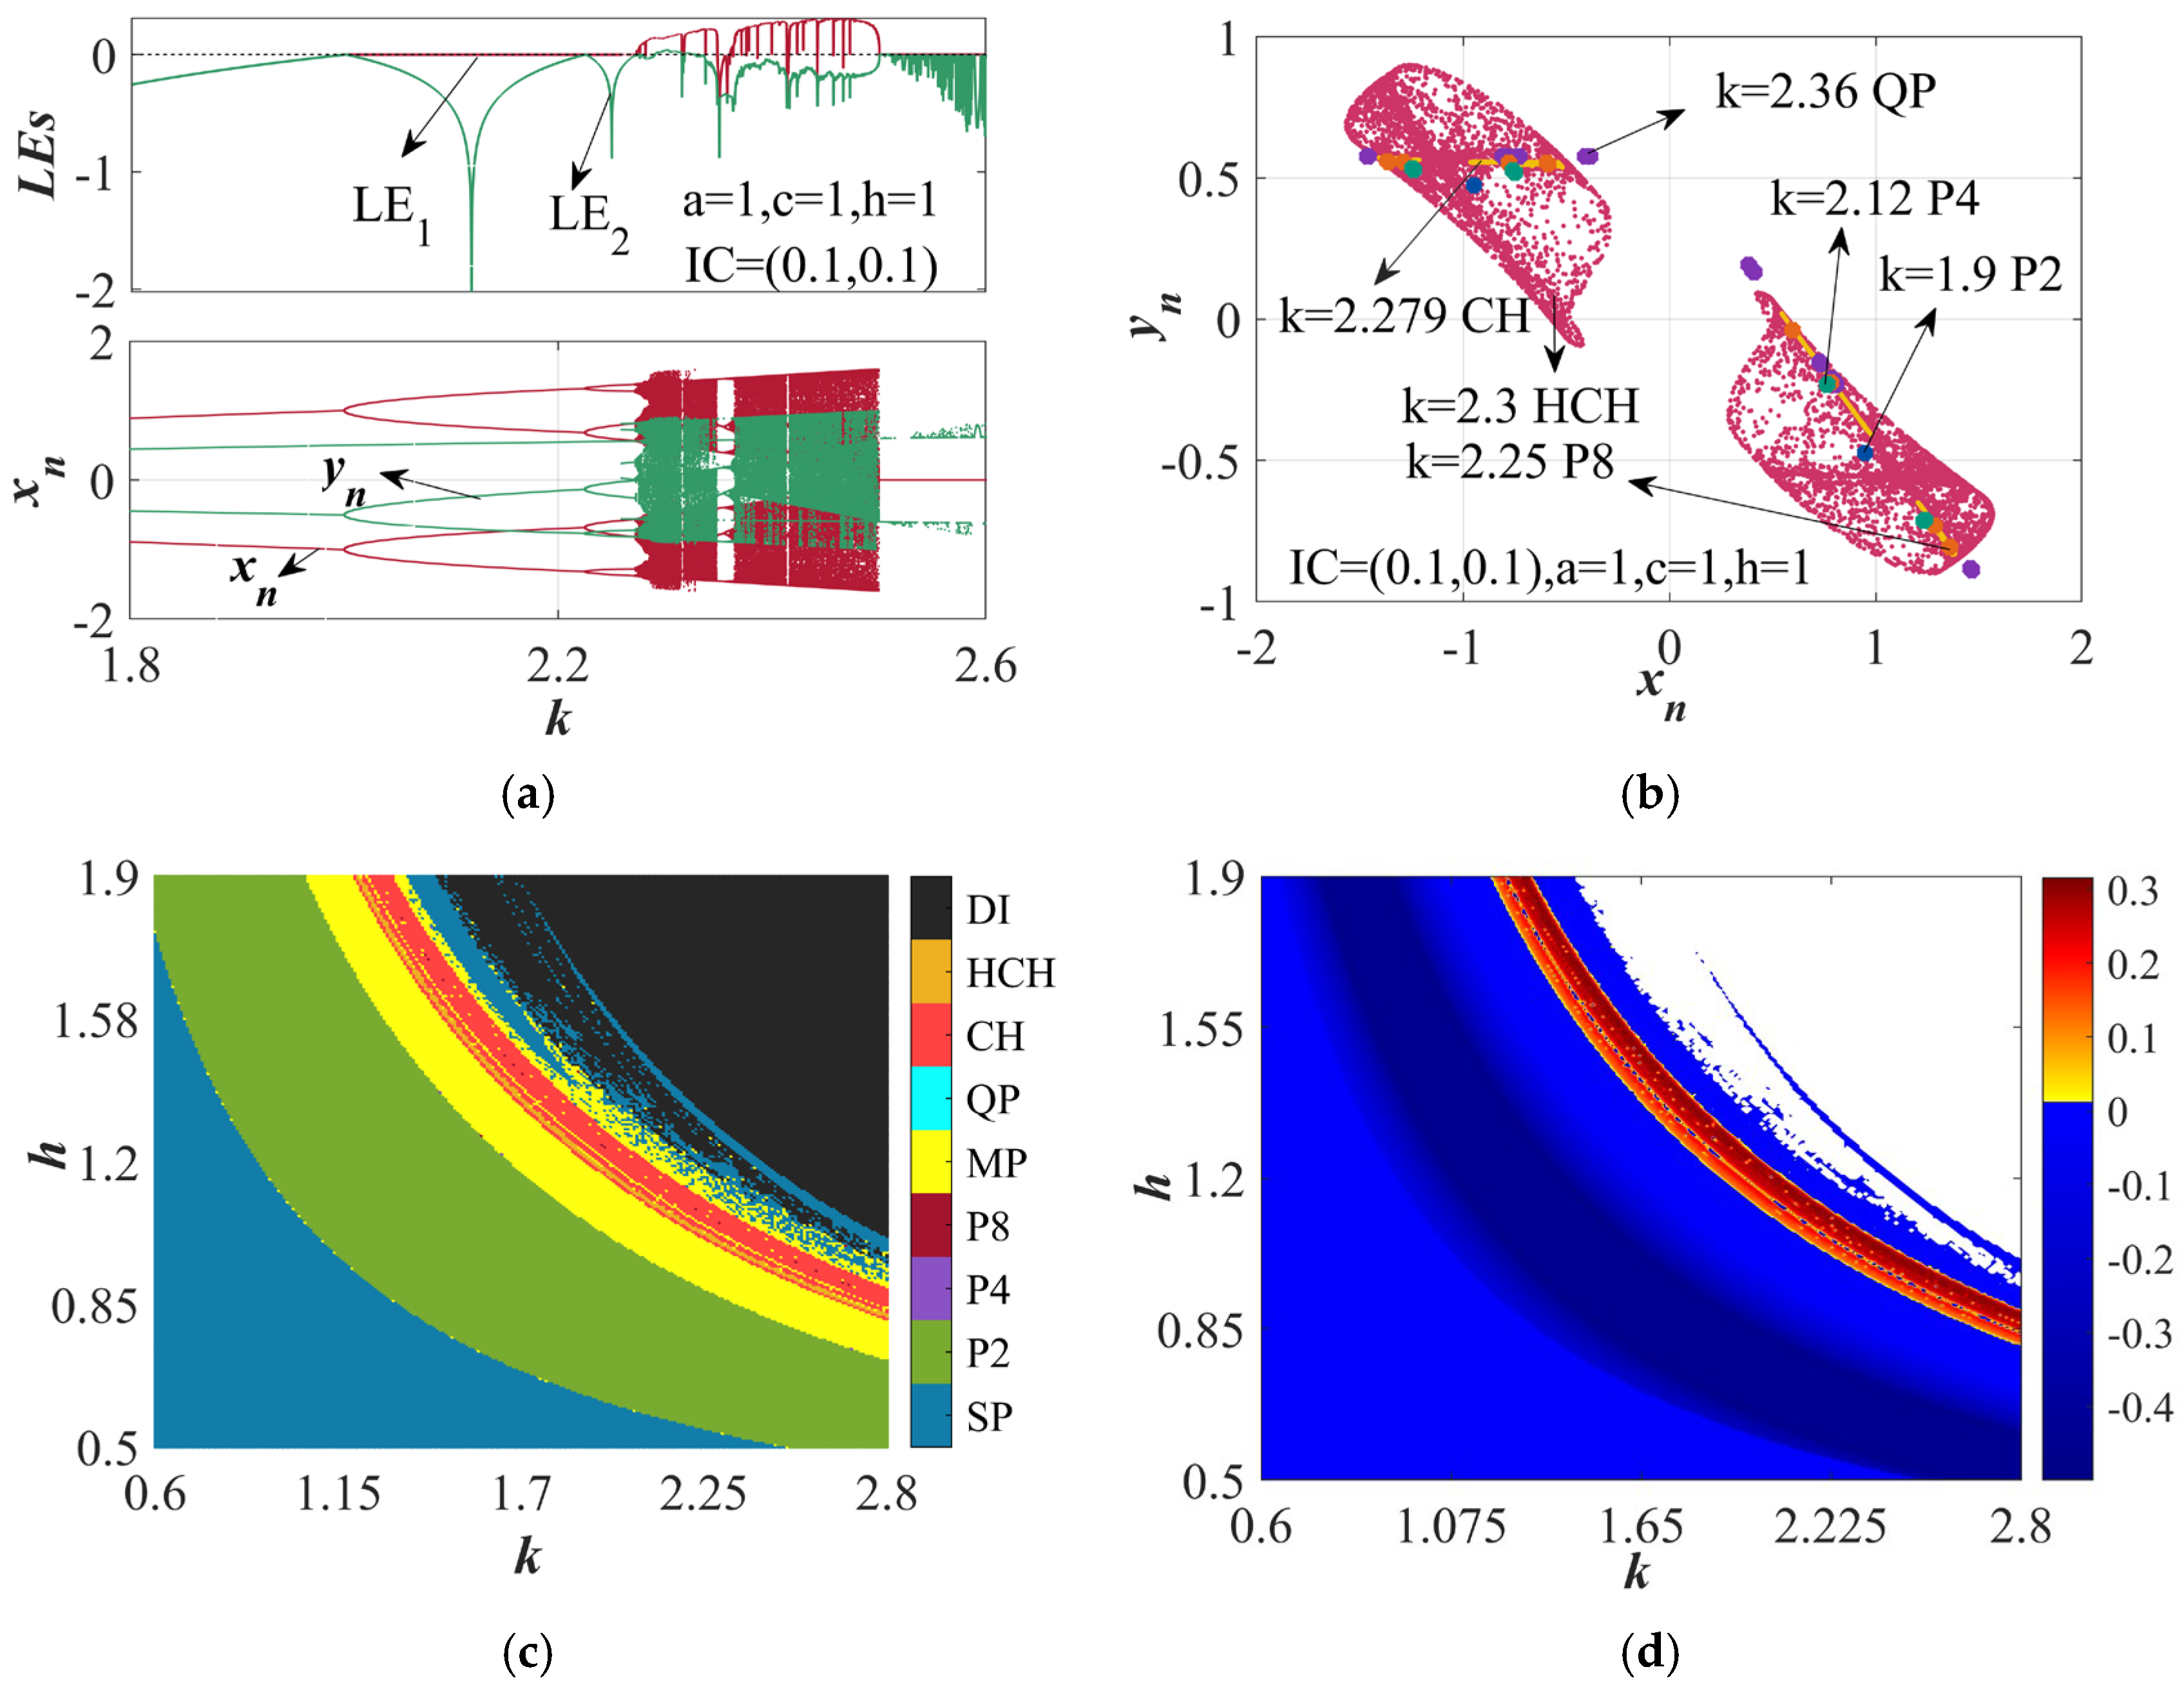
In the process of studying the newly designed absolute value memristor map, we set the initial condition (IC) to (0.1, 0.1) and let the parameters a = 1 and c = 1. Then, we let the parameters k and h change in the range of [0.6, 2.8] and [0.5, 1.9], respectively, to observe their impact on the system behavior. Two curves are drawn at the top of Figure 4a, labeled LE1 and LE2, respectively. These curves show the changes of LEs under different k values. The system parameter is set as a = 1, c = 1, h = 1, and IC = (0.1, 0.1). When k ∈ [2.273, 2.348] [2.361, 2.5] is within the interval, the LE1 value is always greater than 0. In the bifurcation diagram at the bottom of Figure 4a, xn and yn show two cycles (P2), four cycles (P4), eight cycles (P8), and multiple cycles (MP), respectively, in the interval [1.8, 2.6]. Figure 4b shows the trajectory of the system under different parameter k values with different color point groups. Each trajectory corresponds to a specific k value and is marked with the corresponding phase state name, thus revealing the dynamic characteristics of the system with changes in parameters. Figure 4c shows the dynamic behavior analysis of the A-DM map. Different dynamic behaviors are distinguished by different colors. Among them, the steel blue filled area represents the stable area (SP), the green and purple filled area represents the area with periods of two (P2) and four (P4), respectively, the dark red area represents the area with periods of eight (P8), the light blue area represents the quasi period (QP) area, the yellow area represents the multi period (MP) area, the red area represents the chaos (CH) area, the orange area represents the hyperchaos (HCH) area, and the black area represents the borderless (DI) area. From this picture, we can see intuitively how parameter changes lead to the transition of the system from a stable state to a chaotic and hyperchaotic state. Figure 4d The areas with different colors in Figure 4 show the change of variable values under different combinations of h and k. The closer the color is to red, the higher the variable value is; the closer the color is to blue, the lower the variable value is.

3.3. Amplitude Control

In addition to adjusting the coupling strength of the memristor to affect the dynamic behavior of the new map, parameters a and c can also adjust the dynamic characteristics of the map [36].
Assuming xn+1 = aun+1, yn+1 = avn+1, where m > 0, Equation (4) can be derived after the replacements. When a = 1, Equation (4) is the same as Equation (3), which reveals that parameter a of Equation (3) can rescale the amplitude of xn and yn according to 1/a. a is the global amplitude control parameter.
u n + 1 = k ( a 2 v n h ) u n v n + 1 = c u n + v n
Let xn+1 = cun+1, yn+1 = vn+1. When c = 1, Equation (5) is equivalent to Equation (3), which shows that c can rescale the amplitude of xn. So c is the local amplitude control parameter.
u n + 1 = k ( a v n h ) u n v n + 1 = c 2 u n + v n
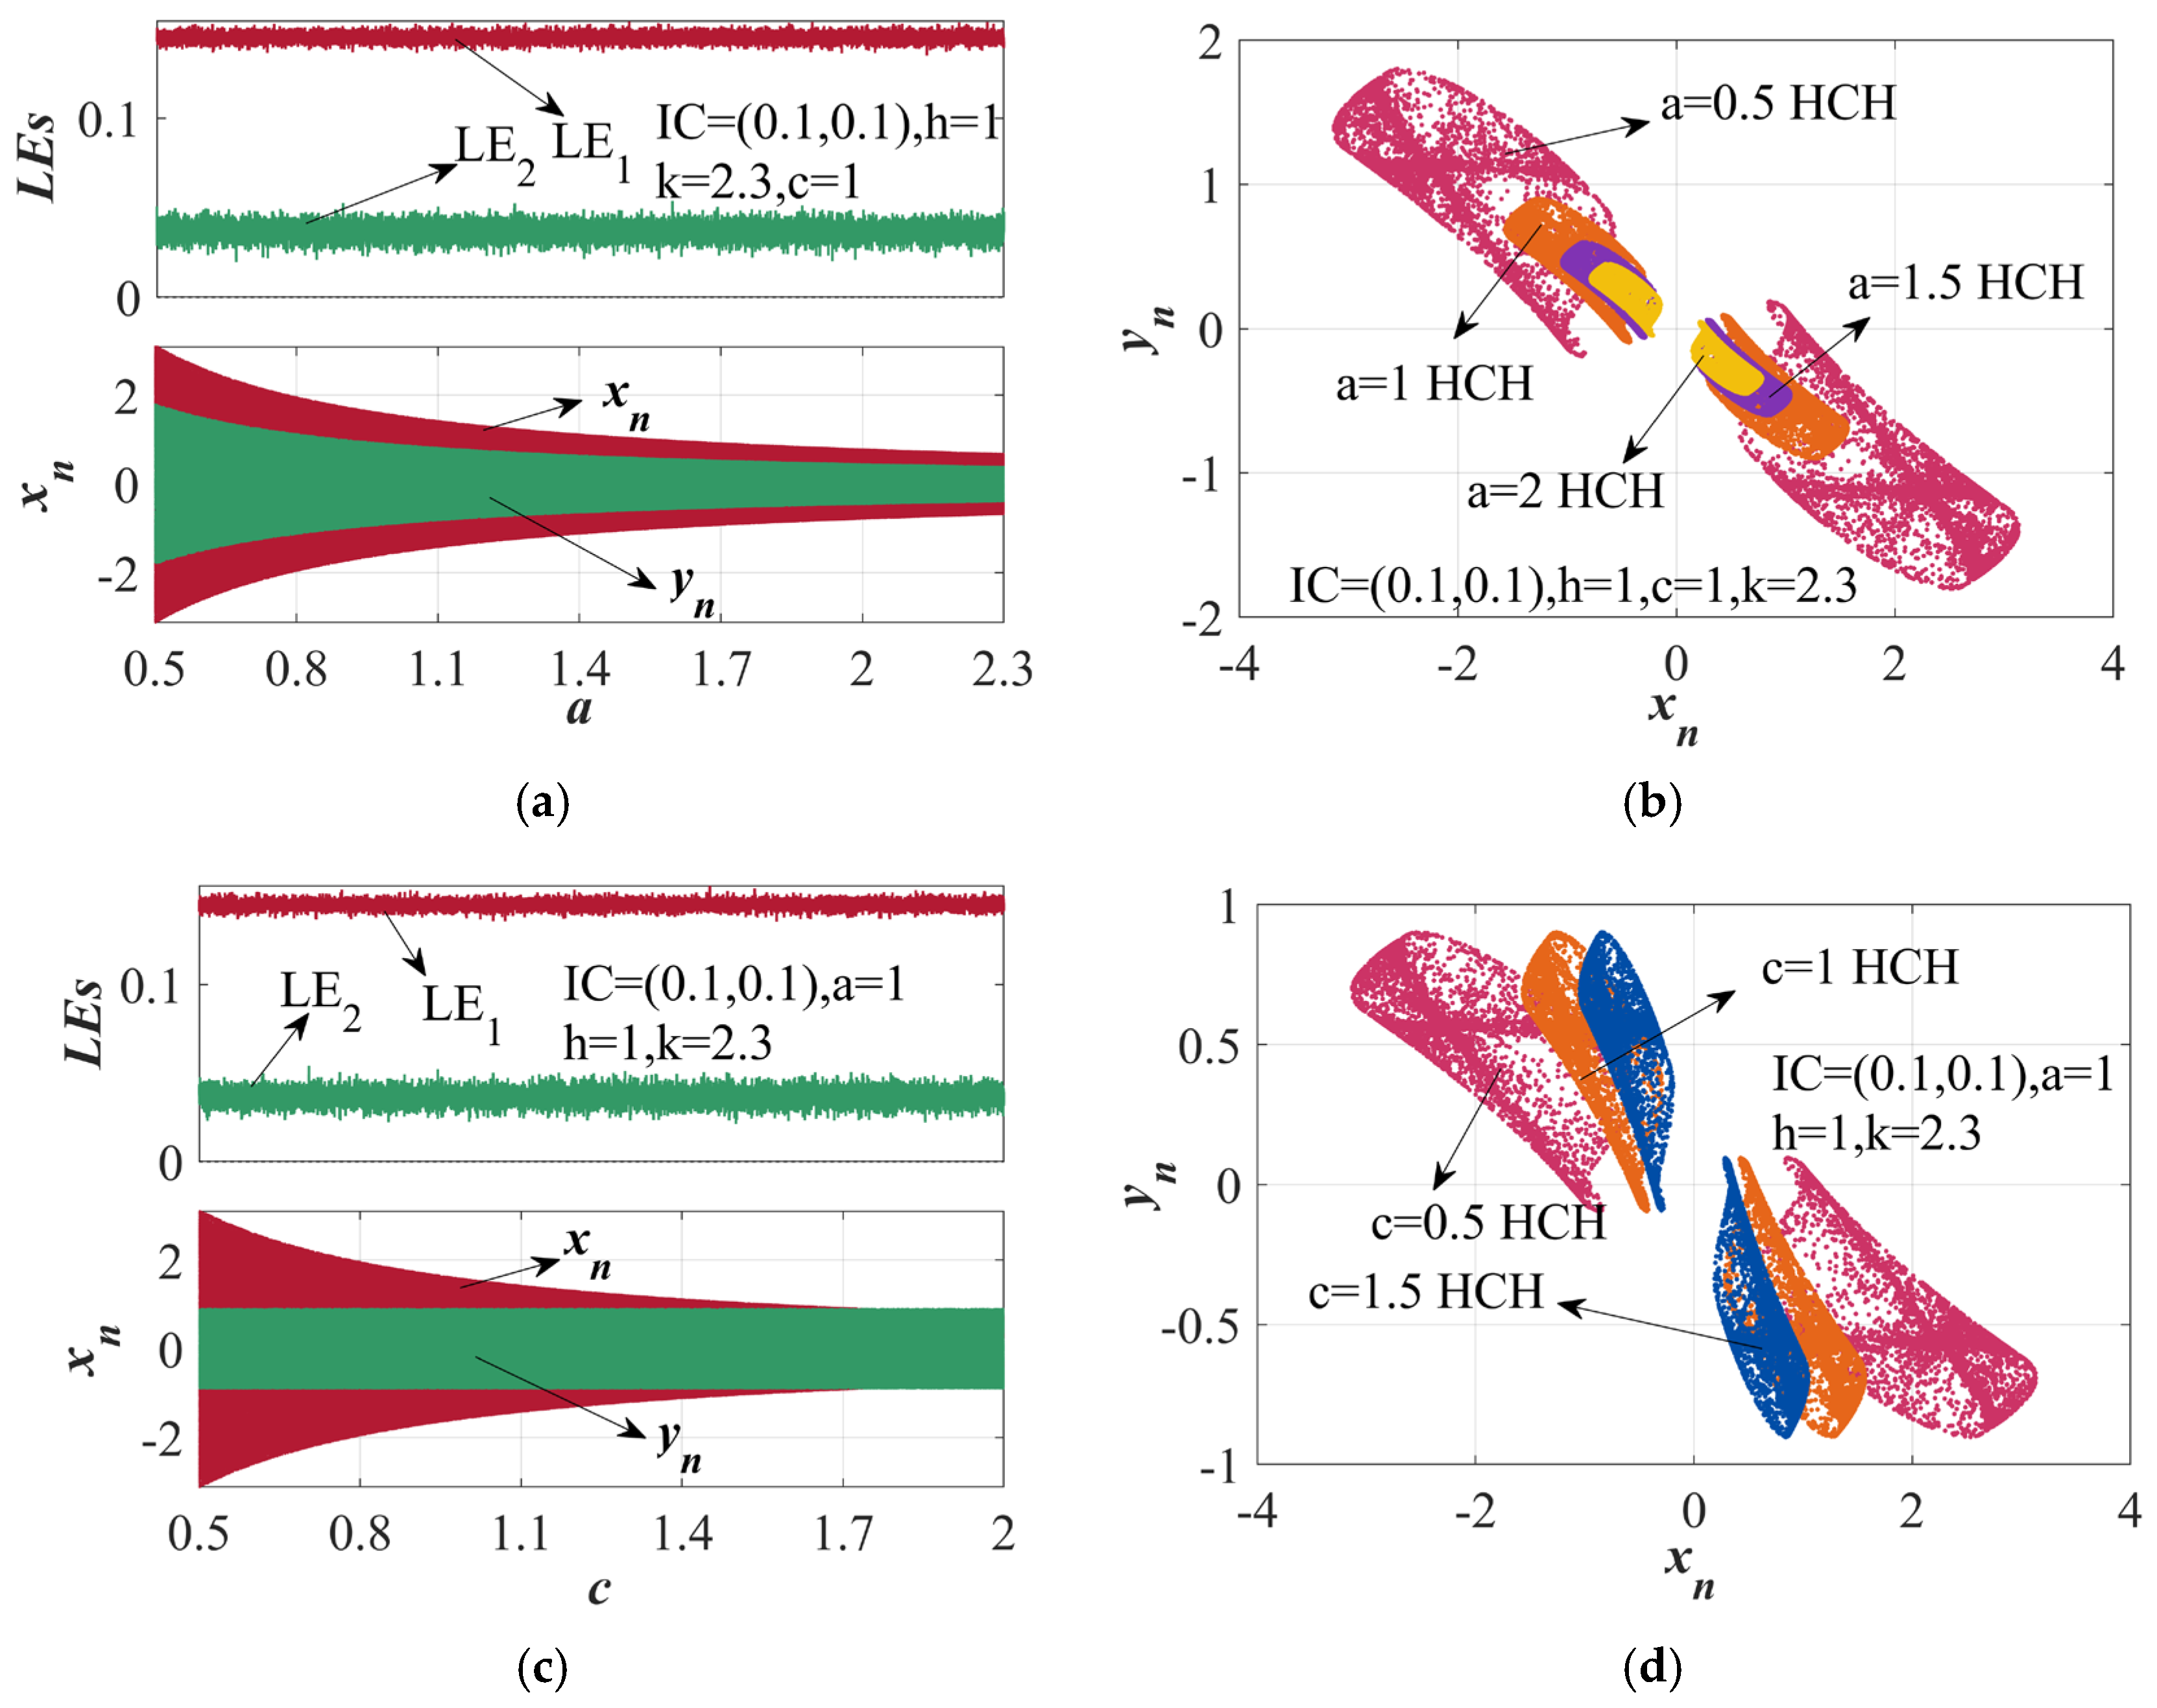
Let the parameters be c = 1, k = 2.3, h = 1, and the IC = (0.1, 0.1); calculate the LE spectrum and bifurcation diagram of a in the interval [0.5, 2.3], as shown in Figure 5a. In Figure 5a, no matter how the parameter a changes, the map shows two positive LEs (LE1, LE2), and the values of both LEs have not changed significantly. However, from the bifurcation diagram at the bottom of Figure 5a, it can be seen that the values of xn and yn gradually decrease with the increase of parameter a. Therefore, we call parameter a the full amplitude control parameter. In addition, with the change of parameter a, the map does not exhibit bifurcation, so parameter a is also called a non-bifurcation parameter. Figure 5b shows in detail the phase space distribution of system state variables xn and yn under different parameter a values. When a = 0.5, the attractor appears as a red region, indicating that the system is in a hyperchaotic state. With the parameter a increasing to 1.5, the attractor turns into an orange region, and the system is still in a hyperchaotic state. When the parameter a is further increased to 2, the attractor becomes yellow, and the system continues to maintain a hyperchaotic state. In this map, c is a non-bifurcation parameter as well as a non-bifurcation parameter. To analyze the influence of parameter c on the map, we make the parameter a = 1, k = 2.3, h = 1, and the IC = (0.1, 0.1), and analyze the LE spectrum and bifurcation diagram of c in the interval [0.5, 2], as shown in Figure 5c. In Figure 5c, no matter how the parameter c changes, it will not cause a change in LE, and the values of the two LE are always greater than 0 and relatively constant. A strange phenomenon appears in the bifurcation diagram at the bottom of Figure 5c. With the increase of parameter c, the value of xn gradually decreases, but the value of yn remains unchanged. Therefore, parameter c can be called the local amplitude control parameter. Figure 5d shows the phase space distribution of system state variables xn and yn under different parameter c values. When c = 0.5, the attractor appears as a red region, indicating that the system is in a hyperchaotic state. With the parameter c increasing to 1.5, the attractor becomes orange, and the system is still in a hyperchaotic state. When the parameter c is further increased to 2, the attractor becomes a blue region, and the system continues to maintain a hyperchaotic state.

3.4. The Multistability of A-DM Map

Multi-stability refers to that in the same phase space, the system will show various attractors or dynamic modes that can exist simultaneously due to the difference of ICs [37,38]. This means that even under the same system parameter settings, different initial states may lead to the evolution of the system to completely different long-term behaviors [39]. Multi-stability can be identified and understood by studying the domain of attraction. The domain of attraction is usually shown in the diagram as areas of different colors, and each color represents a unique stable state or attractor that the system may reach. The shape and position of these areas are significantly affected by the dynamic behavior of the system and the ICs. If three or more regions with different colors are observed in a domain of attraction graph, this indicates that the system does exhibit multi-stability. In this section, we will discuss the multi-stability of the A-DM map using the two-dimensional local basin of attraction formed by the initial states x0 and y0.
Let the IC = (x0, y0) and a = 1, c = 1, k = 2.3, h = 1, where x0 and y0 change in the intervals [−1.9, 1.9] and [−2.3, 2.3], respectively. As shown in Figure 6a, we can intuitively see how the changes of parameters x0 and y0 affect the dynamic behavior of the system. The color distribution shows that the system may exhibit a variety of dynamic behaviors under different parameter combinations, from a stable state to chaotic and even hyperchaotic states. In Figure 6b, the figure above describes LEs, where LE1 is greater than or equal to 0 in the interval [−2.3, 1], showing chaotic behavior or unstable dynamic characteristics; LE2 always keeps a negative value, indicating that the dynamic behavior of the system in the second direction is stable. The changes of system state xn and yn, and how these changes lead to the bifurcation of system behavior. This kind of analysis is very useful for understanding the complex behavior of nonlinear systems, especially when studying period-doubling bifurcation, chaos, and other phenomena. Figure 6c reveals the diversity of dynamic behavior of the system by showing the phase diagrams under different ICs. The points with different colors in the figure represent that the system starts from its unique initial state, follows its own evolution path, and finally stabilizes on a different attractor, respectively. These trajectories not only clearly indicate the starting position of the system but also describe in detail the evolution process of the system state over time and how they gradually tend to their respective stable states.

3.5. Analog Circuit Simulation

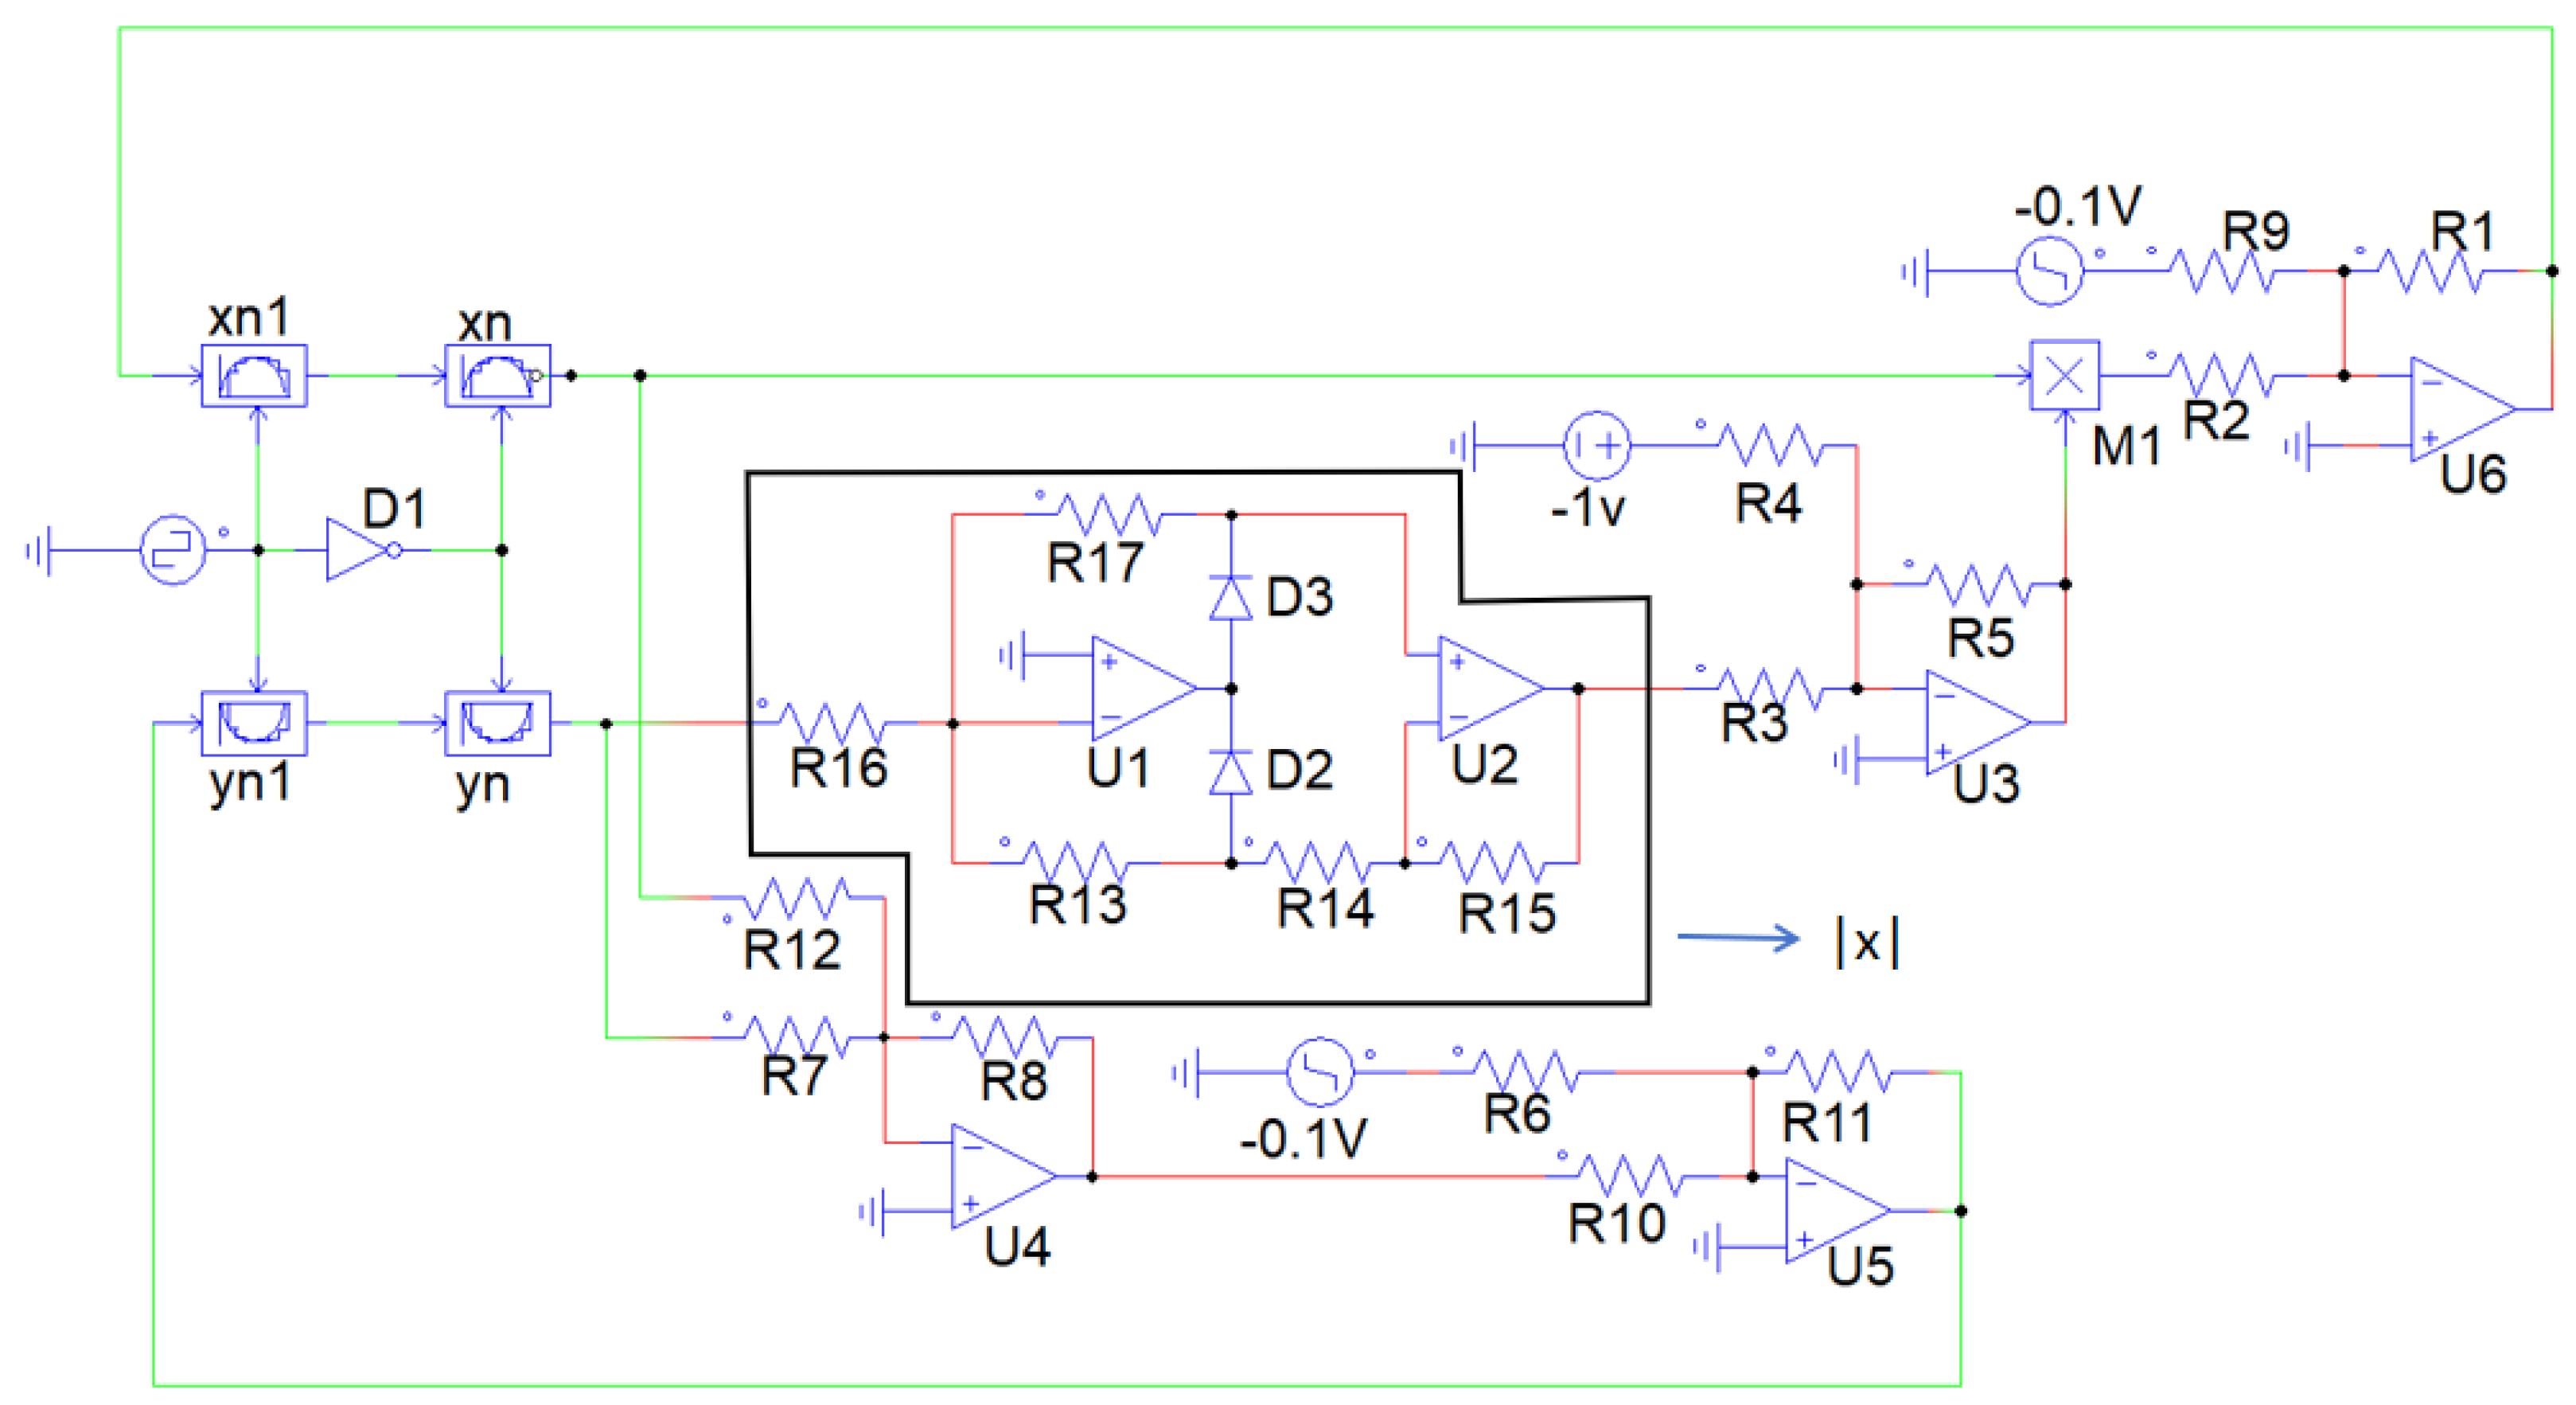
The implementation of chaotic systems can be done in both digital hardware [40] and analog circuits. The focus of this paper is to implement discrete chaos mapping by analog circuits in different IC situations. In Figure 7, four sample and hold devices are used for parameter iteration. D1 is a NOT gate, and a square wave signal with a frequency of 1 KHz is used as the trigger signal for sample and hold. Among them, all resistors except R1 and R9 are 10 K resistors, and the resistance values of R1 and R9 are 23 KΩ. M1 is a multiplier, and two-step signals are used as x0 and y0. The two-step signals jump from −0.1 to 0 at 0.001 s.
Based on the implementation of the above simulated circuit, we can have the following Equation (6).
x n + 1 = R 1 R 2 ( | y n | R 5 R 3 R 5 R 4 ) x n + 0.1 R 1 R 9 y n + 1 = R 8 R 11 R 7 R 10 y n + R 8 R 11 R 12 R 10 x n + 0.1 R 11 R 6
Our simulation method allows for the setting of IC and can display the simulation results of the circuit when parameters a and c take different values. These results are consistent with Figure 5b,d in the Matlab (2022b) simulation, demonstrating the accuracy of the simulated circuit.
As shown in Figure 8, we show the behavior of the circuit under different parameter settings by adjusting parameters c, a, and h. The amplitude control in the circuit depends on the resistance corresponding to the constituent parameters a and c, according to Equation (6), it can be seen that a = R 1 R 5 R 3 R 2 and c = R 8 R 11 R 12 R 10 , k = R 1 R 2 and h = R 5 R 4 . The value of the resistance is described in detail in Section 3.5 to achieve the value of different parameters corresponding to a and c.
In Figure 8a, as the value of parameter a decreases, the distribution of circuit response becomes more dispersed, showing the attractor characteristics under different amplitude control. In Figure 8b, as the value of parameter c decreases, the concentration of circuit response decreases, further showing the attractor behavior under different capacitance conditions. The simulation results of the analog circuit in Figure 8a,b above are consistent with the Matlab simulation results in Figure 5b,d.
In order to facilitate readers’ reference and reproduction, the resistance of the resistors in Figure 7 are listed in Table 1.

4. New Map Coupling with A-DM

4.1. Dynamic Analysis of SAHM

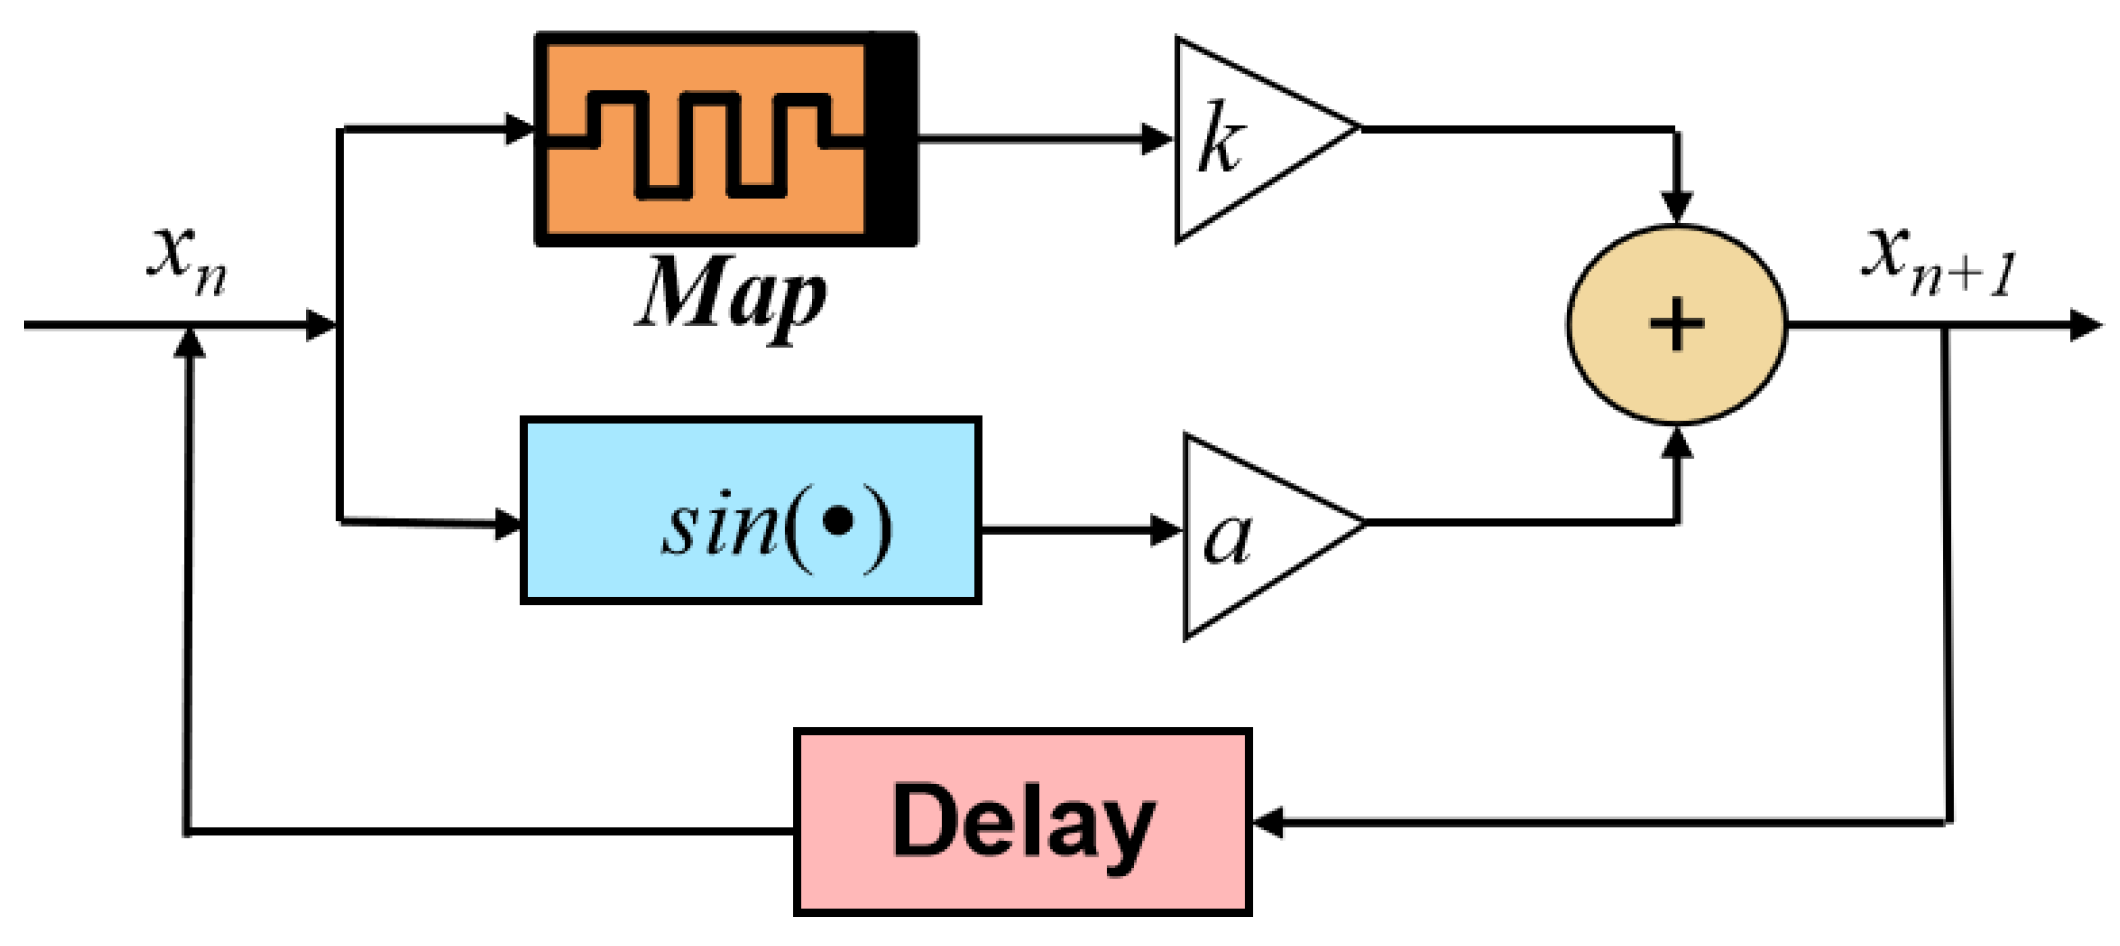
The sine map is a common discrete chaotic map, and its chaotic sequences are applied in various fields [41,42,43]. However, there are still some shortcomings, such as limited chaotic region, sensitivity to parameters and ICs, existence of periodic window, small dynamic range, etc., which limit the effect and scope of its practical application [44]. Therefore, we coupled A-DM in parallel with the sine map to obtain a new sine-A-DM-based hyperchaotic map (SAHM), whose structure is shown in Figure 9.
The input xn enters the memristor and sine map through a parallel connection. The output of the memristor is adjusted by the scale factor k. The adjusted outputs are added in parallel to obtain xn+1 as the input of the next iteration. The mathematical model is as follows:
x n + 1 = a sin ( h x n ) + k ( y n 1 ) x n y n + 1 = c x n + y n .
Setting P(x*, y*) is the fixed point of SAHM, Equation (8) can be obtained
x * = a sin ( h x * ) + k ( y * 1 ) x * y * = c x * + y * .
Hence, the fixed point P(x0, 0) is the set of lines in the entire x-axis. The Jacobian matrix at P is
J P ( x 0 , 0 ) = a h cos ( x 0 ) k x 0 0 c 1 .
The characteristic equation Det(λEJP) = 0 can be written as
[ λ a h cos ( x 0 ) ] ( λ 1 ) = 0 .
The two eigenvalues of the characteristic equation are λ1 = 1 and λ2 = ahcos(x0), respectively. λ1 is on the unit circle; according to the stability criterion, the map is stable only when all eigenvalues at the fixed point are within the unit circle. Therefore, the values of a, h, and x0 determine the stability of SAHM.

4.2. Dynamic Behavior Analysis of SAHM

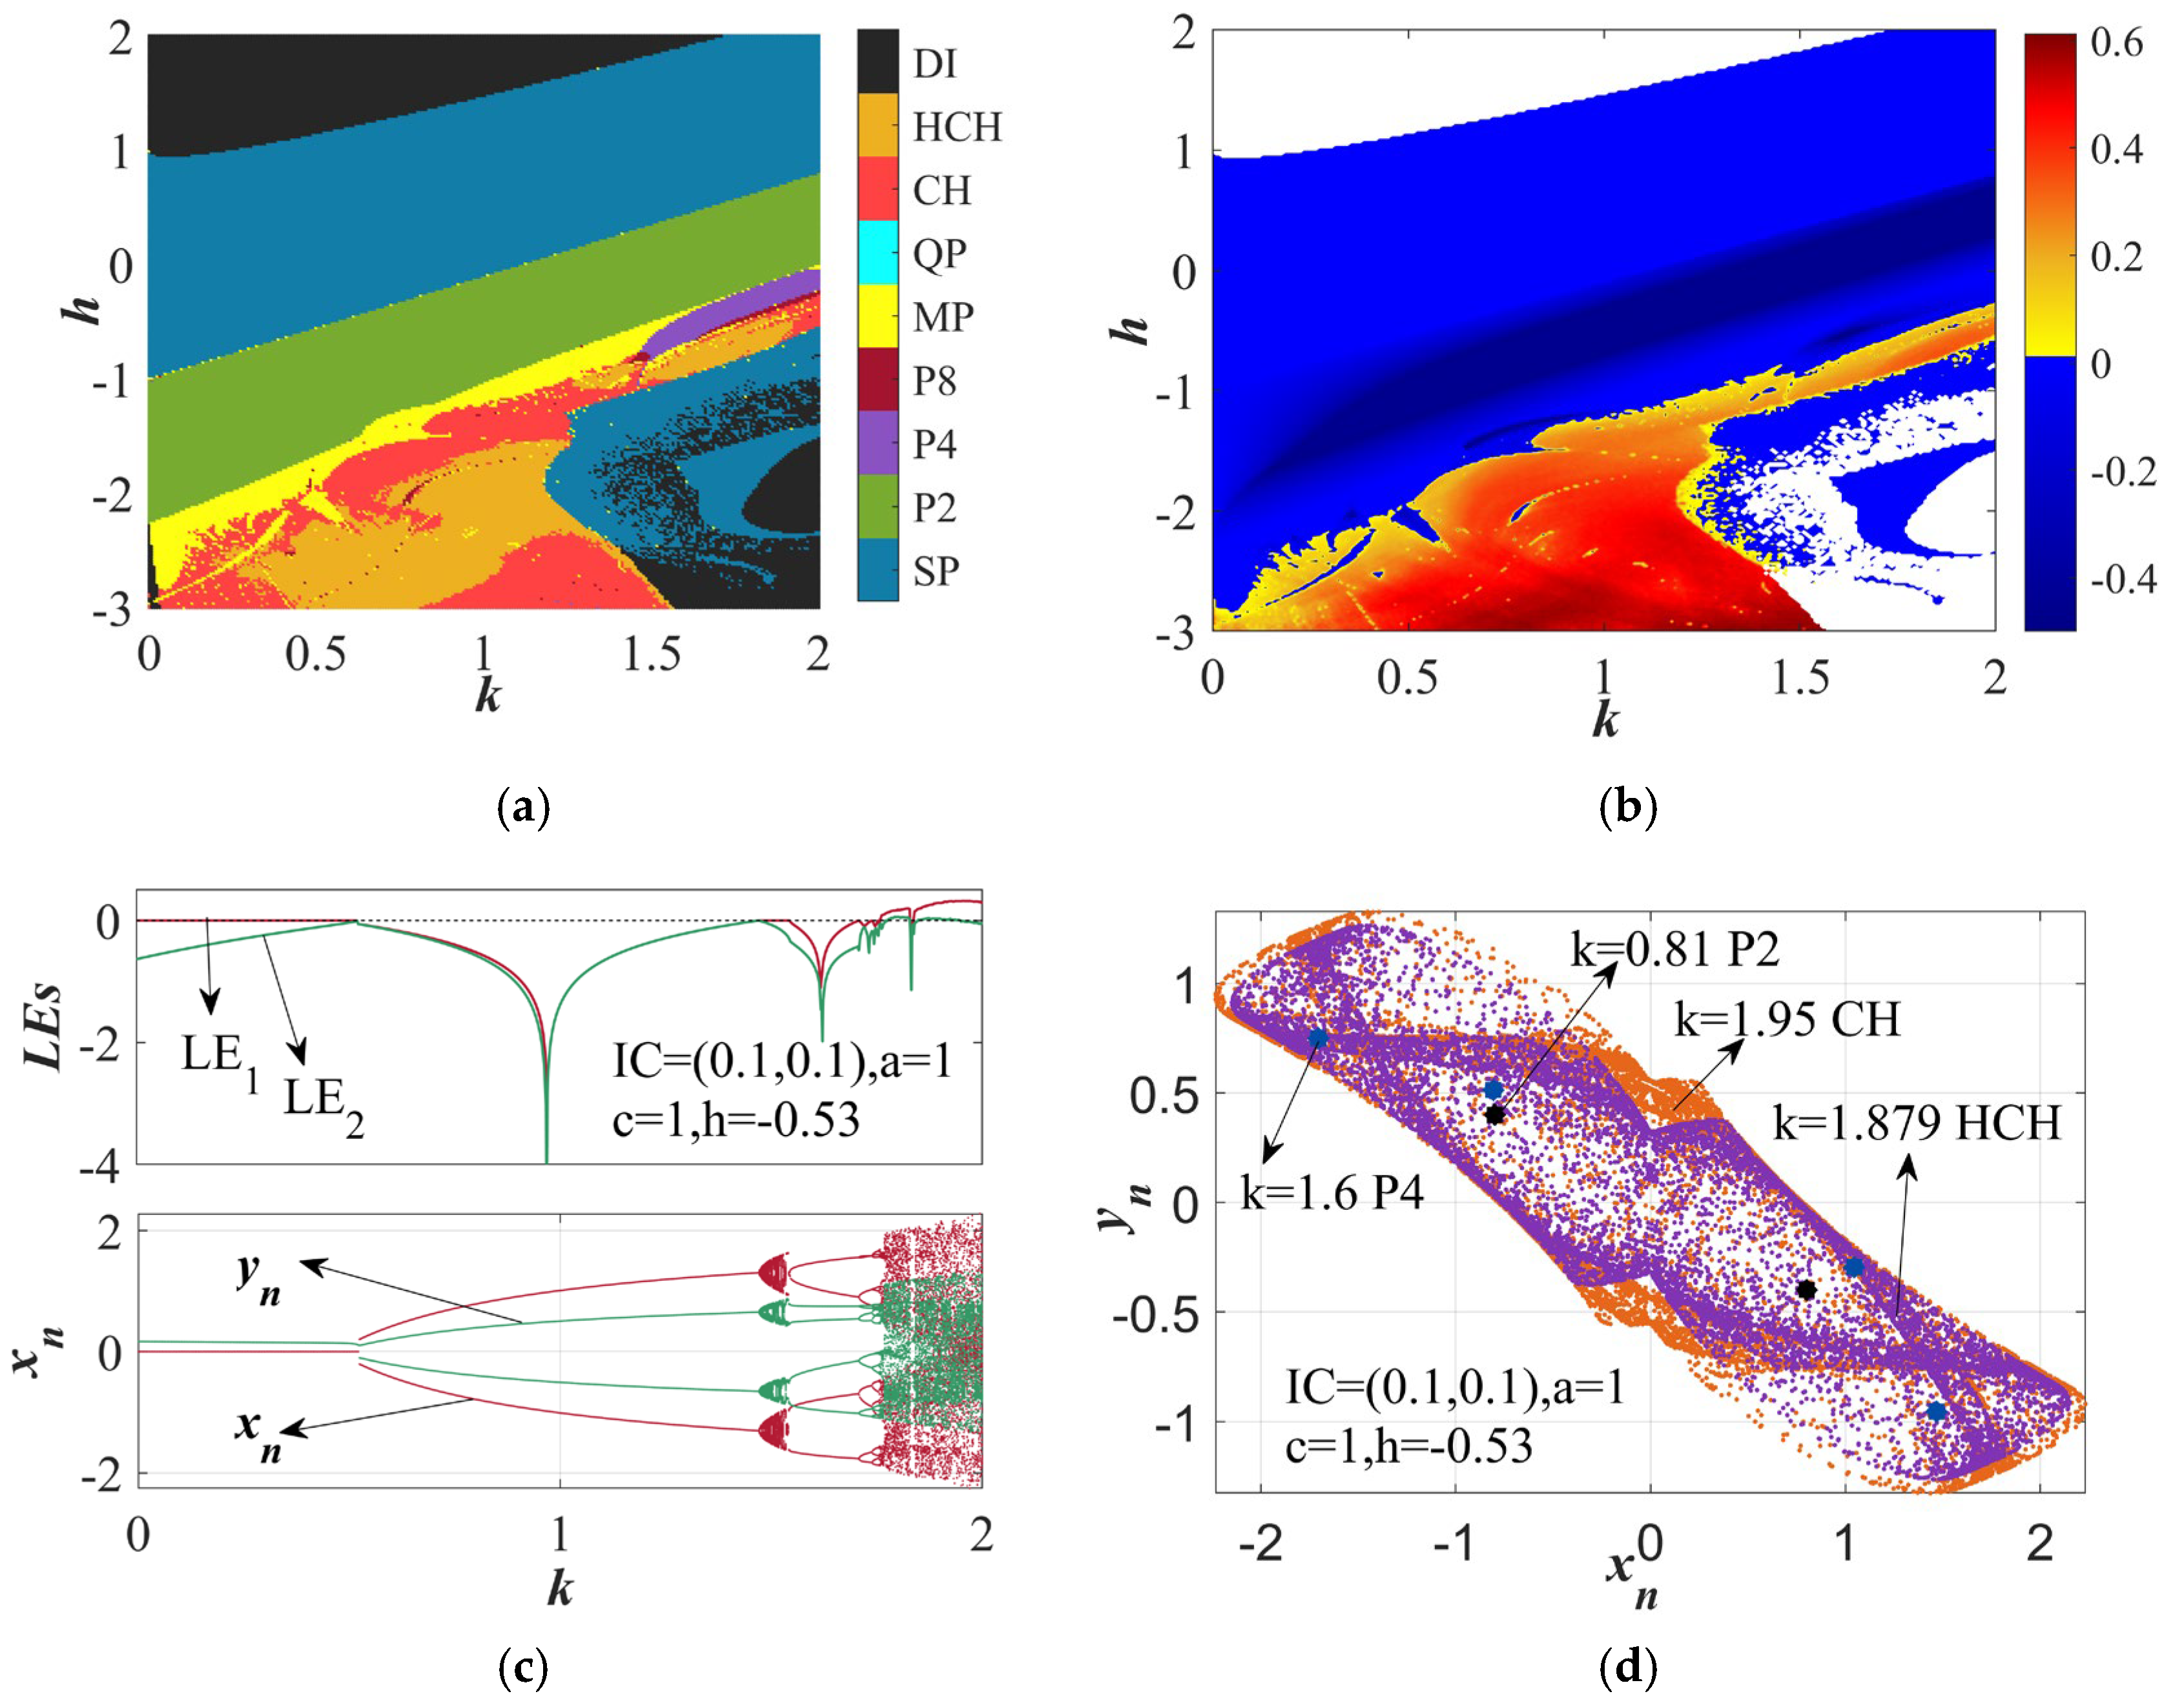
When the IC = (0.1, 0.1), parameter a = 1, and parameter c = 1 are set, the dynamic behavior distribution of the parameters k and h within the range of [0, 2] and [−3, 2], respectively, is depicted in Figure 10, and various dynamic behaviors are represented by different color areas. The orange area indicates that the map shows two hyperchaotic attractors with positive LE, labeled HCH, and the red area indicates that the map shows hyperchaotic attractors with positive LE, labeled CH. The black area indicates an unbounded area, labeled DI; the area occupied by steel blue has stable point attractors, labeled SP. In addition, a variety of colors are also used to represent period-2, period-4, period-8, multi-period, and quasi-period areas, labeled P2, P4, P8, MP, and QP, respectively. Figure 10a shows that on the kh plane, in the first LE two-dimensional distribution diagram, the blue area indicates the period of sexual behavior, while chaos and hyperchaos are filled with gold, yellow, and red, which represent the first LE of positive. The white area represents the divergence. Compared with Figure 10a,b effectively explains the dynamic behavior distribution. In order to further study the evolution process of the dynamic behavior of the map, the 1D first LE spectrum of k under single parameter control is plotted. When h = −2 is set, the bifurcation diagram and Lyapunov spectrum of parameter k in the interval [0, 2] are shown in Figure 10c. With the change of parameter k, when k = 0.514, SDM bifurcates from a one cycle to a two cycle state, and when k = 1.742, SAHM bifurcates into a multi-cycle state on the original basis. From the LE spectrum at the top of Figure 10c, it can be seen that in the range of [0, 1.758] k, LE is less than or equal to zero, which indicates that SAHM is in a periodic state; When k is in the range of [1.758, 1.778] [1.836, 1.847] [1.936, 2], only one LE value is greater than zero, which indicates that chaos occurs in this interval; when k is in the range of [1.758, 1.826] [1.847, 1.936], both LE values are greater than zero, which is the manifestation of hyperchaotic behavior. Figure 10d shows the attractor in the xy plane when k takes different values, where we can find that when k = 1.95, it is in a chaotic state rather than a hyperchaotic state.
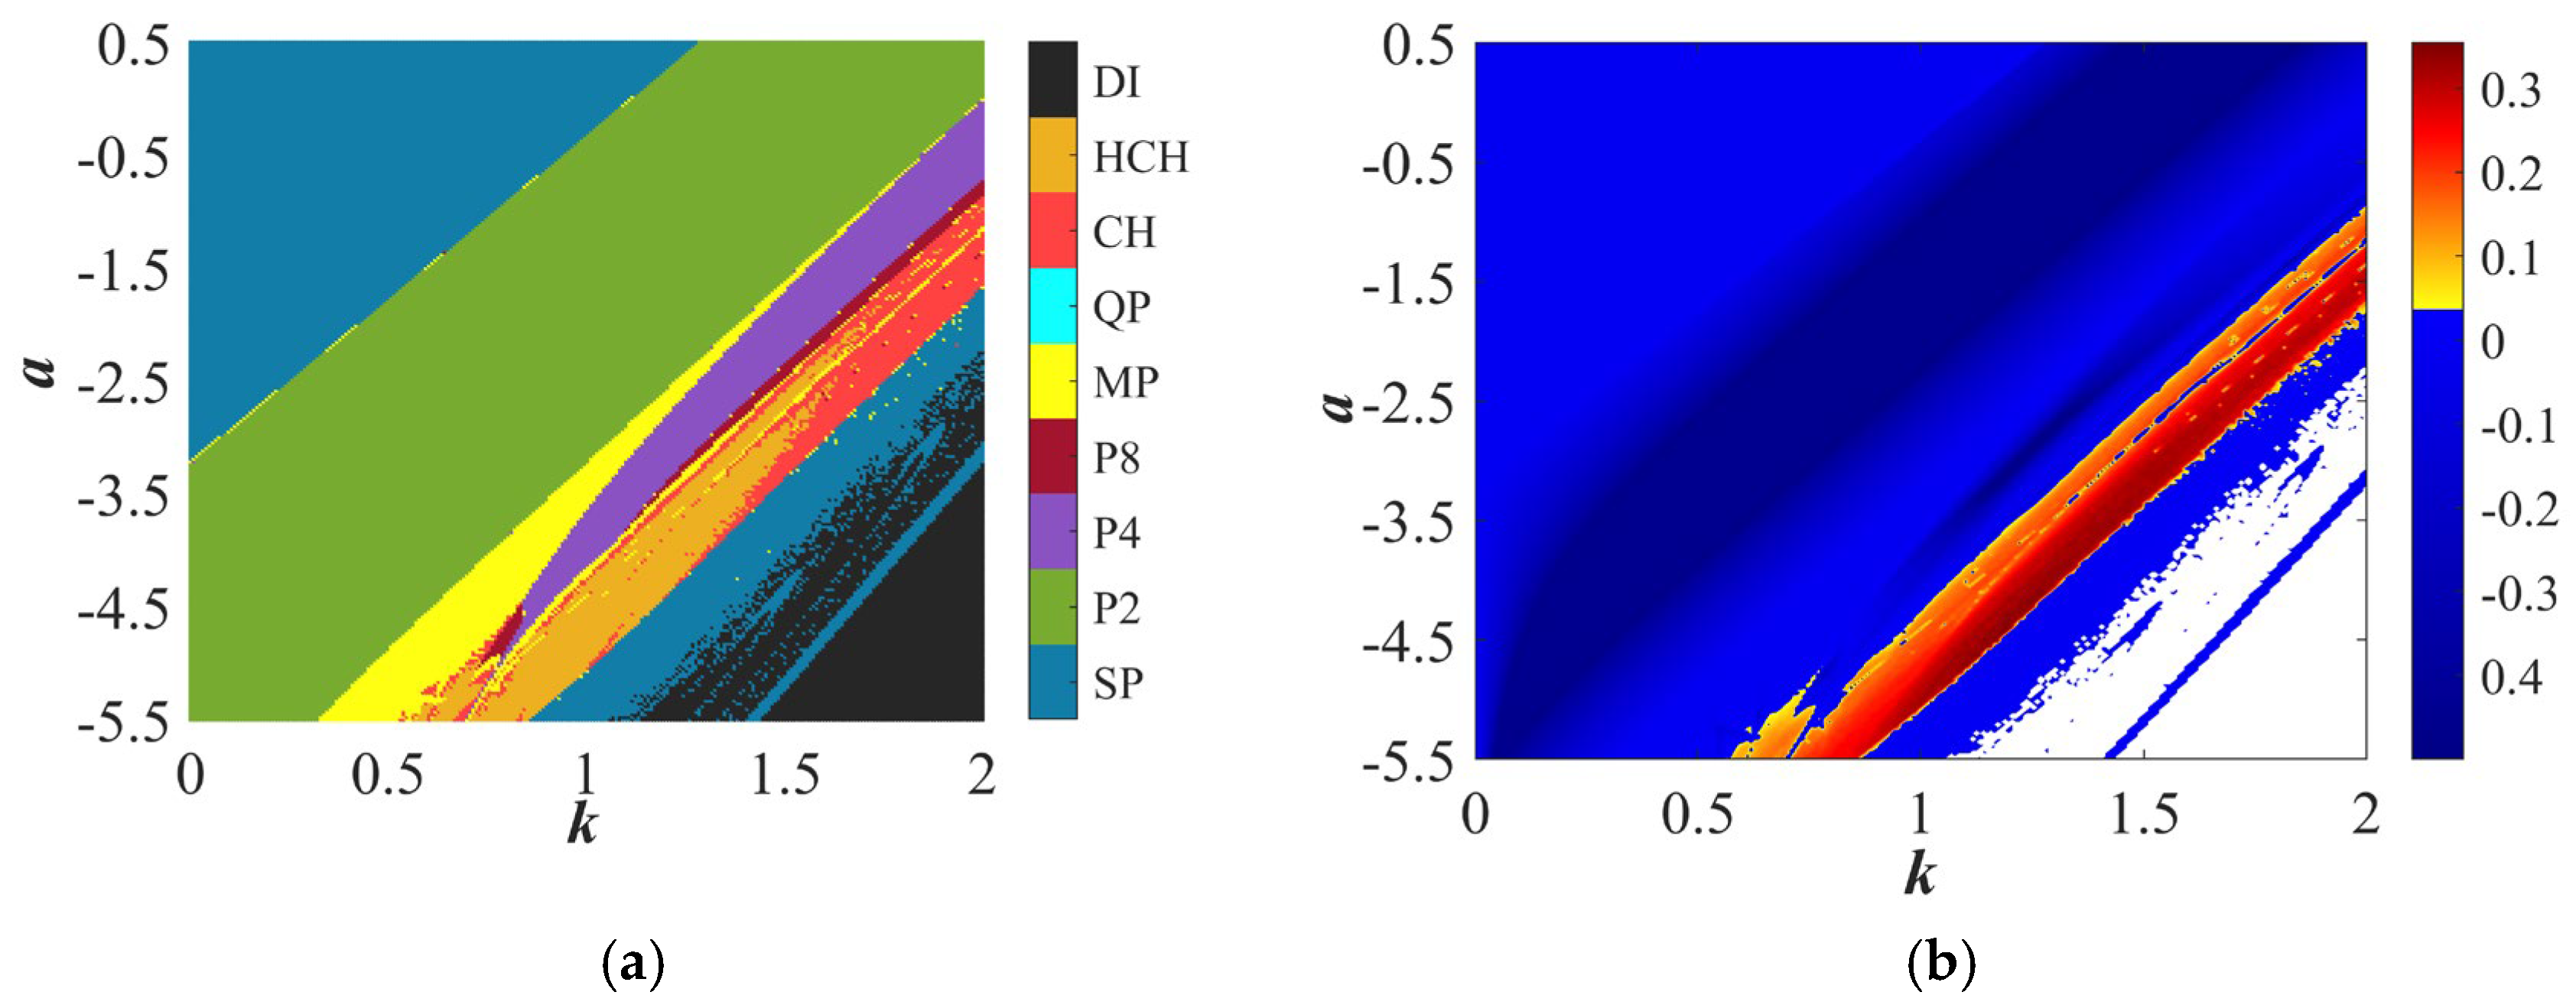
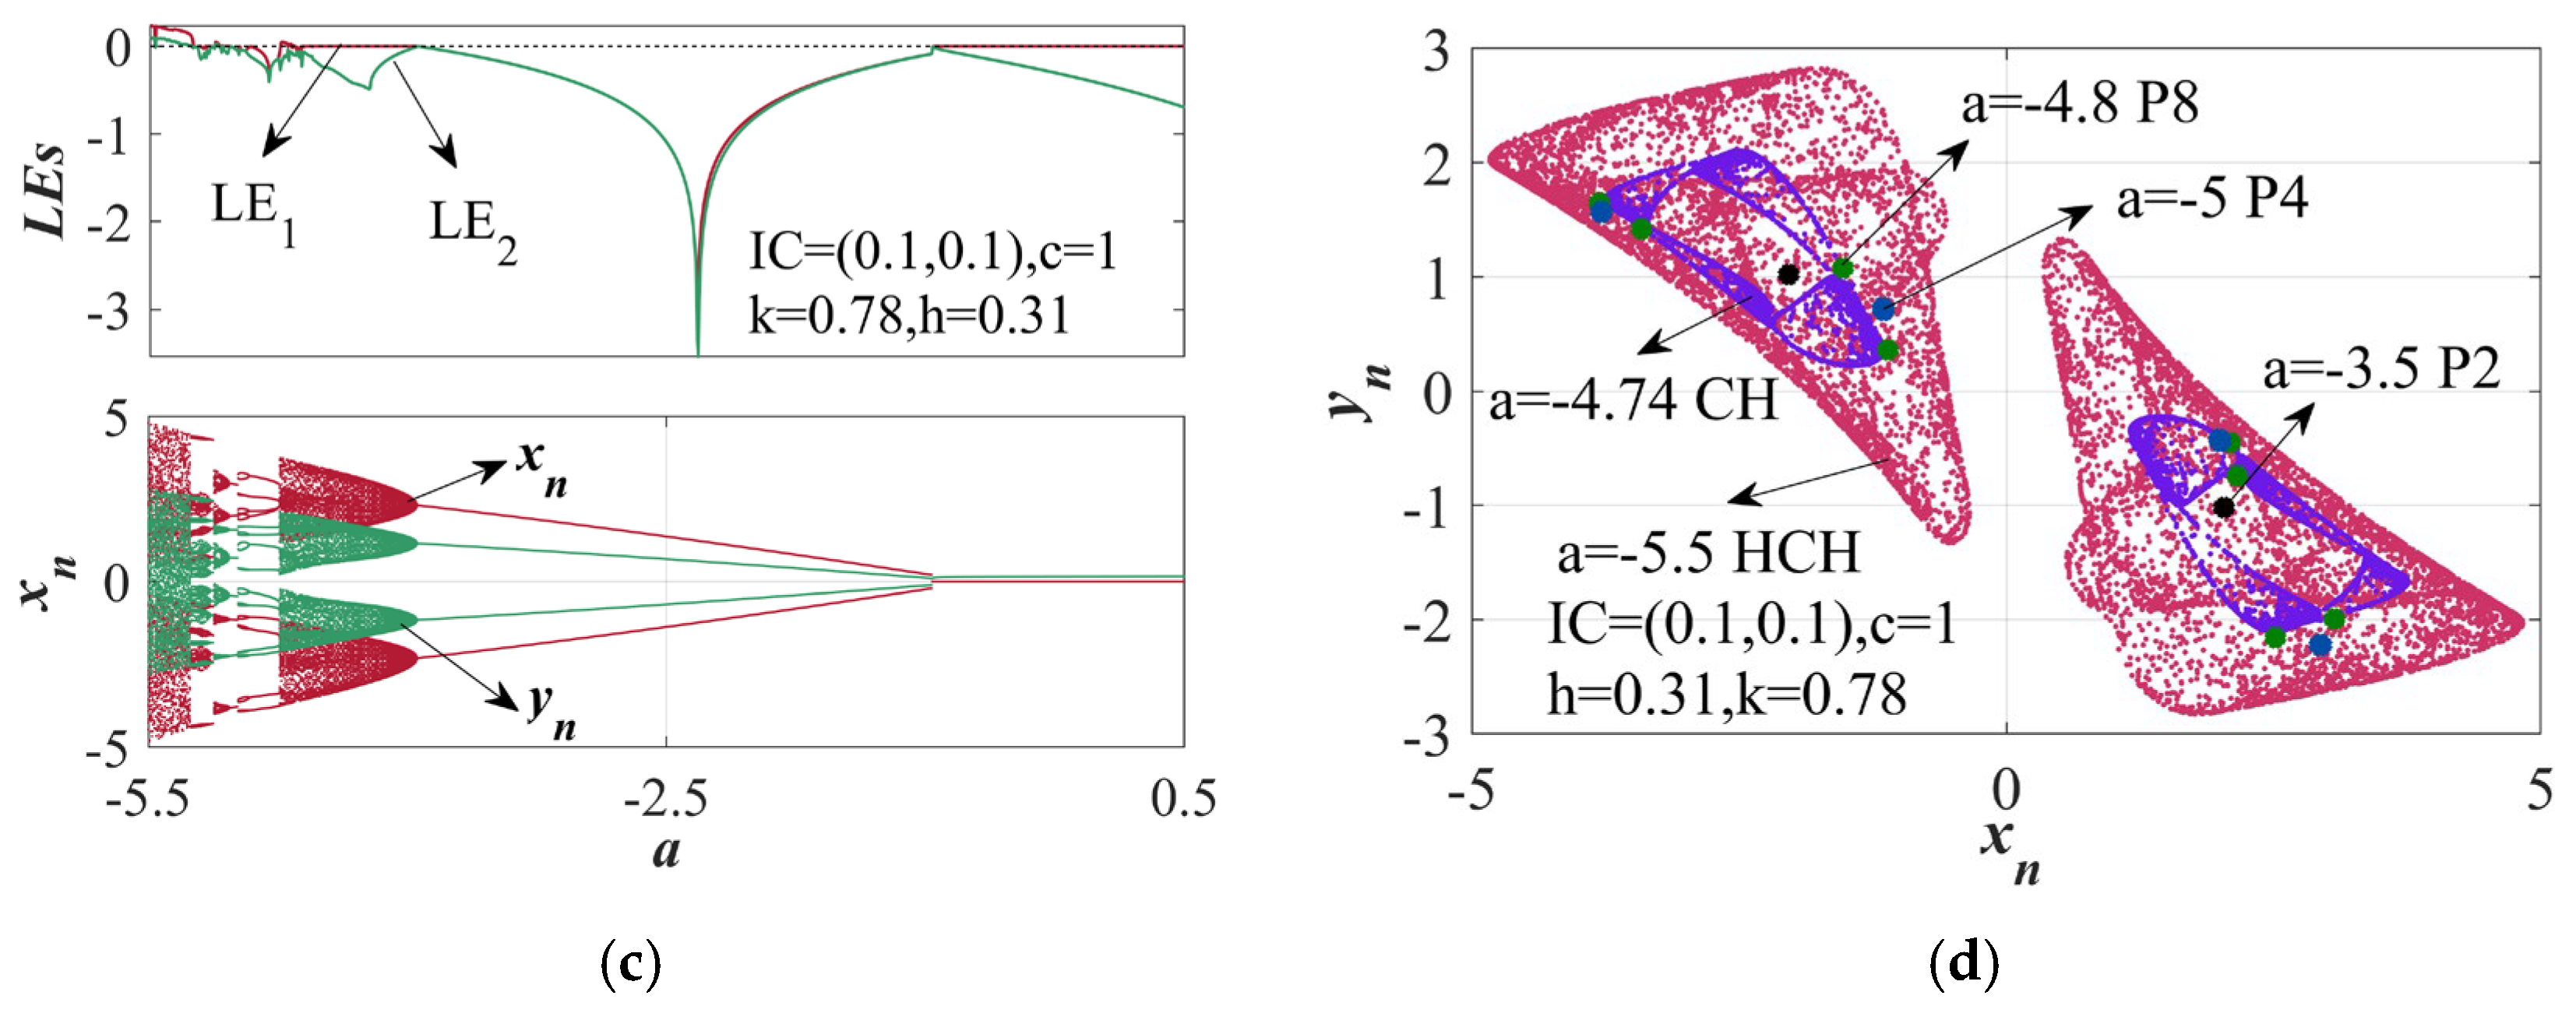
Figure 11a shows the dynamic behavior distribution of parameter k and parameter a in the intervals [0, 2] and [−5.5, 0.5], respectively, when the initial value condition is unchanged and the value of parameter c is also unchanged. Figure 11b represents the LE spectrum of parameters k and a in the 2D distribution. Compared with Figure 11a, it can be seen that they are mutually verified. The white area in Figure 11b corresponds to the borderless area in Figure 11a, while the orange and red areas correspond to the chaotic and hyperchaotic areas in Figure a. When the parameter k = 0.78 is set, the one-dimensional LE spectrum of parameter a in the interval [−5.5, 0.5] is shown in Figure 11c. Based on the above parameter conditions, the attractors of parameter a under different conditions are shown in Figure 11d.

4.3. Gottwald-Melbourne 0–1 Test

To confirm if the SAHM displays chaotic properties, this research adopts the Gottwald-Melbourne 0–1 test for identification. Its methodological novelties lie in two main points: First, unlike traditional approaches that rely on the maximum Lyapunov exponent, it directly handles original time series data, thus successfully avoiding the intricacies involved in phase space reconstruction. Second, the method boasts universal applicability; it can be directly applied to both experimental observation data and numerical simulation results, irrespective of the system’s dynamic equation forms or dimensional features [45]. The test yields a binary outcome: chaotic systems asymptotically converge to 1, whereas non-chaotic systems tend toward 0. In practice, with sufficient data length and minimal oversampling effects, the results exhibit a sharp 0/1 dichotomy. This method surpasses conventional techniques such as Lyapunov exponent computation in both ease of implementation and robustness. For detailed steps, the algorithmic structure described in reference [46] can be consulted. The procedure begins by transforming the univariate series Xn into a two-dimensional framework using Equation (11) [47].
s n + 1 = s n + X n cos ( γ n ) p n + 1 = p n + X n cos ( γ n ) .
Here, n takes values of 1, 2, 3, …, with γ falling within the interval [0, 2π]. On this basis, the mean square displacement can be derived.
M n = lim n 1 N i = 1 N [ ( s i + n s i ) 2 + ( p i + n p i ) 2 ]
Hence, the growth rate can be obtained by Equation (13)
K = lim n log M n log n
The parameter K serves as a critical metric for identifying whether a system displays chaotic behavior or periodic dynamics. Table 2 shows the test outcomes of the generated sequences xn and yn under the three sets of parameter combinations and ICs described in Section 4.2. Specifically, sequences in a chaotic state have K-values approaching 1, while those in a periodic state have K-values near 0.

4.4. Multi-Stability

Multi-stability refers to the phenomenon that the system may exhibit coexisting attractors or dynamic behaviors due to differences in initial IC in phase space [48]. Multi-stability can be effectively observed through the suction basin. The irregular areas filled with different colors in the suction basin represent different stable states of the system, which are directly affected by the dynamic characteristics and IC of the system. When more than three colors appear in the suction basin, the multi-stability of the system can be confirmed [49]. In addition, different stable states can also be identified by analyzing the change sequence of LE and the peak period count.
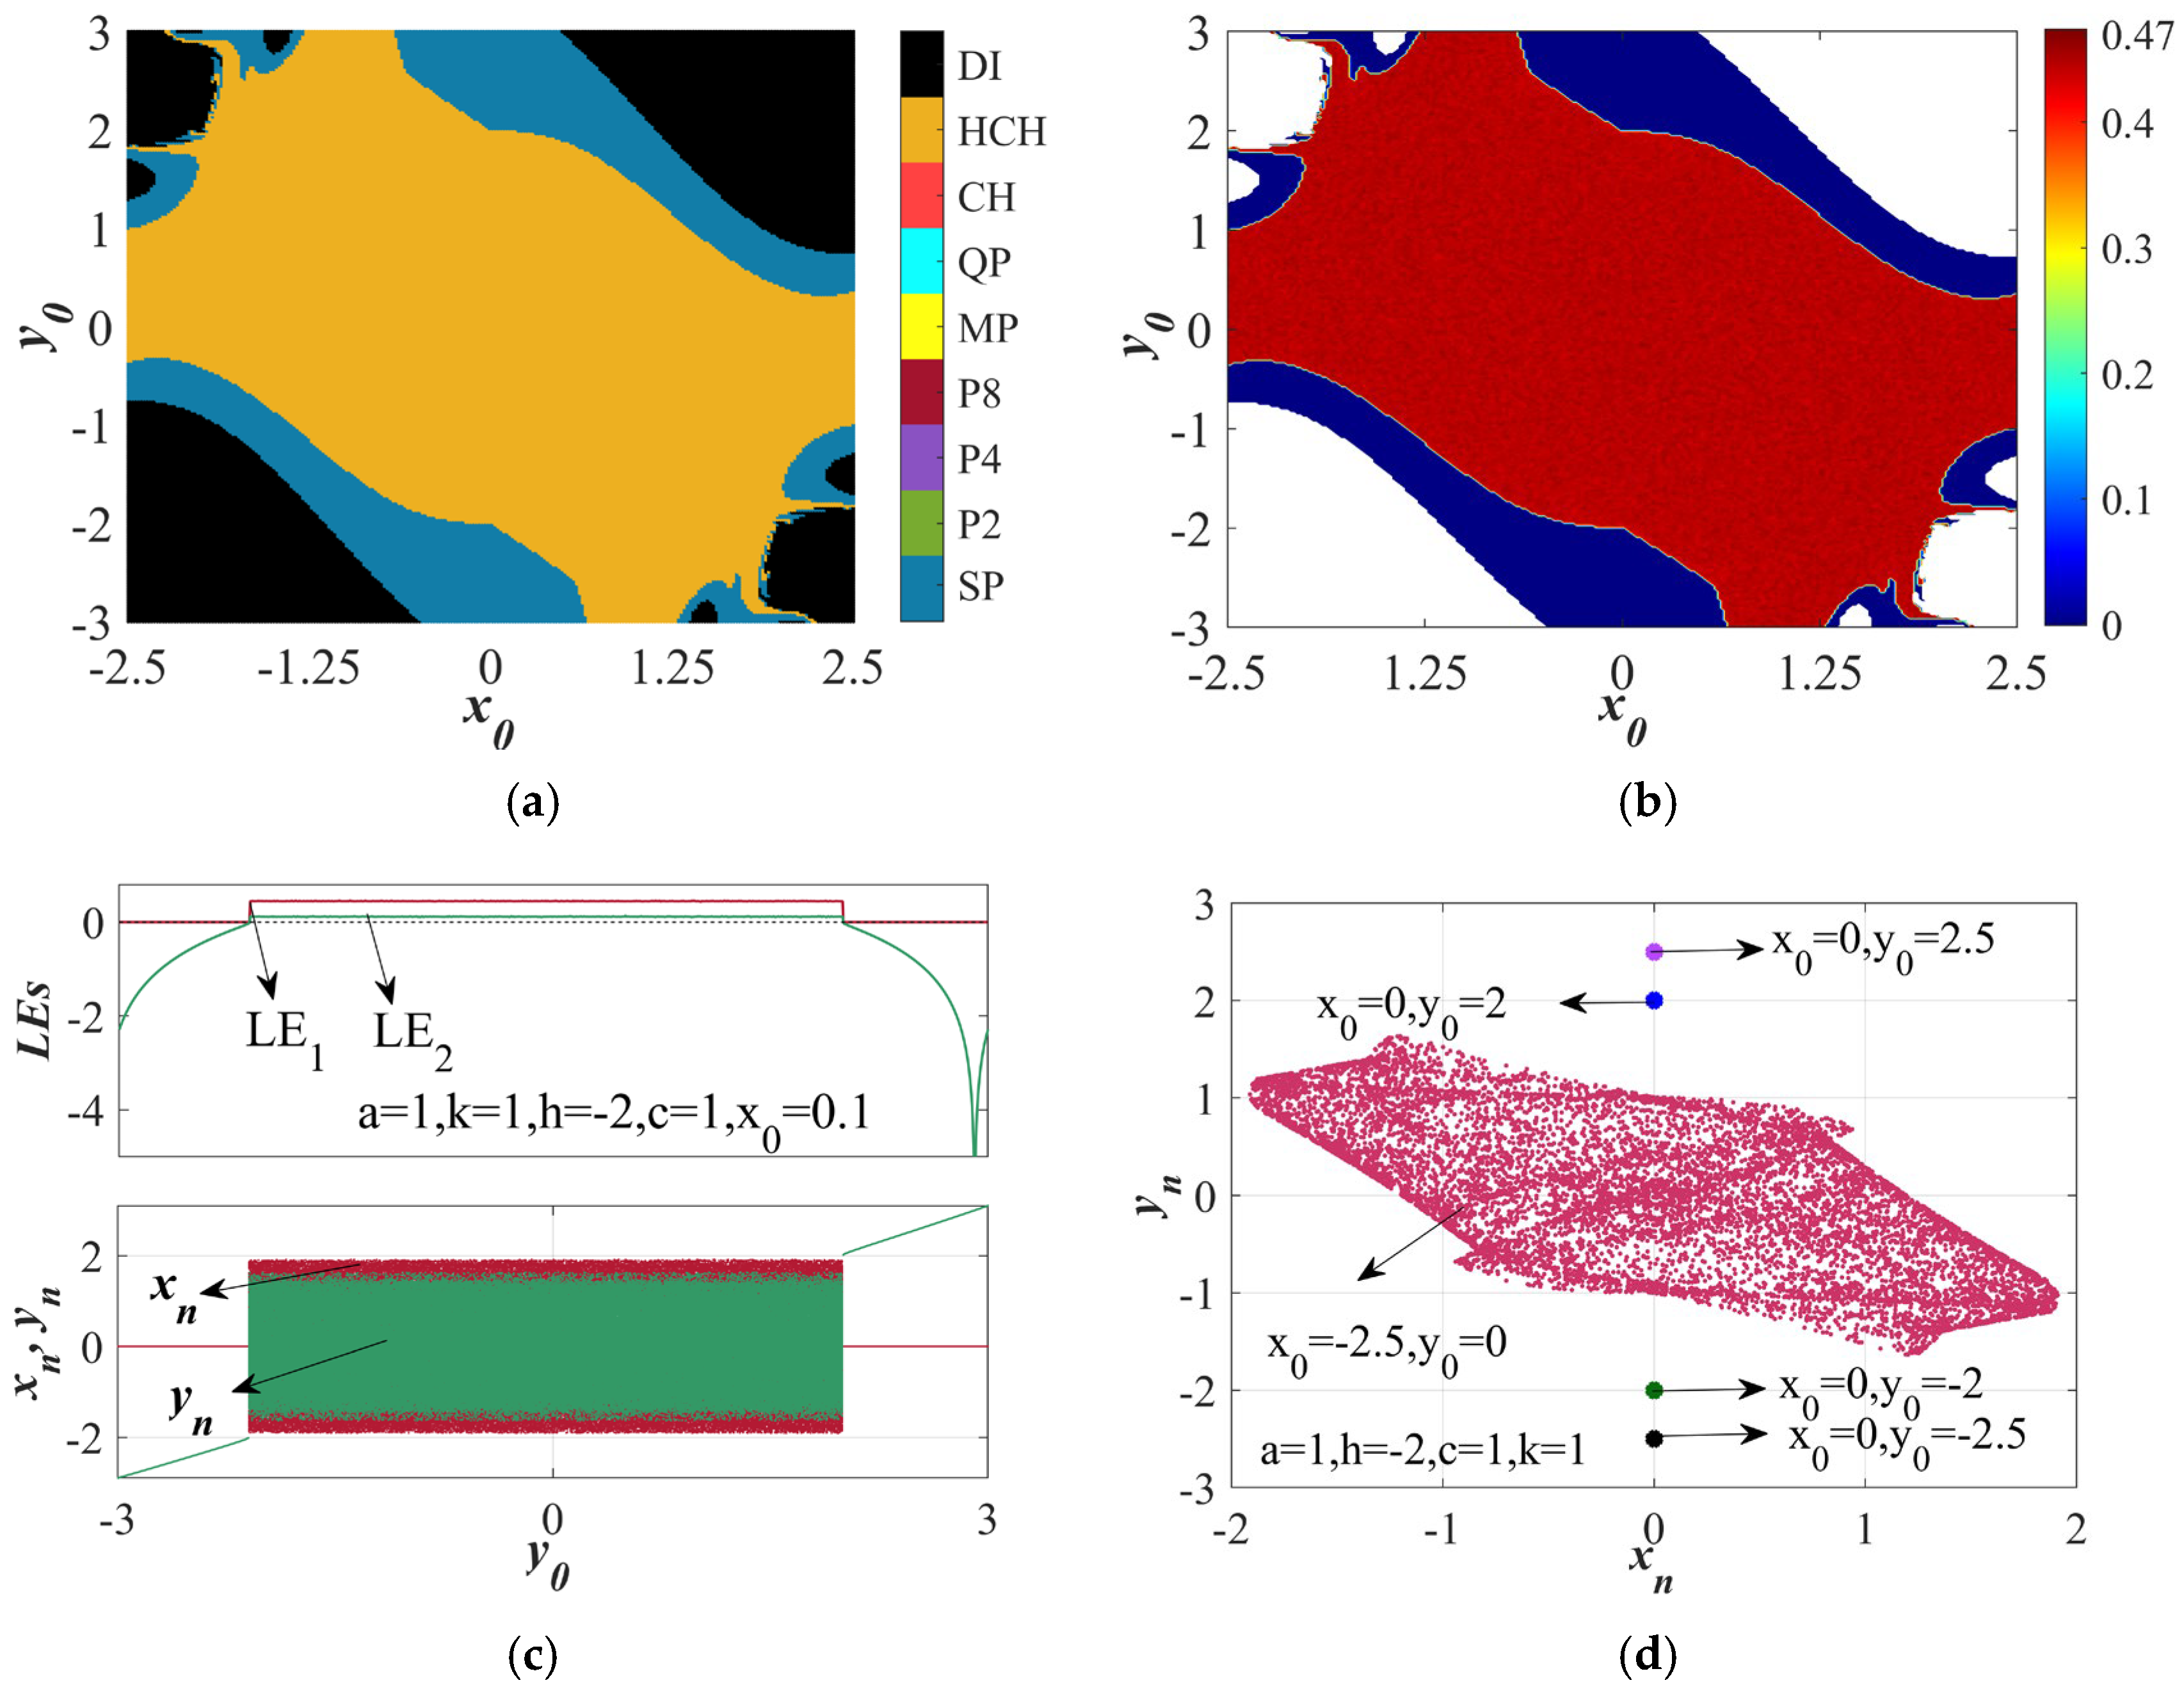
When analyzing the two-dimensional dynamic behavior of x0 and y0, we can find that they are multi-stability analysis graphs. As can be clearly seen in Figure 12b, its dispersion region is consistent with the borderless region in Figure 12a, and the red region corresponds to the hyperchaotic region. When the values of parameters a, c, and k are all 1, and h = −2, x0 = 0.1, the one-dimensional LE spectra and bifurcation diagram are drawn, as shown in Figure 12c. With the increase of y0, xn, and yn remain unchanged, and in the LE spectrum, the first LE is always positive. Then the phase space analysis is carried out for different initial values, as shown in Figure 12d.

4.5. Symmetry

While keeping other parameters unchanged, we change the parameter c in Equation (7) to −c to verify its symmetry. The memristor model is shown in Equation (14):
x n + 1 = a sin ( h x n ) + k ( y n 1 ) x n y n + 1 = c x n + y n
From Equations (7) and (14), the expression of xn+1 of the two equations is the same, which means that no matter what the value of yn is, as long as xn and other parameters (a, k) are the same, the value of xn+1 will be the same. If the sign of parameter c changes, the value of yn+1 will change accordingly. Specifically, when c becomes—c, the expression of yn+1 changes from—cxn + yn to cxn + yn. This change reflects the sensitivity of the system to the parameter c and also shows the symmetry of the system in the y direction.
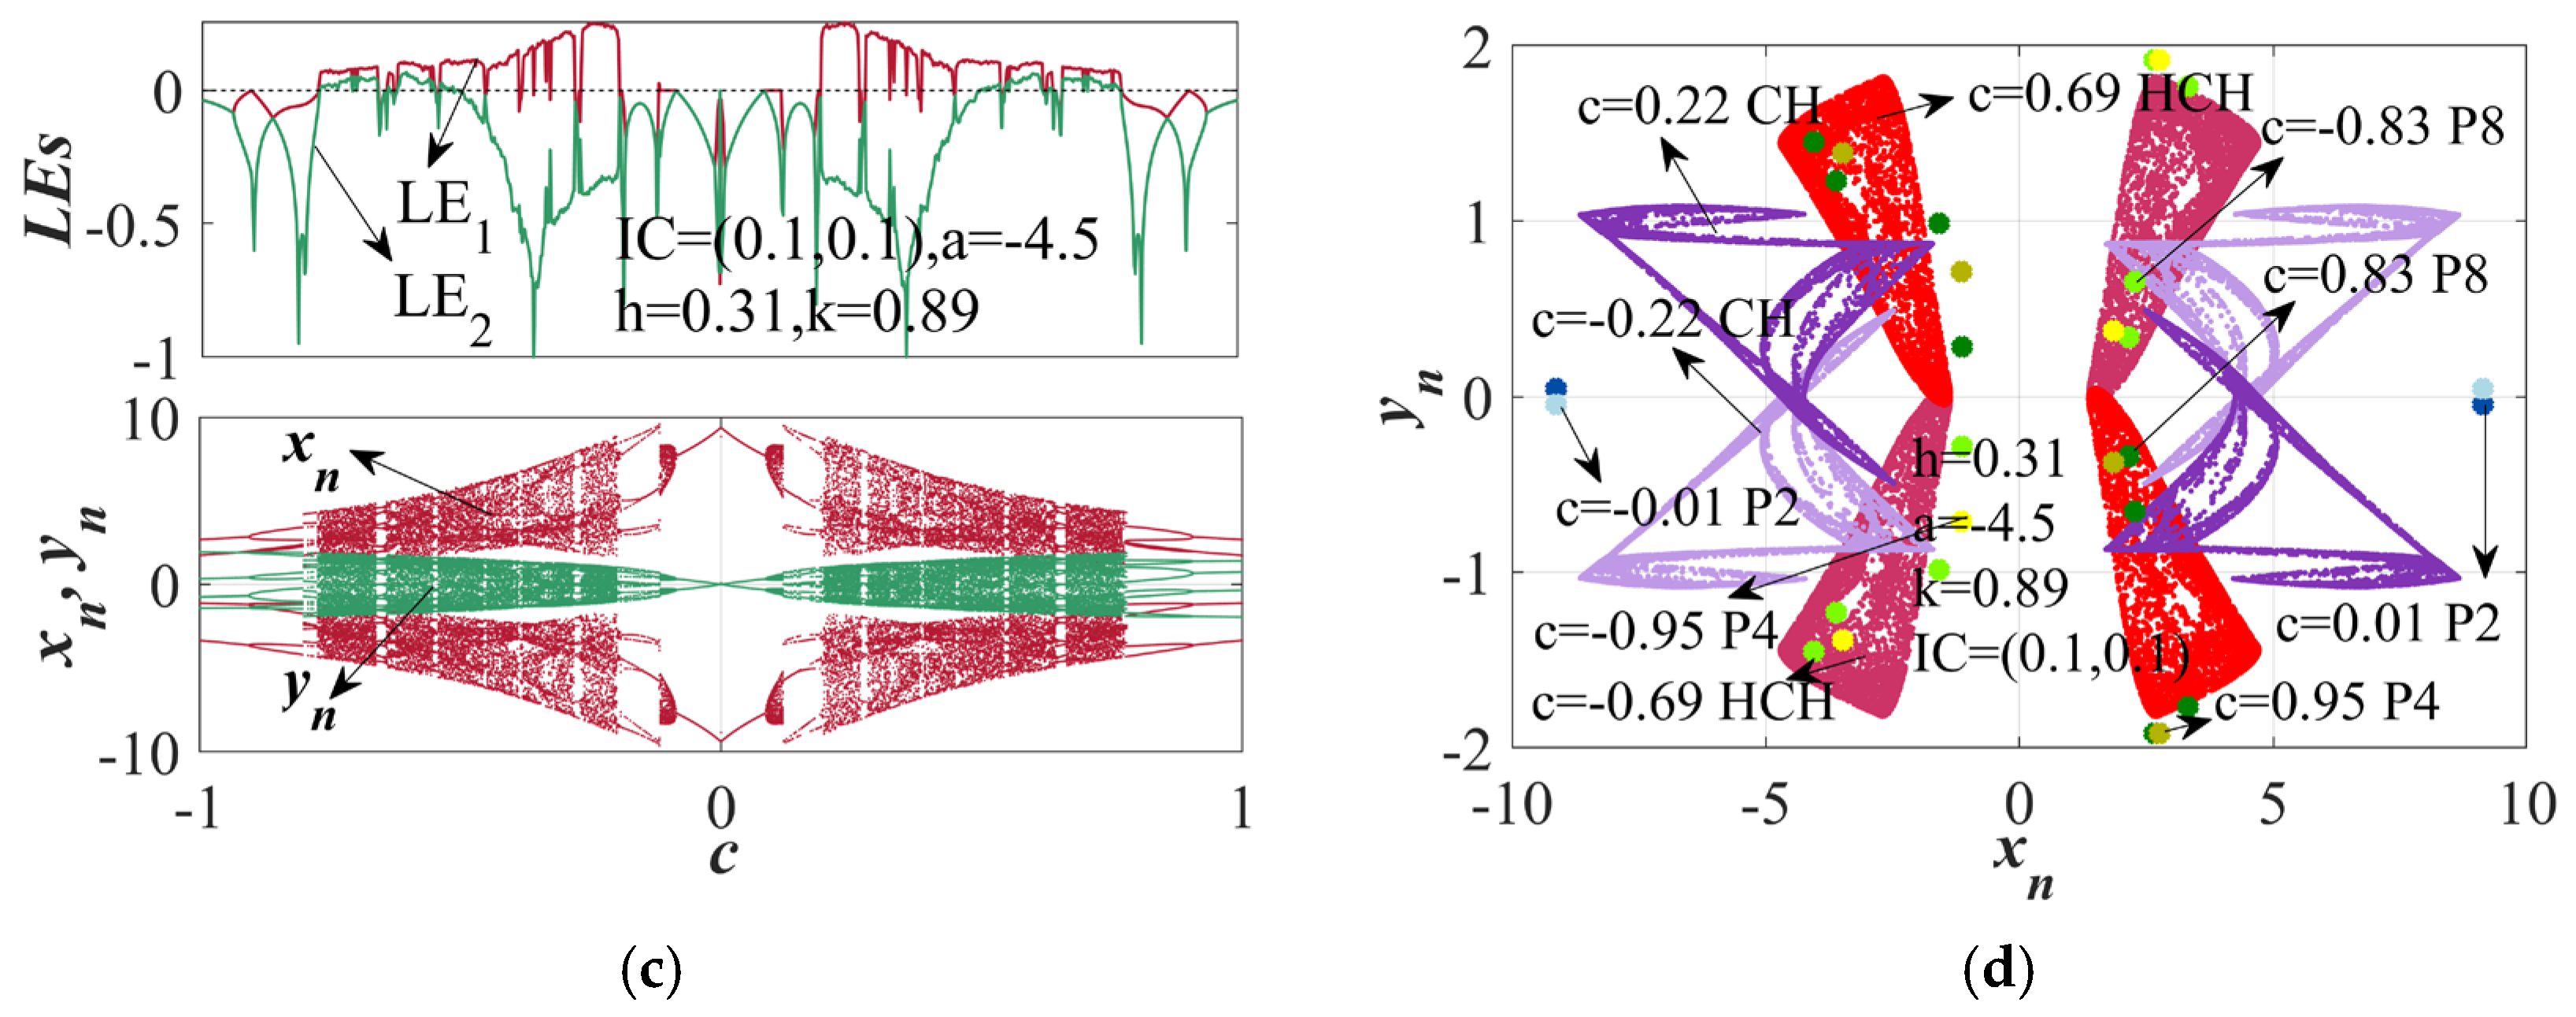
Control the IC to set a = −4.5 and h = 0.31, and analyze the two-dimensional dynamic behavior of parameters k and c in different intervals, as shown in Figure 13a. The LE spectrum of 2D under equal conditions is shown in Figure 13b. Compared with Figure 13a,b, it can be clearly seen that the image between them is consistent, and the zero point is symmetric. Based on this, we also conducted an initial pressurization experiment for parameter c, and the results show that there is no initial pressurization phenomenon for parameter c. When k = 0.89, the LE spectrum and bifurcation diagram of parameter c in the interval [−1, 1] are shown in Figure 13c and are also symmetric. It is worth noting that when parameter a is within the range of [−1, −0.77] [−0.194, 0.194]   [0.768, 1], the LE value is less than or equal to zero. In Figure 13d and Equation (7), we change c to—c to verify the symmetry of parameter c. The phase diagrams of different c values were analyzed. When c = 0.69, the attractor is triangular and hyperchaotic; correspondingly, as shown in Figure 13d, the experiment exhibits self-rotational symmetry when forming chaotic attractors, but it is also axisymmetric with respect to the x = 0 and y = 0 axes. In Figure 13d, it can be seen that when c = 0.69, the attractor is triangular hyperchaotic; correspondingly, when c takes −0.69, it can be observed that the attractor is symmetric about the x = 0 and y = 0 axes, and both are also self-rotationally symmetric. When the values of c are 0.22 and −0.22, the attractors take on a small flag shape and are symmetrical to each other. By analogy, P8, P4, and P2 are symmetrical. It can be proven that when the values of other parameters remain unchanged and only the value of parameter c changes, the attractor is symmetric.

4.6. Analog Circuit Simulation of SAHM

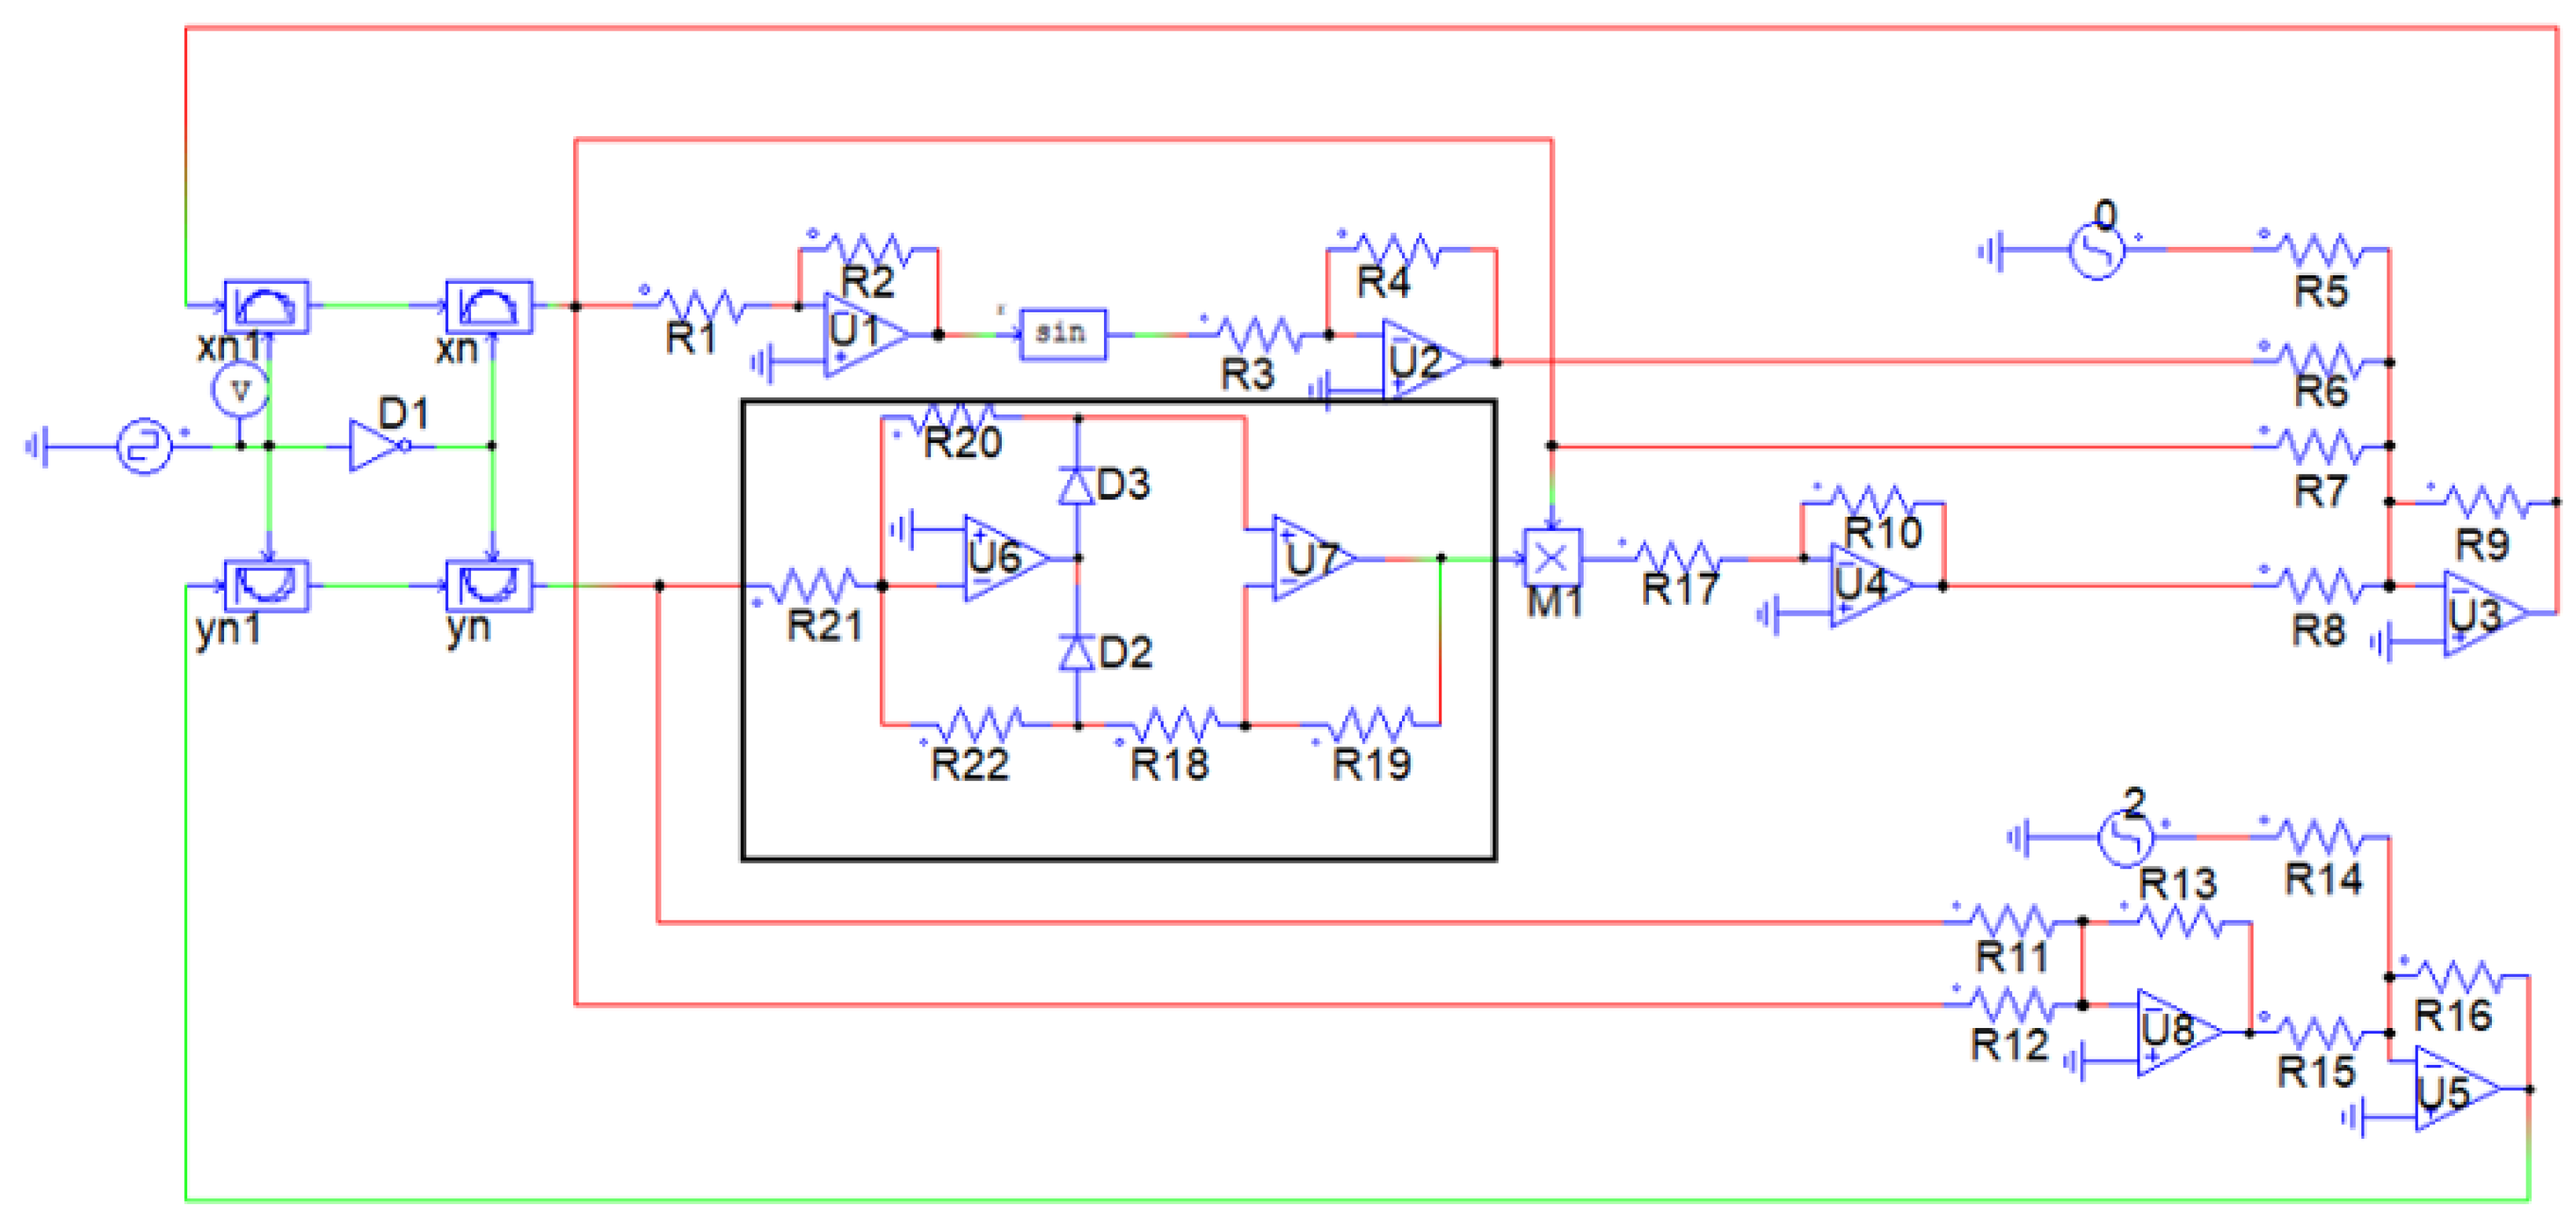
Comparing system (7) and system (15), the following expressions can be obtained for the parameters corresponding to the parameter of π · R 2 R 1 = h = 0.31, R 4 R 9 R 3 R 6 = a, R 13 R 16 R 12 R 15 = c = 1, R 10 R 9 R 17 R 8 = k = 0.78, R 9 R 7 = 1, R 13 R 16 R 11 R 15 = 1, Therefore, the resistance value R5 = R6 = R9 = 7.8 KΩ can be calculated, and all other resistances are 10 KΩ. When the value of a changes, only the value of R4 needs to be adjusted. To verify the previous digital simulation results, when a = −5.5, −5, −4.8, −3.5, and −4.73 is selected, the corresponding R4 values can be adjusted to 5.5, 5, 4.8, 3.5, and 4.73 KΩ, respectively, using the method of selecting and setting the initial value of the memristor for this circuit. The specific circuit diagram is shown in Figure 14.
According to the simulated circuit shown in Figure 14 above, the equation of the simulated circuit can be written.
x n + 1 = R 4 R 9 R 3 R 6 sin ( π · R 2 R 1 x n ) + x n | y n | · R 10 R 9 R 17 R 8 R 9 R 7 x n + 0 y n + 1 = R 13 R 16 R 12 R 15 x n + R 13 R 16 R 11 R 15 y n + 2 R 16 R 14
Setting IC = (0.1, 0.1), two-step power supplies transfer the initial value during the first sampling period (Ts = 0.001 s), stepping it to 0, then holding it straight as shown in Figure 15a. The specific implementation time wave is shown in Figure 15b. The attractor results of the simulated circuit under this parameter and IC are shown in Figure 15c. Different colors and shapes of markers are used in the figure to distinguish the situation at different values. Therefore, if the resistance value of the circuit is adjusted to the parameter corresponding to Section 4.4 ( π · R 2 R 1 = h = −2, R 4 R 9 R 3 R 6 = −a = 1, R 13 R 16 R 12 R 15 = c = 1, R 10 R 9 R 17 R 8 = k = 1, R 9 R 7 = 1, R 13 R 16 R 11 R 15 = 1). The circuit can achieve coexisting attractors under different initial values. From the simulation results in PSIM, it is consistent with the numerical simulation results of Matlab.
Table 3 listed the values of resistors when different parameters and step voltage combinations were used.

5. Complexity and Performance Analysis

5.1. SE and C0 Complexity

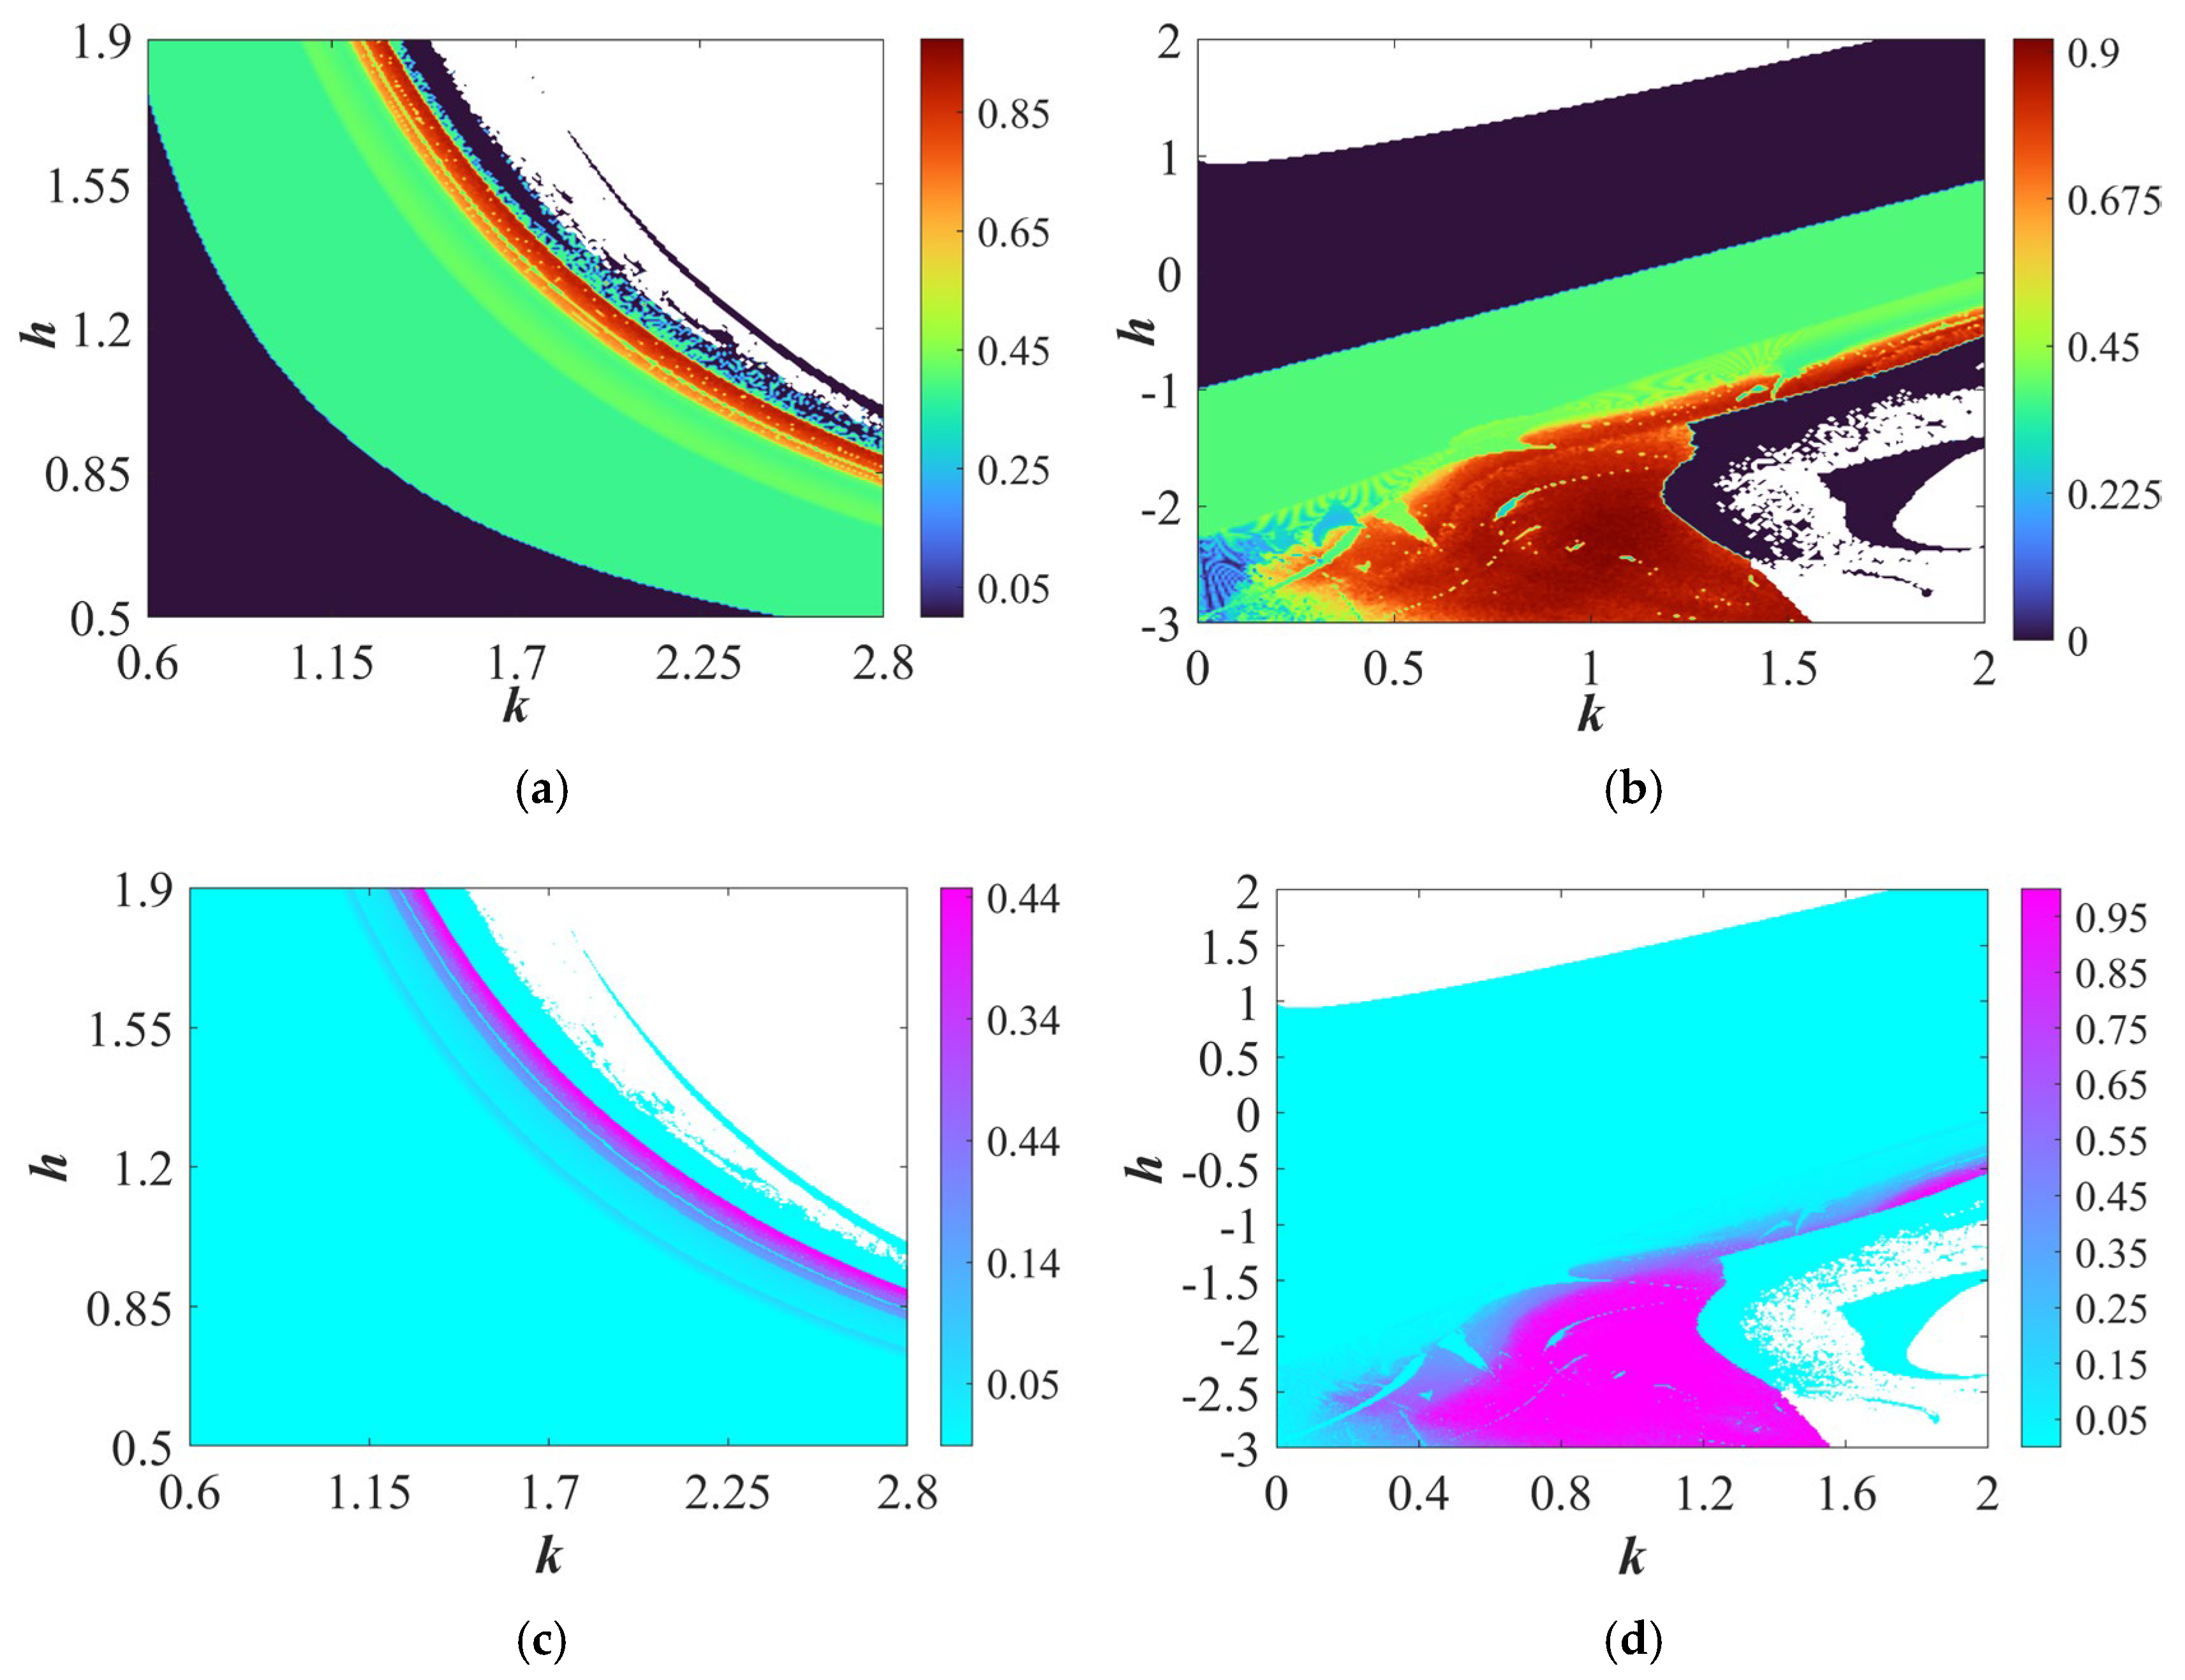
Complexity is an important index to measure the similarity between a chaotic sequence and a random sequence. The randomness of a chaotic sequence is positively correlated with its complexity [50]. From the perspective of system parameter interaction, this paper deeply discusses the chaotic characteristics of the system. With the help of the “turbo” mode in the Matlab R2022 software, the relationship between parameter changes is visually displayed by drawing contour maps of different colors. At the same time, the Spectral Entropy (SE) complexity measurement algorithm is used to accurately calculate the complexity of the new map.
When the parameter a = 1, c = 1, the IC = (0.1, 0.1), the parameter k is in the interval [0.6, 2.8], and the parameter h is in the interval [0.5, 1.9], the SE complexity contour map is shown in Figure 16a. High complexity and low complexity areas are distinguished by different colors. It can be seen in the figure that red areas are high complexity areas. Similarly, control the values of parameters a and c to be 1, and observe the contour map of parameters k and h in the corresponding area. As shown in Figure 16b, the SE is mapped after the new coupling. Compared with Figure 16a, the high complexity area of Figure 16b increases and the unbounded area decreases. Figure 16c and d show the C0 complexity distribution of the A-DM map and the new SAHM, which shows that the new map complexity region is expanded while also greatly increasing the C0 complexity.

5.2. Performance Analysis

From the performance analysis in Table 4, it can be seen that SAHM, as a 2D map method, exhibits significant advantages in SE and C0. Its SE value is 0.9259, which is significantly better than other 2D and 4D map methods. Meanwhile, SAHM’s C0 value is 0.8218, which is also in a leading position among all map methods. These results indicate that SAHM performs well in terms of the correlation of performance indicators, proving its system has certain superiority.

6. Application in PRNG

Pseudorandom numbers (PRNs) find wide-ranging use in various fields. The SAHM map proposed in this research produces hyperchaotic sequences with high complexity, showcasing excellent performance in pseudorandom number generator (PRNG) applications. With a fixed parameter setup [a = 1, k = 1.95, IC = (0.1, y0)], the strong stochastic properties and engineering practicality of the map have been successfully verified.
When the parameter y0 is set to 0.1 and 0.2, two distinct hyperchaotic sequences are generated, labeled as Xy0=0.1 = {x(1), x(2), ⋯, x(n), ⋯} and Yy0=0.2 = {y(1), y(2), ⋯, y(n), ⋯} respectively. These data sets undergo processing following the IEEE 754 standard, where each element x(n) is converted into a standardized 52-bit binary form denoted as xb(n). From each xb(n), eight significant binary digits are extracted to construct PRNs [53]. Through this procedure, the designed pseudorandom number sequence is obtained, which can be formulated by Equation (16).
P y 0 = 0.1 ( i ) = x b ( i ) 35 : 42 P y 0 = 0.2 ( i ) = y b ( i ) 35 : 42 ,
A total of 107 iterations of the SAHM map were conducted to generate hyperchaotic sequences for PRN generation. Each sequence was then segmented into 120 pseudorandom number test datasets, with each dataset being composed of 106-bit sequences. The generated PRNs are subjected to the NIST test, which includes 15 rigorous subtests designed to detect non-random characteristics in the PRNs. As stated in Ref. [54], only when the p-valueT of all subtests is greater than 0.0001 and the pass rate exceeds 0.9628 can the numbers be recognized as qualified pseudorandom numbers. Table 5 shows the test results of two PRNs, both of which passed the NIST test.

7. Conclusions

This article investigates the dynamic characteristics of existing discrete memristor models (A-DM), with a focus on analyzing their dependence on parameters and multi-steady-state behavior. The global and local amplitude control capabilities are verified through simulation circuits. On this basis, A-DM memristors are coupled in parallel with traditional sine maps to construct a novel hyperchaotic map based on sine maps. Affected by the memristor, this mapping exhibits richer dynamic behavior and has origin symmetry. Through simulation experiments, attractors under typical parameters were obtained, and it was found that attractors under different initial values can coexist under the same parameters, verifying the accuracy of theoretical analysis and demonstrating the potential of SAHM in complex dynamic behavior. Finally, comparative analysis shows that SAHM has significant advantages in complexity and randomness, and has broad application prospects in fields such as secure communication and encryption. In the future, we will focus on optimizing anti-noise performance and power consumption for engineering viability. We will also refine parameter configurations via intelligent algorithms to boost chaos intensity and randomness, while expanding applications to encryption and chaotic optimization, supported by robustness analysis against perturbations.

Author Contributions

H.S.: System analysis and draft writing. Z.Y.: Whole analysis. X.L.: Circuit implementation. Q.W.: Circuit design, supervising and reviewing. X.Y.: Manuscript revision. All authors have read and agreed to the published version of the manuscript.

Funding

This work was supported by the Guizhou Education Department Youth Science and Technology Talent Growth Project ([QianJiaoJi [2024]158, QianJiaoJi [2024]160), the Science Research Fund of Guizhou Education University (2024YB003), the Science and Technology Program of Guiyang: (ZK [2024]-1-2), the Guizhou Provincial Basic Research Program (Natural Science): ZK [2024] (652), and the Transformation of scientific and technological achievements Foundation of Guizhou Province (DS [2025] General 001).

Data Availability Statement

The original contributions presented in the study are included in the article. Further inquiries can be directed to the corresponding author.

Conflicts of Interest

Authors declare that the research was conducted in the absence of any commercial or financial relationships that could be construed as a potential conflict of interest. The authors declare no conflicts of interest.

References

  1. Chua, L. Memristor-The missing circuit element. IEEE Trans. Circuit Theory 1971, 18, 507–519. [Google Scholar] [CrossRef]
  2. Chua, L.O.; Kang, S.M. Memristive devices and systems. Proc. IEEE 1976, 64, 209–223. [Google Scholar] [CrossRef]
  3. Lin, T.-C.; Huang, F.-Y.; Du, Z.; Lin, Y.-C. Synchronization of fuzzy modeling chaotic time delay memristor-based Chua’s circuits with application to secure communication. Int. J. Fuzzy Syst. 2015, 17, 206–214. [Google Scholar] [CrossRef]
  4. Iqbal, M.; Riaz, M.B.; Ur Rehman, M.A.; Martinovic, T.; Martinovic, J. Demonstration of Sensitive analysis and optical soliton patterns in a (4+1) Dimensional Boiti-Leon-Manna Pempinelli Equation: Dynamic insights into bifurcation, chaotic behavior. Chaos Theory Appl. (CHTA) 2025, 7, 1–9. [Google Scholar] [CrossRef]
  5. Karimov, T.; Mikhailov, A.; Rybin, V.; Sheptunova, V.; Babkin, I.; Butusov, D. Attack-Resistant Chaotic Communication System in Non-ideal Physical Channel. CHF 2025, 2, 28–37. [Google Scholar] [CrossRef]
  6. Zhou, L.; Wang, C.; Zhou, L. Generating hyperchaotic multi-wing attractor in a 4D memristive circuit. Nonlinear Dyn. 2016, 85, 2653–2663. [Google Scholar] [CrossRef]
  7. Mannan, Z.I.; Choi, H.; Rajamani, V.; Kim, H.; Chua, L. Chua corsage memristor: Phase portraits, basin of attraction, and coexisting pinched hysteresis loops. Int. J. Bifurc. Chaos 2017, 27, 1730011. [Google Scholar] [CrossRef]
  8. Xu, Q.; Lin, Y.; Bao, B.; Chen, M. Multiple attractors in a non-ideal active voltage-controlled memristor based Chua’s circuit. Chaos Solitons Fractals 2016, 83, 186–200. [Google Scholar] [CrossRef]
  9. Min, F.; Xue, L. Routes toward chaos in a memristor-based Shinriki circuit. Chaos Interdiscip. J. Nonlinear Sci. 2023, 33, 023122. [Google Scholar] [CrossRef] [PubMed]
  10. Qian, K.; Xiao, Y.; Wei, Y.; Liu, D.; Wang, Q.; Feng, W. A Robust Memristor-Enhanced Polynomial Hyper-Chaotic Map and Its Multi-Channel Image Encryption Application. Micromachines 2023, 14, 2090. [Google Scholar] [CrossRef]
  11. He, S.; Zhan, D.; Wang, H.; Sun, K.; Peng, Y. Discrete memristor and discrete memristive systems. Entropy 2022, 24, 786. [Google Scholar] [CrossRef]
  12. Bao, H.; Hua, Z.; Li, H.; Chen, M.; Bao, B. Discrete memristor hyperchaotic maps. IEEE Trans. Circuits Syst. I Regul. Pap. 2021, 68, 4534–4544. [Google Scholar] [CrossRef]
  13. Peng, Y.; Sun, K.; He, S. A discrete memristor model and its application in Hénon map. Chaos Solitons Fractals 2020, 137, 109873. [Google Scholar] [CrossRef]
  14. Peng, Y.; He, S.; Sun, K. A higher dimensional chaotic map with discrete memristor. AEU-Int. J. Electron. Commun. 2021, 129, 153539. [Google Scholar] [CrossRef]
  15. Ma, M.; Yang, Y.; Qiu, Z.; Peng, Y.; Sun, Y.; Li, Z.; Wang, M. A locally active discrete memristor model and its application in a hyperchaotic map. Nonlinear Dyn. 2022, 107, 2935–2949. [Google Scholar] [CrossRef]
  16. Laskaridis, L.; Volos, C.; Stouboulos, I.; Antoniades, I.P. A Discrete memristive hyperchaotic map with a modulo function. In Proceedings of the 2023 12th International Conference on Modern Circuits and Systems Technologies (MOCAST), Athens, Greece, 28–30 June 2023; IEEE: New York, NY, USA, 2023; pp. 1–4. [Google Scholar] [CrossRef]
  17. Fan, Z. Construction, dynamic analysis and DSP implementation of a novel 3D discrete memristive hyperchaotic map. Chaos Solitons Fractals 2023, 177, 114303. [Google Scholar] [CrossRef]
  18. Feng, W.; Zhang, K.; Zhang, J.; Zhao, X.; Chen, Y.; Cai, B.; Zhu, Z.; Wen, H.; Ye, C. Integrating Fractional-Order Hopfield Neural Network with Differentiated Encryption: Achieving High-Performance Privacy Protection for Medical Images. Fractal Fract. 2025, 9, 426. [Google Scholar] [CrossRef]
  19. Hong, Q.; Jiang, H.; Xiao, P.; Du, S.; Li, T. A Parallel Computing Scheme Utilizing Memristor Crossbars for Fast Corner Detection and Rotation Invariance in the ORB Algorithm. IEEE Trans. Comput. 2025, 74, 996–1010. [Google Scholar] [CrossRef]
  20. Xiao, P.; Fang, J.; Wei, Z.; Dong, Y.; Du, S.; Wen, S.; Hong, Q. A Riccati Matrix Equation Solver Design Based Neurodynamics Method and Its Application. IEEE Trans. Autom. Sci. Eng. 2025, 22, 15163–15176. [Google Scholar] [CrossRef]
  21. Yu, F.; Wu, C.; Xu, S.; Yao, W.; Xu, C.; Cai, S.; Wang, C. Color video encryption transmission in IoT based on memristive hopfield neural network. SIViP 2025, 19, 77. [Google Scholar] [CrossRef]
  22. Yu, F.; He, S.; Yao, W.; Cai, S.; Xu, Q. Bursting Firings in Memristive Hopfield Neural Network with Image Encryption and Hardware Implementation. IEEE Trans. Comput.-Aided Des. Integr. Circuits. Syst. 2025, 1. [Google Scholar] [CrossRef]
  23. Li, K.; Bao, H.; Li, H.; Ma, J.; Hua, Z.; Bao, B. Memristive Rulkov neuron model with magnetic induction effects. IEEE Trans. Ind. Inf. 2022, 18, 1726–1736. [Google Scholar] [CrossRef]
  24. Li, Y.; Li, C.; Lei, T.; Yang, Y.; Chen, G. Offset boosting-entangled complex dynamics in the memristive Rulkov neuron. IEEE Trans. Ind. Electron. 2023, 71, 9569–9579. [Google Scholar] [CrossRef]
  25. Lai, Q.; Yang, L. Discrete memristor applied to construct neural networks with homogeneous and heterogeneous coexisting attractors. Chaos Solitons Fractals 2023, 174, 113807. [Google Scholar] [CrossRef]
  26. Bao, H.; Hua, Z.; Wang, N.; Zhu, L.; Chen, M.; Bao, B. Initials-Boosted Coexisting Chaos in a 2-D Sine Map and Its Hardware Implementation. IEEE Trans. Ind. Inf. 2021, 17, 1132–1140. [Google Scholar] [CrossRef]
  27. Kavehei, O.; Iqbal, A.; Kim, Y.S.; Eshraghian, K.; Al-Sarawi, S.F.; Abbott, D. The fourth element: Characteristics, modelling and electromagnetic theory of the memristor. Proc. R. Soc. A 2010, 466, 2175–2202. [Google Scholar] [CrossRef]
  28. Peng, Y.; Lan, Z.; Li, W.; Li, Y.; Peng, J. Modeling different discrete memristive sine maps and its parameter identification. Eur. Phys. J. Spec. Top. 2022, 231, 3187–3196. [Google Scholar] [CrossRef]
  29. Eshraghian, K.; Kavehei, O.; Chappell, J.M.; Iqbal, A.; Al-Sarawi, S.F.; Abbott, D. Memristive device fundamentals and modeling: Applications to circuits and systems simulation. Proc. IEEE 2012, 100, 1991–2007. [Google Scholar] [CrossRef]
  30. Wang, Q.; Tian, Z.; Wu, X.; Li, K.; Sang, H.; Yu, X. A 5D super-extreme-multistability hyperchaotic map based on parallel-cascaded memristors. Chaos Solitons Fractals 2024, 187, 115452. [Google Scholar] [CrossRef]
  31. Fu, L.; Wu, X.; He, S.; Wang, H.; Sun, K. A memristive Hénon map based on the state variable difference and its analog circuit implementation. IEEE Trans. Ind. Electron. 2023, 71, 9668–9676. [Google Scholar] [CrossRef]
  32. Yang, K.; Joshua Yang, J.; Huang, R.; Yang, Y. Nonlinearity in Memristors for Neuromorphic Dynamic Systems. Small Sci. 2022, 2, 2100049. [Google Scholar] [CrossRef]
  33. Corinto, F.; Ascoli, A.; Gilli, M. Nonlinear Dynamics of Memristor Oscillators. IEEE Trans. Circuits Syst. I 2011, 58, 1323–1336. [Google Scholar] [CrossRef]
  34. Corinto, F.; Forti, M. Memristor Circuits: Bifurcations without Parameters. IEEE Trans. Circuits Syst. I 2017, 64, 1540–1551. [Google Scholar] [CrossRef]
  35. Li, K.; Wang, Q.; Hu, C.; Liang, B.; Jian, C.; Zheng, Q.; Tian, Z.; Zhao, J. Dynamical analysis of a novel 2D Lyapunov exponent controllable memristive chaotic map. Chaos Interdiscip. J. Nonlinear Sci. 2024, 34, 083135. [Google Scholar] [CrossRef] [PubMed]
  36. Zhang, S.; Zhang, H.; Wang, C. Dynamical analysis and applications of a novel 2-D hybrid dual-memristor hyperchaotic map with complexity enhancement. Nonlinear Dyn. 2023, 111, 15487–15513. [Google Scholar] [CrossRef]
  37. Han, X.; Bi, X.; Sun, B.; Ren, L.; Xiong, L. Dynamical Analysis of Two-Dimensional Memristor Cosine Map. Front. Phys. 2022, 10, 911144. [Google Scholar] [CrossRef]
  38. Khan, A.; Li, C.; Zhang, X.; Cen, X. A Two-Memristor-based Chaotic System with Symmetric Bifurcation and Multistability. CHF 2025, 2, 1–7. [Google Scholar] [CrossRef]
  39. Sharma, P.R.; Shrimali, M.D.; Prasad, A.; Kuznetsov, N.V.; Leonov, G.A. Control of multistability in hidden attractors. Eur. Phys. J. Spec. Top. 2015, 224, 1485–1491. [Google Scholar] [CrossRef]
  40. Emin, B.; Yaz, M. Digital Implementation of Chaotic Systems Using Nvidia Jetson AGX Orin and Custom DAC Converter. CHF 2024, 1, 38–41. [Google Scholar] [CrossRef]
  41. Alawida, M.; Samsudin, A.; Teh, J.S.; Alshoura, W.H. Digital Cosine Chaotic Map for Cryptographic Applications. IEEE Access 2019, 7, 150609–150622. [Google Scholar] [CrossRef]
  42. Zhu, H.; Liu, W.; Sun, K.; Wang, H. Sine-modulation Discrete Memristor Chaotic Map and Its Applications. Nonlinear Dyn. 2025, 1–11. [Google Scholar] [CrossRef]
  43. Chong, Z.; Wang, C.; Zhang, H.; Zhang, S. Sine-Transform-Based Dual-Memristor Hyperchaotic Map and Analog Circuit Implementation. IEEE Trans. Instrum. Meas. 2025, 74, 1–14. [Google Scholar] [CrossRef]
  44. Hermans, M.; Schrauwen, B.; Bienstman, P.; Dambre, J. Automated Design of Complex Dynamic Systems. PLoS ONE 2014, 9, e86696. [Google Scholar] [CrossRef]
  45. Falconer, I.; Gottwald, G.A.; Melbourne, I.; Wormnes, K. Application of the 0-1 test for chaos to experimental data. SIAM J. Appl. Dyn. Syst. 2007, 6, 395–402. [Google Scholar] [CrossRef]
  46. Cetina-Denis, J.J.; Lopéz-Gutiérrez, R.M.; Cruz-Hernández, C.; Arellano-Delgado, A. Design of a chaotic trajectory generator algorithm for mobile robots. Appl. Sci. 2022, 12, 2587. [Google Scholar] [CrossRef]
  47. Murillo-Escobar, D.; Murillo-Escobar, M.Á.; Cruz-Hernández, C.; Arellano-Delgado, A.; López-Gutiérrez, R.M. Pseudorandom number generator based on novel 2D Hénon-Sine hyperchaotic map with microcontroller implementation. Nonlinear Dyn. 2023, 111, 6773–6789. [Google Scholar] [CrossRef] [PubMed]
  48. Mashuri, A.; Adenan, N.H.; Abd Karim, N.S.; Siew, W.T.; Zeng, Z. Application of Chaos Theory in Different Fields—A Literature Review. JSML 2024, 12, 92–101. [Google Scholar] [CrossRef]
  49. Hua, Q.; Shen, B. Simulation of selective catalytic reduction of NO and oxidation of CO and C7H8 over V2O5-TiO2 catalyst. J. Energy Inst. 2025, 119, 101956. [Google Scholar] [CrossRef]
  50. Pisarchik, A.N.; Hramov, A.E. Multistability in Physical and Living Systems: Characterization and Applications; Springer International Publishing: Cham, Switzerland, 2022. [Google Scholar] [CrossRef]
  51. Cao, Y.; Li, Z.; He, S. Complex hidden dynamics in a memristive map with delta connection and its application in image encryption. Nonlinear Dyn. 2024, 112, 7597–7613. [Google Scholar] [CrossRef]
  52. He, S.; Hu, K.; Wang, M.; Wang, H.; Wu, X. Design and dynamics of discrete dual-memristor chaotic maps and its application in speech encryption. Chaos Solitons Fractals 2024, 188, 115517. [Google Scholar] [CrossRef]
  53. Wang, Y.; Liu, Z.; Zhang, L.Y.; Pareschi, F.; Setti, G.; Chen, G. From chaos to pseudorandomness: A case study on the 2-D coupled map lattice. IEEE Trans. Cybern. 2023, 53, 1324–1334. [Google Scholar] [CrossRef] [PubMed]
  54. Rukhin, A.; Soto, J.; Nechvatal, J.; Smid, M.; Barker, E.; Leigh, S.; Levenson, M.; Vangel, M.; Banks, D.; Heckert, A.; et al. A Statistical Test Suite for Random and Pseudorandom Number Generators for Cryptographic Applications; Department of Commerce, Technology Administration, National Institute of Standards and Technology: Gaithersburg, MD, USA, 2010; Volume 22. [Google Scholar]
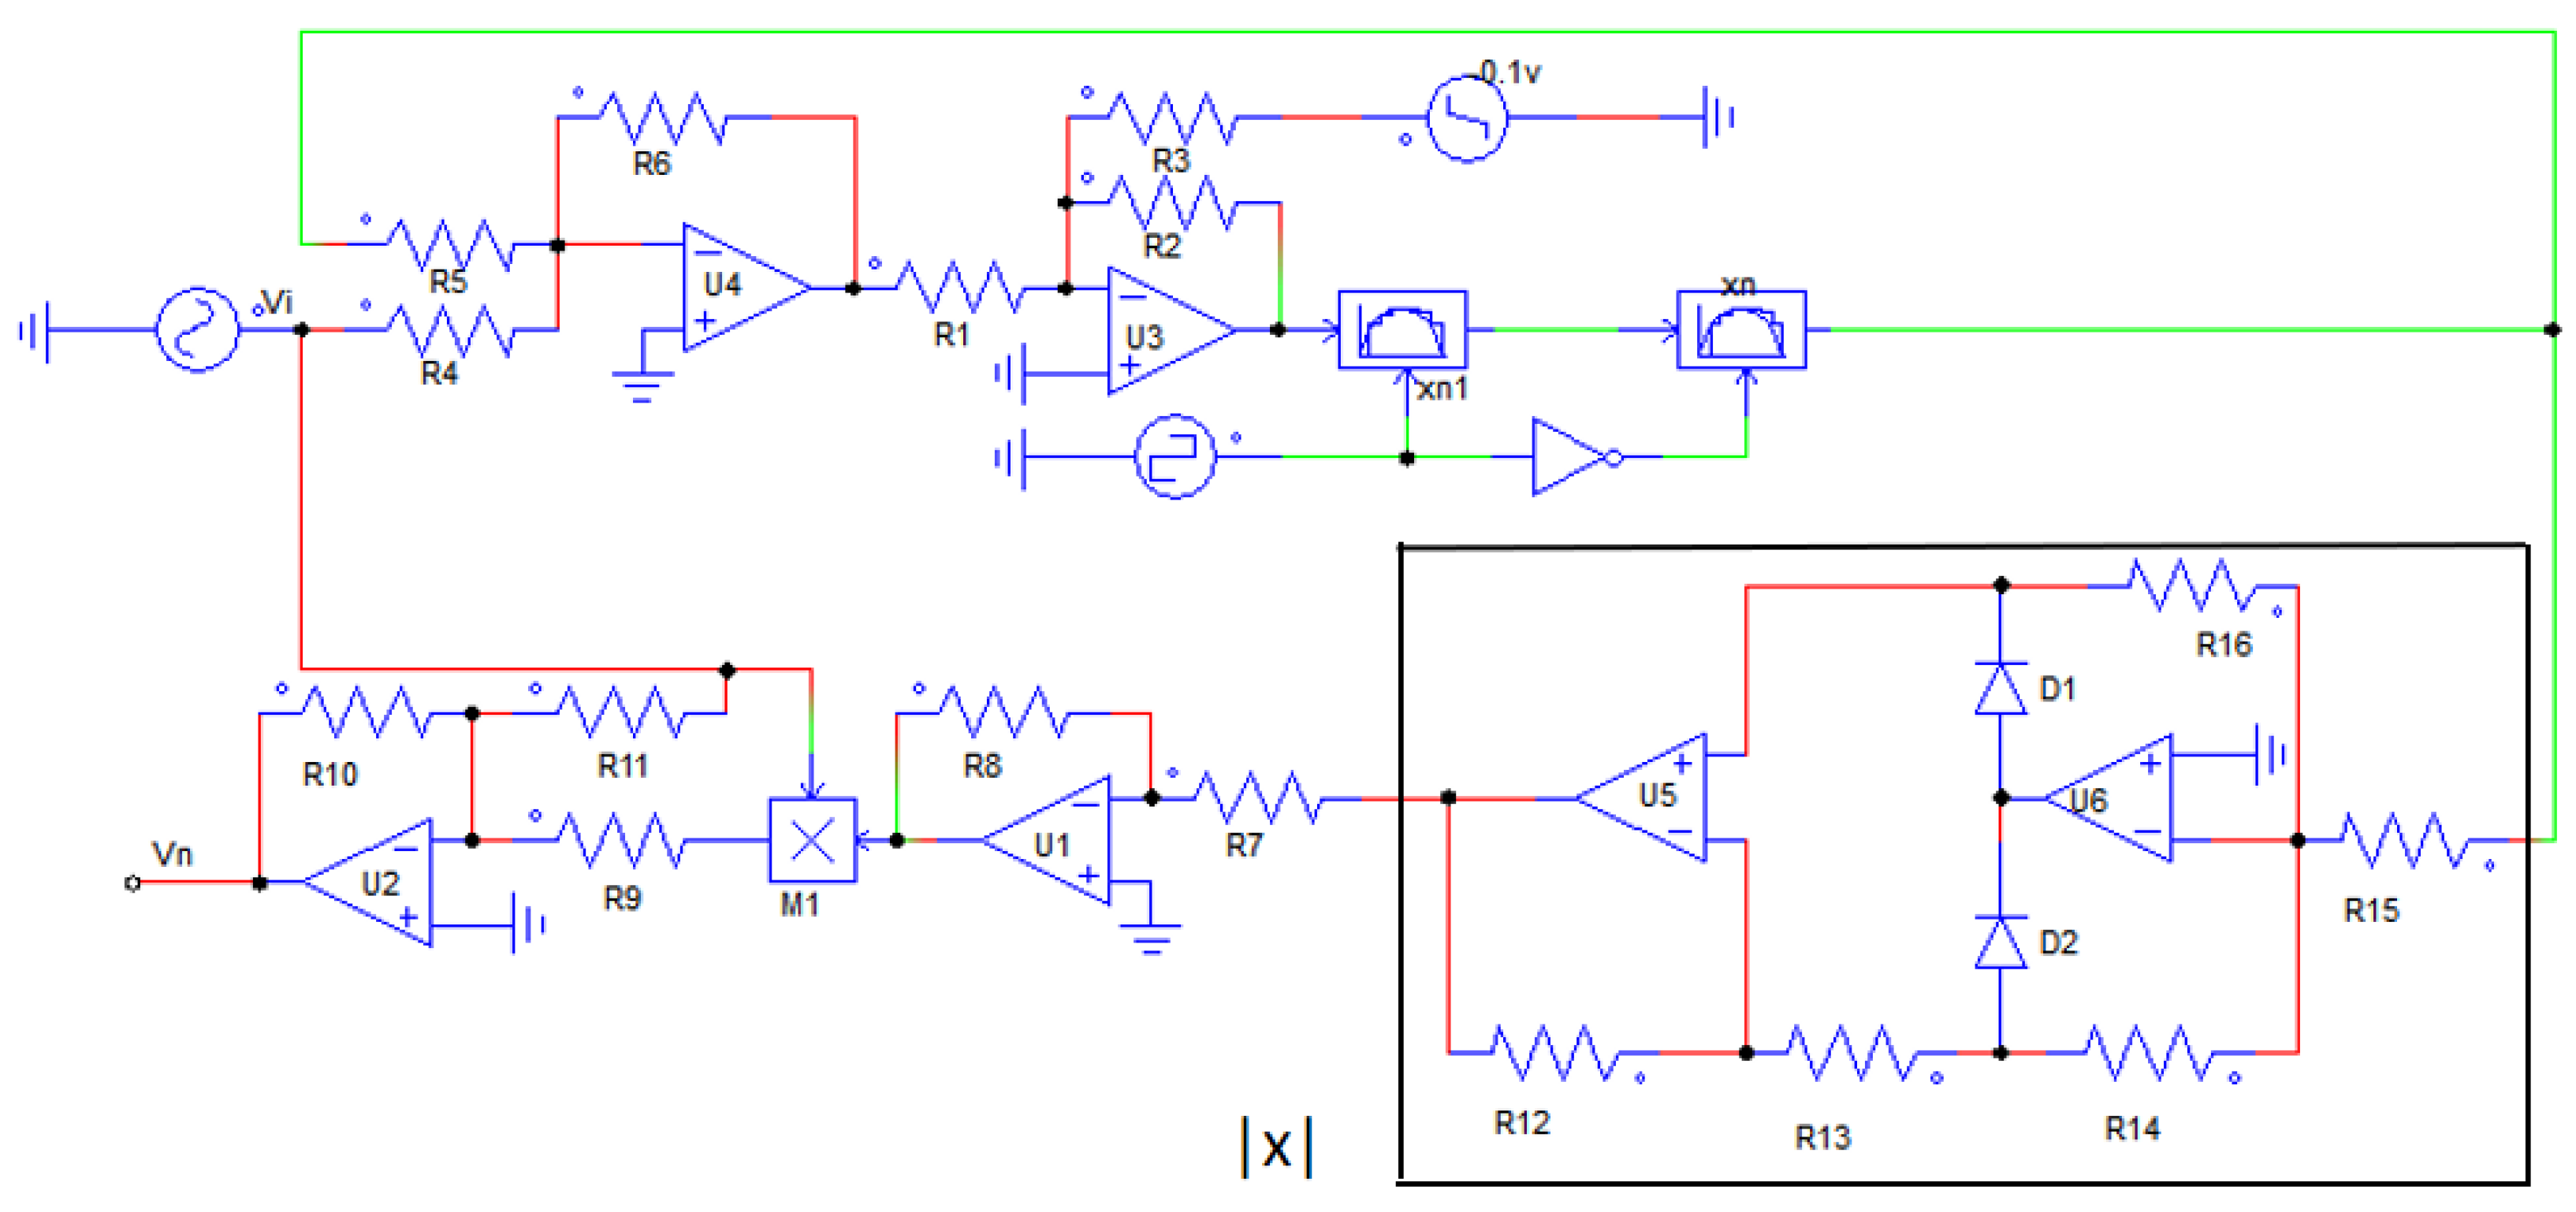
Figure 1. The analog circuit schematic of the A-DM.
Symmetry 17 01358 g001
Figure 2. Waveform of step voltage source when Vq0 = 1 V.
Symmetry 17 01358 g002
Figure 3. The characteristic of A-DM. (a) The PHLs of A-DM when A = 0.1, f = 19.52 Hz, and q0 = 1, 2, and 3. (b) The PHLs of A-DM when A = 0.1, q0 = 0.1, and f = 19.52, 31.83, and 47.75 Hz. (c) The PHLs of A-DM when f = 19.52 HZ, q0 = 1, A = 0.1, 0.2, and 0.3. (d) The iterative sequence.
Symmetry 17 01358 g003
Figure 4. The dynamics of A-DM when a = 1, c = 1, and IC = (0.1, 0.1). (a) One-dimensional LE spectra and bifurcation diagram in the interval of k ∈ [1.8, 2.6]. (b) Attractors when k takes typical values. (c) The dynamic distribution on the kh plane. (d) The first LE distribution on the kh plane.
Symmetry 17 01358 g004
Figure 5. Characteristic of amplitude control in A-DM map when k = 2.3, h = 1, and IC = (0.1, 0.1) for the scaling variables a and c. (a) LE spectrum and bifurcation diagram for a. (b) Attractors when a = 0.5, 1, 1.5, and 2. (c) LE spectrum and bifurcation diagram for c. (d) Attractors when c = 0.5, 1, and 1.5.
Symmetry 17 01358 g005
Figure 6. The characteristic of multi-stability when a = 1, k = 2.3, h = 1, c = 1, and the IC = (x0, y0). (a) The 2D local dynamic distribution depends on x0y0. (b) LE spectra and bifurcation diagrams depend on y0 when x0 = 0.1. (c) Coexisting attractors.
Symmetry 17 01358 g006
Figure 7. Analog circuit schematic of A-DM map.
Symmetry 17 01358 g007
Figure 8. The results of analog circuit simulation when IC = (0.1, 0.1), k = 2.3, and h = 1. (a) The attractors of a when c = 1. (b) The attractors of c when a = 1.
Symmetry 17 01358 g008
Figure 9. Schematic structure of SAHM.
Symmetry 17 01358 g009
Figure 10. The dynamics of SAHM depend on k and h when a = 1, c = 1, and IC = (0.1, 0.1). (a) The 2D dynamic distribution and (b) the 2D first LE spectra on the kh plane. (c) The spectra of LE and the bifurcation diagram for k when h = −0.53. (d) Attractors when k takes typical values.
Symmetry 17 01358 g010
Figure 11. The dynamics of SAHM depend on a and k when the parameter h = 0.31, c = 1, and the IC = (0.1, 0.1). (a) The 2D dynamic distribution and (b) 2D first LE spectra on the ak plane. (c) The LE spectra and bifurcation diagram for a when k = 0.78. (d) Attractors when a takes typical values.
Symmetry 17 01358 g011aSymmetry 17 01358 g011b
Figure 12. The characteristic of multi-stability of SAHM when a = 1, k = 1, h = −2, c = 1, and the IC = (x0, y0). (a) The 2D local dynamic distribution depends on x0y0. (b) The distribution of the first LE. (c) LE spectra and bifurcation diagrams depend on y0 when x0 = 0.1. (d) Coexisting attractors.
Symmetry 17 01358 g012
Figure 13. The characteristic of symmetry of SAHM when a = −4.5, h = 0.31, and IC = (0.1, 0.1). (a) 2D dynamic distribution and (b) 2D first LE spectra on the kc plane. (c) The spectra of LE and bifurcation diagram for c when k = 0.89. (d) The symmetrical attractors.
Symmetry 17 01358 g013aSymmetry 17 01358 g013b
Figure 14. The circuit schematic of SAHM.
Symmetry 17 01358 g014
Figure 15. The circuit simulation of SAHM. (a) The time waves. (b) Attractors with different values of R4. (c) Coexisting attractors with different step voltages.
Symmetry 17 01358 g015
Figure 16. The SE and C0 complexity in the kh plane (a) The SE complexity of A-DM and (b) SAHM. (c) The C0 complexity of A-DM and (d) SAHM.
Symmetry 17 01358 g016
Table 1. The resistance of the resistors of A-DM map.
Parameter ValuesResistor Values
a = 0.5, c = 1, k = 2.3, and h = 1R2 = R4 = R5 = R6 = R7 = R8 = R9 = R10 = R11 = R12 = R13 = R14 = R15 = R16 = 10 kΩ, R1 = 23 kΩ, R3 = 20 kΩ
a = 0.8, c = 1, k = 2.3, and h = 1R2 = R4 = R5 = R6 = R7 = R8 = R9 = R10 = R11 = R12 = R13 = R14 = R15 = R16 = 10 kΩ, R3 = 12.5 kΩ
a = 1, c = 1, k = 2.3, and h = 1R2 = R4 = R5 = R6 = R7 = R8 = R9 = R10 = R11 = R12 = R13 = R14 = R15 = R16 = 10 kΩ, R1 = 23 kΩ, R3 = 10 kΩ
a = 1, c = 2, k = 2.3, and h = 1R2 = R3 = R4 = R5 = R6 = R8 = R9 = R10 = R11 = R12 = R13 = R14 = R15 = R16 = 10 kΩ, R1 = 23 kΩ, R7 = 5 kΩ
a = 1, c = 1, k = 2.3, and h = 1R2 = R3 = R4 = R5 = R6 = R8 = R9 = R10 = R11 = R12 = R13 = R14 = R15 = R16 = 10 kΩ, R1 = 23 kΩ, R7 = 10 kΩ
a = 1, c = 0.5, k = 2.3, and h = 1R2 = R3 = R4 = R5 = R6 = R8 = R9 = R10 = R11 = R12 = R13 = R14 = R15 = R16 = 10 kΩ, R1 = 23 kΩ, R7 = 20 kΩ
Table 2. The results of the Gottwald-Melbourne 0–1.
Parameters and IcsK(xn)K(yn)Status
a = 1, h = −0.53, c = 1, k = 1.6, IC = (0.1, 0.1)−0.002191−0.000236P4
a = 1, h = −0.53, c = 1, k = 1.88, IC = (0.1, 0.1)0.9977220.998529CH
a = 1, h = −0.53, c = 1, k = 1.95, IC = (0.1, 0.1)0.9976510.998687HCH
Table 3. The resistance of the resistors of SAHM.
Parameter ValuesResistor ValuesStep Voltage
a = −5.5, h = 0.31, k = 0.78, c = 1R1 = R7 = R8 = R10 = R11 = R12 = R13 = R14 = R15 = R16 = R17 = R18 = R19 = R20 = R21 = R22 = 10 kΩ, R2 = 3.1 kΩ, R3 = 20 kΩ, R5 = R6 = R9 = 20 kΩ, R4 = 55 kΩ[0.1 V, 0.1 V]
a = −5, h = 0.31, k = 0.78, c = 1R1 = R7 = R8 = R10 = R11 = R12 = R13 = R14 = R15 = R16 = R17 = R18 = R19 = R20 = R21 = R22 = 10 kΩ, R2 = 3.1 kΩ, R3 = 20 kΩ, R5 = R6 = R9 = 20 kΩ, R4 = 50 kΩ[0.1 V, 0.1 V]
a = −4.8, h = 0.31, k = 0.78, c = 1R1 = R7 = R8 = R10 = R11 = R12 = R13 = R14 = R15 = R16 = R17 = R18 = R19 = R20 = R21 = R22 = 10 kΩ, R2 = 3.1 kΩ, R3 = 20 kΩ, R5 = R6 = R9 = 20 kΩ, R4 = 48 kΩ[0.1 V, 0.1 V]
a = −3.5, h = 0.31, k = 0.78, c = 1R1 = R7 = R8 = R10 = R11 = R12 = R13 = R14 = R15 = R16 = R17 = R18 = R19 = R20 = R21 = R22 = 10 kΩ, R2 = 3.1 kΩ, R3 = 20 kΩ, R5 = R6 = R9 = 20 kΩ, R4 = 35 kΩ[0.1 V, 0.1 V]
a = 1, h = −2, k = 1, c = 1R1 = R2 = R3 = R4 = R7 = R8 = R10 = R11 = R12 = R13 = R14 = R15 = R16 = R17 = R18 = R19 = R20 = R21 = R22 = 10 kΩ, R5 = R6 = R9 = 20 kΩ[−2.5 V, 0 V]
a = 1, h = −2, k = 1, c = 1R1 = R2 = R3 = R4 = R7 = R8 = R10 = R11 = R12 = R13 = R14 = R15 = R16 = R17 = R18 = R19 = R20 = R21 = R22 = 10 kΩ, R5 = R6 = R9 = 20 kΩ[0 V, −2.5 V]
a = 1, h = −2, k = 1, c = 1R1 = R2 = R3 = R4 = R7 = R8 = R10 = R11 = R12 = R13 = R14 = R15 = R16 = R17 = R18 = R19 = R20 = R21 = R22 = 10 kΩ, R5 = R6 = R9 = 20 kΩ[0 V, −2 V]
a = 1, h = −2, k = 1, c = 1R1 = R2 = R3 = R4 = R7 = R8 = R10 = R11 = R12 = R13 = R14 = R15 = R16 = R17 = R18 = R19 = R20 = R21 = R22 = 10 kΩ, R5 = R6 = R9 = 20 kΩ[0 V, 2 V]
a = 1, h = −2, k = 1, c = 1R1 = R2 = R3 = R4 = R7 = R8 = R10 = R11 = R12 = R13 = R14 = R15 = R16 = R17 = R18 = R19 = R20 = R21 = R22 = 10 kΩ, R5 = R6 = R9 = 20 kΩ[0 V, 2.5 V]
Table 4. Comparative analysis of recent similar chaotic systems.
MapsParametersDemSEPESampEIEC0
SAHM1, −2, 1, 120.92592.93150.65067.95970.8218
DMP-SDM [42]2,2,1.8520.92503.58490.39127.68440.6953
E-SCDM [43]1.8, 1.6930.91623.65930.96127.98450.1655
TMNM [51]1, −3, −0.9240.84053.51960.62107.76590.7105
SSM-CM [52]1.77,1.7730.89623.32580.41017.55910.0366
Table 5. The results of the NIST test.
Testing Itemsy0 = 0.1y0 = 0.2
p-ValuetPass Ratep-ValuetPass Rate
Frequency0.253551117/1200.012650120/120
Block Frequency0.213309120/1200.437274117/120
Runs0.484646119/1200.162606120/120
Largest runs0.619972118/1200.090906118/120
Rank0.035174120/1200.001344120/120
FFT0.001490120/1200.275709119/120
None-ovla. Temp. 10.001399118/1200.006196119120
Ovla. Temp.0.213309117/1200.048716118/120
Universal0.122325118/1200.931952117/120
Linear complexity0.299251119/1200.012650118/120
Serial (1st)0.602458120/1200.275709120/120
Serial (2nd)0.437274118/1200.437274119/120
Appr. entropy0.066882120/1200.090936119/120
Cum. Sums (F)0.468595116/1200.875539119/120
Cum. Sums (B)0.082177118/1200.213309119/120
Ran. Exc. 20.02075074/750.16260675/75
Ran. Exc. Var. 30.01881574/750.09096374/75
Success counts15/1515/1515/1515/15
1 Non-overlapping template test encompasses 148 subtest items, with the worst-case performance value serving as the reporting benchmark. 2 The random excursions test comprises 8 independent subtests, the worst sub-indicators are exhibited. 3 The random excursions variant test contains 18 subtest units, the worst value is listed.
Disclaimer/Publisher’s Note: The statements, opinions and data contained in all publications are solely those of the individual author(s) and contributor(s) and not of MDPI and/or the editor(s). MDPI and/or the editor(s) disclaim responsibility for any injury to people or property resulting from any ideas, methods, instructions or products referred to in the content.