1. Introduction
Congestion at saturated signalized intersections remains a persistent and complex challenge in urban traffic control. While traffic flow theory and signal optimization have advanced significantly over the past few decades [
1,
2,
3], much of this progress has been centered on network-level optimization or idealized assumptions about flow. In contrast, there has been less focus on understanding the microscopic mechanisms of intersection-specific complexities and mixed traffic interactions [
4,
5,
6]. These microscopic insights are crucial, as they offer a deeper understanding of localized traffic behavior and are key to developing adaptive and effective traffic control strategies. This is particularly important in complex urban environments, where the interactions among vehicles, bicycles, and pedestrians can be highly asymmetric. In this study, asymmetric traffic behavior at signalized intersections refers to the spatial, temporal, or behavioral discrepancies among different directions or participant types (e.g., vehicles, pedestrians, and bicycles), often resulting from uneven infrastructure design, traffic control strategies, or interaction priorities. These asymmetries can affect traffic efficiency, safety, and fairness, and thus merit systematic modeling and analysis.
According to Li’s definition of congestion [
7], traffic blockages at intersections can be categorized into link-blockage and lane-blockage. Link-blockage refers to large-scale congestion caused by queues that propagate upstream along entire road segments, typically resulting from downstream bottlenecks. Lane-blockage, on the other hand, refers to localized, temporary congestion induced by factors such as irregular traffic arrivals, vehicle–pedestrian conflicts, or mismatched signal phases. These two types of congestion represent macro- and micro-scale phenomena, respectively. The formation of link-blockage is primarily influenced by two factors [
8]: (1) permanent infrastructure-based capacity constraints and (2) the accumulation and interaction of local disruptions. While signal timing adjustments can alleviate system-wide capacity constraints, addressing the spread of localized congestion requires a behaviorally sensitive modeling framework that can capture individual-level actions and asymmetric flow interactions.
Traditional signal optimization models are generally categorized into two major families: bandwidth-based models and delay-based models. Bandwidth-based approaches [
9,
10,
11,
12] aim to maximize uninterrupted green wave progression for vehicles by assuming constant speeds and no downstream queuing. However, these methods are typically suited to undersaturated traffic conditions and often fail in congested or geometrically complex intersection settings. Delay-based models [
13,
14,
15,
16], on the other hand, are better equipped to handle saturated intersections by minimizing average delays based on queuing theory or simulation. Despite their practical relevance, both categories of models oversimplify traffic heterogeneity by neglecting the characteristics of non-motorized riders and pedestrians, as well as interactions with motorized traffic streams.
These simplifications, though analytically convenient, lead to distorted representations of urban intersections, especially in mixed traffic environments common in developing regions. In such settings, pedestrians may cross diagonally during red phases, cyclists often encroach into motorized lanes, and user compliance varies widely. These behaviors result in complex, asymmetric interactions that cannot be captured by models assuming homogeneous and symmetric agent behavior. Consequently, there is a pressing need for traffic modeling frameworks that can explicitly represent agent heterogeneity and directional asymmetries.
To bridge this gap, researchers have increasingly adopted mesoscopic and microscopic modeling approaches, including the Cell Transmission Model (CTM) and cellular automaton (CA) model. The CTM, grounded in kinematic wave theory [
17], has been applied to intersection control [
18,
19] and extended to incorporate dynamic signal timing and capacity drop effects [
20,
21,
22,
23]. However, the CTM’s aggregated structure limits its ability to represent discrete and non-continuous behaviors, particularly those involving heterogeneous road users at high-conflict locations within intersections.
In contrast, CA models offer a more flexible and fine-grained representation of traffic dynamics [
24,
25,
26]. CA models discretize space, time, and state transitions, enabling the simulation of complex interactions at the level of individual agents [
27,
28,
29]. The rule-based structure of CA makes it particularly suitable for modeling non-standard behaviors, lane-changing dynamics, and interactions in confined spaces. Several scholars have explored CA models for intersection simulation, particularly under mixed traffic conditions [
30,
31,
32]. For example, Li et al. [
33] proposed a CA-based model for vehicle–bicycle interactions under shared lane conditions. These studies represent important steps forward, but they often rely on simplified or symmetric assumptions, such as applying the same rule set to different user types or assuming uniform response to conflict.
Despite growing interest in mixed traffic modeling, there remains a significant research gap in modeling asymmetric traffic structures and non-uniform conflict mechanisms at signalized intersections. Most existing CA models treat agents homogeneously and overlook the diverse spatial privileges, behavioral hierarchies, and temporal access differences that exist between vehicles, bicycles, and pedestrians. For instance, right-turning vehicles are often forced to yield to through-moving bicycles or pedestrians, creating localized, direction-dependent congestion not captured by symmetric CA rule sets. Moreover, pedestrians may violate signals or move at highly variable speeds, further increasing the system’s heterogeneity and unpredictability.
To bridge this gap, the present study proposes an asymmetric-structure-based CA model tailored to the dynamics of saturated signalized intersections with heterogeneous traffic flows. Building on prior CA research [
34,
35,
36,
37], we introduce two key innovations: (1) a right-of-way hierarchy, which encodes priority levels among different user types and movement directions, and (2) a conflict prediction layer, which anticipates potential clashes and adjusts movement decisions accordingly. These extensions allow the model to capture non-reciprocal interactions and spatial asymmetries, such as the disproportionate blocking effect of cyclists on vehicles or the unique delay patterns induced by jaywalking pedestrians.
In summary, this study aims to address the following research objectives: (1) to develop an asymmetric-structure-based CA model that simulates the interactions among vehicles, bicycles, and pedestrians, enabling a quantitative evaluation of service performance at signalized intersections under mixed traffic conditions; (2) to mine and analyze symmetry-aware behavioral patterns from simulated trajectory data using clustering techniques, thereby recurring interaction structures that characterize asymmetric congestion dynamics; and (3) to explicitly represent cooperative and conflict dynamics within and across different traffic participant types under a unified CA framework, thus capturing the heterogeneous and asymmetric nature of urban traffic behavior.
2. Method
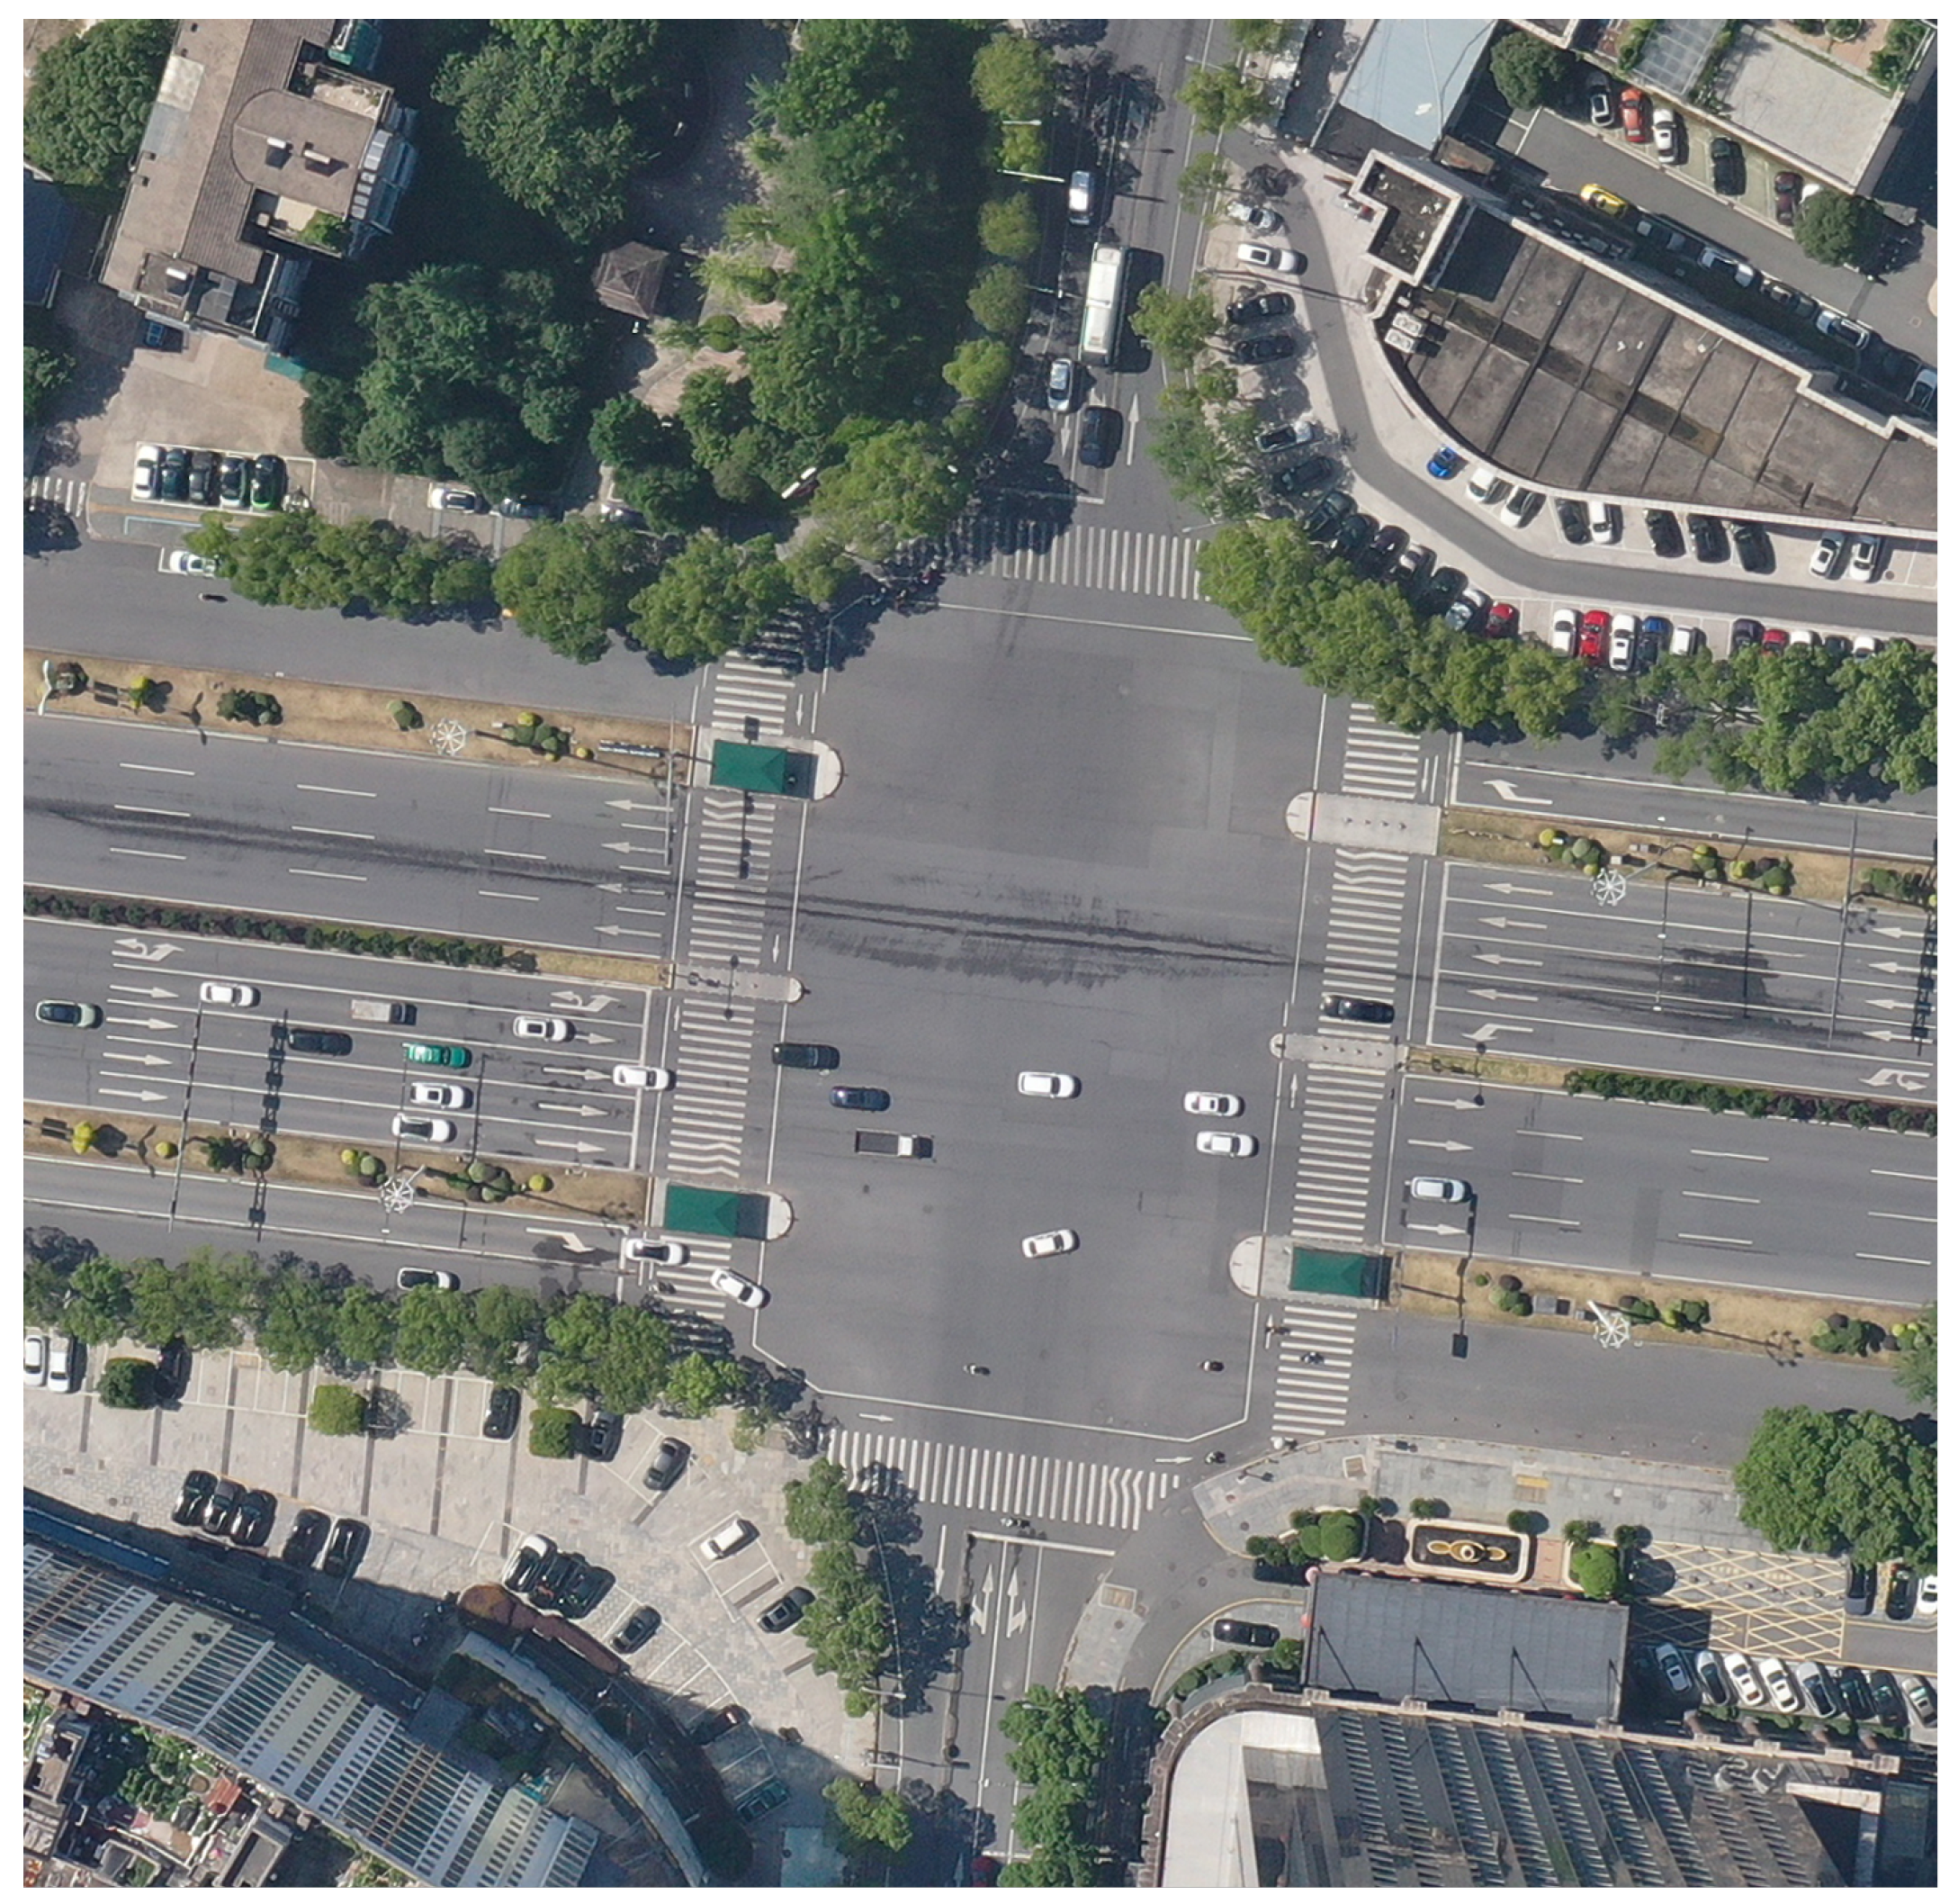
In this model, symmetry is defined as the reciprocity and uniformity in spatial rules, agent priorities, and behavioral responses. Any deviation from these constitutes asymmetry. To support the development of our asymmetric-structure-based CA model for signalized intersections (as shown in
Figure 1), a set of modeling assumptions is established to ensure both conceptual clarity and computational feasibility. These assumptions draw inspiration from the extended CTM framework proposed by Wright and Roberg [
8]. In addition, we also account for the discrete and rule-based nature of the CA model. The assumptions cover aspects related to traveler behavior, traffic demand, and infrastructure configuration. The main assumptions are as follows:
- (1)
Drivers determine their route and turning decisions based on their current location, intended destination, and prevailing traffic rules.
- (2)
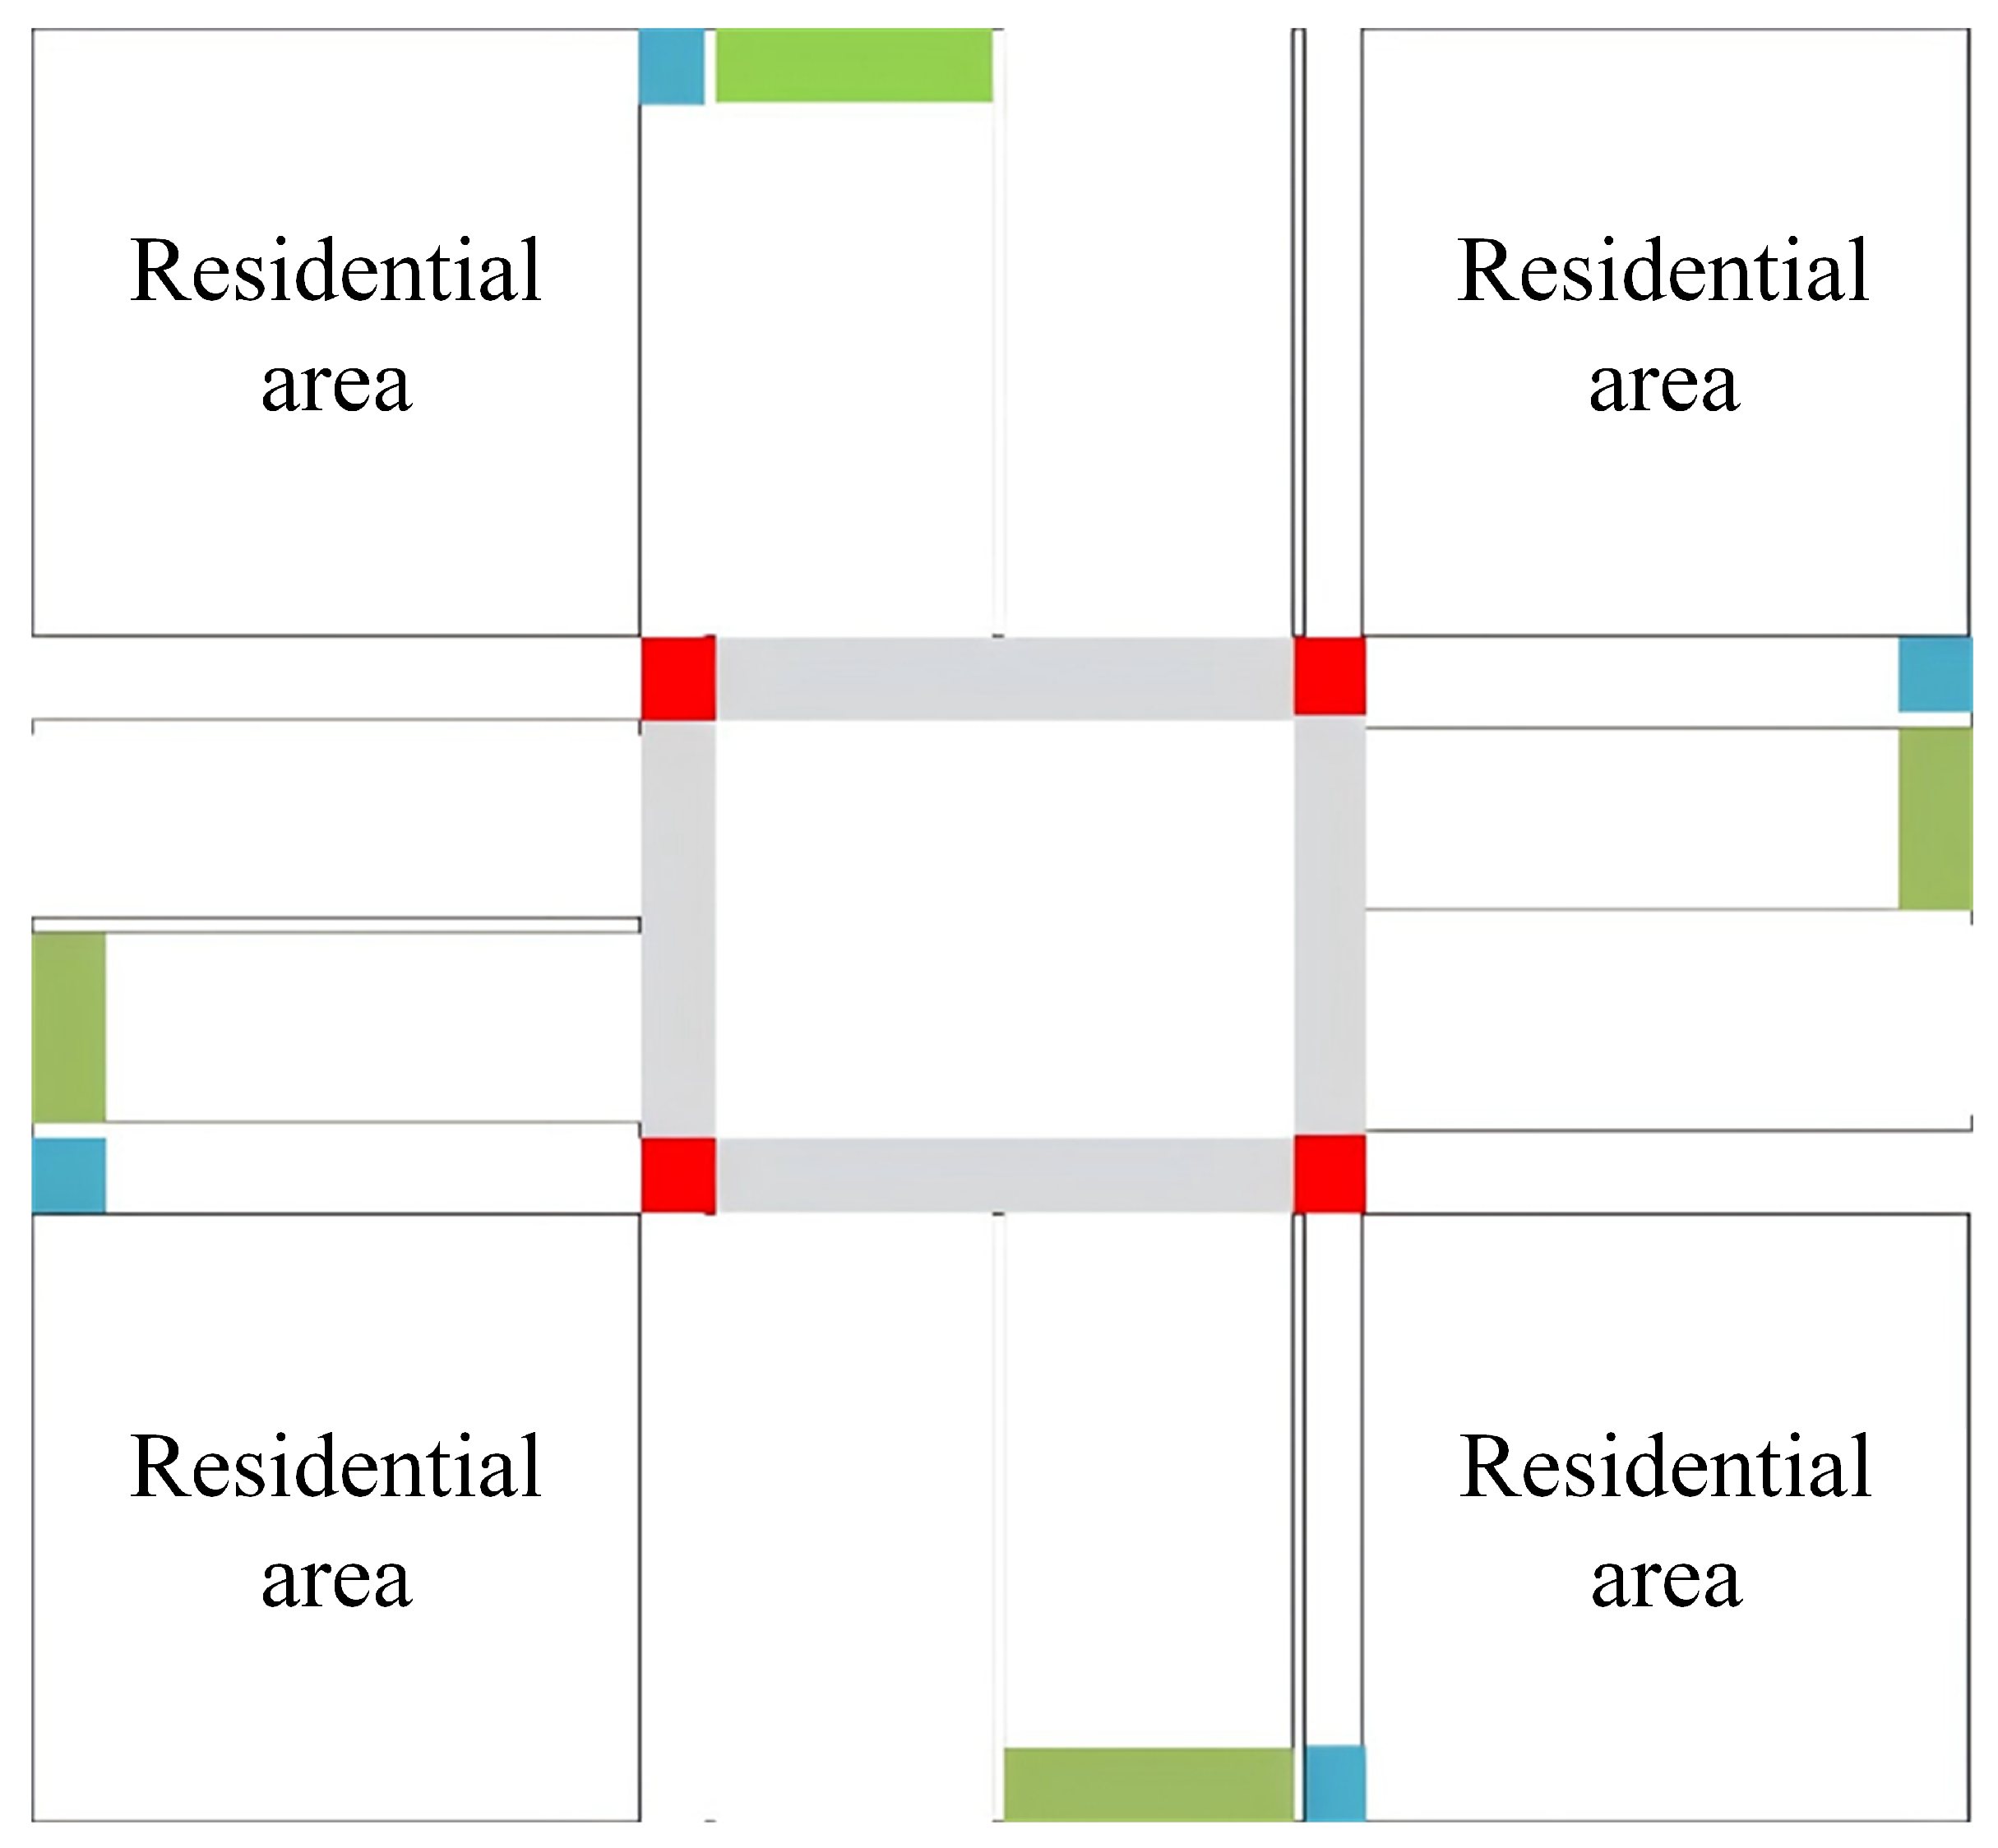
As shown in
Figure 2, vehicles, bicycles, and pedestrians are introduced into the simulation through designated red, blue, and green zones, respectively. Their entry follows predefined demand profiles with varying input intensities.
- (3)
The intersection environment consists of one-way approaches connected by a central junction. The entire area is discretized into uniform square cells of size 1 m × 1 m, providing a consistent spatial resolution for modeling movement dynamics.
- (4)
All vehicles, bicycles, and pedestrians are treated as homogeneous agents within their respective categories. That is, they share identical physical dimensions and behavioral rules, although interactions across modes (e.g., between vehicles and bicycles) are explicitly asymmetric.
- (5)
The position and velocity of a vehicle (or bicycle or pedestrian) at time step are jointly determined by its own state and the states of neighboring agents at time t, following predefined CA transition rules. This assumption reflects the localized and decentralized nature of traffic flow evolution.
- (6)
The motorized lane is 15 cells wide, allowing three vehicles to travel in parallel. The non-motorized lane and the sidewalk are each 3 cells wide, accommodating three bicycles or three pedestrians side by side. These lane widths are selected to reflect realistic spatial allocation and asymmetric user interactions at intersections.
2.1. Notation in Proposed Model
To facilitate the formulation, the variables to be used are listed in the Nomenclature.
2.2. Preset Model Parameters
According to the distinct physical and dynamic characteristics of pedestrians, bicycles, and vehicles, the relevant model parameters are summarized in
Table 1.
2.2.1. Definition of Cell Size
The spatial occupancy of each traffic participant is discretized based on its physical dimensions and behavioral traits. Although the actual footprint of a pedestrian is approximately 0.4 m × 0.4 m, pedestrians typically maintain interpersonal distance while walking. Therefore, each pedestrian is assumed to occupy a single cell with dimensions of 1 cell × 1 cell (i.e., 1 m × 1 m). A typical bicycle measures 1.6–1.8 m in length and 0.5–0.8 m in width. To account for lateral swing during motion and the necessary following distance, each bicycle occupies two longitudinal cells and one lateral cell, represented as 2 cells × 1 cell. Vehicles, due to their larger size and the need for safety buffers while stopping or maneuvering, occupy significantly more space. In our model, each vehicle occupies 5 cells in length and 3 cells in width (i.e., 5 m × 3 m), which includes both the vehicle body and the safety spacing with adjacent vehicles. This discretization reflects the asymmetric spatial requirements among different types of road users, which is fundamental for capturing heterogeneous interactions at intersections.
2.2.2. Definition of Neighborhood
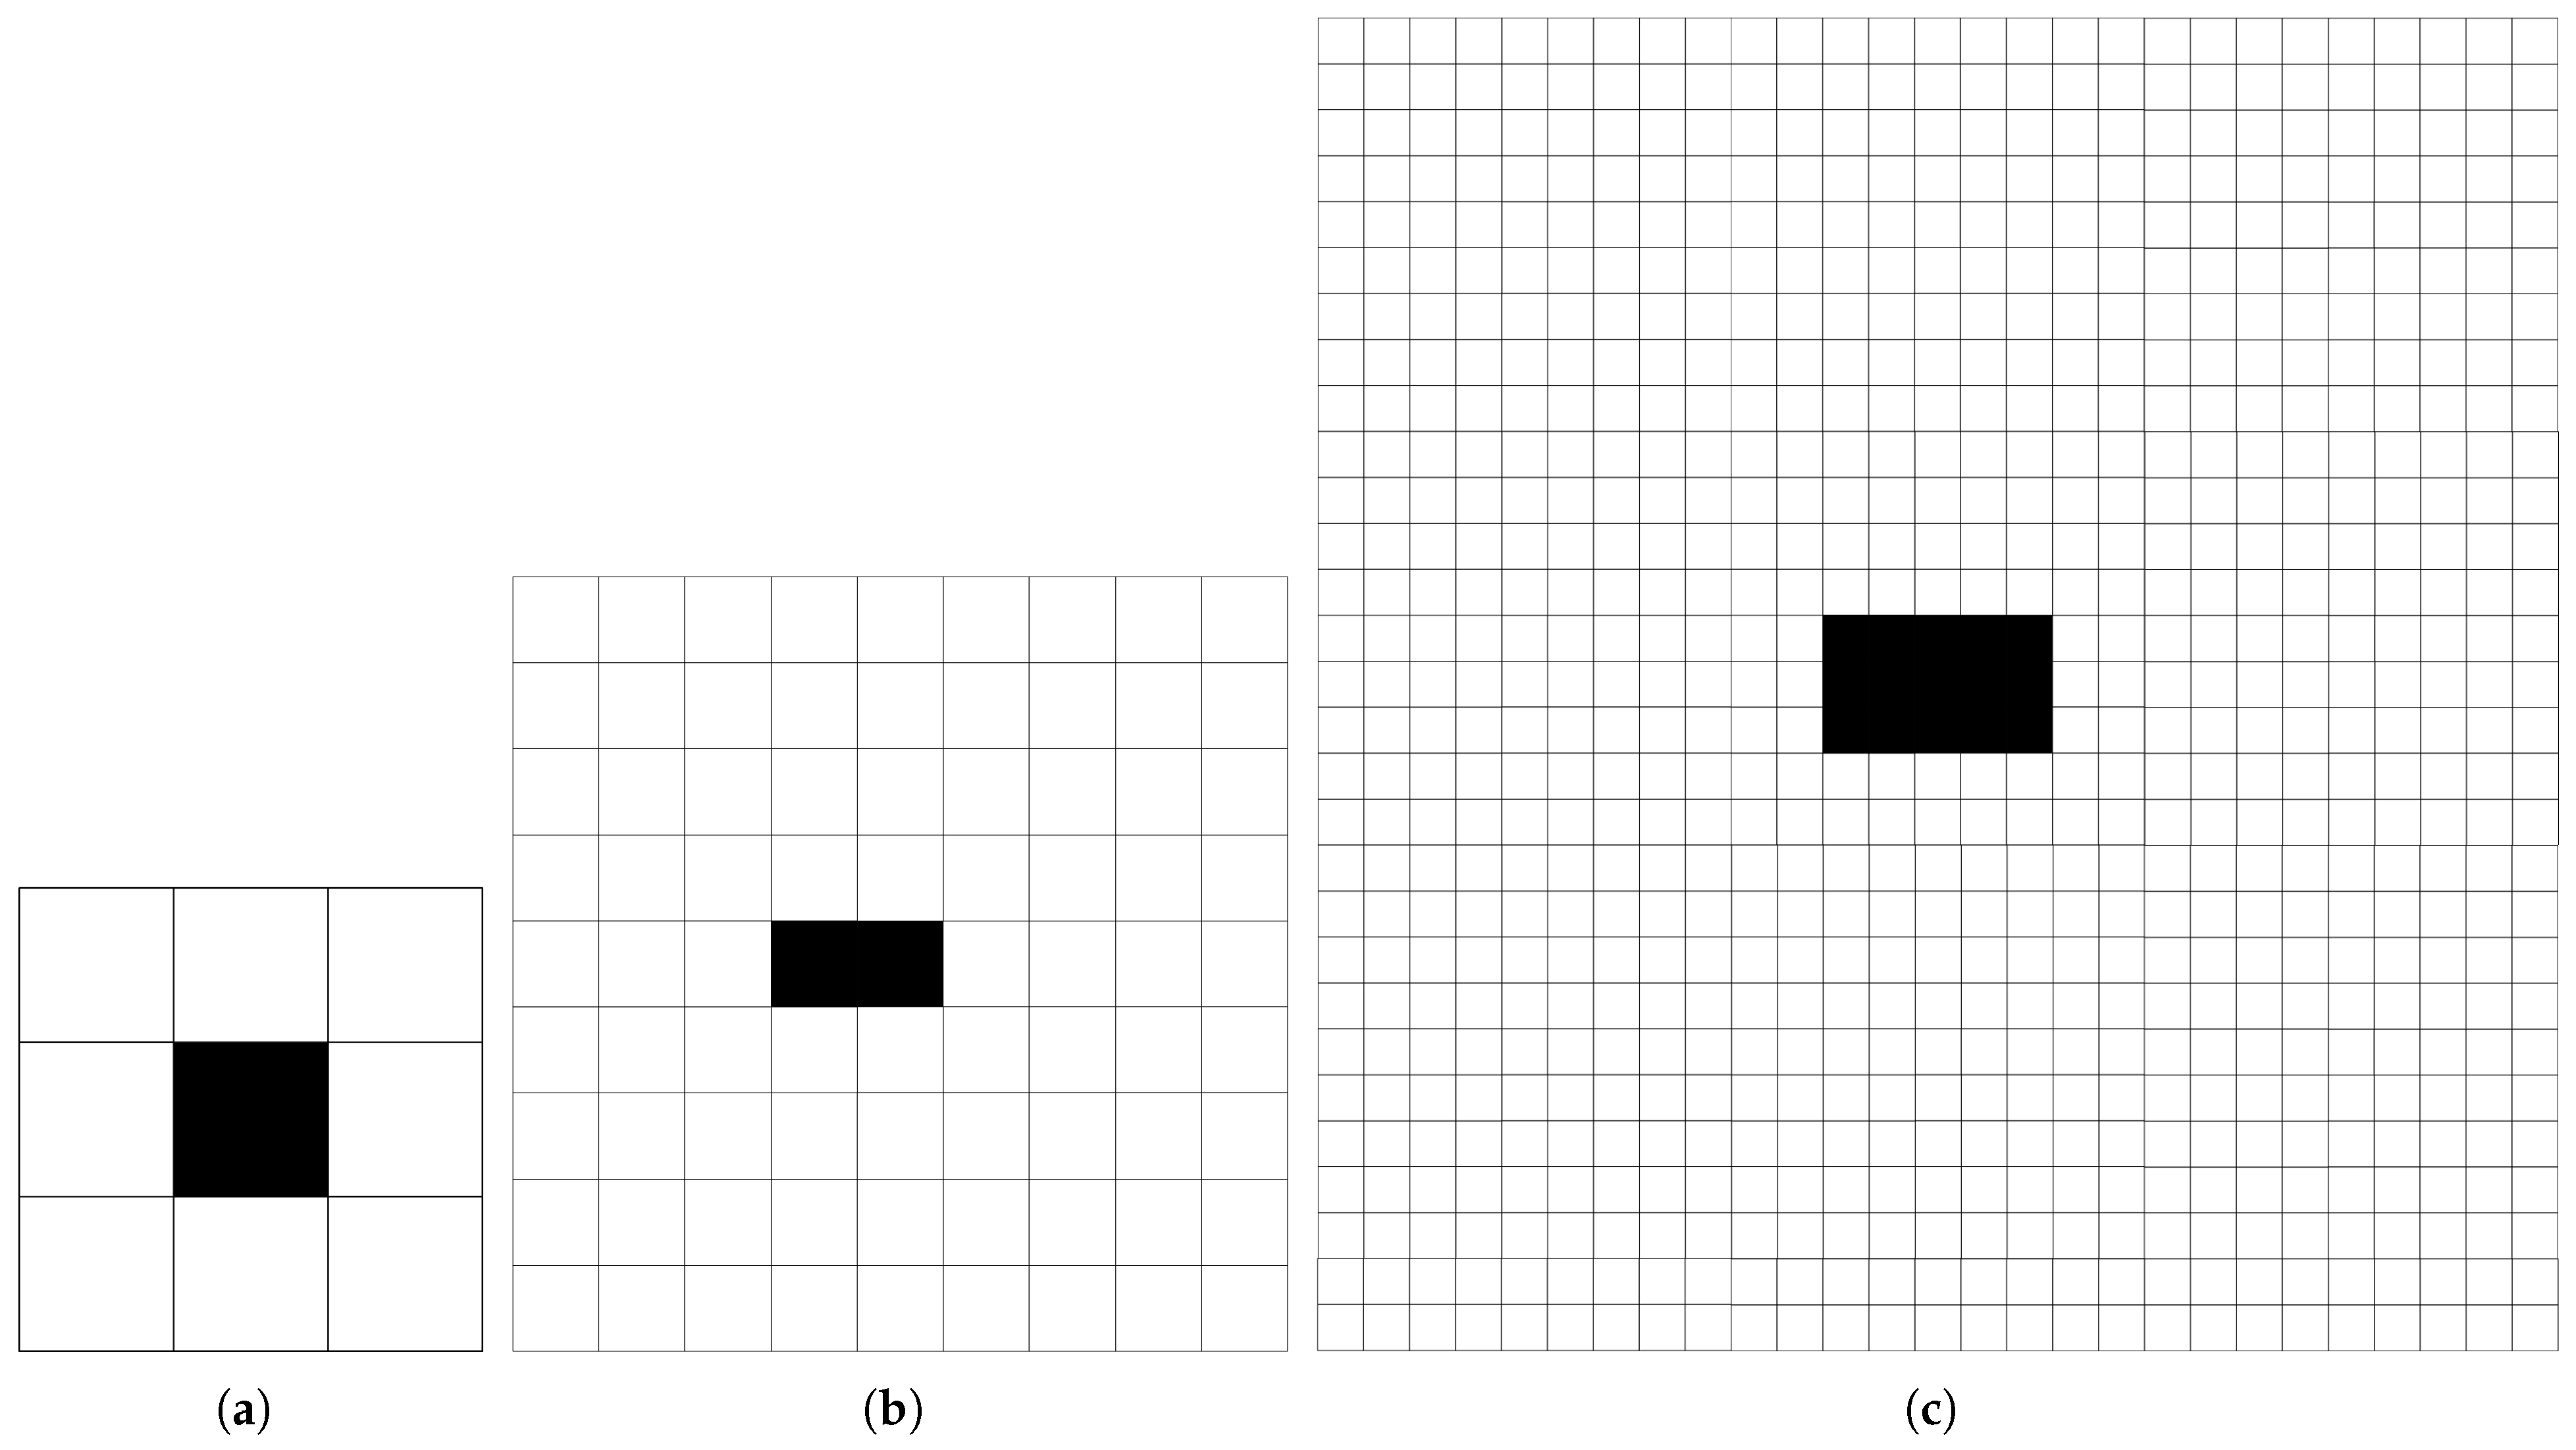
In the CA framework, the state update of a cell is governed by its neighborhood, which defines the set of surrounding cells influencing its next state. The neighborhood size is determined jointly by the cell’s movement capabilities—especially its maximum speed—and its potential turning behavior. As illustrated in
Figure 3, the extended Moore neighborhood is adopted to accommodate omnidirectional interactions. For pedestrians, who occupy a single cell and move at a maximum speed of 1cell/s, a standard 3 × 3 neighborhood is sufficient to capture all immediate influences. For bicycles, with a maximum speed of 4 cells/s and the ability to make 90-degree turns, a 9 × 9 neighborhood is defined. This allows sufficient spatial awareness for lane-keeping, turning, and conflict avoidance behaviors. For vehicles, which move up to 14 cells/s and can also perform turning maneuvers, the neighborhood extends to 29 × 29 cells. This broader neighborhood reflects the larger sensing and reaction zone required by vehicles due to their higher speeds and more complex dynamics.
These asymmetric neighborhood definitions ensure that each traffic agent operates within a perception field appropriate to its physical and behavioral characteristics, which is critical for modeling heterogeneous and non-uniform interactions at signalized intersections.
2.3. Calculation of the Driving Direction
In non-motorized lanes and motor lanes, bicycles and vehicles can only move in one dimension or change lanes if conditions permit. However, in the intersection area, it is different. Bicycles and vehicles can also adjust the driving direction from 90 degrees left to 90 degrees right clockwise (as shown in
Figure 4). Therefore, it can be considered that bicycles and vehicles move in two dimensions in the intersection area. In this paper, based on the CA model characteristics of discretization, meshing, and simplification, we simplify the driving direction range into five fixed turning angles, i.e., 90 degrees left, 45 degrees left, going straight, 45 degrees right, and 90 degrees right.
Before calculating the headway, the target bicycle or vehicle needs to determine the driving direction at a given time according to its own coordinates
, destination coordinates
, and located area. In this paper, the simulation scene is divided into 5 × 5 block partitions based on the difference in location and function, as shown in
Figure 5. The schematic diagram of an unzoned intersection, zoned intersection, and gridded intersection are all shown in this figure. The simulation scene is divided into 25 blocks according to the difference in location and function, and these are assigned serial numbers. Subsequently, the 25 partitions are meshed to form the grid diagram, which is assigned a coordinate system.
In
Figure 5, the coordinates of region 1 are (1,1), the coordinates of region 2 are (1,2), and so on. When the vehicle enters the intersection area, the vehicle’s own coordinates
are assigned according to the located area, and the destination coordinates
are assigned according to the destination area. The vector obtained by subtracting
from
is a direct factor affecting the driving direction of the driver. However, due to the influence of traffic rules, we need to make some amendments to
.
In non-motorized lanes and motor lanes, we need to map
along the direction
p of the lane to obtain the vector
. Then we unitize
, and the resulting vector
is the driving direction of the target vehicle in the street. In the intersection area (i.e., the area composed of sidewalks and the intersection), bicycles and vehicles travel in a free direction. Combined with the previous five simplified turning angles, we map
along the closest turning angle
q to obtain the vector
and unitize it to obtain the driving direction
. Therefore, the calculation formula of driving direction is as follows:
where Equations (1)–(3) are based on standard applications of planar geometry and vector operations, specifically the cross product and angle calculation between vectors.
2.4. Conflict and Avoidance Judgment
2.4.1. Classification of Right of Way
Conflicts among vehicles, bicycles, and pedestrians are frequently observed at signalized intersections, and the fundamental cause of these conflicts is the competition for right of way. To reflect this asymmetry and to ensure traffic safety, the proposed model assigns hierarchical right-of-way levels to different traffic participants based on their vulnerability and legal priority. According to the
Highway Capacity Manual [
38], pedestrians are assigned the highest priority with a right-of-way grade
, followed by bicyclists with
. Go-straight vehicles hold a lower priority with
, while turning vehicles are given the lowest grades—left-turning vehicles with
and right-turning vehicles with
. In conflict scenarios, if a traffic participant with a lower right-of-way grade encounters one with a higher grade, the lower-grade participant will perform an avoidance maneuver, while the higher-grade participant proceeds without adjustment. This priority rule introduces an asymmetric behavioral structure and reflects real-world dynamics in which more vulnerable road users (e.g., pedestrians) are legally protected and typically expected to be yielded to.
2.4.2. Prediction Layer
In two-dimensional CA models, conflict points may arise when different types of road users occupy intersecting paths—particularly between go-straight vehicles and laterally approaching participants. To capture this temporal–spatial complexity, a prediction layer is introduced as an auxiliary mechanism to simulate forward-looking behavior. This layer enables each traffic agent to anticipate potential conflicts by projecting its own movement trajectory, as well as those of surrounding objects, based on their current positions and velocities. Formally, for a given time step t, we define a prediction layer (Layer II) that overlays the actual state layer (Layer I). Layer II contains the projected positions of pedestrians, bicycles, and vehicles at time , forming the basis for collision detection and avoidance decision-making.
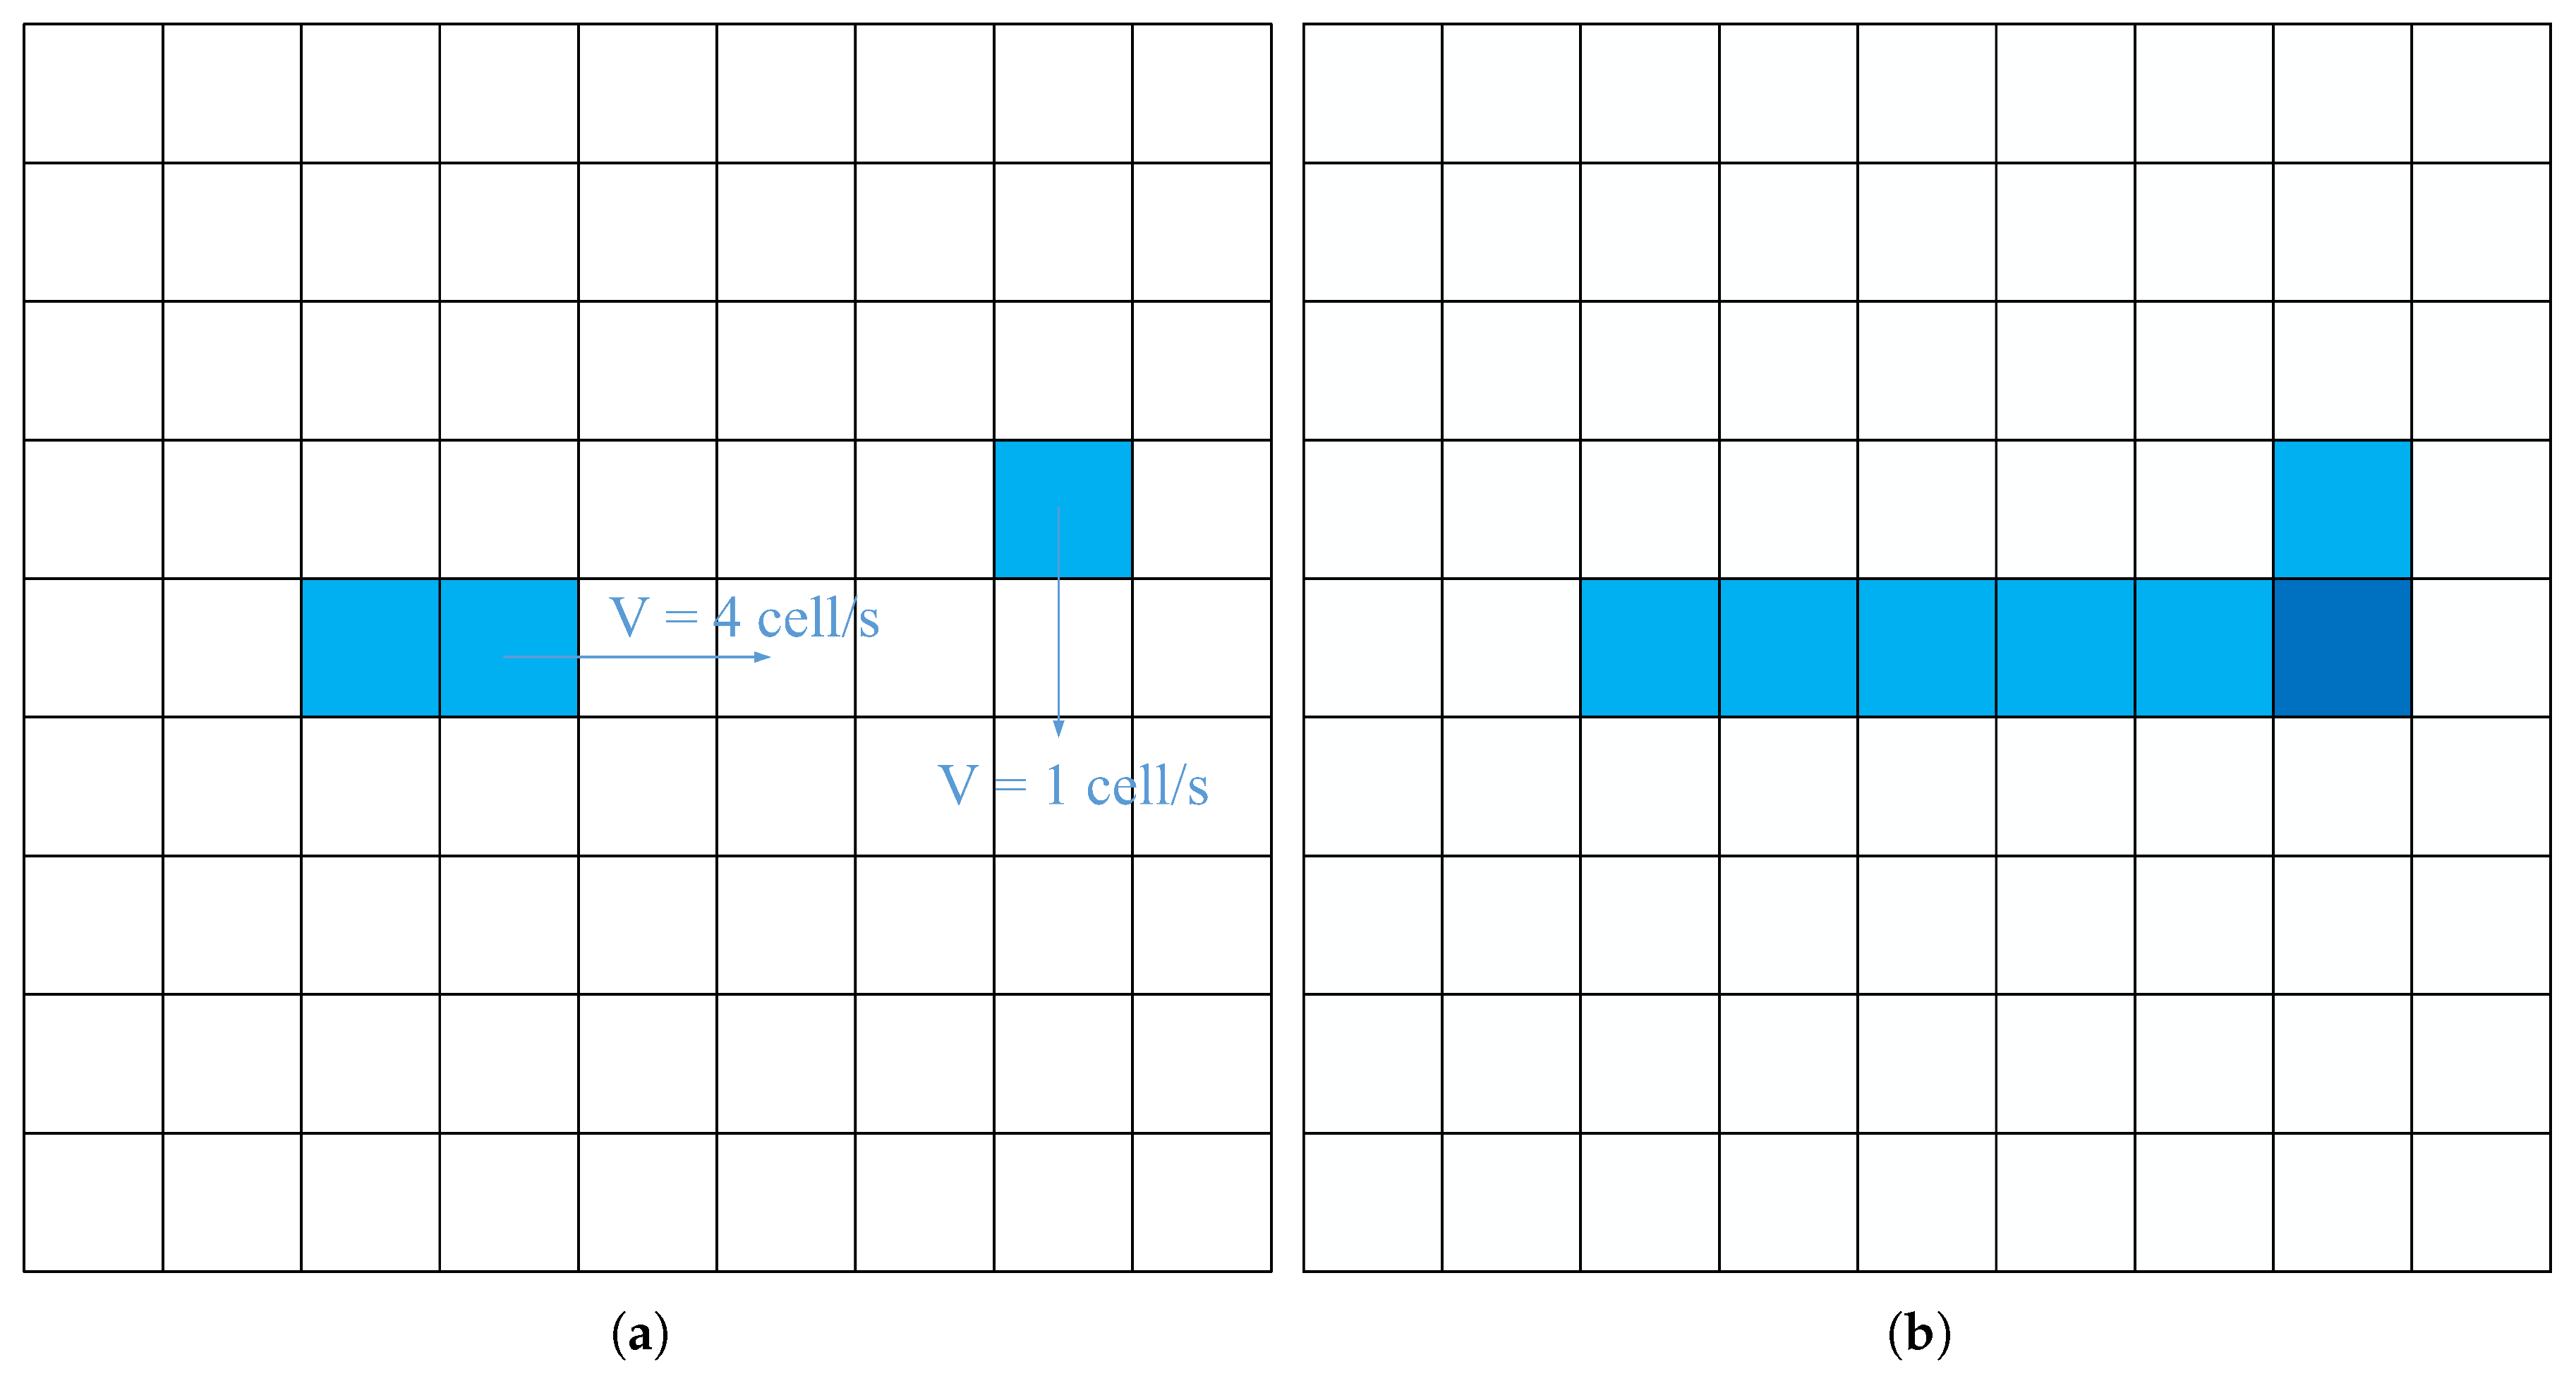
As illustrated in
Figure 6, the left side shows Layer I (current state), while the right side displays Layer II (prediction). In Layer I, bicycle
A and pedestrian
B are moving toward a potential conflict point. Layer II reveals that their projected paths will intersect, indicating a likely collision at the next time step. According to the right-of-way hierarchy, since pedestrian
B holds a higher priority than bicycle
A, the bicycle must initiate an avoidance maneuver, while the pedestrian proceeds unaffected. The avoidance behavior modifies the headway of the agent. In this example, as shown in
Figure 6, the headway of bicycle
A is reduced from 4 cells to 1 cell to accommodate the pedestrian’s movement. This dynamic adjustment mechanism enables the model to realistically capture non-uniform and asymmetric interactions among heterogeneous traffic flows at intersections.
2.5. Lane-Change Judgement
In order to better reflect the actual lane-changing behavior of vehicles, each object will calculate the headway of the left lane, middle lane, and right lane when driving and choose a better driving lane to change. The lane-change formula is shown as follows, where
is the maximum value between
,
, and
. And the above three values are the left headway, middle headway, and right headway of the target vehicle
i.
is the index of the maximum value (i.e., if
is 1, then
is the maximum value), which determines whether the target vehicle changes to the left, to the right, or not.
2.6. Status Update
After calculating the headway of all the objects, it is necessary to update their status. Status update is divided into four parts: acceleration, deceleration, random slow, and position update. The formula is as follows, where is the speed of object i at time n, a is the object’s inherent acceleration, is the maximum speed of the object, is the headway, is the driving direction, is the random probability of slowing down (i.e., when the probability is less than 0.3, the speed of the object is slowed by one cell/s). The four parts’ formulas are shown as follows:
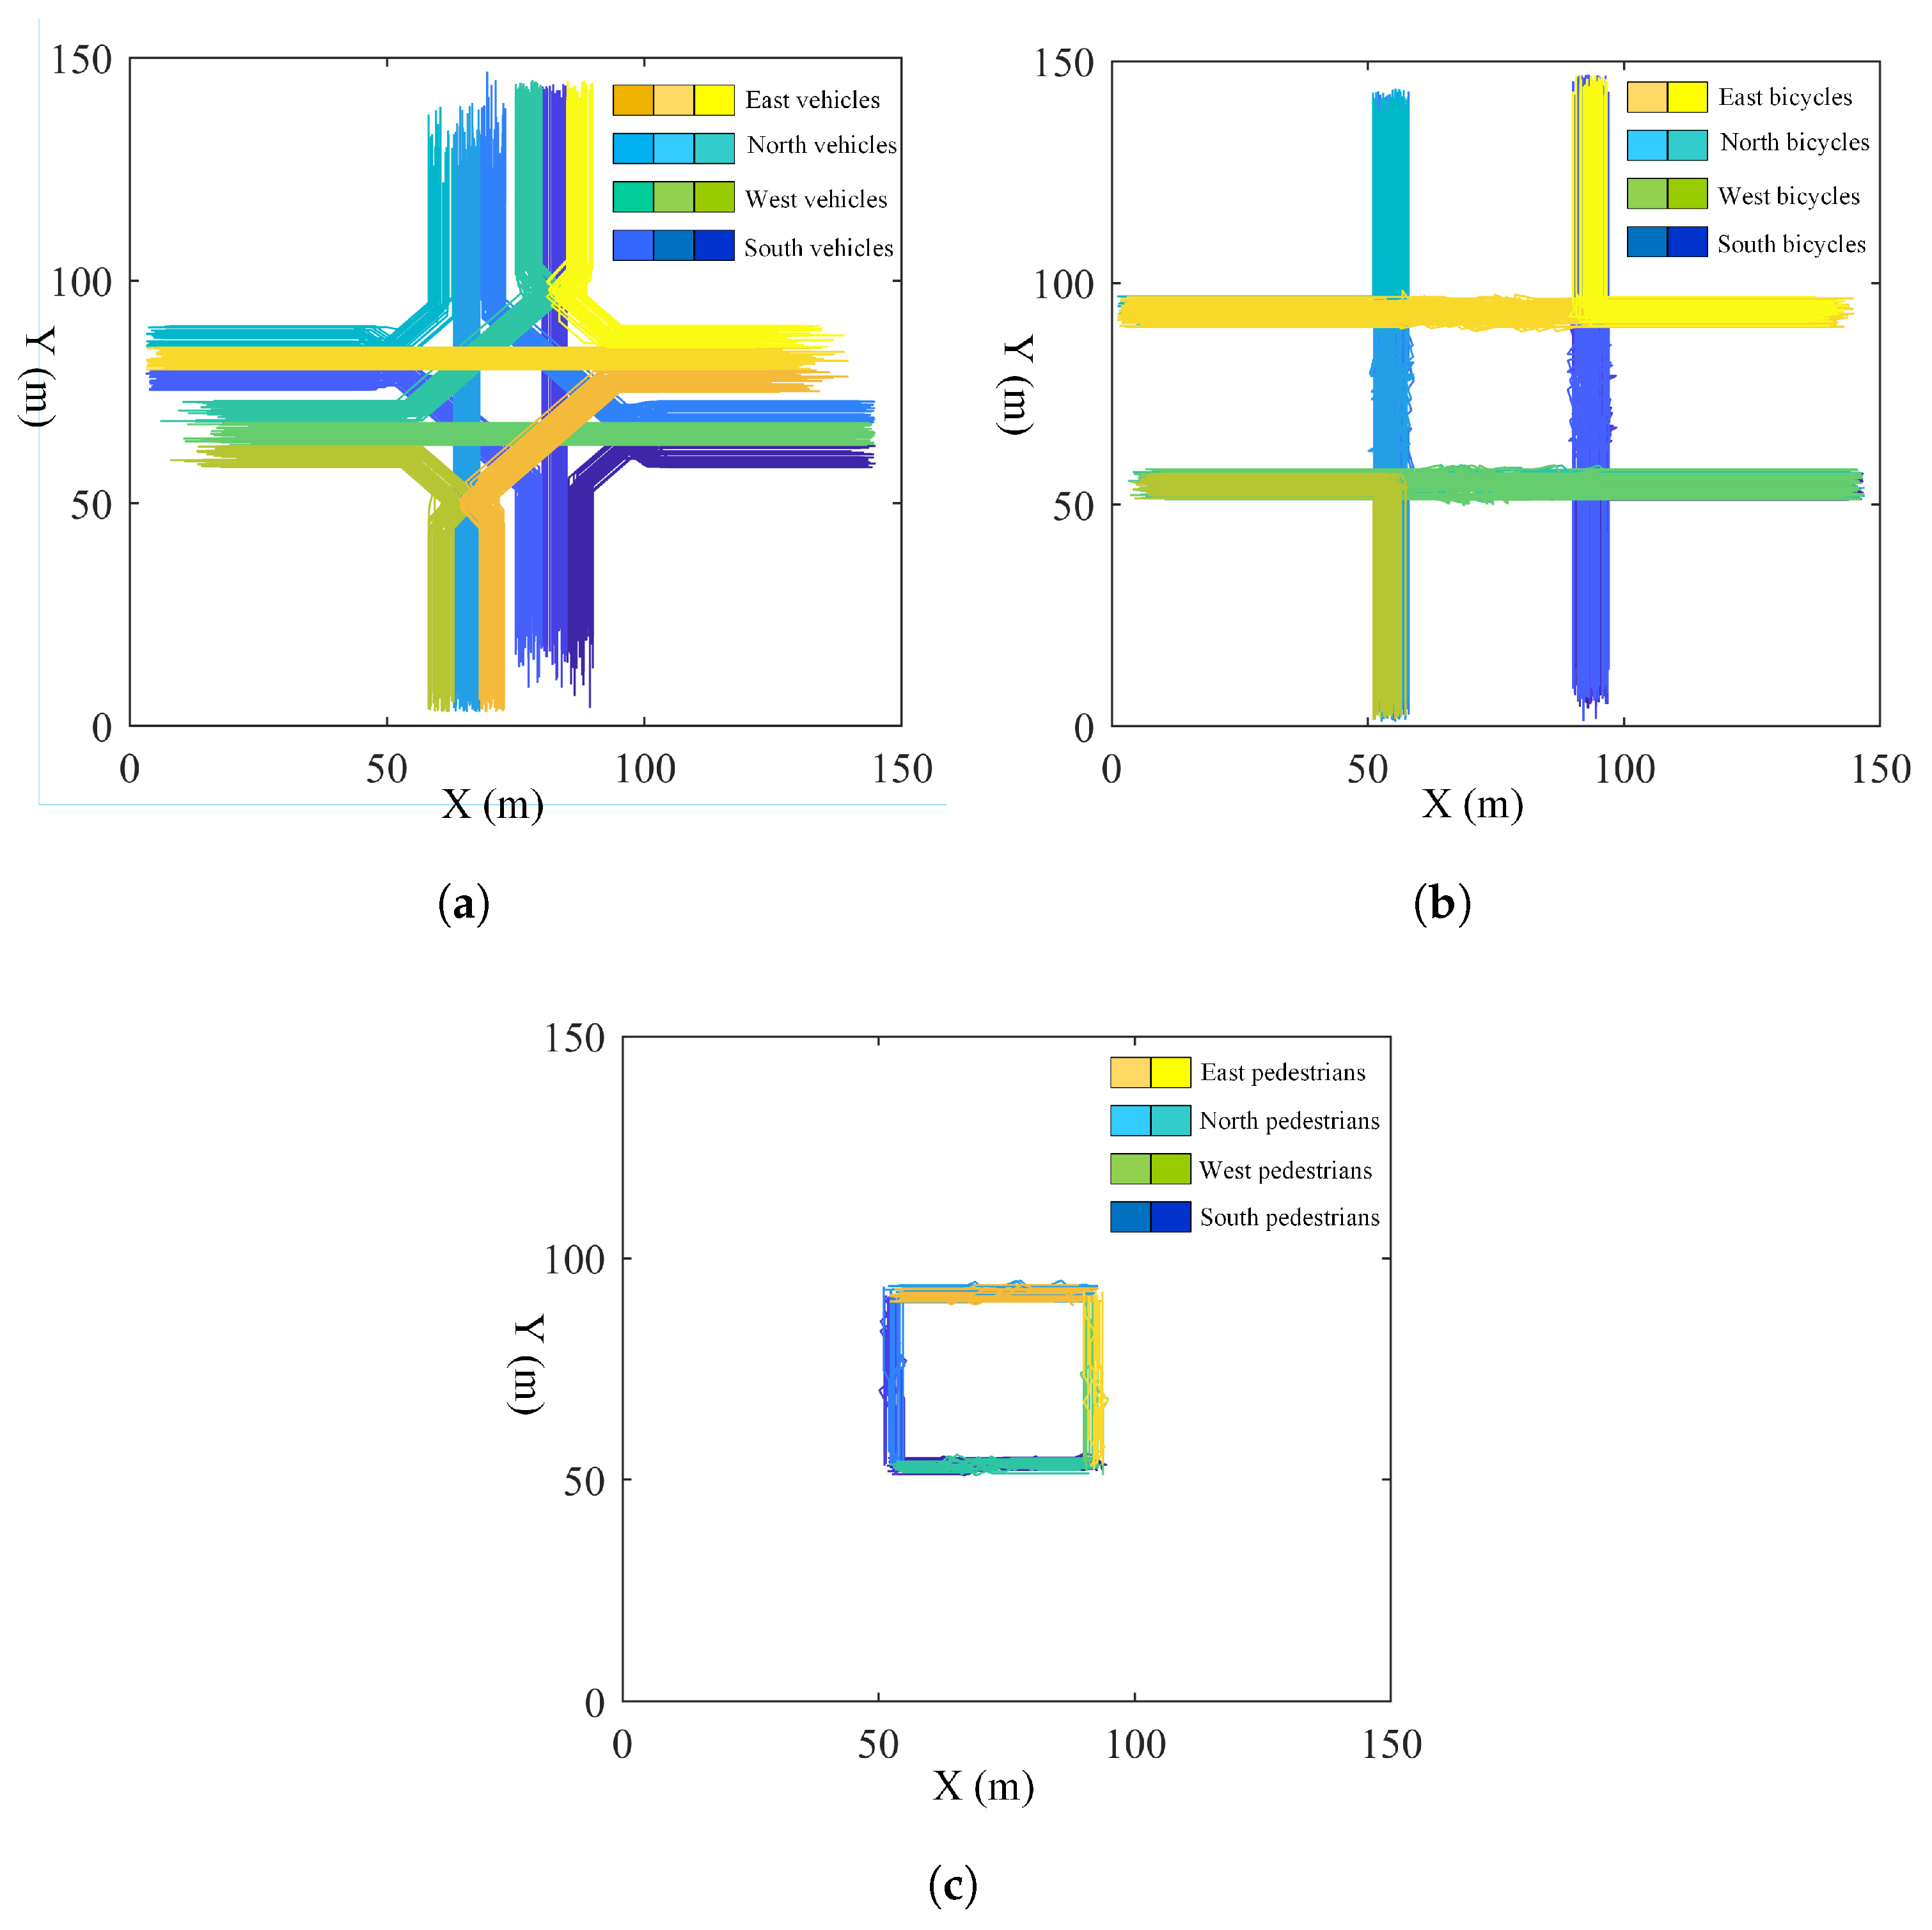
2.7. Pattern Mining via Trajectory Clustering
In this study, we perform trajectory clustering based on microscopic simulation-generated data, using both the type of traffic participant (vehicle, bicycle, and pedestrian) and their movement direction (left-turn, through, and right-turn) as classification dimensions. The goal is to identify typical traffic behavior patterns within the intersection. Two clustering algorithms are employed: K-Means and DBSCAN. K-Means is applied when behavior categories are clearly defined in advance—such as straight-going vehicles or right-turning bicycles—while DBSCAN is used to detect high-density clusters under irregular or congested conditions, such as overtaking behaviors among bicycles or vehicles forced to stop and queue due to unresolved conflicts.
K-Means is a widely used unsupervised clustering algorithm that partitions a set of data points into K clusters by minimizing the intra-cluster variance. In the context of traffic behavior analysis, each data point represents a simulated trajectory segment or a derived feature vector from a full trajectory, capturing the spatiotemporal characteristics of a traffic participant.
Let be the set of n data points, where each is a d-dimensional feature vector extracted from trajectory data, such as average speed, total delay time, turning angle, conflict occurrence count, path curvature, etc.
The K-Means algorithm aims to divide the dataset into
K clusters
by solving the following optimization problem:
where
is the centroid (mean) of cluster
and
denotes the Euclidean distance. The algorithm steps are as follows:
- (1)
Initialization: Randomly select K initial centroids ;
- (2)
Assignment Step: Assign each data point to the nearest centroid:
- (3)
Update Step: Update centroids based on the current assignments:
- (4)
Repeat Steps 2–3 until convergence (i.e., assignments no longer change or the centroid shift is below a threshold).
In our implementation, the feature vectors
are standardized before clustering to ensure equal weighting across all behavioral attributes. The number of clusters
K is selected based on the silhouette score, ensuring a balance between within-cluster compactness and between-cluster separation. The silhouette score is a widely used and well-established clustering evaluation metric that balances within-cluster cohesion and between-cluster separation. Given its standard definition in the literature [
39], we have not repeated the formula in this manuscript.
2.8. Symmetry Metric Design
The input data for clustering include the spatial coordinates
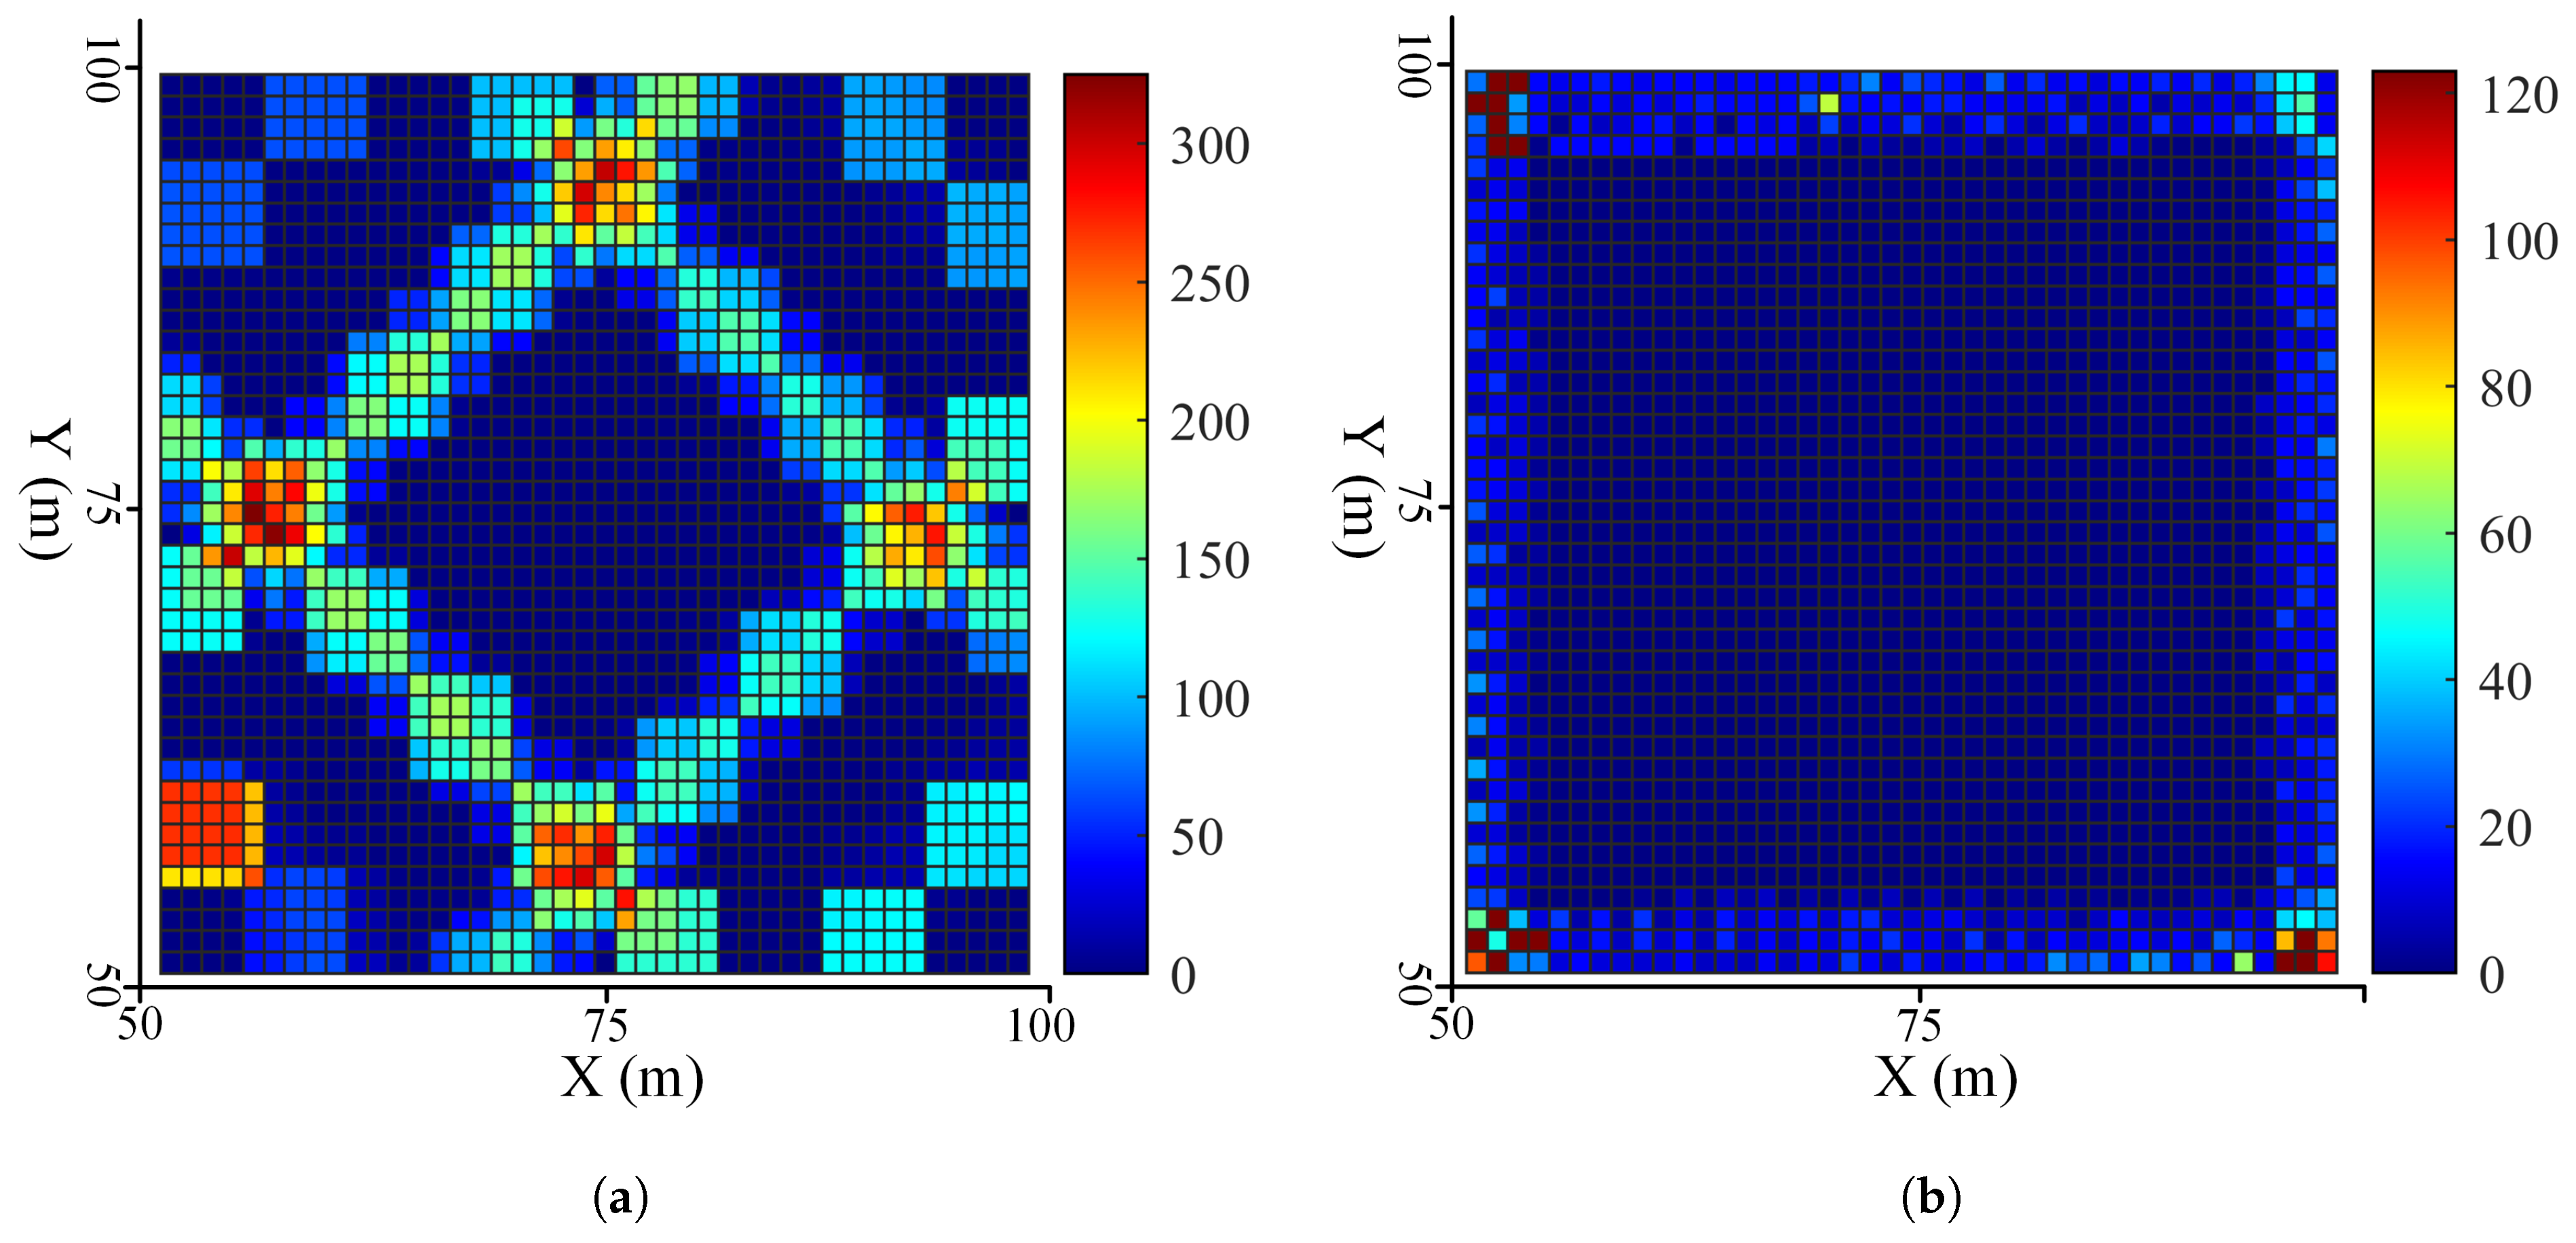
of each traffic agent at each time step, their object type, movement direction, conflict type, and accumulated delay time. By extracting these spatiotemporal and behavioral features, and grouping similar trajectories into clusters, we are able to identify several behavior patterns that are difficult to observe through aggregate traffic indicators. These patterns are subsequently visualized through trajectory heatmaps, delay distributions, and conflict point density maps (as shown in
Figure 7), offering insights into the structural differences among various traffic behaviors.
2.9. Asymmetry Discovery and Sensitivity Analysis
For example, the clustering results reveal a recurrent “right-turn blockage” pattern (as shown in
Figure 8), where right-turning vehicles exhibit curved or stalled trajectories due to yielding to through-moving bicycles. Another observed pattern is the “overtake–merge–reinsert” sequence among bicycles, especially prominent in non-motorized lanes without internal lane markings. These behavior patterns serve as the fundamental analytical units in our later symmetry analysis and provide valuable behavioral evidence to support intersection control optimization.
DBSCAN is a density-based clustering algorithm that is well-suited for identifying irregularly shaped or non-linearly separable clusters in spatial data. In the context of traffic simulation, DBSCAN is particularly effective for detecting abnormal behaviors, such as bicycle overtaking, lane deviations, or localized vehicle queuing, which often manifest as high-density clusters in specific regions of trajectory space.
In our study, DBSCAN is applied to identify localized dense behaviors that deviate from typical lane-based flows. Examples include the following: (1) Bicycle overtaking behavior: A group of bicycle trajectories diverging laterally and merging back downstream form a compact, high-density region in space-time—DBSCAN captures this as a separate cluster. (2) Right-turn vehicle queuing conflicts: When right-turning vehicles accumulate upstream due to yielding, they generate spatially dense and stationary trajectory segments—DBSCAN effectively distinguishes these from free-flow trajectories. Unlike K-Means, DBSCAN does not require specifying the number of clusters in advance and is robust to noise, making it highly appropriate for exploratory behavior pattern discovery in heterogeneous and congested urban traffic.
3. Results and Discussion
3.1. Simulation Condition Setting
Using the asymmetric-structure-based CA model described in the previous sections, we design a signalized intersection simulation based on a discrete time-step framework. As illustrated in
Figure 2, the simulation environment comprises four 50 m × 42 m approach areas and a 42 m × 42 m intersection core. All boundaries serve as both origins and destinations, with pedestrians assigned specific origin–destination pairs to reflect realistic crossing paths.
In this model, we define the directional choice proportions for both vehicles and bicycles as , , and , representing the probabilities of turning left, going straight, and turning right, respectively. To simplify the directional flow structure, we assume and initially set . The simulation focuses primarily on the asymmetric interactions between turning vehicles and through-moving bicycles and pedestrians, which often lead to local conflicts and delays.
The entire simulation space is discretized into 1 m × 1 m square cells, aligned with the CA framework. The signalized intersection operates under a four-phase control scheme with the following settings [
40]:
- (1)
The signal cycle length is set to 120 s.
- (2)
The total traffic demand is varied incrementally from 50 to 900 (in steps of 50) across simulation batches.
- (3)
For modeling simplicity, the demand for vehicles, bicycles, and pedestrians is assumed to be equal, as the relative composition is not the focus of this study.
- (4)
The four signal phases are equally allocated, each lasting 30 s.
- (5)
Specifically, left-turning movements are assigned a dedicated 30 s phase, while through and right-turn movements share a combined 30 s phase.
Each simulation run spans 1200 time steps (i.e., 1200 s). At every time step, vehicles, bicycles, and pedestrians enter the system from their respective origins according to a predefined input probability p. Within each simulation period, traffic demand remains constant; a new simulation is triggered when the demand level is updated.
Notably, we emphasize scenarios with high turning proportions, as such traffic patterns are commonly observed at intersections near urban facilities such as schools, commercial complexes, and transit hubs. These conditions are particularly prone to asymmetrical interference, making them ideal for evaluating the performance of the proposed CA model.
3.2. Analysis of Spatiotemporal Trajectory Diagrams
This paper discusses factors that influence the formation and dissipation of jams due to conflicts between vehicles, bicycles, and pedestrians during the simulation. Under our assumptions, there are two main factors: the number of the traffic demand and the type of object. Moreover, it is also interesting to note the impact of distribution of conflict points and frequency of conflict on the jam propagation. Traffic demand is denoted by the inflow of pedestrians, bicycles, and vehicles in this area. We are interested in studying the effect of inflow rate changes on the formation and dissipation of a jam. In this regard, two indicators that are easier to quantify are queue length and delay time. A jam will lead to unnecessary queue length and excessive delay time. Through the two indicators, we can have a look at the impact of inflow changes on jams.
As shown in
Figure 9a, pedestrians maintain relatively stable walking speeds when crossing the intersection, with minimal deceleration observed throughout the signal cycle. However, the number of entering pedestrians varies significantly across different signal cycles, reflecting the intermittent nature of pedestrian flow. Moreover, pedestrian trajectories are considerably shorter than those of bicycles and vehicles, which aligns with their lower but stable walking speeds. It is worth noting that no significant pedestrian–vehicle conflicts are observed. This may be attributed to the highest level of right of way assigned to pedestrians at signalized intersections, where vehicles tend to yield proactively, resulting in minimal interference with pedestrian movements.
Figure 9b reveals that bicycles exhibit frequent overtaking behavior within the non-motorized lane, owing to the absence of marked sub-lane divisions. Although cyclists queue in an orderly manner during red phases, forming a periodic stop-and-go flow, overtaking becomes common during green phases. The 500 veh/h arrival rate does not exceed the capacity of the bicycle flow, as all queued bicycles are released during each green interval. However, even after crossing the stop line, bicycles still experience start–stop movement patterns, suggesting interference from right-turning vehicles. Although the impact of such conflicts is limited under low-flow conditions, it is expected to intensify as demand increases.
Figure 9a,b illustrate the direction-dependent differences in the spatiotemporal patterns of vehicular flows. For through-moving vehicles, traffic proceeds smoothly with no observable conflicts or disturbances, maintaining stable speeds. In contrast, left-turning vehicles encounter lateral interference from bicycles after crossing the stop line, leading to the formation of deceleration waves that propagate upstream, as evidenced by the red slow-down region in
Figure 9a. Right-turning vehicles experience earlier conflicts, engaging in yield behavior before reaching the stop line due to the presence of intersecting bicycle flows. This results in upstream-propagating shockwaves even before the turning maneuver begins.
Although all three vehicular movements are fully discharged during green phases, their start-up wave speeds differ significantly. Left-turning and through vehicles exhibit relatively faster start-up waves, while right-turning vehicles accelerate more slowly due to prolonged yielding. Moreover, the total release time for left-turning and through vehicles is notably shorter than that of right-turning vehicles, underscoring the asymmetric impact of non-motorized traffic on different vehicular movements.
3.3. Effect of Average Arrival Rate on Queue Length
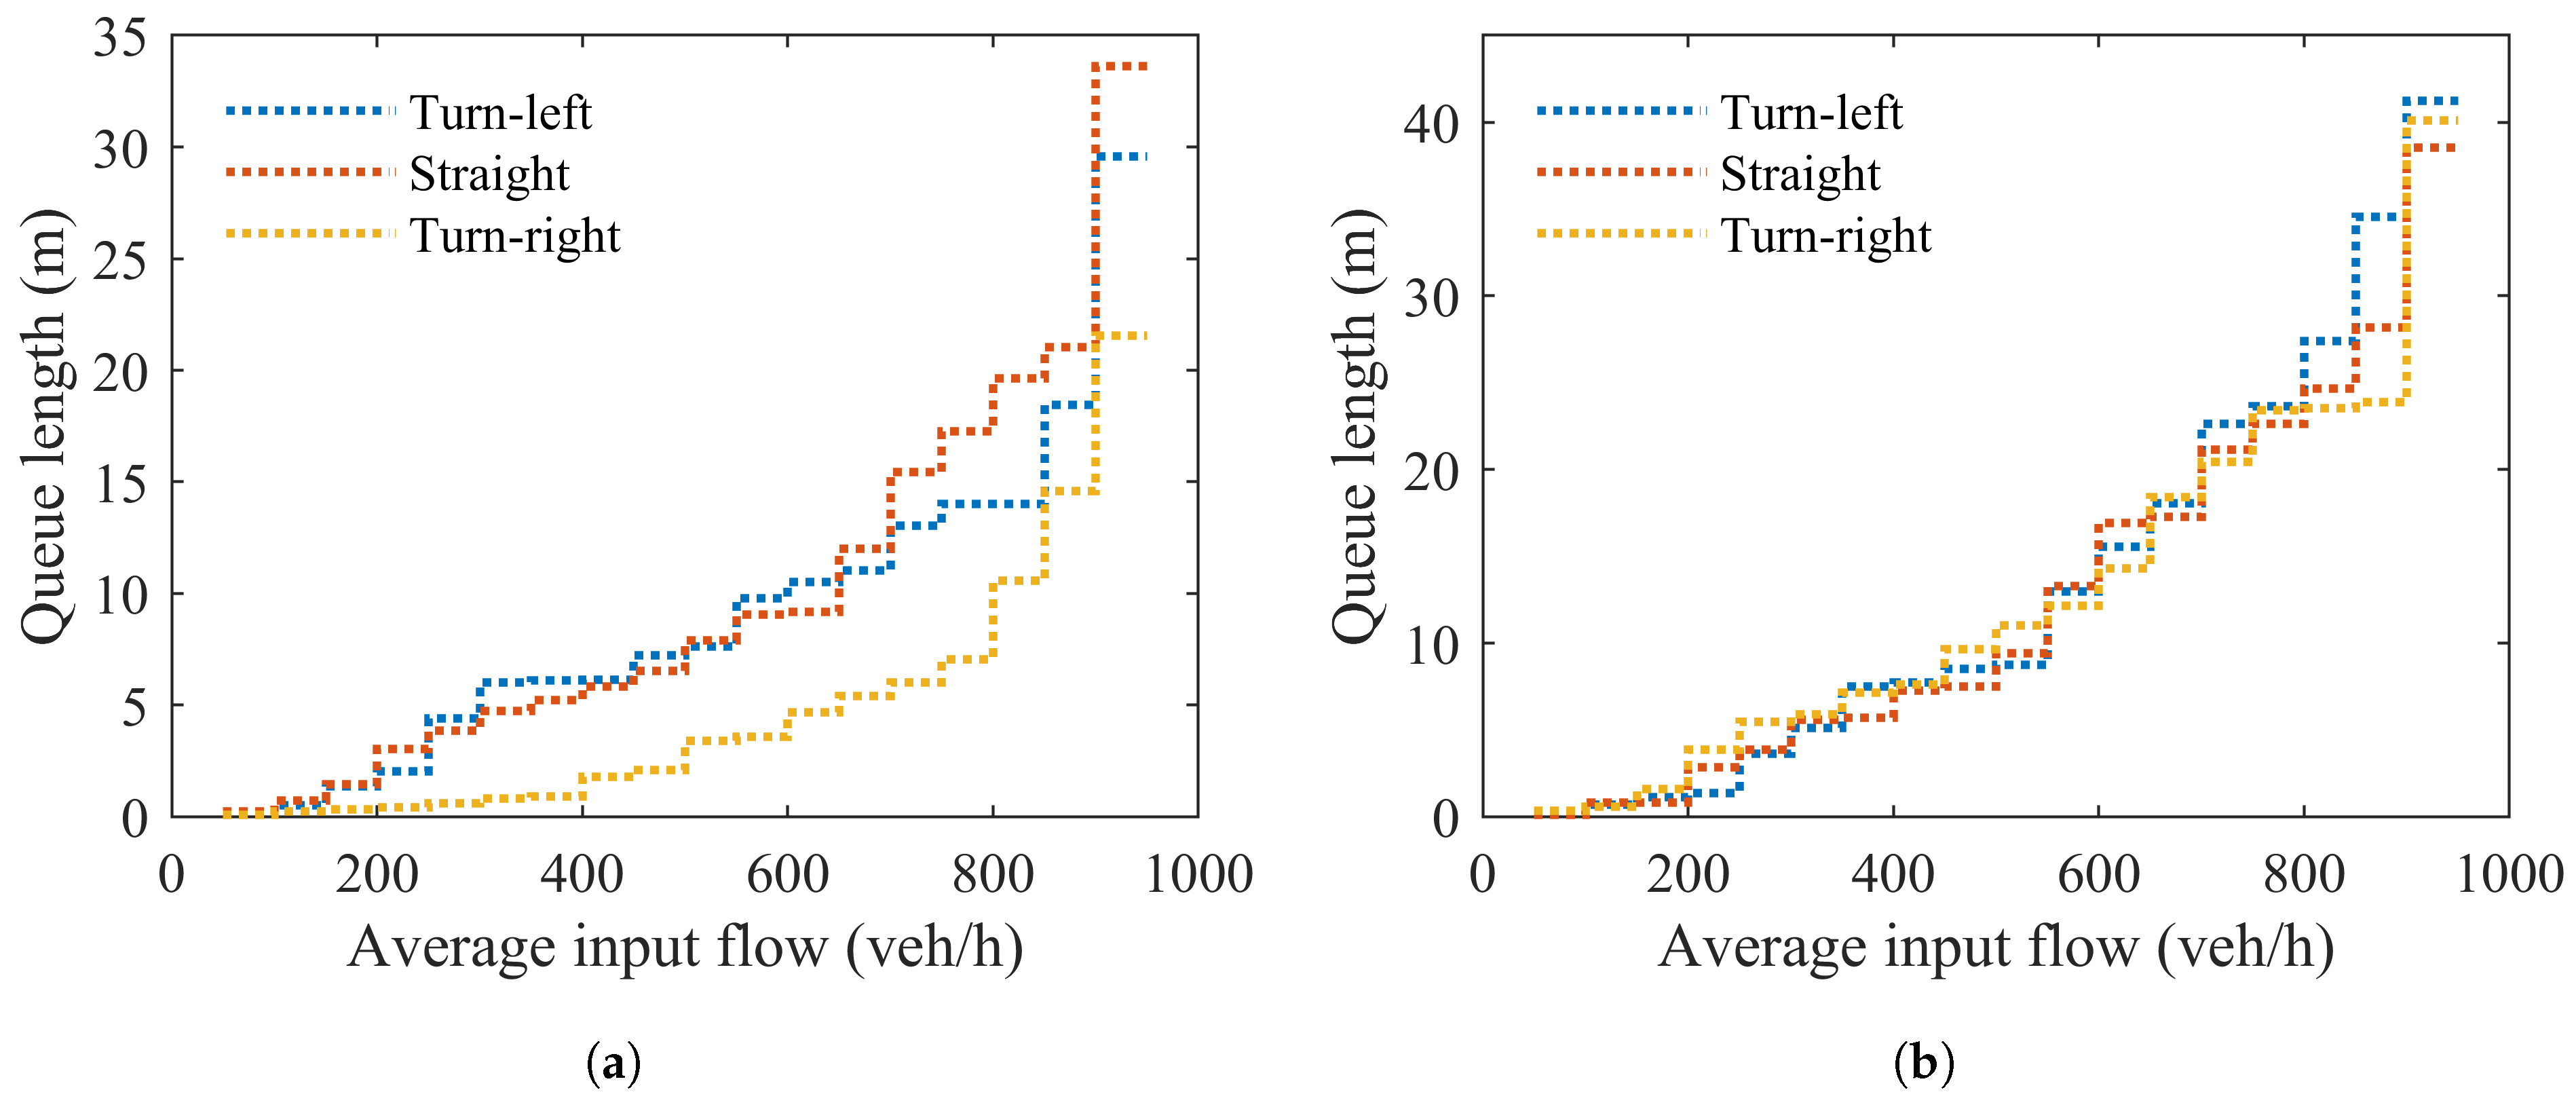
In general, the queue length of vehicle flows at the intersection increases with rising traffic demand, and this increase becomes progressively steeper as the demand grows (as shown in
Figure 10). When traffic demand is below 450 veh/h, the queue length increases at an approximately constant rate. We define this constant rate as the queue-demand increment, denoted by
, which reflects the regular increase in queue length directly associated with increasing traffic inflow. Under these conditions, the queue length grows proportionally with traffic demand, and the intersection operates under unsaturated but stable conditions.
However, when the traffic demand exceeds 450 veh/h, the growth in queue length surpasses the baseline increment
, and this excessive queue growth continues to accumulate across cycles. We attribute the additional portion of the queue to the residual queue carried over from the previous signal cycle and define its rate of accumulation as the queue-remain increment, denoted by
. The total queue increment
k is thus composed of two parts:
When , it implies that the queue is fully discharged within each signal cycle, and the traffic flow is considered to operate under benign conditions. In contrast, when , it indicates that queues are not fully cleared, leading to a residual buildup and malignant traffic operation at the intersection.
To further investigate the sources of residual queues, we analyze the queue evolution for each bicycle movement at the intersection. As shown in
Figure 10b, the queue increment
k for left-turning and right-turning bicycles remains relatively stable across varying traffic demands. In contrast, the
k value for through-moving bicycles increases rapidly, suggesting that the persistent growth in bicycle queue length is primarily driven by the go-straight movement.
This phenomenon can be traced to a structural conflict inherent in the four-phase signal system, where through-moving bicycles often compete for space and priority with right-turning motor vehicles. Visual inspection of the simulation interface confirms that right-turning vehicles significantly obstruct the discharge of queued bicycles, leading to longer residual queues and degraded performance for the through-bicycle stream. This asymmetrical interference highlights the importance of accounting for directional and modal interactions when designing signal control strategies for mixed traffic environments.
3.4. Effect of Average Arrival Rate on Total Delay
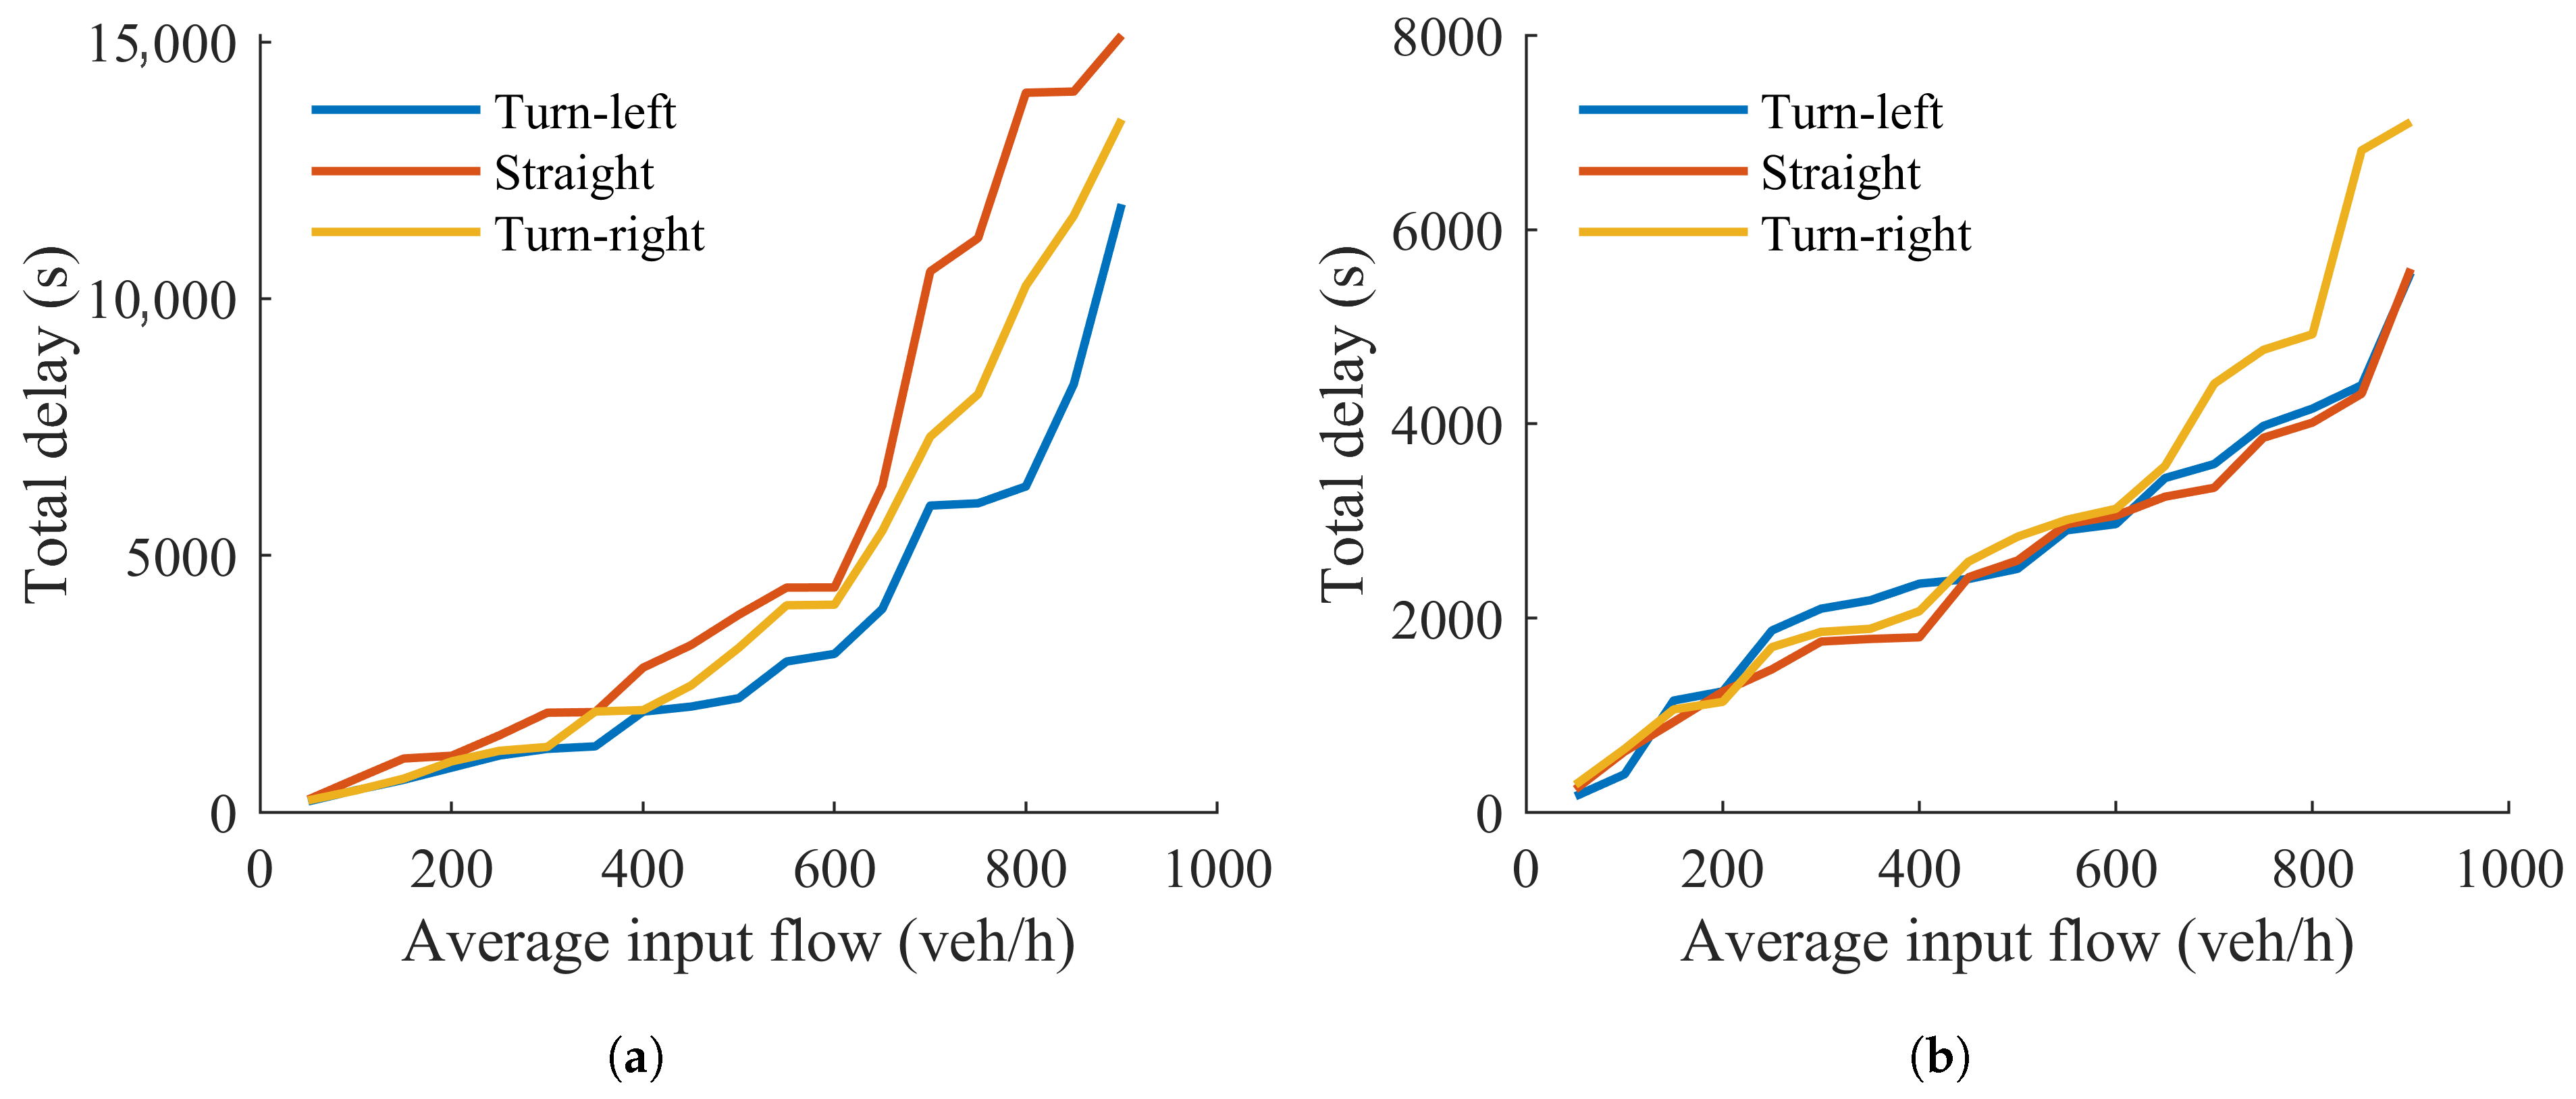
As shown in
Figure 11, the conflict between through-moving bicycles and right-turning vehicles at the intersection is a major contributor to the overall increase in delay time. For traffic flows that are not subject to such conflicts—such as isolated left-turn or right-turn movements—delay increases at a relatively stable rate when the traffic demand is below 850 veh/h. This indicates that, in the absence of conflict, the intersection can maintain benign operating conditions even at moderately high traffic volumes.
However, under conflicting conditions, the operational performance deteriorates significantly at lower demand levels. Specifically, when the traffic demand for the conflicting movement (i.e., through bicycles vs. right-turn vehicles) exceeds 500 veh/h, the system enters a malignant state, where queues are no longer fully discharged within a single signal cycle and delays grow rapidly. This suggests that the direct conflict between through bicycles and right-turning vehicles is the dominant factor leading to residual queues, increased delays, and the overall worsening of congestion at the intersection.
The impact of this conflict is not symmetric. It not only impairs the flow of through-moving bicycles but also severely disrupts the release of right-turning vehicles. As illustrated in
Figure 11a, the delay times for through and left-turn movements increase approximately linearly with traffic demand, showing a predictable and manageable congestion pattern. In contrast, the delay time for right-turning traffic remains relatively low until the demand exceeds 400 veh/h, after which it increases sharply, indicating that right-turn queues begin to stall and spill back, creating localized gridlocks.
This asymmetric response is also reflected in the queue length distribution: the queue length of right-turning vehicles is significantly higher than that of left-turning and through vehicles under the same demand levels. The inability of right-turning vehicles to proceed efficiently—due to both direct conflicts with through bicycles and indirect disturbances from pedestrian flows—demonstrates the importance of modeling direction-dependent and mode-dependent interactions when evaluating signalized intersection performance.
It should also be noted that while some results may appear intuitive, we argue that the model’s ability to reproduce these patterns from bottom-up behavioral rules is in itself a valuable confirmation of its validity. We also acknowledge the limitation regarding generalizability, i.e., the model proposed in this article is currently applicable to situations where road rights rules are clearly stated and traffic participants generally comply with traffic regulations, which can clarify the applicable scope of our findings and potential directions for broader application.
4. Conclusions
In this paper, a CA model is extended to simulate the formation and propagation of traffic jams resulting from the inherent asymmetric conflicts among vehicles, bicycles, and pedestrians at signalized intersections. By incorporating heterogeneous agent behaviors and movement patterns, the model captures the complex, direction-dependent interactions that often occur in mixed traffic environments. The influence of both traffic demand intensity and traffic participant type on congestion dynamics is systematically analyzed through a combination of theoretical modeling and numerical simulation.
Simulation results demonstrate how conflicts between right-turning vehicles and through-moving bicycles lead to significant increases in queue length and delay time, especially under high-demand scenarios. Furthermore, the spatial distribution and temporal frequency of conflicts are examined across different traffic modes and movement directions. The findings reveal that conflict events occurring farther from the link entrance tend to cause less severe congestion, suggesting that the location of conflict points plays a critical role in determining the extent of jam propagation.
This study primarily focuses on the microscopic mechanisms and asymmetric propagation characteristics of traffic jams within a single signalized intersection. The proposed framework not only contributes to a deeper understanding of local congestion formation but also provides a foundation for evaluating traffic control strategies under mixed traffic conditions. The modeling insights derived from asymmetric right-of-way and spatial interaction structures can inform the design of intelligent decision-making systems in broader domains such as warehouse logistics, drone coordination, or autonomous urban mobility. We also acknowledge that real-world traffic behavior can deviate from normative assumptions, particularly in mixed traffic contexts, such as pedestrian yielding and signal violations. While this study adopts a rule-based framework as a first step, we recognize the importance of empirical calibration and plan to incorporate these behavioral nuances in future work. As future work, we plan to extend this modeling approach to multi-intersection networks and explore the development of adaptive detection and mitigation strategies for congestion management in more complex urban traffic systems.
