Abstract
Urban safety critically depends on effective street lighting systems; however, rapidly expanding cities, such as Astana, face considerable challenges in maintaining these systems due to the inefficiency, high labor intensity, and error-prone nature of conventional manual inspection methods. This necessitates an urgent shift toward automated, accurate, and scalable monitoring systems capable of quickly identifying malfunctioning streetlights. In response, this study introduces an advanced computer vision-based approach for automated detection and analysis of street lighting conditions. Leveraging high-resolution dashcam footage collected under diverse nighttime weather conditions, we constructed a robust dataset of 4260 carefully annotated frames highlighting streetlight poles and lamps. To significantly enhance detection accuracy, we propose the novel YOLO-CSE model, which integrates a Channel Squeeze-and-Excitation (CSE) module into the YOLO (You Only Look Once) detection architecture. The CSE module leverages the inherent symmetry of streetlight structures, such as the bilateral symmetry of poles and the radial symmetry of lamps, to dynamically recalibrate feature channels, emphasizing spatially repetitive and geometrically uniform patterns. By modifying the bottleneck layer through the addition of an extra convolutional layer and the SE block, the model learns richer, more discriminative feature representations, particularly for small or distant lamps under partial occlusion or low illumination. A comprehensive comparative analysis demonstrates that YOLO-CSE outperforms conventional YOLO variants and state-of-the-art models, achieving a mean average precision (mAP) of 0.798, recall of 0.794, precision of 0.824, and an F1 score of 0.808. The model’s symmetry-aware design enhances robustness to urban clutter (e.g., asymmetric noise from headlights or signage) while maintaining real-time efficiency. These results validate YOLO-CSE as a scalable solution for smart cities, where symmetry principles bridge geometric priors with computational efficiency in infrastructure monitoring.
1. Introduction
Street lighting is a critical component of urban infrastructure, essential for ensuring safe vehicular and pedestrian movement after dark [1]. It not only improves visibility, it also improves public safety, reduces crime, and supports the smooth transit of goods and people. As a vital enabler of socioeconomic activity and community connectivity, well-maintained road lighting plays a central role in modern city life. As shown in the study by Natu (2015), sufficient street lighting can reduce pedestrian accidents by up to 50% [2]. Similarly, Beyer and Ker emphasize the important role of street illumination in mitigating traffic-related injuries [3]. However, maintaining the integrity and performance of expansive street lighting networks remains a formidable challenge for urban authorities. Many modern cities operate hundreds of thousands of streetlights—Los Angeles alone maintains more than 220,000 units—and globally, the number is projected to exceed 350 million by 2025 [4,5,6]. Despite their importance, many cities still rely on outdated maintenance practices. Traditional inspection methods, such as periodic manual checks or citizen complaints, are labor-intensive, error-prone, and often delayed in detecting outages. As Bokade et al. (2025) note, these approaches lead to significant latency in addressing faults and increased operational costs, underscoring the need for automated, sensor-based monitoring systems [7]. These reactive approaches are labor-intensive, slow, and error-prone, leading to delays in detecting and repairing outages. As a result, unlit or malfunctioning lamps often go unnoticed for extended periods, leaving entire streets in darkness, compromising public safety, and increasing energy waste [8]. To overcome these limitations, there is a pressing need for automated, accurate, and scalable streetlight monitoring solutions. Some cities have explored IoT-based approaches, installing sensors or smart controllers on lamp posts to report outages in real-time. While effective in certain cases, such sensor networks entail high deployment and maintenance costs and can be difficult to adapt for tens of thousands of lamps [9]. A more cost-effective alternative is leveraging computer vision—using cameras to visually detect streetlights and determine if they are operational. Prior work has demonstrated the feasibility of drive-by inspection systems equipped with cameras; for example, Kumar [1] mounted cameras on vehicles to automatically map streetlights and identify lamps that are unlit or dim during nighttime patrols. By distinguishing streetlights from other light sources and spotting “dark areas” between them, such vision-based systems can pinpoint outages without any physical sensors on the lamps. This concept of using mobile cameras (e.g., dashcams on city vehicles) offers a promising, scalable way to routinely survey the lighting network at night, turning everyday vehicles into data collectors for infrastructure monitoring.
Recent works have further explored deep-learning-based detection in specialized contexts, such as anomaly behavior detection in pedestrian monitoring [10] and lightweight agricultural object recognition [11]. These studies emphasize the importance of multi-scale features and real-time performance—principles closely aligned with our objectives.
In this paper, we propose a YOLO-CSE model as an accurate and real-time computer vision solution for automated streetlight monitoring. YOLO-CSE builds upon the one-stage object detector YOLO (You Only Look Once) by integrating a Channel Squeeze-and-Excitation (CSE) attention module into its network architecture. The YOLO family of models is well known for fast real-time object detection, making it suitable for on-the-move analysis from dashcam video streams. Our innovation is the incorporation of a Squeeze-and-Excitation (SE) block [12] into YOLO’s backbone to improve its sensitivity to the subtle features of streetlights in nighttime images. The SE module adaptively recalibrates channel-wise feature responses by modeling interdependencies between feature channels. In essence, the network can learn to “excite” the channels that correspond to bright light sources or lamp structures while “squeezing” out less relevant features. This addition to the C3 module of the bottleneck has been shown to significantly enhance feature representations in deep networks at minimal computational cost. By embedding an SE block into YOLO (hence, YOLO-CSE), we aim to boost detection performance on small or occluded streetlights—for instance, distant lamps that appear as tiny light spots, or lamps partially hidden by urban objects. The enhanced model is expected to better distinguish faint streetlights from background noise and to maintain high accuracy even when streetlights overlap with other bright objects (vehicle headlights, signage, etc.). The main contributions are outlined as follows: (1) Our proposed model is particularly tailored for accurate and real-time detection of small, distant, and partially occluded streetlights under diverse nighttime conditions, significantly outperforming traditional YOLO variants. (2) A robust annotated dataset of 4260 dashcam images collected in Astana has been developed, capturing diverse nighttime scenarios to ensure comprehensive and reliable model evaluation.
2. Related Works
Streetlight management has increasingly embraced IoT and smart city paradigms in recent years. A number of studies have proposed equipping streetlights with sensors or networked controllers to enable remote monitoring, adaptive operation, and automatic fault reporting. For instance, Chowdhury [13] explored an IoT-based framework for streetlight management. The study focuses on improving energy efficiency, reducing electricity costs, and integrating real-time error detection to address the improper streetlight management issue in Bangladesh. Alba [14] introduced a system for monitoring and theft detection in streetlights using Raspberry Pi, optocouplers, and a power analyzer. Key innovations include real-time detection of power cable theft, lamp theft, and electricity pilferage with 100% accuracy. The system features a GSM module for instant alerts and a web interface for logging events, improving upon existing methodologies by offering immediate notifications and accurate fault detection. For example, Kumar [1] developed an IoT-based system for automatic detection of lamp failures, where traditional complaint-driven maintenance was replaced by sensors (light-dependent resistors and motion detectors) that feed real-time status updates to a central system. Such systems can instantly alert operators when a lamp goes out, significantly reducing response time. In a similar vein, Andi [15] addressed inefficiencies in conventional lighting control by integrating current sensors (PZEM-004T) and light sensors (LDR) with an Arduino-based controller, connecting each streetlight to a cloud platform (ThingSpeak API v1) for continuous monitoring. These IoT solutions often not only detect lamp failures but can also implement energy-saving strategies (dimming lights during low traffic hours, etc.), contributing to smart city energy efficiency goals. A comprehensive survey by Yanming [16] highlights that wireless sensor networks and adaptive lighting controls are central to many smart streetlighting systems, focusing on communication reliability and energy optimization. The study also i introduced machine learning into sensor-based monitoring, using an Extreme Learning Machine (ELM) to diagnose lamp faults from electrical data with high accuracy. While IoT approaches show promise, they require installing and maintaining hardware on every light pole, which can be cost-prohibitive and logistically complex for large cities. Power supply issues, network coverage, and device reliability are additional concerns that have limited the widespread adoption of purely IoT-based streetlight fault detection. Zhang [10] observed that the current research on streetlight fault detection largely falls into two categories: manual visual inspection or non-visual sensor analysis, both of which have clear drawbacks (labor intensity for the former, high cost and scalability issues for the latter). This gap has opened the door for computer vision techniques as a form of automated “visual inspection” that can be scaled with minimal marginal cost. The idea is to use cameras to do what a human inspector does, but faster and continuously. Zanjani [17] presented a system that uses network cameras and image processing to monitor and detect faults in street lighting, aiming to improve maintenance efficiency by automating fault detection. Lee and Huang [18] provided a creative solution for the pervasive problem of malfunctioning streetlights. The authors offer a workable solution using wireless sensor networks and modern data processing methods by creating a low-cost, noninvasive system for the monitoring and detection of streetlight faults. The technology helps towns to save running expenses by demonstrating great precision and efficiency in real-time problem identification, therefore permitting prompt repair. This study not only emphasizes the possibility of combining current technology with urban infrastructure but also presents a scalable methodology that can be modified to fit different environments, thereby improving public safety and resource management. Yu [19] devised a semi-automated approach, including curb line detection, segmenting road surfaces, and using a pairwise 3-D form context for accurate extraction to extract streetlight poles from mobile LiDAR point clouds. Their approach handles complicated clusters first by voxel-based elevation filtering and Euclidean distance clustering, then normalized cut segmentation. High accuracy and efficiency were shown by testing data from a RIEGL VMX-450 system (RIEGL Laser Measurement Systems GmbH, Horn, Austria); completeness exceeded 99%, correctness exceeded 97%, and quality exceeded 96%.
Mavromatis [20] presented a dataset of approximately 350,000 images of streetlights, collected over six months using Raspberry Pi Camera Modules (Raspberry Pi Foundation, Cambridge, UK) installed on 140 lampposts in South Gloucestershire, UK. Each image is tagged with GPS coordinates and labeled as either on or off. The model used is based on the VGG-16 (Visual Geometry Group, University of Oxford, UK) [21] architecture, pre-trained on ImageNet (Stanford University, USA), and fine-tuned for classifying streetlight status. During the day, the VGG-16 model achieves about 90% accuracy, while at night, a threshold-based approach using median RGB values from highly exposed images determines the status. In the study by Teixeira [22], the NLight dataset was created from nighttime images taken by the JL1-3B (Chang Guang Satellite Technology Co., Ltd, Changchun, China) satellite over Seville, Spain, to segment streetlights. They trained four deep learning models: U-Net [23] and Feature Pyramid Network (FPN) [24] architectures, each with ResNet50 [25] and InceptionResNetv2 [26] backbones. The models were evaluated on their ability to localize streetlights, with U-Net combined with InceptionResNet v2 (UI) achieving the highest accuracy of 93.4% correct lamp localization.
The literature review highlights that significant advancements have been made in streetlight management using IoT, image processing, and deep learning techniques. These studies highlight improvements in energy efficiency, real-time error detection, and theft prevention. Systems using Raspberry Pi and GSM modules provide instant notifications for theft and faults. Car-mounted sensor platforms and network cameras offer detailed monitoring and automated fault detection, respectively. Comprehensive datasets and advanced deep learning models have achieved high accuracy in streetlight status classification and lamp localization.
3. Materials and Methods
3.1. Data Acquisition
There are still few extensive datasets in the fields of computer vision and object detection that are especially suited to the recognition and categorization of streetlighting infrastructure. This deficiency emphasizes how urgently the current study is needed, which attempts to address the lack of publicly accessible resources by compiling a specialized dataset. Prior to undertaking the research described herein, it was imperative to conduct an extensive data collection campaign focusing on streetlighting elements under real-world conditions. The data acquisition phase utilized two distinct categories of vehicles—sport utility vehicles (SUVs) and sedans—to ensure broad variability in both vantage points and driving conditions. These vehicles were each outfitted with high-resolution dashcams, namely, Fujida Karma Duos (Fujida Optical Technologies Co., Ltd., Seoul, Republic of Korea), which are capable of capturing video at a resolution of 1280 × 720 pixels. The high-definition footage provided a detailed visual record of nighttime driving in Astana, Kazakhstan, facilitating the precise observation of streetlighting components. Moreover, the camera setup was meticulously configured to capture sufficient detail for subsequent machine learning analyses, particularly under challenging lowlight conditions. In order to provide wide variation in both viewpoints and driving circumstances, the data collection phase used two different vehicle types: sedans and sport utility vehicles (SUVs). Each of these cars was equipped with a high-resolution dashcam, specifically, Fujida Karma Duos, which can record video at 1280 × 720 pixels. The HD video allowed for a clear visual record of driving in Astana, Kazakhstan at night, which made it easier to identify the various elements of streetlighting. Additionally, the camera arrangement was carefully planned to record enough information for further machine learning evaluations, especially in difficult low light. This data collection effort’s main goal was to locate and examine poles and lamps, two major classes of interest. By closely examining the recorded video, this study also included a number of additional types of streetlighting on roadways, adding to the dataset’s rich annotations.
Figure 1 shows a representative sample of the collected data, demonstrating the depth and scope of the evening scenes. Both SUVs and sedans drove through various urban and suburban environments while continually filming video during the data collection period. This video included a variety of weather conditions, such as clear sky, precipitation (rain), and snowfall, to increase the dataset’s resilience and guarantee that the ensuing object detection models would hold up well in changing and occasionally challenging environmental settings. Following the compilation of the video recordings, individual frames were isolated to create a sizable dataset appropriate for sophisticated computer vision studies. In particular, 4260 frames in total were extracted from the unprocessed videos, including 1494 frames captured under clear skies, 1524 frames during snowfall, and 1242 frames during rainfall. This distribution ensures that the dataset reflects the diverse and occasionally challenging environmental conditions encountered during urban driving. Human annotators carefully identified instances of the two focal object classes—poles and lamps—after each frame underwent a thorough inspection and annotation process. This annotation step was essential for constructing a high-fidelity corpus of labeled images, which is critical for training and evaluating machine learning models focused on object recognition and classification. Interestingly, the dataset also included 396 images that did not contain any lamps or poles, thereby increasing its diversity and enhancing the robustness of the algorithms developed to detect the presence or absence of the target objects. The annotated dataset was then divided into training, validation, and testing subsets using a 75%–10%–15% split, respectively, to ensure balanced model development and performance evaluation. A selection of frames taken from the video footage obtained using dashcams mounted in sedans and sport utility vehicles (SUVs) is shown in Figure 1. These typical photos highlight the variety of environmental backgrounds and atmospheric conditions included in the dataset, highlighting the range of situations that were experienced during data collecting. The image depicts the variety of elements affecting vision and object identification in actual driving conditions by capturing nighttime scenarios in different urban and suburban locations. With bounding boxes and related metadata, such as timestamps and geolocation coordinates (latitude and longitude), each frame is carefully tagged and arranged in a two-by-two grid. Comprehensive spatiotemporal studies that are necessary for assessing model performance in dynamic environments are made easier by these annotations. Additionally, different object classes (such as poles and lighting) or different detection confidence levels are represented by color-coding. In the bottom left frame, a commercial district is shown, with a sizeable streetlight and a building in the background. The interplay of bright reflections on the vehicle windshield and ambient lighting sources reflects the complexity of real-world nighttime conditions. The bottom right frame illustrates a bustling urban street after dark, showcasing multiple streetlights along the roadway. A highlighted streetlight pole and lamp demonstrates the type of object targeted for detection and classification in subsequent machine learning tasks. The second row of images in the grid offers additional nuanced examples of nighttime conditions. The top left image in this row reveals a busy arterial roadway characterized by several lanes and a concentration of vehicles, featuring well-distributed illumination from nearby streetlights. Conversely, the top right image portrays an intersection illuminated by both streetlights and traffic lights, alongside the brake lights of vehicles, thereby introducing a confluence of artificial lighting sources. The bottom left frame, captured under similar urban conditions, may reflect altered streetlight performance or potentially variable weather conditions that influence visibility. Finally, the bottom right frame depicts a pedestrian crossing during snowfall, illustrating how natural precipitation interacts with artificial lighting to affect driver perception and camera clarity. Together, these frames form an essential portion of the dataset used to train and test object detection algorithms that are designed to detect lights, streetlight poles, and other urban objects under low-light conditions. This picture demonstrates the careful process used to guarantee the dataset’s representativeness and robustness by covering a range of weather conditions, infrastructure types, and levels of vehicle activity. Building dependable and flexible computer vision models that can function well in the various lighting and environmental conditions that come with driving in an urban setting at night requires this kind of diversity.
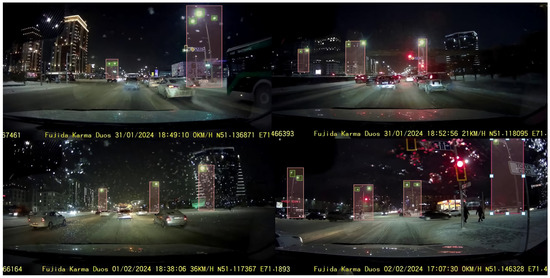
Figure 1.
Representative frames from the collected streetlighting dataset.
3.2. Architecture of Neural Network
The architecture of the YOLO (You Only Look Once)-based object detection model [27] is depicted in Figure 2, which emphasizes the essential components and the flow of data through the network. The architecture can be partitioned into five primary components: the backbone, feature pyramid network (FPN), feature pyramid, head, and YOLO loss. The backbone section of the network is responsible for the extraction of feature maps from the input image.
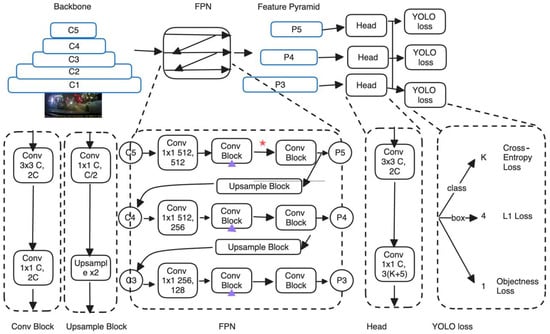
Figure 2.
Architecture of the YOLO-based object detection model. Designations: ★—skip-connections (C3–C5→FPN), ▲—detection heads (P3–P5).
Figure 2 illustrates the architecture of a YOLO-based object detection model, incorporating elements such as a backbone network, a feature pyramid network (FPN), and detection heads with specific loss functions. The backbone consists of five convolutional layers (C1 through C5) that extract features from the input image at various scales. This hierarchical feature extraction is crucial for detecting objects of different sizes. The FPN takes features from the backbone and processes them to create a multi-scale feature pyramid (P3 to P5). This includes upsampling and convolution operations to merge low-resolution, semantically strong features with high-resolution, semantically weaker features, enhancing the ability to detect objects at various scales. Each level of the feature pyramid (P3, P4, P5) is fed into a corresponding detection head. These heads perform further convolutions and predict bounding boxes, object classes, and objectness scores. The model utilizes three types of loss functions: YOLO loss applied to each head, which integrates objectness loss (how likely a box contains an object), class prediction loss (cross-entropy loss for class probabilities), and bounding box regression loss (L1 loss for the coordinates of the bounding box). Cross-entropy loss is used for classifying the detected objects into various categories. L1 loss is used for bounding box regression to make the predicted boxes as close as possible to the true box coordinates. This diagram also incorporates arrows and various blocks (convolutional, upsampling) to illustrate the flow of data through the network, showing how features are transformed and combined to achieve effective object detection. Symbols such as the red star and purple arrows highlight specific components or pathways that are key to the architecture’s functionality.
This architecture leverages the strengths of hierarchical feature extraction and multi-scale predictions, enabling efficient and accurate object detection across various contexts and object sizes. The model utilizes three types of loss functions: YOLO loss applied to each head, which integrates objectness loss (how likely a box contains an object), class prediction loss (cross-entropy loss for class probabilities), and bounding box regression loss (L1 loss for the coordinates of the bounding box). The YOLO loss function combines several components to train the network effectively. Cross-entropy loss is used for class prediction. L1 loss is used for bounding box regression, ensuring accurate localization of objects. Objectness loss is used to predict the presence of an object in a given bounding box. The flow of data through the network begins with the input image, which is processed by the backbone to generate feature maps. These maps are then refined and combined in the FPN, producing a multi-scale feature pyramid. The feature pyramid feeds into the detection heads, which output predictions used to calculate the YOLO loss. The network is trained end-to-end to optimize object detection performance.
Faster R-CNN [28], an object identification system introducing Region Proposal Networks (RPNs), is presented in this study to increase speed and accuracy. By sharing convolutional layers with the detection network, RPNs produce region recommendations that are almost completely free of cost. The system compiles RPNs and Fast R-CNN into a single network. Validated on PASCAL VOC [29] and MS COCO [30] datasets, Faster R-CNN achieves state-of-the-art object identification accuracy and efficiency, proving outstanding performance in several contests.
RT-DETR (Real-Time Detection Transformer) [31] is an innovative end-to-end object detector that combines high accuracy with real-time performance balancing, as illustrated in Figure 3.

Figure 3.
Architecture of RT-DETR.
Extending the DETR [30] framework, it combines a hybrid encoder with a convolution-based backbone to attain real-time rates. RT-DETR separates intra-scale interactions from cross-scale fusion to best manage multiscale characteristics. Figure 3 provides a comprehensive view of the R-DETR model architecture, an approach for object detection that utilizes an efficient hybrid encoder, an IoU-aware query selection mechanism, and a decoder-head module for processing and predicting objects in images. The backbone serves as the initial feature extractor from input images. It processes an input image (depicted as a landscape with animals) to generate a set of feature maps at multiple scales, labeled S3, S4, and S5, representing different levels of abstraction and detail. Feature layers (S3 to S5) capture various levels of features from the backbone, which are processed further for enhanced feature representation. AIFF (Adaptive Feature Fusion) adaptively integrates features across different scales to ensure that the model captures both high-level semantic information and fine details necessary for accurate object localization. CCFM (Cross-Channel Feature Modulation) aims to enhance the feature representation by dynamically recalibrating feature responses across channel dimensions, facilitating more effective feature fusion from different layers. IoU-aware Query Selection selects queries based on their Intersection over Union (IoU) score, ensuring that the queries most likely to match actual objects are processed preferentially. The decoder interprets the selected queries to predict object classes and bounding boxes. It includes convolutional layers with Batch Normalization (BN) and SiLU activation functions, structured to refine the predictions progressively. The model efficiently handles high-resolution inputs and complex scenes by combining deep feature hierarchies and selective query processing, aiming to improve both the accuracy and speed of object detection tasks. The architectural flow is depicted from left (input) to right (output), emphasizing the transformation from raw image data to precise object localization and classification.
3.3. Proposed Method YOLO-CSE
The proposed YOLO-CSE framework builds upon the YOLOv5 architecture, a highly efficient and widely adopted one-stage object detector. The original YOLOv5 model consists of three primary components: a backbone, a neck, and a detection head. The backbone is responsible for hierarchical feature extraction, the neck fuses multi-scale features, and the head performs final object classification and localization.
As shown in Figure 4, the input to the network is an image of size 640 × 640 pixels. The backbone contains a series of CBS and C3 blocks. Each CBS block is composed of a convolutional layer, Batch Normalization, and the SiLU activation function. The C3 blocks serve as bottleneck modules that facilitate deep feature learning with residual connections and efficient reuse of intermediate representations. The backbone also includes an SPPF module, which aggregates multi-scale contextual information by applying multiple pooling operations to enhance the receptive field.
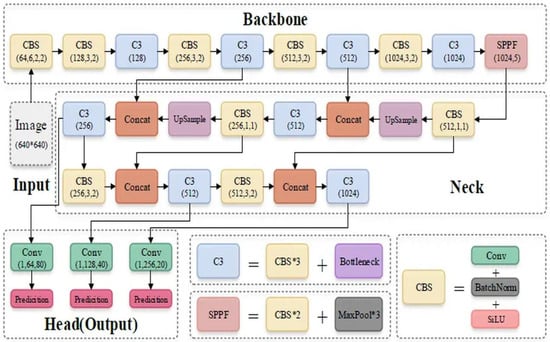
Figure 4.
Yolov5 architecture.
The neck incorporates upsampling and concatenation operations to combine features from different depths and spatial resolutions. These fused features are then passed to the detection head, which predicts object locations and classes at three different scales. This multi-scale detection strategy improves the model’s robustness in detecting both large and small objects.
While the original C3 blocks are effective at consolidating feature information, they lack an explicit mechanism to emphasize the most informative channels. To address this, we introduce the CSE module—a lightweight attention-enhanced variant of the C3 block. The CSE module integrates a simplified channel attention mechanism that re-weights feature channels based on global contextual information.
Given an input feature map , the attention mechanism first computes global descriptors via both average pooling and max pooling operations across the spatial dimensions:
These descriptors are concatenated and passed through two learnable transformations, activated by the SiLU function and followed by a sigmoid nonlinearity:
The resulting attention weights are applied to the original feature map through channel-wise multiplication:
Here, ⊙ denotes element-wise multiplication, and σ represents the sigmoid activation function. This process allows the network to emphasize channels that contribute more to the task while suppressing less informative ones.
We propose a modified bottleneck architecture that integrates the Squeeze-and-Excitation (SE) attention mechanism to enhance representational power, as shown in Figure 5. Given an input feature map , the module performs the following sequence of operations:
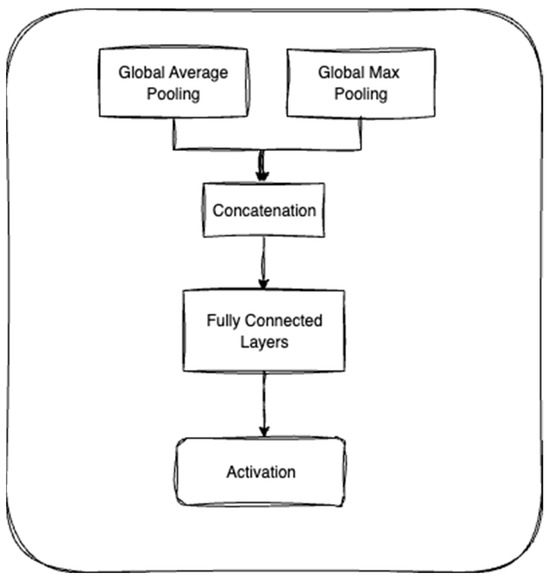
Figure 5.
SE block.
- A 1 × 1 convolution is first applied to reduce the channel dimensionality from C to a lower-dimensional space C′:
- 2.
- Next, a 3 × 3 convolution captures local spatial features:
- 3.
- A second 1 × 1 convolution restores the original channel dimensionality:
- 4.
- Finally, the SE block is applied to introduce channel-wise attention:
This configuration not only preserves the computational efficiency of traditional bottleneck blocks but also enhances channel interdependencies using attention mechanisms. As a result, the model can dynamically emphasize informative features while suppressing less useful ones, potentially leading to improved task performance.
A visual comparison between the original C3 and the proposed CSE module is presented in Figure 6. In the standard C3 module, a convolutional layer is followed by a bottleneck structure, and the outputs are concatenated and passed through a final convolution. In contrast, the CSE module introduces an additional convolution followed by the attention mechanism, which recalibrates the features before merging them with the shortcut connection. The resulting output is then passed through the final convolutional layer.
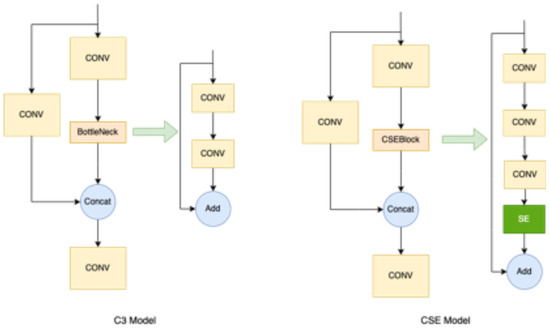
Figure 6.
C3 and CSE architecture.
This architectural modification enhances the network’s ability to detect small and low-contrast objects, such as streetlights under varying nighttime conditions, without compromising inference speed. By combining efficient bottlenecking with attention, YOLO-CSE offers a practical and accurate solution for object detection tasks in complex real-world environments.
The CSE module’s channel-wise attention mechanism naturally exploits symmetrical patterns in streetlight imagery. By analyzing inter-channel dependencies, the network learns to emphasize features that exhibit spatial symmetry—a characteristic common to man-made objects like streetlamps. This symmetry-aware feature enhancement proves particularly valuable for detecting partially occluded lamps, where the visible portion often retains symmetrical properties that aid recognition.
3.4. Experimental Results and Analysis
The YOLO-CSE model is pretrained on the COCO2017 dataset, undergoing training for up to 100 epochs. During training, the model resizes images to 640 × 640 pixels and applies a random horizontal flip with a probability of 0.5. Additionally, the training process involves setting the batch size to 32. The initial learning rate is set at 0.01, with a weight decay of 0.0005 and a momentum of 0.9. The CIoU loss was used for bounding box regression, and binary cross-entropy was used for objectness and classification. A cosine annealing learning rate scheduler was applied. The training is performed on a system that includes an NVIDIA A10 GPU, runs on Debian OS 12.0, and is equipped with an Intel(R) Xeon(R) Silver 4310T CPU, along with 128 GB of RAM. The provided Table 1 offers a detailed comparison of several object detection models, including various versions of YOLO, RT-DETR, Faster R-CNN, and YOLO-CSE. The models are evaluated based on precision, recall, F1 score, and mean average precision (mAP).

Table 1.
Performance metrics for different models.
Figure 7 presents a comparative analysis of the performance metrics for three different object detection models: YOLOv5m, YOLOv8m, and RT-DETR. Each row corresponds to a different model, labeled at the beginning of the row with the model name. The top row presents data for YOLOv5m, the middle for YOLOv8m, and the bottom for RT-DETR. The first column shows the precision metric across a range of confidence thresholds from 0 to 100. The second column displays the recall metric over the same range of confidence thresholds. The third column represents the mAP calculated at a threshold of 0.5 (mAP@0.5), also over confidence thresholds from 0 to 100. Each graph contains data points connected by lines, illustrating the variation of each metric as the confidence threshold changes. Generally, as the confidence threshold increases, precision tends to increase or stabilize, while recall tends to decrease, indicating a trade-off between these metrics. The mAP metric also shows variability, generally peaking at certain confidence thresholds before plateauing or declining, reflecting an optimal balance between precision and recall at specific thresholds. The graphs demonstrate the performance characteristics of each model, where higher precision at lower recall levels might indicate a model is conservative in its predictions, focusing on correctness over coverage. Conversely, higher recall at the expense of lower precision suggests a model that captures more true positives but also more false positives. This detailed visualization aids in understanding how each model performs across different confidence levels, allowing for targeted improvements and optimizations based on specific detection needs and scenarios.
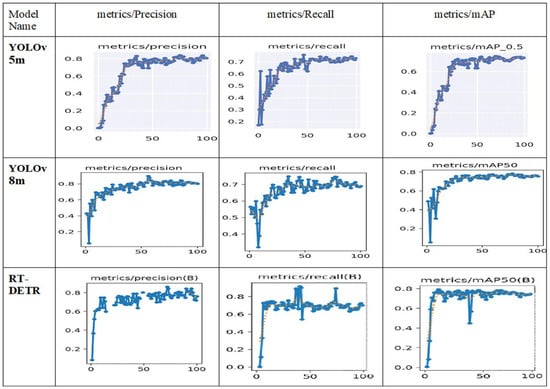
Figure 7.
Detection results.
While YOLOv8n has the lowest precision at 0.759, implying it is less accurate in its detections than the other models, YOLOv5m obtains the greatest precision with 0.836, thereby displaying its great capacity to precisely identify objects. Whereas YOLOv5n has the lowest recall at 0.67, implying it misses more relevant things than the other models, YOLO-CSE leads in recall with 0.794, meaning it is most successful in recognizing relevant objects. While YOLOv8n with 0.711 has the lowest F1 score, demonstrating a less balanced performance than the others, YOLO-CSE, with 0.808, achieves the greatest F1 score, reflecting a balanced performance in precision and recall. Whereas YOLOv8n has the lowest mAP at 0.749, showing its overall inferior performance, YOLO-CSE also obtains the greatest mAP with 0.798, demonstrating it performs best overall in terms of precision and recall across multiple thresholds.
Figure 8 presents performance metrics for two object detection models, Faster R-CNN and YOLO-CSE, across multiple metrics. Each model’s performance is assessed in terms of precision, recall, and mean average precision (mAP). The faster RCNN’s left graph represents precision as a function of training epochs, showcasing how the model’s ability to correctly identify objects as positive predictions evolves over training. The metric is plotted over 50 epochs. The middle graph shows recall over the same 50 epochs, indicating the model’s ability to detect all relevant instances in the dataset. The right graph plots the mAP, a combined measure of precision and recall, over the epochs, providing an overview of the overall performance of the model in detecting objects with a confidence threshold of 0.5. YOLO-CSE’s graphs plot the respective metrics against a confidence threshold ranging from 0 to 100. The left graph shows precision, the middle shows recall, and the right shows mAP at a threshold of 0.5 (mAP50). Each metric is characterized by fluctuations across varying confidence levels, illustrating the trade-off between precision and recall and the model’s performance stability across different thresholds. All the graphs use a line plot with data points marked along the curves, aiding in visualizing trends and changes more distinctly. The y-axes of all the graphs are scaled to fit the range of the metrics, facilitating a clear comparison of values across different scales and models. This figure effectively compares the learning progression of Faster R-CNN across epochs with the confidence threshold variability in YOLO-CSE, providing insights into how these models adjust their detection strategies under different training and operational conditions.
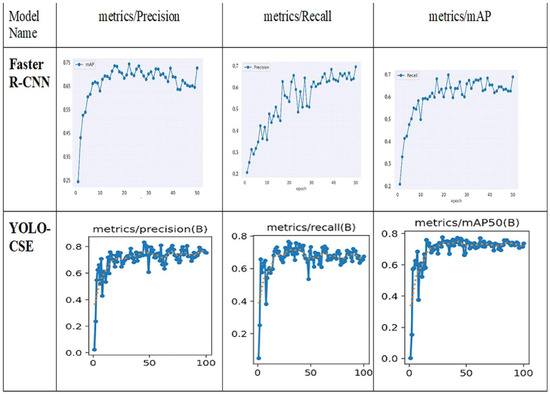
Figure 8.
Validation results.
Strong accuracy but somewhat reduced recall are shown by YOLOv5 models, including YOLOv5m in particular. Among all the models, YOLOv5n has the lowest recall, as it misses more pertinent items; YOLOv5s keeps balanced metrics with modest scores in accuracy, recall, and F1 score. While YOLOv8n displays the lowest performance across these measures, YOLOv8m beats the other YOLOv8 models in accuracy, recall, and F1 score. With good accuracy, recall, and F1 score, RT-DETR shows consistency but not leadership in any one category. Faster R-CNN indicates a balanced but not exceptional performance, as it has reduced accuracy but preserves reasonable recall and F1 score. With the best recall, F1 score, and mAP among all the other models, YOLO-CSE is the strongest model generally.
Qualitative analysis revealed that YOLO-CSE’s symmetry-enhanced features enabled more robust detection of streetlights in asymmetrical viewing conditions, such as angled perspectives or partial obstructions, where traditional models frequently failed.
3.5. Symmetry in Street Lighting Detection: Enhancing Robustness and Performance
Symmetry plays a pivotal role in both the design and analysis of street lighting systems, as well as in the development of computer vision models for their detection. Geometrically, streetlight poles and lamps often exhibit bilateral symmetry, where their structures are mirrored along a central axis. This inherent symmetry can be leveraged to improve detection accuracy, especially in challenging conditions, such as partial occlusions or low visibility. For instance, symmetric features, like the uniform spacing of lamps along a road or the repetitive patterns of light emission, can serve as robust cues for algorithms to identify and localize streetlights, even when partially obscured.
In the context of our proposed YOLO-CSE model, symmetry is implicitly harnessed through the Channel Squeeze-and-Excitation (CSE) module. The CSE mechanism dynamically recalibrates feature channels by modeling interdependencies between them, effectively “exciting” symmetric or repetitive patterns (e.g., evenly spaced lamps) while suppressing noise. This process mirrors the human visual system’s ability to recognize symmetric objects more efficiently, thereby enhancing the model’s ability to detect small or distant streetlights under varying illumination conditions.
Furthermore, the multi-scale feature fusion in YOLO-CSE’s architecture benefits from symmetric hierarchical representations. By combining low-resolution (semantically strong) and high-resolution (spatially precise) features, the model captures both global symmetry (e.g., alignment of poles along a street) and local symmetry (e.g., individual lamp shapes). This dual-scale approach aligns with the principles of scale symmetry, where objects retain detectable features across different resolutions.
From a practical standpoint, symmetry-aware detection improves urban infrastructure monitoring by the following mechanisms:
Reducing False Positives: Symmetric structures (e.g., paired lamps on a pole) are less likely to be confused with asymmetric noise (e.g., vehicle headlights).
Enhancing Generalization: Models trained on symmetric patterns adapt better to diverse urban layouts, as symmetry is a universal design principle in street lighting.
4. Discussion
In the context of urban streetlight monitoring, achieving accurate and efficient detection of faulty streetlights remains a significant challenge with considerable implications for public safety, energy efficiency, and city management. An effective resolution of this issue can substantially enhance urban environments and reduce operational costs. In this study, we introduced YOLO-CSE, a novel, deep-learning-based model that integrates the Channel Squeeze-and-Excitation (CSE) module into the YOLO detection architecture. Our approach specifically addresses the challenge of detecting streetlights under diverse, real-world nighttime conditions, including small, distant, and partially occluded targets.
The YOLO-CSE model was developed based on the YOLO architecture due to its well-known real-time inference capabilities. Although YOLO models prioritize speed, their performance in detecting small or partially occluded objects can be limited. By integrating the CSE attention module, the proposed YOLO-CSE significantly enhances feature representation, enabling more accurate detection of challenging streetlight scenarios. The channel-wise attention mechanism effectively recalibrates feature maps, allowing the network to better discriminate subtle visual details critical for accurate detection.
As demonstrated in Table 1, YOLO-CSE achieved superior overall performance compared to various state-of-the-art object detection models evaluated in our experiments. Specifically, YOLO-CSE delivered an average precision of 0.824, recall of 0.794, an F1 score of 0.808, and a mean average precision (mAP) of 0.798. Notably, YOLO-CSE outperformed all the compared baseline models, including popular variants, such as YOLOv5 (n, s, m), YOLOv8 (n, s, m), RT-DETR, and Faster R-CNN. For instance, compared to YOLOv8m—the strongest baseline competitor—YOLO-CSE improved recall by 0.038 and the F1 score by 0.020, while achieving similar precision and a slight gain in mAP. Such improvements highlight the tangible benefits of integrating the CSE module into the YOLO architecture.
Interestingly, although certain models such as YOLOv5m and YOLOv5n exhibited slightly higher precision (0.836 and 0.835, respectively), their recall performance was substantially lower (0.726 and 0.670), leading to lower overall F1 scores and mAP values. This indicates that while some baseline models excel at detecting easily identifiable streetlights, they often fail under challenging conditions, such as occlusion or low visibility. In contrast, YOLO-CSE maintained a balanced and robust performance across both easily identifiable and difficult detection scenarios, underscoring its suitability for real-world streetlight monitoring.
Figure 9 illustrates the object detection process using a YOLOCSE model applied to street images. The model identifies streetlights, lamps and poles. These scores reflect the model’s certainty in detecting and classifying each object, with higher scores indicating greater confidence in the detection. This demonstrates YOLOCSE effectiveness in real-time object detection under varying lighting conditions.
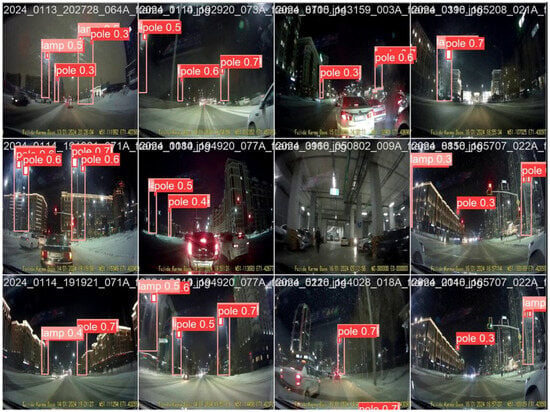
Figure 9.
Detection results 3.
The integration of the CSE module demonstrates clear advantages, as illustrated by the qualitative results in Figure 10. YOLOCSE consistently outperforms the baseline YOLOv8-m, particularly in difficult scenarios. The baseline model fails to detect streetlamps in low-light or visually challenging conditions. Although YOLO-CSE delivers superior performance overall, it occasionally has difficulty detecting lamps in particularly complex scenes.
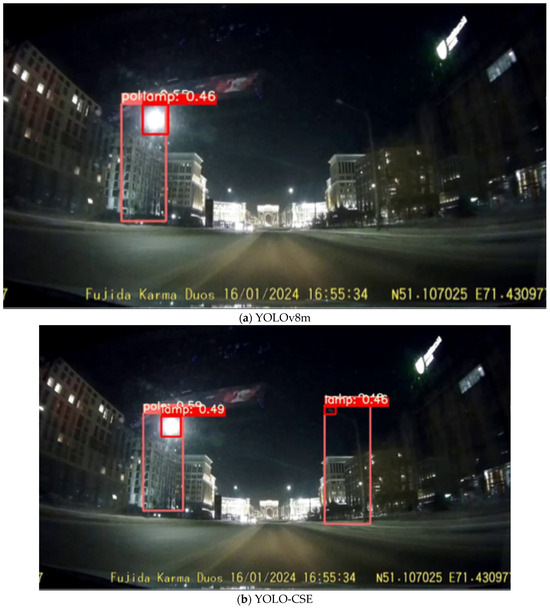
Figure 10.
YOLOv8m vs YOLO-CSE (proposed) comparison.
The success of YOLO-CSE can be partially attributed to its implicit utilization of symmetrical properties inherent in urban lighting infrastructure. Streetlights typically exhibit the following features:
- −
- Bilateral symmetry in individual lamp and pole designs;
- −
- Translational symmetry in their spatial distribution along roads;
- −
- Radial symmetry in light emission patterns.
Our model’s attention mechanism learns to exploit these regularities without explicit symmetry constraints. This explains its superior performance on occluded or distant lamps, where symmetrical subcomponents remain detectable even when full objects are obscured. Future work could explore explicitly incorporating symmetry constraints into the loss function to further boost performance.
5. Conclusions
The integration of automated streetlight fault detection into urban infrastructure monitoring systems is essential for enhancing public safety, optimizing energy consumption, and improving the efficiency of city management. Although significant advancements have been made in automated inspection methods, our literature review highlighted important gaps in developing scalable and reliable solutions capable of effectively detecting small, distant, or partially occluded streetlights in real-time urban scenarios.
To address these limitations, we introduced YOLO-CSE, a novel model integrating the Channel Squeeze-and-Excitation (CSE) attention module into the YOLO detection architecture. The proposed model significantly improved detection accuracy, effectively identifying challenging streetlight conditions without notable increases in computational complexity or latency. As demonstrated by both quantitative metrics and qualitative analyses, YOLO-CSE achieved an optimal balance between accuracy and computational efficiency, surpassing existing state-of-the-art models.
Looking forward, this study highlights several promising research directions. Adding data from different cities and diverse urban contexts could further enhance the model’s robustness and generalization capabilities, enabling better adaptability to varying real-world scenarios. Future research might also investigate advanced image enhancement techniques to further improve detection performance in challenging conditions. Additionally, exploring adaptive quantization, model compression, and transfer learning methods will facilitate optimized deployment on resource-constrained edge devices, significantly extending YOLO-CSE’s practical applicability and effectiveness in smart city infrastructure monitoring.
The YOLO-CSE framework demonstrates how computer vision can leverage the inherent symmetry of urban infrastructure for robust monitoring applications. By combining the efficiency of YOLO architectures with symmetry-aware feature learning, we achieve state-of-the-art performance in streetlight detection while maintaining real-time operation capabilities.
Author Contributions
Conceptualization, S.A. and A.Z.; methodology, S.A. and A.Z.; software, S.A. and E.T.M.; validation, E.T.M., B.M. (Bigul Mukhametzhanova) and B.M. (Bakhyt Matkarimov); formal analysis, E.T.M., B.M. (Bigul Mukhametzhanova). and B.M. (Bakhyt Matkarimov); investigation, S.A., A.Z. and E.T.M.; data curation, S.A., A.Z. and B.M. (Bakhyt Matkarimov); writing—original draft preparation, S.A., A.Z., E.T.M. and B.M. (Bakhyt Matkarimov); writing—review and editing, S.A. and A.Z.; visualization, S.A. an B.M. (Bigul Mukhametzhanova); supervision, A.Z.; project administration, A.Z.; funding acquisition, A.Z. All authors have read and agreed to the published version of the manuscript.
Funding
This work was supported by the Science Committee of the Minister of Science and Higher Education of the Republic of Kazakhstan (Grant No. of the research fund: AP19678989—Intelligent video analytics and reporting on city streets surface and lighting).
Data Availability Statement
Some of the datasets that were used and/or analyzed in this study have been uploaded to the website https://github.com/sungggat/YOLO-Streetlights, accessed 12 July 2025. In addition, we have attached the format conversion code for xml-YOLO. All the homemade datasets in this study (4260 in total) can be obtained by contacting the corresponding author.
Acknowledgments
We appreciate the assistance of the entire Label Studio team during this study. The data labeling performed in Label Studio was essential to our work.
Conflicts of Interest
The authors declare no conflicts of interest.
References
- Kumar, S.; Deshpande, A.; Ho, S.S.; Ku, J.S.; Sarma, S.E. Urban street lighting infrastructure monitoring using a mobile sensor platform. IEEE Sens. J. 2016, 16, 4981–4994. [Google Scholar] [CrossRef]
- Natu, O. GSM Based Smart Street Light Monitoring and Control System. 2013. Available online: https://www.semanticscholar.org/paper/GSM-Based-Smart-Street-Light-Monitoring-and-Control-Natu/12d070859578454c70cbaa1cbd0258bdd76bf7eb (accessed on 2 March 2025).
- Beyer, F.R.; Ker, K. Street lighting for prevention of road traffic injuries. Inj. Prev. 2009, 15, 282. [Google Scholar] [CrossRef]
- Bureau of Street Lighting (BSL), City of Los Angeles. STPOC—Solar Technology for Street Lighting Update. 2024. Available online: https://cao.lacity.gov (accessed on 2 March 2025).
- Bello-Yusuf, S.; Bello, A. Energy Sustainability Paradox: Exploring the Challenges and Opportunities of Solar LED Street Lights in Sokoto, Nigeria. Niger. J. Environ. Sci. Technol. 2020, 4, 260–271. [Google Scholar] [CrossRef]
- AGC Lighting. LED Street Lighting Solutions for Growing Cities. 2024. Available online: https://agcled.com (accessed on 2 March 2025).
- Bokade, A.S.; Gabhane, P.R.; Samudre, S.P.; Himane, S.V. Centralized Monitoring System for Faulty Street Light Detection and Location Tracking. Int. J. Sci. Res. Eng. Trends 2025, 11, 615. [Google Scholar]
- Sitetracker. Smart City Deep Dive: LED Streetlights. 2023. Available online: https://www.sitetracker.com (accessed on 5 March 2025).
- Hua, C.; Luo, K.; Wu, Y.; Shi, R. YOLO-ABD: A Multi-Scale Detection Model for Pedestrian Anomaly Behavior Detection. Symmetry 2024, 16, 1003. [Google Scholar] [CrossRef]
- Guo, Z.; Ma, W.; Wang, Y.; Zhou, Y.; Du, S. Multi-Scale Convolution and Dynamic Task Interaction Detection Head for Efficient Lightweight Plum Detection. Comput. Electron. Agric. 2023, 209, 107857. [Google Scholar] [CrossRef]
- Zhang, F.; Dai, C.; Zhang, W.; Liu, S.; Guo, R. Night Lighting Fault Detection Based on Improved YOLOv5. 2024. Available online: https://www.researchgate.net (accessed on 5 March 2025).
- Hu, J.; Shen, L.; Sun, G. Squeeze-and-Excitation Networks. In Proceedings of the IEEE Conference on Computer Vision and Pattern Recognition (CVPR), Salt Lake City, UT, USA, 18–23 June 2018; pp. 7132–7141. Available online: https://openaccess.thecvf.com (accessed on 5 March 2025).
- Chowdhury, T.; Sultana, J.; Sourav, M.S.U. IoT-based Efficient Streetlight Controlling, Monitoring, and Real-time Error Detection System for Smart Cities in Bangladesh. In Proceedings of the International Conference on Electrical, Computer and Communication Engineering (ECCE), Chittagong, Bangladesh, 23–25 February 2023; IEEE: Piscataway, NJ, USA, 2023. [Google Scholar]
- Alba, A.R.; Linsangan, N.B. Application Specific Computer for Intelligent Monitoring of Cabled Streetlights with Theft Detection Features. In Proceedings of the IEEE 14th International Conference on Humanoid, Nanotechnology, Information Technology, Communication and Control, Environment, and Management (HNICEM), Boracay Island, Philippines, 1–4 December 2022. [Google Scholar] [CrossRef]
- Adriansyah, A.; Budiyanto, S.; Andika, J.; Romadlan, A.; Nurdin, N. Public street lighting control and monitoring system using the Internet of Things. AIP Conf. Proc. 2020, 2217, 030103. [Google Scholar] [CrossRef]
- Lee, Y.; Zhang, H.; Rosa, J. Street Lamp Fault Diagnosis System Based on Extreme Learning Machine. IOP Conf. Ser. Mater. Sci. Eng. 2019, 490, 042053. [Google Scholar] [CrossRef]
- Zanjani, P.N.; Ghods, V.; Bahadori, M. Monitoring and Remote Sensing of the Street Lighting System Using Computer Vision and Image Processing Techniques for the Purpose of Mechanized Blackouts. In Proceedings of the 19th International Conference on Mechatronics and Machine Vision in Practice (M2VIP12), Auckland, New Zealand, 28–30 November 2012. [Google Scholar] [CrossRef]
- Lee, H.-C.; Huang, H.-B. A Low-Cost and Noninvasive System for the Measurement and Detection of Faulty Streetlights. IEEE Trans. Instrum. Meas. 2015, 64, 836–848. [Google Scholar] [CrossRef]
- Yu, Y.; Li, J.; Guan, H.; Wang, C.; Yu, J. Semiautomated Extraction of Street Light Poles from Mobile LiDAR Point-Clouds. IEEE Trans. Geosci. Remote Sens. 2015, 53, 1374–1386. [Google Scholar] [CrossRef]
- Mavromatis, I.; Stanoev, A.; Carnelli, P.; Jin, Y.; Sooriyabandara, M.; Khan, A. A dataset of images of public streetlights with operational monitoring using computer vision techniques. Data Brief 2022, 45, 108658. [Google Scholar] [CrossRef]
- Simonyan, K.; Zisserman, A. Very deep convolutional networks for large-scale image recognition. arXiv 2014, arXiv:1409.1556. [Google Scholar]
- Teixeira, A.C.; Carneiro, G.; Filipe, V.; Cunha, A.; Sousa, J.J. Street Light Segmentation in Satellite Images Using Deep Learning. In Proceedings of the IGARSS 2023—2023 IEEE International Geoscience and Remote Sensing Symposium 2023, Pasadena, CA, USA, 16–21 July 2023; pp. 6862–6865. [Google Scholar] [CrossRef]
- Ronneberger, O.; Fischer, P.; Brox, T. U-Net: Convolutional networks for biomedical image segmentation. arXiv 2015, arXiv:1505.04597. [Google Scholar] [CrossRef]
- Lin, T.Y.; Dollar, P.; Girshick, R.; He, K.; Hariharan, B.; Belongie, S. Feature pyramid networks for object detection. arXiv 2017, arXiv:1612.03144. [Google Scholar] [CrossRef]
- He, K.; Zhang, X.; Ren, S.; Sun, J. Deep residual learning for image recognition. arXiv 2015, arXiv:1512.03385. [Google Scholar] [CrossRef]
- Szegedy, C.; Ioffe, S.; Vanhoucke, V.; Alemi, A. Inception-v4, Inception-ResNet and the impact of residual connections on learning. arXiv 2016, arXiv:1602.07261. [Google Scholar] [CrossRef]
- Redmon, J.; Divvala, S.; Girshick, R.; Farhadi, A. You Only Look Once: Unified, real-time object detection. arXiv 2016, arXiv:1506.02640. [Google Scholar] [CrossRef]
- Ren, S.; He, K.; Girshick, R.; Sun, J. Faster R-CNN: Towards realtime object detection with region proposal networks. arXiv 2015, arXiv:1506.01497. [Google Scholar] [CrossRef]
- Everingham, M.; Eslami, S.M.A.; Van Gool, L.; Williams, C.K.I.; Winn, J.; Zisserman, A. The Pascal Visual Object Classes Challenge: A retrospective. Int. J. Comput. Vis. 2015, 111, 98–136. [Google Scholar] [CrossRef]
- Lin, T.Y.; Maire, M.; Belongie, S.; Hays, J.; Perona, P.; Ramanan, D.; Dollar, P.; Zitnick, C.L. Microsoft COCO: Common objects in context. arXiv 2014, arXiv:1405.0312. [Google Scholar]
- Lv, W.; Zhao, Y.; Xu, S.; Wei, J.; Wang, G.; Cui, C.; Du, Y.; Liu, Y. DETRs Beat YOLOs on Real-time Object Detection. arXiv 2023, arXiv:2304.08069. [Google Scholar]
Disclaimer/Publisher’s Note: The statements, opinions and data contained in all publications are solely those of the individual author(s) and contributor(s) and not of MDPI and/or the editor(s). MDPI and/or the editor(s) disclaim responsibility for any injury to people or property resulting from any ideas, methods, instructions or products referred to in the content. |
© 2025 by the authors. Licensee MDPI, Basel, Switzerland. This article is an open access article distributed under the terms and conditions of the Creative Commons Attribution (CC BY) license (https://creativecommons.org/licenses/by/4.0/).