Abstract
To address the limitations of the Red-billed Blue Magpie Optimization algorithm (RBMO), such as its tendency to get trapped in local optima and its slow convergence rate, an enhanced version called MRBMO was proposed. MRBMO was improved by integrating Good Nodes Set Initialization, an Enhanced Search-for-food Strategy, a newly designed Siege-style Attacking-prey Strategy, and Lens-Imaging Opposition-Based Learning (LIOBL). The experimental results showed that MRBMO demonstrated strong competitiveness on the CEC2005 benchmark. Among a series of advanced metaheuristic algorithms, MRBMO exhibited significant advantages in terms of convergence speed and solution accuracy. On benchmark functions with 30, 50, and 100 dimensions, the average Friedman values of MRBMO were 1.6029, 1.6601, and 1.8775, respectively, significantly outperforming other algorithms. The overall effectiveness of MRBMO on benchmark functions with 30, 50, and 100 dimensions was 95.65%, which confirmed the effectiveness of MRBMO in handling problems of different dimensions. This paper designed two types of simulation experiments to test the practicability of MRBMO. First, MRBMO was used along with other heuristic algorithms to solve four engineering design optimization problems, aiming to verify the applicability of MRBMO in engineering design optimization. Then, to overcome the shortcomings of metaheuristic algorithms in antenna S-parameter optimization problems—such as time-consuming verification processes, cumbersome operations, and complex modes—this paper adopted a test suite specifically designed for antenna S-parameter optimization, with the goal of efficiently validating the effectiveness of metaheuristic algorithms in this domain. The results demonstrated that MRBMO had significant advantages in both engineering design optimization and antenna S-parameter optimization.
1. Introduction
In the field of optimization, metaheuristic algorithms have received widespread attention due to their effectiveness and applicability in solving complex multimodal problems. Metaheuristic algorithms are an improvement of heuristic algorithms and are a combination of random algorithms and local search algorithms. Metaheuristic algorithms are employed to solve complex optimization problems by conducting both global searches and local exploration to find optimal or near-optimal solutions. The key concepts in these algorithms are exploration and exploitation. Exploration involves extensively searching the entire problem space, as the optimal solution could be anywhere within it. Exploitation focuses on maximizing the use of available information, often by identifying patterns or correlations in the solutions and refining the algorithm to improve its results. The main benefit of metaheuristic algorithms is their ability to address complex, nonlinear problems without needing assumptions about the problem’s specific model. While they cannot guarantee a global optimal solution, these algorithms are efficient at finding or approximating the best solution within a given time frame.
Table 1 lists some classical and novel metaheuristic algorithms. Due to their excellent optimization ability and versatility, metaheuristic algorithms have been widely applied in various fields such as robot path planning, job shop scheduling, neural network parameter optimization, and feature selection. However, many traditional metaheuristic algorithms, such as PSO, GA, and ACO, often face issues such as getting trapped in local optima and slow convergence when dealing with complex problems. To address these challenges, researchers have attempted to integrate various improvement strategies into basic metaheuristic algorithms, including hybrid algorithms, enhanced exploration–exploitation balance methods, and the introduction of new biological behavior models.

Table 1.
Details of the metaheuristic algorithms.
In 2018, Guojiang Xiong et al. proposed the improved whale optimization algorithm (IWOA) with a novel search strategy for solving solar photovoltaic model parameter extraction problems [10]. In 2023, Ya Shen et al. proposed an improved whale optimization algorithm based on multi-population evolution (MEWOA). The algorithm divides the population into three sub-populations based on individual fitness and assigns different search strategies to each sub-population. This multi-population cooperative evolution strategy effectively enhances the algorithm’s search capability [11]. In 2024, Ying Li et al. proposed the Improved Sand Cat Swarm Optimization algorithm (VF-ISCSO) based on virtual forces and a nonlinear convergence strategy. VF-ISCSO demonstrated significant advantages in enhancing the coverage range of wireless sensor networks [12]. In 2024, Gu Y et al. proposed an IPSO that incorporated adaptive t-distribution and Levy flight for UAV three-dimensional path planning [13]. In 2025, Wei J et al. proposed LSEWOA, which integrates Spiral flight and Tangent flight, to address the slow convergence speed and susceptibility to local optima of WOA [14]. LSEWOA significantly improved the convergence speed and accuracy of WOA. These outstanding algorithms, by integrating various novel improvement strategies, offer new insights into the enhancement of metaheuristic algorithms.
The Red-Billed Blue Magpie Optimization (RBMO) algorithm is a novel metaheuristic algorithm inspired by the foraging behavior and social cooperation characteristics of the red-billed blue magpie [15]. RBMO demonstrates significant advantages in global search, population diversity, and ease of implementation. However, it still exhibits limitations in solution accuracy and convergence speed, particularly when dealing with complex multimodal problems, where it struggles to quickly approach the optimal solution. To address these challenges, this paper proposed an enhanced RBMO algorithm (MRBMO). MRBMO was improved by integrating Good Nodes Set Initialization, an Enhanced Search-for-food Strategy, a newly designed Siege-style Attacking-prey Strategy and Lens-Imaging Opposition-Based Learning (LIOBL).
2. Current Research on Antenna Design
Adegboye et al. introduced the Honey Badger Algorithm (HBA) for antenna design optimization, demonstrating the algorithm’s effectiveness in enhancing antenna performance through specific cases [16]. The improvements were evident in key metrics such as gain and bandwidth. They compared the performance of various algorithms in antenna design, highlighting the advantages of the new algorithm in addressing particular design challenges. Park et al. proposed a method for optimizing antenna placement in single-cell and dual-cell distributed antenna systems (DAS) to maximize the lower bounds of expected signal-to-noise ratio (SNR) and expected signal-to-leakage ratio (SLR) [17]. The results indicated that the DAS using the proposed gradient ascent-based algorithm outperforms traditional centralized antenna systems (CASs) in terms of capacity, especially in dual-cell environments, effectively reducing interference and improving system performance. Jiang et al. designed a multi-band pixel antenna using genetic algorithms and N-port characteristic modal analysis, which operates effectively across the 900 MHz, 1800 MHz, and 2600 MHz frequency bands [18]. The effectiveness of the Genetic Algorithm in antenna design optimization was validated by monitoring changes in the objective function. Yang Zhao et al. proposed an optimization design method for dual-band tag antennas based on a multi-population Genetic Algorithm, overcoming the inefficiencies of traditional simulation and parameter tuning experiments in determining optimal size parameters [19]. The optimized UHF antenna achieved near-ideal input impedance at 915 MHz, resulting in good impedance matching with the chip. The size of the optimized dual-band tag antenna was significantly reduced compared to existing designs. Cai Jiaqi et al. presented a self-optimization method for base station antenna azimuth and downtilt angles based on the Artificial Bee Colony algorithm [20]. Experimental results provided the optimal azimuth and downtilt angles for base station antennas, improving coverage effectiveness for user devices, particularly in weak coverage areas. Fengling Peng et al. developed an antenna optimization framework based on Differential Evolution (DE), customized decision trees, and Deep Q-Networks (DQNs) [21]. Experimental results showed that this hybrid strategy-based framework achieves superior antenna design solutions with fewer simulation iterations. Metaheuristic algorithms have played an important role in antenna design. While the aforementioned studies primarily focus on antenna design, they consistently demonstrate the effectiveness of metaheuristic algorithms in addressing complex, high-dimensional, and multi-constrained optimization problems. These characteristics are not unique to antenna systems but are prevalent across a wide range of engineering design challenges. Accordingly, the demonstrated success of metaheuristic algorithms in antenna optimization has motivated their broader application in general engineering design problems. The subsequent section provides a systematic review of recent advancements in engineering design optimization, emphasizing the expanding role and applicability of metaheuristic algorithms as robust and efficient tools for solving intricate engineering tasks.
3. Current Research on Engineering Design Optimization
Nowadays, with the rapid development of metaheuristic algorithms, they are being widely applied in engineering design optimization [22]. Since the early 21st century, metaheuristic algorithms have been introduced to various engineering optimization problems. Before this, engineering design heavily relied on engineers’ experience and intuition. Although some numerical optimization methods were introduced, they were often limited by problem complexity and struggled to find global optima. With the rapid development of computer technology and the maturation of metaheuristic algorithms, engineering design optimization entered a new era. For instance, in pressure vessel design, canonical designs relied on experience and experimentation [23]. By introducing metaheuristic algorithms, multiple parameters such as vessel size and materials can be optimized, significantly reducing material costs while ensuring safety. In rolling bearing design [24], metaheuristic algorithms optimize parameters such as geometric dimensions and contact angles to achieve longer bearing life and higher load capacity.
Compared to canonical engineering design methods, metaheuristic algorithms offer several advantages. First, they can efficiently handle complex optimization problems, such as high-dimensional, multi-constraint, and nonlinear problems, without relying on specific mathematical models. Second, metaheuristic algorithms possess strong global search capabilities, allowing them to escape local optima and find global solutions. Additionally, these algorithms exhibit good robustness, maintaining high optimization performance across different application scenarios. These advantages have made metaheuristic algorithms important tools in modern engineering design and effective solutions for complex optimization problems [25]. In 2021, MH Nadimi-Shahraki et al. proposed I-GWO to solve problems such as pressure vessel design, welded beam design, and optimal power flow problems [26]. In 2023, JO Agushaka et al. introduced a new metaheuristic algorithm, the Greater Cane Rat Algorithm (GCRA), to solve issues in engineering design, including Three-bar truss, Gear train, and Welded beam problems, providing a new metaheuristic approach for engineering design optimization [27]. In 2025, Wei J et al. proposed LSEWOA, which was applied to solve engineering design optimization problems such as Three-bar Truss, Multi-disc Clutch Brake, and Industrial Refrigeration System, offering new insights for the application of WOA in engineering design optimization [14].
This paper will explore the effectiveness and applicability of MRBMO in engineering design optimization, aiming to provide a new optimizer for engineering design optimization.
4. Arrangement of the Rest of the Paper
Section 5 outlines the key contributions of this study. Section 6 details the principles of the RBMO algorithm, highlighting its strengths and limitations. Section 7 introduces the proposed MRBMO algorithm. Section 8 evaluates the performance of MRBMO through various experiments. Section 9 presents simulations and compares MRBMO with other metaheuristic algorithms on different engineering design optimization problems, as well as an antenna S-parameter optimization test suite, demonstrating the effectiveness of MRBMO.
5. Contributions of This Study
By integrating Good Nodes Set Initialization, an Enhanced Search-for-Food Strategy, a newly designed Siege-style Attacking-Prey Strategy, and Lens-Imaging Opposition-Based Learning (LIOBL), we proposed a novel optimizer, MRBMO, for solving real-world challenges. Through an ablation study, we evaluated the effectiveness of each strategy. By comparing MRBMO with other state-of-the-art metaheuristic algorithms on classical benchmark functions, we validated the outstanding performance of MRBMO. In a subsequent series of simulation experiments, MRBMO demonstrated excellent optimization ability and good convergence, proving that it can be used in real-world applications to solve various numerical optimization problems.
6. Red-Billed Blue Magpie Optimization Algorithm
The red-billed blue magpie, native to Asia, is commonly found in China, India, and Myanmar. This bird is notable for its large size, vibrant blue feathers, and distinct red beak. Its diet mainly consists of insects, small vertebrates, and plants, demonstrating active hunting behavior. When foraging, red-billed blue magpies use a mix of hopping, walking on the ground, and searching for food on branches.
These magpies are most active in the early morning and evening, often forming small groups of 2–5 individuals, but sometimes gathering in larger groups of over 10. They exhibit cooperative hunting behaviors, such as when one magpie finds food like fruit or insects and then invites others to share. This group effort allows them to capture larger prey, and their collective actions help them overcome the prey’s defense mechanisms. Additionally, magpies store food for later, hiding it in tree hollows, branches, and rock crevices to protect it from other animals.
Overall, red-billed blue magpies are flexible predators that acquire and store food through diverse strategies, while also exhibiting social and cooperative hunting behaviors. Inspired by this, Shengwei Fu et al. proposed a novel metaheuristic algorithm in 2024, called the Red-billed Blue Magpie Optimization algorithm (RBMO) [15]. When solving complex problems, RBMO defines an objective function specific to the problem, and the solution space refers to the set of all possible candidate solutions. The goal of RBMO is to efficiently search for the global or near-global optimum within this space. In each iteration, RBMO randomly generates N individuals (called search agents) within the solution space. These agents simulate the behaviors of red-billed blue magpies, such as searching for food, attacking prey, and storing food. During the optimization process, each agent updates its position, which represents a candidate solution. The fitness of that solution is then evaluated using the objective function. After multiple iterations, the algorithm converges to the best or a near-best solution according to the fitness values.
6.1. Search for Food
In red-billed blue magpies’ search-for-food stage, they use a variety of methods such as hopping on the ground, walking or searching for food resources in trees. The whole flock will be divided into small groups of 2–5 individuals or in clusters of 10 or more to search for food.
RBMO imitates their search-for-food behavior in small groups as follows:
where t represents the current iteration number; p is a random integer between 2 and 5, representing the number of red-billed blue magpies in a population of 2 to 5 randomly selected from all searched individuals; represents the th randomly selected individual; represents the th individual; represents the randomly selected search agent in the current iteration; is a random number in the range of [0, 1].
Also, RBMO imitates their search-for-food behavior in clusters as follows:
where q is a random integer between 10 and n, representing the number of red-billed blue magpies in a population of 10 to n randomly selected from all searched individuals; n is the population size; is a random number in the range of [0, 1].
The whole Search-for-food Strategy is modeled below.
where is a random number in the range of [0, 1]; balance coefficient is usually set to 0.5.
Although the mathematical forms of Equations (3) and (4) appear similar, they represent different swarm behaviors triggered under distinct probabilistic regimes, and are thus presented separately for clarity and fidelity to the original biological metaphor [15].
6.2. Attacking Prey
When attacking prey, red-billed blue magpies demonstrate remarkable hunting proficiency and cooperative behavior. They employ diverse strategies such as rapid pecking, leaping to capture ground prey, and flying to intercept insects. To improve predation efficiency, they typically operate in flexible formations, either in small coordinated groups of 2–5 individuals or in larger clusters of 10 or more. This adaptive grouping behavior provides a natural model of collaborative predation, which is reflected in the RBMO algorithm’s exploitation phase to enhance convergence and intensify the search around promising solutions.
RBMO imitates red-billed blue magpies’ attacking-prey behavior in small groups as follows:
where represents the location of th new search agent; represents the position of the food, which indicates the current optimal solution; p is a random integer between 2 and 5, representing the number of red-billed blue magpies in a population of 2 to 5 randomly selected from all searched individuals; denotes the random number used to generate the standard normal distribution (mean 0, standard deviation 1); is the step control factor, calculated as in Equation (6).
where t represents the current number of iterations; T represents the maximum number of iterations.
RBMO imitates red-billed blue magpies’ attacking-prey behavior in clusters as follows:
where q is a random integer between 10 and n, representing the number of red-billed blue magpies in a population of 10 to n randomly selected from all searched individuals; denotes the random number used to generate the standard normal distribution (mean 0, standard deviation 1).
The Attacking prey is modeled below.
where is a random number in the range of [0, 1]; balance coefficient is usually set to 0.5.
6.3. Food Storage
As well as searching for food and attacking food, red-billed blue magpies store excess food in tree holes or other hidden places for future consumption, ensuring a steady supply of food in times of shortage.
RBMO imitates the storing-food behavior of red-billed blue magpies. And the formula for storing food is shown in Equation (10).
where and denote the fitness values before and after the position update of the th red-billed blue magpie, respectively.
6.4. Initialization
Like many metaheuristic algorithms, RBMO employs pseudo-random numbers for initializing the population. Although this method is straightforward, it frequently leads to limited diversity and an uneven distribution of solutions, potentially reducing search efficiency. Figure 1 illustrates a population initialized using the pseudo-random approach.
where represents the randomly generated population, and denote the upper and lower bounds of the problem, and is a random value between 0 and 1.
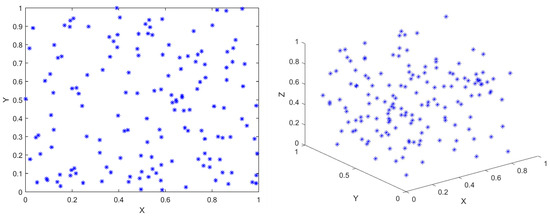
Figure 1.
The population initialized by pseudo-random number method (N = 150). The figure on the left is the 2D view of the population distribution, and the figure on the right is the 3D view of the population distribution. Axes are normalized in [0, 1] for visualization purposes.
To better illustrate the randomness and distribution pattern of the initialization process, Figure 1 uses a normalized domain of [0, 1] along each axis, independent of the specific problem’s actual bounds. The coordinates shown in the figure correspond to the unscaled values of , not the final scaled positions . This figure is intended solely as a visualization of the randomness and spatial diversity of the initial population in 2D and 3D spaces.
6.5. Workflow of RBMO and Its Analysis
The workflow of RBMO is provided in Figure 2.
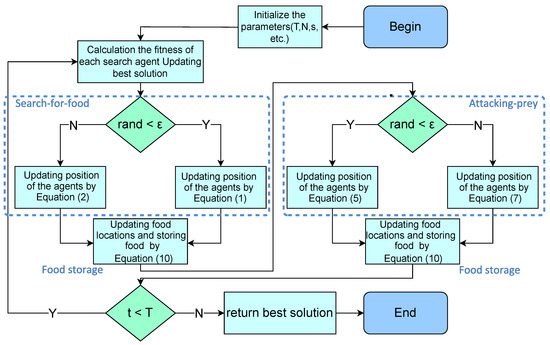
Figure 2.
Workflow of RBMO. After executing the Search-for-food strategy, RBMO will execute the Food storage strategy to preserve the better solution. Then, after executing the Attacking prey strategy, the Food storage strategy will be executed again to preserve the better solution.
As a novel biologically inspired metaheuristic algorithm, RBMO had significant advantages in global search, population diversity, and simplicity of implementation. The update mechanism of RBMO increased the breadth and diversity of the search by randomly selecting the mean values of multiple individuals for updating, which enabled it to cover a larger search space, effectively avoiding falling into a local optimum.
Secondly, the algorithm structure of RBMO was simple and easy to implement, making it suitable for the rapid solution of different problems across various fields. In addition, by randomly selecting individuals and mean updating strategies, RBMO could adapt to different types and sizes of optimization problems, demonstrating good stability and adaptability.
However, RBMO also had some limitations, particularly in its local search ability and convergence speed. As the attacking-prey strategy of RBMO was relatively monotonous, it led to insufficient local search ability when facing complex and multi-peak problems, making it difficult to approach the optimal solution quickly. Additionally, the convergence speed of RBMO was relatively slow, requiring more iterations to find a better solution in the optimization process. These shortcomings limited the effectiveness and efficiency of RBMO’s application to some extent. To address these issues, enhance the local search capability, and accelerate the convergence speed, we proposed an enhanced RBMO, called MRBMO.
7. MRBMO
7.1. Good Nodes Set Initialization
The original RBMO uses the pseudo-random number method to initialize the population; this method is simple, direct and random, but there are some drawbacks. The randomly generated population, as shown in Figure 1, is not uniformly distributed throughout the solution space; it is very aggregated in some areas and scattered in some areas, which leads to the algorithm’s poor exploitation of the whole search space and low diversity of the population. Therefore, some experts proposed using chaotic mapping, random wandering, Gaussian distribution and other methods to initialize the population. Later, some scholars proposed using Good Nodes Set initialization [28].
The theory of Good Nodes Set was first proposed by the famous Chinese mathematician Loo-keng Hua. Good Nodes Set is a method used to cover a multidimensional space uniformly, aiming to improve the quality of initialized populations. Compared with the traditional initialization method, Good Nodes Set initialization, as shown in Figure 3, can better distribute the nodes and improve the diversity of the population, thus providing better initial conditions for the optimization algorithm. This method is also effective in high-dimensional spaces.
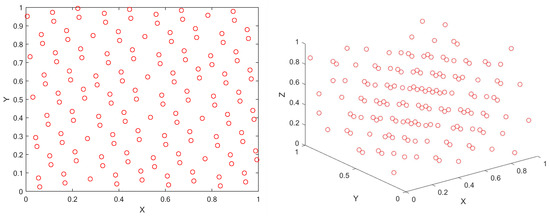
Figure 3.
The population initialized by Good Nodes Set method (N = 150). The figure on the left is the 2D view of the population distribution, and the figure on the right is the 3D view of the population distribution. Axes are normalized in [0, 1] for visualization purposes.
Let denote a unit cube in D-dimensional Euclidean space, and let r be a given parameter. The canonical node set is defined as in Equation (12):
where {x} represents the fractional part of x; M is the number of points; r is a deviation parameter greater than zero.
This set is referred to as the Good Nodes Set, with each element termed a Good Node. Given the lower and upper bounds and of the th dimension in the search space, the mapping from the Good Nodes Set to the actual search space is expressed as follows:
7.2. Enhanced Search-for-Food Strategy
In the original RBMO, the Search-for-food phase relied on the random number and lacks dynamic adjustment, which resulted in large random fluctuations between the population individuals. Particularly in the later stages of iteration, individuals may still explore with large step sizes, leading to a decrease in search efficiency and affecting convergence accuracy. The whole Search-for-food Strategy is modeled below.
where is a random number in the range of [0, 1]; balance coefficient is usually set to 0.5.
Therefore, this paper introduced a nonlinear factor k, which enabled more thorough exploration in the early stages and more refined development in the later stages. The variation process of k is shown in Figure 4. And the calculation of the nonlinear factor k is as follows:
where t represents the current number of iterations; T represents the maximum number of iterations.
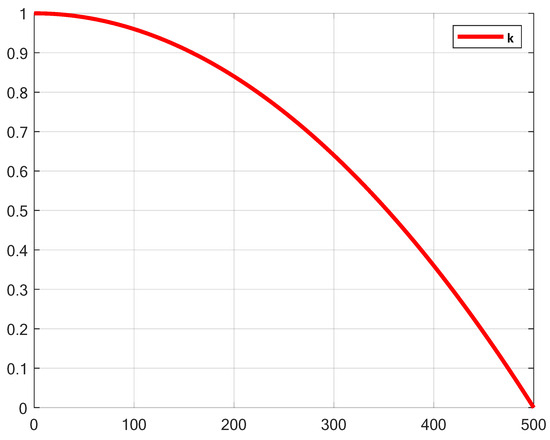
Figure 4.
The variation process of k.
In the early iterations, the value of k is close to 1, which enhanced the large step movements between the population individuals, thus improving global exploration ability. In the later iterations, the value of k approached 0, limiting the movement range of individuals and gradually transitioning towards local exploitation. By introducing the nonlinear factor k, the search intensity of RBMO dynamically decayed, naturally balancing exploration and exploitation, thereby improving convergence stability. The Enhanced Search-for-food Strategy addressed the issue of excessive randomness in the search phase of the original algorithm. The Enhanced Search-for-food Strategy is modeled below.
where k is the proposed nonlinear factor; is a random number in the range of [0, 1]; balance coefficient is usually set to 0.5.
7.3. Siege-Style Attacking-Prey Strategy
7.3.1. Inspiration of HHO
The original RBMO algorithm was prone to getting stuck in local optima because the average position induced a contraction effect on the dynamic range of the population, limiting further exploration of the search space. Furthermore, in the original RBMO algorithm, the strategy for attacking prey relied on the average position of the red-billed blue magpie individuals. This updating mechanism may lead to a decrease in population diversity, resulting in slower convergence and reduced accuracy and efficiency of the search, thus hindering further optimization. Therefore, inspired by the Harris Hawk Optimization (HHO) algorithm, this paper introduced the concept of HHO into the prey attack phase of RBMO, proposing the Siege-style Attacking-prey Strategy. The Harris Hawk Optimization (HHO), introduced by Ali Asghar Heidari et al. in 2019, is a novel bio-inspired optimization algorithm [7]. The HHO algorithm simulated the diverse hunting strategies of Harris hawks, allowing HHO to perform efficient global search in a larger solution space while reducing the likelihood of falling into local optima. At the development stage, the HHO algorithm fine-tuned the position of prey to perform local search, thereby finding better solutions in the local regions of the solution space. We drew inspiration from the following position updating strategy of HHO.
where is the positions of the th Harris hawk search agent; E is the energy of the prey; J is a prey’s random step while escaping; and represents the position of the food, which indicates the current optimal solution.
The Siege-style Attacking-prey Strategy integrated the ideas of HHO, introducing the absolute difference between the prey’s position and the red-billed blue magpie individual’s current position , combined with the step size to directly adjust the individual’s position update step size. This mechanism helped to guide the red-billed blue magpie individuals more rapidly toward better solutions, refining the local development capability of RBMO in later stages, thereby improving solution accuracy and accelerating convergence speed. Additionally, through the combination of a random factor and nonlinear scaling, the Siege-style Attacking-prey Strategy maintained population diversity during the development phase. With the dynamically adjusted step size , the attacking behavior of the red-billed blue magpie individuals was able to adapt to the different search demands at various stages of iteration, enhancing exploration in the early stages and reinforcing exploitation in the later stages. This avoided premature convergence to a single solution and improved the robustness of the algorithm.
7.3.2. Levy Flight
The concept of Levy flight originates from the work of mathematician Paul Levy in the 1920s. Inspired by the foraging behavior observed in nature and the jump phenomena in complex systems, Levy flight combines frequent short-range movements with occasional long-range jumps, resembling the foraging trajectories of predators such as sharks, birds, and insects. It is a stochastic walk model based on the Levy distribution, with a defining characteristic of alternating between small local steps and rare, large-distance jumps. This search pattern enables individuals to avoid being trapped in local optima while preserving the capability for global exploration. The long jumps allow the algorithm to escape from local regions, significantly alleviating the problem of premature convergence in complex optimization problems. Meanwhile, the predominance of short steps enables fine-tuned search within promising local regions [13]. Figure 5 presents a two-dimensional simulation of Levy flight generated using the Mantegna method. In this visualization, each jump is rendered in a different color to intuitively convey the heterogeneity of step sizes. This coloring approach allows readers to clearly distinguish between the frequent, short-distance movements and the occasional, long-distance jumps that characterize Levy flight behavior, thereby highlighting its dual exploration–exploitation capability. The step length in Levy flight follows the Levy distribution, and is computed as follows:
where u and are normally distributed; = 1.5.
The calculation of is given by:
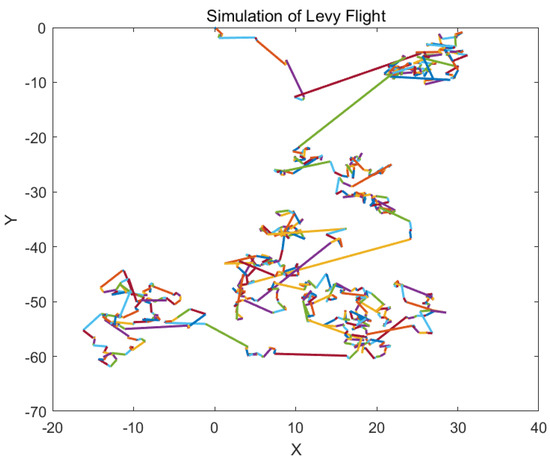
Figure 5.
Two-dimensional simulation of Levy flight using the Mantegna method [29]. The trajectory is generated by repeatedly taking steps whose lengths follow a Levy distribution, with random directions in 2D space.
One of the Siege-style Attacking-prey Strategies is modeled in Equation (25).
where represents the th individual; represents the position of the food, which indicates the current optimal solution; is the step control factor, calculated as in Equation (6); is a random number in the range of [0, 1]; is calculated in Equation (20); is the step size of Levy flight, calculated in Equation (21).
7.3.3. Prey-Position-Based Enhanced Guidance
In the original attacking-prey phase, the movement of the red-billed blue magpie individuals relied on both the position of the prey and the average position of the randomly selected red-billed blue magpies. This movement strategy introduced some randomness and bias, which caused individuals to become trapped near suboptimal solutions and prevented them from fully utilizing information about the global optimum, hindering the local exploitation of the RBMO. Therefore, we proposed Prey-position-based Enhanced Guidance. Due to the success of the prey-position-based guidance strategy in HHO and GWO, in this approach, we replaced the average position of the randomly selected red-billed blue magpies with the position of the prey, directly guiding the red-billed blue magpie individuals towards the prey. This helped to reduce the gap between the individuals and the optimal solution. Prey-position-based Enhanced Guidance strengthened the dependency on the optimal position, mitigated the degradation of solution quality due to randomness, and enhanced the concentration of local exploitation. Therefore, Prey-position-based Enhanced Guidance, one of the Siege-style Attacking-prey Strategies, is modeled in Equation (26).
where represents the th individual; represents the position of the food, which indicates the current optimal solution; is the step control factor, calculated as in Equation (6); is a random number in the range of [0, 1].
The entire Siege-style Attacking-prey Strategy is modeled below:
where is a random number in the range of [0, 1]; balance coefficient is set to 0.5.
7.4. Lens-Imaging Opposition-Based Learning
Opposition-Based Learning (OBL) is a concept proposed by Tizhoosh in 2005, which expands the search space by generating the ‘opposite solution’ of the current solution, thus facilitating global search. The fundamental idea of OBL is to map the current solution X to an opposite solution , which lies in the opposite region of the solution space (the relative opposite direction of the solution space). Lens Imaging Opposition-Based Learning (LIOBL) is an extension of OBL, further enhancing the effect of opposition-based learning by incorporating the concept of ‘lens imaging’, as shown in Figure 6 [30]. The figure illustrates how rays originating from the object are refracted through the lens to form an image. Compared to OBL, LIOBL introduces lens imaging during the generation of opposite solutions, which results in individuals with greater diversity, enhancing the coverage of the solution space and preventing the population from getting trapped in local optima.
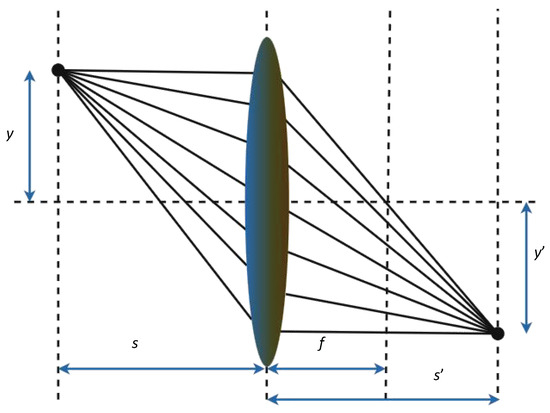
Figure 6.
The concept of lens imaging. In this schematic, s and represent the distances from the object and image to the lens, respectively, while f denotes the focal length of the lens. y is the height of the object, and is the height of the corresponding image.
In the RBMO, the Food Storage phase is relatively simple; it passively replaces the current solution with a previous one when the solution is poor. In practice, this leads to early convergence of the population, making it difficult to escape local optima. Furthermore, this strategy lacks the ability for comprehensive exploration of the solution space, hindering the discovery of better solutions. In contrast to the original Food Storage strategy, LIOBL is more forward-looking [30]. Therefore, we introduced the concept of LIOBL into the Food Storage phase. The improved Food Storage strategy consisted of two steps. Firstly, we calculated the opposite solutions by Equation (29).
where is the given solution; and are the upper and lower bounds of domain of definition, respectively; is the scaling factor of len imaging, which is set to 0.5.
Then, we needed to retain the better individuals through greedy meritocracy to the next generation of the population, increasing the proportion of elite individuals in the population, as shown in Equation (30).
where indicates the fitness value of , and indicates the fitness value of .
7.5. Time Complexity Analysis
For RBMO, let the initialization time complexity be . In each iteration, both food storage and position updates require operations, resulting in an overall per-iteration complexity of . After T iterations, the total computational cost can be expressed as:
Total Time Complexity 1 = Initialization + T ∗ (the total time complexity per iteration) = + T ∗ =
Similarly, for MRBMO, the initialization phase also has a complexity of . Within each iteration, food storage, LIOBL processing, and position updates each contribute , leading to the same per-iteration complexity of . After T iterations, the total computational cost is given by:
Total Time Complexity 2 = Initialization + T ∗ (the total time complexity per iteration) = + T ∗ =
In conclusion, both RBMO and MRBMO share the same overall time complexity of .
7.6. Worflow of MRBMO
The worflow of MRBMO is provided in Figure 7.
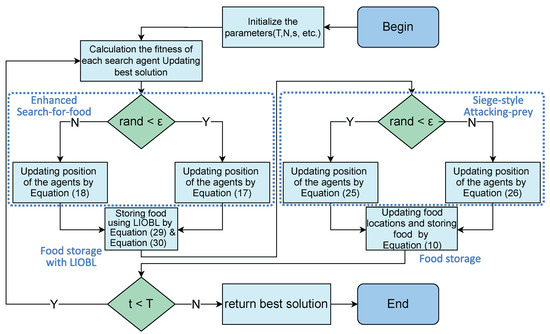
Figure 7.
Workflow of MRBMO. After executing the Enhanced Search-for-food strategy, MRBMO will implement the Enhanced Food Storage with LIOBL strategy to generate new solutions and retain better ones. Then, after executing the Siege-style Attacking Prey strategy, the original Food Storage strategy will be applied to retain better solutions.
8. Performance Test
The experimental environment for experiments was Windows 11 (64 bit), Intel(R) Core(TM) i5-8300H CPU @ 2.30 GHz, 8 GB running memory and the simulation platform is Matlab R2023a.
In order to validate the performance and effectiveness of MRBMO, the following four experiments were designed to test the algorithms on 23 classical benchmark functions and simulation experiment for engineering design optimization and antenna S-parameter optimization will be performed in the next chapter:
- Each of the four improvement strategies was removed from MRBMO and an ablation study was performed on the 23 classical benchmark functions in CEC2005 test suite in Table 2 [31].
 Table 2. Classical benchmark functions [31].
 - A qualitative analysis experiment was conducted to assess the performance, robustness, and exploration–exploitation balance of MRBMO across various benchmark functions. This evaluation focused on examining convergence behavior, population diversity, and the algorithm’s ability to balance exploration and exploitation in different problem types.
- MRBMO, traditional RBMO and other outstanding metaheuristic algorithms were examined on the classical benchmark functions with the dimension D = 30.
- MRBMO, traditional RBMO and other outstanding metaheuristic algorithms were examined on the classical benchmark functions with the higher dimensions D = 50 and D = 100.
8.1. Ablation Study
This paper designed an ablation study to evaluate the effectiveness of various improvement strategies on RBMO. We defined the following variants. MRBMO1 was the MRBMO which removes the Good Nodes Set initialization. MRBMO2 was the MRBMO which removes Enhanced Search-for-prey Strategy. MRBMO3 was the MRBMO which removes Siege-style Attacking-prey Strategy. And MRBMO4 was the MRBMO which removes LIOBL. To fairly compare the effectiveness of each strategy, we test these improved algorithms on 23 benchmark functions. We set the maximum iteration as T = 500 and the population size as N = 30. We ran each algorithm on the 23 functions for 30 iterations and the results are shown in Figure 8.
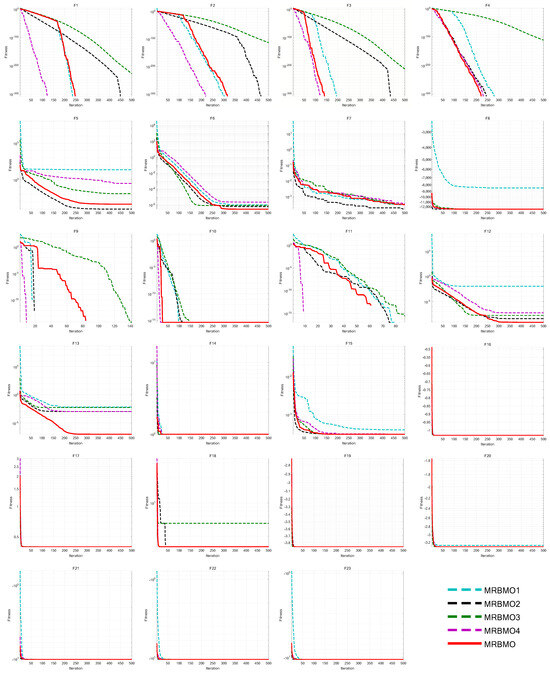
Figure 8.
Iteration curves for MRBMOs in ablation study.
Experimental results show that each improvement strategy significantly enhances RBMO’s performance. The Good Nodes Set Initialization distributed the population evenly in the solution space, improving quality and aiding in solving high-dimensional multi-modal functions like F5, F8, F12 and F13. As shown in F6, F7 and F13, the Enhanced Search-for-food Strategy sacrificed a slight reduction in convergence speed but improves the optimization ability for handling complex multi-modal functions. As shown in F1–F4 and F9–F13, the Siege-style Attacking-prey Strategy strengthened the exploitation phase, enhancing local search capability and convergence speed. Replacing the Food Storage mechanism with LIOBL allowed population updates post-development, increasing diversity while preserving elite individuals, which boosted exploration and reduced local optima entrapment.
8.2. Qualitative Analysis Experiment
In the qualitative analysis experiment, we applied MRBMO on the benchmark functions recorded in the search history of the red-billed blue magpie individuals, the exploration–exploitation percentage of MRBMO during the iterations and the population diversity of MRBMO, so that we could comprehensively evaluate the performance, robustness and exploration–exploitation balance of MRBMO in different types of problems.
In this experiment, the maximum number of iterations was set to T = 500 and the population size was N = 30. The search history of the red-billed blue magpie individuals, the proportions of exploration and exploitation, population diversity, and iteration curves were recorded and are presented in Figure 9, Figure 10, Figure 11 and Figure 12. From the figures, it is evident that the red-billed blue magpie individuals in MRBMO demonstrate a well-distributed search within the solution space, indicating the effectiveness of the Good Nodes Set Initialization. For F8, the global optimal solution was located in the upper-right corner of the solution space, posing significant challenges for the algorithm’s ability to escape local optima. The Siege-style Attacking-prey Strategy facilitated detailed exploration around the region with the potential solution, ultimately leading to the identification of the optimal solution for F8. Additionally, the introduction of Levy flight allowed MRBMO to consistently escape local optima and maintain high population diversity, even when addressing complex combinatorial problems such as F15–F23. For uni-modal functions, the results showed that the exploitation proportion of MRBMO increased rapidly during the iterative process, demonstrating strong exploitation capabilities. For complex functions like F7, F8 and F15, the exploration proportion decreased gradually in the early iterations, reflecting MRBMO’s robust global exploration ability. In the later stages of the iterations, the exploitation proportion increased significantly, indicating strong local exploitation capabilities.
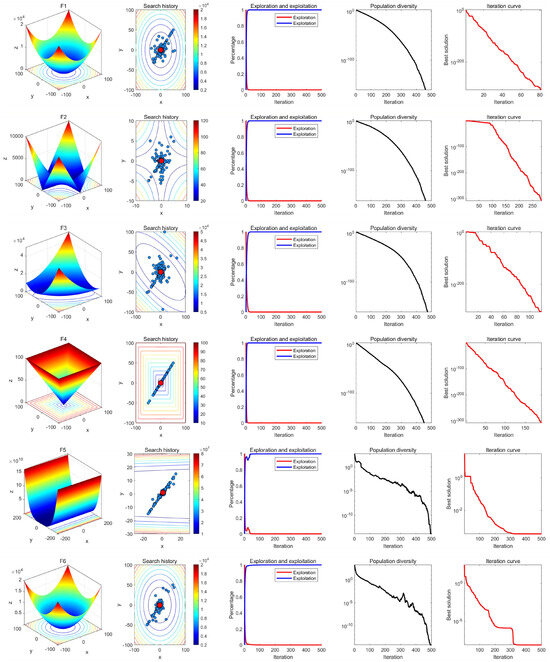
Figure 9.
Results of MRBMO in qualitative analysis experiment (F1–F6).
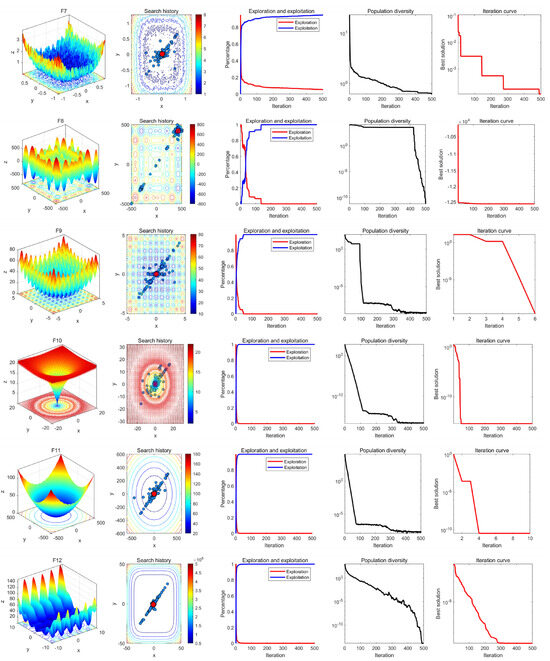
Figure 10.
Results of MRBMO in qualitative analysis experiment (F7–F12).
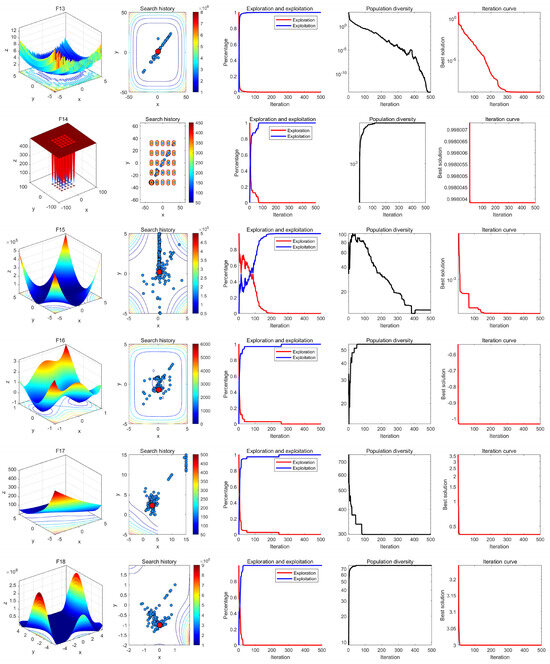
Figure 11.
Results of MRBMO in qualitative analysis experiment (F13–F18).
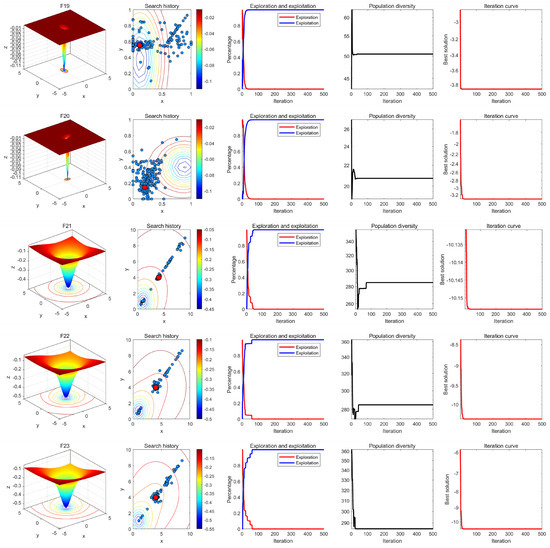
Figure 12.
Results of MRBMO in qualitative analysis experiment (F19–F23).
8.3. Superiority Comparative Test with Dimension D = 30
To further verify the superiority of MRBMO, we selected Attraction-Repulsion Optimization Algorithm (AROA) [32], Grey Wolf Optimizer (GWO) [33], Rime Optimization Algorithm (RIME) [34], Whale Optimization Algorithm (WOA) [6], Remora Optimization Algorithm [35], Harris Hawks Optimization (HHO) [7], MSWOA [36], MWOA [37], and RBMO for superiority comparative experiments. The parameter configurations for all algorithms are listed in Table 3. The population size was set to , and the number of iterations to . Each algorithm was executed independently 30 times. For performance evaluation, the average fitness (Ave), standard deviation (Std), p-values from the Wilcoxon rank-sum test, and Friedman rankings across the 30 runs were recorded. The corresponding results are displayed in Figure 13 and Table 4 and Table 5.

Table 3.
Parameter configurations for different algorithms.
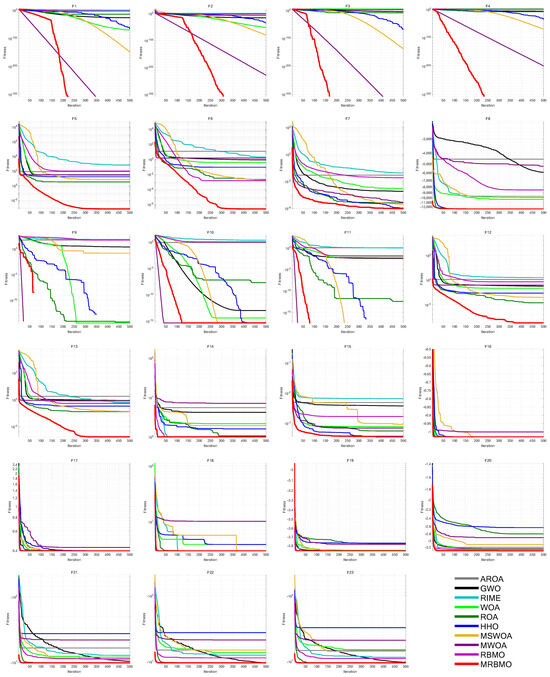
Figure 13.
Iteration curves for each algorithm in superiority comparative test.

Table 4.
Parametric results (Ave and Std) of each algorithm in superiority test with D = 30.

Table 5.
Ranking of non-parametric tests of different algorithms. ‘Rank’ refers to the ranking of the Average Friedman Value for ten metaheuristic algorithms. ‘+/=/−’ refers to the result of the Wilcoxon rank-sum test.
From the experiment results, it could be seen that MRBMO converged to the optimal value on most functions, with a standard deviation of zero or close to zero, demonstrating strong stability, robustness and optimization capabilities. For problems like F5–F8 and F20–F23, which were prone to local optima, the Good Nodes Set initialization allowed the population of MRBMO to be evenly distributed in the solution space, significantly improving the population quality. As a result, MRBMO could escape local optima and achieve better solutions for these types of problems. The incorporation of Enhanced Search-for-food Strategy and Siege-style Attacking-prey Strategy contributed to higher accuracy in solving complex problem like F5–F6 and F12–F13. Siege-style Attacking-prey Strategy helped MRBMO achieve higher convergence speed and accuracy, enabling MRBMO to find the optimal solutions for F1–F4 and F9–F11 within a limited number of iterations.
In non-parametric tests, the statistical results, as shown in Table 5, indicated that most p-values from Wilcoxon rank-sum tests were less than 0.05, suggesting significant differences between the optimization results of MRBMO and the nine comparison algorithms. On F1 and F3, there was no significant difference between MRBMO and MWOA. On F9–F11, there was no significant difference between MRBMO and HHO, MSWOA and MWOA. They all found the optimal solutions within a limited number of iterations when solving these functions. There was no significant difference between MRBMO and RBMO on F17 and F19, because MRBMO not only found the optimal solutions for complex functions F16–F19 every time but also had a standard deviation equal to or slightly smaller than that of RBMO. This indicated that MRBMO, while maintaining RBMO’s ability to solve complex functions, also achieved faster convergence speed and higher accuracy. And there is a significant difference between MRBMO and the rest of the algorithms (AROA, GWO, RIME, WOA and ROA). This experiment further corroborated the reliability of the Superiority Test. According to these results, MRBMO ranked first in terms of the average Friedman value among the ten algorithms, indicating its superior performance. This consistent performance across multiple functions highlighted the effectiveness and robustness of MRBMO.
8.4. Superiority Comparative Test with High Dimensions of 50 and 100
Among the 23 classical benchmark functions, F1–F13 are scalable in dimensionality, whereas F14–F23 are defined with fixed dimensions. To assess MRBMO’s capability in solving problems of varying dimensionality and complexity, the dimensions of the scalable functions (F1–F13) were extended to 50 and 100, while the fixed-dimension functions (F14–F23) remained unchanged. MRBMO was evaluated against AROA, GWO, RIME, WOA, ROA, HHO, MSWOA, MWOA, and RBMO on these benchmarks under two high-dimensional settings: and . All algorithm parameters are summarized in Table 3, with the population size and iteration count set to and , respectively. Each algorithm was independently executed 30 times on each function. Performance was analyzed using the Wilcoxon rank-sum test (p-values) and Friedman rankings, and the results are presented in Table 6.

Table 6.
Results of non-parametric tests of different algorithms in higher dimensions. ‘Rank’ refers to the ranking of the Average Friedman Value for ten metaheuristic algorithms. ‘+/=/−’ refers to the result of the Wilcoxon rank-sum test.
The findings demonstrate that MRBMO exhibits strong performance in high-dimensional optimization tasks, outperforming several competing algorithms in comparative evaluations. As shown in Table 6, in the experiments with dimensions of 50 and 100, MRBMO achieved first place in the Friedman ranking. Moreover, in the Wilcoxon rank-sum test, there was a significant difference between MRBMO and other metaheuristic algorithms at the dimensions of 50 and 100. This provided sufficient evidence to demonstrate that MRBMO still possessed strong optimization capability when handling optimization problems of different dimensions, and it showed a strong competitive edge compared to other excellent basic metaheuristic algorithms.
Table 7 presents a comprehensive comparison of MRBMO against competing algorithms using the metric known as overall effectiveness (OE). In this table, w, t, and l, respectively, represent the number of wins, ties, and losses. The OE for each method is determined using Equation (31) [38].
where N denotes the total number of evaluations, and L indicates the number of times an algorithm underperformed (i.e., losses).

Table 7.
OE of MRBMO and other SOTA algorithms.
Achieving an OE score of 95.65%, MRBMO emerged as the most effective among the evaluated approaches. Moreover, MRBMO demonstrated strong competitiveness when compared with state-of-the-art (SOTA) methods across benchmark problems of varying dimensions. These findings confirm the robustness and adaptability of MRBMO in addressing optimization challenges across different problem scales.
9. Simulation Experiments
To validate the ability of MRBMO to solve real-world problems, we used four engineering design optimization problems to test the performance of MRBMO, in order to verify the effectiveness and applicability of MRBMO in engineering design optimization. We also used an antenna S-parameter optimization test suite to test the performance of MRBMO, in order to quickly validate the effectiveness and applicability of MRBMO in antenna S-parameter optimization.
9.1. Engineering Design Optimization
To manage constraints in the engineering design optimization process, we adopted a transformation strategy based on the Penalty Function approach. This technique reformulates the original problem by embedding constraint violations directly into the objective function through additional penalty terms. As a result, the constrained problem is converted into an unconstrained one, facilitating its resolution. Whenever a decision variable breaches a given constraint, a high cost is incurred in the modified objective, effectively steering the optimization algorithm toward feasible regions of the search space.
9.1.1. Pressure Vessel Design
The structural configuration of the pressure vessel is illustrated in Figure 14, featuring sealed ends enclosed by caps [14], with one cap being hemispherical in shape. In this design, and denote the thicknesses of the cylindrical body and the end cap, respectively. The variable corresponds to the inner diameter of the cylindrical section, while specifies its length, excluding the hemispherical head. These four parameters—, , , and —serve as the decision variables in the optimization of the vessel. The objective function, along with the associated four design constraints, is formulated as follows:
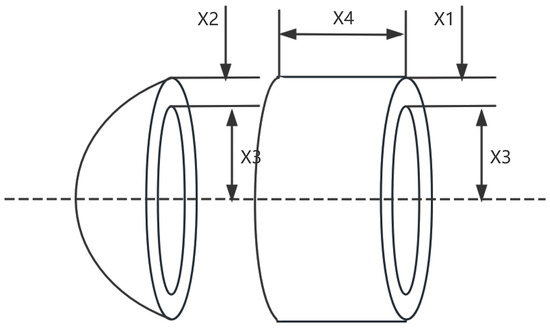
Figure 14.
The structure of a pressure vessel.
- Variable:
- Minimize:
- Subject to:
- Variable range:where:
In this work, we benchmarked the performance of MRBMO against several established metaheuristic algorithms, including the Attraction-Repulsion Optimization Algorithm (AROA) [32], Grey Wolf Optimizer (GWO) [33], Rime Optimization Algorithm (RIME) [34], Whale Optimization Algorithm (WOA) [6], Remora Optimization Algorithm [35], Harris Hawks Optimization (HHO) [7], as well as enhanced variants such as MSWOA [36], MWOA [37], and RBMO. A consistent experimental setup was maintained, with all algorithms configured as outlined in Table 3. The number of iterations was fixed at T = 500, and the population size was set to N = 30. To ensure statistical robustness, each method was independently executed 30 times on the pressure vessel design task. The performance metrics, including average fitness (Ave) and standard deviation (Std), were recorded for evaluation. Experimental outcomes are presented in Figure 15 and Table 8.
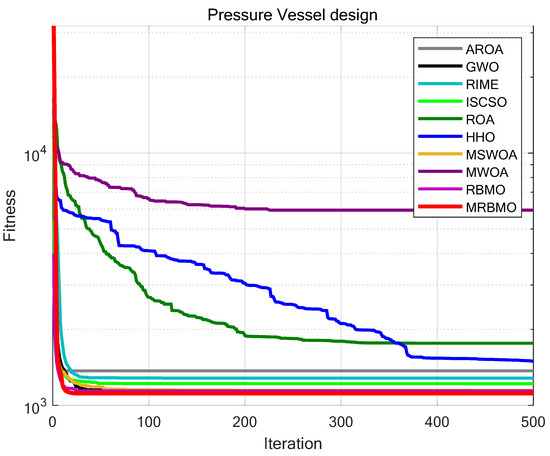
Figure 15.
Iteration curves of the algorithms in pressure vessel design.

Table 8.
Results of different algorithms on various engineering design optimization problems.
As can be observed from Table 8, MRBMO consistently outperformed other methods in terms of both accuracy and stability on the pressure vessel design task. These results underscore MRBMO’s effectiveness in solving such engineering optimization problems.
9.1.2. Piston Lever Design
The piston lever, illustrated in Figure 16, represents a representative case in classical engineering optimization problems [14]. Its design process involves tuning several geometric and mechanical variables to reduce material usage or structural mass, while adhering to constraints such as mechanical strength and stability. The goal is to strike an optimal trade-off between cost-effectiveness and structural integrity, making this problem highly relevant in fields like mechanical system design, automotive engineering, and other industrial applications focused on lightweight, high-performance components.
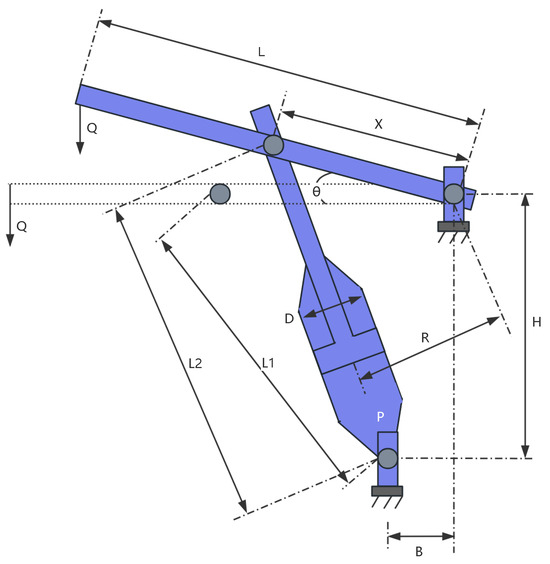
Figure 16.
The structure of a piston lever.
In this context, the optimization objective is to minimize the material consumption of the piston lever, subject to constraints that ensure sufficient load-bearing capacity and functional reliability. The structure is characterized by a set of design variables that define critical geometric relationships and determine its overall performance. In this optimization task, the piston lever comprises several interconnected structural components with the following key attributes; one end is anchored, while the opposite end experiences an external load. Its mechanical behavior is significantly affected by geometric parameters such as radius and length, with each of these features being regulated by specific decision variables. According to the geometric configuration, the variables to are defined as follows. and represent the primary dimensions—length and width—of the structure, which shape the overall lever arm. denotes the radius of the cross-section at the force application point, influencing the distribution of stress. corresponds to a dimensional parameter associated with the support location.
The optimization goal in the Piston Lever design task is formulated as follows:
- Variable:
- Minimize:
- Subject to:
- Variable range:where:
This study compared MRBMO with Attraction-Repulsion Optimization Algorithm (AROA) [32], Grey Wolf Optimizer (GWO) [33], Rime Optimization Algorithm (RIME) [34], Whale Optimization Algorithm (WOA) [6], Remora Optimization Algorithm [35], Harris Hawks Optimization (HHO) [7], MSWOA [36], MWOA [37] and RBMO. The configuration of each algorithm is listed in Table 3. To ensure fairness, the iteration count was consistently set to T = 500, and the population size was fixed at N = 30. All algorithms were executed 30 times independently on the piston lever optimization task. For performance evaluation, the average fitness (Ave) and standard deviation (Std) were collected. The corresponding results are depicted in Figure 17 and detailed in Table 8. As evidenced by Table 8, MRBMO outperformed the other methods in terms of both optimization precision and result stability, showcasing its strong effectiveness in addressing such engineering design challenges.
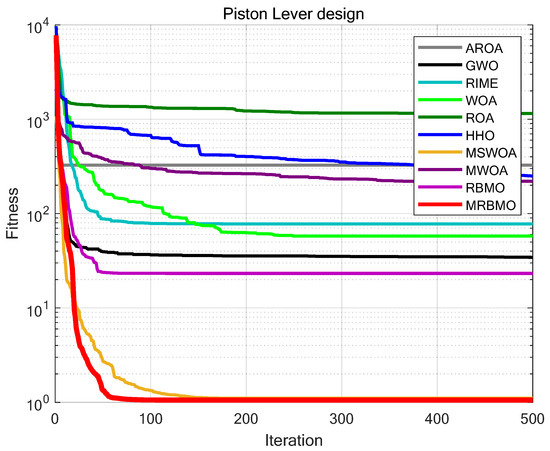
Figure 17.
Iteration curves of the algorithms in piston lever design problem.
9.1.3. Robot Gripper Design
The robot gripper design problem is a classic engineering optimization problem, widely applied in industrial automation, medical robotics, and logistics. The goal is to maximize gripping performance or minimize material usage under the constraints of gripping force range, structural requirements, and geometric stability, thereby optimizing the structural efficiency and cost-effectiveness of the robot gripper. Figure 18 is the structure of a robot gripper [14].
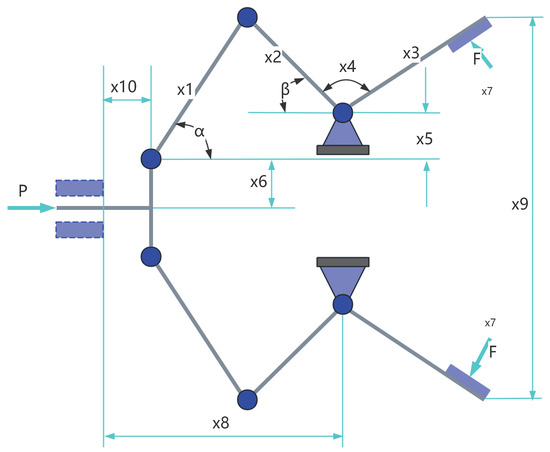
Figure 18.
The structure of a robot gripper.
The robot gripper involves several critical parameters related to geometry, mechanics, and motion. , , , are geometric parameters of the gripper; is the force applied to the gripper; is the length of the gripper; is the angular offset of the gripper.
The objective function of the Robot Gripper design problem can be described as:
- Variable:
- Minimize:
- Subject to:
- Variable range:where:
When Flag = 1, calculate the grabbing force:
When Flag = 2, calculate the applied force:
This study compared MRBMO with Attraction-Repulsion Optimization Algorithm (AROA) [32], Grey Wolf Optimizer (GWO) [33], Rime Optimization Algorithm (RIME) [34], Whale Optimization Algorithm (WOA) [6], Remora Optimization Algorithm [35], Harris Hawks Optimization (HHO) [7], MSWOA [36], MWOA [37] and RBMO. The parameter configurations for all algorithms are summarized in Table 3. For consistency across experiments, the number of iterations was set to , and the population size was maintained at . Each algorithm was independently run 30 times on the robot gripper design task, with the average fitness (Ave) and standard deviation (Std) recorded for comparative analysis. The corresponding results are displayed in Figure 19 and Table 8.
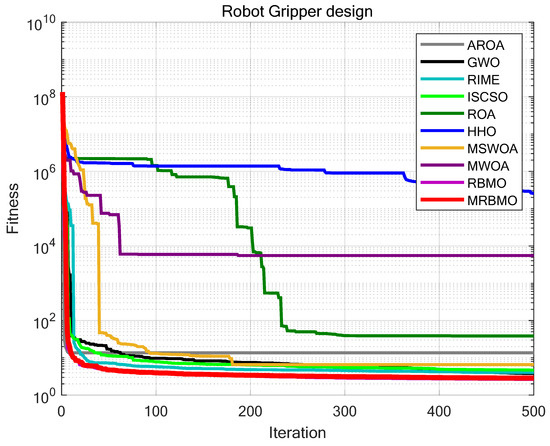
Figure 19.
Iteration curves of the algorithms in Robot Gripper design problem.
As shown in Table 8, MRBMO exhibited notably better performance than the other methods in terms of both solution accuracy and robustness in the Robot Gripper design scenario, highlighting its strong capability in solving such engineering optimization problems.
9.1.4. Industrial Refrigeration System Design
The industrial refrigeration system optimization problem aims to reduce both energy usage and operational cost while maintaining effective cooling capability, as depicted in Figure 20 [14]. The task involves determining the optimal configuration of system elements—such as compressors, condensers, and evaporators—to ensure minimal cost and maximum thermal efficiency. This problem encompasses fourteen decision variables: compressor powers (, ), refrigerant flow and mass rates (–), design parameters of the condenser and evaporator (, ), compression characteristics (, ), temperature-related parameters (, ), and flow control variables (, ). In detail, and define the cooling output via compressor power; to characterize the movement of refrigerant through key system units; and correspond to size attributes of the condenser and evaporator; and describe compression level and efficiency; and adjust the heat exchange temperature gradient; and , regulate coolant or refrigerant flow rates, which critically influence overall system effectiveness. The formal mathematical formulation of this problem is provided below.
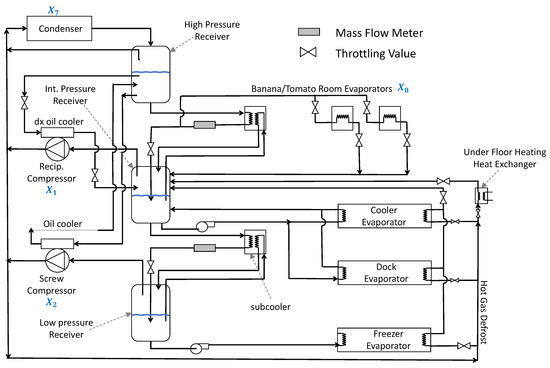
Figure 20.
The structure of an industrial refrigeration system.
- Variable:
- Minimize:
- Subject to:where:
- Variable range:
A comparative test was also conducted between MRBMO and Attraction-Repulsion Optimization Algorithm (AROA) [32], Grey Wolf Optimizer (GWO) [33], Rime Optimization Algorithm (RIME) [34], Whale Optimization Algorithm (WOA) [6], Remora Optimization Algorithm [35], Harris Hawks Optimization (HHO) [7], MSWOA [36], MWOA [37] and RBMO. The parameter configurations for all algorithms are detailed in Table 3. Each algorithm was executed for 30 independent trials, with a maximum of T = 500 iterations and a population size of N = 30. The results, shown in Figure 21 and Table 8, reveal that MRBMO consistently avoids local optima, continually improving the solution even when other algorithms stagnated in sub-optimal regions. Compared to other methods, MRBMO demonstrated superior accuracy and stability in its search for optimal solutions. Thus, MRBMO stands out as a robust and effective optimization approach for complex design problems.
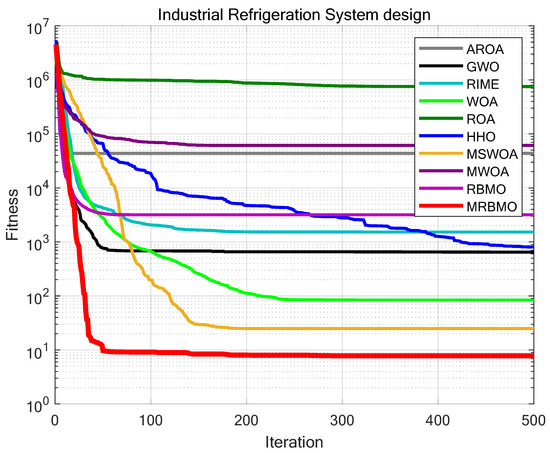
Figure 21.
Iteration curves of the algorithms in Industrial Refrigeration System design problem.
9.2. Antenna S-Parameter Optimization
The optimization of antenna S-parameters (scattering parameters) is a critical aspect of the design of wireless communication systems, radar, and other electronic devices, serving as a key factor in ensuring the efficient operation of wireless systems. S-parameters describe the reflection and transmission characteristics of antennas, primarily including (reflection coefficient) and (transmission coefficient). Optimizing these parameters can enhance antenna performance, reduce signal loss, and improve radiation efficiency. Metaheuristic algorithms are capable of finding optimal or near-optimal solutions within complex design spaces. When integrated with electromagnetic simulation software, they create an iterative optimization workflow. Designers can effectively optimize the S-parameters of antennas, thereby enhancing their performance and reliability, by selecting appropriate algorithms, configuring suitable parameters, and utilizing relevant objective functions. However, validating the suitability of algorithms for optimizing antenna S-parameters through simulation can be time-consuming and resource-intensive. Therefore, Zhen Zhang et al. developed a benchmark test suite for antenna S-parameter optimization [39] to intuitively and rapidly assess the performance of metaheuristic algorithms in antenna design. This benchmark suite simulates the characteristics of electromagnetic simulations and addresses common antenna issues, ranging from single antennas to multiple antennas, thereby tackling the structural design challenges for both types. They demonstrated that the test suite they proposed has the same effect as the electromagnetic simulation of antenna S-parameters, that is, if an algorithm performs well on the test suite, it is suitable for antenna S-parameter optimization. The benchmark functions of the test suite are detailed below and Figure 22 is the landscapes of the functions. More details of the benchmark functions of the Antenna S-parameter Optimization test suite are listed in Table A1.
where is a uni-modal function characterized by a rose-shaped valley, with a minimum value of 0 and a dimension of 8. It is continuous, differentiable, and non-separable for single antenna optimization.
where is a uni-modal function with a steep narrow valley, having a minimum value of 0 and a dimension of 8. It is continuous, differentiable, separable, and scalable, for multi-antenna design optimization.
where is a uni-modal function featuring a long narrow valley, with a minimum value of 0 and a dimension of 8. It is continuous, differentiable, separable, and scalable, for both single and multiple antenna optimization.
where is a uni-modal function characterized by steep and banana-shaped curved valleys, with a minimum value of 0 and a dimension of 8. It is continuous, differentiable, non-separable, and scalable, for multi-antenna design optimization.
where is a multi-modal function with long narrow valleys, having a minimum value of 0 and a dimension of 2. It is continuous, non-differentiable, non-separable, and non-scalable, for multi-antenna design optimization.
where is a multi-modal function with long narrow valleys that intersect, featuring a minimum value of 0 and a dimension of 8. It is continuous, scalable, non-differentiable, and non-separable, for multi-antenna optimization.
where is a multi-modal compositional function with long narrow and intersecting valleys, with a minimum value of 0 and a dimension of 8. It is continuous, non-differentiable, non-separable, and scalable, for multi-antenna design optimization.
where is a multi-modal function characterized by long narrow and intersecting valleys, with a minimum value of 0 and a dimension of 8. It is continuous, non-differentiable, non-separable, and scalable, for multi-antenna optimization.
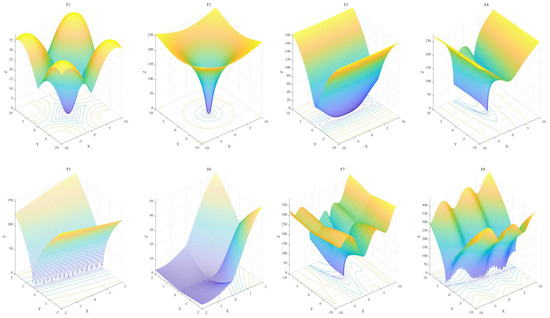
Figure 22.
Landscapes of eight benchmark functions in the Antenna S-parameter Optimization test suite.
We employed a set of algorithms, including the Attraction-Repulsion Optimization Algorithm (AROA) [32], Grey Wolf Optimizer (GWO) [33], Rime Optimization Algorithm (RIME) [34], Whale Optimization Algorithm (WOA) [6], Remora Optimization Algorithm [35], Harris Hawks Optimization (HHO) [7], MSWOA [36], MWOA [37], RBMO, and MRBMO, to assess their effectiveness in antenna S-parameter optimization tasks using a benchmark suite. For consistency, all tests were conducted with a fixed iteration count of T = 500 and a population size of N = 30. Each method was independently run 30 times on eight benchmark functions, and metrics such as average fitness (Ave), standard deviation (Std), Wilcoxon rank-sum test p-values, and Friedman test results were collected to evaluate performance.
According to the outcomes presented in Figure 23 and Table 9 and Table 10, MRBMO demonstrated outstanding performance in the antenna S-parameter optimization task, achieving significantly better results than other state-of-the-art algorithms. MRBMO exhibited rapid convergence speeds and high accuracy across many functions. In particular, MRBMO showcased robust optimization capabilities in the benchmark functions. In F2, F3, and F6, similar to most other SOTA algorithms, MRBMO was able to converge to the optimal solution at a relatively fast speed when solving these three functions. Notably, in F1, F5, and F8, compared to other SOTA algorithms, MRBMO converged to the optimal solution within a limited number of iterations. In F4 and F7, when other algorithms got stuck in local optima, MRBMO effectively escaped the local optimum and continued to find better solutions. Additionally, the Wilcoxon rank-sum test and Friedman test confirm that MRBMO’s performance in various aspects was significantly superior to that of the other algorithms, highlighting its overall excellence. MRBMO, with overall effectiveness of 100%, was the most effective algorithm. The results revealed the ability of MRBMO to solve antenna S-parameter optimization problems (Table 11).
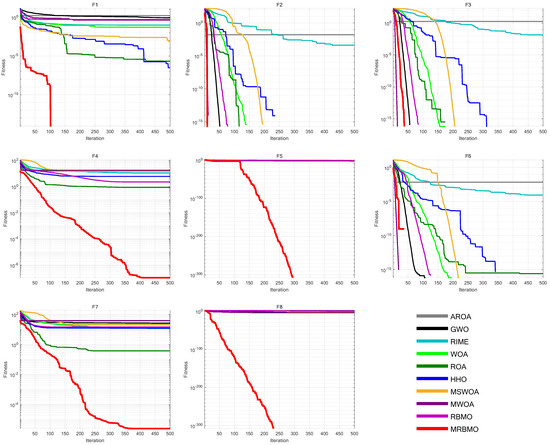
Figure 23.
Iteration curves of the algorithms in antenna S-parameter optimization.

Table 9.
Parametric results (Ave and Std) of each algorithm in antenna S-parameter optimization.

Table 10.
Results of non-parametric tests of different algorithms in antenna S-parameter optimization. ‘Rank’ refers to the ranking of the Average Friedman Value for ten metaheuristic algorithms. ‘+/=/−’ refers to the result of the Wilcoxon rank-sum test.

Table 11.
Effectiveness of MRBMO and other SOTA algorithms in antenna S-parameter optimization.
10. Discussion
We conducted a series of experiments using benchmark functions, including unimodal, multimodal, and composite functions, to assess the performance of MRBMO. These experiments validated the efficacy of MRBMO across various problem types. In the ablation study, we evaluated the effectiveness of each improvement strategy embedded in MRBMO. Qualitative analyses were also carried out to examine its search dynamics, including the balance between exploitation and exploration, as well as the maintenance of population diversity. The experimental results demonstrated that MRBMO effectively explored the solution space and was capable of locating global or near-global optima. Exploitation–exploration ratio curves showed that MRBMO maintained a balanced search process, while population diversity analyses confirmed its ability to avoid premature convergence.
When compared with several state-of-the-art (SOTA) metaheuristic algorithms, MRBMO exhibited superior performance in terms of convergence speed and solution accuracy. It also demonstrated strong robustness and adaptability across different problem dimensions (30, 50, and 100). Furthermore, in engineering simulations, MRBMO achieved the best results on four real-world engineering design problems and the antenna S-parameter optimization task, underscoring its effectiveness and practical potential. In the engineering design optimization simulations, MRBMO achieved the lowest average fitness and standard deviation compared to other advanced metaheuristic algorithms. This indicated that MRBMO was capable of effectively identifying optimal or near-optimal solutions within the given number of iterations. In the antenna S-parameter optimization tasks, MRBMO continued to demonstrate significant superiority. In most cases, MRBMO was able to locate the global optimum even when other competitive metaheuristic algorithms were trapped in local optima. These results confirmed that MRBMO remained a highly effective and recommended optimizer in the domain of antenna S-parameter optimization.
However, MRBMO is not without limitations. The algorithm involved multiple parameters whose improper configuration could affect performance, indicating a certain degree of parameter sensitivity. Additionally, although MRBMO exhibited strong global search ability, it might still face challenges when dealing with extremely high-dimensional or dynamically changing environments. In terms of computational cost, while MRBMO maintained reasonable runtime in benchmark tests, its complexity increased with problem size due to the multi-phase structure.
In future research, we aim to further explore the parameter sensitivity of MRBMO and develop adaptive parameter control strategies to enhance robustness. Moreover, computational efficiency can be improved through parallelization or lightweight strategies. We also plan to evaluate MRBMO using real-world prototypes of mechanical components and antenna systems, integrating more practical constraints into the optimization process. Potential application domains include combinatorial optimization (e.g., TSP), financial modeling, and neural network hyperparameter tuning. Ultimately, MRBMO is expected to serve as a reliable and effective tool for engineering optimization, simulation, and design.
Author Contributions
Conceptualization, J.W., B.L. and Z.X.; methodology, J.W.; software, J.W.; validation, J.W.; formal analysis, Y.Y.; investigation, Z.L.; resources, N.C.; data curation, R.Z., B.L. and S.P.; writing—original draft preparation, J.W.; writing—review and editing, Y.C., J.W. and N.C.; visualization, J.W. and Y.G.; supervision, N.C. and Y.C.; project administration, B.L.; funding acquisition, N.C. All authors have read and agreed to the published version of the manuscript.
Funding
Our research, including the article processing charges (APC), was supported by Macao Polytechnic University under Grant no: RP/FCA-06/2022 and the Macao Science and Technology Development Fund through Grant no: 0044/2023/ITP2.
Data Availability Statement
The original contributions presented in the study are included in the article, further inquiries can be directed to the corresponding author.
Acknowledgments
We gratefully acknowledge the financial support from Macao Polytechnic University (MPU Grant no: RP/FCA-06/2022) and the Macao Science and Technology Development Fund (FDCT Grant no: 0044/2023/ITP2). These contributions were instrumental in facilitating various aspects of the study, including data acquisition, result analysis, and resource procurement. The generous funding from MPU and FDCT played a vital role in enhancing the overall quality and depth of our research.
Conflicts of Interest
The authors declare no conflicts of interest.
Abbreviations
The following abbreviations are used in this manuscript:
| Ave | Average fitness |
| Std | Standard deviation |
| OE | overall effectiveness |
Appendix A. Table
Appendix A.1. Details of the Benchmark Functions
The benchmark function models have been made available on Figshare. The specific modeling details for the Standard Benchmark Functions with D = 30 can be accessed via the following link: https://doi.org/10.6084/m9.figshare.28440863, intended solely for readers’ reference and in-depth examination.
Appendix A.2. Details of the Antenna S-Parameter Optimization Test Suit

Table A1.
Benchmark functions in Antenna S-parameter Optimization test suit.
Table A1.
Benchmark functions in Antenna S-parameter Optimization test suit.
| Function | Type | Dimension | Boundaries | |
|---|---|---|---|---|
| F1 | uni-modal | 8 | 0 | [−100, 100] |
| F2 | uni-modal | 8 | 0 | [−50, 50] |
| F3 | uni-modal | 8 | 0 | [−30, 30] |
| F4 | uni-modal | 8 | 0 | [−10, 10] |
| F5 | Multi-modal | 2 | 0 | [−5, 5] |
| F6 | Multi-modal | 8 | 0 | [−5, 5] |
| F7 | Compositional | 8 | 0 | [−20, 20] |
| F8 | Compositional | 8 | 0 | [−50, 50] |
References
- Laarhoven, P.J.M.V.; Aarts, E.H.L.; Laarhoven, P.J.M.V. Simulated Annealing; Springer: Dordrecht, The Netherlands, 1987. [Google Scholar]
- Holland, J.H. Genetic algorithms. Sci. Am. 1992, 267, 66–73. [Google Scholar] [CrossRef]
- Dorigo, M.; Birattari, M.; Stutzle, T. Ant colony optimization. IEEE Comput. Intell. Mag. 2006, 1, 28–39. [Google Scholar] [CrossRef]
- Kennedy, J.; Eberhart, R. Particle swarm optimization. In Proceedings of the ICNN’95-International Conference on Neural Networks, Perth, WA, Australia, 27 November–1 December 1995; Volume 4, pp. 1942–1948. [Google Scholar]
- Das, S.; Suganthan, P.N. Differential evolution: A survey of the state-of-the-art. IEEE Trans. Evol. Comput. 2010, 15, 4–31. [Google Scholar] [CrossRef]
- Mirjalili, S.; Lewis, A. The whale optimization algorithm. Adv. Eng. Softw. 2016, 95, 51–67. [Google Scholar] [CrossRef]
- Heidari, A.A.; Mirjalili, S.; Faris, H.; Aljarah, I.; Mafarja, M.; Chen, H. Harris hawks optimization: Algorithm and applications. Future Gener. Comput. Syst. 2019, 97, 849–872. [Google Scholar] [CrossRef]
- Zhong, C.; Li, G.; Meng, Z. Beluga whale optimization: A novel nature-inspired metaheuristic algorithm. Knowl.-Based Syst. 2022, 251, 109215. [Google Scholar] [CrossRef]
- Jia, H.; Rao, H.; Wen, C.; Mirjalili, S. Crayfish optimization algorithm. Artif. Intell. Rev. 2023, 56 (Suppl. S2), 1919–1979. [Google Scholar] [CrossRef]
- Xiong, G.; Zhang, J.; Shi, D.; He, Y. Parameter extraction of solar photovoltaic models using an improved whale optimization algorithm. Energy Convers. Manag. 2018, 174, 388–405. [Google Scholar] [CrossRef]
- Shen, Y.; Zhang, C.; Gharehchopogh, F.S.; Mirjalili, S. An improved whale optimization algorithm based on multi-population evolution for global optimization and engineering design problems. Expert Syst. Appl. 2023, 215, 119269. [Google Scholar] [CrossRef]
- Li, Y.; Zhao, L.; Wang, Y.; Wen, Q. Improved sand cat swarm optimization algorithm for enhancing coverage of wireless sensor networks. Measurement 2024, 233, 114649. [Google Scholar] [CrossRef]
- Wei, J.; Gu, Y.; Law, K.L.E.; Cheong, N. Adaptive Position Updating Particle Swarm Optimization for UAV Path Planning. In Proceedings of the 2024 22nd International Symposium on Modeling and Optimization in Mobile, Ad Hoc, and Wireless Networks (WiOpt), Seoul, Republic of Korea, , 21–24 October 2024; pp. 124–131. [Google Scholar]
- Wei, J.; Gu, Y.; Yan, Y.; Li, Z.; Lu, B.; Pan, S.; Cheong, N. LSEWOA: An Enhanced Whale Optimization Algorithm with Multi-Strategy for Numerical and Engineering Design Optimization Problems. Sensors 2025, 25, 2054. [Google Scholar] [CrossRef] [PubMed]
- Fu, S.; Li, K.; Huang, H.; Ma, C.; Fan, Q.; Zhu, Y. Red-billed blue magpie optimizer: A novel metaheuristic algorithm for 2D/3D UAV path planning and engineering design problems. Artif. Intell. Rev. 2024, 57, 134. [Google Scholar] [CrossRef]
- Adegboye, O.R.; Feda, A.K.; Ishaya, M.M.; Agyekum, E.B.; Kim, K.C.; Mbasso, W.F.; Kamel, S. Antenna S-parameter optimization based on golden sine mechanism based honey badger algorithm with tent chaos. Heliyon 2023, 9, e21596. [Google Scholar] [CrossRef]
- Park, E.; Lee, S.R.; Lee, I. Antenna placement optimization for distributed antenna systems. IEEE Trans. Wirel. Commun. 2012, 11, 2468–2477. [Google Scholar] [CrossRef]
- Jiang, F.; Chiu, C.Y.; Shen, S.; Cheng, Q.S.; Murch, R. Pixel antenna optimization using NN-port characteristic mode analysis. IEEE Trans. Antennas Propag. 2020, 68, 3336–3347. [Google Scholar] [CrossRef]
- Karthika, K.; Anusha, K.; Kavitha, K.; Geetha, D.M. Optimization algorithms for reconfigurable antenna design: A review. In Advances in Microwave Engineering; CRC Press: Boca Raton, FL, USA, 2024; pp. 85–103. [Google Scholar]
- Cai, J.; Wan, H.; Sun, Y. Artificial bee colony algorithm-based self-optimization of base station antenna azimuth and down-tilt angle. Telecommun. Sci. 2021, 1, 69–75. [Google Scholar]
- Peng, F.; Chen, X. An antenna optimization framework based on deep reinforcement learning. IEEE Trans. Antennas Propag. 2024, 72, 7594–7605. [Google Scholar] [CrossRef]
- Martins, J.R.R.A.; Ning, A. Engineering Design Optimization; Cambridge University Press: Cambridge, UK, 2021. [Google Scholar]
- Salih, S.Q.; Alsewari, A.R.A.; Yaseen, Z.M. Pressure vessel design simulation: Implementing of multi-swarm particle swarm optimization. In Proceedings of the 2019 8th International Conference on Software and Computer Applications, Penang, Malaysia, 19–21 February 2019; pp. 120–124. [Google Scholar]
- Dandagwhal, R.D.; Kalyankar, V.D. Design optimization of rolling element bearings using advanced optimization technique. Arab. J. Sci. Eng. 2019, 44, 7407–7422. [Google Scholar] [CrossRef]
- Wei, J.; Gu, Y.; Lu, B.; Cheong, N. RWOA: A novel enhanced whale optimization algorithm with multi-strategy for numerical optimization and engineering design problems. PLoS ONE 2025, 20, e0320913. [Google Scholar] [CrossRef]
- Nadimi-Shahraki, M.H.; Taghian, S.; Mirjalili, S. An improved grey wolf optimizer for solving engineering problems. Expert Syst. Appl. 2021, 166, 113917. [Google Scholar] [CrossRef]
- Agushaka, J.O.; Ezugwu, A.E.; Saha, A.K.; Pald, J.; Abualigahe, L.; Mirjalilii, S. Greater cane rat algorithm (GCRA): A nature-inspired metaheuristic for optimization problems. Heliyon 2024, 10, e31629. [Google Scholar] [CrossRef] [PubMed]
- Xiao, C.; Cai, Z.; Wang, Y. A good nodes set evolution strategy for constrained optimization. In Proceedings of the 2007 IEEE Congress on Evolutionary Computation, Singapore, 25–28 September 2007; pp. 943–950. [Google Scholar]
- Wei, J.; Gu, Y.; Xie, Z.; Yan, Y.; Lu, B.; Li, Z.; Cheong, N. LSWOA: An enhanced whale optimization algorithm with Levy flight and Spiral flight for numerical and engineering design optimization problems. PLoS ONE 2025, 20, e0322058. [Google Scholar] [CrossRef]
- Yu, F.; Guan, J.; Wu, H.; Chen, Y.; Xia, X. Lens imaging opposition-based learning for differential evolution with cauchy perturbation. Appl. Soft Comput. 2024, 152, 111211. [Google Scholar] [CrossRef]
- Suganthan, P.N.; Hansen, N.; Liang, J.J.; Deb, K.; Chen, Y.-P.; Auger, A.; Tiwari, S. Problem definitions and evaluation criteria for the CEC 2005 special session on real-parameter optimization. KanGAL Rep. 2005, 2005, 2005005. [Google Scholar]
- Cymerys, K.; Oszust, M. Attraction-Repulsion Optimization Algorithm for Global Optimization Problems. Swarm Evol. Comput. 2024, 84, 101459. [Google Scholar] [CrossRef]
- Mirjalili, S.; Mirjalili, S.M.; Lewis, A. Grey wolf optimizer. Adv. Eng. Softw. 2014, 69, 46–61. [Google Scholar] [CrossRef]
- Su, H.; Zhao, D.; Heidari, A.A.; Liu, L.; Zhang, X.; Mafarja, M.; Chen, H. RIME: A physics-based optimization. Neurocomputing 2023, 532, 183–214. [Google Scholar] [CrossRef]
- Jia, H.; Peng, X.; Lang, C. Remora optimization algorithm. Expert Syst. Appl. 2021, 185, 115665. [Google Scholar] [CrossRef]
- Wenbiao, Y.; Kewen, X.; Shurui, F.; Li, W.; Tiejun, L.; Jiangnan, Z.; Yu, F. A Multi-Strategy Whale Optimization Algorithm and Its Application. Eng. Appl. Artif. Intell. 2022, 108, 104558. [Google Scholar] [CrossRef]
- Anitha, J.; Pandian, S.I.A.; Agnes, S.A. An efficient multilevel color image thresholding based on modified whale optimization algorithm. Expert Syst. Appl. 2021, 178, 115003. [Google Scholar] [CrossRef]
- Nadimi-Shahraki Mohammad, H.; Shokooh, T.; Seyedali, M.; Hossam, F. MTDE: An effective multi-trial vector-based differential evolution algorithm and its applications for engineering design problems. Appl. Soft Comput. 2020, 97, 106761. [Google Scholar] [CrossRef]
- Zhang, Z.; Chen, H.; Jiang, F.; Yu, Y.; Cheng, Q.S. A benchmark test suite for antenna S-parameter optimization. IEEE Trans. Antennas Propag. 2021, 69, 6635–6650. [Google Scholar] [CrossRef]
Disclaimer/Publisher’s Note: The statements, opinions and data contained in all publications are solely those of the individual author(s) and contributor(s) and not of MDPI and/or the editor(s). MDPI and/or the editor(s) disclaim responsibility for any injury to people or property resulting from any ideas, methods, instructions or products referred to in the content. |
© 2025 by the authors. Licensee MDPI, Basel, Switzerland. This article is an open access article distributed under the terms and conditions of the Creative Commons Attribution (CC BY) license (https://creativecommons.org/licenses/by/4.0/).