Abstract
This study investigates natural convection of liquid metal in an annular enclosure with a square cross-section using three-dimensional numerical simulations. Liquid metals, with low Prandtl numbers, exhibit oscillatory transitions at lower Rayleigh numbers than conventional fluids. While previous studies focused on full-circle domains where steady or irregular flows were observed, this work examines the effect of angular partitions on flow dynamics. The results reveal that periodic three-dimensional oscillatory flows arise in domains with specific angular sizes, such as quarter circles, whereas full-circle domains produce irregular or steady flows. Angular wave numbers vary spatially and temporally during transitional growth. The emergence of half-symmetric oscillatory modes highlights the role of symmetry constraints imposed by the geometry and boundary conditions. These transitions are closely tied to symmetry breaking and mode selection. A linear stability perspective helps clarify the critical factors that determine the transition type. These findings underscore that angular segmentation and periodic boundary conditions are essential for sustaining regular oscillatory convection. This study contributes to the understanding of symmetry-governed convection transitions in low-Prandtl-number fluids and has potential implications for industrial processes, such as semiconductor crystal growth, where flow uniformity and thermal stability are crucial.
1. Introduction
Liquid metals are categorized as low-Prandtl-number fluids, where the convective effects in the momentum equation dominate over the viscous forces. Consequently, thermal convection in such fluids is prone to temporal oscillations. In two-dimensional rectangular enclosures, natural convection in low-Prandtl-number fluids transitions from a steady two-dimensional flow to an oscillatory state at significantly lower Rayleigh numbers compared to that in air [1]. Tagawa and Ozoe [2] reported that two-dimensional natural convection in a square cavity—with vertical walls maintained at different temperatures, and horizontal adiabatic walls—exhibits periodic oscillations at a Prandtl number of 0.025 when the Rayleigh number exceeds approximately 105.
The transition from steady to oscillatory thermal convection in liquid metals cannot always be explained by simple bifurcation models such as the Hopf bifurcation. For instance, Rayleigh–Bénard convection in a rectangular cavity filled with liquid metal can exhibit irregular flow reversals over time, depending on the conditions [3]. Oscillatory transitions are particularly significant in Marangoni convection, which is driven by surface tension forces [4]. In the floating zone method—a technique used to grow single-crystal semiconductors—a column of molten metal is formed using surface tension. If the liquid metal enters an oscillatory flow state, then it becomes challenging to produce large, high-quality single crystals. For this reason, the transition mechanisms of Marangoni convection in liquid metals have been actively studied. However, the theoretical or analytical treatment of Marangoni convection requires assumptions or modeling, such as approximating a flat free surface. Conversely, natural convection within sealed enclosures allows for precise specification and control of wall boundary conditions.
For three-dimensional domains with horizontal temperature gradients, horizontally elongated rectangular enclosures have been widely studied. Specifically, natural convection in a rectangular cavity with a width-to-height-to-depth ratio of 4:2:1 has been extensively studied [5,6,7]. Bifurcation scenarios in such domains encompass a range of steady and periodic solutions, with the nature of the transitions influenced by the Prandtl number and the cavity’s aspect ratio. Furthermore, simulations involving horizontally elongated trapezoidal cross-sections and periodic boundary conditions have revealed flows exhibiting periodicity in both time and space [8].
Several three-dimensional numerical studies have investigated magnetohydrodynamic natural convection in annular enclosures with a vertical cylindrical axis and rectangular cross-section, under differentially heated inner and outer cylindrical walls [9,10,11,12,13,14,15]. Kakarantzas et al. [9,10,11] used a finite-difference method to investigate annular enclosures with rectangular cross-sections, including square sections. In their configuration, the inner and outer cylindrical surfaces were isothermally cooled and heated, respectively, while the top and bottom surfaces were adiabatic. A uniform static magnetic field was applied horizontally along the x-axis. The results indicated that increasing the axial direction of the cross-section in made the flow more susceptible to unsteadiness. Moreover, in the absence of a magnetic field, periodic steady convection patterns were observed.
In terms of flow patterns, previous studies by Kakarantzas et al. [9,10,11] focused solely on full-circle domains and did not explicitly observe regular three-dimensional oscillatory flows. To address this limitation, the present authors previously employed angularly segmented periodic domains and successfully generated regular three-dimensional oscillatory flows. They also examined the transition process as a function of the Rayleigh and Hartmann numbers [16,17]. Furthermore, linear stability analysis (LSA) was used to identify the bifurcation points associated with transitions from two-dimensional to three-dimensional flow and from steady to oscillatory flow [18].
In this study, we numerically investigate the natural convection of liquid metal in an annular enclosure with a square cross-section using three-dimensional simulations. The enclosure consists of vertical walls, with the inner and outer sides heated and cooled, respectively, and horizontal walls that are adiabatic. By comparing domains with varying angular sizes, we investigate the factors that prevent the observation of regular three-dimensional oscillatory flows in full-circle domains.
This study differs from previous works in several key aspects. First, while earlier investigations primarily considered full-circle domains, our study systematically explores angularly segmented domains (e.g., 1/4, 1/20 divisions) and their influence on three-dimensional oscillatory convection. Second, we reveal how the domain size and symmetry constraints affect the competition between steady and unsteady modes and the selection of dominant flow structures. Third, we examine the transition thresholds and flow patterns associated with different azimuthal wavenumbers, providing new insights into symmetry-induced modal behavior.
The angular partitions employed in this study, though idealized, serve as useful models for periodic and modular engineering systems. Examples include repeated cooling channel structures, turbine segmentations, and modular enclosures in MHD applications. By studying these partitioned configurations, we gain insights into symmetry-constrained convection phenomena that are relevant for practical thermal system design and optimization.
Furthermore, the present study highlights the role of symmetry constraints imposed by domain segmentation. By systematically varying the azimuthal extent, we investigate how geometrical symmetries (or their absence) influence the emergence, suppression, and stability of oscillatory modes in liquid metal convection. These symmetry-related mechanisms are central to the present analysis and directly relate to the aims of this journal.
2. Methods
2.1. Problem Formulation
Figure 1 presents a schematic model discussed in this study. This model represents one of the simplest geometries for circulation structures in thermal transport devices using liquid metals. A cylindrical coordinate system is employed for this annular enclosure, which has a square cross-section with a side length of h. The radii from the coordinate origin to the inner and outer walls of the annulus are represented as rin and rout, respectively. The radius ratio is defined as κ = rin/rout. In this study, the radius ratio κ was fixed at 0.5 to maintain consistency with previous studies and the relevant literature. This value provides a balanced geometry in which both vertical and radial temperature gradients can develop clearly. Such a configuration is widely used in experimental and numerical investigations of annular enclosures, making it a representative choice for studying natural convection phenomena. The annular container is placed horizontally and filled with a low-Prandtl-number fluid (Pr = 0.025), subject to a uniform gravitational field. The fluid is assumed to be a typical liquid metal, such as molten iron, mercury, or gallium. The inner cylindrical wall of the container is heated, while the outer wall is cooled, with both walls maintained at constant temperatures. The top and bottom horizontal walls are thermally insulated. As a result of the interaction between gravity and the fluid’s density difference, buoyancy forces drive natural convection. The list of symbols is provided at the end of this manuscript.
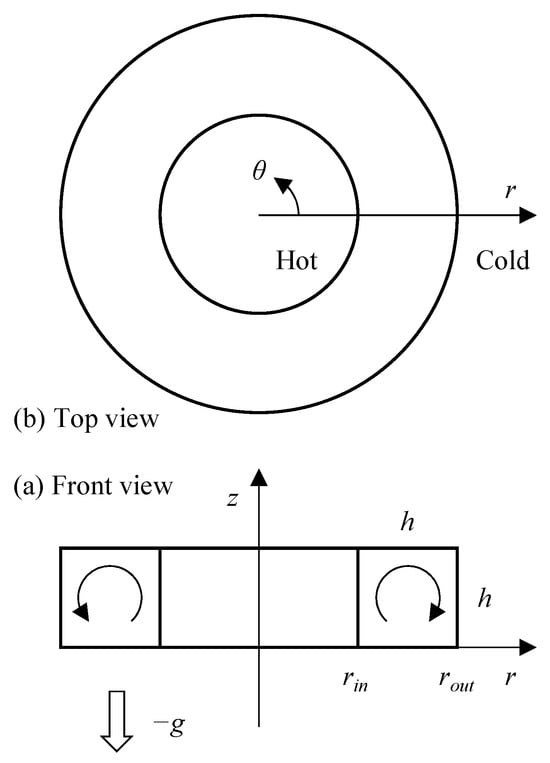
Figure 1.
Diagram of the physical model.
2.2. Governing Equations and Nondimensionalization
The fluid is considered incompressible and Newtonian, with the Boussinesq approximation applied. Additionally, internal heat sources, such as viscous dissipation and Joule heating, are neglected. The governing equations include the continuity equation, momentum equation, and energy equation:
Here, ez denotes the unit vector in the z-direction, T0 = (Th + Tc)/2 represents the reference temperature, and ρ signifies the constant fluid density at the reference temperature.
The boundary conditions on all four walls are defined as follows: A no-slip condition is applied for the velocity. The inner and outer vertical walls are kept at constant temperatures Th and Tc, respectively, while the top and bottom horizontal walls are thermally insulated:
The pressure boundary condition is set such that the normal derivative is zero at all walls (i.e., ∂p/∂r = ∂p/∂z = 0). For the three-dimensional simulations, periodic boundary conditions are applied in the azimuthal direction. Let φ represent a generic variable and Lθ [rad] be the azimuthal span of the computational domain. Then, the periodic condition is expressed as
Periodic boundary conditions were applied in the azimuthal direction. This assumption is physically reasonable for systems exhibiting repetitive azimuthal structures, such as modular components in cylindrical reactors or turbine segments. It also facilitates the study of flow symmetries and mode selection in annular geometries. Similar periodic modeling approaches have been widely adopted in prior simulation work. Unless otherwise specified, all initial conditions are uniformly set to zero.
Next, the governing equations are nondimensionalized. A reference velocity u0 = α/h is defined, where α is the thermal diffusivity and h denotes the characteristic length scale. The radius from the center of the circular container to the center of the cross-section is expressed as
With this, the variables are nondimensionalized as follows:
Consequently, governing Equations (1)–(3) are rewritten in their nondimensional forms as
The nondimensional parameters are the Prandtl number Pr and the Rayleigh number Ra, defined as follows:
In this study, Pr was fixed at 0.025.
2.3. Numerical Methods
The nondimensional governing equations were discretized on a nonuniform staggered grid. The grid spacing was determined using the hyperbolic tangent (tanh) function. For instance, the grid points for the radial velocity component in the R direction were defined by the following equation:
Here, Nr represents the number of cells in the radial direction, with the same method applied in the Z direction. Following previous studies [16,17], the full circular domain used a grid resolution of Nr = Nz = 40 and Nθ = 560. For other angular domain sizes, Nθ was chosen so that the grid spacing Δθ would remain nearly uniform. A grid independence study was conducted during the preliminary phase of this study. It was confirmed that the chosen resolution (Nr = Nz = 40, Nθ = 560 for the full circle) results in Nusselt number and kinetic energy values that deviate by less than 1% from those obtained with finer meshes. Thus, the current grid resolution was adopted for all simulations in this work.
In numerical simulations of flow fields using finite difference methods, the choice of discretization scheme is critical to ensuring sufficient conservation of quantities such as momentum and kinetic energy. The discretization of the advection term, in particular, has a significant impact on the outcomes. In cylindrical coordinate systems, several schemes with excellent conservation properties have been proposed by Verzicco and Orlandi [19], Fukagata and Kasagi [20], and Morinishi et al. [21]. For example, Kakarantzas et al. [9,10,11] used the second-order accurate scheme developed by Verzicco and Orlandi [19].
In this study, the advection terms were discretized using the fourth-order central difference scheme developed by Morinishi et al. [21]. The discretization of energy Equation (10) employed the same scheme as that used for momentum Equation (9). The high-order scheme by Morinishi et al. [21] incorporates diagonal grid points in the discretization of the advection terms. Preliminary simulations using a second-order central difference scheme were also performed and showed qualitatively similar flow behavior. However, the fourth-order scheme provided better resolution of periodic flow structures and significantly reduced numerical diffusion, which is crucial for capturing subtle oscillatory dynamics. To address this issue, ghost cells were added outside the computational domain, with their values smoothly connected to the interior using symmetry considerations to ensure proper behavior at the boundaries. For all other spatial terms, excluding the advection term, second-order central differences were applied. Time integration was performed using a third-order low-storage Runge–Kutta method, while the diffusion term in the energy equation was discretized using a second-order Crank–Nicolson scheme. The time step was dynamically adjusted during the simulations to ensure that the Courant–Friedrichs–Lewy (CFL) number remained below 0.5, based on the maximum local velocity within the domain. The simplified marker and cell method was employed for solving the coupled flow field equations. The bi-conjugate gradient stabilized (BiCGSTAB) method was used as the iterative solver, and the successive over-relaxation (SOR) method was applied for the energy equation. The convergence criterion was that the residual should fall below a threshold value, set to 10−6. Parallel computing with OpenMP was employed when necessary.
2.4. Characteristic Quantities and Visualization
The local heat flux due to convective heat transfer, Qconv, and that due to conductive heat transfer, Qcond, on the hot or cold wall surfaces are expressed as follows:
Based on these definitions, the local Nusselt number, Nuloc, can be obtained as follows:
The average Nusselt number, Nu, is then computed as
Here, Lθ represents the angular extent of the computational domain in the θ-direction.
Although the Nusselt number is commonly used to evaluate thermal convection phenomena, its definition does not account for the velocity components. Therefore, to more accurately evaluate the flow dynamics of the convection, the total kinetic energy (TK), defined as the sum of the squares of the velocity components, was also assessed:
This definition of TK follows that proposed by Morinishi et al. [21]. However, while Morinishi et al. defined the total kinetic energy as the volume-integrated value over the entire computational domain, the present study adopted the total kinetic energy per unit volume to allow for comparison among computational domains with different Lθ values.
The convective circulation structure was visualized using the second invariant Q of the velocity gradient tensor. To facilitate this, Q was normalized by the magnitude E of the tensor, limiting the range to −1 ≤ Q/E ≤ 1:
Here, Xi represents the spatial coordinates, and the subscripts i and j follow the Einstein summation convention. When expressed in cylindrical coordinates, the following equations are obtained:
To identify coherent vortex structures in the flow field, we employ the Q criterion, which is defined as the second invariant of the velocity gradient tensor. This method effectively distinguishes regions where the rotation rate dominates over the strain rate, and thus highlights vortex cores. Compared to other vortex identification techniques such as the λ2 or Δ criteria, the Q criterion offers a good balance between computational efficiency and physical interpretability in three-dimensional flows.
3. Results and Discussion
3.1. Summary of Previous Studies
The characteristics of the natural convection examined in this study were investigated in detail within a 1/20th sector of the circular domain [16]. This study revealed a sequence of flow transitions with increasing Rayleigh number Ra: starting from a two-dimensional axisymmetric steady flow, progressing to a three-dimensional steady flow, then to a three-dimensional non-half-symmetric periodic oscillatory flow, transitioning to a three-dimensional aperiodic oscillatory flow, to a three-dimensional half-symmetric periodic oscillatory flow, and finally to a three-dimensional nonperiodic oscillatory flow. The half-symmetry is defined by the following relation:
Here, θprd [rad] represents the angular wavelength of the fundamental mode that constitutes the convection, satisfying the relation θprd = 2π/m. The transition from two-dimensional to three-dimensional flow is accompanied by the suppression of convection, which results in a reduction in the heat transfer rate. This is reflected in a decrease in both the Nusselt number Nu and total kinetic energy (TK). Additionally, in three-dimensional simulations, the critical point at which the transition from 2D steady to 3D steady flow occurs can be obtained via LSA. As the system moves further from this critical point, nonlinear effects become more pronounced.
In this natural convection system, at least two distinct disturbance modes with different temporal characteristics are present: a steady disturbance mode (Φ′S) and an unsteady disturbance mode (Φ′P). The neutral Ra of Φ′S can be determined through LSA, while Φ′P is characterized by its half-symmetric structure. These two modes possess different growth rates and may coexist during the amplification process. However, as disturbances evolve, only Φ′S remains stable in the three-dimensional steady flow, whereas only Φ′P persists in the three-dimensional half-symmetric periodic oscillatory flow. Consequently, the time-averaged disturbance structures differ significantly between the 3D steady flow and 3D half-symmetric periodic oscillatory flow.
3.2. Circle Regions Divided into m
In this section, various characteristic quantities are compared across multiple values of m by setting the angular extent of the computational domain to Lθ = 2π/m. Figure 2 shows the distributions of SR, Nu, TK, and τprd as functions of m.
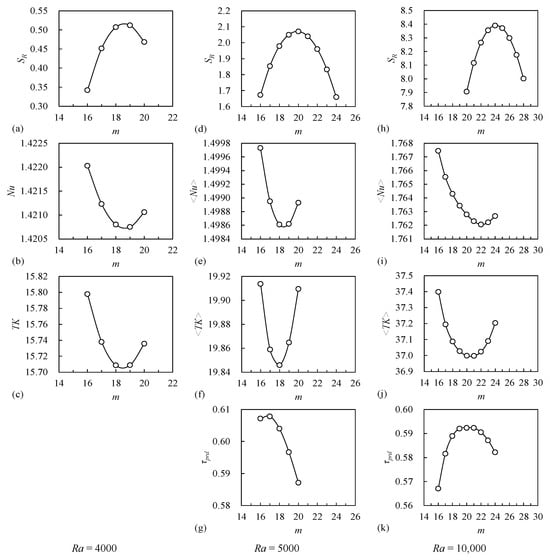
Figure 2.
Distributions of SR, Nu, TK, and τprd with respect to m at (a–c) Ra = 4000; (d–g) Ra = 5000; and (h–k) Ra = 10,000. SR: Linear growth rate of the disturbance mode, indicating its amplification tendency. Nu: Nusselt number, a measure of convective heat transport efficiency. TK: Time-averaged kinetic energy of the flow, representing its intensity. τprd: Nondimensional oscillation period, showing the temporal regularity of the unsteady flow. For each Ra, the dominant wavenumber m corresponds to the peak SR.
First, the SR obtained from LSA increases approximately linearly with Ra, with the slope of this relationship becoming steeper at higher azimuthal wavenumbers. The integer value of m corresponding to the maximum SR was m = 19, 20, and 24 for Ra = 4000, 5000, and 10,000, respectively. As Ra increases, the linear stability analysis suggests that shorter-wavelength disturbances become more unstable due to increased thermal buoyancy. Consequently, the most amplified azimuthal wavenumber m shifts from 19 to 24 with increasing Ra, reflecting the higher growth rates of higher-order modes.
Next, both Nu and TK exhibit minima with respect to m. The observed minima in Nu and TK as functions of m are associated with suboptimal modal alignment between the flow structure and the azimuthal periodicity of the domain. When the selected m does not match the naturally preferred mode of the system, convective transport and kinetic energy are suppressed due to inefficient modal excitation. When m is limited to integers, the minimum Nu at Ra = 4000 occurred at m = 19, while TK reached its lowest value at m = 18′; however, the difference between m = 18 and m = 19 was minimal for both quantities. At Ra = 5000, three-dimensional half-symmetric periodic oscillatory flows were observed for 16 ≤ m ≤ 20, three-dimensional aperiodic oscillatory flows for 21 ≤ m ≤ 22, and three-dimensional steady flows for 23 ≤ m ≤ 24. For m = 21 and 22 at Ra = 5000, the irregular flow arises from the nonlinear competition between the steady (Φ′S) and periodic (Φ′P) modes. When both modes exhibit comparable amplitude and growth rates, the system fails to settle into a dominant periodic structure, resulting in aperiodic behavior. The azimuthally averaged values, Nu and TK, denoted <Nu> and <TK>, both peaked at m = 18. For Ra = 10,000, three-dimensional half-symmetric periodic oscillatory flows were observed for all values 16 ≤ m ≤ 24. The minimum of <Nu> was observed at m = 22, while <TK> was the smallest at m = 21. According to Masuda and Tagawa [16], when m is restricted to multiples of 4, the minimum values of <Nu> and <TK> occur at m = 24 and m = 20, respectively; however, the difference in <Nu> between m = 20 and m = 24 was minor.
The dimensionless oscillation period τprd showed a maximum with respect to m, occurring near m = 17 at Ra = 5000. At Ra = 10,000, τprd was identical for both m = 20 and m = 21, indicating that the maximum likely lies in the range 20 < m < 21.
Although the values of m at which Nu, TK, and τprd reach their extrema are close to the values of m with maximum SR, no clear correlations were identified between SR and these physical quantities.
These results suggest that the azimuthal symmetry of the domain imposes selection rules on the admissible modes. For example, in the m = 20 domain (corresponding to 18° angular periodicity), only flow structures compatible with that discrete rotational symmetry are allowed to grow.
Furthermore, the transition point from steady to unsteady three-dimensional flows varied with m. Figure 3 illustrates the amplification or attenuation of the temporal fluctuations in Uθ for 4100 ≤ Ra ≤ 4700 and 15 ≤ m ≤ 20. The temporal variation of Uθ is based on the value at a specific point at the center of the enclosure. At Ra = 4200, both m = 16 and m = 17 exhibited unsteady flows, but the amplitude was larger for m = 16. Therefore, among the integer values of m, the critical Rayleigh number for the transition from steady to unsteady flow is lowest at m = 16. Based on the behavior shown in Figure 3, the critical Rayleigh number for the onset of oscillatory convection under the present configuration (Pr = 0.025, κ = 0.5) is estimated to be approximately Ra ≈ 4000–4200. In practical systems, this threshold can vary depending on geometry, boundary conditions, and material properties. In Figure 3, all initial conditions are uniformly set to zero.
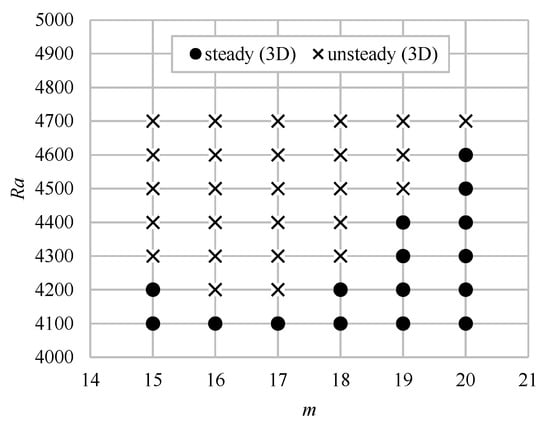
Figure 3.
Distribution of time evolution characteristics for 4100 ≤ Ra ≤ 4700 and 15 ≤ m ≤ 20.
3.3. Quarter-Circle Regions
In the quarter-circle regions, a three-dimensional half-symmetric single-periodic oscillatory flow with a uniform azimuthal wavenumber distribution was obtained, even when simulations were initiated from a zero initial condition, as illustrated in Figure 4. This suggests that the emergence of a regular three-dimensional oscillatory flow is influenced by the angular extent of the computational domain.
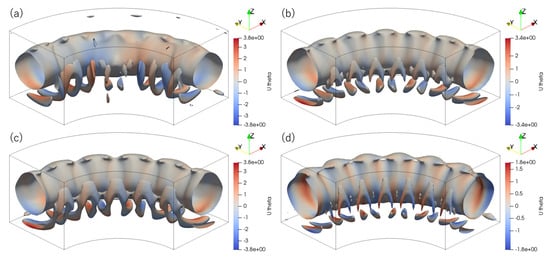
Figure 4.
Contours of Q/E = 0.4 with respect to (a,c) m = 20 and (b,d) 24 in a quarter region at Ra = 10,000 at (a,b) τ = 6 and (c,d) τ = 30.
However, the corresponding value of m was not necessarily unique. For example, at Ra = 10,000, the disturbance structure with m = 24 consistently emerged during the early stage of amplification. This value of m corresponds to the one that yields the largest SR among multiples of 4 in the LSA. Nevertheless, once the flow fully developed, structures with both m = 20 and m = 24 were observed. In cases such as Figure 4a,c, where the value of m differed between the amplification and post-amplification stages, the flow structure initially broke down (at τ = 6) but later reconverged into a regular configuration (at τ = 30). Similarly, in cases like Figure 4b,d, where m = 24 remained consistent throughout, the convection structures initially displayed some spatial nonuniformity (at τ = 6), which gradually smoothed out over time (by τ = 30).
The difference in m between the amplified and fully developed flows is not attributed to a change in m during the amplification process. Rather, it arises because the values of m corresponding to the steady disturbance mode (Φ′S) and unsteady disturbance mode (Φ′P) differ from the outset. In other words, the value of m that yields the maximum amplification rate is not the same for Φ′S and Φ′P. However, since the amplification of Φ′S begins earlier than that of Φ′P for Ra = 10,000, the value of m associated with Φ′P could not be identified during the initial amplification stage.
The choice of m in the quarter-circle region was influenced by factors such as grid resolution, convergence criteria, and initial disturbances. For example, at three Rayleigh numbers (Ra = 8000, 10,000, and 12,000), the convergence threshold was varied in increments of 10−8—specifically set to 1.00 × 10⁻⁶, 1.01 × 10⁻⁶, 1.02 × 10⁻⁶, and 1.03 × 10⁻⁶. In these tests, parallel computation was not employed. For Ra = 8000, all conditions resulted in convergence to m = 20. However, for Ra = 10,000 and Ra = 12,000, the flow converged to either m = 20 or m = 24, depending on the specific convergence condition. Similarly, when the SOR method was used as the iterative solver for Ra = 10,000, the solution again converged to either m = 20 or m = 24, indicating sensitivity to the numerical setup.
Among these cases, we focus on the BiCGSTAB-based simulation at Ra = 10,000, where the convergence criterion of the iterative velocity field calculation was evaluated using the continuity error ε. As presented in Figure 5, the continuity error during the 143rd inner iteration of the 30th outer iteration was 1.0072 × 10⁻⁶. When the convergence threshold was set to ε = 1.00 × 10⁻⁶ or lower, the inner iterations proceeded to the 147th iteration. However, when the threshold was relaxed to ε = 1.01 × 10⁻⁶, the iterations terminated at the 143rd step. Once the iterative pathways diverged due to this slight difference in convergence conditions, they never returned to the same solution. As a result, the flow ultimately converged to m = 20 in the former case and to m = 24 in the latter.
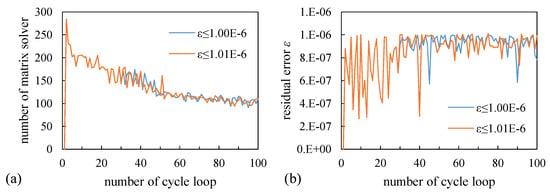
Figure 5.
Comparison between the convergence criterion ε ≤ 1.00 × 10⁻⁶ and 1.01 × 10⁻⁶ in a quarter region at Ra = 10,000. (a) number of matrix solver; (b) residual error.
What is significant about this phenomenon is not whether the flow converges to m = 20 or m = 24, but rather that it consistently converges to one of these values. Nevertheless, since the continuity error in this study effectively acts as a pseudo-initial disturbance, there is a potential concern that the computational results may appear to stem from flaws in the numerical method. To address this issue and validate the robustness of the results, we attempted to reproduce the phenomenon by explicitly introducing initial disturbances—generated from random numbers—into the initial state.
The final converged wavenumber (e.g., m = 20 or m = 24) in the quarter-circle simulations was found to depend sensitively on the residual convergence criterion. This is attributed to the presence of multiple near-neutral modes whose selection is influenced by small numerical perturbations or solver path dependency. Such sensitivity is common in systems exhibiting symmetry-breaking bifurcations.
For these calculations, a more stringent convergence criterion was imposed for the inner iteration, requiring the continuity error to fall below 10−9, compared to the usual threshold of 10−6. Under this stricter condition, minute disturbances arising from the continuity error did not amplify, and the flow field remained two-dimensional in the absence of explicitly imposed initial perturbations. To introduce such perturbations, a disturbance of order 10−10 was uniformly imposed in the azimuthal direction, ensuring that Uθ satisfied the continuity equation, i.e.:
Multiple simulations were then conducted using different random distributions. As a result, both m = 20 and m = 24 oscillatory flows were obtained. This finding suggests that the final flow configuration depends on subtle differences in initial or numerical conditions—akin to the butterfly effect in chaos theory.
The numerical results also indicate that the system exhibits high sensitivity to small perturbations, especially in the transitional regime (e.g., around Ra ≈ 4700). Depending on slight differences in initial conditions or numerical precision (e.g., convergence threshold), the flow may converge to different dominant azimuthal wavenumbers or display irregular time evolution. This sensitivity is reminiscent of low-dimensional chaotic dynamics. However, extended time integration suggests that the trajectories remain bounded and do not exhibit exponential divergence typical of fully developed chaos. Therefore, the system may be categorized as quasi-periodic or weakly aperiodic, rather than truly chaotic.
3.4. Full-Circle Regions
In the full-circle region with Lθ = 2π, the dominant azimuthal wavenumber during the disturbance amplification process was approximately m ≈ 19, 20, 20, 20, 22, and 24 for Ra = 4000, 4300, 4600, 5000, 6000, and 10,000, respectively. These wavenumbers closely corresponded to the integer m values that yielded the maximum SR in the LSA. However, as illustrated in Figure 6, the azimuthal wavenumber distributions were not uniform. As m is not restricted to integer—as long as the total azimuthal wavelength sums to 2π—multiple disturbance modes with different m values can coexist within the domain. This nonuniformity in the wavenumber became more pronounced with increasing Ra.
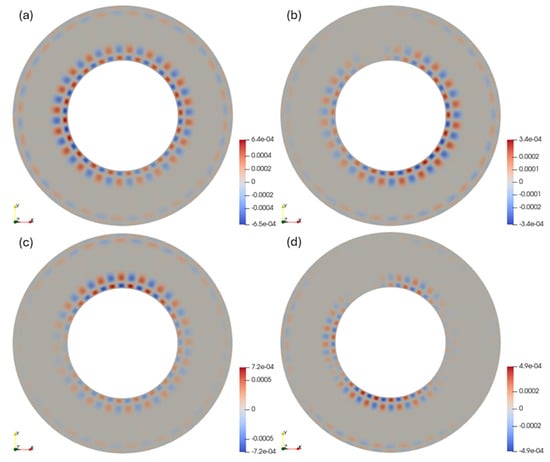
Figure 6.
Contours of Uθ at Z = 0.5 during growth process at (a) Ra = 4300 (τ = 26), (b) Ra = 4600 (τ = 18), (c) Ra = 5000 (τ = 13), and (d) Ra = 10,000 (τ = 3.3).
Next, we consider the flow behavior after the disturbances have sufficiently developed. For Ra = 4000, 4300, and 4600, the dominant wavenumbers were approximately m ≈ 19, 20, and 20, respectively. However, the wavenumber distributions remained nonuniform. At Ra = 4000 and 4300, the flow stabilized into a three-dimensional steady state, while at Ra = 4600, oscillatory structure emerged in only part of the convective field. As shown in Figure 7, the flow in the foreground remained steady, whereas the background region exhibited irregular oscillations. This partial unsteadiness is likely a result of the coexistence of stable and unstable flow structures, arising from the nonuniform azimuthal wavenumber distribution. Supporting this interpretation, Figure 3 shows that in m-divided circular domains at Ra = 4600, three-dimensional oscillatory flows were observed for 15 ≤ m ≤ 19, while a steady flow occurred for m = 20. The key difference between these flow regimes lies in the relative stability of the steady and unsteady disturbance modes. Although the flow may eventually transition to a fully steady state after an extremely long time, locally stable unsteady disturbances could persist temporarily.

Figure 7.
Contours of Q/E = 0.4 based on U at Ra = 4600 at (a) τ = 59 and (b) τ = 60; the color denotes Uθ.
For Ra ≥ 5000, the initially regular, small-scale disturbance structures collapsed, giving rise to irregular three-dimensional oscillatory flows that lacked both spatial and temporal regularity. In the full-circle region, this irregularity persisted even after sufficient simulation time, showing no tendency to transition into a regular pattern. To estimate the number of dominant disturbances M in such flows, the peaks of the azimuthal velocity Uθ were visually counted using contour plots, as shown in Figure 8. In this estimation, each peak was counted as M = 0.5. Consequently, the estimated values of M for these irregular oscillatory flows were not always integers and were frequently evaluated as multiples of 0.5. The resulting flow structures, as shown in Figure 8, demonstrated a twisted configuration in which both the temporal and spatial phases were offset by half a wavelength. For Ra = 5000, 6000, and 10,000, the dominant azimuthal wavenumbers during the disturbance amplification stage were approximately m ≈ 20, 22, and 24, respectively. However, following the transition to irregular oscillations, the number of dominant disturbances M became less well-defined and exhibited fluctuations. Specifically, M varied within the ranges M ≈ 20–21, 18.5–19.5, and 21.5, for Ra = 5000, 6000, and 10,000, respectively.
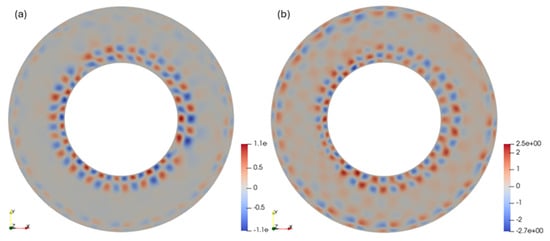
Figure 8.
Contours of Uθ at Z = 0.5 after long-time evolution at (a) Ra = 5000 (τ = 60) and (b) Ra = 10,000 (τ = 30).
These irregular oscillations in the full-circle region are triggered by the nonuniformity of the azimuthal wavenumber (as seen in Figure 6) and the temporal discrepancies in the growth phases. Such nonuniformities are present even at the initial microscopic stage, before amplification begins, and arise within the error margin of the continuity equation. However, if this error tolerance is set too strictly, the disturbances become too small to grow. In this study, the residual for the continuity equation was set at 10−6, but when reduced to 10−9, the transition from two-dimensional to three-dimensional flow did not occur. Therefore, it is considered impossible to obtain a three-dimensional, single-periodic oscillatory flow in the full-circle region, at least when starting from a zero initial condition.
In the present study, a residual convergence threshold of 10−6 was adopted, which ensures a good balance between numerical convergence and the preservation of physical instabilities. When the threshold was reduced to 10−9, initial perturbations were numerically suppressed below the growth threshold, thereby preventing the transition to oscillatory or multi-modal states. This indicates that convergence criteria not only influence solution accuracy but can also unintentionally dampen physical instabilities in sensitive flow regimes.
Nevertheless, the three-dimensional oscillatory flows composed of a single fundamental azimuthal wavenumber component are intrinsically stable. Using a flow field generated in an m-divided circular domain, which consisted of a single fundamental azimuthal wavenumber, we constructed an initial field for full-circle simulations by connecting this structure m times in the azimuthal direction. As shown in Figure 9, the resulting full-circle simulation that at Ra = 10,000 revealed that the three-dimensional half-symmetric, single-periodic oscillatory flows originating from m = 20 or m = 24 components remained stable for at least 30 dimensionless time units.
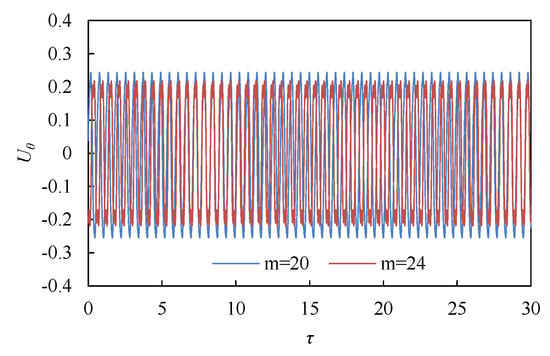
Figure 9.
Time evolution of Uθ in a full-circle region at Ra = 10,000. The initial value is constructed by joining four periodic flows in a quarter-circle region.
The initial condition used in Figure 9, consisting of a periodic flow pattern repeated m times in the azimuthal direction, is a mathematical construction introduced to isolate the intrinsic stability of individual modes. Although such perfect periodicity may not be realized in real physical systems due to inherent disturbances and noise, it serves as a useful idealized benchmark to test whether a selected mode can persist under near-symmetric conditions.
The use of m-periodic initial conditions serves to probe the dynamical response of the system under strict symmetry constraints. This approach allows for us to isolate how symmetries embedded in the initial and boundary conditions influence the persistence and deformation of flow structures.
4. Conclusions
Three-dimensional numerical simulations were performed to investigate natural convection of liquid metal in an annular container with vertical walls and a square cross-section, where the walls were isothermally heated and cooled at different temperatures. The main findings obtained from this study are summarized below:
In both the full-circle and quarter-circle domains, the degree of freedom in choosing the fundamental azimuthal wavenumber is higher. During the disturbance amplification process, the wavenumber m approximately aligns with the integer value corresponding to the maximum linear growth rate in the LSA. However, spatial nonuniformities in the azimuthal wavenumber distribution and temporal discrepancies during the growth phase were observed during the amplification process. Consequently, although both steady three-dimensional and irregular oscillatory flows were present in the full-circle domain, regular single-periodic three-dimensional oscillatory flows were not observed. Conversely, in the quarter-circle domain, the flow eventually converged to a three-dimensional half-symmetric single-periodic oscillatory flow, even when slight nonuniformities existed in the early stages of disturbance growth, consistent with those obtained in the 1/20 or 1/24 circular domains. Furthermore, it was found that the dominant azimuthal wavenumber m can differ between the disturbance growth phase and the fully developed flow. This is caused by the difference in the wavenumber between Φ′S and Φ′P. However, the value of m for Φ′P may vary depending on the subtle differences in the computational conditions.
The present study focused on Pr = 0.025, which corresponds to representative liquid metals such as mercury, gallium, and their alloys. These materials exhibit oscillatory natural convection at relatively low Rayleigh numbers, making them ideal candidates for investigating transition behavior. For fluids with higher Prandtl numbers, the onset of oscillation is expected at significantly higher Ra values, with different modal structures and stability characteristics. These aspects will be addressed in future studies.
In addition, this study emphasizes how symmetry constraints—imposed both by geometry and boundary conditions—govern the onset and structure of oscillatory convection. Understanding these symmetry-breaking transitions provides insight not only into the fundamental fluid mechanics but also into the design of flow control strategies in practical systems with modular or periodic geometries.
From an application standpoint, the emergence of oscillatory or aperiodic convection patterns in low-Prandtl-number fluids is highly relevant to industrial processes such as crystal growth using the floating-zone or Czochralski method. Oscillatory flows can lead to radial or azimuthal thermal nonuniformities, which may in turn induce interface fluctuations and reduce crystal quality. Understanding and controlling such flow-induced instabilities is essential for optimizing material processing in liquid metal-based systems.
Author Contributions
Conceptualization, T.T.; methodology, T.M. and T.T.; software, T.M.; validation, T.M. and T.T.; formal analysis, T.M.; investigation, T.M.; data curation, T.M.; writing—original draft preparation, T.M.; writing—review and editing, T.T.; visualization, T.M.; supervision, T.T.; project administration, T.T. All authors have read and agreed to the published version of the manuscript.
Funding
This research received no external funding.
Data Availability Statement
The raw data supporting the conclusions of this article will be made available by the authors on request.
Conflicts of Interest
The authors declare no conflicts of interest.
Nomenclature
| ez | unit vector in the z-direction (-) |
| E | dimensionless dissipation rate of kinetic energy (-) |
| g | gravitational acceleration (m/s2) |
| h | length of one side of an enclosure (m) |
| M | number of disturbances (-) |
| m | angular wave number in the θ-direction (rad) |
| N | cell number in each direction (-) |
| Nu | average Nusselt number (-) |
| p | pressure (Pa) |
| P | dimensionless pressure, = p/ρu02 (-) |
| Pr | Prandtl number, = ν/α (-) |
| Q | dimensionless second invariant of the velocity gradient tensor (-) |
| r | radial distance (m) |
| rin | radius of inner cylinder (m) |
| rout | radius of outer cylinder (m) |
| r0 | mean radius, = (rin + rout)/2 (m) |
| R | dimensionless radial distance, = r/h (-) |
| Ra | Rayleigh number, = gβ(Th − Tc)h3/αν (-) |
| SR | dimensionless linear growth rate (-) |
| t | time (s) |
| T | temperature (K) |
| Tc | temperature of a cold wall (K) |
| Th | temperature of a hot wall (K) |
| T0 | reference temperature, = (Th + Tc)/2 (K) |
| TK | dimensionless kinetic energy (-) |
| u | velocity, = (ur, uθ, uz) (m/s) |
| Ur | dimensionless velocity component in the r-direction, = ur/u0 (-) |
| Uθ | dimensionless velocity component in the θ-direction, = uθ/u0 (-) |
| Uz | dimensionless velocity component in the z-direction, = uz/u0 (-) |
| u0 | reference velocity, = α/h (m/s) |
| z | axis coordinate (m) |
| Z | dimensionless axis coordinate = z/h (-) |
| Greek symbols | |
| α | thermal diffusivity (m2/s) |
| β | volumetric coefficient of thermal expansion (K−1) |
| θ | azimuth (rad) |
| θprd | azimuth of the fundamental wave, = 2π/m (rad) |
| Θ | dimensionless temperature, = (T − T0)/(Th − Tc) (-) |
| κ | ratio of radii, = rin/rout (-) |
| ν | kinetic viscosity (m2/s) |
| ρ | density at T0 (kg/m3) |
| τ | dimensionless time, = t/(h/u0) (-) |
| τprd | dimensionless fundamental oscillation period (-) |
| Φ | arbitrary dimensionless variable (-) |
| Φ′P | unsteady disturbance mode (-) |
| Φ′S | steady disturbance mode (-) |
| Brackets | |
| < > | time mean component |
References
- Gelfgat, A.Y.; Bar-Yoseph, P.Z.; Yarin, A.L. Stability of multiple steady state of convection in laterally heated cavities. J. Fluid Mech. 1999, 388, 315–334. [Google Scholar] [CrossRef]
- Tagawa, T.; Ozoe, H. Effect of Prandtl number and computational schemes on the oscillatory natural convection in an enclosure. Numer. Heat Transf. Part A Appl. 1996, 30, 271–282. [Google Scholar] [CrossRef]
- Yanagisawa, T.; Yamagishi, Y.; Hamano, Y.; Tasaka, Y.; Takeda, Y. Spontaneous flow reversals in Rayleigh-Bénard convection of a liquid metal. Phys. Rev. E 2011, 83, 036307. [Google Scholar] [CrossRef]
- Kitayama, T.; Tagawa, T. Effect of the electric conductivity and Seebeck coefficient of the rods on the oscillatory Marangoni convection in the presence of a uniform axial magnetic field. Trans. Jpn. Soc. Mech. Eng. Ser. B 2017, 83, 17-00011. [Google Scholar] [CrossRef]
- Henry, D.; Buffat, M. Two- and three-dimensional numerical simulations of the transition to oscillatory convection in low-Prandtl-number fluids. J. Fluid Mech. 1998, 374, 145–171. [Google Scholar] [CrossRef][Green Version]
- Henry, D.; BenHadid, H. Multiple flow transitions in a box heated from the side in low-Prandtl-number fluids. Phys. Rev. E 2007, 76, 016314. [Google Scholar] [CrossRef]
- Medelfef, A.; Henry, D.; Bouabdallah, A.; Kaddeche, S. Bifurcations from steady to quasi-periodic flows in a laterally heated cavity filled with low Prandtl number fluids. J. Fluid Mech. 2019, 861, 223–252. [Google Scholar] [CrossRef]
- Lappa, M.; Ferialdi, H. Gravitational thermal flows of liquid metals in 3D variable cross-section containers: Transition from low-dimensional to high-dimensional chaos. Chaos 2018, 28, 093114. [Google Scholar] [CrossRef]
- Kakarantzas, S.C.; Grecos, A.P.; Vlachos, N.S.; Sarris, I.E.; Knaepen, B.; Carati, D. Direct numerical simulation of a heat removal configuration for fusion blankets. Energy Convers. Manag. 2007, 48, 2775–2783. [Google Scholar] [CrossRef]
- Kakarantzas, S.C.; Sarris, I.E.; Vlachos, N.S. Natural convection of liquid metal in a vertical annulus with lateral and volumetric heating in the presence of a horizontal magnetic field. Int. J. Heat Mass Transf. 2011, 54, 3347–3356. [Google Scholar] [CrossRef]
- Kakarantzas, S.C.; Benos, L.T.; Sarris, I.E.; Knaepen, B.; Grecos, A.P.; Vlachos, N.S. MHD liquid metal flow and heat transfer between vertical coaxial cylinders under horizontal magnetic field. Int. J. Heat Fluid Flow 2017, 65, 342–351. [Google Scholar] [CrossRef]
- Mebarek-Oudina, F.; Bessaïh, R. Oscillatory magnetohydrodynamic natural convection of liquid metal between vertical coaxial cylinders. J. Appl. Fluid Mech. 2016, 9, 1655–1665. [Google Scholar] [CrossRef]
- Mebarek-Oudina, F.; Makinde, O.D. Numerical simulation of oscillatory MHD natural convection in cylindrical annulus: Prandtl number effect. Defect Diffus. Forum 2018, 387, 417–427. [Google Scholar] [CrossRef]
- Afrand, M.; Toghraie, D.; Karimipour, A.; Wongwises, S. A numerical study of natural convection in a vertical annulus filled with gallium in the presence of magnetic field. J. Magn. Magn. Mater. 2017, 430, 22–28. [Google Scholar] [CrossRef]
- Afrand, M. Using a magnetic field to reduce natural convection in a vertical cylindrical annulus. Int. J. Therm. Sci. 2017, 118, 12–23. [Google Scholar] [CrossRef]
- Masuda, T.; Tagawa, T. Transition of natural convection of liquid metal in an annular enclosure. Phys. Fluids 2022, 34, 024107. [Google Scholar] [CrossRef]
- Masuda, T.; Tagawa, T.; Alam, M.M.A.; Hayamizu, Y. Transition of natural convection of liquid metal in an annular enclosure under a magnetic field. Phys. Fluids 2023, 35, 014112. [Google Scholar] [CrossRef]
- Masuda, T.; Tagawa, T. Linear stability analysis of three-dimensional natural convection at low Prandtl number in an annular enclosure in the presence of a toroidal magnetic field. AIP Adv. 2020, 10, 125208. [Google Scholar] [CrossRef]
- Verzicco, R.; Orlandi, P. A finite-difference scheme for three-dimensional incompressible flows in cylindrical coordinates. J. Comput. Phys. 1996, 123, 402–414. [Google Scholar] [CrossRef]
- Fukagata, K.; Kasagi, N. Highly energy-conservative finite difference method for the cylindrical coordinate system. J. Comput. Phys. 2002, 181, 478–498. [Google Scholar] [CrossRef]
- Morinishi, Y.; Vasilyev, O.V.; Ogi, T. Fully conservative finite difference scheme in cylindrical coordinates for incompressible flow simulations. J. Comput. Phys. 2004, 197, 686–710. [Google Scholar] [CrossRef]
Disclaimer/Publisher’s Note: The statements, opinions and data contained in all publications are solely those of the individual author(s) and contributor(s) and not of MDPI and/or the editor(s). MDPI and/or the editor(s) disclaim responsibility for any injury to people or property resulting from any ideas, methods, instructions or products referred to in the content. |
© 2025 by the authors. Licensee MDPI, Basel, Switzerland. This article is an open access article distributed under the terms and conditions of the Creative Commons Attribution (CC BY) license (https://creativecommons.org/licenses/by/4.0/).