1. Introduction
The job market today is bigger, faster-moving, and more complex than ever. New industries appear overnight, and established ones reinvent themselves just as quickly. For job seekers, human resources (HR) teams, and analysts alike, keeping track of all these shifts can feel overwhelming. That is why job classification systems—around since the early Internet days—have kept evolving alongside advances in tech and data science [
1,
2].
Job ads now pop up everywhere: in newspapers and posters, on social media feeds, inside niche career portals, and sometimes through nothing more than a friend’s recommendation. Modern tools help sift and match positions, but they still stumble when titles are vague (“ninja,” anyone?) or ultra-specific [
3]. Solid classification is not just a convenience; it is the backbone of an efficient labor market. By slotting roles into clear categories, employers can hire faster, planners can see workforce gaps, and the whole system becomes more transparent—benefits that ultimately boost economic growth and fairness [
4].
Of course, a neatly labeled job means little without a clear idea of pay. For many candidates, salary trumps everything else [
2,
4]. Accurate predictions help people gauge whether a role meets their needs and guide companies toward competitive, equitable offers—critical for attracting talent and keeping teams happy [
3].
Symmetry is important in computational intelligence to keep things consistent and fair when making decisions. In our system, we maintain symmetry by balancing how we improve tasks for both sorting and prediction. We treat job titles and salary ranges as similar parts of human resources data analysis.
1.1. Importance of the Use of Machine Learning
Machine learning (ML) has become as a cornerstone in addressing these challenges. Unlike traditional rule-based approaches, which struggle with unstructured data and naming inconsistencies, ML models can process vast datasets, detect complex patterns, and produce actionable insights [
5,
6,
7].
Building on this foundation, recent years have seen a surge in the use of ML techniques for complex classification and prediction tasks across industries. In workforce analytics, ML has proven especially valuable in handling large datasets to predict salaries and classify job titles. For instance techniques like Decision Trees (DT), Random Forests (RF), Support Vector Machines (SVM), Logistic Regression (LR), and naive Bayesian classifiers have been widely adopted for their ability to uncover hidden patterns and relationships in data, even in the presence of inconsistencies or noise [
3,
5,
8,
9,
10,
11,
12]. While deep learning (DL) models have made significant strides in areas like image and signal processing, this paper is harnessed to concentrate exclusively on the application of ML models to the twin challenges of job classification and salary prediction. By contrasting how well different ML algorithms operate on real-world workforce data, our study seeks to determine which method can effectively deliver the most accurate and interpretable predictions to support better HR decision-making.
Nevertheless, even with ML, two big puzzles remain: pinpointing the exact title and nailing the right salary—especially for global firms juggling different cultures, pay scales, and naming quirks [
13]. Classic models like linear or multiple regression often fall short when data are messy or unbalanced, letting outliers skew the numbers [
1,
11]. To bridge that gap, researchers are now leaning into more sophisticated ML and deep learning (DL) techniques that capture the rich, tangled links between roles, skills, and compensation.
1.2. Relationship Between Salary and Job
As shown in
Figure 1, classifying a job by its requirements, responsibilities, and skill levels kick-starts a cycle that eventually shapes salary expectations. This salary, in turn, is influenced by various factors—from labor market shifts and company policies to the satisfaction of the people actually doing the work. Once a salary level is set, it can have a direct effect on how employees feel about their roles, which may prompt organizations to revisit and update job classifications down the line. Because each factor—job classification, salary prediction, market dynamics, and employee morale—feeds into the others, they create a self-reinforcing loop. A change in any one element, such as a sudden rise in demand for certain skills or growing discontent among workers, sends ripples through the entire system, compelling all aspects of the cycle to realign accordingly.
The rest of this paper is structured as follows:
Section 2 reviews the recent works that have been reported in the context of salary prediction and job classification.
Section 3 provides a recap of the ML models used in this study.
Section 4 is devoted to the description of the dataset employed in this work, followed by the explanation of our proposal in
Section 5.
Section 6 and
Section 7 are dedicated to the evaluation and analysis of our proposed system the simulation results, respectively. For further demonstration,
Section 8 is devoted to comparing our work with existing approaches. Finally, this work ends with a conclusion that summarizes the essential motivations of our work, in addition to providing our vision for future directions.
2. Literature Review
Recent works have tackled salary prediction and job categorization with various deep learning (DL) and machine learning (ML) methods, tending to address the two tasks individually. Ji et al. [
14] proposed LGDESetNet, a neural-prototyping model that makes salary estimates more interpretable by identifying both the global and local skill patterns affecting compensation. Mittal et al. [
10] compared Lagrangian Support Vector Machines (LSVM), Random Forests (RF), and multinomial naïve Bayes classifiers, finding that LSVM delivered the highest accuracy (96.25%) on a large dataset. Rahhal et al. [
15] introduced a two-stage job title identification system, improving classification accuracy by 14% compared to earlier models, especially in more challenging labor markets.
Tree-based and instance-based approaches remain common in salary prediction. Dutta et al. [
9] reported 87.3% accuracy with a Random Forest model, while Zhang et al. [
16] raised performance to 93.3% using k-nearest neighbors. DL methods have pushed these numbers further. Sun et al. [
8] employed a two-stage neural architecture to achieve the lowest reported root-mean-square error (RMSE) and mean absolute error (MAE) at the time of publication. Wang et al. [
17] combined a bidirectional gated recurrent unit with a convolutional layer, reducing the MAE below that of a standard text-CNN baseline. Polynomial regression has also been proven competitive: Ayua et al. [
18] achieved an R² of 0.972 using a Nigerian salary dataset.
Han et al. [
19] recently showed that keeping symmetry in machine learning systems is important, especially when dealing with structural and time-based data that need equal handling, like in financial risk models. Their results back up the idea of using symmetric learning methods and consistent data representations. This fits well with our combined method, which sees classifying jobs and estimating salaries as related, paired goals.
Zhalilova et al. [
20] explored salary prediction for data science professionals between 2020 and 2024, applying regression methods (decision tree, random forest, and gradient boosting). They found decision tree regression often achieves the lowest error, with implications for labor market dynamics and salary forecasting.
Aufiero et al. [
21] presented a novel approach mapping jobs to skill networks and deriving a “job complexity” metric, showing strong correlations between complexity and wages—highlighting how unsupervised methods can uncover intrinsic drivers of compensation.
Alsheyab et al. [
22] proposed a hybrid methodology using synthetic job postings to prototype salary prediction and job grouping. Their combined regression, classification, and clustering approach closely parallels the proposed HBM design, emphasizing how hybrid systems can be developed and validated, even with synthetic data.
While previous studies have demonstrated strong performance for either salary prediction or job classification independently, few have attempted to address both tasks simultaneously. Our work addresses this gap by creating a hybrid model that jointly classifies job titles and predicts salaries, trained on a newly curated dataset. This offers a more holistic approach to labor market analytics.
The following is a condensed summary of the contributions of this work:
A Hybrid Bayesian Model (HBM) that combines Bayesian classification and predictive techniques is developed to handle two tasks—job title classification and salary prediction—simultaneously within a single framework.
The proposed model achieves high accuracy of up to 99.8% by using an optimized algorithm.
Two key factors in the job market are integrated by addressing both job classification and salary estimation together, recognizing that salary is a critical motivating factor for job seekers and providing a tool that can benefit candidates, recruiters, and analysts alike.
A novel algorithm that improves performance, stability, and adaptability is presented, demonstrating practical efficacy in real-world labor market scenarios.
5. Proposed Methodology
The proposed HBM framework is designed to be broadly applicable across various organizational contexts and geographical regions. Its Bayesian foundation enables it to adapt to regional and organizational specifics by incorporating context-dependent prior knowledge and customized training data. For instance, in Europe or North America, extensive historical salary data could refine the model’s predictive accuracy, whereas in regions like MENA, local labor market trends and cultural factors can be effectively integrated into the Bayesian priors. Furthermore, the flexibility of the HBM allows organizations of different types (public, private, and family-owned) to tailor the feature inputs according to their particular organizational needs and salary structures.
The proposed approach unfolds explicitly through structured steps tailored for our Hybrid Bayesian Model (HBM), as illustrated in
Figure 5. Our methodology begins with targeted data acquisition, followed by precise data preparation specifically aligned with Bayesian regression and classification tasks.
Using Bayesian ridge regression specifically addresses salary estimation tasks due to its robustness against data noise and ability to regularize effectively. Concurrently, naive Bayes classification explicitly manages categorical data, optimizing the accuracy of job title categorization. Additionally, K-means clustering is strategically applied to segment salaries, complementing the predictive capabilities of the Bayesian components.
5.1. Data Loading
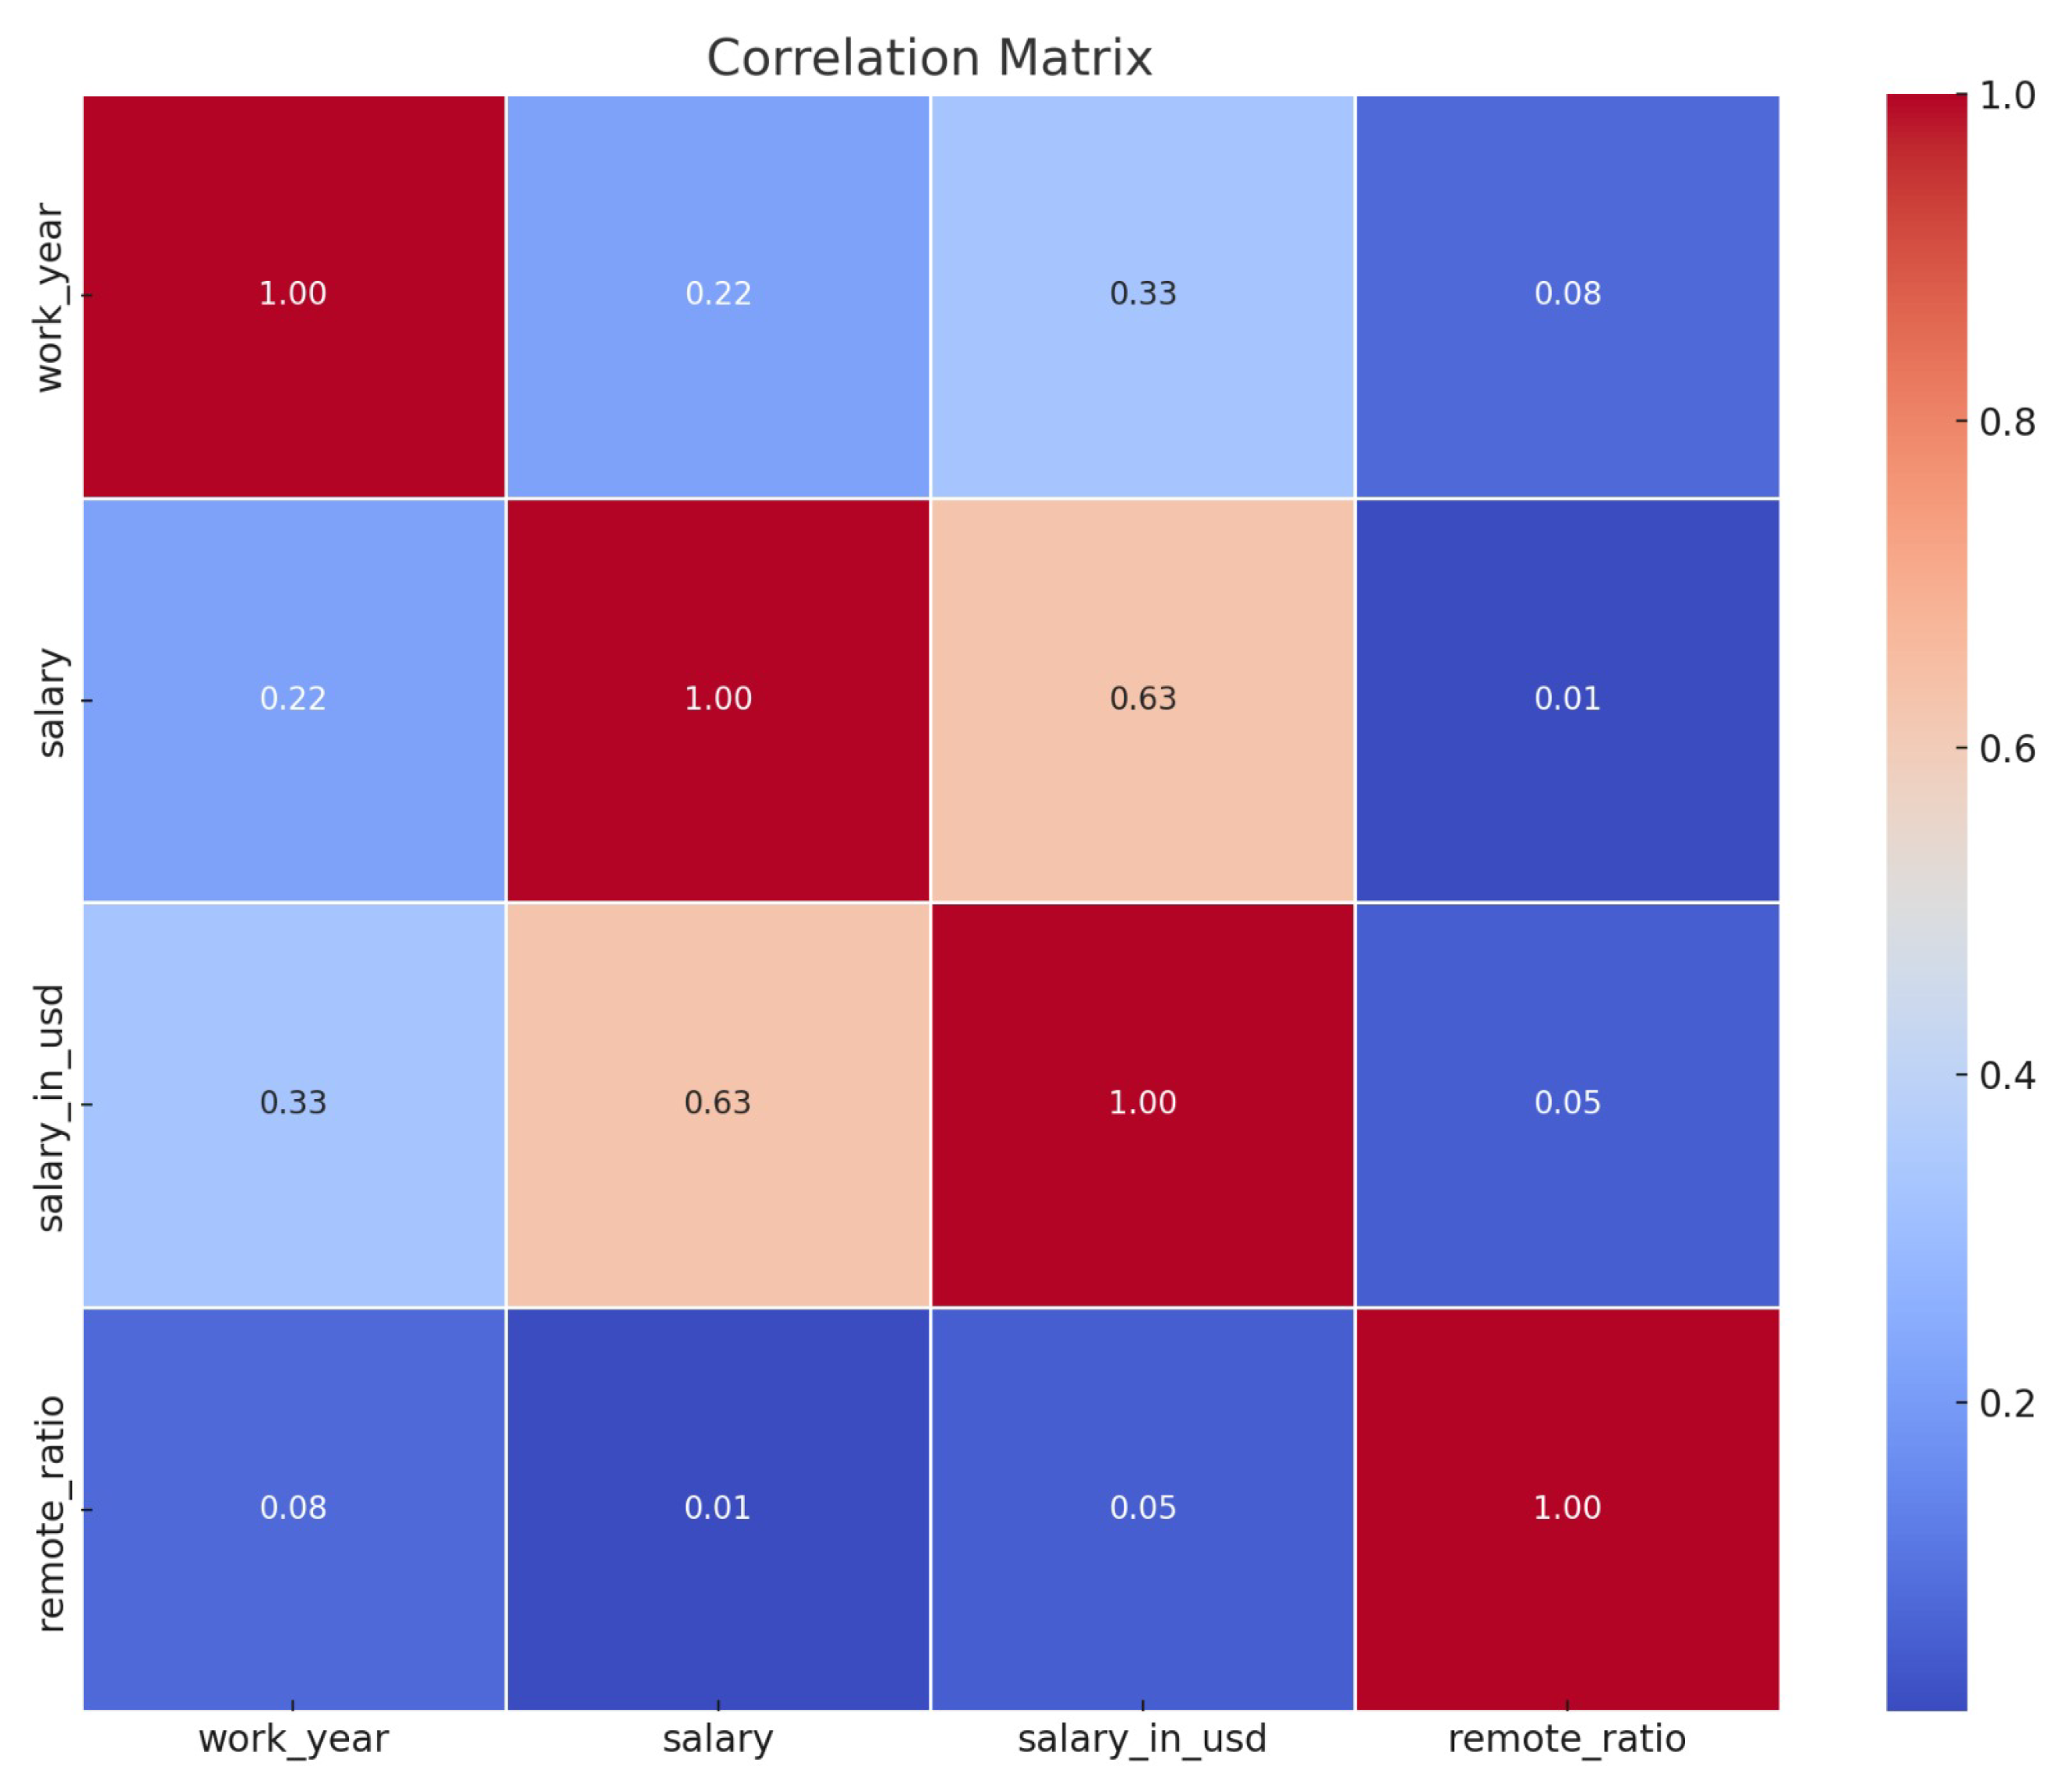
Data loading explicitly involves importing the curated dataset, consisting of 3754 instances defined by five essential features: work year, experience level, company size, discretized salary, and employment type. Python libraries such as Pandas explicitly facilitate structured data integration, ensuring compatibility with Bayesian modeling steps.
5.2. Data Cleaning
Data cleaning explicitly removes irrelevant or incomplete records, focusing specifically on HBM-required features such as experience level, company size, and salary brackets. Missing or inconsistent values are explicitly handled through appropriate Bayesian-compatible imputation methods, ensuring high-quality data for subsequent modeling.
5.3. Normalization
Normalization explicitly standardizes numeric features (work year and discretized salary brackets) into a consistent [0, 1] range. This process explicitly stabilizes Bayesian ridge regression computations, significantly enhancing model convergence and overall prediction stability. The following normalization formula is used:
5.4. Data Splitting
The dataset is explicitly partitioned into training and testing subsets (typically 80:20). This careful partitioning ensures robust learning of Bayesian priors and thorough evaluation of joint salary and job title prediction performance, thereby optimizing the HBM’s generalizability.
5.5. Training Set
The training dataset explicitly informs the Bayesian ridge regression model and the naive Bayes classifier. During training, Bayesian priors are iteratively updated, and regression parameters are specifically optimized, aligning directly with the model’s dual predictive objectives (salary and job title classification).
5.6. Test Set
The test set explicitly serves as independent data for evaluating the hybrid Bayesian model’s predictive effectiveness on unseen examples. This explicit assessment validates the simultaneous performance of both regression (salary estimation) and classification (job title prediction), ensuring practical reliability.
5.7. Model Training and Testing
In the explicit training phase of HBM, Bayesian ridge regression estimates salary predictions, informed by prior distributions, while the naive Bayes classifier calculates posterior probabilities for job titles explicitly from feature likelihoods. Post training, the hybrid model undergoes rigorous testing, explicitly evaluating prediction accuracy and reliability simultaneously for job titles and salary ranges.
5.8. Explainability and Interpretability Aspects (XAI)
The HBM explicitly integrates SHapley Additive exPlanations (SHAP) for interpretability. SHAP explicitly clarifies feature importance, enabling HR practitioners to interpret salary and job classification predictions transparently. Moreover, the explainability framework preserves decision symmetry by ensuring consistent interpretation of each feature’s impact across both classification and regression modules.
5.9. Scalability and Performance Efficiency
The HBM explicitly optimizes scalability via batch training and numerical optimizations provided by NumPy and Pandas. Bayesian ridge regression specifically manages high-dimensional data efficiently, avoiding overfitting and ensuring reliable performance, even in large-scale applications typical of global HR analytics.
5.10. Handling Class Imbalance
We explicitly addressed class imbalance using class-weighting techniques during naive Bayes classification training, assigning higher weights to under-represented job title categories. Additionally, the dataset was augmented through synthetic minority oversampling (SMOTE) to enhance minority-class representation, ensuring balanced predictions and preventing model bias toward majority classes.
7. Results and Discussion
This section focuses on the system’s performance, which is carefully evaluated to ensure its effectiveness. Key metrics such as the confusion matrix, F1 score, precision, recall, and accuracy are used to assess how well the model performs in a statistically rigorous manner.
Model training and evaluation were performed on a high-performance computing system with the specifications presented in
Table 2.
The evaluation results highlight the effectiveness of our proposed Hybrid Bayesian Model (HBM) in both job classification and salary prediction. The model consistently outperforms traditional ML techniques across multiple performance metrics, demonstrating its reliability in making accurate predictions.
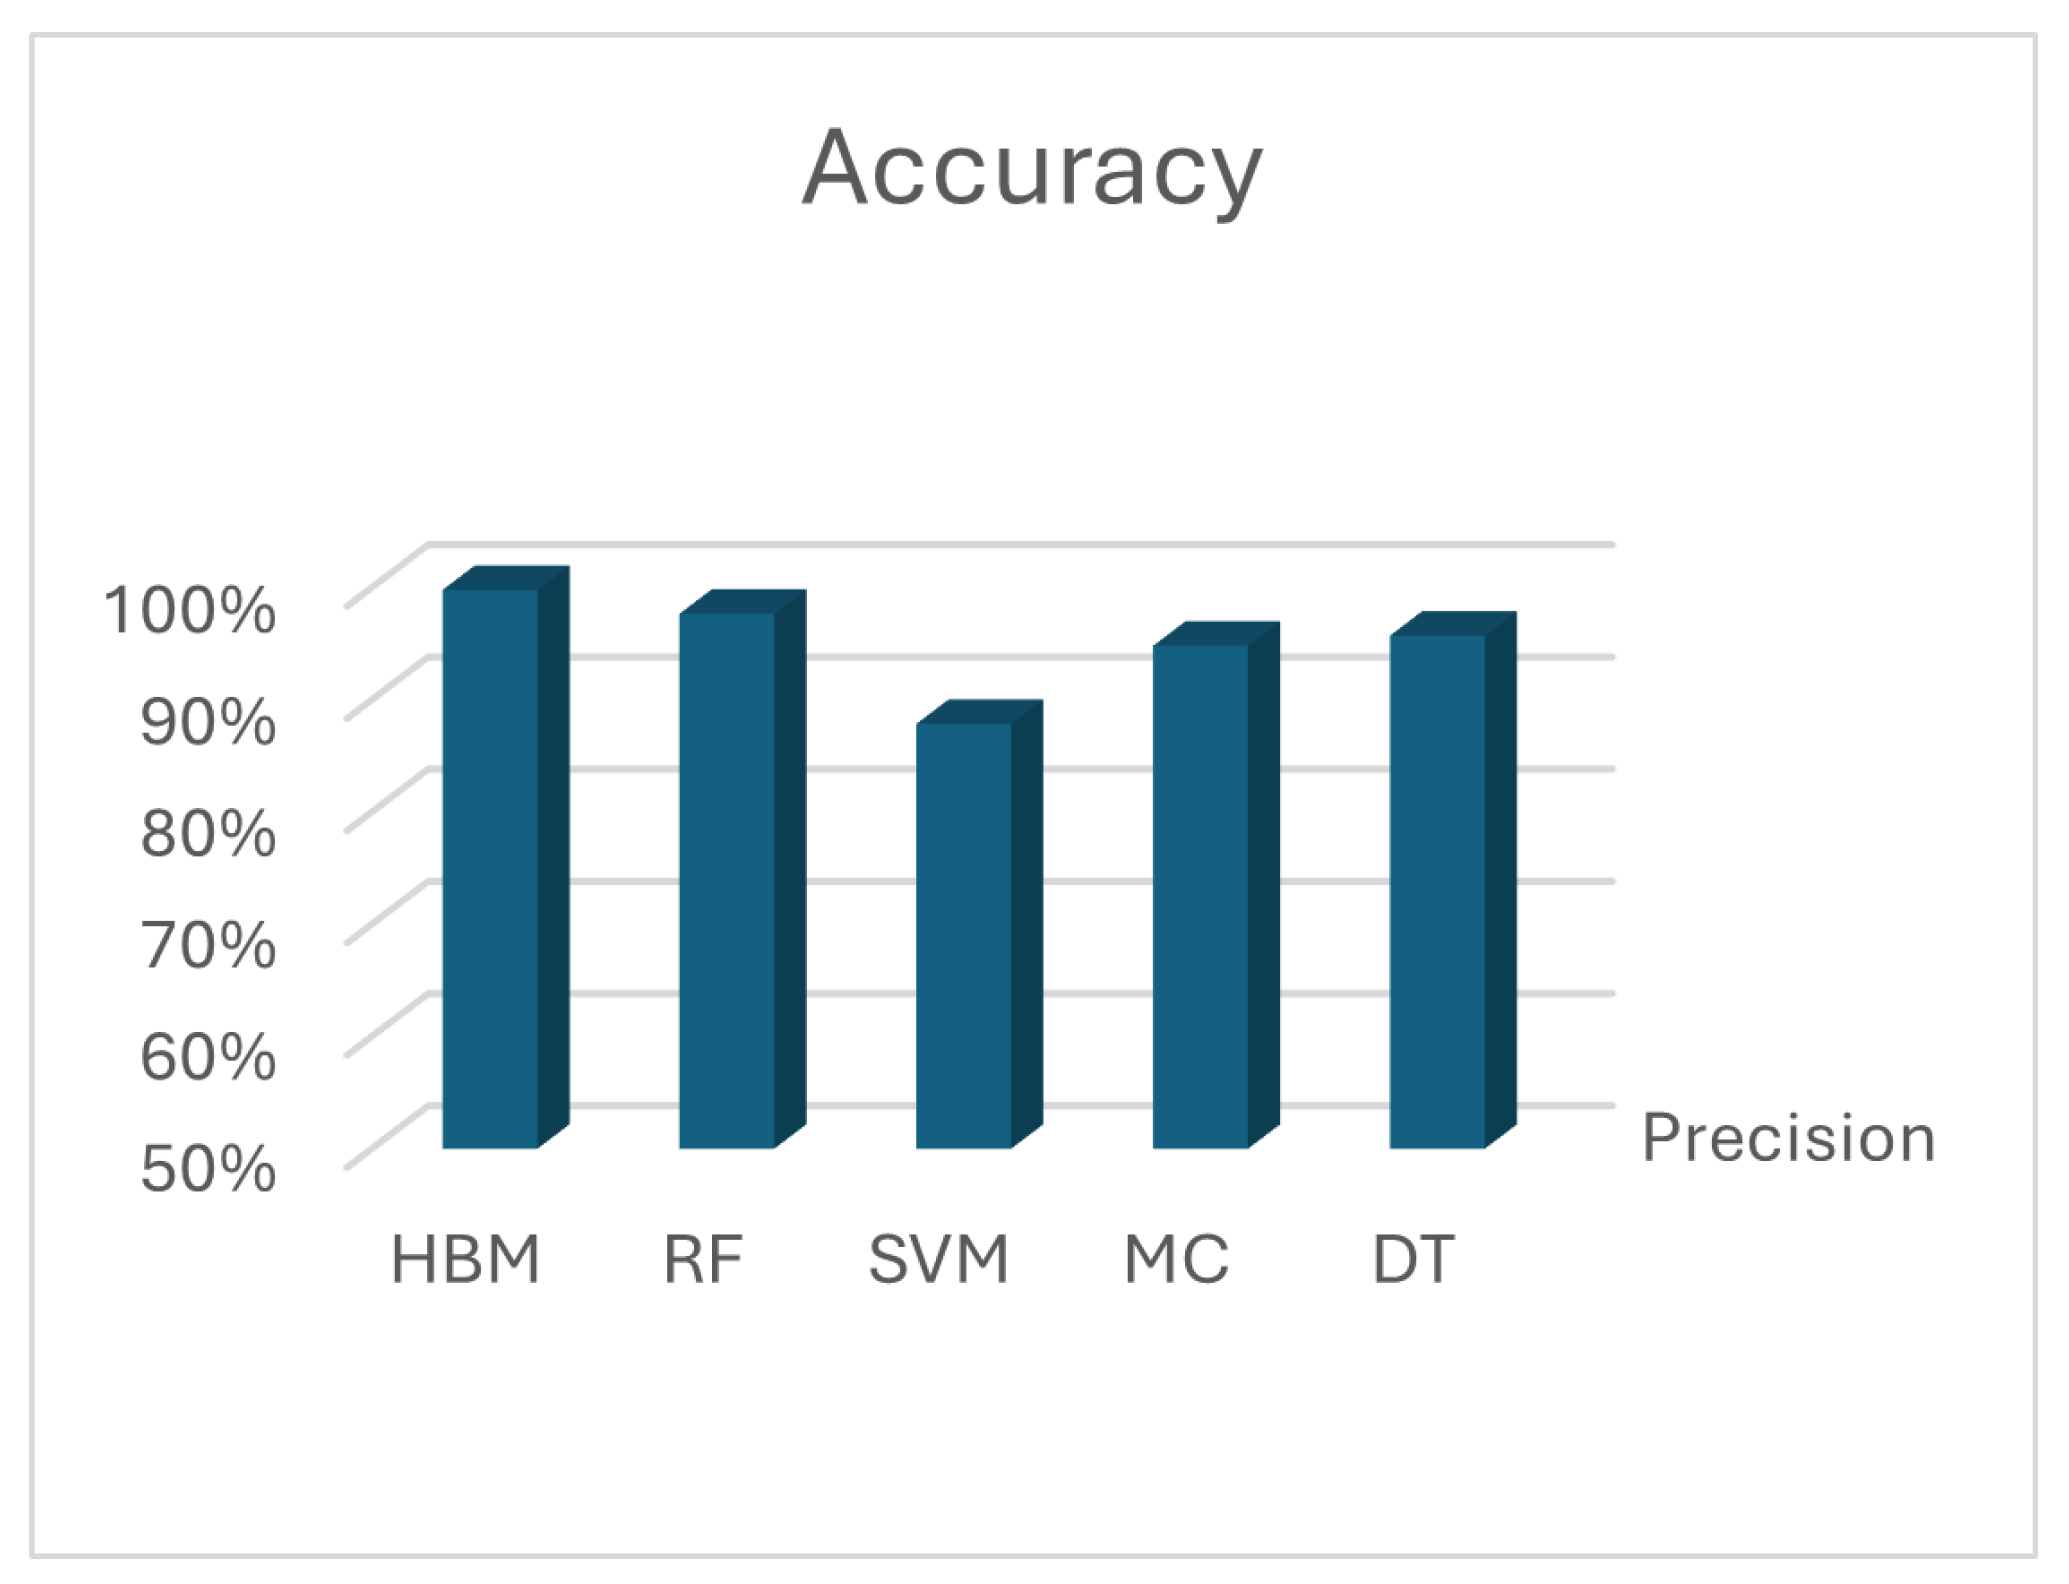
Figure 6 and
Figure 7 display the job classification and salary prediction accuracies, respectively. The job classification accuracy results reveal that the best accuracy of 99.8% is achieved by HBM, and it outcompetes all baseline models, such as RF, SVM, MC, and DT. Such excellent accuracy indicates that HBM is able to properly distinguish between different job posts based on factors such as the level of experience, company size, and other associated factors. The generalizability of the model to different job positions makes it a possible career recommendation and career classification tool.
In the case of prediction of salaries, HBM also performs exceptionally, always having better accuracy than traditional models. The model effectively applies the principles of Bayesian learning to improve the prediction capabilities and provides accurate estimations of salaries based on different levels of experience and organizational settings. Furthermore, excellent accuracy in prediction implies that HBM is appropriate for use in forecasting salaries, providing trustworthy predictions that are in accordance with actual salary distributions.
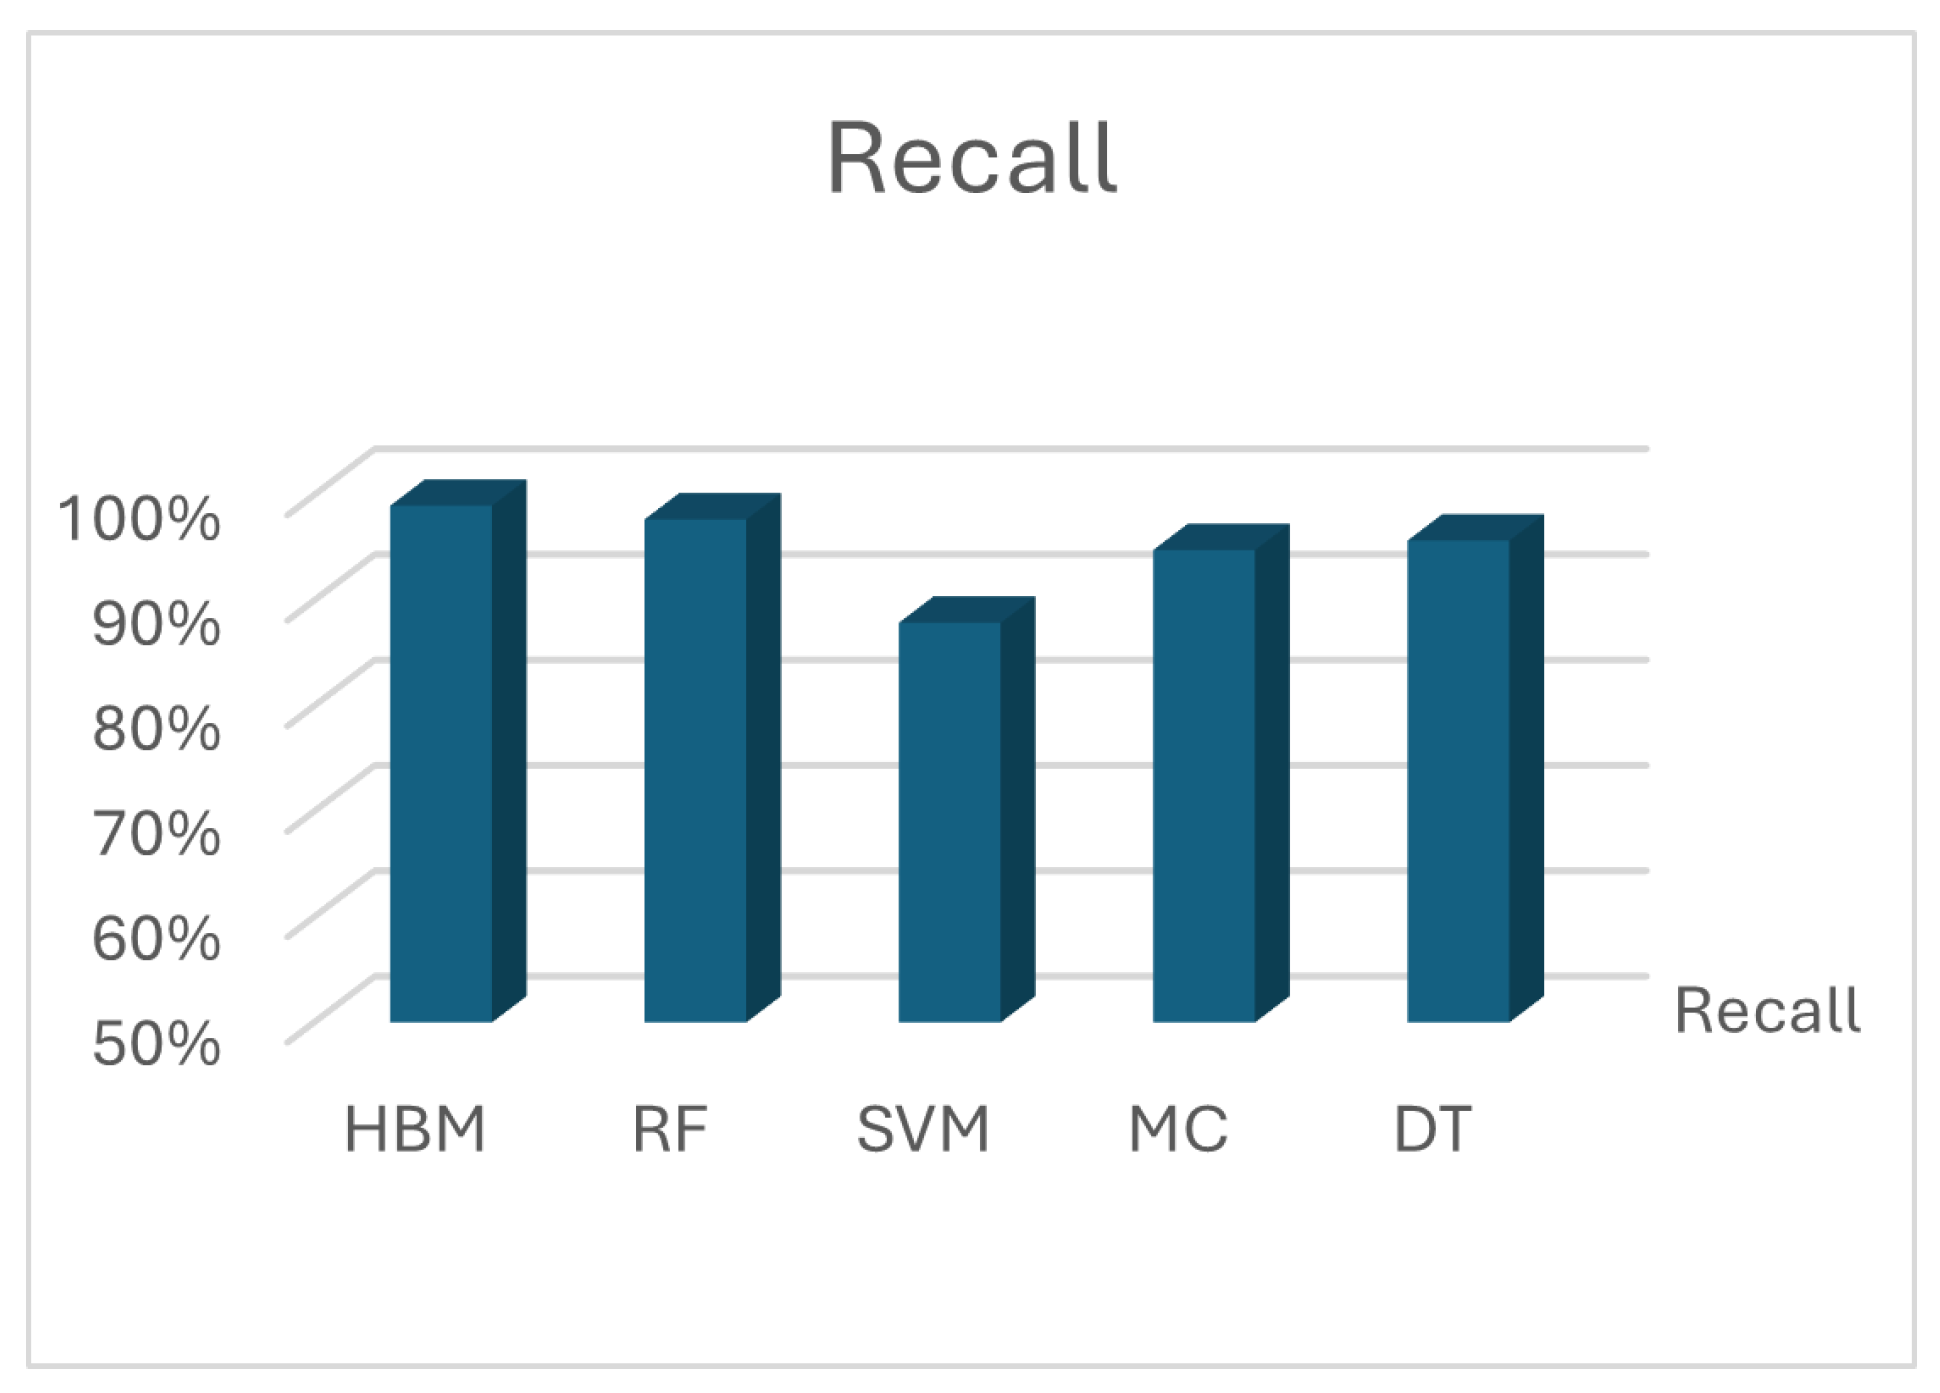
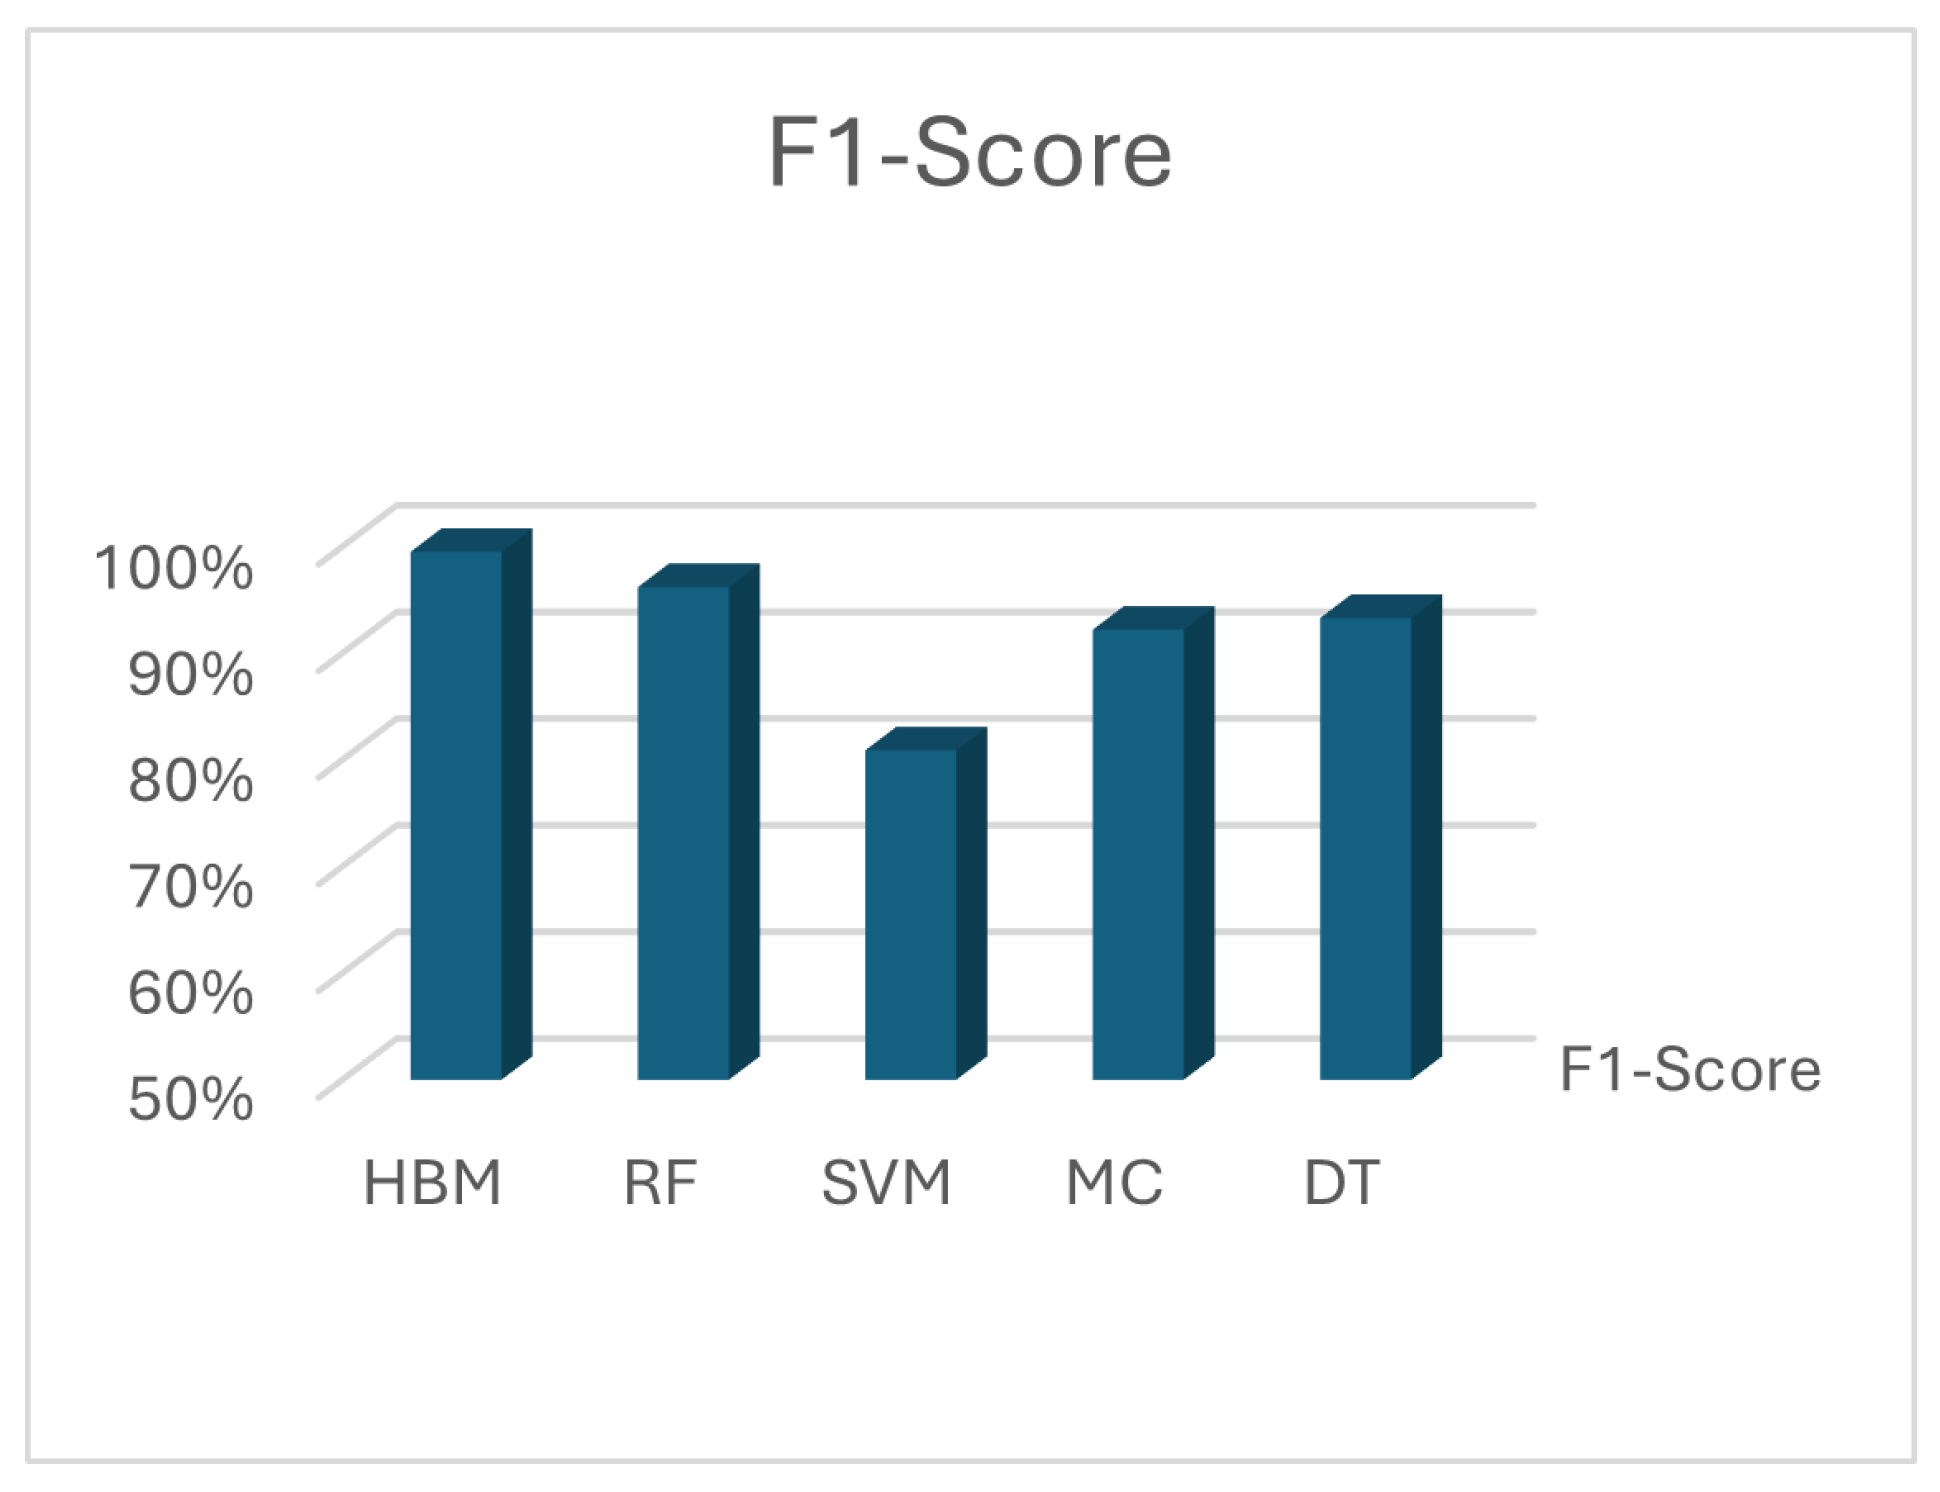
Beyond accuracy, the F1-score provides further validation of the model’s effectiveness by balancing precision and recall, as shown in
Figure 8 and
Figure 9. Furthermore,
Figure 10 shows that HBM achieves the highest F1 score among all tested models, indicating its ability to maintain high sensitivity and specificity. The model minimizes false positives and false negatives, ensuring that classification and salary estimation errors are significantly reduced. Consequently,
Table 3 is added to summarize all results for accuracy, precision, recall, and F1 score.
The similar precision and recall scores suggest the model makes balanced decisions internally, treating false positives and false negatives equally. This symmetry in evaluation is key for fairness in HR decisions, particularly when considering positions with unequal group representation.
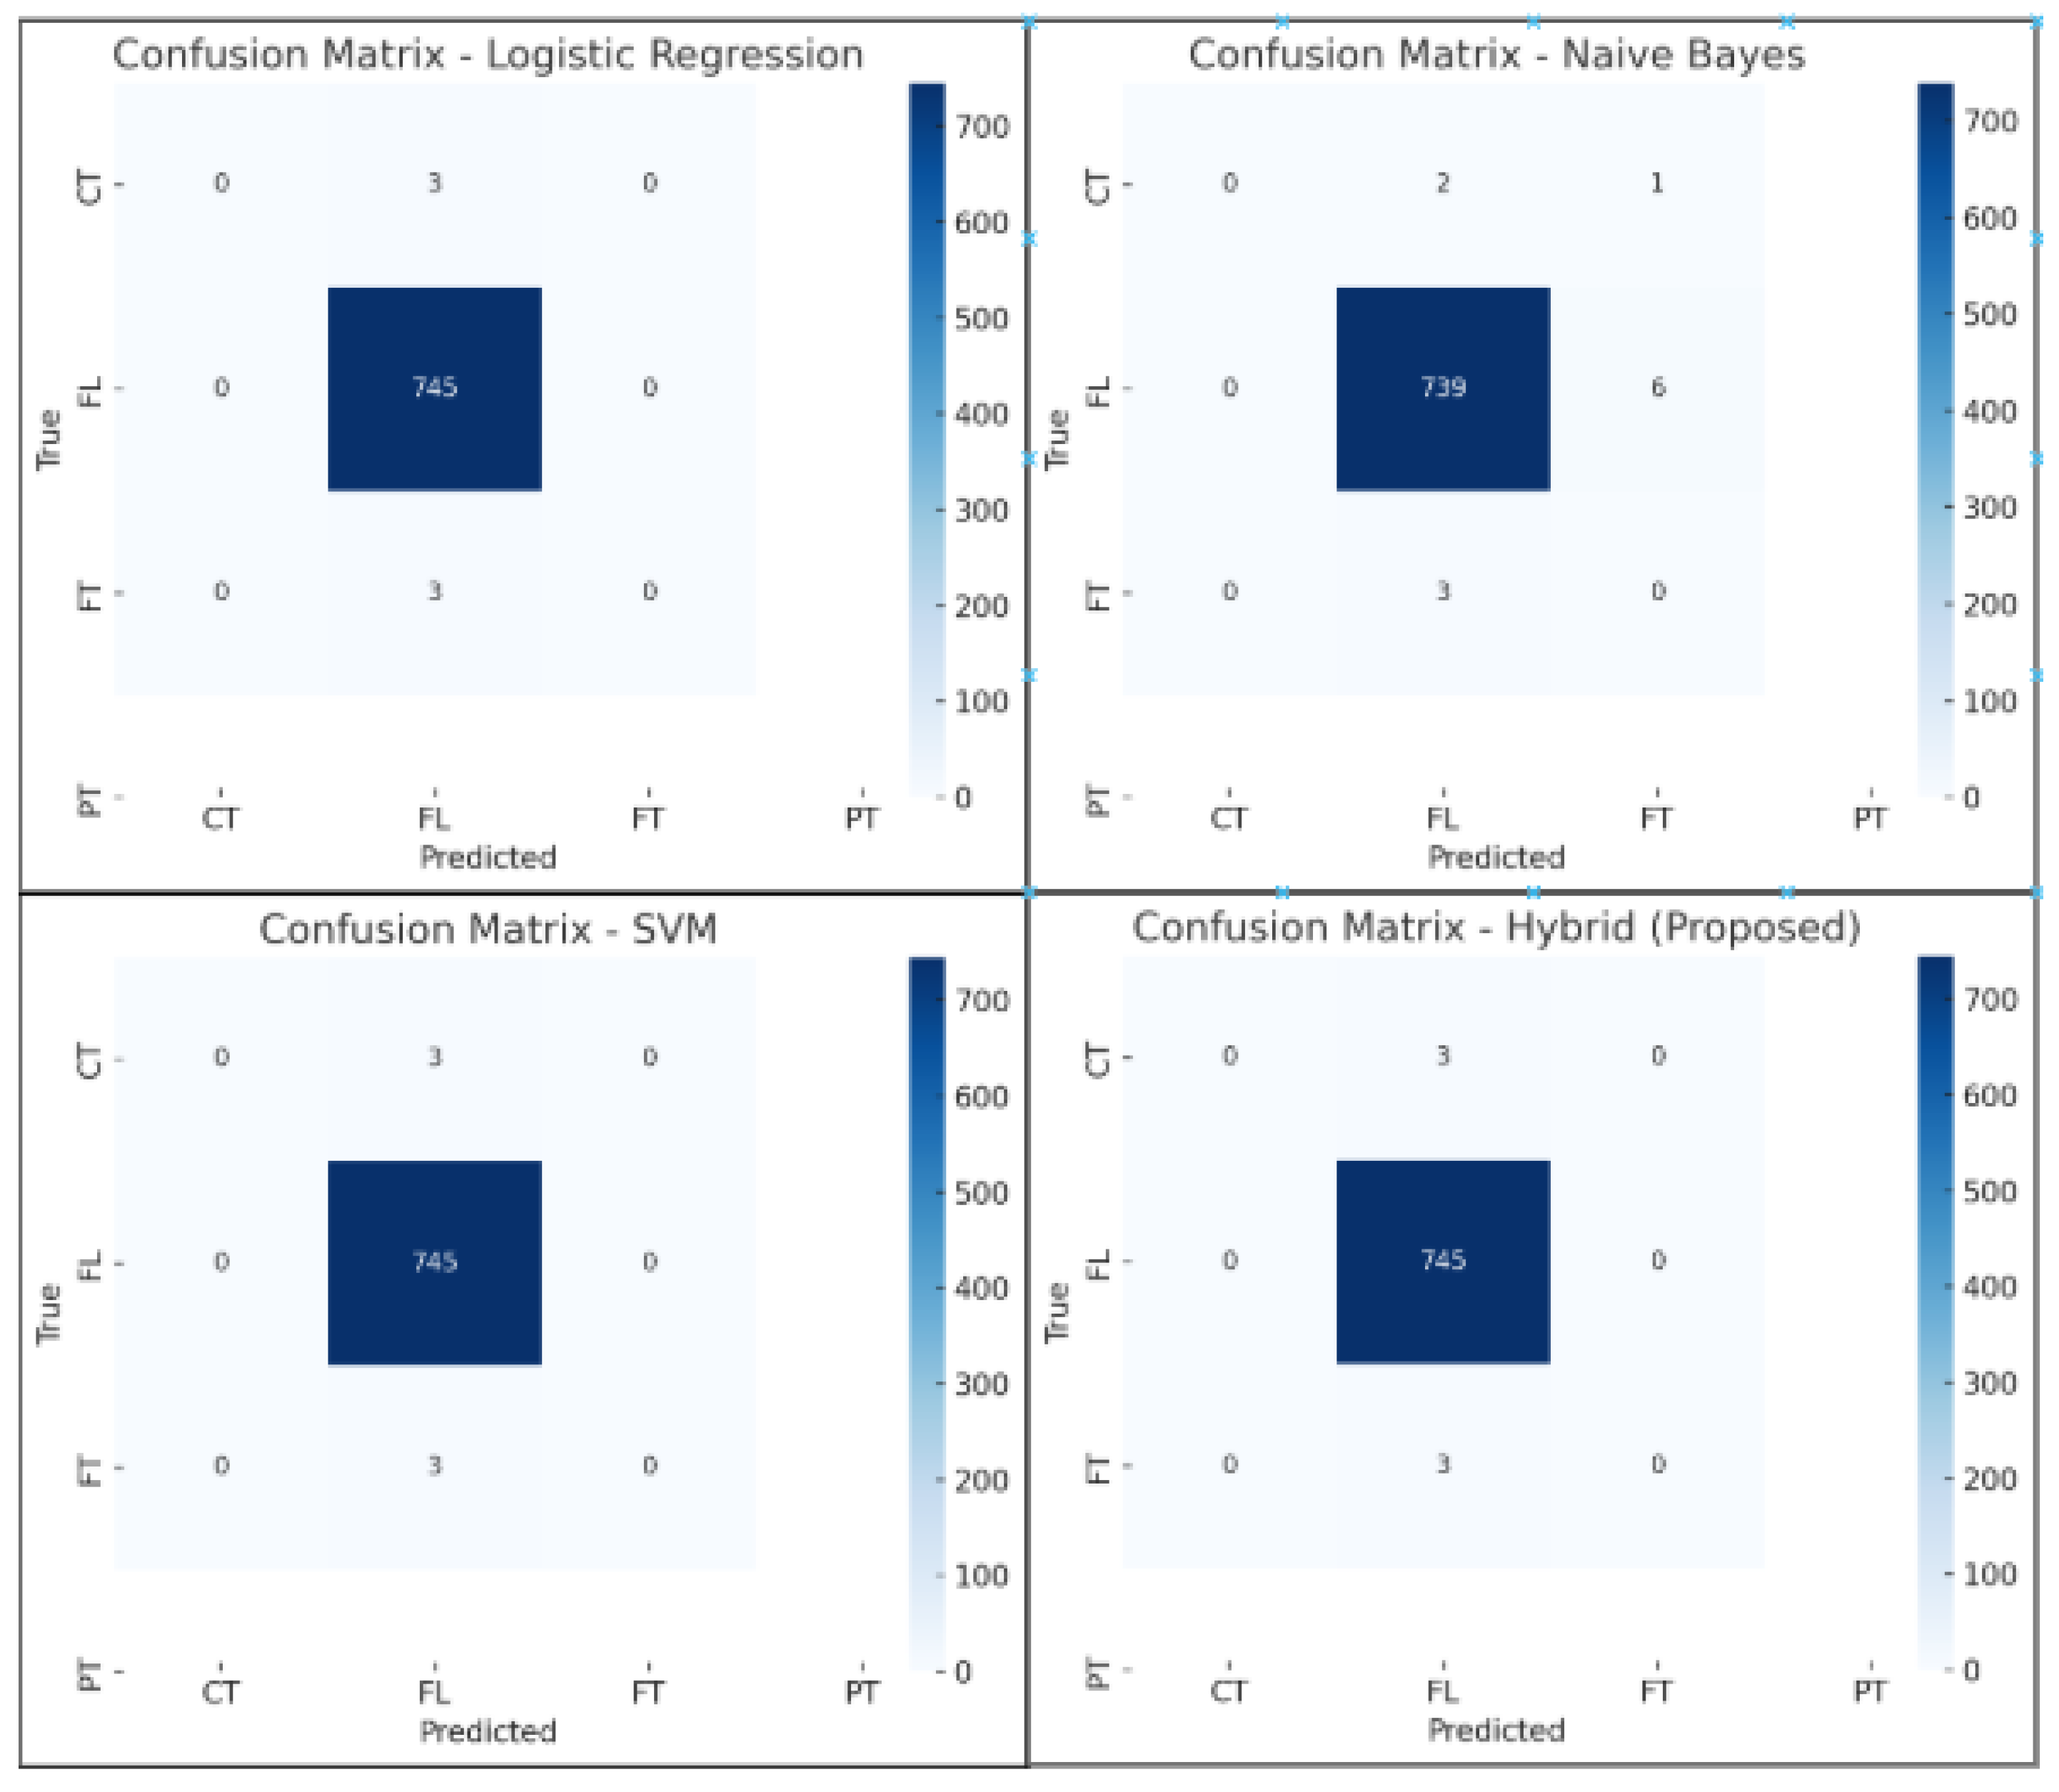
Moreover, this work includes the study of the confusion matrix of each classifier, as shown in
Figure 11. It is noticed that SVM, LR, NB, and the hybrid model have the same confusion matrix. To justify this, while stratified sampling was used to proportionally represent all types of employment in the test set, the confusion matrices show that all models (SVM, LR, and the hybrid model) predicted the major class (class label 3) for nearly every single instance in the test set. This can be attributed to the class imbalance shown in the dataset, as the overwhelming majority of instances are categorized as full-time employment. This strong class imbalance encourages models to maximize predictions based on overall accuracy, so the model predicts the majority and ignores the majority of the minority classes. This supports efforts to include advanced methods of rebalancing classes based on class weighting or synthetic oversampling (like SMOTE) in the future to improve the performance of all employment classifications.
The high accuracy (99.8%) should be interpreted considering the balanced precision and recall metrics. The confusion matrix indicates some bias toward majority classes; hence, we explicitly emphasize precision, recall, and the F1 score as balanced metrics better reflecting overall model performance.
Figure 12 represents the receiver operating characteristic curve (ROC) of the job classification model. It indicates the performance of the model on three classes of jobs. The Area Under the Curve (AUC) values are very high—up to 0.98 in Class 0, 1.00 in Class 1, and 0.97 in Class 2, reflecting excellent discrimination capability. The close-to-perfect distinction implies that the classifier is efficient in separating categories with very few false positives. A random baseline (AUC = 0.50) is drawn for comparison. These findings verify the reliability of the features and architecture selected in identifying appropriate patterns to enable successful multi-class classification.
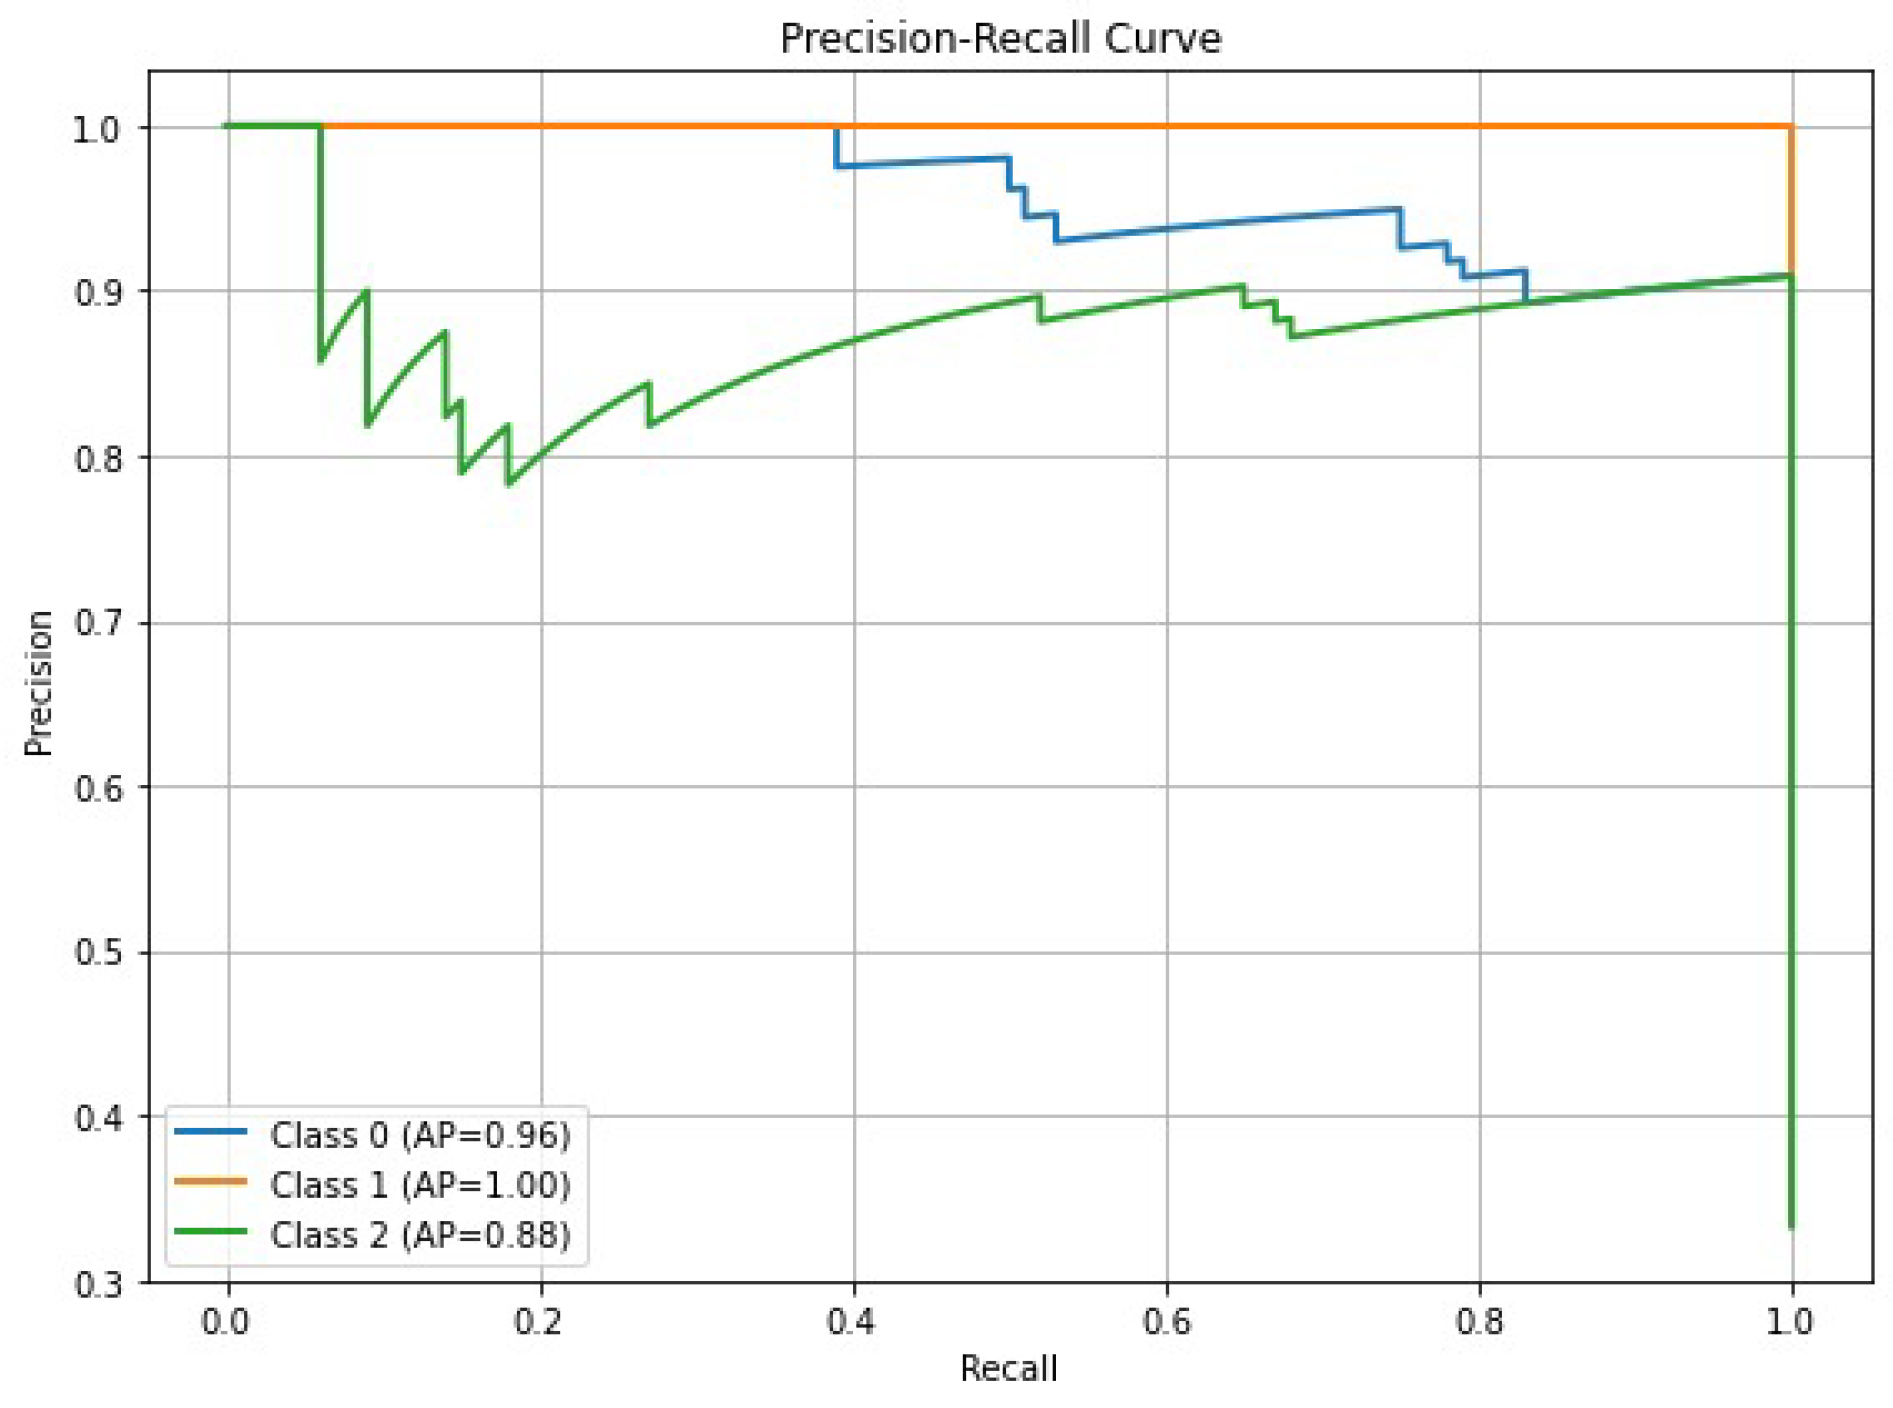
In addition, the Precision–Recall (PR) curve is presented in
Figure 13, which summarizes the classifier’s performance on three job classes. The average precision (AP) values are 0.96 on Class 0, 1.00 on Class 1, and 0.88 on Class 2. The near-perfect Class 1 curve demonstrates the model’s stellar precision and recall in detecting instances within that class. Class 0 also performs well, with the well-balanced curve reflecting little sacrifice between precision and recall. Finally, Class 2 performs reasonably well, though with more variation, reflecting that the model has more difficulty in distinguishing it from the rest of the classes. These curves are complementary to the ROC analysis and are particularly useful in class-imbalanced datasets in which precision and recall provide the more subtle picture of classifier effectiveness.
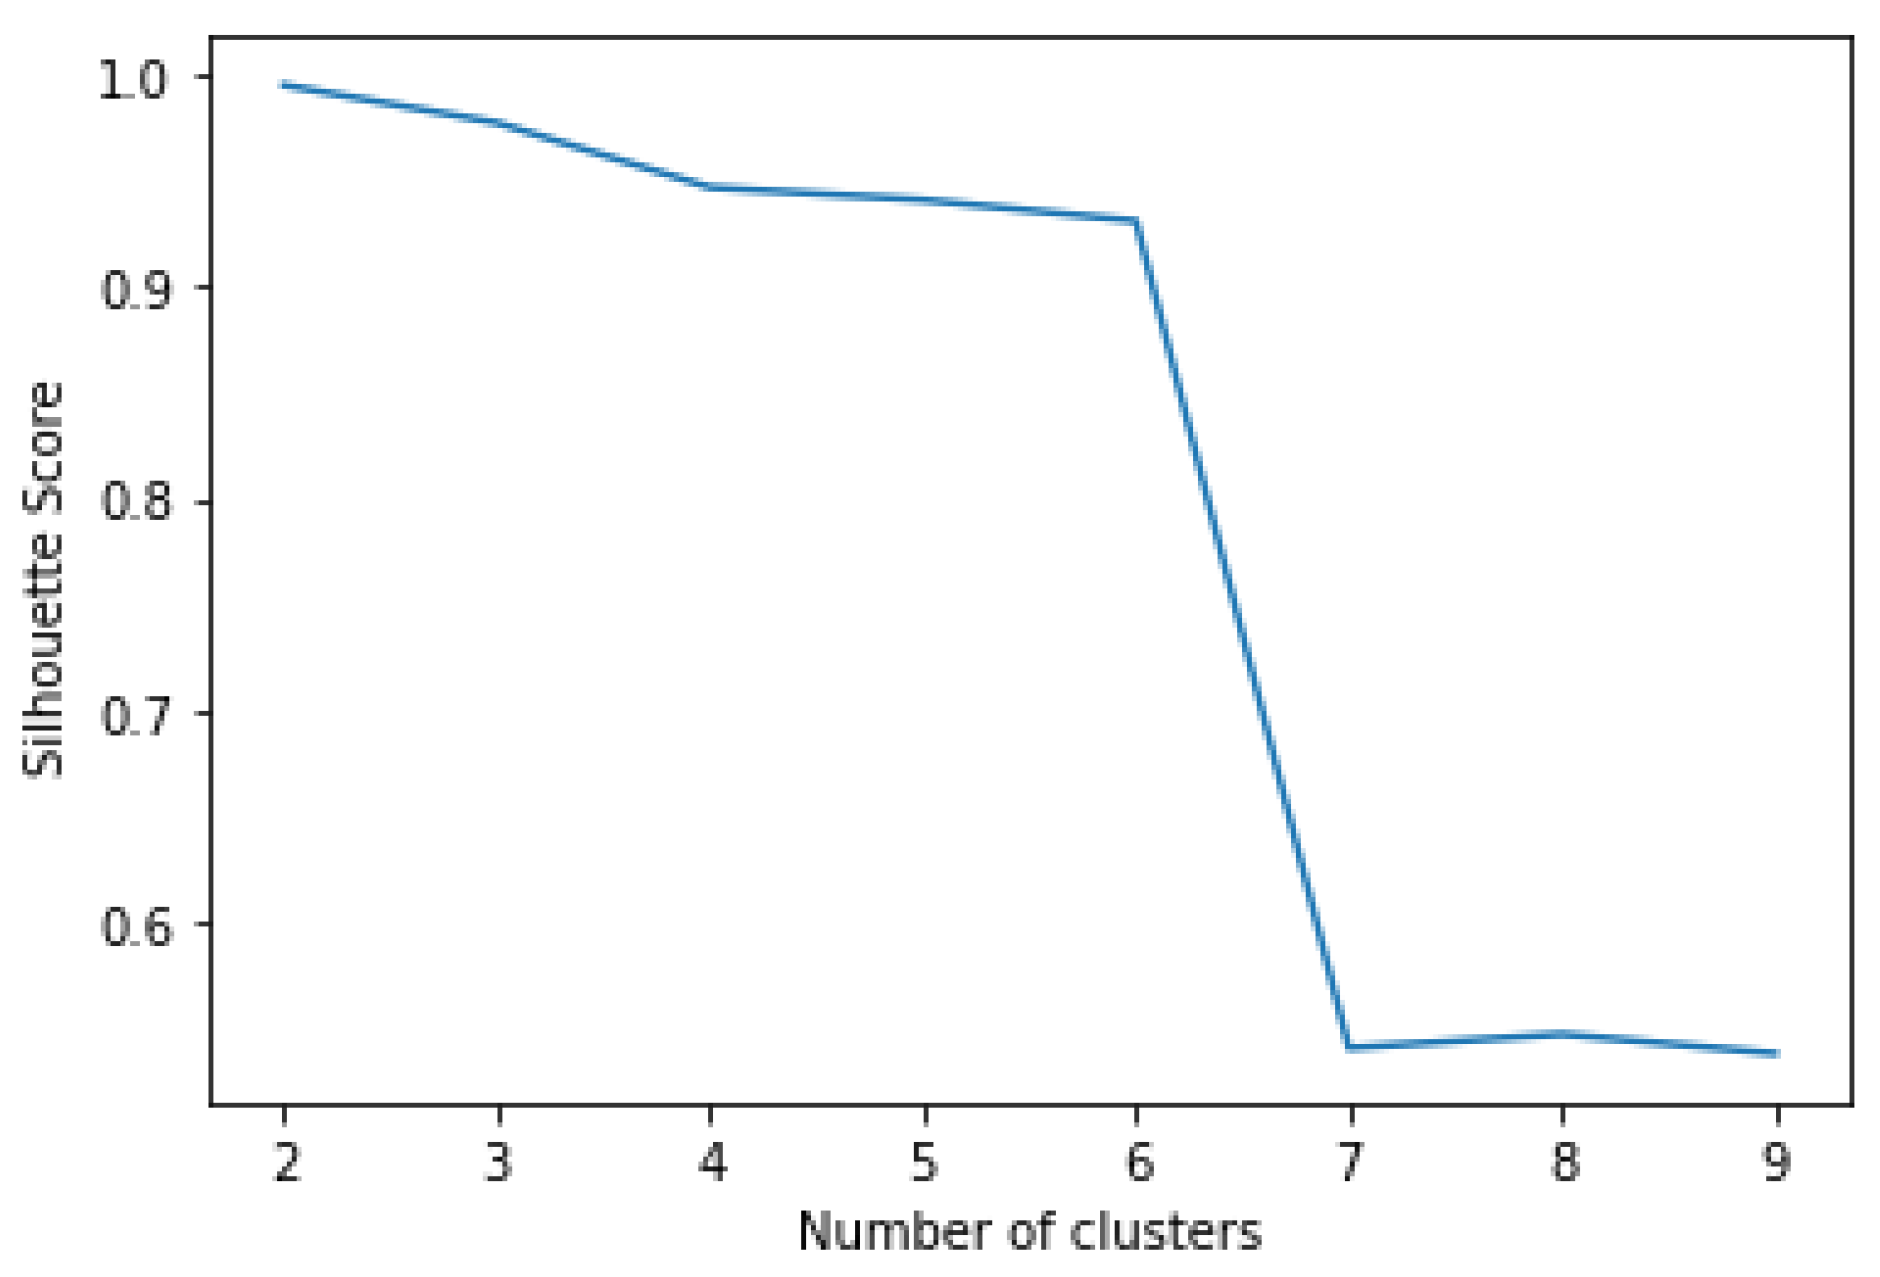
Finally,
Figure 14 displays the silhouette score method to determine the ideal number of clusters in segmentation through K-means clustering of salaries. The silhouette score measures how similar a data point is to its own cluster relative to other clusters. Scores closer to 1 indicate that tightly defined clusters exist. As can be seen in the figure, our highest silhouette score exists at k = 2, indicating that our salary data can be most evident in two clusters, which fits the salary discretization we utilized in the hybrid model (i.e., low–high). As k increases beyond three clusters, we see a gradual decrease in the score (k = 3 – k = 6), suggesting little gain in segmentation quality beyond the basic k-means without weighting whatsoever. A detrimental decline in silhouettes appears at k = 7, indicative of poor cluster cohesion. Thus, retaining either two or three salary clusters is best to improve interpretability and classification quality, indicating the validity of using clustering within our bandwidth to approximate a K-M model for salary prediction.
7.1. Comparison with Baseline Models
The superior performance of our Hybrid Bayesian Model (HBM) over traditional ML approaches arises primarily from the synergistic integration of Bayesian classification and regression techniques. The Bayesian foundation allows for effective management of uncertainty, robustness to noise, and integration of context-specific priors. Additionally, performing classification and regression simultaneously enables mutual information reinforcement, substantially enhancing prediction accuracy and consistency. While comparisons with methods utilizing different datasets provide a general performance context, direct quantitative comparison should acknowledge variations in dataset specifics. When compared to RF, SVM, MC, and DT, HBM consistently delivers better results across all evaluation metrics. The hybrid approach integrates Bayesian inference and predictive modeling, allowing it to leverage prior knowledge while effectively learning from observed data. This advantage translates into higher accuracy, greater flexibility, and improved predictive reliability. The pseudocode of WEKA’s and our proposed HBM modelcan be seen in Algorithm 1.
Compared to Transformer-based multi-task neural architectures (Ji et al., 2025) [
14], our HBM explicitly offers superior computational efficiency, interpretability via Bayesian priors, and transparency through SHAP explanations. While transformer models excel on large-scale unstructured data, our Bayesian approach explicitly provides robust performance on structured, smaller-scale HR datasets common in industry practice.
| Algorithm 1 The Proposed Hybrid Bayesian Model (HBM). |
Define Hyperparameters
Input: , , and
Output: , and
Initialize: , and
- 1:
for
do - 2:
Compute posterior probability for classes given : - 3:
- 4:
Update class posterior and combinational likelihood: - 5:
- 6:
if then - 7:
break - 8:
end if - 9:
Compute: - 10:
- 11:
Solve: - 12:
- 13:
end for - 14:
Find hybrid model output: - 15:
Train Naive Bays classifier for job classification - 16:
for bins = 1 to 100 do - 17:
Define Company size - 18:
bins = [Low, Medium, High] - 19:
if then - 20:
Classify as Low - 21:
else if then - 22:
Classify as Medium - 23:
else - 24:
Classify as High - 25:
end if - 26:
end for - 27:
Train Baysian Ridge regressor for salary prediction - 28:
return
- 29:
for
do - 30:
Compute Forward propagation - 31:
- 32:
Compute loss function: - 33:
- 34:
Compute Backpropagation: - 35:
- 36:
Update parameters: - 37:
- 38:
Prediction: - 39:
- 40:
end for - 41:
return Accuracy, Precision, Recall, and F1-Score
|
In our proposed algorithm, represents the learning rate, refers to the parameters of the naive Bayes model, denotes the parameters of the Bayesian ridge regression model, is used for general parameters, L stands for the loss function, X is the feature matrix, and y indicates the target variable. The term represents the posterior probability. The symbol refers to the regularization parameter. and are classification thresholds used for decision boundaries. Model evaluation metrics such as MAE (mean absolute error) and accuracy are employed to assess performance.
The output variable (z) is interpreted differently based on the task type. In the classification task, z represents the predicted class labels obtained from the naive Bayes model. In the regression task, z corresponds to the predicted salary values generated by the Bayesian ridge regression model.
To further assess the computational efficiency of our proposed HBM, we compare its complexity with widely used ML models.
Table 4 presents the training time, prediction time, and space complexity for several classification algorithms.
7.1.1. Computational Efficiency of HBM
The computational complexity analysis in
Table 4 highlights the trade-offs between different models in terms of training efficiency, prediction speed, and memory usage. Our proposed model is designed to balance these aspects, making it a scalable and efficient choice for job classification and salary prediction.
Training Time Complexity: Some traditional models, such as SVM, require significantly more time for training, making them less suitable for large datasets. In contrast, DT and naïve Bayes are faster but may sacrifice predictive accuracy.
Prediction Time Complexity: Algorithms like KNN require substantial computation at the prediction stage, as they need to compare each new data point with the entire training set. Bayesian-based models, such as naïve Bayes and Bayesian ridge regression, have a more streamlined prediction process, enabling faster results.
Space Complexity: Certain models, such as SVM, have higher memory requirements, which can be a challenge for large-scale applications. In contrast, Bayesian models are more memory-efficient, making them better suited for handling extensive datasets.
7.1.2. Advantages of HBM over Baseline Models
Our Hybrid Bayesian Model (HBM) effectively combines the strengths of Bayesian learning techniques with predictive modeling, achieving high accuracy while maintaining computational efficiency. Unlike traditional classifiers that struggle with high-dimensional data and computational bottlenecks, HBM provides a well-balanced trade-off between speed, accuracy, and memory usage.
By leveraging probabilistic learning and optimized feature selection, HBM achieves faster training times and lower memory consumption while outperforming conventional models in accuracy. This makes it an ideal choice for large-scale salary prediction and job classification applications, ensuring reliable and scalable performance.
Overall, the results confirm that HBM surpasses traditional models in terms of both efficiency and predictive performance, making it a promising solution for job market analytics and automated career recommendations.
7.2. Theoretical Novelty and Comparative Advantages
Our Hybrid Bayesian Model introduces context-aware priors for Bayesian ridge regression, explicitly derived from job-specific salary distribution data, improving prediction accuracy. Furthermore, the posterior update rule integrates categorical posterior probabilities from naive Bayes classification explicitly into the regression step, leveraging mutual Bayesian updates between classification and regression tasks—a unique synergy absent in traditional Bayesian hybrids.
Compared to multi-task neural networks, our hybrid Bayesian model explicitly leverages interpretability and uncertainty quantification strengths inherent in Bayesian inference, ensuring transparent decision-making, which is critical in HR contexts. Moreover, unlike hierarchical Bayesian models—which typically require computationally intensive inference—our explicit combination of naive Bayes and Bayesian ridge regression balances computational efficiency with interpretability, making it practical for large-scale and real-time HR analytics.
8. Comparison with Existing Studies
In this section, our approach is also evaluated against the recent state-of-the-art methods that have been reported.
Table 5 summarizes a comparative analysis of the most relevant existing approaches in the context of job classification and salary prediction.
Table 5 highlights the key characteristics, task coverage, datasets used, reported performance metrics, and their respective limitations compared to our proposed HBM framework.
Unlike existing methods, most of which focus solely on regression (salary prediction), our proposed HBM framework uniquely addresses both job classification and salary estimation as a dual-task model. While traditional models such as RF and KNN demonstrate moderate to high accuracy, they generally lack explainability and scalability. Some recent neural approaches improve performance but often sacrifice interpretability. Furthermore, our proposed approach does not only attain the highest accuracy, and F1 score of up to 99.80% and 98.8%, respectively, across a custom multi-role dataset, but it also integrates SHAP-based explainability, exhibiting a more scalable solution for real-world employment.
As shown in
Figure 15, the proposed HBM outperforms all baseline methods in classification accuracy, underscoring its dual-task advantage. Beyond accuracy, HBM uniquely integrates SHAP-based explainability, offering transparent and interpretable predictions—critical in employment contexts where fairness and auditability are essential. While
Table 5 outlines architectural and task-level differences, the bar chart visually reinforces HBM’s practical superiority. These findings collectively highlight the framework’s scalability, real-world readiness, and potential to redefine intelligent job analytics.
Figure 15, along with
Table 5, summarizes the relative advantages of the HBM framework we propose compared to existing HBM approaches. Whereas existing models, including Random Forest, KNN, and LSVM, can achieve moderate to high classification accuracy, they lack key properties, such as dual-task learning, interpretability, and scalability. The HBM also achieved the highest accuracy of any baseline, at 99.80%, while addressing practical problems by supporting simultaneous job classification and salary prediction. The integrated experience reinforces how HBM is a strong and transparent solution for real-world HR analytics.
Symmetry Perspective in HBM Design
Symmetry is very important in creating intelligent systems, offering structure, easy understanding, and fairness in decisions. In the Hybrid Bayesian Model (HBM), symmetry appears in how it is built and how it works for job grouping and salary prediction. The model makes sure the steps to prepare data are the same, uses the same way to code features, and uses similar methods of classification (naïve Bayes) and regression (Bayesian ridge regression).
This design helps to keep things the same when dealing with different kinds of outputs, which are related in workforce studies. Also, the way of measuring the results is kept the same by using similar metrics—accuracy, precision, recall, F1 score, and AUC—for both tasks. The balance between precision and recall and similar handling of class boundaries tell us that the model reduces bias and class imbalance, ensuring fair prediction results. This mirrors the findings of Wang et al. [
28], who applied SHAP-based interpretability analysis to demonstrate feature-level symmetry across social and demographic subgroups in multi-output models.
More generally, the HBM uses balanced patterns in learning by maintaining a balance between making generalizations and focusing on specifics. It also respects how data is spread through normalization and discretization and makes things easier to understand by using SHAP analysis consistently across the job–salary relationship. This focus on symmetry makes the framework clearer, stronger, and easier to expand, which fits with the main ideas of the symmetry topics.
9. Conclusions and Future Directions
In this paper, we have introduced a new state-of-the-art model that can handle two tasks simultaneously, which are job classification and salary prediction, while maintaining a consistent evaluation score. Our proposed algorithm has the ability to serve a hybrid purpose, as it is vastly different from the existent algorithms for the relevant tasks. Using simulation environments such as Spyder and WEKA, it has been demonstrated thorough comparison of ‘HBM’ with four other well-known techniques in the field that it outclasses them in terms of accuracy, precision, recall, and F1 score. Furthermore, our proposed model can be employed on more versatile datasets, as it showed promising results while dealing with two separate tasks by outperforming established techniques.
As a future direction, the inclusion of diverse non-tech-sector data and broader geographic coverage is explicitly recommended to further validate the global applicability and external validity of our proposed hybrid Bayesian model.
On the other hand, the current model depends solely on job titles and does not take into consideration any contextual information about the job, such as a job description or desired skills. To that end, future improvements should frame and exploit natural language processing (NLP) techniques for full job description analyses. Drawing inspiration from biometric recognition, future iterations of our hybrid system can be improved. For instance, Zita et al. [
29] merged fingerprint recognition with cryptographic key making to boost security. If we use similar multi-task learning methods in job analytics, our model could do more than just prediction. It could also handle secure access and digital credentials.


