Abstract
The present investigation presents the field measurement and prediction of tunneling-induced surface ground settlement in Tianjin Metro Line 7, China. The cross-section of a metro tunnel exhibits circular symmetry, thereby making it suitable for tunneling with a circular shield machine. The ground surface may deform during the tunneling stage. In the early stage of tunneling, few measurement data can be collected. To obtain a better usable prediction model, two kinds of neural networks according to the model-agnostic meta-learning (MAML) scheme are presented. One kind of deep learning strategy is a combination of the Back-Propagation Neural Network (BPNN) and the MAML model, named MAML-BPNN. The other prediction model is a mixture of the MAML model and the Long Short-Term Memory (LSTM) model, named MAML-LSTM. Founded on several measurement datasets, the prediction models of the MAML-BPNN and MAML-LSTM are successfully trained. The results show the present models possess good prediction ability for tunneling-induced surface ground settlement. Based on the coefficient of determination, the prediction result using MAML-LSTM is superior to that of MAML-BPNN by 0.1.
1. Introduction
Recently, many underground spaces have been rapidly established to support the development of the economy. In particular, subway systems have been built to facilitate the movement of people. Shield construction technology has become a prevalent and useful way to establish new subway systems [1,2]. In underground shield tunneling construction, continuous advancement of the tunneling process may induce significant settlement in the overlying strata [3], posing substantial threats to both construction safety and project quality. It can also potentially cause structural damage to buildings located on the ground near the tunneling area. In shield tunneling engineering, prediction of surface ground movement and deformation is essential for ensuring the reliability, steadiness, and long-term viability of existing buildings or bridges.
Investigation of the impact of tunneling-induced surface ground settlement on existing structures has become a hot research topic in shield tunneling engineering [4,5,6]. Cao et al. [7] investigated ground deformation and the displacement of neighboring structures caused by large-scale SPB TBM tunneling in clay. The results showed structures move synchronously with the ground, with stiffer structures resisting deformation more effectively. Cast-in-place piles between tunnels and bridges block deformation propagation. Liang et al. [8] developed a laboratory device to assess shield tunnel tail grout performance across different soils. They tested three grouts, evaluating properties such as deformation, strength, and permeability through SEM and MIP analysis. The results indicated that grout performance is dependent on composition, pressure, and soil permeability. Furthermore, optimized grout formulations applied in Beijing Metro Line 12 reduced track bed deformation by 30%, demonstrating their effectiveness in deformation control. The compensation effect of tail grouting is limited and diminishes with distance, because the grout hardens, causing the pressure to decrease. TBM parameters affect settlements both locally and longitudinally, requiring consideration of longitudinal effects for accurate prediction. Bayen and Samanta [9] studied and explored how tunneling-induced ground movement affects buildings on shallow foundations. Using 3D FEM and lab experiments, they evaluated the responses of an RCC building near a tunnel in cohesionless soil, considering parameters like C/D ratios, volume loss, and building eccentricity. The results showed good agreement between numerical and experimental methods, offering insights for hazard assessment of buildings near tunnels. Franza et al. [10] studied building responses caused by tunneling-induced ground movements using elastic and elastoplastic continuum solutions. They compared these solutions with centrifuge test data for small-scale bearing wall buildings, examining the effects of wall openings and foundation schemes. The study also explored structural continuity effects on tunnel–structure interaction and proposed a correction factor expression for settlement through shape changes due to soil–structure interaction, validated against previous data. Liang et al. [11] proposed a probabilistic framework to evaluate the failure risk of existing shield tunnels due to under-crossing tunneling. A two-phase deterministic model combining Loganathan and Poulos’ method with a longitudinal beam-spring model (LBSM) was presented to assess tunnel responses. Validated via case histories and compared with prior methods, this model effectively predicts tunneling-induced deformations. Global sensitivity and Monte Carlo analyses revealed that ground modulus and joint stiffness uncertainties mainly affect settlement and joint behavior, with tunnel clearance and new tunnel diameter significantly influencing the allowable volume loss and failure modes. Liu et al. [12] explored the mechanism of rear grouting deformation in shield tunneling using novel lab equipment. X-ray diffraction and scanning electron microscope analyses revealed the micromechanics of grout deformation and strength. Laboratory tests calibrated parameters for numerical analysis, optimizing predictions of ground deformation. The proposed method, verified by Beijing Metro Line 12 project data, showed high performance and accuracy compared to traditional methods. Liu et al. [13] examined the structural responses and safety of Double-O-Tunnel tunnels during shield under-crossing. The results showed dynamic deformation patterns, stress changes, and the impact of twin-tunneling and tail grouting causing torsional deformation of the tunnel. Key findings included deformation phases, peak distributions, stress calculations, and the influence of boundary constraints. In general, these investigations emphasize the significance of comprehending and solving tunneling-induced surface ground settlement or deformation to preserve the reliability and steadiness of the infrastructure. Ongoing studies are designed to improve critical tunneling technologies and alleviate the potential related risks.
Some investigations have been performed to study strategies or techniques for alleviating tunneling-induced structure deformation [14,15,16]. Masini et al. [17] discussed compensation grouting efficiency, which depends on grout, soil, and injection properties. In clayey soils, efficiency is high initially but may decrease with time due to pore-water pressures. In sandy soils, volume loss from pressure filtration reduces efficiency. An analytical model evaluated filtration losses, showing efficiency improved with lower soil permeability and higher bentonite content; experimental data aligned well with model predictions, validating the approach. Bilotta and Russo [18] evaluated the effectiveness of pile rows in protecting buildings near shallow tunnels using 3D finite-element analysis and centrifuge tests. The results showed significant settlement reduction with very small pile spacing, while larger spacing can still reduce horizontal strain, preventing building damage. Bai et al. [19] discussed the Bund Tunnel, a 14.27 m diameter tunnel constructed using a super-diameter earth pressure balanced shield in Shanghai. To protect nearby historical buildings during tunneling, three protection techniques were employed: underground cut-off walls for distances less than 5 m, grouting reinforcement for distances between 5 and 10 m, and refined construction parameters for distances exceeding 10 m. Monitoring results showed these measures effectively reduced deformation and ensured safety. Moreover, forecasting the tunneling-induced surface ground settlement is an important way to avoid building deformation nearing the tunneling position. The use of artificial neural networks can offer new solutions for predicting tunneling-induced surface ground deformation and settlement [20,21,22]. Lei et al. [23] proposed a novel and effective method for reconstructing lost data in structural health monitoring using deep convolutional generative adversarial networks. This method shows remarkable effectiveness in recovering both the high-frequency details and low-frequency outlines of lost signals, demonstrating strong alignment with real signals in both the time and frequency domains. A case study validated the method’s efficiency and accuracy in modal identification and strain data reconstruction, even when dealing with a high data loss ratio. Overall, the method represents a valuable solution for data reconstruction in SHM systems affected by sensor faults or transmission failures. Lei et al. [24] presented an innovative two-stage framework for detecting damage in cable-supported bridges, which combined Bayesian Neural Networks (BNNs) for displacement prediction and a Mahalanobis distance-based method for anomaly detection. The BNN model demonstrated excellent performance in quantifying uncertainty and predicting displacement, while the GEV distribution effectively established thresholds for anomaly detection. Validation using real monitoring data from the Jiangyin Yangtze River Bridge illustrated the practical effectiveness of this method in identifying component abnormalities, offering a valuable tool for bridge maintenance and safety management. Artificial intelligence algorithms, such as support vector machine and random forest, are adapted to most regression problems because they do not consider sequential data [25,26]. Datasets used regarding tunneling-induced surface ground deformation are sequential. Hu et al. [27] proposed a prediction model for shield tunneling-induced ground settlement, combining machine learning with finite element mesh optimization. By integrating four machine learning algorithms with four optimization algorithms, they developed 16 models. By evaluation using data from a Changsha subway project, they discovered that the GA–SVR model, when used with a 1.4 m finite element mesh, demonstrated the highest prediction accuracy and generalization ability. Ground settlement caused by the shield at a previous time affects surface deformation in the present. Recurrent neural networks (RNNs) have been developed for dealing with the sequential task. However, the defects of RNNs include the following: Gradient vanishing and explosion problems, RNN’s difficulty in capturing long-term dependencies in long sequences, and sensitivity to the input sequence length. Reflecting this, the long short-term memory (LSTM) deep learning method has been applied to handle time-series datasets to improve robustness. Zhang et al. [28] introduced an LSTM-based deep learning method to simulate soil stress–strain behavior, which involved data preparation, network structure determination, and optimization. Compared to feedforward and feedback neural networks, LSTM showed superior exactness and convergence ratio. Laboratory test data verified its performance, and a new phenomenon of “bias at low-stress levels” was identified and analyzed. In addition, different location situations have a large impact on land surface settlement in tunneling engineering. There are not enough datasets for similar environments. Traditional deep learning models can achieve remarkable predictive accuracy when trained on sufficient data to represent physical phenomena. However, their predictive accuracy decreases significantly when the training data are limited [29]. Therefore, using several sequential datasets to train models for predicting surface ground settlement is very important in real-world engineering to assist workers in adjusting the working parameters of the shield machinery. Meta-learning, having a special gradient update mechanism, can improve the learning ability of artificial neural networks using few datasets and equip models with enhanced flexibility. Verma et al. [30] presented a meta-learning generative model for solving the generic zero-shot learning issue. At the base-training stage, the model imitates zero-shot learning by tackling tasks with separate, nonoverlapping categories and enhances its generalization capacity through novel category tasks in the meta-training stage.
In the present study, combining the advantages of LSTM and meta-learning, a Model-Agnostic Meta-Learning (MAML) and LSTM model is presented, named MAML-LSTM, to predict the surface ground deformation caused by shield machine tunneling. A MAML-BPNN model, a combination of the Back-Propagation Neural Network (BPNN) and the MAML, is also trained using several sequential datasets. The coefficient of determination is used to evaluate the prediction capability of the two models. The paper is arranged as follows: The measurement approach is introduced in Section 2. The methodology used in this study is detailed in Section 3. The results and discussion are presented in Section 4. The final section provides the conclusions of this study.
2. Measurement
2.1. Site Conditions and Geological Conditions
Two side-by-side tunnels were used to connect the Liulitai Station to Haiguangsi Station, which belongs to Metro Line No.7, in Tianjin, China. The left and right lines of the Liulitai-Haiguangsi Station Metro are both 593.403 m long. The shield tunnel segments, possessing a circular symmetry, are 1.5 m wide, and 350 mm thick, with an internal diameter of 5900 mm and an external diameter of 6600 mm. The segment wedge is 39.6 mm. The shield machine starts from Haiguangsi Station’s short mileage end. The left and right lines are parallel, with a spacing of 17.2 m. The route runs straight along Weijin Road from Haiguangsi Station to Liulitai Station. The longitudinal profile shows both lines sloping downward at 9.107‰ to Liulitai Station. The tunnel’s structural top has a soil cover thickness of 12.06–16.55 m. The geometric scale of the tunnel and the underground location are given in Figure 1. Shield construction began and finished with the left tunnel first, and subsequently, the shield machine proceeded to excavate the right tunnel. This approach can help reduce differential ground settlement caused by construction of the two tunnels.
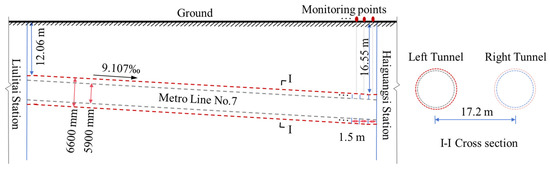
Figure 1.
Schematic diagram of the tunnel for Metro Line No.7.
According to geological survey results, the entire tunnel for Metro Line No.7 is constructed in silty clay, sandy silt, silty sand, and below the water table. The mechanical properties of these three types of soil are poor and collapse can easily occur, which implies that many challenges require to be solved to avert significant ground settlement. The random finite element method can be utilized to handle deformation or settlement in complex strata [31,32,33]. The different boundary conditions and complicated constitutive behaviors for soft ground contribute significantly to the high time cost of numerical analysis. In consequence, an artificial neural network model is established and trained to rapidly predict the surface ground deformation caused by tunneling to meet the requirements of real-world engineering.
2.2. Surface Ground Settlement
During the shield machine tunneling of the left line, a monitoring point was set along the longitudinal line direction to monitor the surface ground deformation. The first fifty monitoring data points are selected at the start of shield machine tunneling of the tunnel from Haiguangsi Station and are plotted in Figure 2. The ground settlement at the same transverse section is shown in Figure 2a. Transverse sections 4 and 23 correspond to tunnel segments 4 and 23, respectively. The maximum ground settlement occurs at the centerline of the left tunnel, and as the distance increases from this centerline, the surface ground deformation decreases. This phenomenon is similar to that reported by Zhang et al. [26]. The maximum surface ground settlements at different tunnel segments were selected as the investigation target, as shown in Figure 2b. The monitoring points used to measure the surface settlement are distributed along the centerline of the left tunnel, as shown in Figure 1. Adjacent monitoring points are spaced 1.5 m apart, equivalent to the width of a single tunnel segment. Every monitoring point is associated with a particular tunnel segment. The initial fifty monitoring points account for a total tunnel excavation length of 75 m. Moreover, it should be noted that the size of the dataset corresponds to the number of completed tunnel segments. The more completed tunnel segments there are, the larger the dataset becomes. That is, dataset sizes of 1–50 correspond to tunnel segments 1–50. The monitoring data of the ground settlement show an obvious and large separation because the spacing of the surface ground to the tunnel and the parameters of the shield machine change at different shield tunnel segments. This means that the parameters of the shield machine need to continuously change to reflect the new situation. The surface ground deformation is found to range from −23.2 mm to 20.6 mm. It should be noted that the negative value indicates ground depression, while the positive value represents ground heave. The occurrence of ground heave may result from several factors. Soils with low stiffness or high groundwater levels can lead to heave. Improper control of the excavation face pressure, shield machine parameters like speed, or over-excavation may also cause this phenomenon.
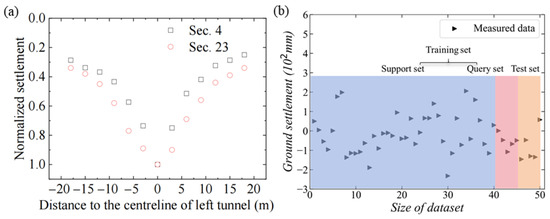
Figure 2.
Surface ground settlement during shield tunneling. (a) ground settlement at cross section. (b) ground settlement of different datasets.
In shield tunneling construction, the factors influencing ground settlement have been researched extensively for years. Analysis of prior research by Liu et al. [34], Sha et al. [35] and Su et al. [36]), suggests that six main factors are primarily responsible for surface ground settlement when the shield machine digs a tunnel. These include the soil type, soil chamber pressure of the shield machine, groundwater level, tunneling speed, soil discharge rate during shield tunneling, and the spacing from the top of the tunnel to the ground surface. In prediction model training, the remaining five parameters are set as input parameters, while the soil type is removed because the soil type is similar. The surface ground settlement is set as the target prediction parameter. The datasets are divided into three parts: a support set, a query set, and a test set. Of the total dataset, 80% is used as a support set, 10% as a query set, and the remaining 10% is set as the test set, as shown in Figure 2b. It should be noted that all the datasets are sequential datasets.
Figure 3a–e present the soil chamber pressure of the shield machine, groundwater level, tunneling speed, soil discharge rate during shield tunneling, and spacing from the top of the tunnel to the ground surface, respectively. The five parameters are measured during tunnel construction. The key observation is that none of the parameters remain constant across all tunnel segments, indicating variability in tunneling conditions. Since no two tunnel segments share identical values for all parameters, the training and testing datasets are entirely distinct. Therefore, if a model trained on the training dataset performs well on the test dataset, it indicates that the model has strong generalization capability.
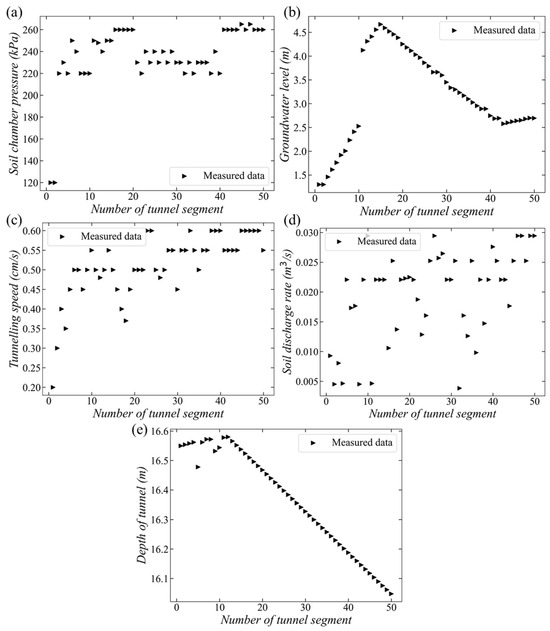
Figure 3.
Measured parameters during shield tunneling. (a) soil chamber pressure, (b) groundwater level, (c) tunnelling speed, (d) soil discharge rate, (e) depth of tunnel.
3. Methodology
3.1. Predictive Model Architectures Based on Model-Agnostic Meta-Learning
MAML is a meta-learning algorithm aimed at training models that can rapidly adjust to various scenarios of tunneling-induced surface ground settlement. The goal of meta-learning is to enable models to leverage prior knowledge for fast adaptation and optimal performance on new tasks. MAML optimizes the model’s initial parameters so that it can quickly converge on new tasks. Its core idea is to find initial parameters that allow the model to achieve good performance with minimal gradient updates on new tasks. Moreover, in MAML, the query set and test set both assess model performance but have distinct roles. The query set, used in the outer loop update, helps optimize the initial parameters for quick adaptation to new tasks. The test set independently evaluates generalization without participating in training. Using the test set in training causes data leakage and overfitting, inflating generalization estimates. Thus, keeping the test set independent is crucial for accurate and reliable evaluation. The detailed process of the MAML algorithm is given as follows:
In the base-training stage, the support set is utilized to train the model, where the gradient descent can be performed and the parameters are updated according to the initial parameters (i.e.,) of the model:
And then the query set is used to test the predicting ability of the model with the parameters . The loss () in the model for every query set can be calculated and the total loss function (L) can be obtained:
Then, the new parameters () can be renewed using the gradient descent method, as follows:
where represents the base learning rate, which controls the parameter updating amplitude. is the meta-learning rate, which determines the step length of the meta-updates and affects modification of the parameters () of the support and query datasets.
Due to its special structure, the MAML architecture not only improves the model’s capacity to learn the surface ground settlement in given conditions but also explores its generalizability in other conditions. MAML serves as the meta-learner and the network architecture acts as the base learner. In the present study, the network architecture includes two types: the LSTM network and BPNN, which will be introduced in the following sections. The whole process starts by optimizing the initial parameters based on the support set, followed by quick updates during the meta-learning stage to adjust the model for the new dataset, as given in Figure 4.
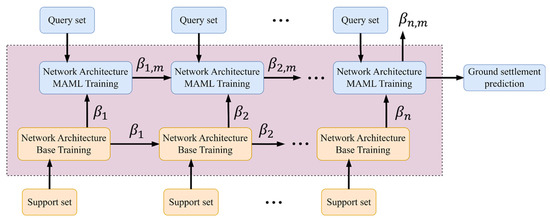
Figure 4.
Architectures of predictive model based on MAML.
Next, the network architecture of BPNN will be introduced. BPNN is a type of multilayer forward-feeding neural network trained via the back-propagation method. It is generally utilized in fields such as pattern recognition, classification, regression, and prediction. The BP neural network is typically composed of three layers: an input layer, a hidden layer, and an output layer, as shown in Figure 5. The input and output layers are each one layer, respectively. The hidden layers have three layers: both of the first and second layers possess 128 neurons, and the third layer contains 8 neurons. The training process of the BPNN is as follows: The input data are processed via the network layer-by-layer to calculate the output result and then the error is computed between the predicted result and the true measurement result using a loss function. Then, the error is propagated back via the network to compute the gradient of each weight and update the weights and biases based on the result of gradient descent.
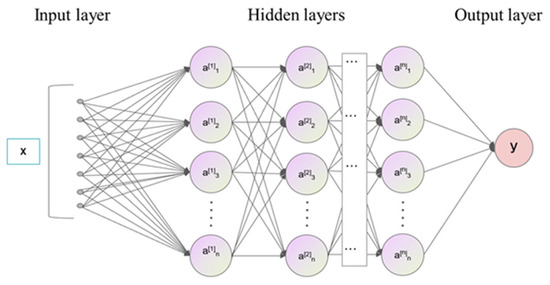
Figure 5.
Architectures of BP neural network.
The other network architecture used in the current investigation is LSTM, as shown in Figure 6. The classical LSTM model is a unique Recurrent Neural Network (RNN), which is designed to handle and learn the long-term sequential dataset. The LSTM can optimize the drawbacks of gradient vanishing or gradient explosion of the traditional RNN. An LSTM cell possesses three different gate structures that underpin the basic adjustment ability of the LSTM neural network. A memory cell Ct is used to remember and store the significant information of the previous step. Unique gate structures, including the input gate , forget gate , and output gate , are utilized to preserve the useful information of the dataset in the network. The role of the input gate is to select crucial information from a new dataset, improving the model’s prediction ability. The forget gate is used to estimate and modulate the influence of the previous dataset, removing the unimportant information. The output gate determines the model’s contribution to the prediction target task. The primary calculating process of the LSTM neural network is given as follows:
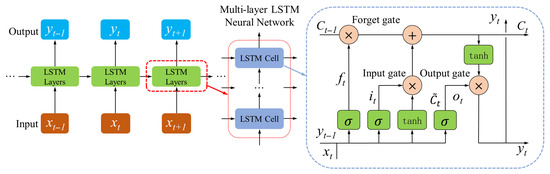
Figure 6.
Architectures of LSTM.
Forget gate:
Input gate:
Output gate:
Memory cell update:
Candidate memory cell:
State update:
where , , , and , , , are the weights and biases of the LSTM neural network, respectively. represents the Relu activation function of the unique gate, with a bounded range from 0 to 1. Thus, it has a significant impact on deciding whether the special information passes the gate or not. The LSTM model includes five hidden layers, and the number of the hidden state is 16.
3.2. Models Setting and Evaluation Metrics
The input dataset includes the important factors causing the surface ground settlement. As mentioned above, these primary factors involve geological conditions, tunnel geometry, and the shield mechanic operation parameters [26,37]. The input datasets were standardized using the StandardScaler module, which ensures all features have the same scale, improving model performance and training efficiency. In the training process, the optimizer should be determined. There are two kinds of main popular optimization methods: general gradient descent and stochastic gradient descent (SGD). SGD is an efficient and flexible optimization algorithm ideal for large datasets and complex problems. By updating parameters with individual samples and introducing randomness, SGD converges quickly and avoids local optima, making it a top choice for many machine learning and deep learning tasks. The more widely used stochastic algorithms include the Adaptive Gradient (AdaGrad) [38] and the Adaptive Moment Estimation (Adam) [39]. The present investigation uses the Adam optimizer to speed up the calculation process. Moreover, it is one of the useful ways to mitigate the overfitting of the model adopt weight decay that can effectively alleviate large model weights. The learning rate is adjusted via the CosineAnnealingLR scheduler, which uses a cosine function to gradually vary the learning rate. It declines from the initial value to a minimum and then returns to the initial value, creating a cyclical pattern. The CosineAnnealingLR scheduler offers smooth learning rate changes, aiding quick initial model convergence and reducing overfitting. Its cyclical rate adjustments from high to low and back help the model escape local optima. The training epochs of the MAML-BPNN and MAML-LSTM models are 66,220 and 102,580, respectively, which is confirmed through a trial-and-error method. The base learning rate and the meta-learning rate are set as 0.001 and 0.001, respectively, in both the two models. All the hyperparameters of the two models are as shown in Table 1.

Table 1.
Hyperparameters of MAML-BPNN and MAML-LSTM.
All the training and test tasks are performed on a host computer equipped with an Intel i7-14700K, 3.4 GHz and 20 core, 32 GB memory, and the graphics card device is NVIDIA RTX 4080, which was used to speed up the calculations.
In the present investigation, the mean squared error (MSE) served as a loss function for evaluating the difference between the predicting value and the measurement value. It is calculated according to the following equation:
where and represent the predicted value and measured value surface ground settlement, respectively.
To entirely estimate the performance of the established model in the present investigation, the Nash--Sutcliffe Efficiency (i.e., coefficient of determination: R2) was employed. Nash and Sutcliffe [40] used this metric for estimating the hydrological model. The computational method for calculating this metric is as follows:
4. Results and Discussion
4.1. Overall Performance of MAML-BPNN
Figure 7 gives the training result of the MAML-BPNN model on the surface ground deformation caused by shield machine tunneling. The ground settlement changes with the size of the dataset, as shown in Figure 7a. Here, black inverted triangles represent the measurement of ground settlement, named the train dataset, and red stars represent the prediction results of the ground settlement. It can be found that the MAML-BPNN is capable of predicting the surface ground settlement with a small error in the training data. Then, to clearly show the difference, the prediction of MAML-BPNN versus the actual measured ground settlement is plotted in Figure 7b. The trend indicates the model’s prediction accuracy, with ideal prediction following the black line. The dataset is distributed along the ideal prediction line. Moreover, the coefficient of determination (R2) for the training data of the MAML-BPNN algorithm is estimated as 0.99 and the MSE is obtained as 0.0029, which illustrates that the model predictions conform closely to the measured surface ground settlement.
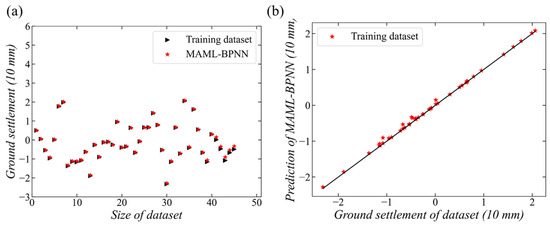
Figure 7.
Training performances of the MAML-BPNN model. (a) ground settlement versus size of dataset, (b) prediction of MAML-BPNN versus ground settlement of data set.
After using the training dataset to train the MAML-BPNN model, the test datasets are used to validate the generalization of this model. Figure 8 shows the predicted surface ground settlement of the MAML-BPNN model. In order to clearly compare the training performance, the training dataset is also included in this figure. The predictive result of the model is, in general, close to the measured test dataset. The measured surface ground settlement attributed to construction of the shield tunnel segments Nos. 47–49 is very similar to the predicted result. However, there is a larger difference between the model’s prediction and real measurement at the shield tunnel segments Nos. 46 and 50. The R2 of the MAML-BPNN model is calculated as 0.88 using the test dataset, which is lower than that using the training dataset. Moreover, the MSE is evaluated as 0.043, which is larger than that of the training stage. This phenomenon illustrates that the generalization of the MAML-BPNN model needs to be improved. Therefore, the sequential model of MAML-LSTM is applied to predict the ground settlement contributed by tunneling.
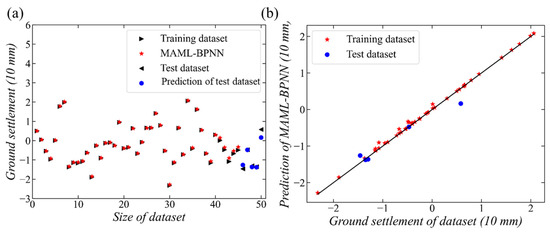
Figure 8.
Predictive surface ground settlement of the MAML-BPNN. (a) ground settlement versus size of dataset, (b) prediction of MAML-BPNN versus ground settlement of data set.
4.2. Overall Performance of MAML-LSTM
After building the sequential model of MAML-LSTM, the first step was training this model using the training dataset. Figure 9 shows the training result of the sequential model. The influence of the main parameters on the surface ground deformation was learned by the MAML-LSTM model after training. The R2 for calculating the result of the model is 0.99 and the MSE is estimated as 0.0024, which are similar values to the performance of the MAML-BPNN model for the training dataset. As a consequence, the prediction data and the training dataset show similar values at the same shield tunnel segment, as shown in Figure 9a, and the prediction result and the real ground settlement are distributed along the ideal prediction line, as given in Figure 9b.
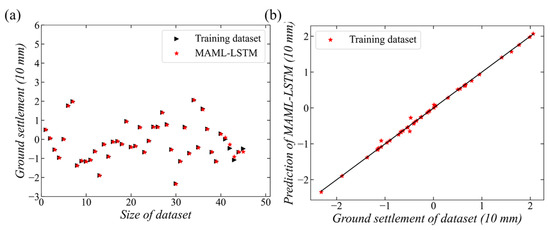
Figure 9.
Training performances of the MAML-LSTM. (a) ground settlement versus size of dataset, (b) prediction of MAML-LSTM versus ground settlement of data set.
Using a test dataset to examine the prediction ability of the ground settlement using the MAML-LSTM model is now analyzed. The predictive result is given in Figure 10. The blue circles are used to denote the ground settlement prediction of the test dataset. The figure demonstrates how the MAML-LSTM model performs in predicting ground deformation, showing both the training and testing data alongside the model’s predictions. It can be inferred that the prediction result of the trained MAML-LSTM model is extremely close to or even overlaps the test data obtained by real measurement, as given in Figure 10a. From Figure 10b, the prediction and real measurement data are distributed along the ideal trend line with a few differences. To quantify the predictive difference, R2 is estimated as 0.98, which is higher than that of the MAML-BPNN model by 0.1. The MSE is calculated as 0.0096, which is much lower than that of the MAML-BPNN model. The predictive precision of the MAML-LSTM model is superior to that of the MAML-BPNN model. This illustrates that the predictive performance of the sequential model is superior to that of the nonlinear fitting method model in a situation where the dataset possesses temporality. According to the result in Figure 3, different numbers of tunnel segments under construction have different construction parameters, causing different ground settlements. Regarding the test dataset, i.e., the number of tunnel segments equaling 46 to 50, there are not the same parameters compared to the training dataset. In particular, the difference is greatest where the number of tunnel segments is 50. This causes the predicting error to be the largest, with underprediction of the ground settlement by the MAML-BPNN model, as shown in Figure 8. However, the MAML-LSTM model considers previous impacts on the present stage, thus achieving better prediction results, as shown in Figure 10. This indicates that previous construction work will impact the ground settlement that occurs during subsequent tunnel construction. The MAML-LSTM model shows strong generalization performance of the new dataset based on the analysis above.
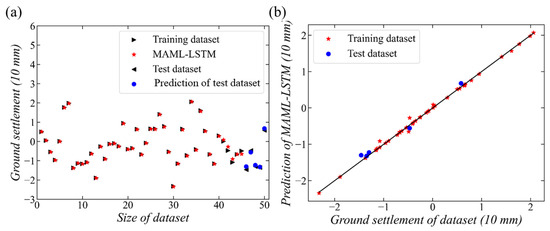
Figure 10.
Predictive surface ground settlement of the MAML-LSTM. (a) ground settlement versus size of dataset, (b) prediction of MAML-LSTM versus ground settlement of data set.
Figure 11 illustrates the prediction errors of ground settlement for the MAML-BPNN and MAML-LSTM models across datasets of sizes ranging from 46 to 50. The predicted ground settlement is calculated by subtracting the predicted value from the measured value. A negative result means the measured value is lower than the predicted value, while a positive result means the measured value is higher than the predicted value. The maximum prediction errors for the MAML-LSTM and MAML-BPNN models are estimated as 1.6 mm and 4.1 mm, respectively, for the test datasets. This indicates that the MAML-LSTM model’s prediction errors are of lower magnitude compared to those of the MAML-BPNN model. Thus, the MAML-LSTM model may have better stability and generalization capabilities and be more reliable for predicting ground settlement.
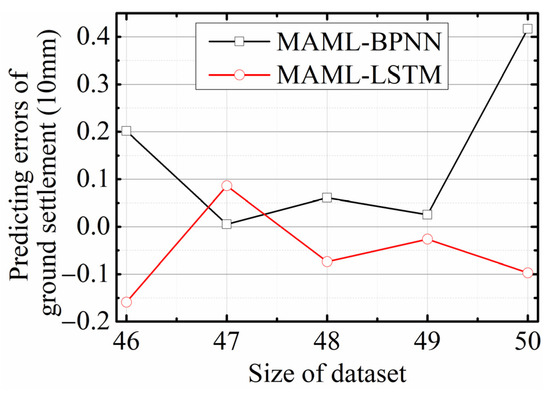
Figure 11.
Predicting errors of the two models.
In a previous study by Zhang et al. [26], a stand-alone LSTM model was established for predicting ground settlement. The R2 values for the training and predicting stages were 0.96 and 0.70, respectively. In contrast, the present study enhances the predicting performance of the LSTM model by incorporating MAML. This improvement demonstrates the advantage of combining MAML with LSTM for better prediction accuracy.
4.3. Parameter Analysis
The study shows that the MAML-LSTM model has a better predicting ability than the MAML-BPNN model. Therefore, the MAML-LSTM model was selected to study the main parameter sensitivity characteristics that affect the model’s generalization in predicting surface ground settlement, such as the number of hidden layers and the size of the training set.
Figure 12 shows the R2 values of the ground deformation prediction results for the LSTM model with different numbers of hidden layers. It should be noted that other parameters remain consistent with those in Section 3. When there are 1 or 2 hidden layer(s), the R2 value is only 0.19, indicating poor predictive performance of the MAML-LSTM model in these cases. As the number of hidden layers increases, the model’s generalization ability improves. Specifically, the R2 value rises from 0.19 (with two layers) to 0.73 with three layers. Further increases in layers show R2 values of 0.84 (four layers), 0.98 (five layers), and 0.97 (six layers) for the test dataset. The performance degradation at six layers may stem from increased model complexity leading to overfitting. This demonstrates that setting the number of hidden layers to five yields the best performance. Therefore, five layers were chosen as the optimal configuration, and subsequent analysis of how training dataset size affects predictive ability was conducted using this configuration.
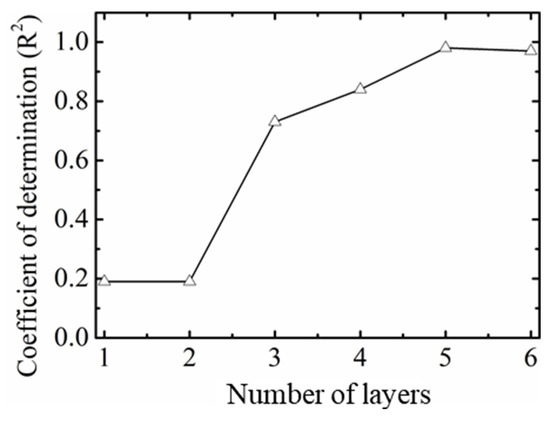
Figure 12.
Coefficient of determination of predicting result versus number of layers.
To investigate the impact of the dataset size on predictive ability, Figure 13 presents the R2 values of the MAML-LSTM model for different training set sizes. For instance, a training set size of 25 implies a support set size of 20 and a query set size of 5, with other cases following this rule. The test set size remains consistent at 5 across all scenarios. The results show that when the training set size is reduced from 45 to 25, the R2 values are 0.98, 0.94, 0.93, 0.85, and 0.77, respectively. This indicates that the MAML-LSTM model still maintains accurate predictive performance for ground settlement even when the training set size is decreased from 45 to 35.
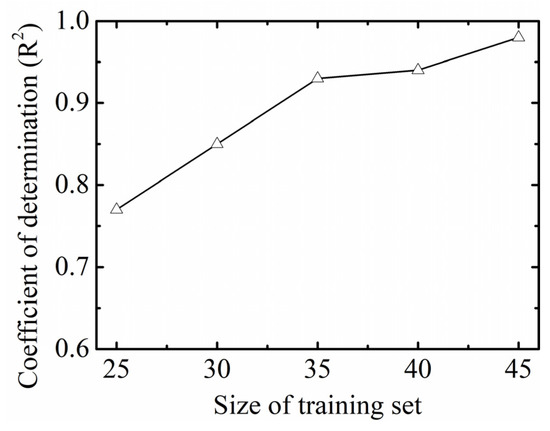
Figure 13.
Coefficient of determination of predicting result versus size of training set.
5. Conclusions
In the present study, two prediction models of the surface ground deformation attributed to shield machine tunneling in Metro Line No.7 were investigated, in Tianjin, China. The main conclusions are presented as follows:
First, a combination of MAML and BPNN models, named MAML-BPNN, was utilized to predict the tunneling-induced surface ground settlement. The coefficient of determination (R2) for the test dataset is calculated as 0.88 and the MSE is 0.043.
Second, a sequential model of LSTM was embedded in the MAML method, named MAML-LSTM, which was trained using a training dataset and verified through a test dataset. The prediction result of the MAML-LSTM is very close to the real measurement result, with R2 being 0.98 and the MSE being 0.0096.
Compared to the MAML-BPNN model, generalization of the MAML-LSTM model exhibits better performance and the sequential model is more suitable for the tunneling-induced surface ground settlement.
Moreover, the MAML-LSTM model generalizes well for predicting surface ground settlement using small sequential datasets; for instance, it achieves an R2 of 0.93 with a training dataset size of 35. This is particularly useful for practitioners predicting ground deformation when only small datasets are available. However, to continuously enhance the MAML-LSTM model’s predictive accuracy, the training dataset should be gradually expanded as the shield machine continues to work. Moreover, the current models, including MAML-LSTM, are limited by their failure to incorporate soil type variations and tunnel diameter parameters in the training data, which may limit their generalizability. Future research should focus on enhancing the training datasets with these parameters and conducting sensitivity analyses to strengthen model robustness. The integration of physical characteristics into models for predicting ground settlement is an important topic. Incorporating soil properties and soil–structure interaction will enhance accuracy and generalization of the model.
Author Contributions
Methodology, G.-B.C.; Validation, G.-B.C., W.Q. and W.-L.C.; Formal analysis, L.T.; Investigation, W.H., W.-L.C., L.T. and X.K.; Data curation, W.H.; Writing—original draft, W.H.; Writing—review & editing, G.-B.C., W.Q., W.-L.C. and X.K.; Visualization, G.-B.C.; Supervision, W.-L.C.; Project administration, G.-B.C. and W.-L.C. All authors have read and agreed to the published version of the manuscript.
Funding
This research work is supported by the National Natural Science Foundation of China [52408521], National Natural Science Foundation of China [52427812], National Natural Science Foundation of China [U2106222], Postdoctoral Fellowship Program of CPSF [GZB20230962], Fundamental Research Funds for the Central Universities, China [No. 5630114423].
Data Availability Statement
Data is contained within the article.
Conflicts of Interest
Author Wei He was employed by China Construction Eighth Engineering Division Rail Transit Construction Co., Ltd., Nanjing 210046, China. The remaining authors declare that the research was conducted in the absence of any commercial or financial relationships that could be construed as a potential conflict of interest.
References
- He, W.; Kong, X.; Tang, L.; Chen, W.; Hu, W.; Chen, G. A Preliminary Study on Mitigation Techniques for 3D Deformation of Adjacent Buildings Induced by Tunnelling in Water-Rich Strata: A Case. Symmetry 2024, 16, 1339. [Google Scholar] [CrossRef]
- Tang, S.; Zhang, X.; Liu, Q.; Xie, W.; Wu, X.; Chen, P.; Qian, Y. Control and prevention of gas explosion in soft ground tunneling using slurry shield TBM. Tunn. Undergr. Space Technol. 2021, 113, 103963. [Google Scholar] [CrossRef]
- Liu, Z.; Xue, J.; Ye, J.; Qian, J. A simplified two-stage method to estimate the settlement and bending moment of upper tunnel considering the interaction of undercrossing twin tunnels. Transp. Geotech. 2021, 29, 100558. [Google Scholar] [CrossRef]
- Chen, R.P.; Song, X.; Meng, F.Y.; Wu, H.N.; Lin, X.T. Analytical approach to predict tunneling-induced subsurface settlement in sand considering soil arching effect. Comput. Geotech. 2022, 141, 104492. [Google Scholar] [CrossRef]
- Farrell, R.; Mair, R.; Sciotti, A.; Pigorini, A. Building response to tunnelling. Soils Found. 2014, 54, 269–279. [Google Scholar] [CrossRef]
- Park, K.H. Analytical solution for tunnelling-induced ground movement in clays. Tunn. Undergr. Space Technol. 2005, 20, 249–261. [Google Scholar] [CrossRef]
- Cao, L.; Zhang, D.; Fang, Q.; Yu, L. Movements of ground and existing structures induced by slurry pressure-balance tunnel boring machine (SPB TBM) tunnelling in clay. Tunn. Undergr. Space Technol. 2020, 97, 103278. [Google Scholar] [CrossRef]
- Liang, J.; Liu, W.; Yin, X.; Li, W.; Yang, Z.; Yang, J. Experimental study on the performance of shield tunnel tail grout in ground. Undergr. Space 2025, 20, 277–292. [Google Scholar] [CrossRef]
- Bayen, A.; Samanta, M. Assessment of Building Response Supported on Shallow Foundation Due to Tunnelling in Cohesionless Soil. IOP Conf. Ser. Earth Environ. Sci. 2024, 1333, 012044. [Google Scholar] [CrossRef]
- Franza, A.; Ritter, S.; Dejong, M.J. Continuum solutions for tunnel–building interaction and a modified framework for deformation prediction. Géotechnique 2020, 70, 108–122. [Google Scholar] [CrossRef]
- Liang, R.; Zhang, Z.; Wu, J.; Li, Z.; Cao, S.; Wu, W. Probabilistic assessment of existing shield tunnel longitudinal responses to tunnelling. Int. J. Numer. Anal. Methods Géoméch. 2024, 48, 2493–2520. [Google Scholar] [CrossRef]
- Liu, W.; Liang, J.; Xu, T. Tunnelling-induced ground deformation subjected to the behavior of tail grouting materials. Tunn. Undergr. Space Technol. 2023, 140, 105253. [Google Scholar] [CrossRef]
- Liu, Y.; Liao, S.; Chen, L.; Liu, M. Structural responses of DOT tunnel induced by shield under-crossing in close proximity in soft ground. Part I: Field measurement. Tunn. Undergr. Space Technol. 2022, 128, 104623. [Google Scholar]
- Bilotta, E.; Stallebrass, S.E. Prediction of stresses and strains around model tunnels with adjacent embedded walls in overconsolidated clay. Comput. Geotech. 2009, 36, 1049–1057. [Google Scholar] [CrossRef]
- Khabbaz, H.; Gibson, R.; Fatahi, B. Effect of constructing twin tunnels under a building supported by pile foundations in the Sydney central business district. Undergr. Space 2019, 4, 261–276. [Google Scholar] [CrossRef]
- Li, Y.; Zhang, W. Investigation on passive pile responses subject to adjacent tunnelling in anisotropic clay. Comput. Geotech. 2020, 127, 103782. [Google Scholar] [CrossRef]
- Masini, L.; Rampello, S.; Soga, K. An Approach to Evaluate the Efficiency of Compensation Grouting. J. Geotech. Geoenvironmental Eng. 2014, 140, 04014073. [Google Scholar] [CrossRef]
- Bilotta, E.; Russo, G. Use of a Line of Piles to Prevent Damages Induced by Tunnel Excavation. J. Geotech. Geoenvironmental Eng. 2011, 137, 254–262. [Google Scholar] [CrossRef]
- Bai, Y.; Yang, Z.; Jiang, Z. Key protection techniques adopted and analysis of influence on adjacent buildings due to the Bund Tunnel construction. Tunn. Undergr. Space Technol. 2014, 41, 24–34. [Google Scholar] [CrossRef]
- Chen, R.P.; Zhang, P.; Kang, X.; Zhong, Z.Q.; Liu, Y.; Wu, H.N. Prediction of maximum surface settlement caused by earth pressure balance (EPB) shield tunneling with ANN methods. Soils Found. 2019, 59, 284–295. [Google Scholar] [CrossRef]
- Hasanipanah, M.; Noorian-Bidgoli, M.; Jahed Armaghani, D.; Khamesi, H. Feasibility of PSO-ANN model for predicting surface settlement caused by tunneling. Eng. Comput. 2016, 32, 705–715. [Google Scholar] [CrossRef]
- Zhang, L.; Wu, X.; Ji, W.; AbouRizk, S.M. Intelligent approach to estimation of tunnel-induced ground settlement using wavelet packet and support vector machines. J. Comput. Civ. Eng. 2017, 31, 04016053. [Google Scholar] [CrossRef]
- Lei, X.; Sun, L.; Xia, Y. Lost data reconstruction for structural health monitoring using deep convolutional generative adversarial networks. Struct. Health Monit. 2021, 20, 2069–2087. [Google Scholar] [CrossRef]
- Lei, X.; Sun, Z.; Wang, A.; Guo, T.; Nagayama, T. Estimation of Bridge Girder Cumulative Displacement for Component Operational Warning Using Bayesian Neural Networks. Struct. Control. Health Monit. 2025, 2025, 9974584. [Google Scholar] [CrossRef]
- Sahoo, S.; Russo, T.A.; Elliott, J.; Foster, I. Machine learning algorithms for modeling groundwater level changes in agricultural regions of the United States. Water Resour. Res. 2017, 53, 3878–3895. [Google Scholar] [CrossRef]
- Zhang, N.; Zhou, A.; Pan, Y.; Shen, S.L. Measurement and prediction of tunnelling-induced ground settlement in karst region by using expanding deep learning method. Measurement 2021, 183, 109700. [Google Scholar] [CrossRef]
- Hu, D.; Hu, Y.; Hu, R.; Tan, Z.; Ni, P.; Chen, Y.; Xiang, X.J.; Li, Y.S.; Liu, J. Machine Learning–Finite Element Mesh Optimization-Based Modeling and Prediction of Excavation-Induced Shield Tunnel Ground Settlement. Int. J. Comput. Methods 2024, 22, 2450066. [Google Scholar] [CrossRef]
- Zhang, N.; Shen, S.L.; Zhou, A.; Jin, Y.F. Application of lstm approach for modelling stress–strain behaviour of soil. Appl. Soft Comput. 2021, 100, 106959. [Google Scholar] [CrossRef]
- Samek, W.; Montavon, G.; Vedaldi, A.; Hansen, L.K.; Müller, K.-R. Explainable AI: Interpreting, Explaining and Visualizing Deep Learning; Springer: London, UK, 2019. [Google Scholar]
- Verma, V.K.; Liang, K.; Mehta, N.; Carin, L. Meta-Learned Attribute Self-Gating for Continual Generalized Zero-Shot Learning. In Proceedings of the 2024 IEEE/CVF Winter Conference on Applications of Computer Vision (WACV), Waikoloa, HI, USA, 3–7 January 2024. [Google Scholar]
- Griffiths, D.V.; Fenton, G.A. Probabilistic slope stability analysis by finite elements. J. Geotech. Geoenvironmental Eng. 2004, 130, 507–518. [Google Scholar] [CrossRef]
- Griffiths, D.V.; Fenton, G.A. Probabilistic Settlement Analysis by Stochastic and Random Finite-Element Methods. J. Geotech. Geoenvironmental Eng. 2009, 135, 1629–1637. [Google Scholar] [CrossRef]
- Pan, Y.; Liu, Y.; Tyagi, A.; Lee, F.H.; Li, D.Q. Model-independent strength-reduction factor for effect of spatial variability on tunnel with improved soil surrounds. Géotechnique 2021, 71, 406–422. [Google Scholar] [CrossRef]
- Liu, D.; Zhang, W.; Duan, K.; Zuo, J.; Li, M.; Zhang, X.; Liang, X. Intelligent prediction and optimization of ground settlement induced by shield tunneling construction. Tunn. Undergr. Space Technol. 2025, 160, 106486. [Google Scholar] [CrossRef]
- Sha, F.; Zhang, M.; Dong, Y.; Wang, Q.; Ni, L. A review on the key factors influencing the stability of shield tunneling. KSCE J. Civ. Eng. 2025; in press. [Google Scholar]
- Su, J.; Wang, Y.; Niu, X.; Sha, S.; Yu, J. Prediction of ground surface settlement by shield tunneling using XGBoost and Bayesian Optimization. Eng. Appl. Artif. Intell. 2022, 114, 105020. [Google Scholar] [CrossRef]
- Santos, O.J.; Celestino, T.B. Artificial neural networks analysis of são paulo subway tunnel settlement data. Tunn. Undergr. Space Technol. 2008, 23, 481–491. [Google Scholar] [CrossRef]
- Duchi, J.; Hazan, E.; Singer, Y. Adaptive subgradient methods for online learning and stochastic optimization. J. Mach. Learn Res. 2011, 12, 2121–2159. [Google Scholar]
- Kingma, D.P.; Ba, J. Adam: A method for stochastic optimization. Int. Conf. Learn 2015, 5, 1–13. [Google Scholar]
- Nash, J.E.; Sutcliffe, J.V. River flow forecasting through conceptual models part I—A discussion of principles. J. Hydrol. 1970, 10, 282–290. [Google Scholar] [CrossRef]
Disclaimer/Publisher’s Note: The statements, opinions and data contained in all publications are solely those of the individual author(s) and contributor(s) and not of MDPI and/or the editor(s). MDPI and/or the editor(s) disclaim responsibility for any injury to people or property resulting from any ideas, methods, instructions or products referred to in the content. |
© 2025 by the authors. Licensee MDPI, Basel, Switzerland. This article is an open access article distributed under the terms and conditions of the Creative Commons Attribution (CC BY) license (https://creativecommons.org/licenses/by/4.0/).