Author Contributions
Conceptualization, H.L. and J.J.; Data curation, H.L.; Formal analysis, H.L. and J.J.; Funding acquisition, J.J.; Investigation, H.L. and Z.M.; Methodology, H.L., J.J., J.L., C.L. and Z.Y.; Project administration, J.J. and Z.M.; Resources, J.J.; Software, H.L.; Supervision, J.J. and Z.M.; Validation, H.L. and L.L.; Visualization, H.L.; Writing—original draft, H.L.; Writing—review and editing, J.J. and Z.M. All authors have read and agreed to the published version of the manuscript.
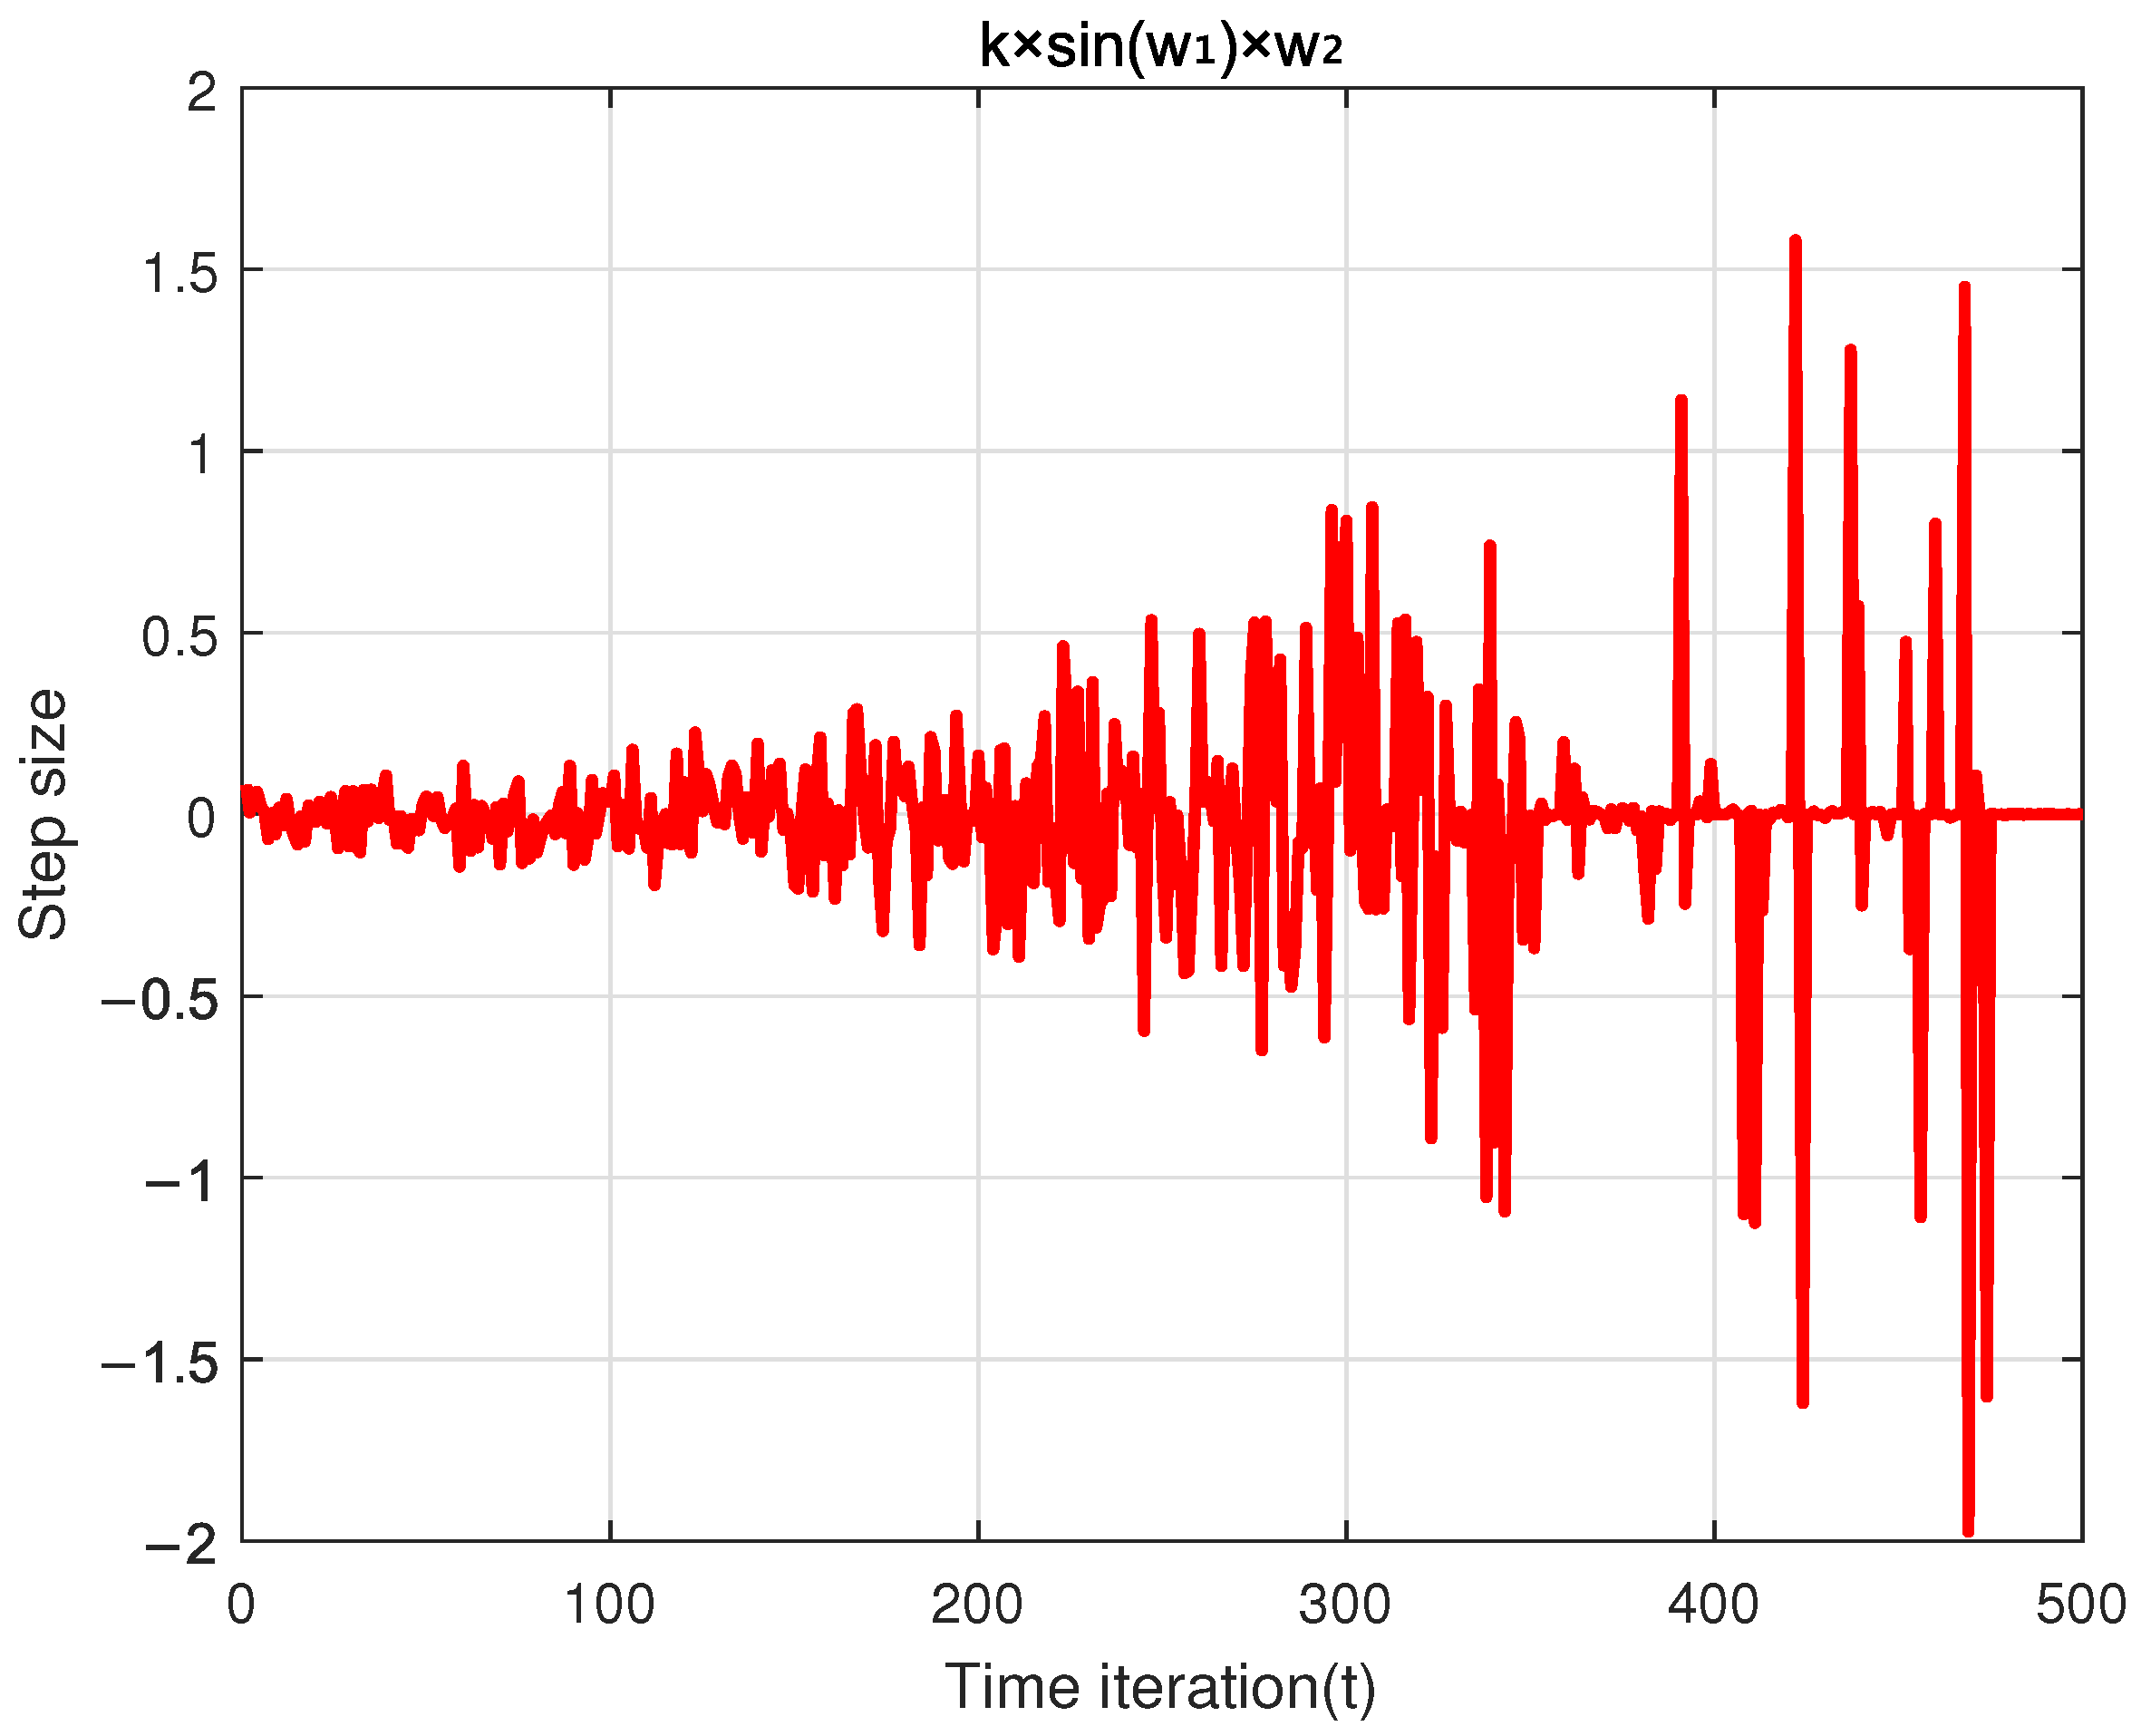
Figure 1.
The variation in step size with iterations.
Figure 1.
The variation in step size with iterations.
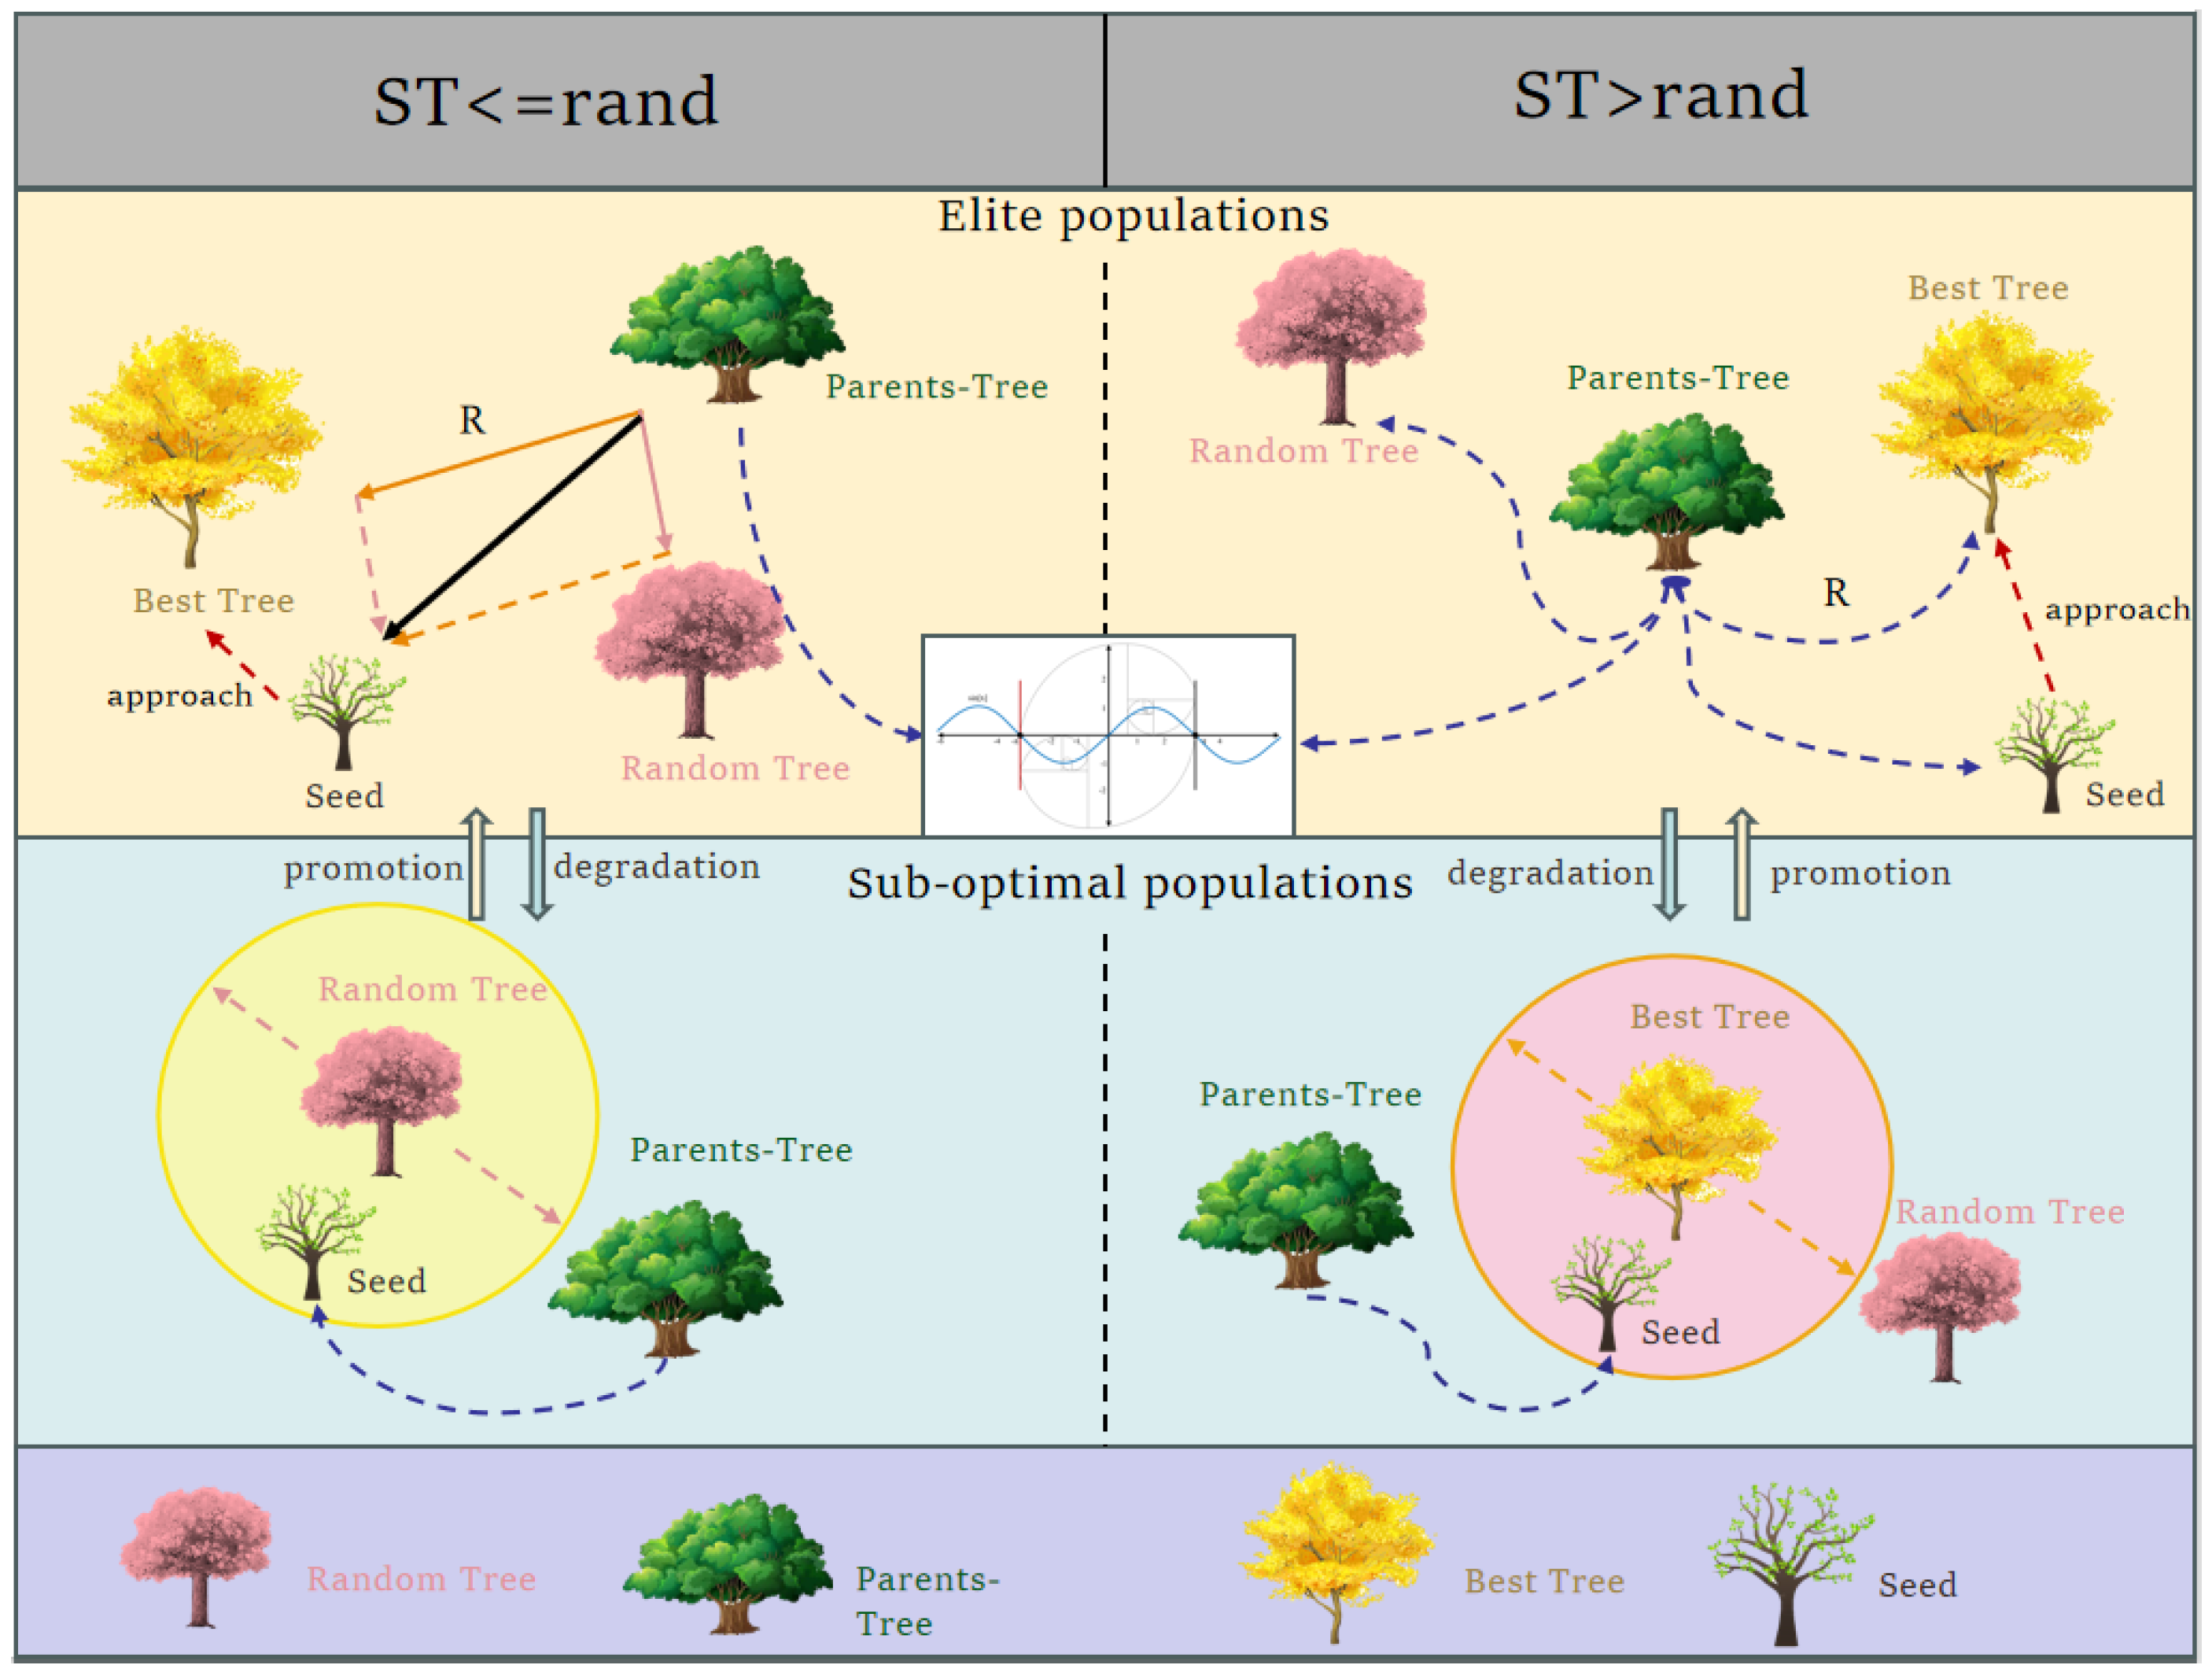
Figure 2.
The principle of dual-subpopulation dynamic update mechanism.
Figure 2.
The principle of dual-subpopulation dynamic update mechanism.
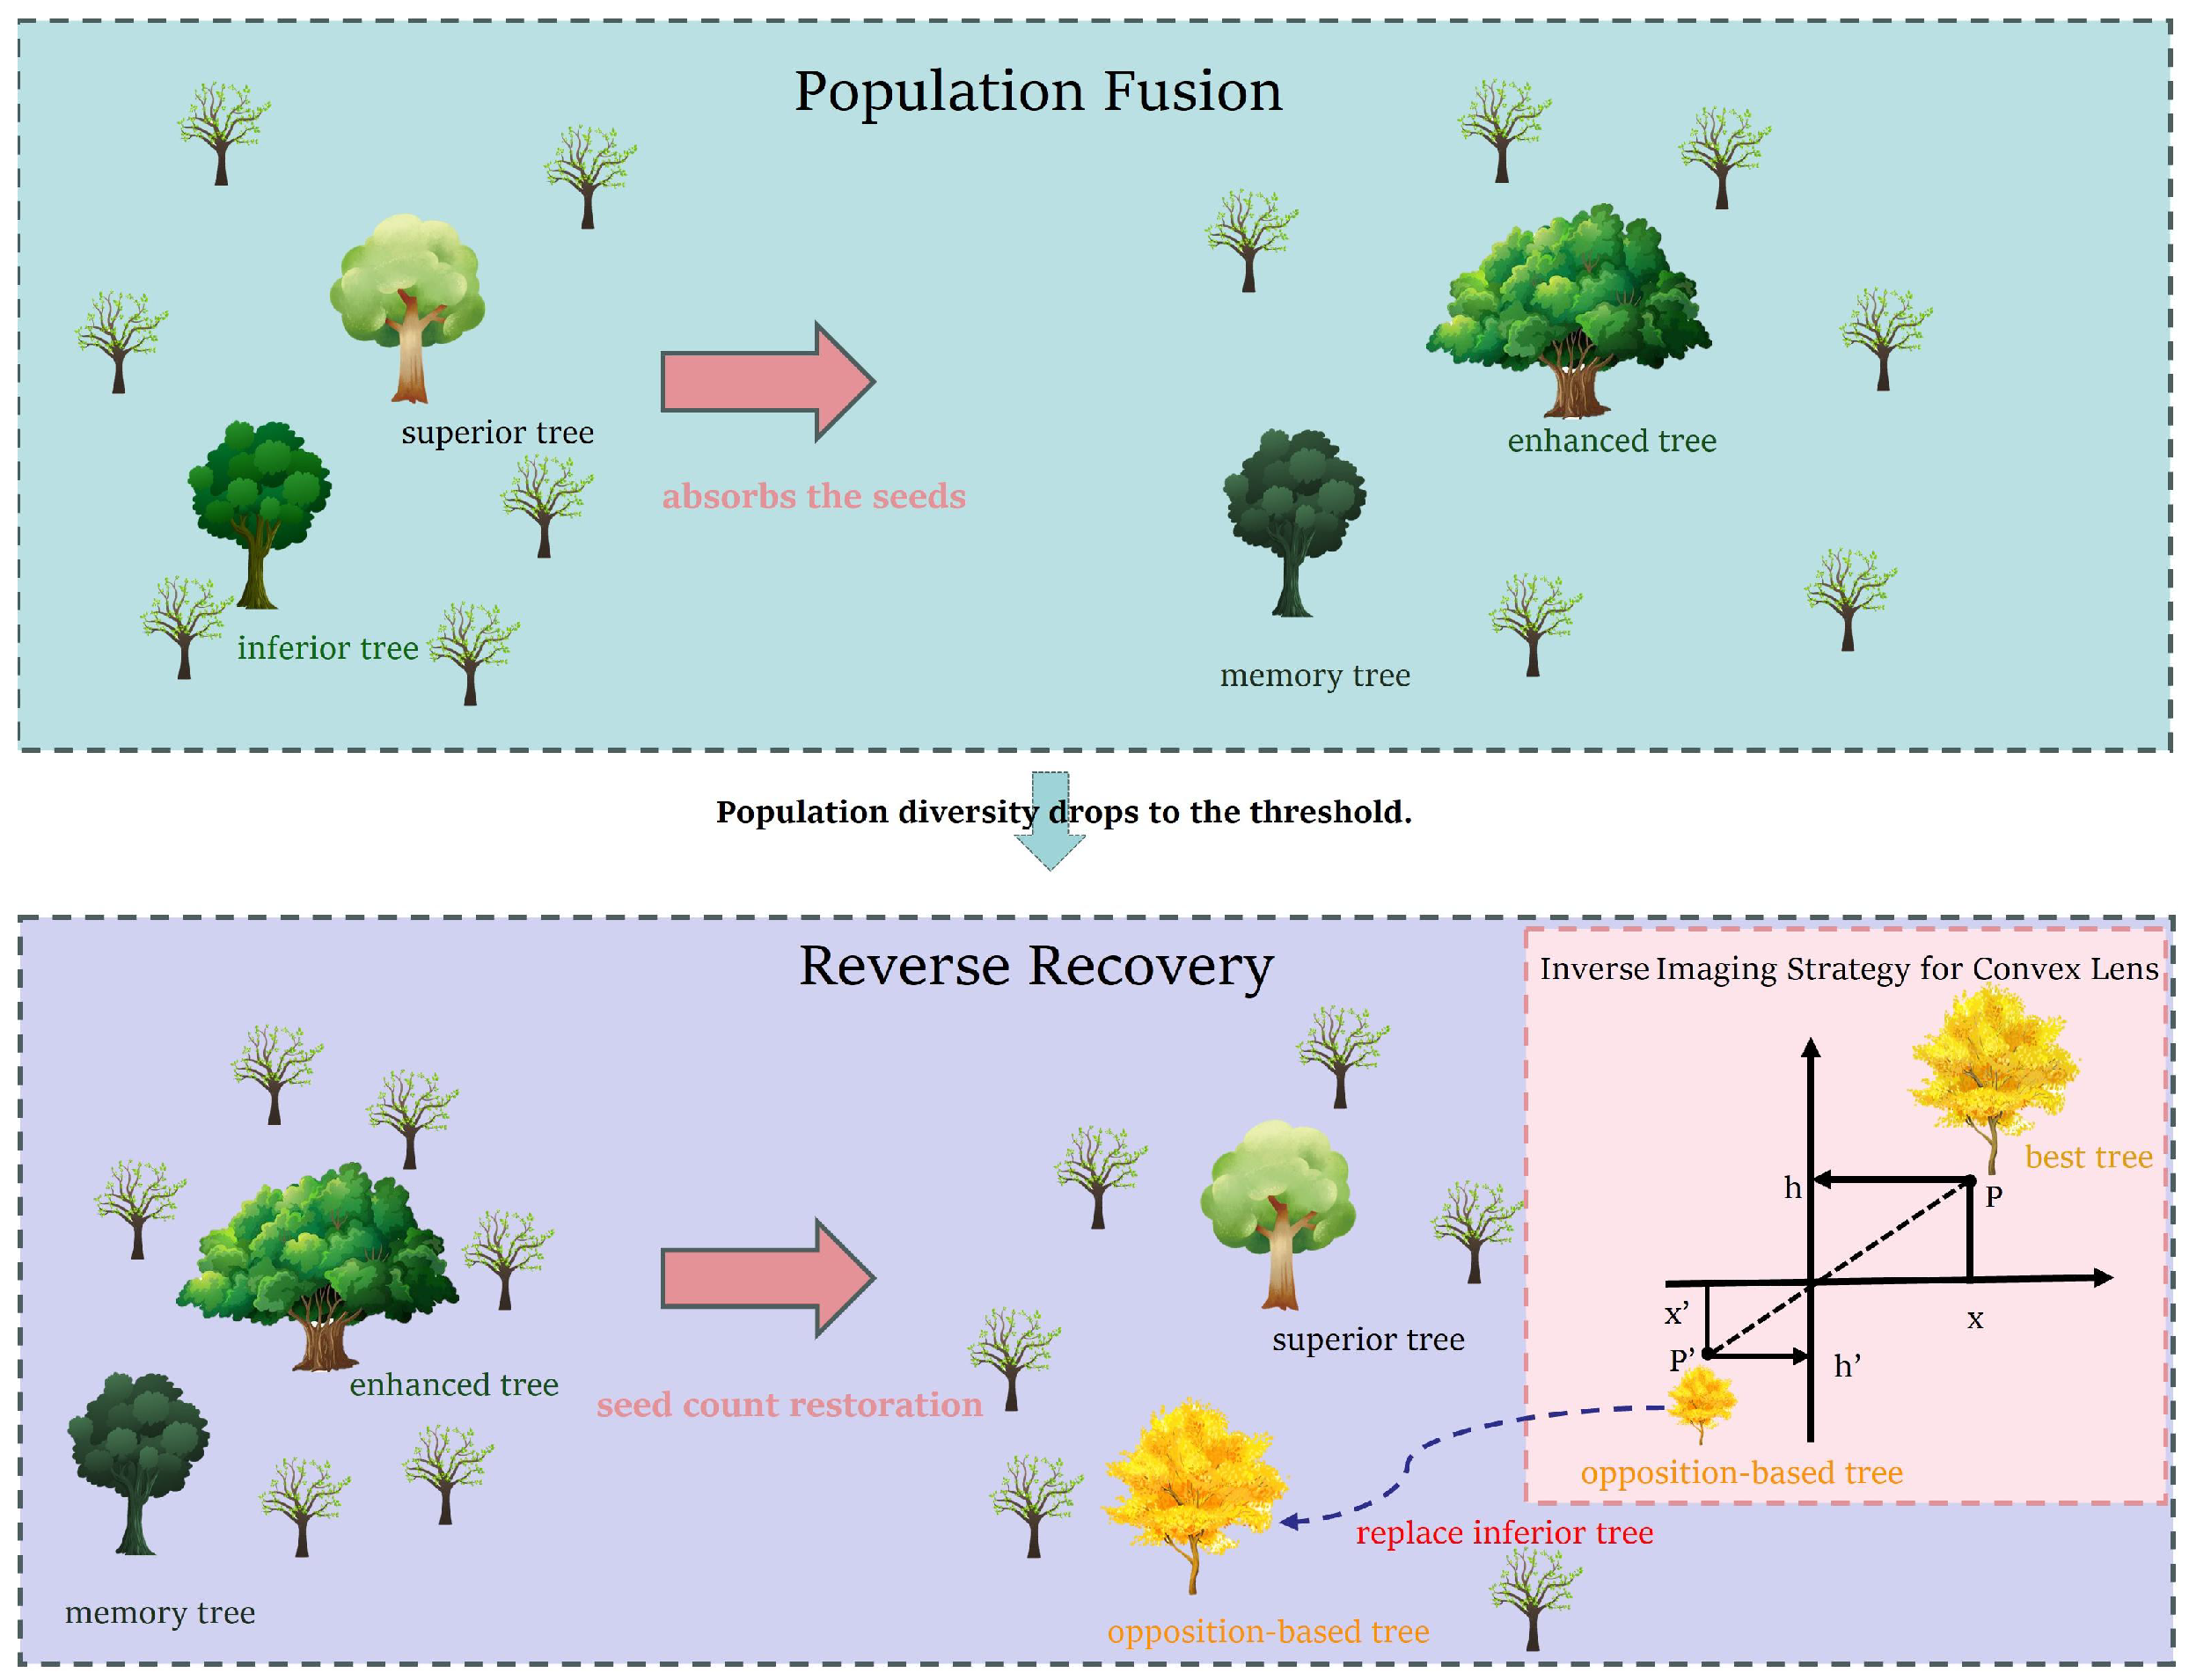
Figure 3.
Principle of population fusion and reverse recovery perturbation mechanism.
Figure 3.
Principle of population fusion and reverse recovery perturbation mechanism.
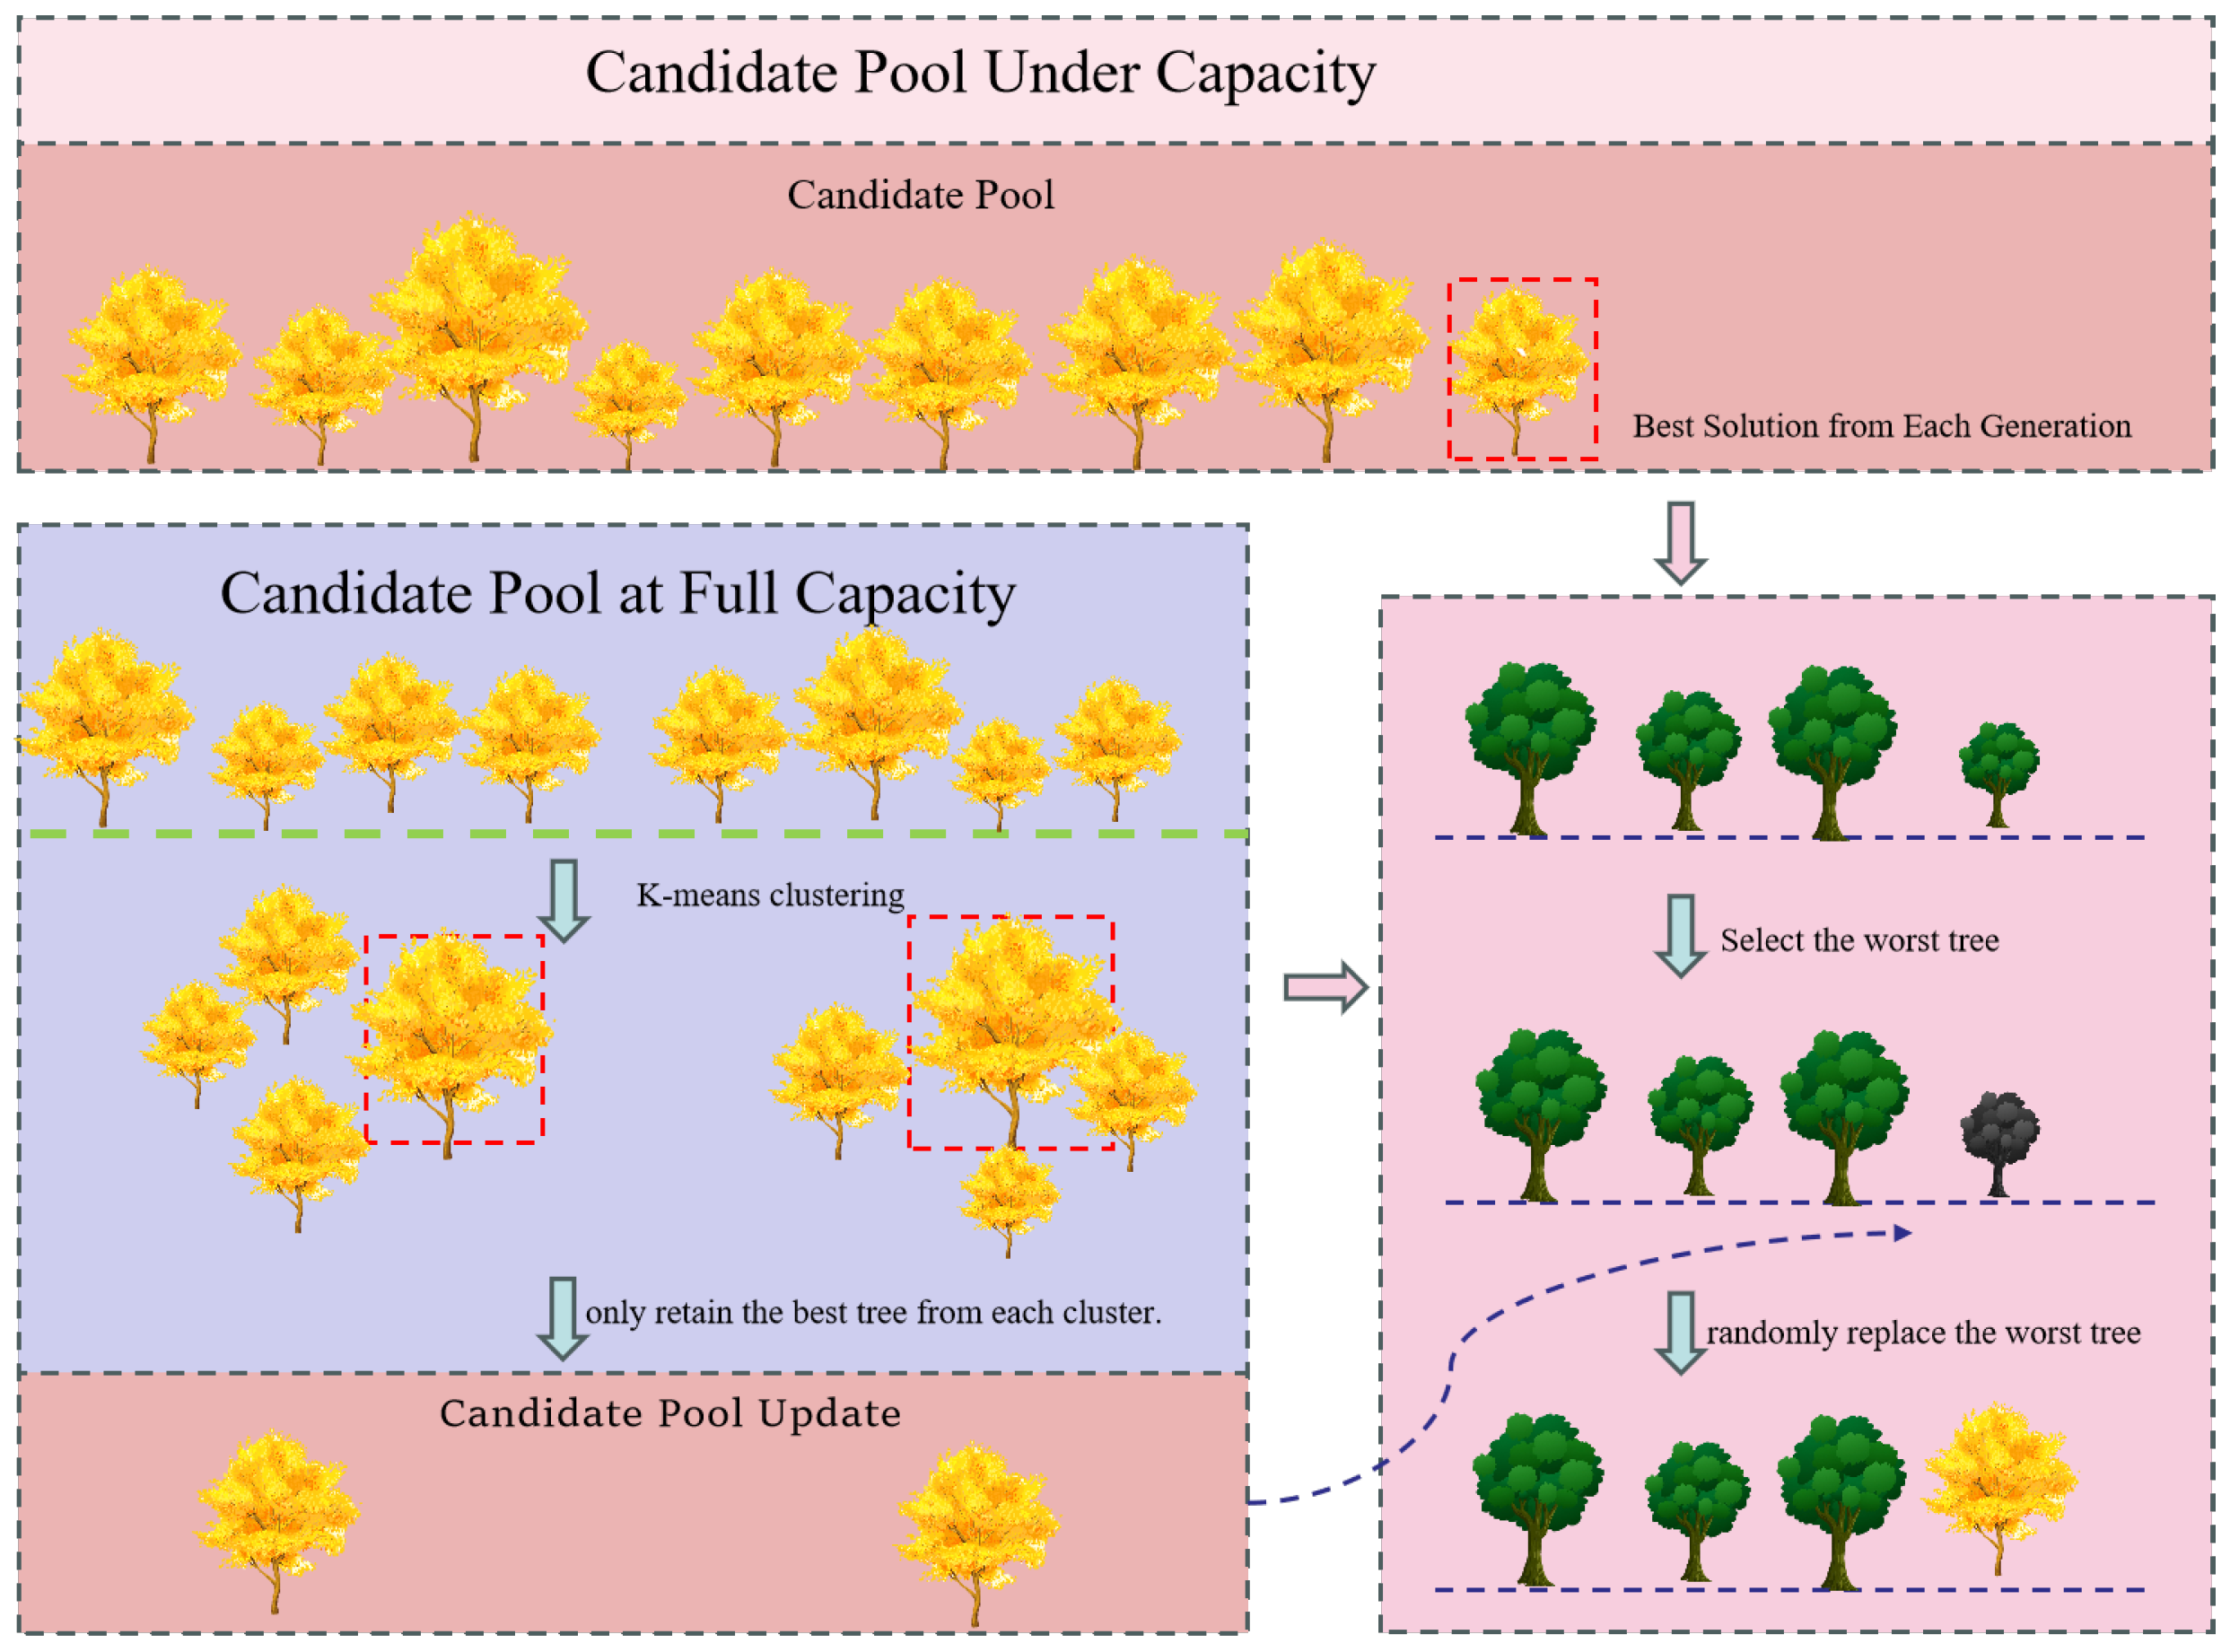
Figure 4.
Principle of dynamic clustering archive replacement mechanism.
Figure 4.
Principle of dynamic clustering archive replacement mechanism.
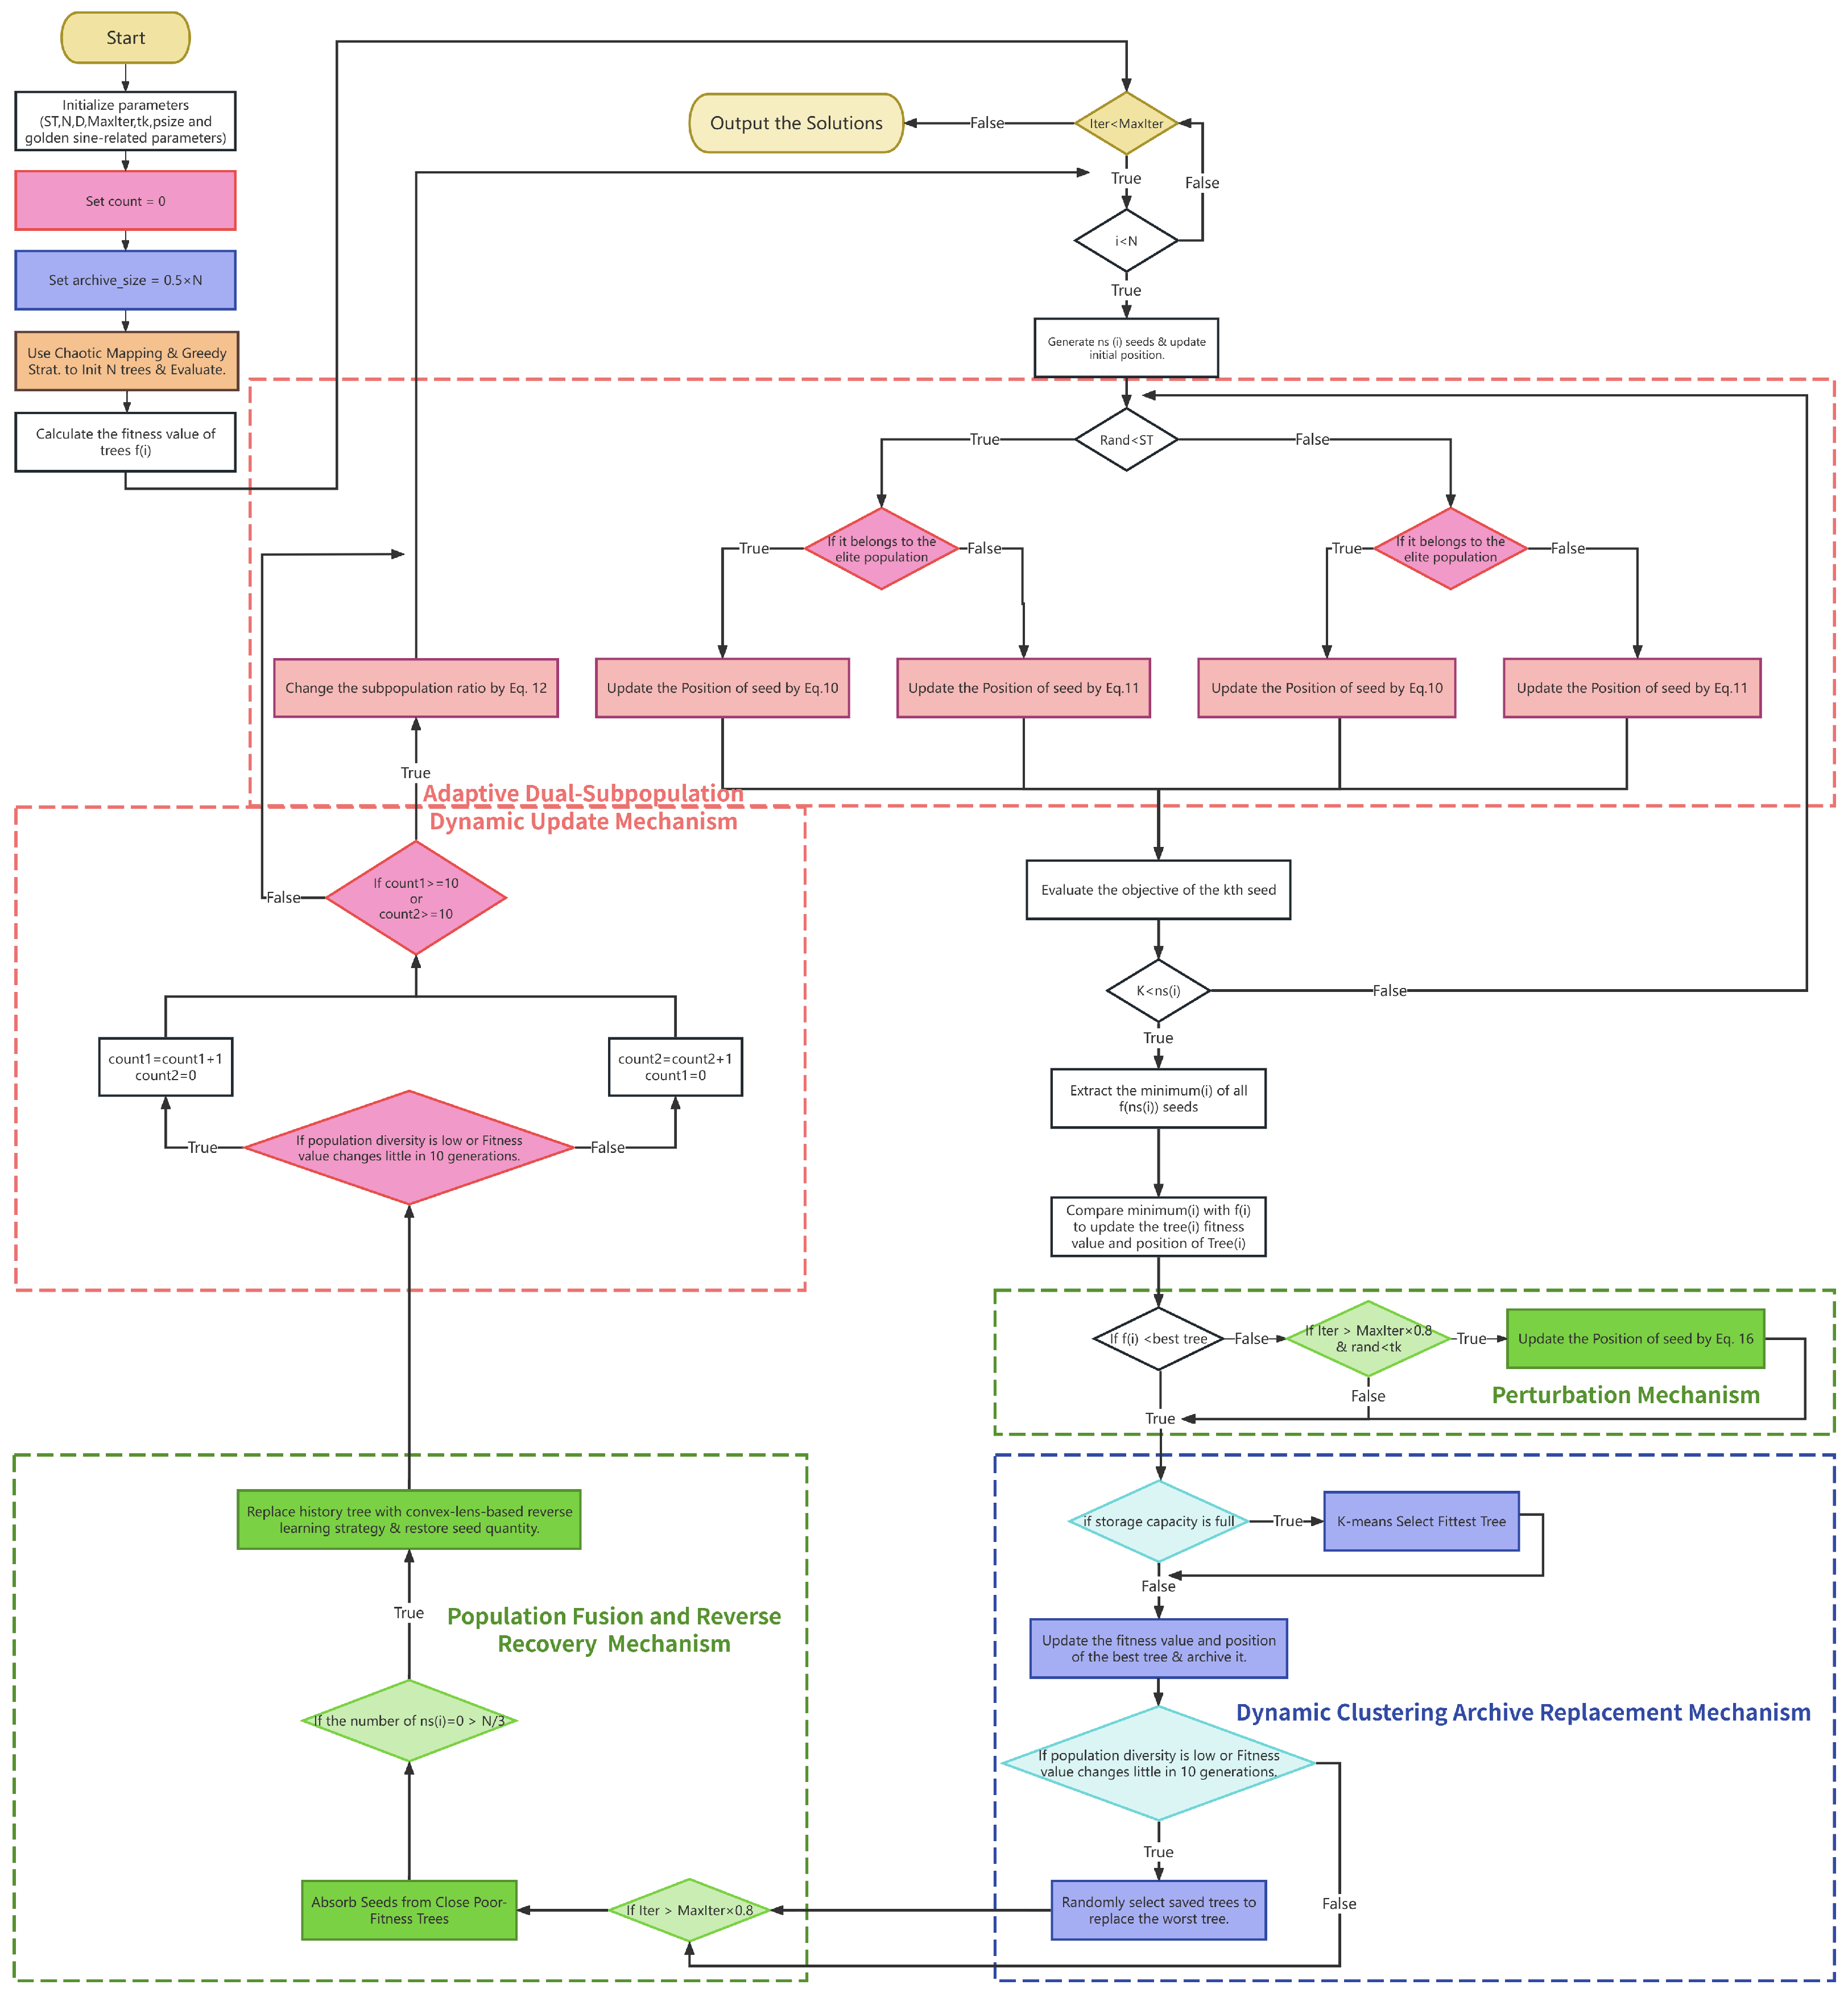
Figure 5.
The flowchart for the ADTSA.
Figure 5.
The flowchart for the ADTSA.
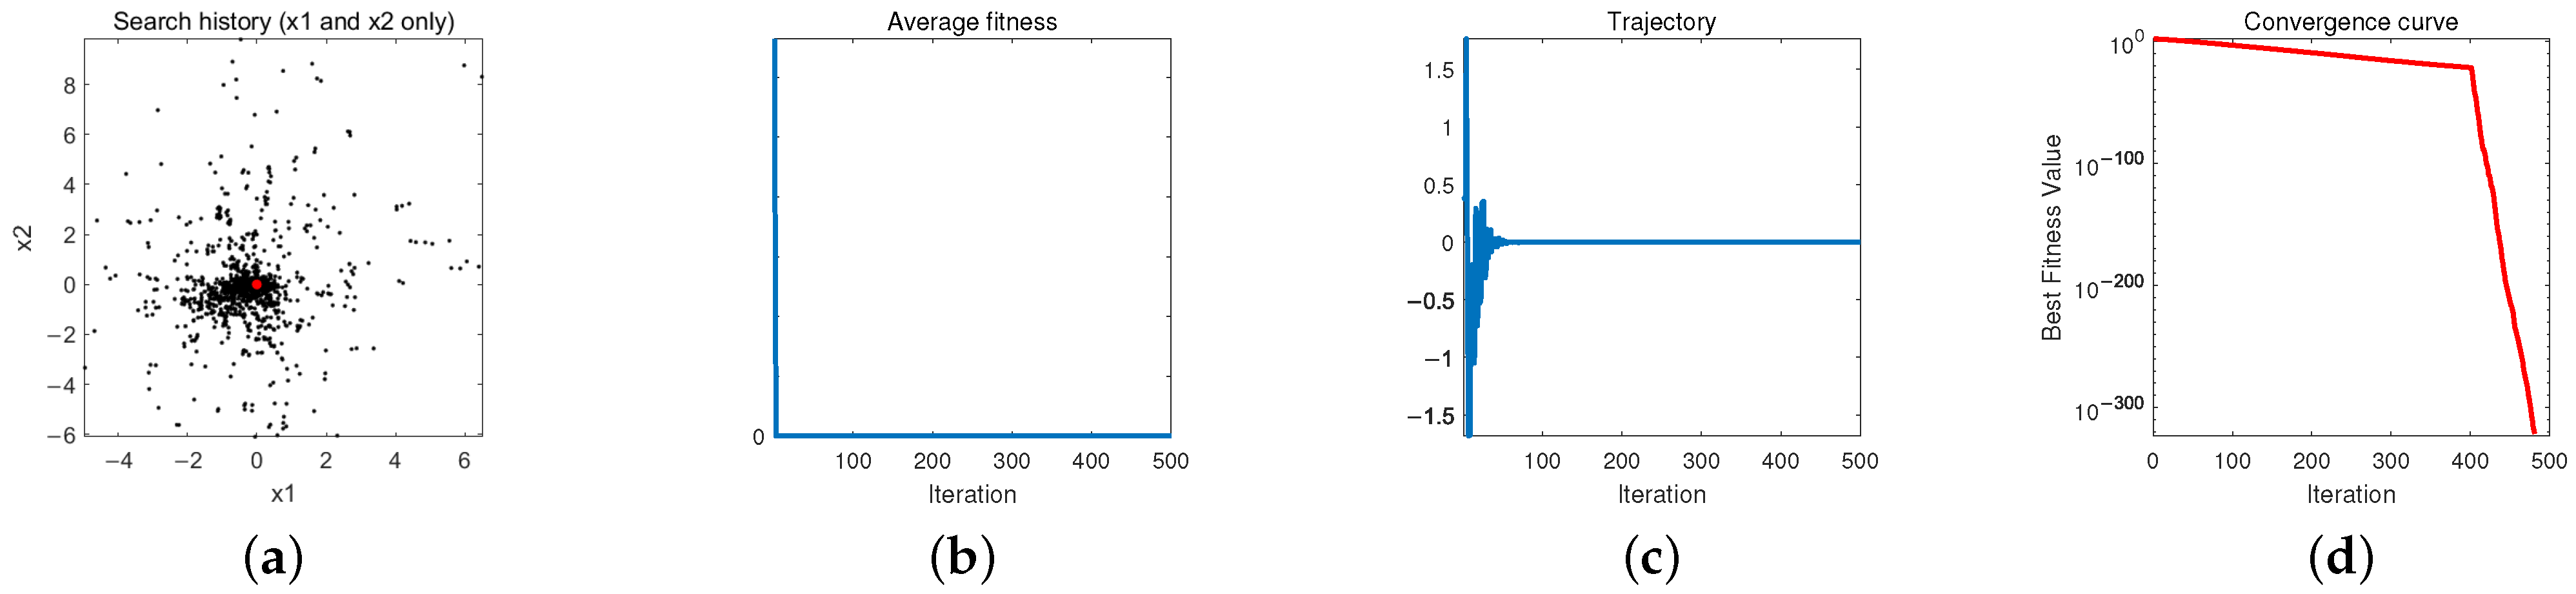
Figure 6.
Visualizing parameter spaces.
Figure 6.
Visualizing parameter spaces.
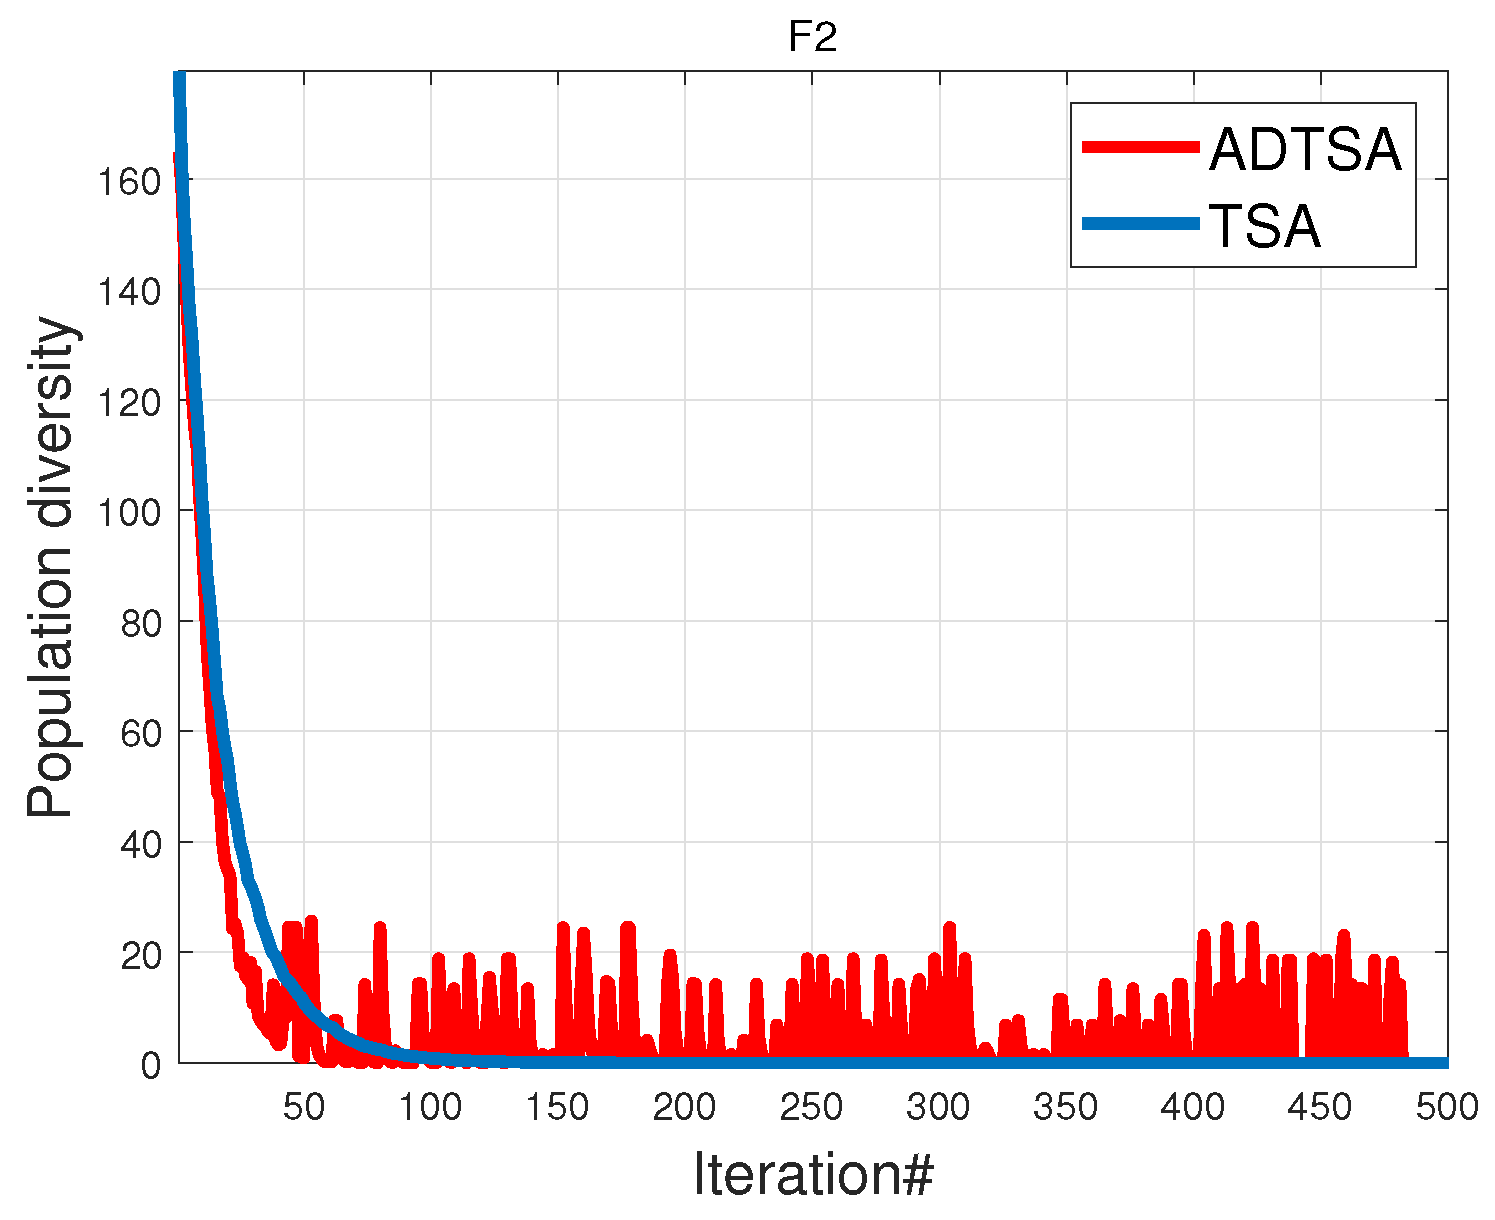
Figure 9.
Population diversity for F2.
Figure 9.
Population diversity for F2.
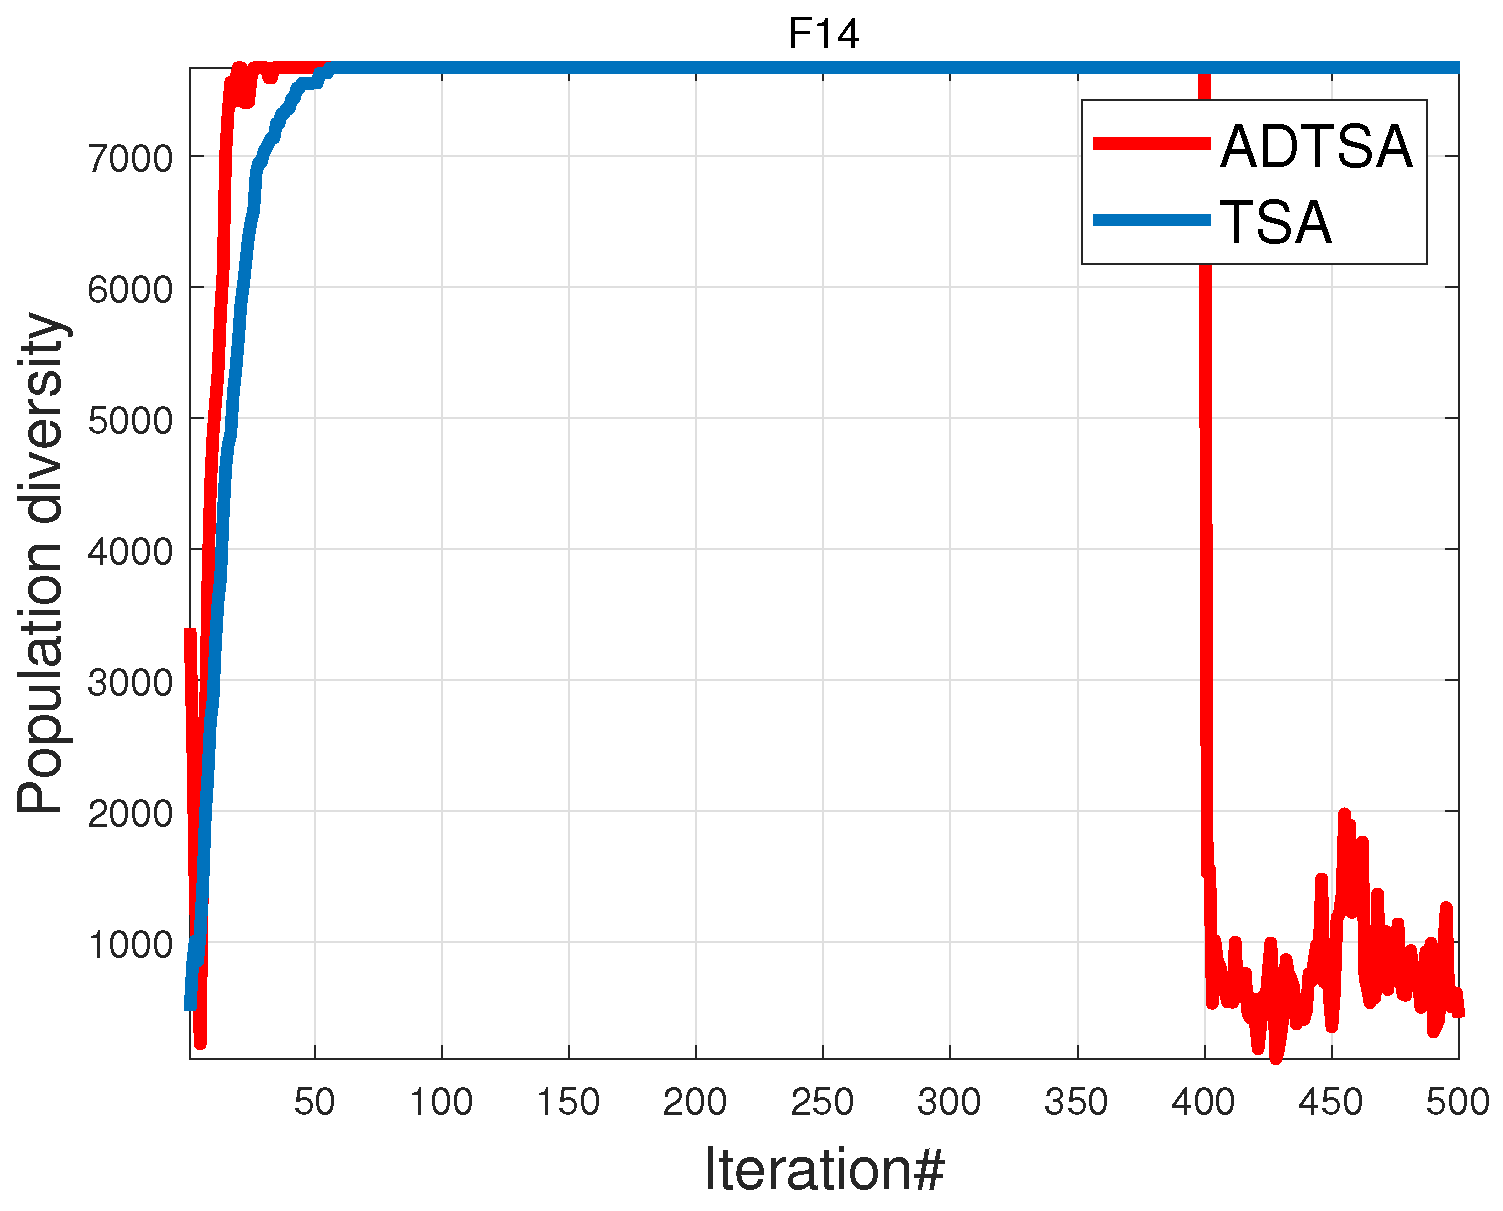
Figure 10.
Population diversity for F14.
Figure 10.
Population diversity for F14.
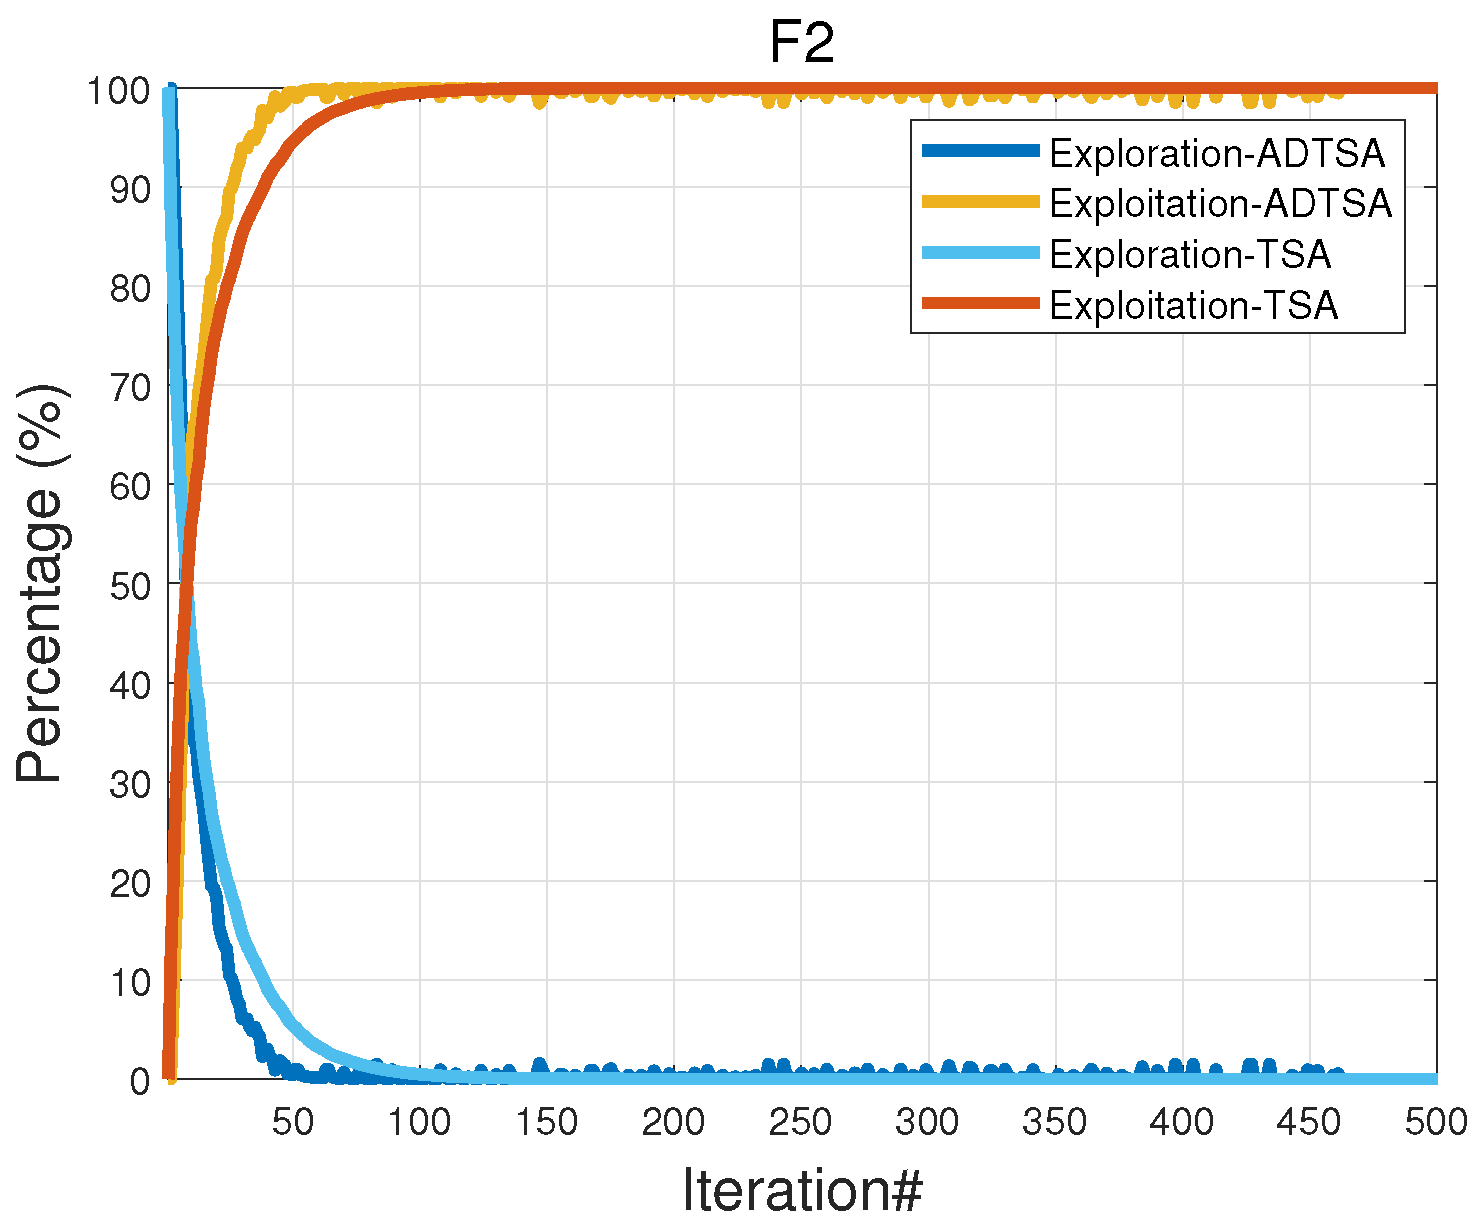
Figure 11.
Analysis for F2.
Figure 11.
Analysis for F2.
Figure 12.
Analysis for F14.
Figure 12.
Analysis for F14.
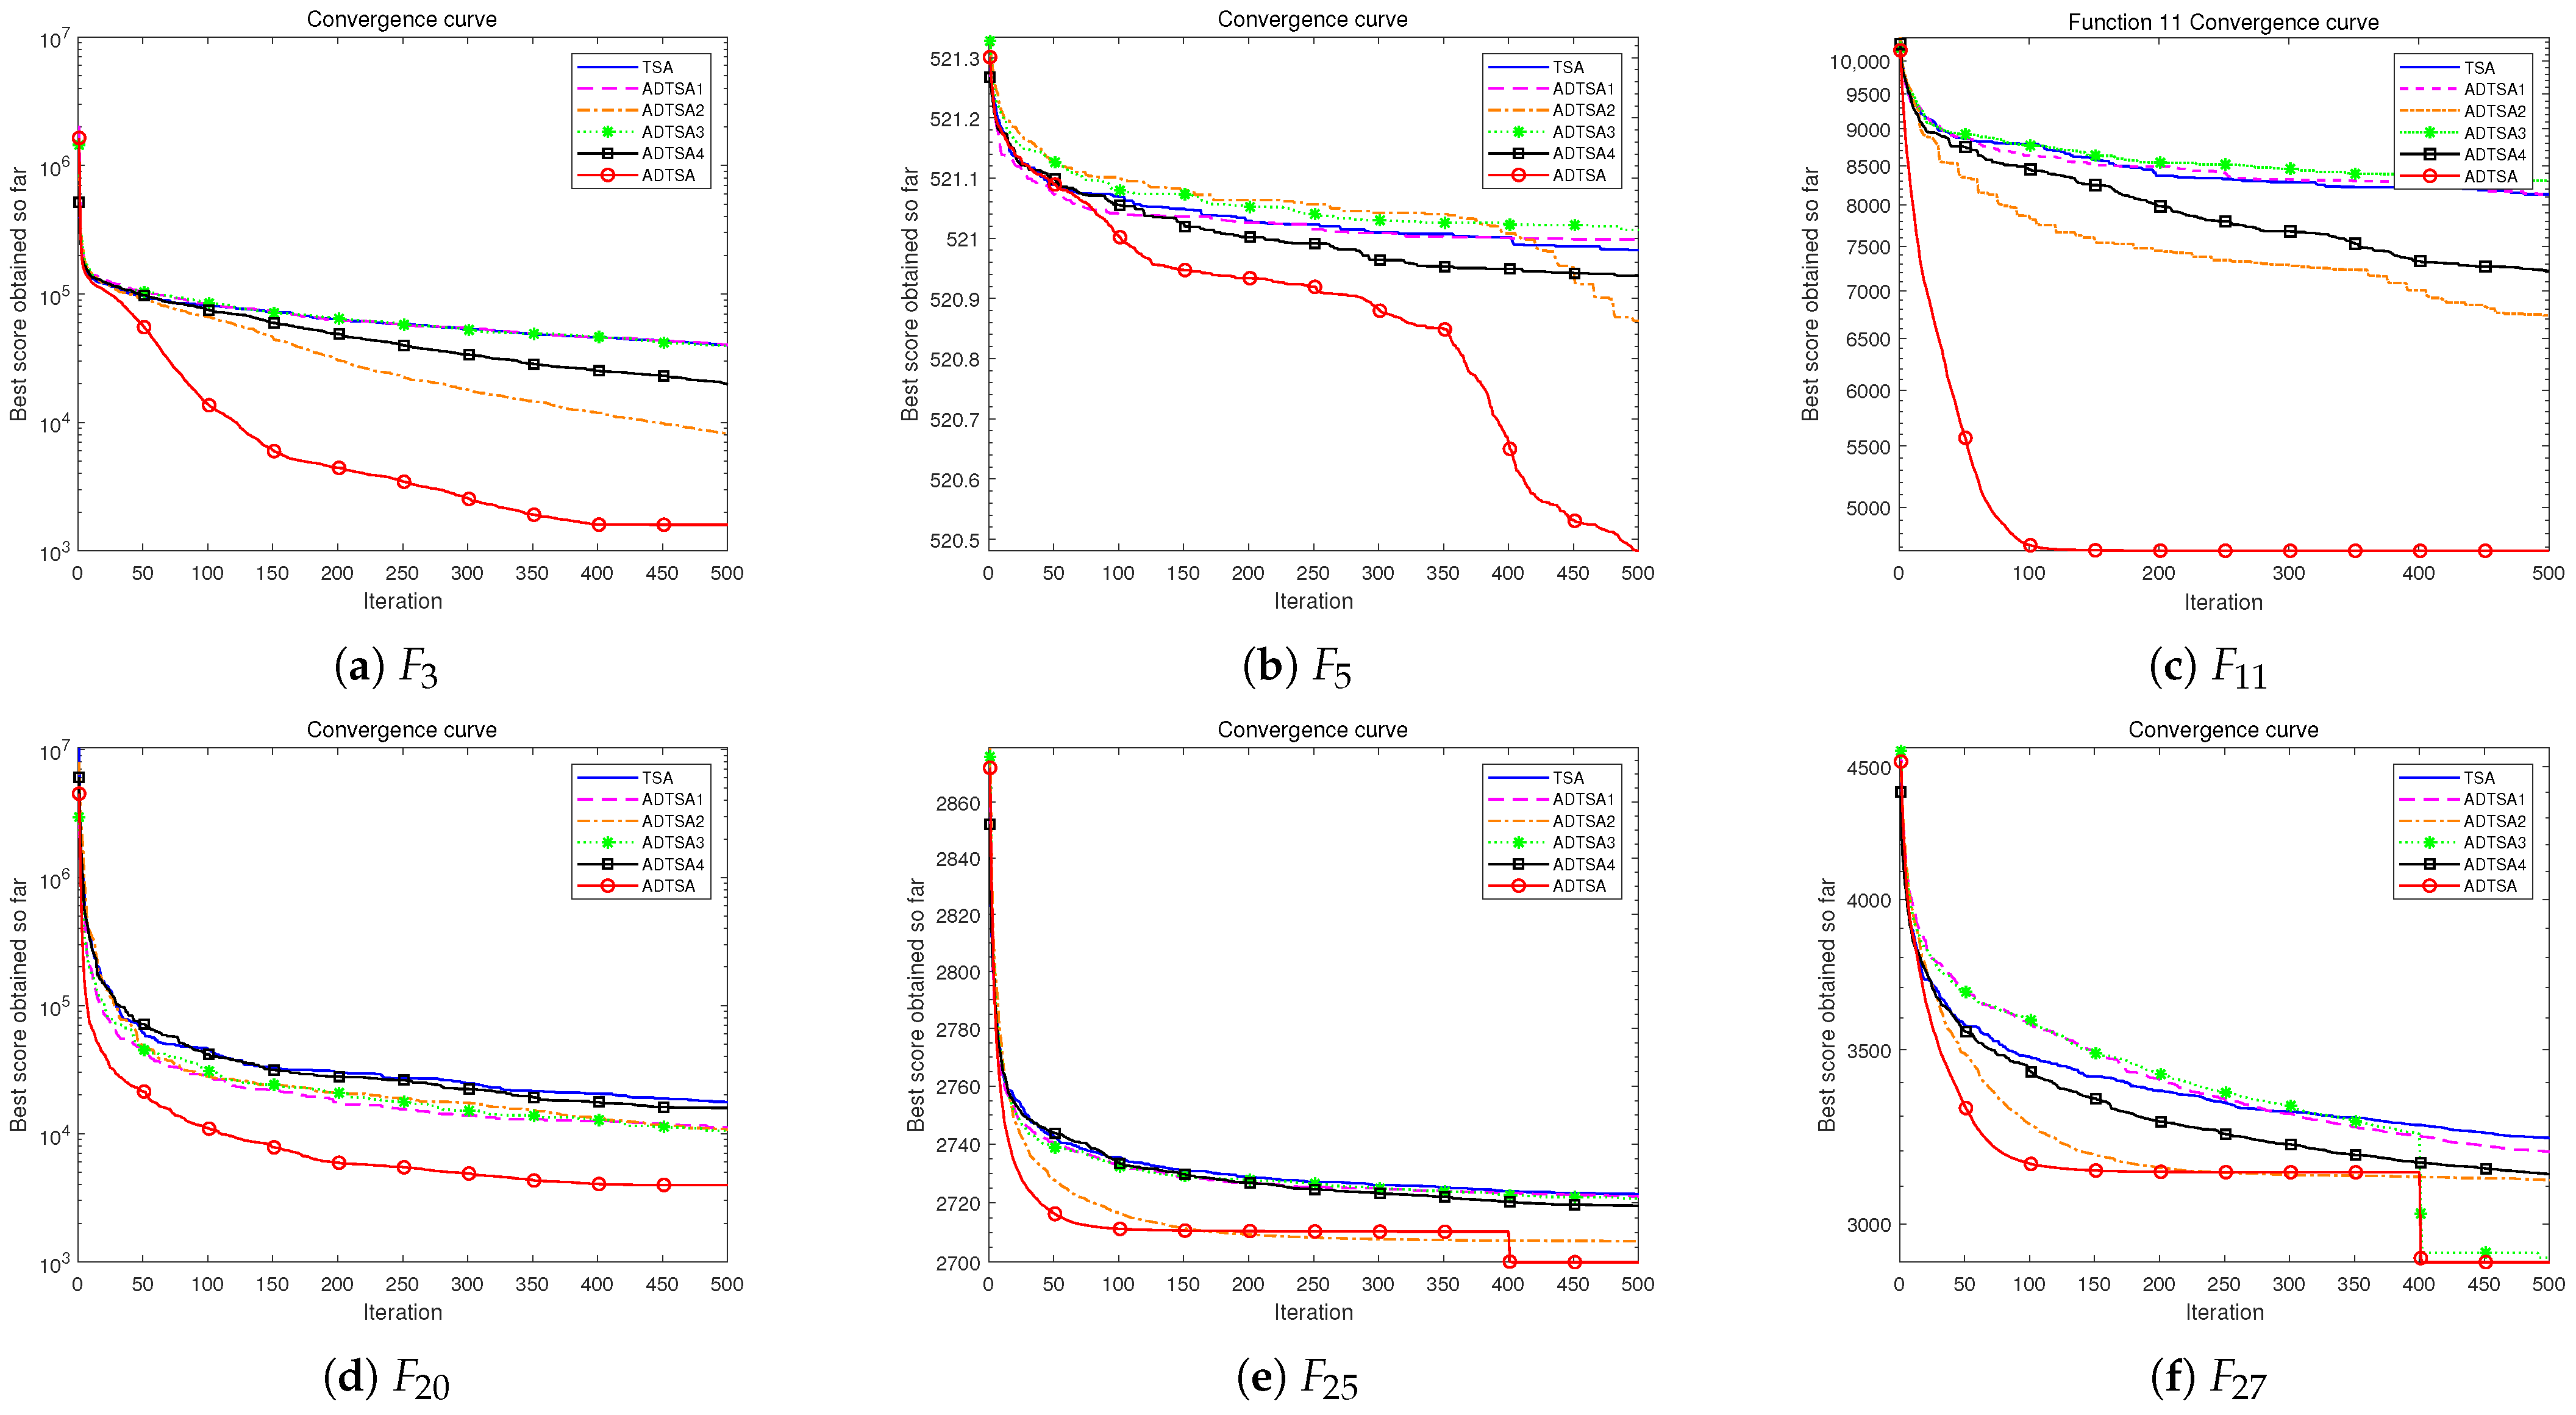
Figure 13.
Convergence curve of ADTSA, TSA, ADTSA1, and other variants for 30D.
Figure 13.
Convergence curve of ADTSA, TSA, ADTSA1, and other variants for 30D.
Figure 14.
Convergence curve of ADTSA, TSA, ADTSA1, and other variants for 50D.
Figure 14.
Convergence curve of ADTSA, TSA, ADTSA1, and other variants for 50D.
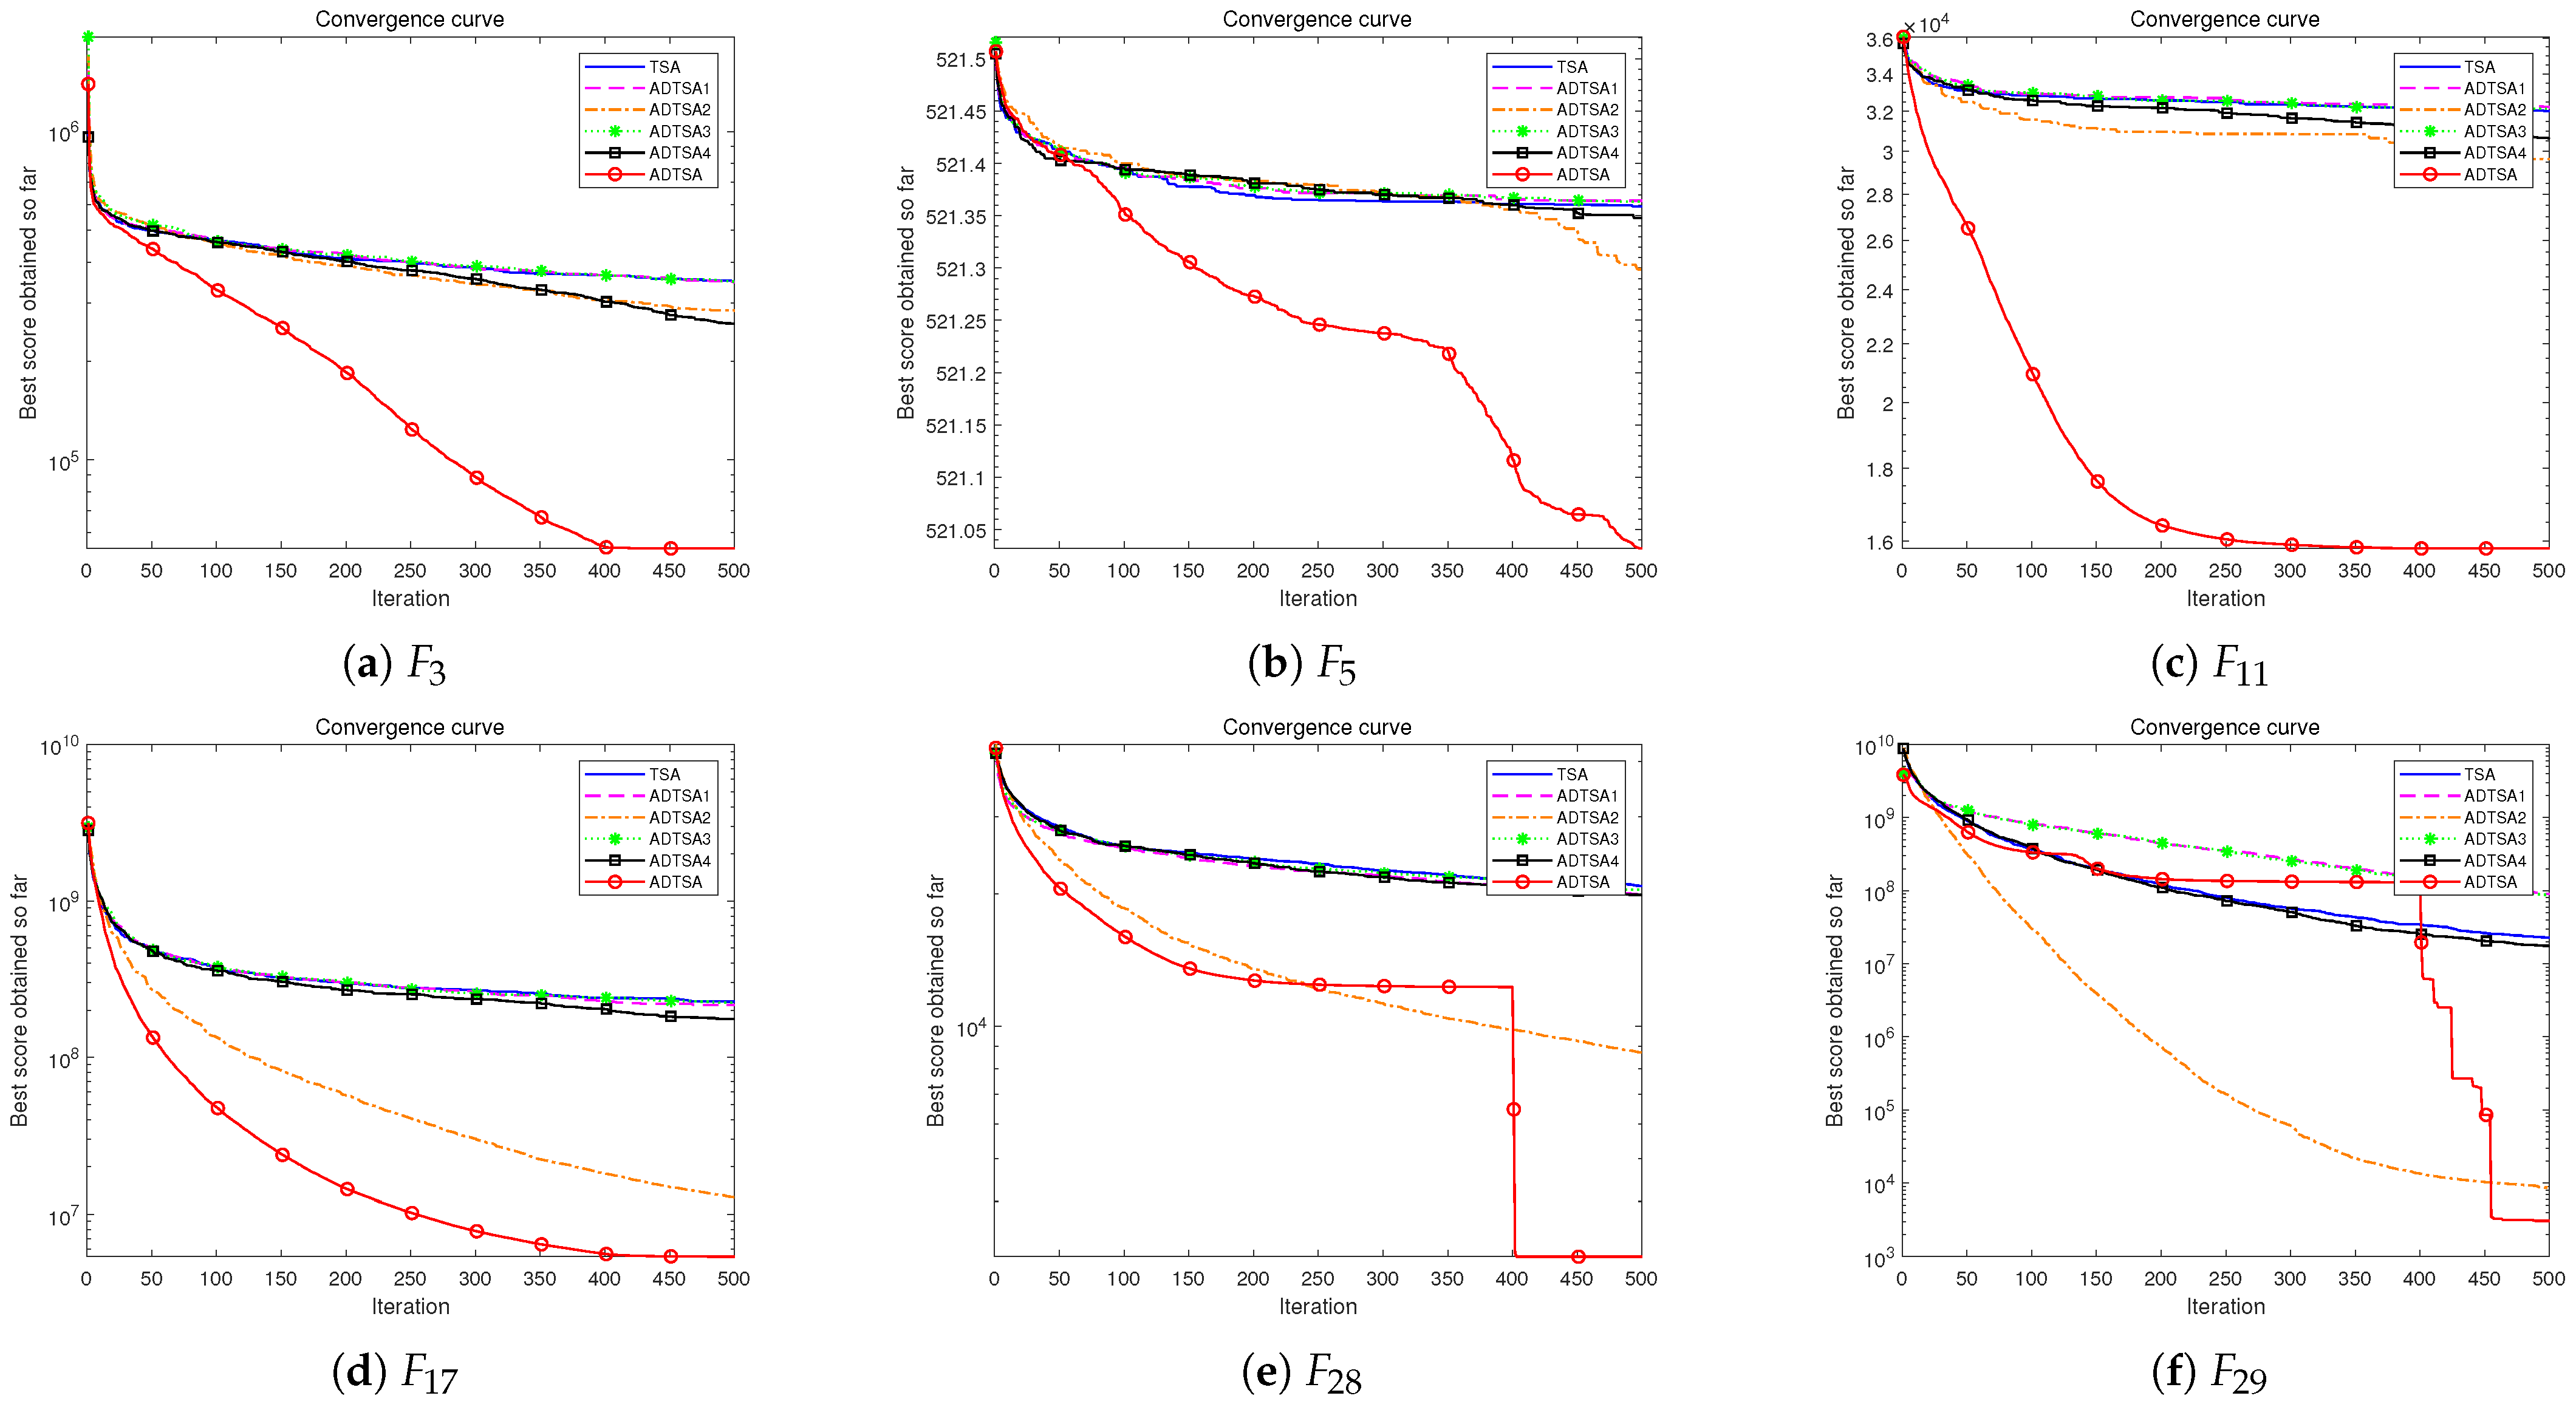
Figure 15.
Convergence curve of ADTSA, TSA, ADTSA1, and other variants for 100D.
Figure 15.
Convergence curve of ADTSA, TSA, ADTSA1, and other variants for 100D.
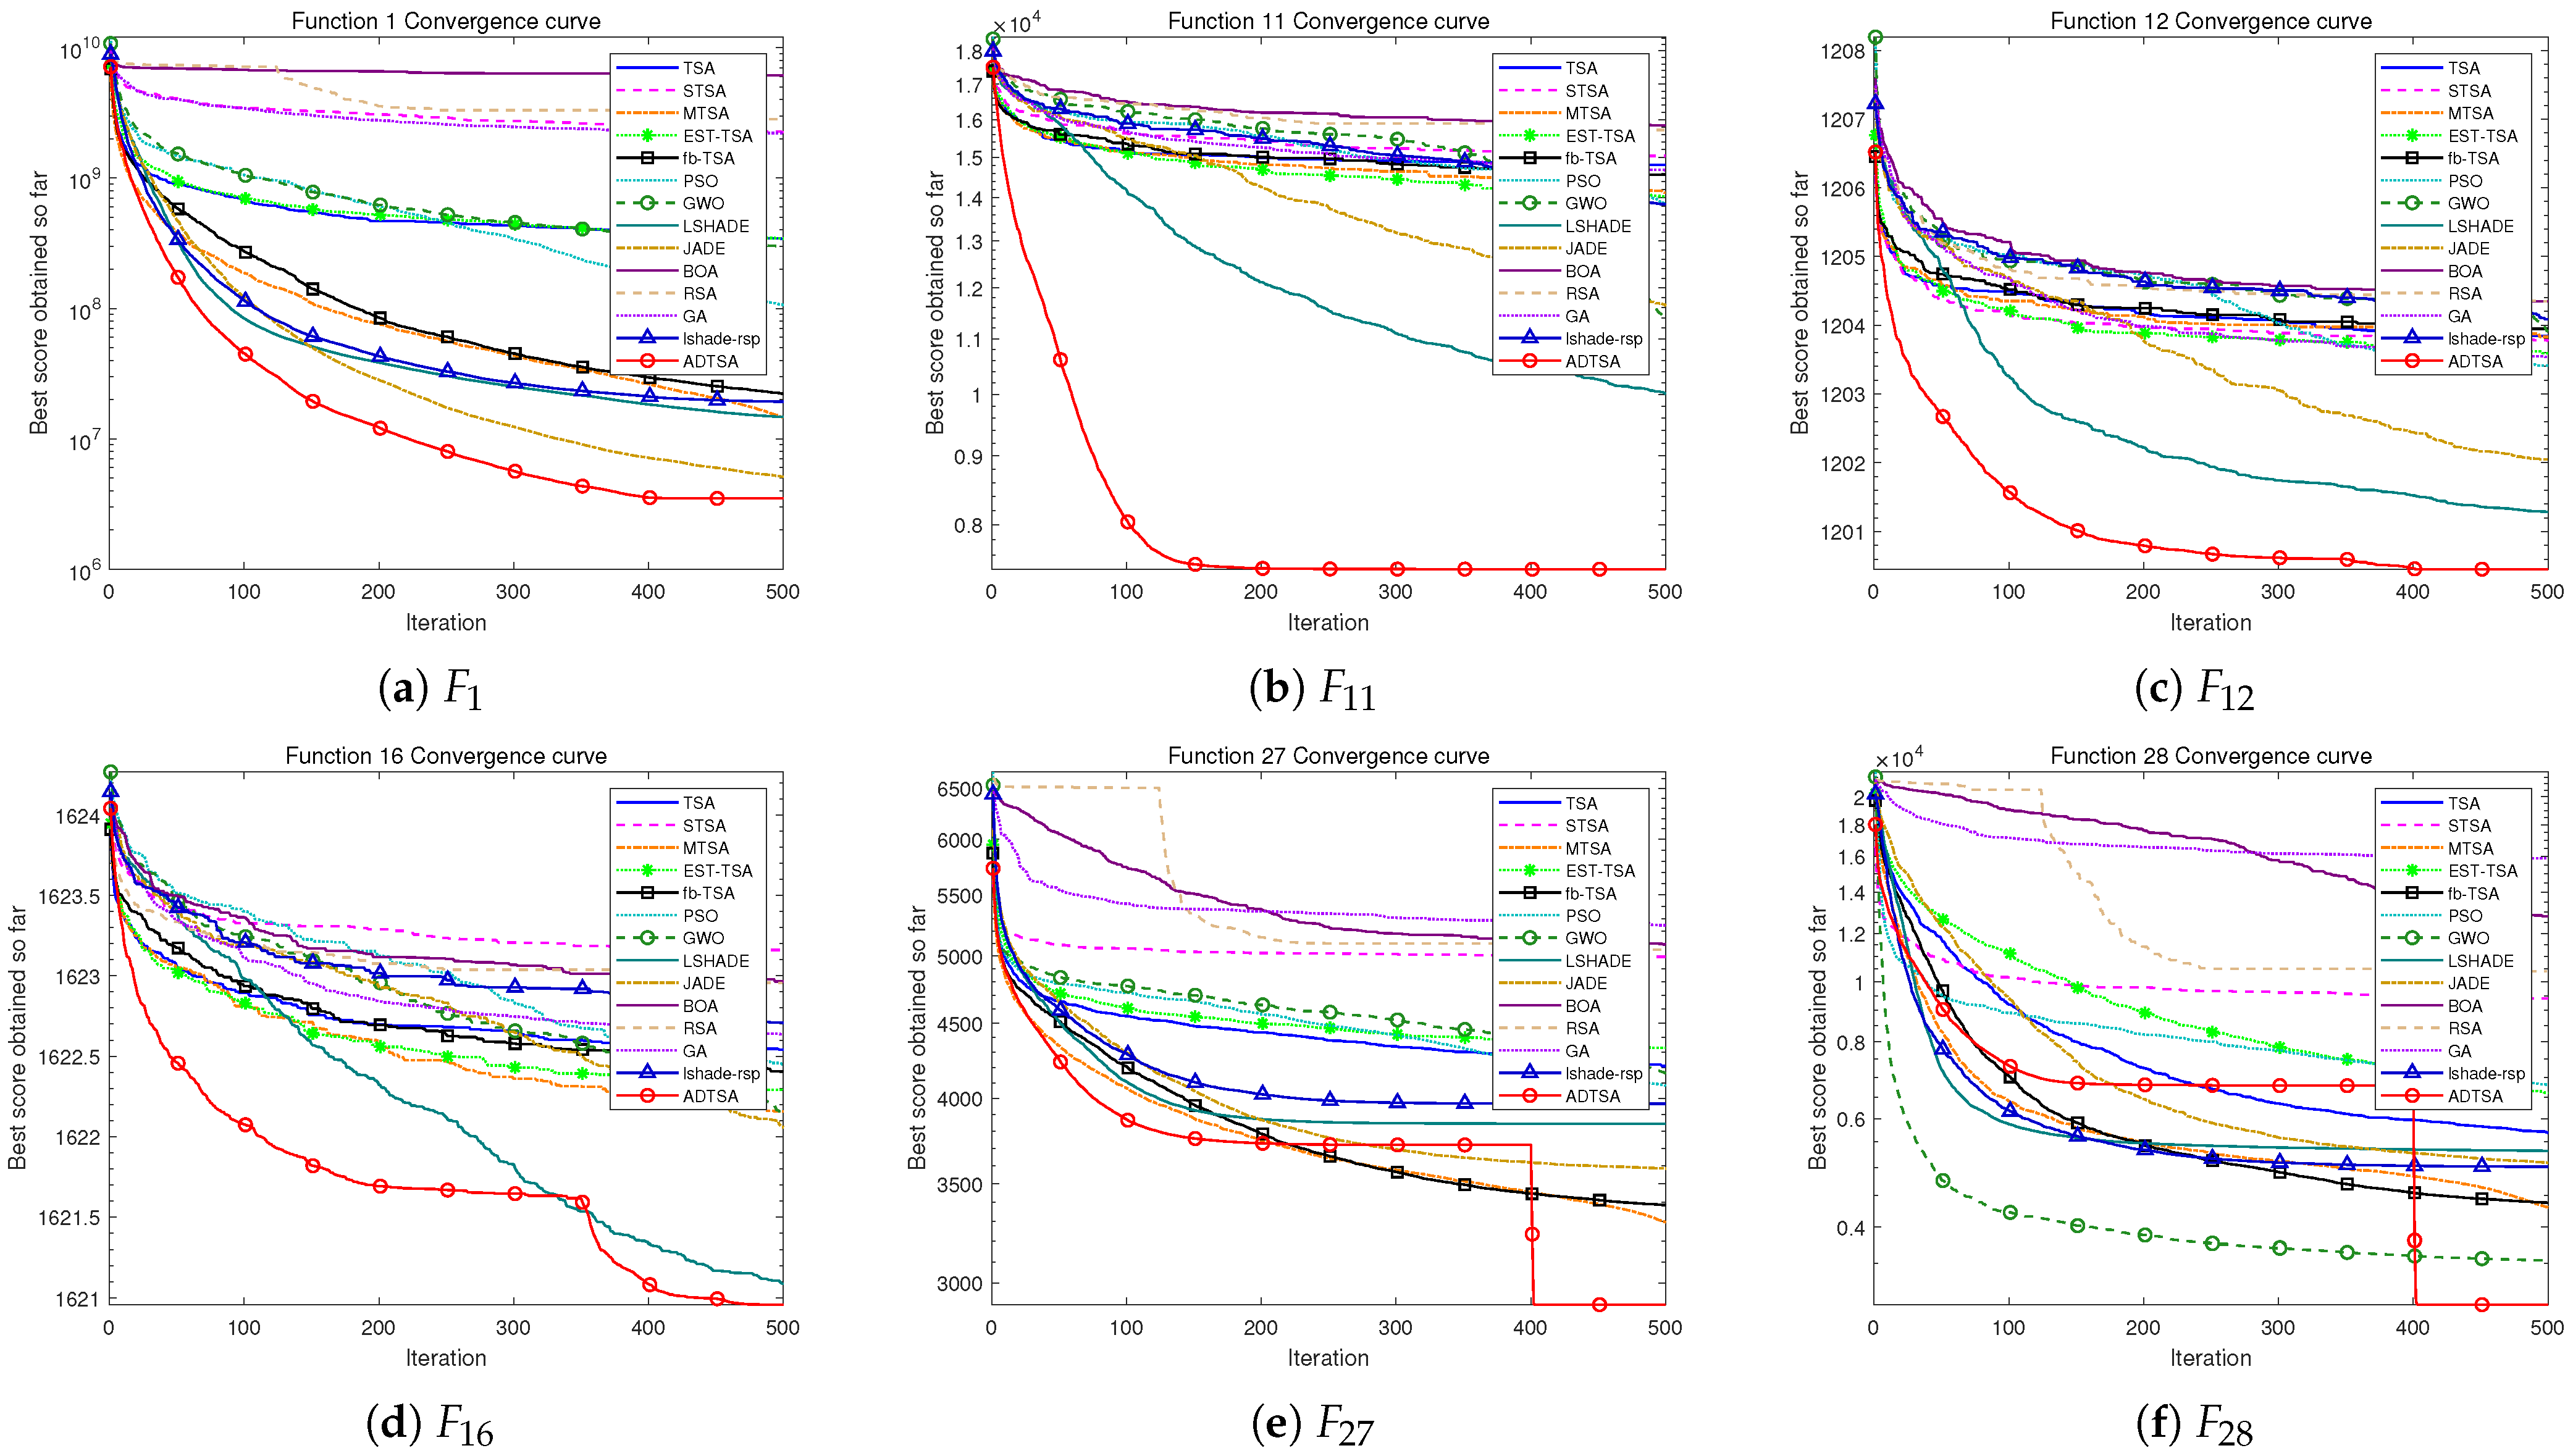
Figure 16.
Convergence curve of the ADTSA and other heuristic for 30D.
Figure 16.
Convergence curve of the ADTSA and other heuristic for 30D.
Figure 17.
Convergence curve of the ADTSA and other heuristics for 50D.
Figure 17.
Convergence curve of the ADTSA and other heuristics for 50D.
Figure 18.
Convergence curve of the ADTSA and other heuristics for 100D.
Figure 18.
Convergence curve of the ADTSA and other heuristics for 100D.
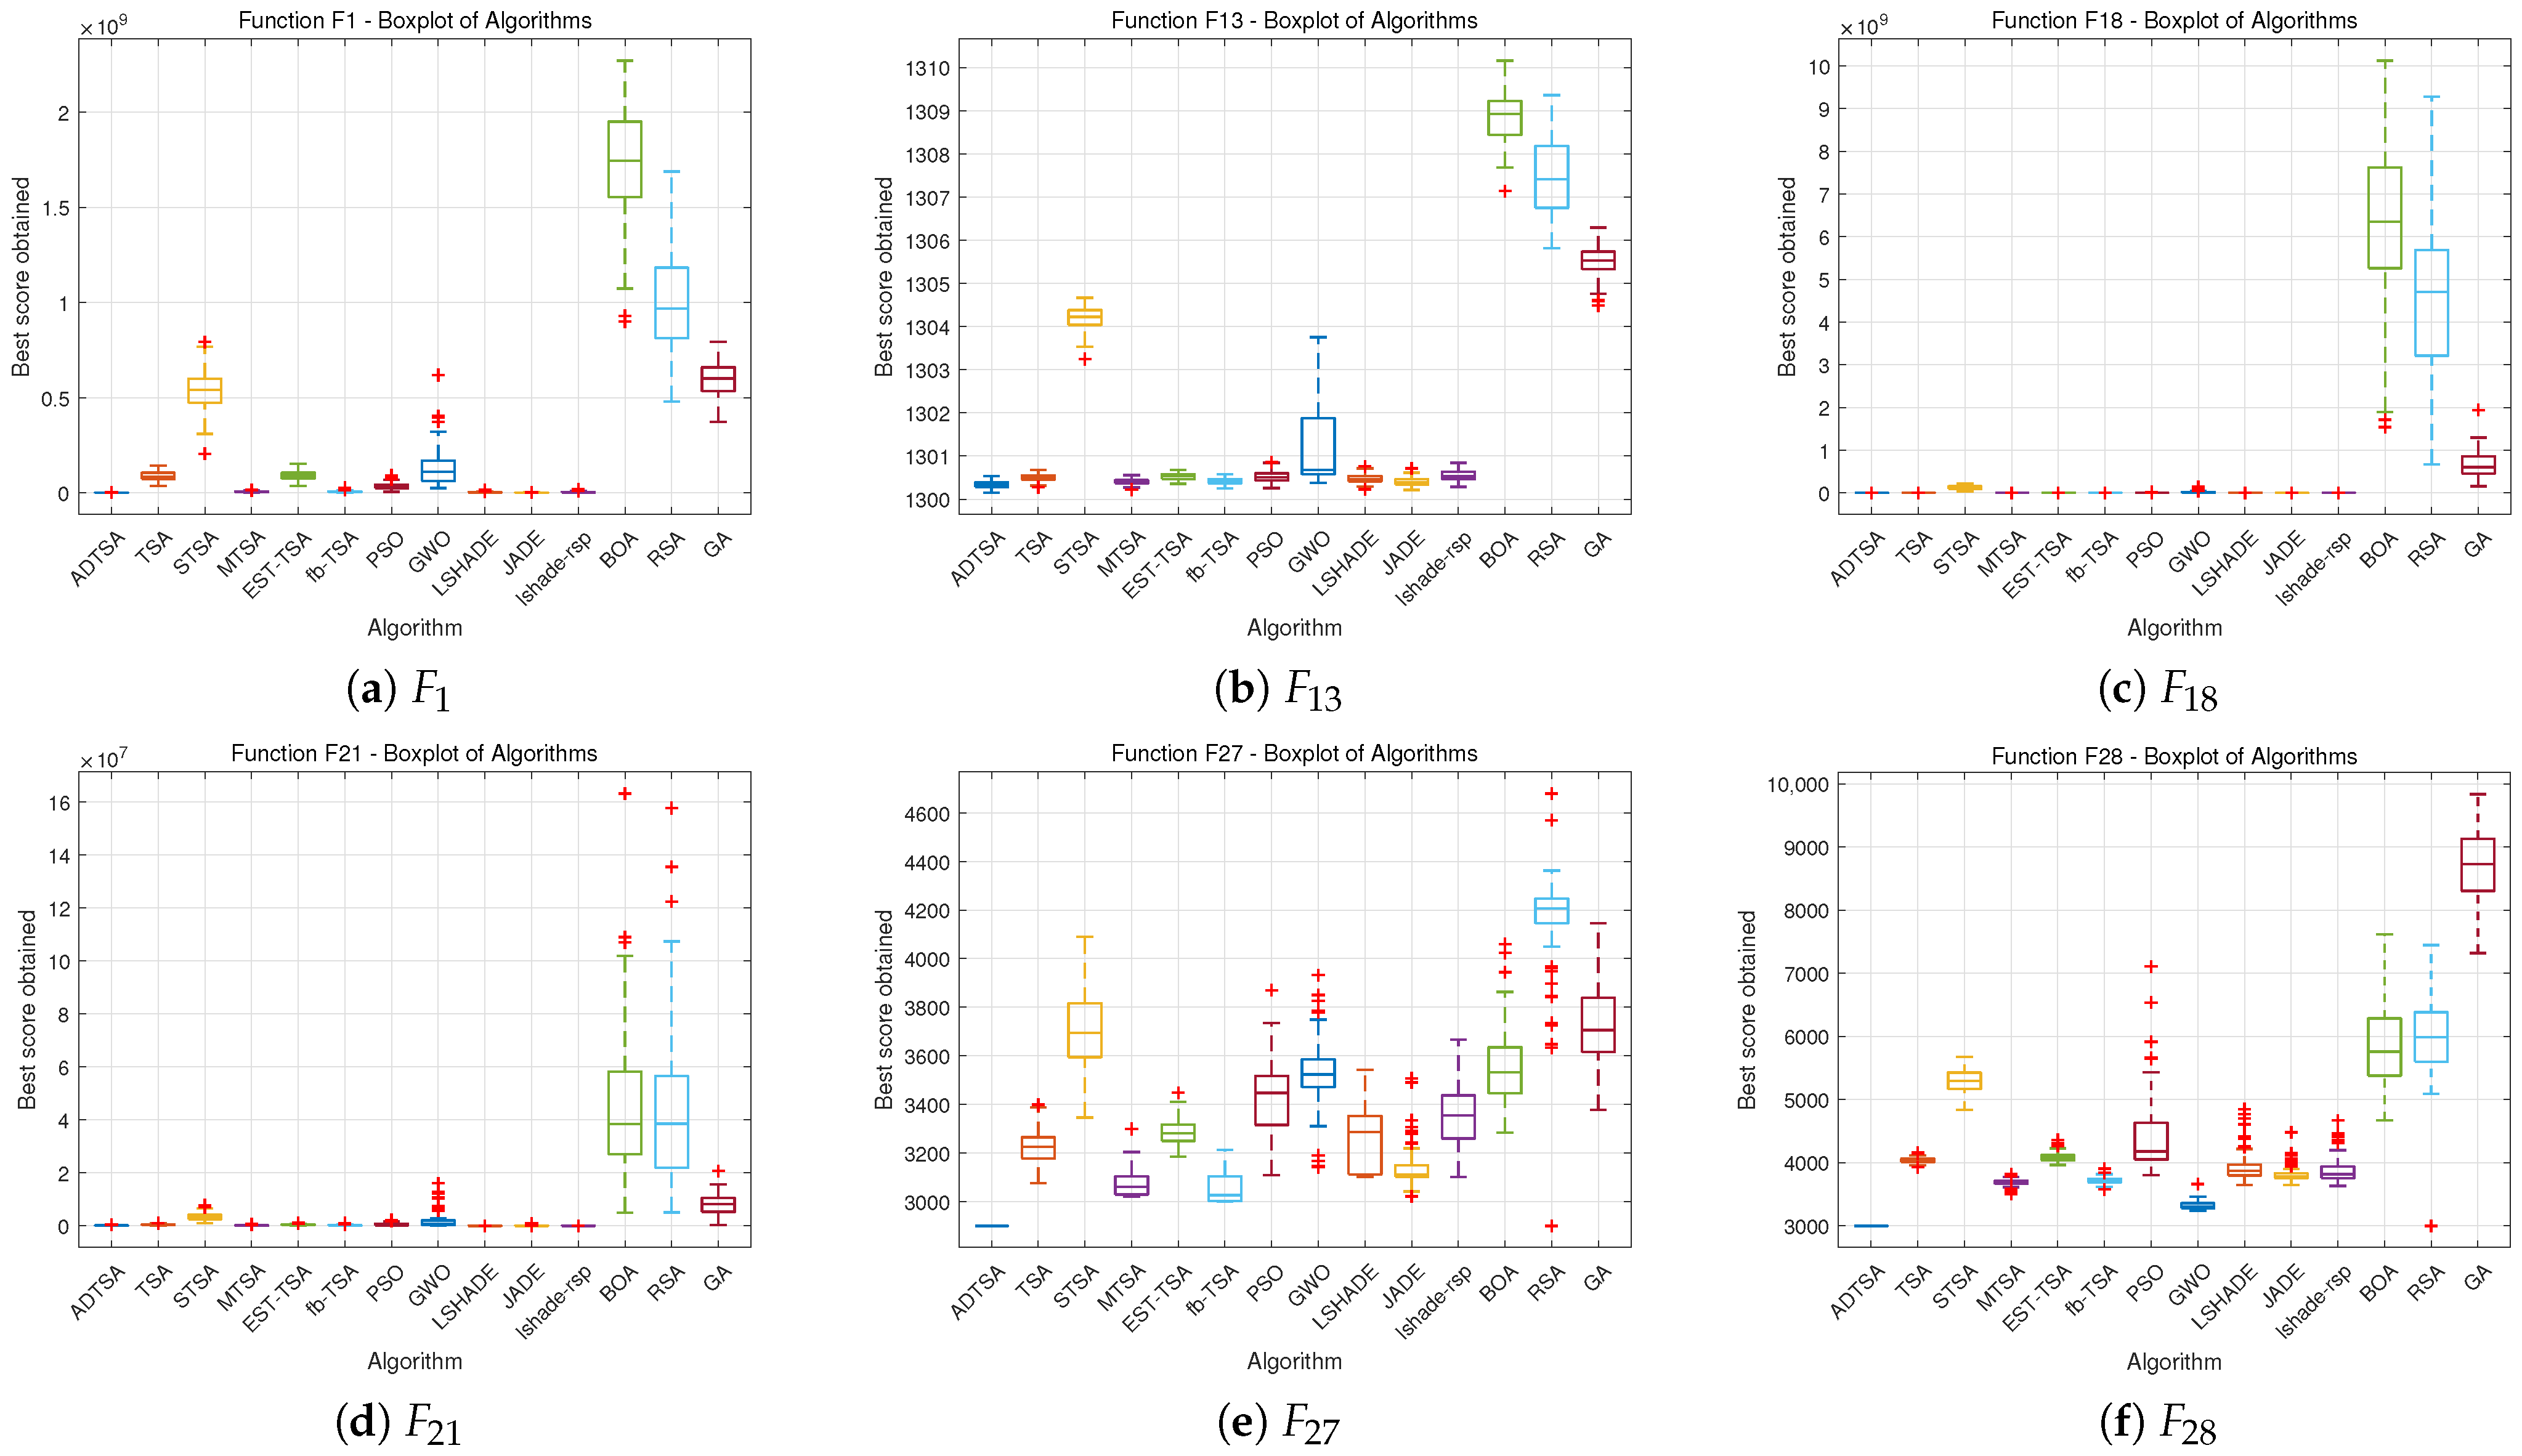
Figure 19.
Box plots of all tested algorithms for 30D.
Figure 19.
Box plots of all tested algorithms for 30D.
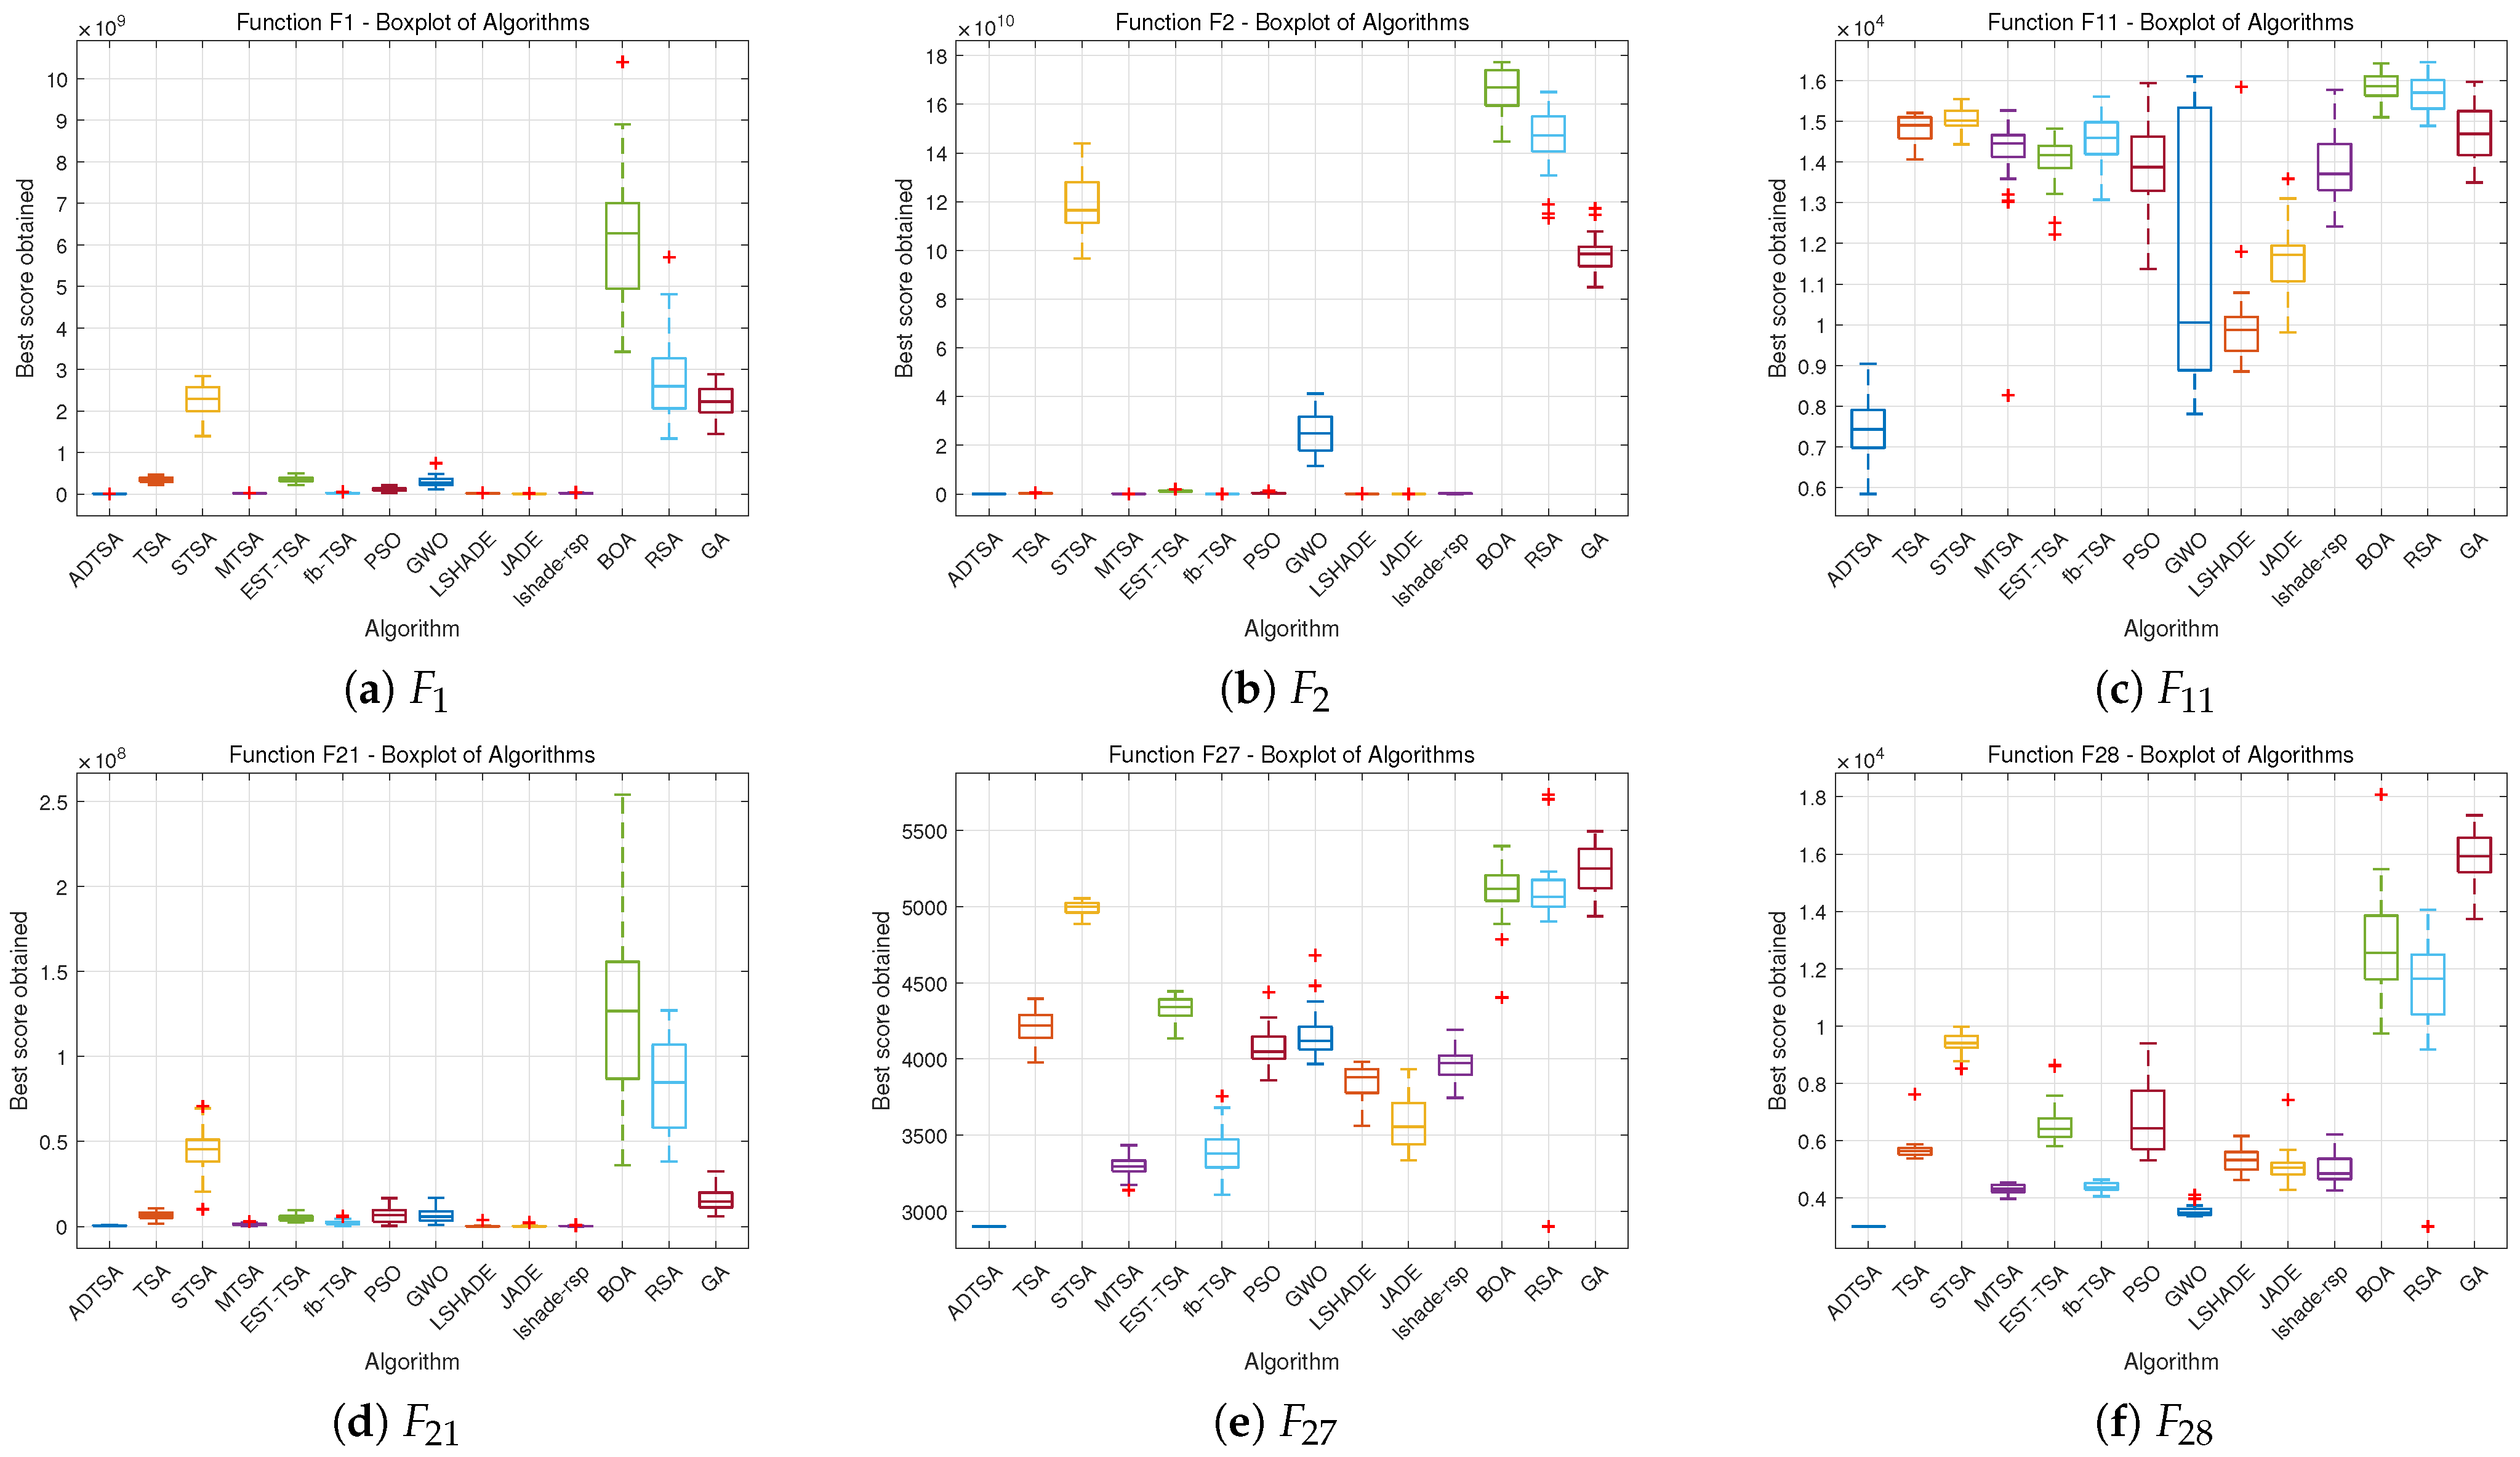
Figure 20.
Box plots of all tested algorithms for 50D.
Figure 20.
Box plots of all tested algorithms for 50D.
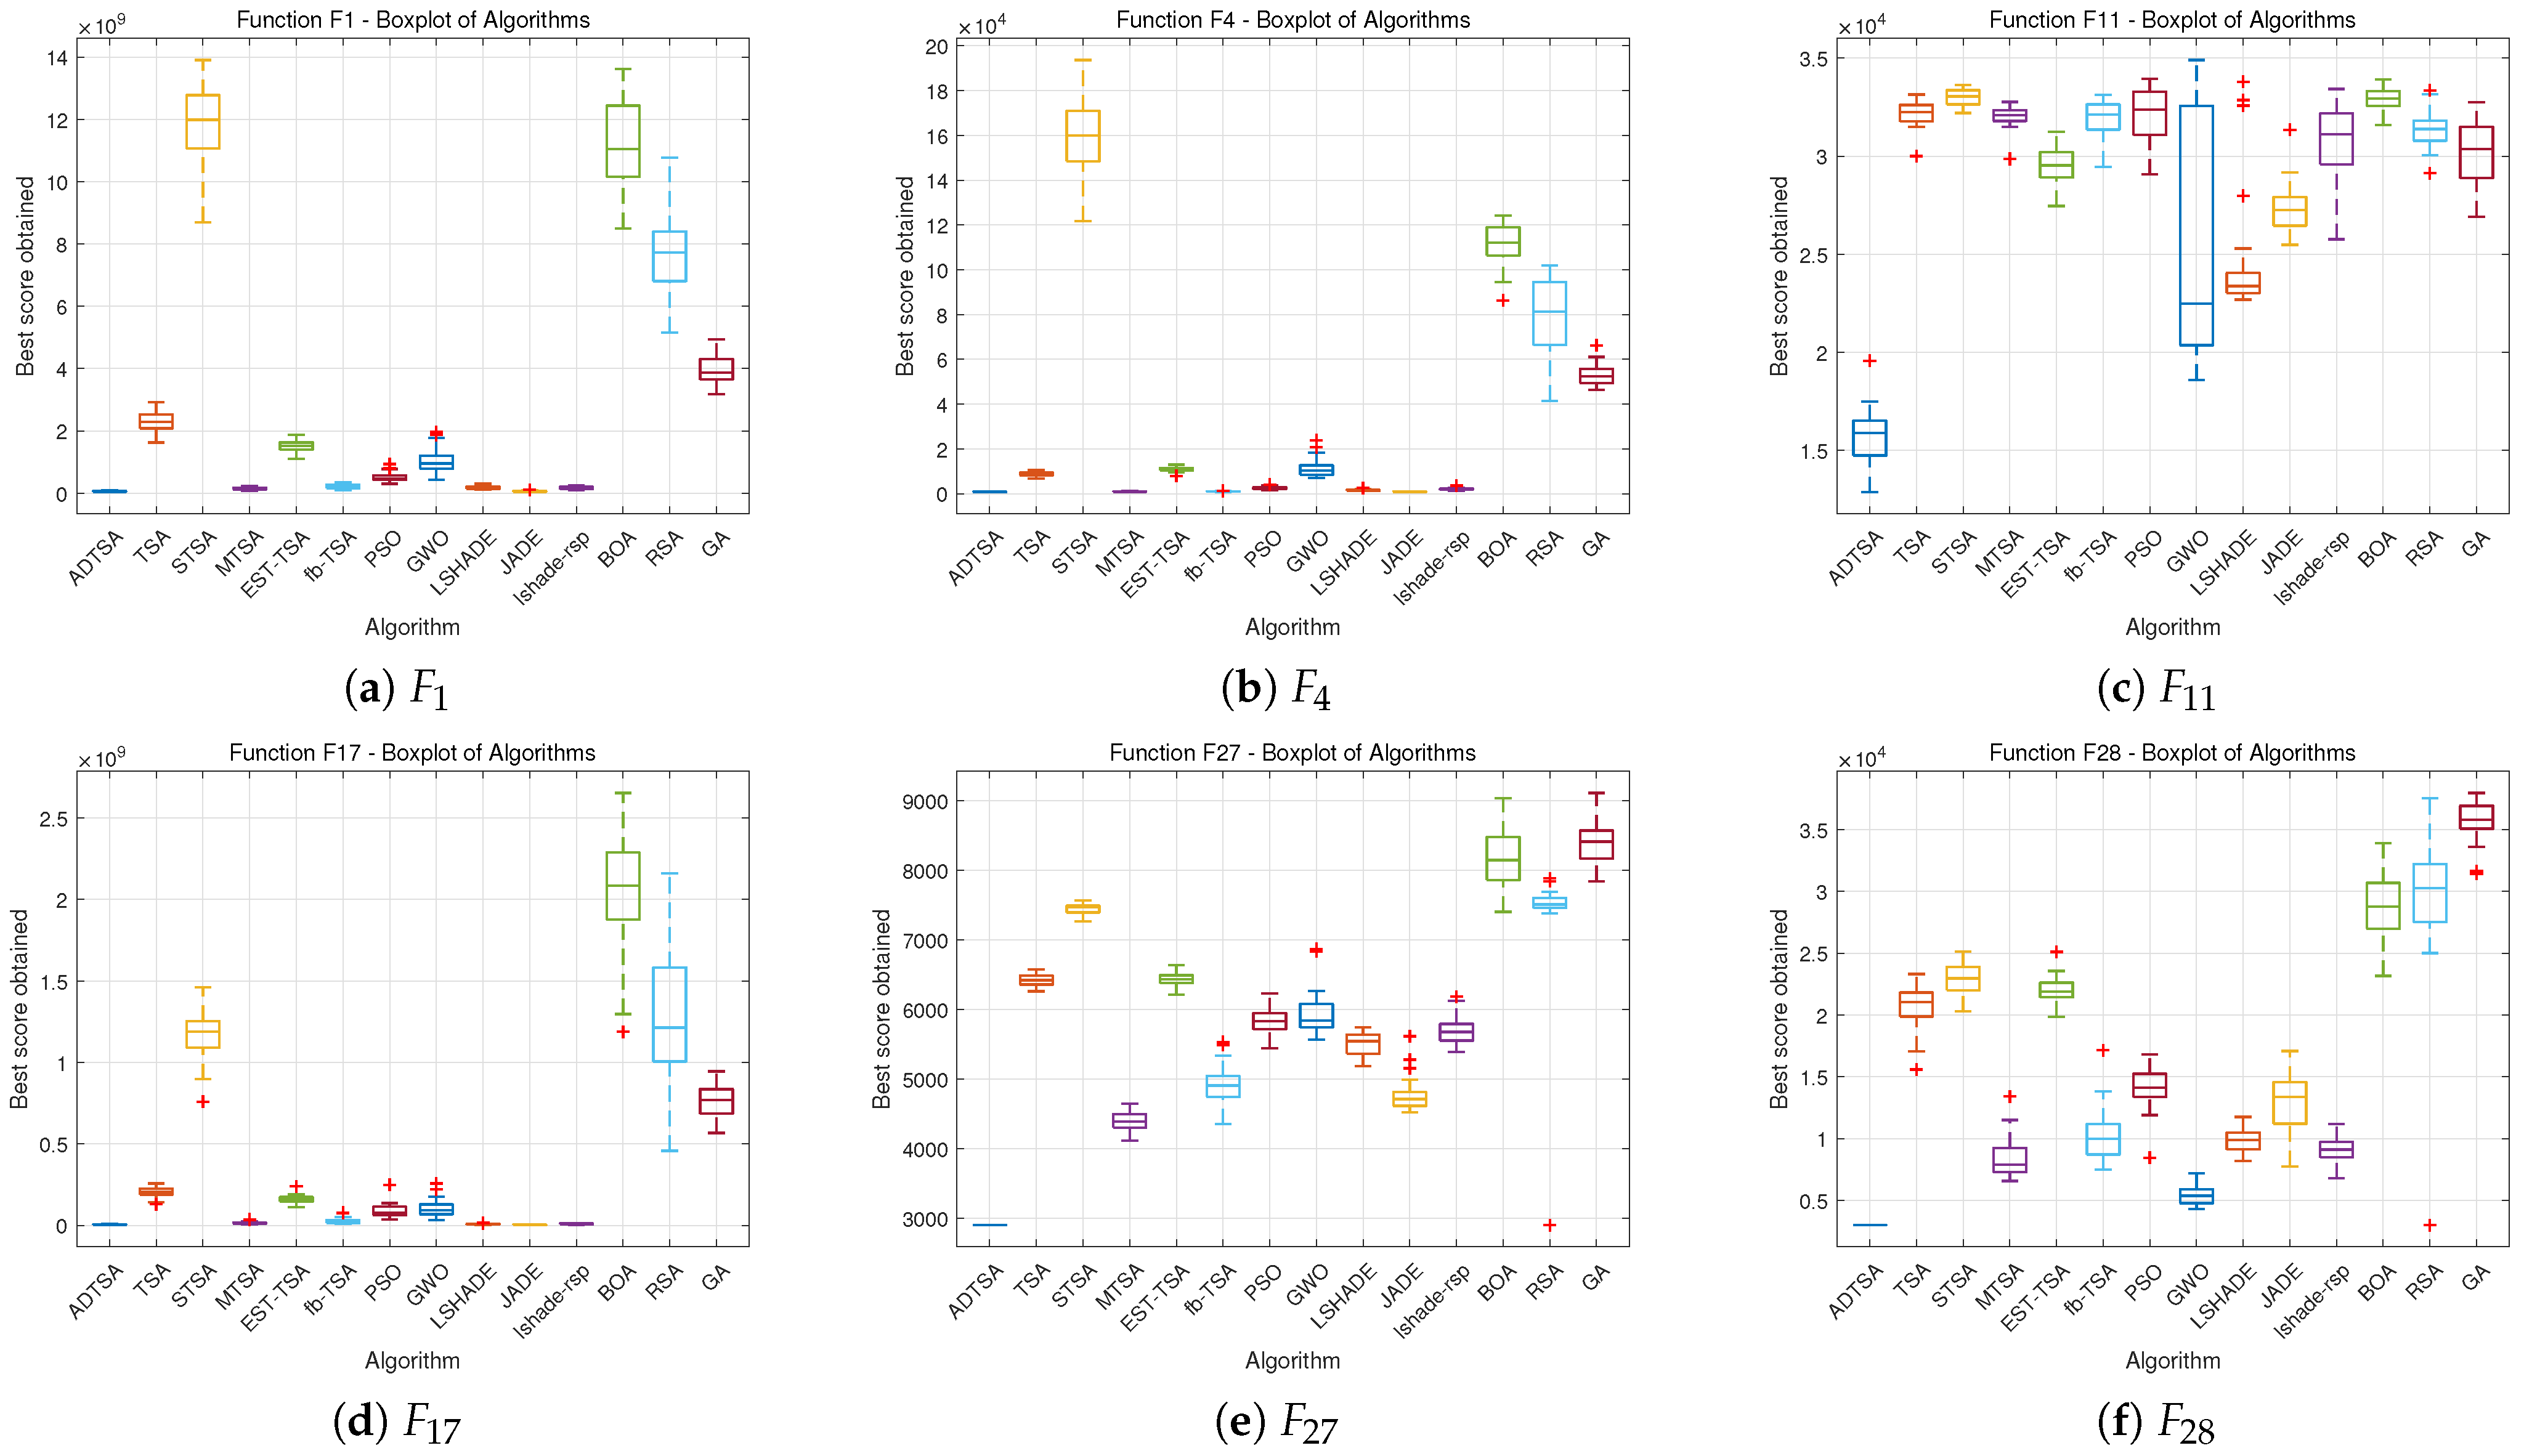
Figure 21.
Box plots of all tested algorithms for 100D.
Figure 21.
Box plots of all tested algorithms for 100D.
Figure 22.
Convergence curves of all experimental algorithms on three datasets. (a) Convergence curve for gil262. (b) Convergence curve for Loggi-n401-k23. (c) Convergence curve for Loggi-n1001-k31.
Figure 22.
Convergence curves of all experimental algorithms on three datasets. (a) Convergence curve for gil262. (b) Convergence curve for Loggi-n401-k23. (c) Convergence curve for Loggi-n1001-k31.
Table 1.
TSA variants and their applications.
Table 1.
TSA variants and their applications.
| TSA Variant | Application Introduction |
|---|
| MS-TSA [11] | Utilized multiple strategies for parameter estimation of photovoltaic module models. |
| WQTSA [12] | Water-cycling and quantum rotation-gate mechanisms balanced exploitation–exploration to optimize reservoir production models. |
| WSTSA [13] | Combined wormhole and salp swarm strategies, achieved high efficiency and optimized hyperparameters in neural architecture search with a genetic algorithm to improve medical segmentation accuracy. |
| TSA-ANN [14] | Optimized neural network architectures in the medical field to achieve accurate COVID-19 diagnosis. |
Table 2.
Initial settings of the comparison algorithms.
Table 2.
Initial settings of the comparison algorithms.
| Algorithm | Parameter Name | Parameter Value |
|---|
| ADTSA | Search tendency | 0.1 |
| TSA | Search tendency | 0.1 |
| STSA | Search tendency | 0.1 |
| MTSA | Search tendency | 0.1 |
| EST-TSA | Search tendency | 0.1 |
| fb-TSA | Search tendency | 0.1 |
| PSO | Individual learning factor | 2 |
| Social learning factor | 2 |
| GWO | a | Linearly decreased from 2 to 0 |
| LSHADE | | 30 |
| 1.4 |
| p | 0.11 |
| Historical memory size (H) | 5 |
| JADE | CR | 0.5 |
| F | 0.5 |
| lshade-rsp | p | 0.11 |
| H | 5 |
| BOA | P | 0.8 |
| RSA | Evolutionary sense | |
| 0.005 |
| 0.1 |
| GA | Type | Real coded |
| Selection | Roulette wheel |
| Crossover | Probability = 0.7 |
| Mutation | Probability = 0.2 |
Table 3.
Average values for the ADTSA, TSA, ADTSA1, and other variants for 30D.
Table 3.
Average values for the ADTSA, TSA, ADTSA1, and other variants for 30D.
| Function | ADTSA | TSA | ADTSA1 | ADTSA2 | ADTSA3 | ADTSA4 |
|---|
| F1 | | | | | | |
| F2 | | | | | | |
| F3 | | | | | | |
| F4 | | | | | | |
| F5 | | | | | | |
| F6 | | | | | | |
| F7 | | | | | | |
| F8 | | | | | | |
| F9 | | | | | | |
| F10 | | | | | | |
| F11 | | | | | | |
| F12 | | | | | | |
| F13 | | | | | | |
| F14 | | | | | | |
| F15 | | | | | | |
| F16 | | | | | | |
| F17 | | | | | | |
| F18 | | | | | | |
| F19 | | | | | | |
| F20 | | | | | | |
| F21 | | | | | | |
| F22 | | | | | | |
| F23 | | | | | | |
| F24 | | | | | | |
| F25 | | | | | | |
| F26 | | | | | | |
| F27 | | | | | | |
| F28 | | | | | | |
| F29 | | | | | | |
| F30 | | | | | | |
| Rank first | 22 | 1 | 0 | 6 | 2 | 1 |
Table 4.
Average values for the ADTSA, TSA, ADTSA1, and other variants for 50D.
Table 4.
Average values for the ADTSA, TSA, ADTSA1, and other variants for 50D.
| Function | ADTSA | TSA | ADTSA1 | ADTSA2 | ADTSA3 | ADTSA4 |
|---|
| F1 | | | | | | |
| F2 | | | | | | |
| F3 | | | | | | |
| F4 | | | | | | |
| F5 | | | | | | |
| F6 | | | | | | |
| F7 | | | | | | |
| F8 | | | | | | |
| F9 | | | | | | |
| F10 | | | | | | |
| F11 | | | | | | |
| F12 | | | | | | |
| F13 | | | | | | |
| F14 | | | | | | |
| F15 | | | | | | |
| F16 | | | | | | |
| F17 | | | | | | |
| F18 | | | | | | |
| F19 | | | | | | |
| F20 | | | | | | |
| F21 | | | | | | |
| F22 | | | | | | |
| F23 | | | | | | |
| F24 | | | | | | |
| F25 | | | | | | |
| F26 | | | | | | |
| F27 | | | | | | |
| F28 | | | | | | |
| F29 | | | | | | |
| F30 | | | | | | |
| Rank first | 22 | 0 | 1 | 6 | 2 | 1 |
Table 5.
Average values for the ADTSA, TSA, ADTSA1, and other variants for 100D.
Table 5.
Average values for the ADTSA, TSA, ADTSA1, and other variants for 100D.
| Function | ADTSA | TSA | ADTSA1 | ADTSA2 | ADTSA3 | ADTSA4 |
|---|
| F1 | | | | | | |
| F2 | | | | | | |
| F3 | | | | | | |
| F4 | | | | | | |
| F5 | | | | | | |
| F6 | | | | | | |
| F7 | | | | | | |
| F8 | | | | | | |
| F9 | | | | | | |
| F10 | | | | | | |
| F11 | | | | | | |
| F12 | | | | | | |
| F13 | | | | | | |
| F14 | | | | | | |
| F15 | | | | | | |
| F16 | | | | | | |
| F17 | | | | | | |
| F18 | | | | | | |
| F19 | | | | | | |
| F20 | | | | | | |
| F21 | | | | | | |
| F22 | | | | | | |
| F23 | | | | | | |
| F24 | | | | | | |
| F25 | | | | | | |
| F26 | | | | | | |
| F27 | | | | | | |
| F28 | | | | | | |
| F29 | | | | | | |
| F30 | | | | | | |
| Rank first | 24 | 0 | 0 | 5 | 0 | 1 |
Table 6.
Average values for ADTSA and other heuristics for 30D.
Table 6.
Average values for ADTSA and other heuristics for 30D.
| Function | ADTSA | TSA | fb-tsa | MTSA | EST-TSA | STSA | LSHADE | JADE | lshade-rsp | GWO | BOA | PSO | GA | RSA |
|---|
| F1 | | | | | | | | | | | | | | |
| F2 | | | | | | | | | | | | | | |
| F3 | | | | | | | | | | | | | | |
| F4 | | | | | | | | | | | | | | |
| F5 | | | | | | | | | | | | | | |
| F6 | | | | | | | | | | | | | | |
| F7 | | | | | | | | | | | | | | |
| F8 | | | | | | | | | | | | | | |
| F9 | | | | | | | | | | | | | | |
| F10 | | | | | | | | | | | | | | |
| F11 | | | | | | | | | | | | | | |
| F12 | | | | | | | | | | | | | | |
| F13 | | | | | | | | | | | | | | |
| F14 | | | | | | | | | | | | | | |
| F15 | | | | | | | | | | | | | | |
| F16 | | | | | | | | | | | | | | |
| F17 | | | | | | | | | | | | | | |
| F18 | | | | | | | | | | | | | | |
| F19 | | | | | | | | | | | | | | |
| F20 | | | | | | | | | | | | | | |
| F21 | | | | | | | | | | | | | | |
| F22 | | | | | | | | | | | | | | |
| F23 | | | | | | | | | | | | | | |
| F24 | | | | | | | | | | | | | | |
| F25 | | | | | | | | | | | | | | |
| F26 | | | | | | | | | | | | | | |
| F27 | | | | | | | | | | | | | | |
| F28 | | | | | | | | | | | | | | |
| F29 | | | | | | | | | | | | | | |
| F30 | | | | | | | | | | | | | | |
| Rank first | 16 | 1 | 2 | 2 | 1 | 0 | 4 | 3 | 2 | 0 | 2 | 0 | 0 | 3 |
Table 7.
Average values for ADTSA and other heuristics for 50D.
Table 7.
Average values for ADTSA and other heuristics for 50D.
| Function | ADTSA | TSA | fb-tsa | MTSA | EST-TSA | STSA | LSHADE | JADE | lshade-rsp | GWO | BOA | PSO | GA | RSA |
|---|
| F1 | | | | | | | | | | | | | | |
| F2 | | | | | | | | | | | | | | |
| F3 | | | | | | | | | | | | | | |
| F4 | | | | | | | | | | | | | | |
| F5 | | | | | | | | | | | | | | |
| F6 | | | | | | | | | | | | | | |
| F7 | | | | | | | | | | | | | | |
| F8 | | | | | | | | | | | | | | |
| F9 | | | | | | | | | | | | | | |
| F10 | | | | | | | | | | | | | | |
| F11 | | | | | | | | | | | | | | |
| F12 | | | | | | | | | | | | | | |
| F13 | | | | | | | | | | | | | | |
| F14 | | | | | | | | | | | | | | |
| F15 | | | | | | | | | | | | | | |
| F16 | | | | | | | | | | | | | | |
| F17 | | | | | | | | | | | | | | |
| F18 | | | | | | | | | | | | | | |
| F19 | | | | | | | | | | | | | | |
| F20 | | | | | | | | | | | | | | |
| F21 | | | | | | | | | | | | | | |
| F22 | | | | | | | | | | | | | | |
| F23 | | | | | | | | | | | | | | |
| F24 | | | | | | | | | | | | | | |
| F25 | | | | | | | | | | | | | | |
| F26 | | | | | | | | | | | | | | |
| F27 | | | | | | | | | | | | | | |
| F28 | | | | | | | | | | | | | | |
| F29 | | | | | | | | | | | | | | |
| F30 | | | | | | | | | | | | | | |
| Rank first | 16 | 0 | 3 | 3 | 1 | 1 | 3 | 1 | 2 | 1 | 3 | 0 | 0 | 3 |
Table 8.
Average values for ADTSA and other heuristics for 100D.
Table 8.
Average values for ADTSA and other heuristics for 100D.
| Function | ADTSA | TSA | fb-tsa | MTSA | EST-TSA | STSA | LSHADE | JADE | lshade-rsp | GWO | BOA | PSO | GA | RSA |
|---|
| F1 | | | | | | | | | | | | | | |
| F2 | | | | | | | | | | | | | | |
| F3 | | | | | | | | | | | | | | |
| F4 | | | | | | | | | | | | | | |
| F5 | | | | | | | | | | | | | | |
| F6 | | | | | | | | | | | | | | |
| F7 | | | | | | | | | | | | | | |
| F8 | | | | | | | | | | | | | | |
| F9 | | | | | | | | | | | | | | |
| F10 | | | | | | | | | | | | | | |
| F11 | | | | | | | | | | | | | | |
| F12 | | | | | | | | | | | | | | |
| F13 | | | | | | | | | | | | | | |
| F14 | | | | | | | | | | | | | | |
| F15 | | | | | | | | | | | | | | |
| F16 | | | | | | | | | | | | | | |
| F17 | | | | | | | | | | | | | | |
| F18 | | | | | | | | | | | | | | |
| F19 | | | | | | | | | | | | | | |
| F20 | | | | | | | | | | | | | | |
| F21 | | | | | | | | | | | | | | |
| F22 | | | | | | | | | | | | | | |
| F23 | | | | | | | | | | | | | | |
| F24 | | | | | | | | | | | | | | |
| F25 | | | | | | | | | | | | | | |
| F26 | | | | | | | | | | | | | | |
| F27 | | | | | | | | | | | | | | |
| F28 | | | | | | | | | | | | | | |
| F29 | | | | | | | | | | | | | | |
| F30 | | | | | | | | | | | | | | |
| Rank first | 20 | 0 | 1 | 3 | 2 | 1 | 1 | 3 | 0 | 1 | 3 | 0 | 0 | 4 |
Table 9.
Tension/compression spring design problem.
Table 9.
Tension/compression spring design problem.
| | ADTSA | TSA | RSA | GWO | SO | PSO | GA | OMA | BOA |
|---|
| best | 0.013 | 0.013 | 0.013 | 0.013 | 0.013 | 0.013 | 0.015 | 0.013 | 0.013 |
| mean | 0.013 | 0.013 | 0.015 | 0.013 | 0.013 | 0.013 | 0.019 | 0.013 | 0.027 |
| std | 0.000 | 0.000 | 0.004 | 0.000 | 0.001 | 0.001 | 0.003 | 0.000 | 0.015 |
| worst | 0.013 | 0.013 | 0.030 | 0.013 | 0.017 | 0.018 | 0.028 | 0.013 | 0.080 |
| 11.317 | 10.811 | 15.000 | 12.790 | 11.171 | 10.544 | 7.558 | 10.640 | 11.013 |
| 0.356 | 0.365 | 0.310 | 0.334 | 0.359 | 0.357 | 0.410 | 0.368 | 0.368 |
| 0.052 | 0.052 | 0.050 | 0.051 | 0.052 | 0.052 | 0.055 | 0.052 | 0.052 |
Table 10.
Design problem of three-bar truss.
Table 10.
Design problem of three-bar truss.
| | ADTSA | TSA | RSA | GWO | SO | PSO | GA | OMA | BOA |
|---|
| best | 263.896 | 263.896 | 263.921 | 263.899 | 263.896 | 263.896 | 263.896 | 263.896 | 263.896 |
| mean | 263.896 | 263.896 | 265.371 | 263.902 | 263.896 | 263.897 | 263.911 | 263.896 | 264.025 |
| std | 0.000 | 0.000 | 1.185 | 0.005 | 0.000 | 0.001 | 0.015 | 0.000 | 0.249 |
| worst | 263.896 | 263.896 | 267.869 | 263.906 | 263.896 | 263.899 | 263.952 | 263.896 | 264.932 |
| 0.789 | 0.789 | 0.793 | 0.789 | 0.788 | 0.789 | 0.788 | 0.789 | 0.789 |
| 0.408 | 0.408 | 0.397 | 0.408 | 0.410 | 0.409 | 0.410 | 0.408 | 0.408 |
Table 11.
Design problem of welded beam.
Table 11.
Design problem of welded beam.
| | ADTSA | TSA | RSA | GWO | SO | PSO | GA | OMA | BOA |
|---|
| best | 1.693 | 1.693 | 1.860 | 1.694 | 1.694 | 1.693 | 1.896 | 1.693 | 1.794 |
| mean | 1.693 | 1.693 | 2.142 | 1.695 | 1.707 | 1.710 | 2.250 | 1.693 | 2.435 |
| std | 0.000 | 0.000 | 0.398 | 0.001 | 0.019 | 0.033 | 0.153 | 0.000 | 0.478 |
| worst | 1.693 | 1.693 | 4.074 | 1.695 | 1.720 | 1.773 | 2.683 | 1.693 | 3.883 |
| h | 0.206 | 0.206 | 0.195 | 0.206 | 0.205 | 0.206 | 0.208 | 0.206 | 0.174 |
| l | 3.235 | 3.235 | 3.076 | 3.235 | 3.247 | 3.235 | 3.235 | 3.235 | 4.386 |
| t | 9.037 | 9.037 | 10.000 | 9.038 | 9.036 | 9.037 | 9.037 | 9.037 | 9.057 |
| b | 0.206 | 0.206 | 0.211 | 0.206 | 0.206 | 0.206 | 0.256 | 0.206 | 0.206 |
Table 12.
Results for gil262 for the SDVRP.
Table 12.
Results for gil262 for the SDVRP.
| | ADTSA | TSA | RSA | GWO | SO | PSO | GA | OMA | BOA |
|---|
| best | 2.39 × 10⁴ | 2.49 × 10⁴ | 2.55 × 10⁴ | 2.70 × 10⁴ | 2.39 × 10⁴ | 2.59 × 10⁴ | 2.47 × 10⁴ | 2.50 × 10⁴ | 2.56 × 10⁴ |
| mean | 2.47 × 10⁴ | 2.59 × 10⁴ | 2.61 × 10⁴ | 2.87 × 10⁴ | 2.50 × 10⁴ | 2.64 × 10⁴ | 2.55 × 10⁴ | 2.59 × 10⁴ | 2.59 × 10⁴ |
| std | 4.36 × 10² | 2.70 × 10² | 2.18 × 10² | 5.84 × 10² | 8.97 × 10² | 2.41 × 10² | 4.03 × 10² | 2.47 × 10² | 1.96 × 10² |
| worst | 2.55 × 10⁴ | 2.62 × 10⁴ | 2.64 × 10⁴ | 2.97 × 10⁴ | 2.58 × 10⁴ | 2.69 × 10⁴ | 2.63 × 10⁴ | 2.61 × 10⁴ | 2.63 × 10⁴ |
Table 13.
Results for Loggi-n401-k23 for the SDVRP.
Table 13.
Results for Loggi-n401-k23 for the SDVRP.
| | ADTSA | TSA | RSA | GWO | SO | PSO | GA | OMA | BOA |
|---|
| best | 1.10 × 10⁵ | 1.21 × 10⁵ | 1.21 × 10⁵ | 1.33 × 10⁵ | 1.19 × 10⁵ | 1.21 × 10⁵ | 1.16 × 10⁵ | 1.20 × 10⁵ | 1.20 × 10⁵ |
| mean | 1.17 × 10⁵ | 1.24 × 10⁵ | 1.24 × 10⁵ | 1.39 × 10⁵ | 1.22 × 10⁵ | 1.26 × 10⁵ | 1.21 × 10⁵ | 1.23 × 10⁵ | 1.24 × 10⁵ |
| std | 2.76 × 10³ | 1.15 × 10³ | 1.14 × 10³ | 3.58 × 10³ | 1.19 × 10³ | 1.52 × 10³ | 2.20 × 10³ | 9.83 × 10² | 1.26 × 10³ |
| worst | 1.21 × 10⁵ | 1.25 × 10⁵ | 1.26 × 10⁵ | 1.45 × 10⁵ | 1.24 × 10⁵ | 1.28 × 10⁵ | 1.25 × 10⁵ | 1.24 × 10⁵ | 1.26 × 10⁵ |
Table 14.
Results for Loggi-n1001-k31 for the SDVRP.
Table 14.
Results for Loggi-n1001-k31 for the SDVRP.
| | ADTSA | TSA | RSA | GWO | SO | PSO | GA | OMA | BOA |
|---|
| best | 2.85 × 10⁵ | 2.90 × 10⁵ | 2.91 × 10⁵ | 3.05 × 10⁵ | 2.86 × 10⁵ | 2.91 × 10⁵ | 2.88 × 10⁵ | 2.90 × 10⁵ | 2.89 × 10⁵ |
| mean | 2.89 × 10⁵ | 2.93 × 10⁵ | 2.93 × 10⁵ | 3.11 × 10⁵ | 2.93 × 10⁵ | 2.97 × 10⁵ | 2.92 × 10⁵ | 2.92 × 10⁵ | 2.93 × 10⁵ |
| std | 1.89 × 10³ | 1.21 × 10³ | 1.12 × 10³ | 2.94 × 10³ | 1.47 × 10³ | 2.06 × 10³ | 2.20 × 10³ | 9.97 × 10² | 1.33 × 10³ |
| worst | 2.93 × 10⁵ | 2.95 × 10⁵ | 2.96 × 10⁵ | 3.18 × 10⁵ | 2.94 × 10⁵ | 3.00 × 10⁵ | 2.95 × 10⁵ | 2.94 × 10⁵ | 2.95 × 10⁵ |


