Article

Decision Trees for Strategic Choice of Augmenting Management Intuition with Machine Learning

by
Guoyu Luo
1,*,
Mohd Anuar Arshad
1 and
Guoxing Luo
2
1
School of Management, University Sains Malaysia, Gelugor 11800, Penang, Malaysia
2
Department of Bioengineering, Shuozhou Vocatinal Technical College, Shuozhou 036002, China
*
Author to whom correspondence should be addressed.
Symmetry 2025, 17(7), 976; https://doi.org/10.3390/sym17070976
Submission received: 30 March 2025 / Revised: 27 April 2025 / Accepted: 4 June 2025 / Published: 20 June 2025
(This article belongs to the Section Computer)

Abstract

:
Strategic financial decision-making is critical for organizational sustainability and competitive advantage. However, traditional approaches that rely solely on human expertise or isolated machine learning (ML) models often fall short in capturing the complex, multifaceted, and often asymmetrical nature of financial data, leading to suboptimal predictions and limited interpretability. This study addresses these challenges by developing an innovative, symmetry-aware integrated ML framework that synergizes decision trees, advanced ensemble techniques, and human expertise to enhance both predictive accuracy and model transparency. The proposed framework employs a symmetrical dual-feature selection process, combining automated methods based on decision trees with expert-guided selections, ensuring the inclusion of both statistically significant and domain-relevant features. Furthermore, the integration of human expertise facilitates rule-based adjustments and iterative feedback loops, refining model performance and aligning it with practical financial insights. Empirical evaluation shows a significant improvement in ROC-AUC by 2% and F1-score by 1.5% compared to baseline and advanced ML models alone. The inclusion of expert-driven rules, such as thresholds for debt-to-equity ratios and profitability margins, enables the model to account for real-world asymmetries that automated methods may overlook. Visualizations of the decision trees offer clear interpretability, providing decision-makers with symmetrical insight into how financial metrics influence bankruptcy predictions. This research demonstrates the effectiveness of combining machine learning with expert knowledge in bankruptcy prediction, offering a more robust, accurate, and interpretable decision-making tool. By incorporating both algorithmic precision and human reasoning, the study presents a balanced and symmetrical hybrid approach, bridging the gap between data-driven analytics and domain expertise. The findings underscore the potential of symmetry-driven integration of ML techniques and expert knowledge to enhance strategic financial decision-making.

1. Introduction

Financial management decisions remain at the base of organizational success in determining organic growth, competitive positioning, and profitability. To compete effectively in a constantly fluctuating marketplace, organizations face a number of interconnected issues and concerns in the efficient and effective use of resources in resource scarcity, risk management, and business growth opportunities in financial environment. Organizations must navigate multifaceted challenges to optimize resource allocation, manage risks, and seize growth opportunities [1]. It shows financial activities that can be referred to as the practice of finance consisting of investment appraisal, capital budgeting, risk management as well as financial forecasting. All these decisions influence the nature and future of any organization in terms of profitability, resource management, and market positioning [2]. The ever-evolving conditions of global markets provoked by technology development, changes in legislation and economic instability require sound and flexible decision-making tools. The mostly qualitative methods based on the experienced operators, as well as historical statistics, are not very effective to cope with multilayer modern financial processes’ interfaces. As a result, there is an acute demand for better ways to combine multiple types of data, capture intricate structures, and deliver insights for guiding higher-level endeavors [3].
Machine learning (ML) has gained significant attention over the years and has become the driving power in the financial business, with various advanced techniques in data analysis and prediction as well as automation. ML techniques are used in finance across several fields such as algorithm trading, credit risk assessment, fraud detection, portfolio optimization, and forecasting [4]. Since ML models can learn from large datasets, recognize non-linear patterns, and develop into recognizing new emerging patterns, statistical methods are enhanced with them significantly [5]. Another more crucial benefit of machine learning in finance is that it provides a much better prediction rate. Machine learning techniques of a higher level, like ensemble learning methods and deep learning, have shown better results for estimating business performance, outlier detection, and optimizing investment strategies [6]. These models are able to take inputs of features which may be in high dimensions and incorporate unstructured texts such as news articles, social media post, and market reports into the decision-making processes, enhancing the decision-making processes with comprehensive information in real time. In addition, ML helps automate specific tasks that are commonly assessed to support financial reports, making it easier to do and with less chance of errors. Some applications of AI include but are not limited to automated trading system using ML to trade at the right time, informed by analysis, boosting profitability, and effectiveness [7]. Likewise, investor protection through concepts like fair value enhances risk management and machine learning-driven credit scoring improves the lender’s ability to rate the borrower effectively, hence promoting minority access to credit [8].
However, a problem occurs when applying ML for strategic financial decision-making. Indeed, one of the key problems is the explainability of the results obtained in ML models. While complex algorithms like deep neural networks and ensemble methods offer high predictive performance, they often operate as “black boxes”, providing limited transparency into their decision-making processes [9]. In finance, where regulatory compliance, accountability, and trust are paramount, the inability to explain model predictions poses significant barriers to adoption [10]. The other vital bane is the quality and accessibility of the information. Financial data are always noisy, high-dimensional, and contain various forms of biases. Data preprocessing steps involving the protection of data integrity together with methods for treating missing values and managing outliers create fundamental performance changes in models [11]. The players involved in financial markets exhibit continuous movement while market trends along with variable relationships undergo constant changes. A statistical model built on previous market data becomes unfit for purpose when it cannot adapt to industry trends along with market structure changes. Financial applications of ML require ethical examination due to crucial questions that need assessment. Data privacy together with algorithmic bias and systemic risks demand comprehensive governance structures for proper management according to [12]. Organizations should deploy ML models by putting innovation beside responsibility to protect security and fair treatment while maintaining system transparency [13].
The solution to address these challenges depends on joint capabilities from ML methods together with conventional approaches which we have already considered. Research has indicated that combined systems that combine human experts with machine analysis (Human-in-the-loop, HITL) represent a strong approach for boosting financial decision processes [14]. Organizations can achieve better analysis and correct reasoning from experts by uniting the numeric analysis of ML with human specialists who understand context. Several techniques are used to incorporate human knowledge in the frameworks used in ML. Expert-driven feature selection, for instance, ensures that models incorporate domain-relevant variables that could not be automatically identified by algorithms [15]. This collaboration enhances the model’s ability to capture critical financial indicators and improves its overall predictive performance. Additionally, expert feedback can be used to refine model outputs, implement rule-based adjustments, and validate predictions, thereby bridging the gap between data-driven analytics and practical financial insights [16]. Hence, there is an intensive utilization of human judgments in model interpretability and responsibility. Experts can interpret complex model results, provide explanations for predictions, and ensure that the models align with regulatory and ethical standards [17]. This collaborative approach not only enhances trust in ML-driven decisions but also facilitates regulatory compliance and ethical responsibility [18].
Decision trees (DTs) are one of the basic ML approaches, very popular among the financial sector because of their explainability and ease. DTs partition data into subsets based on feature values, making them highly intuitive and easy to visualize [19]. They provide clear decision rules that can be directly applied to financial decision-making processes, such as credit risk assessment and investment evaluation [20]. However, single decision trees are prone to overfitting and may exhibit limited predictive performance on complex datasets [21]. In order to overcome these limitations, the newer methods like Random Forest (RF) and Gradient Boosting Machine (GBM) techniques, namely extra gradient boosting (XGboost), light GBM, etc., have evolved. These techniques generate multiple decision trees and then use the invents to make them more robust, less variable, and more generalized.
Random Forests combine multiple decision tree (DT) predictions which rely on various subsets of data and features in order to reduce overfitting and maximize prediction accuracy [22]. Gradient Boosting Machines construct multiple trees through serial ensemble operations that focus on fixing errors made by previous models to achieve very precise predictive models [23]. Various financial applications use high-performing ensemble methods like these for stock price prediction, portfolio optimization, and fraud detection systems according to [24]. Our team has discovered that ensemble methods generate their own set of interpretability issues despite their effective performance. The aggregation method is used by multiple trees for better accuracy results in decision-making processes that become harder to understand as the certification process becomes more complicated [25]. The competing demands between performance and interpretation require integrated systems that effectively strike this trade-off according to [26].
This study aims to bridge the identified gaps by developing and validating an integrated ML framework that combines decision trees, advanced ensemble techniques, and human expertise to enhance strategic financial decision-making. The specific objectives of this research are the following: (i) to create a hybrid framework that leverages the interpretability of decision trees and the predictive power of advanced ensemble ML models, augmented by human expertise for feature selection and model refinement; (ii) to demonstrate that the integrated framework achieves superior predictive performance compared to individual models while maintaining high levels of interpretability through expert-driven adjustments; (iii) to apply the framework to comprehensive financial datasets, evaluating its effectiveness in real-world financial decision-making scenarios such as bankruptcy prediction, risk assessment, and investment strategy optimization; (iv) to incorporate ethical considerations into the framework development, ensuring data privacy, mitigating algorithmic bias, and enhancing model accountability through transparency and expert validation.
In this study, the main contributions are as follows:
  • Introduces a unique methodology that synergizes decision trees, advanced ensemble ML models, and human expertise, providing a balanced solution that enhances both accuracy and interpretability.
  • Offers robust empirical evidence demonstrating the framework’s effectiveness in improving financial decision-making processes, thereby advancing the application of ML in finance.
  • Establishes a comprehensive approach that integrates ethical considerations into ML framework development, promoting responsible AI practices in financial analytics.
  • Provides actionable insights and tools for financial analysts and strategic managers, enabling more informed and effective decision-making through the combined use of ML and human expertise.
This study is structured into eight major sections: Section 1 is about introducing how energy efficiency analysis techniques of houses need to undergo a radical change. Section 2 reviews existing studies on ML applications in finance, decision trees and ensemble methods, and the integration of human expertise in ML frameworks, highlighting the gaps that this research addresses. Section 3 discusses the methodology used in the study, detailing data sources, feature descriptions, and preprocessing steps, and outlines the methodology underpinning the integrated ML framework. Section 4 details the development of the automated feature selection and expert feedback-integrated ML framework. Section 5 presents the model development, integration of human expertise, training, and optimization. Section 6 presents empirical findings, comparing the performance of the integrated framework against baseline and advanced ML models, and analyzing feature importance and model interpretability. Section 7 concludes the key findings, contributions, and practical implications of the study, and offers recommendations for future research.

2. Literature Review

The adoption of machine learning in the financial decision-making process has imparted a new form of versatility and populism to the financial analysis. These algorithms are capable of dealing with big and intricate data, identifying interconnections and dependencies unknown to basic statistics [27]. These computational tools have been applied to numerous financial applications, such as credit scoring, fraud detection, algorithmic trading, risk management, portfolio optimization, etc. [28]. For instance, the supply chain credit risk evaluation based on the ML has provided more reliable predictions about borrowers’ default compared to the traditional models, which enhances credit risk management and lending decisions and mitigates default risks [29]. Aside from enhancing forecasting precision, developing ML models provides real-time processing to detect and manage emerging risk factors that have not been accounted for in earlier models [30]. Their ability to generalize allows them to hold high predictive accuracy over time while the financial environment continues to change [31]. However, there is a lot of hurdles in implementing ML in finance, yet it does not pose a serious threat to displacement of human managerial decisions; rather, it has the goals of augmenting managerial instinct and, hence, problems such as data quality and interpretability and ethical issues [32] are core aspects that should be conquered in order to deploy perfect tools of ML in finance.
Decision trees (DTs) have emerged as a key ML methodology in financial contexts due to their inherent simplicity and interpretability [33]. DTs rely on a hierarchical structure of decision rules, providing a transparent model that resonates with the way human experts conceptualize strategic financial choices [34]. This characteristic is especially valuable where explainability is critical, as in regulatory environments and high-stakes decision-making settings [35]. In practice, DTs have been utilized for segmenting borrowers into risk categories, guiding loan approval processes, and identifying relevant indicators that inform investment strategies [36]. However, DTs are prone to overfitting, potentially diminishing their predictive robustness and limiting their applicability to highly volatile financial domains [37]. The development of ensemble methods Random Forests (RFs) and Gradient Boosting Machines (GBMs) enabled the use of multiple decision trees for improving model accuracy and generalized performance as well as stability [38]. The outcomes of numerous decorrelated trees are averaged in Random Forests to minimize both variance and prevent overfitting problems according to [39]. Two widely used Gradient Boosting Machine versions, known as XGBoost and LightGBM, function by updating predictions in a serial manner through iterative error correction processes [40]. These superior ensemble techniques operate successfully throughout multiple financial settings by predicting stock movements and identifying fraudulent transactions while managing portfolio investments [41]. The implementation of complex models results in lower interpretability, which means stakeholders struggle to grasp the information in unpredictable ways.
The strategic financial decision-making process faces a significant drawback because it requires a balance between model performance and transparency. Managers who make strategic decisions need to integrate ensemble modeling results with their professional knowledge and business expertise because sophisticated ensemble systems deliver the best predictive performance. HITL frameworks are increasingly important to research because they use expert knowledge to improve ML capabilities, as shown in [3]. Strategic financial direction and ethical boundaries can be reinforced by practitioner expertise, which guides the model development through feature selection and model validation as well as decision rule interpretation [42]. The incorporation of expert input with management intuition into AI systems leads to improved capabilities in financial prediction technology and clarification of their output logic. The ability of experts to find relevant characteristics among leverage metrics in specific industries will enhance both domain suitability and predictive strength of the model [43]. This progression enables successive review stages to permit experts to revise models based on their advice and regulatory standards. The combination of expert-based collaboration enables organizations to both follow established business rules and compliance standards while using ML-generated recommendations that maintain alignment with organizational norms and policies [44].
That being said, there is still a myriad of issues to be addressed. Model interpretability stands out as a critical issue, particularly in complex ensemble methods and deep learning architectures that function as “black boxes” [45]. Financial decision-making often necessitates transparent, justifiable reasoning to satisfy internal governance, regulatory mandates, and stakeholder scrutiny [46]. Ensuring data quality is another persistent challenge, as financial datasets are frequently noisy, incomplete, or biased, requiring comprehensive preprocessing and fairness-aware modeling approaches [47]. Moreover, markets are inherently dynamic, compelling models to adapt continuously and prevent performance degradation over time [48]. The role of ethical concerns in ML for financial models has grown as of today. Data privacy, discrimination prevention, algorithmic bias, and systemic risk represent ongoing concerns that must be integrated into the model development lifecycle [49]. Tackling such ethical considerations before an incident occurs can increase stakeholder trust and diminish foul play or negative side effects in a system constructed on a combination of machine learning and finance.
Table 1 presents a summary of key studies in this domain. These works underline the transformative potential of ML in finance, the strengths and limitations of decision trees, the effectiveness of ensemble methods, and the need for expert integration. They also emphasize the centrality of ethical and interpretability challenges that remain unresolved. As indicated in Table 1, while ML technologies offer transformative potential for financial decision-making, challenges remain. Decision trees provide interpretability but require complementary methods such as ensemble modeling and expert integration to avoid overfitting and to achieve sufficient robustness [50]. Ethical dimensions are increasingly prominent, with researchers advocating fairness-aware algorithms and explainable AI (XAI) techniques to enhance trust, transparency, and regulatory compliance [51]. In [52,53], the most common financial tasks that XAI was used for were fraud detection, stock price prediction, and credit management. The explainability of the three most widely used AI black-box techniques in finance Random Forest, Extreme Gradient Boosting (XGBoost), and Artificial Neural Networks (ANNs) was assessed. Shapley additive explanations (SHAP), feature importance, and rule-based approaches are used in the majority of the reviewed publications [54,55].
A critical gap in the current literature lies in the comprehensive integration of DT-based methods with advanced ensemble techniques and management intuition within a unified strategic decision-making framework. Existing studies largely focus on either maximizing predictive performance through advanced ML models or maintaining interpretability using simpler models, while seldom combining the strengths of both approaches with domain-specific human insight [50]. This oversight restricts the development of holistic solutions that not only deliver superior predictive accuracy but also preserve transparency, adhere to ethical standards, and align with organizational strategic objectives. Similarly, while ethics and interpretability are emphasized as priorities, they are often tackled piecemeal rather than as integral parts of the model development and deployment process [12]. Moreover, empirical evidence demonstrating how human expertise can effectively refine model outputs to better support strategic managerial decisions remains limited [56].
In light of these identified gaps, this study proposes an integrated ML framework tailored to the strategic choice of augmenting management intuition with machine learning. By leveraging decision trees as an interpretable foundation and enhancing their robustness through advanced ensemble methods and iterative expert involvement, the framework aims to deliver both high predictive accuracy and clear, context-driven explanations. Furthermore, embedding ethical considerations and governance mechanisms from the outset ensures that the resulting models are not only effective in real-world financial contexts but also aligned with broader social responsibilities and regulatory mandates.
This approach offers an avenue to move beyond the dichotomy of accuracy versus interpretability, forging a path toward practical, trustworthy, and strategically informed financial decision-making. In doing so, it aligns the analytical capabilities of ML with the nuanced judgments that financial managers and executives must bring to critical strategic choices.
Table 1. Summary of key literature.
Author(s)YearPurposeMethodologyFindings
Mashrur et al. [4]2020Explore ML applications in financial decision-makingReviewML enhances predictive accuracy in finance.
Deep [6]2024Compare ensemble ML techniques in financial contextsEmpirical studyGBMs outperform single DTs in predictive tasks.
Mestiri et al. [8]2024Develop ML-based credit scoring modelsML modelingML models improve prediction of borrower defaults.
Nguyen & Tran [12]2024Address ethical concerns in ML for financeTheoretical analysisData privacy and bias are key ethical challenges.
Breiman et al. [33]2021Introduce and analyze decision trees (DT)Theoretical frameworkDTs are interpretable but prone to overfitting.
Charbuty & Abdulazeez [34]2021Examine limitations of decision treesAnalytical studySingle DTs have low generalizability in dynamic environments.
Chen et al. [57]2022Develop XGBoost algorithm for financial forecastingAlgorithm developmentXGBoost achieves high accuracy and efficiency.
Singh & Gupta [7]2014Implement ML-based automated trading systemsCase studyML improves profitability in trading strategies.
Jha et al. [5]2025Integrate expert knowledge into ML modelsHybrid modelingExpert integration enhances model reliability and trust.
Lappas & Yannacopoulos [56]2021Incorporate expert feedback into ML modelsExperimental studyExpert feedback refines model performance in financial settings.
Puchakaya et al. [10]2023Ensure model transparency in financial applicationsPolicy analysisRecommends explainable AI (XAI) techniques.
Piramuthu et al. [11]2006Improve data preprocessing for ML modelsData analysisEnhanced preprocessing boosts model accuracy.

3. Methodology

Financial decisions are critical to the performance of any business since they determine a firm’s profitability, growth rate, and sustainability. The ratios of profitability, liquidity, solvency, and efficiency are used as the financial performance measures of a firm. These metrics tend to provide useful information on the firm’s profitability status, debt position, operational efficiency, and financial sustainability. This paper examines how integration of prior knowledge with the use of machine learning can improve the accuracy of strategic financial decisions that may otherwise be informed by such financial measures. This section presents a detailed description of the rigorous method used to construct and verify the strategic financial decision-making integrated ML framework. The method comprises data acquisition, data preprocessing, feature extraction, integration of expert knowledge, model creation and tuning, model assessment, model implementation, and model refinement. They are all well thought out so that each one is rugged, precise, and grounded in sound financial realities.
The dataset utilized in this study collected from [58] includes a wide range of financial features, organized into five distinct categories and can be seen in Table 2: Profitability, Liquidity, Leverage, Growth, and Operational Efficiency. The dataset used in this study consists of 6820 observations, each representing a financial record of a company with various input features and a binary output feature. The output feature is “Bankrupt”, indicating whether the company went bankrupt (1) or not (0). The input features include a comprehensive set of financial ratios, performance metrics, and growth indicators, such as ROA before interest and depreciation, Operating Gross Margin, Operating Profit Rate, Net Value Per Share, Cash Flow Rate, Debt Ratios, and several others related to profitability, liquidity, asset management, and financial leverage. These features are crucial for assessing the financial health and predictive power of the model, particularly in forecasting bankruptcy and other financial outcomes. The dataset provides a rich set of financial indicators, which can be used for model training and testing in the context of strategic financial decision-making.
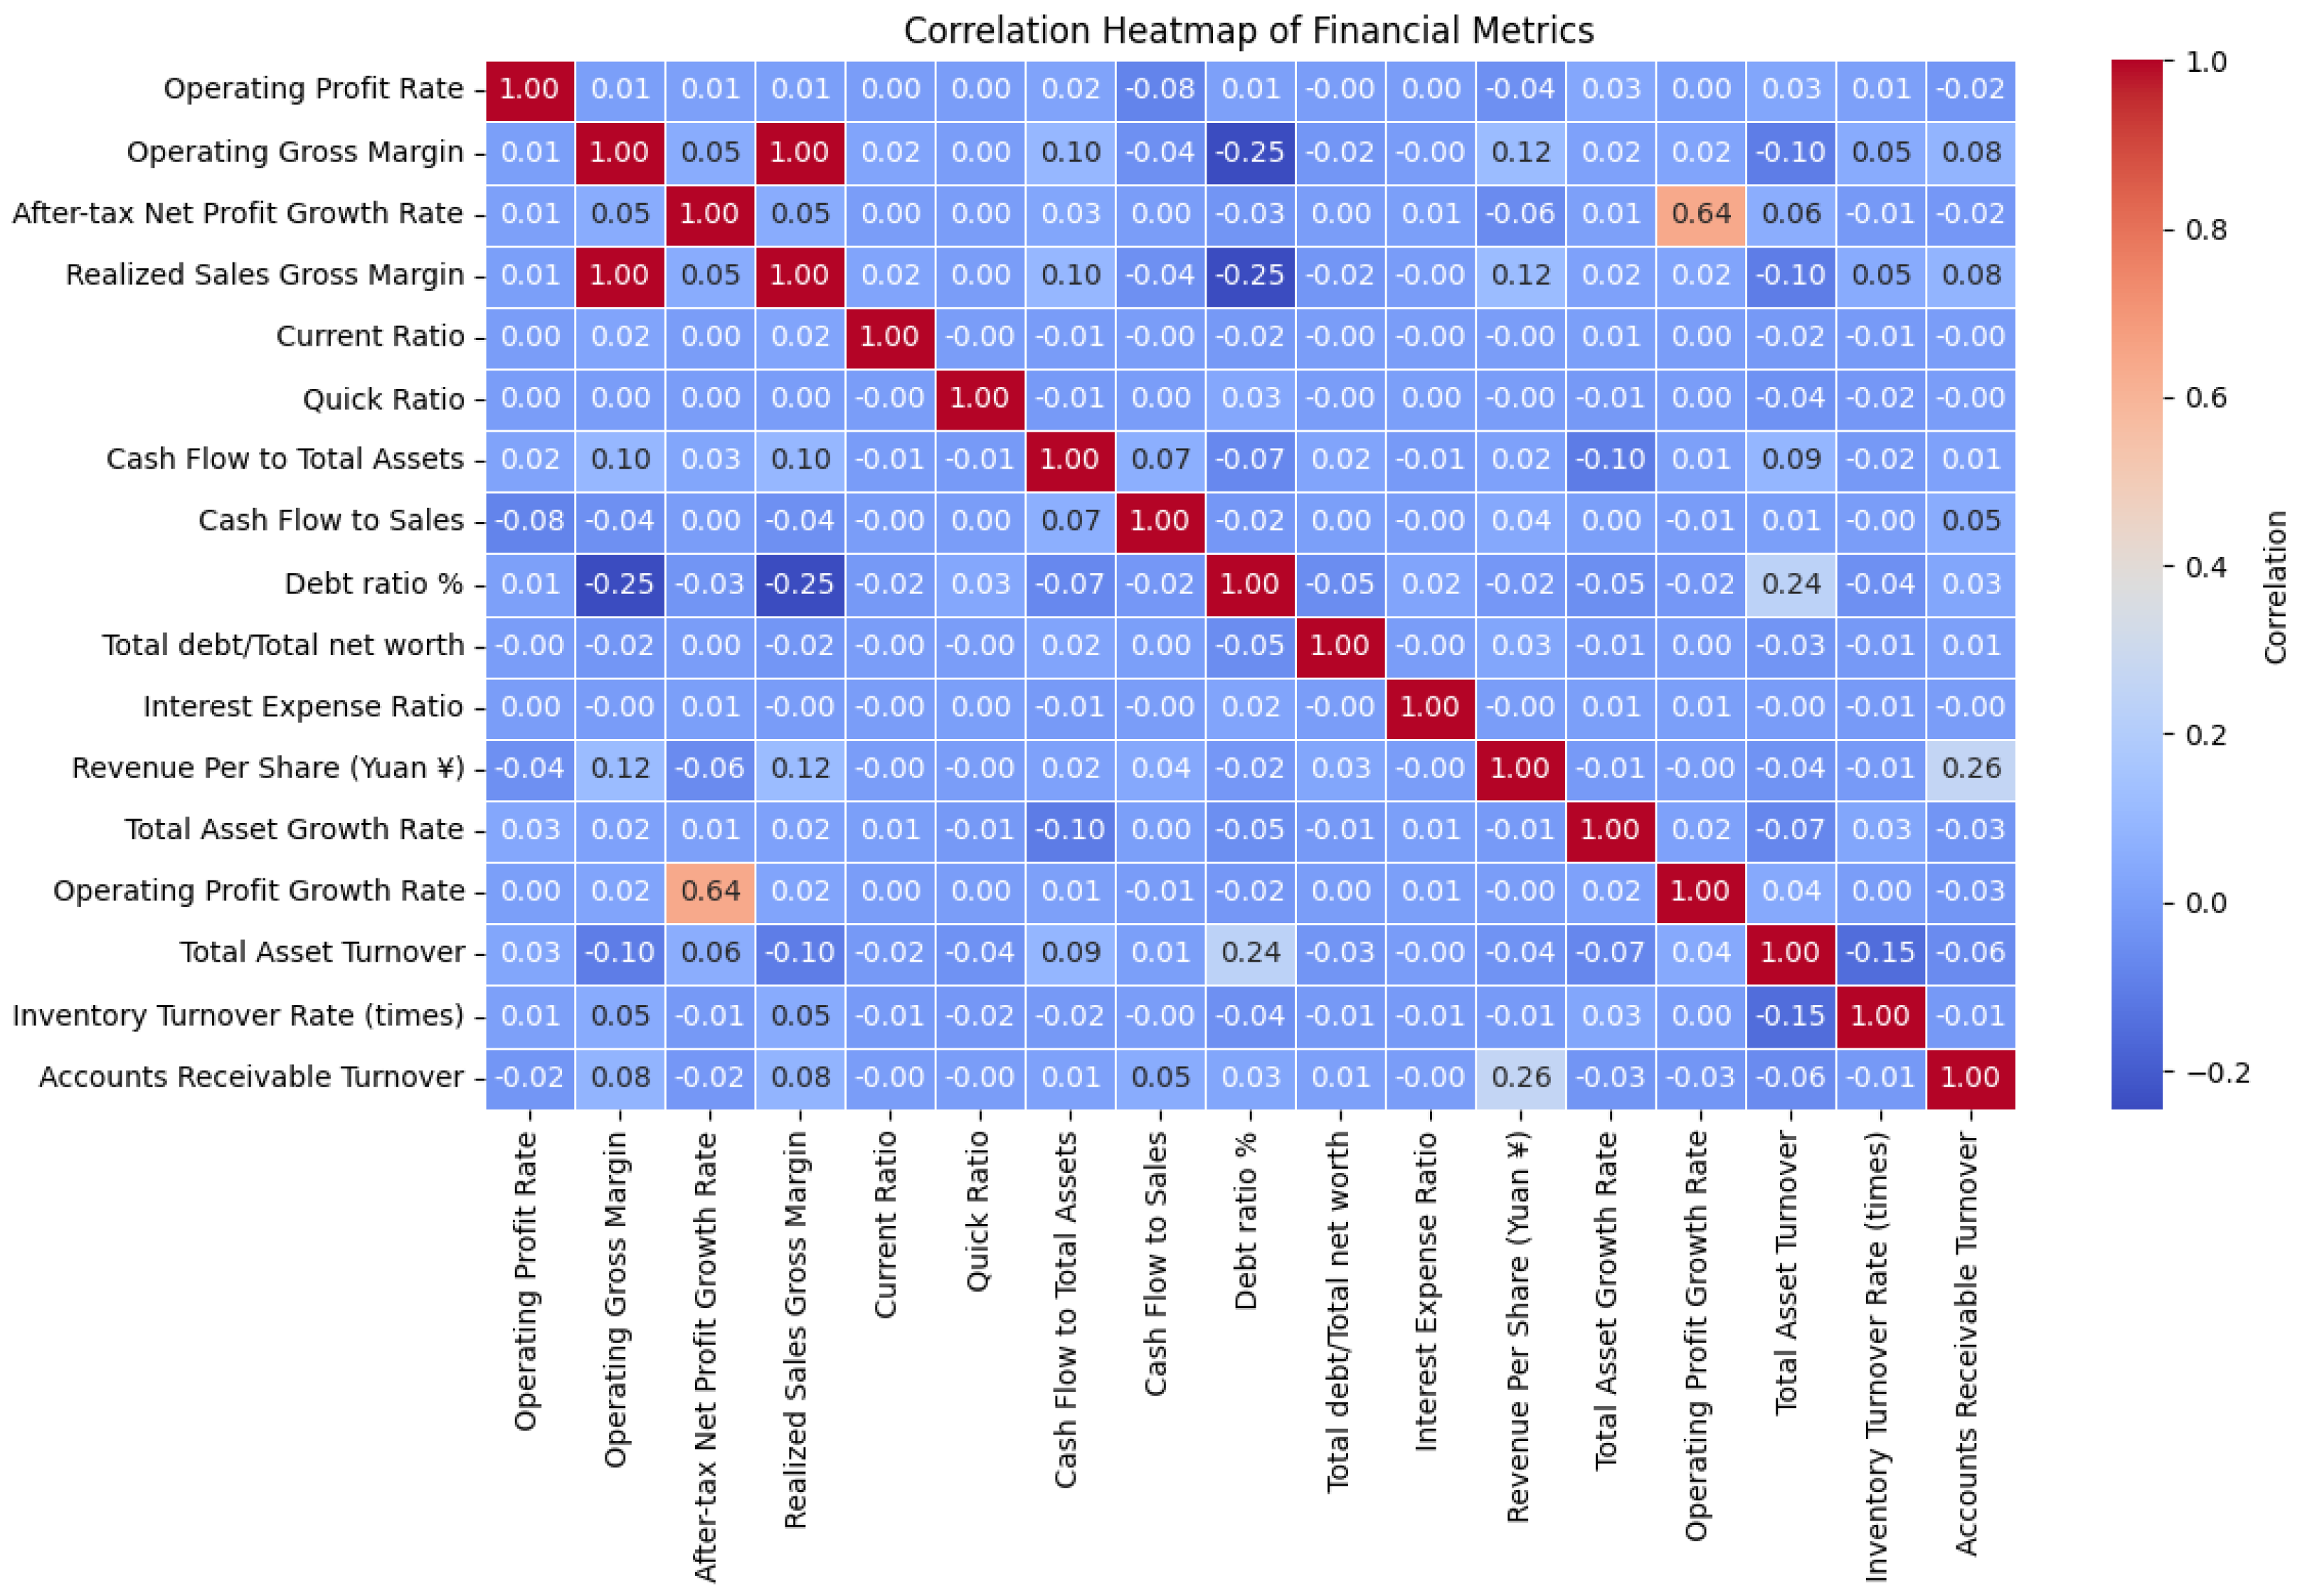
In the Exploratory Data Analysis at the beginning, some nice relations between the financial characteristics were revealed. From the Pearson’s correlation heatmap in Figure 1, it can be observed that there are linear relationships between the metrics that could be anticipated and some others as well that could not be predicted. For example, Operating Gross Margin and After-tax Net Profit Growth Rate have a relationship of positive correlation, which means that the higher the profitability level of the company, the higher post-tax profit growth rate will be. Likewise, the Debt Ratio % and the Total Debt to Total Net Worth are highly synchronized, which demonstrates the relationship between the debt ratios. Such relationships indicate that there exists a tendency of co-movement of some dimensions of financial characteristics such as profitability and leverage, while there may be a weak relationship between other characteristics such as operational efficiency and growth. However, the heatmap also indicates that there are relatively low levels of connection between some efficiency factors, including Inventory Turnover Rate and Accounts Receivable Turnover, which implies that these indicators may function as measures of a distinct financial characteristic. This further intensifies the nature of financial data, and that a simple model might not be enough to capture some of the characteristics. These correlations suggest the need for a model that can simultaneously consider multiple financial ratios and their interactions. Thus arises a need for a higher form of modeling, as a basic model may fail to capture all these aspects.
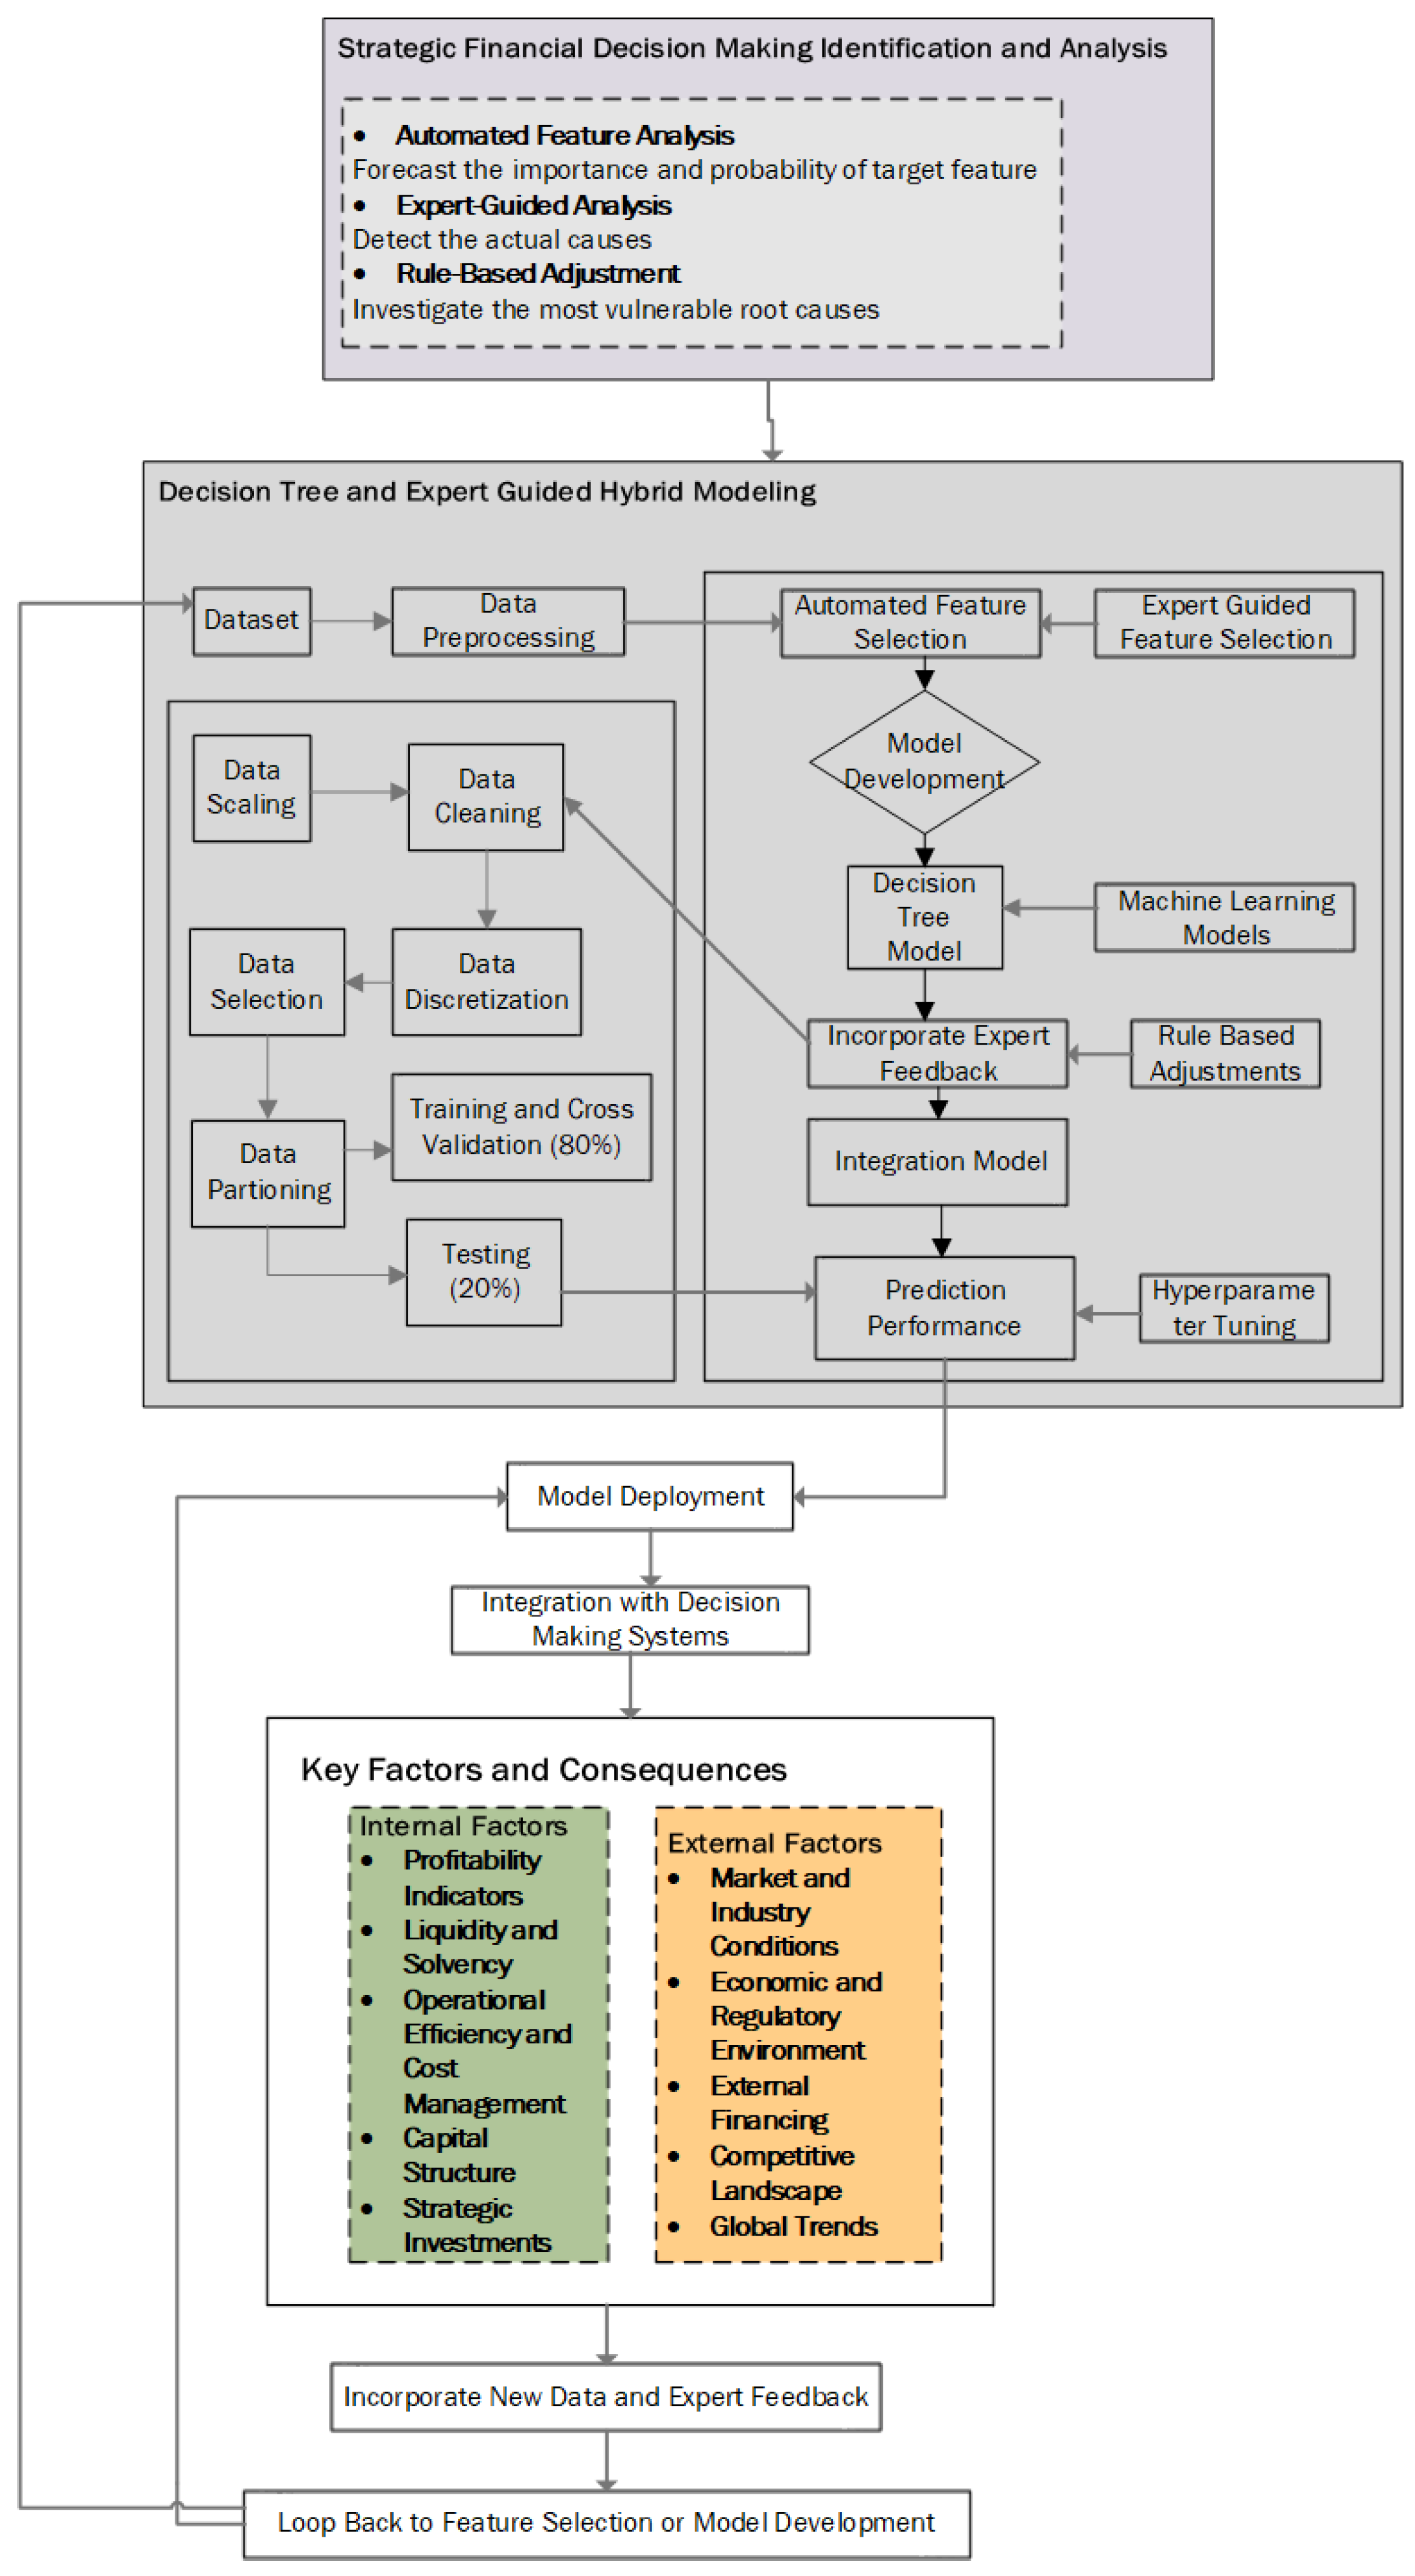
Given these findings, we propose a hybrid model in Figure 2: decision trees are merged with feedback from experts into a novel approach called Neural Information Framework to address the challenges that are present in financial decision-making. This model will be capable of recognizing relationships between different variables which are typical for the scope of the company’s financial performance, as well as taking into account such factors which are considered only in the given domain and are based on the experience of the financial specialists. In the following section, we will talk about the proposed framework, which is based on the combination of machine learning algorithms and financial analysts’ expertise to improve the efficiency of financial forecasts.

3.1. Research Design

The proposed hybrid framework can be seen in Figure 2, which depicts a comprehensive, iterative framework for strategic financial decision-making that synthesizes automated analytics, expert insight, and rule-based refinement. At the highest level, the Strategic Financial Decision-Making Identification and Analysis module encompasses three parallel streams: (1) automated feature analysis, in which statistical and tree-based methods forecast feature importance and target probabilities; (2) Expert-Guided Analysis, whereby domain specialists interrogate model outputs to uncover root causes; and (3) rule-based adjustment, which applies predefined financial thresholds (e.g., debt-to-equity limits) to diagnose vulnerable corporate conditions. The central “Hybrid Modeling” panel is divided into a data preprocessing subsystem (left) and a model development pipeline (right). In preprocessing, raw observations undergo scaling, cleaning, discretization into categorical bins, and feature selection before being partitioned into a training set (with cross-validation) and a hold-out test set. The model development pipeline first performs automated feature selection via decision-tree criteria, then integrates Expert-Guided Feature Selection to incorporate practitioner knowledge. Next, a suite of learners (decision tree, Random Forest, XGBoost) is trained; expert feedback and rule-based adjustments are then embedded into an Integration Model, which is subsequently refined through hyperparameter tuning and evaluated for Prediction Performance on the test data. Upon validation, the integrated model is deployed and embedded within organizational decision-support systems to generate real-time risk assessments. A dedicated Key Factors and Consequences module distinguishes between Internal Factors (e.g., profitability, liquidity, capital structure) and External Factors (e.g., market conditions, regulatory environment, competitive landscape), reinforcing the dual focus of the framework. Finally, new data and ongoing expert feedback are continuously looped back into feature selection or model retraining, ensuring that the system remains adaptive, transparent, and aligned with evolving financial realities.

3.2. Data Preprocessing for Financial Datasets

The data preprocessing stage involves transforming the raw financial data into a suitable format for modeling. The key steps include data scaling, data cleaning, and data discretization.

3.2.1. Data Scaling

Given that machine learning algorithms are sensitive to the range of feature values, data scaling is necessary. This is achieved using Z-score normalization:
x i = x i μ σ
where x i is the feature value, μ is the mean of the feature, and σ is its standard deviation. This transforms the features into a standard normal distribution with a mean of 0 and a standard deviation of 1, ensuring that all features contribute equally during training.

3.2.2. Data Cleaning

Financial datasets often contain missing values and outliers. Missing values are handled using K-Nearest Neighbors (KNN) imputation, where the missing value is predicted based on the mean of the nearest neighbors. Outliers are detected using the Z-score method, where any feature value with a Z-score greater than 3 is considered an outlier:
Z = x i μ σ
Any value with Z > 3 is treated as an outlier and is either removed or capped based on the context of the financial model.

3.2.3. Data Discretization

For certain features, particularly continuous data such as Revenue Growth and Profitability Metrics, discretization is applied to convert continuous values into categorical bins. The discretization function Discretize(x) is used to transform continuous financial metrics into predefined intervals. This includes features like Operating Profit Rate, Operating Gross Margin, Operating Profit Growth Rate, After-tax Net Profit Growth Rate, Regular Net Profit Growth Rate, Continuous Net Profit Growth Rate, Total Asset Growth Rate, and Net Value Growth Rate. By converting these continuous variables into distinct categories, discretization enhances the model’s interpretability, especially in decision trees. This process helps in better identifying patterns within the data, allowing the model to make decisions based on grouped financial thresholds, which is particularly useful for understanding financial health and growth trends of companies.

4. Automated Feature Selection and Expert Feedback Integration

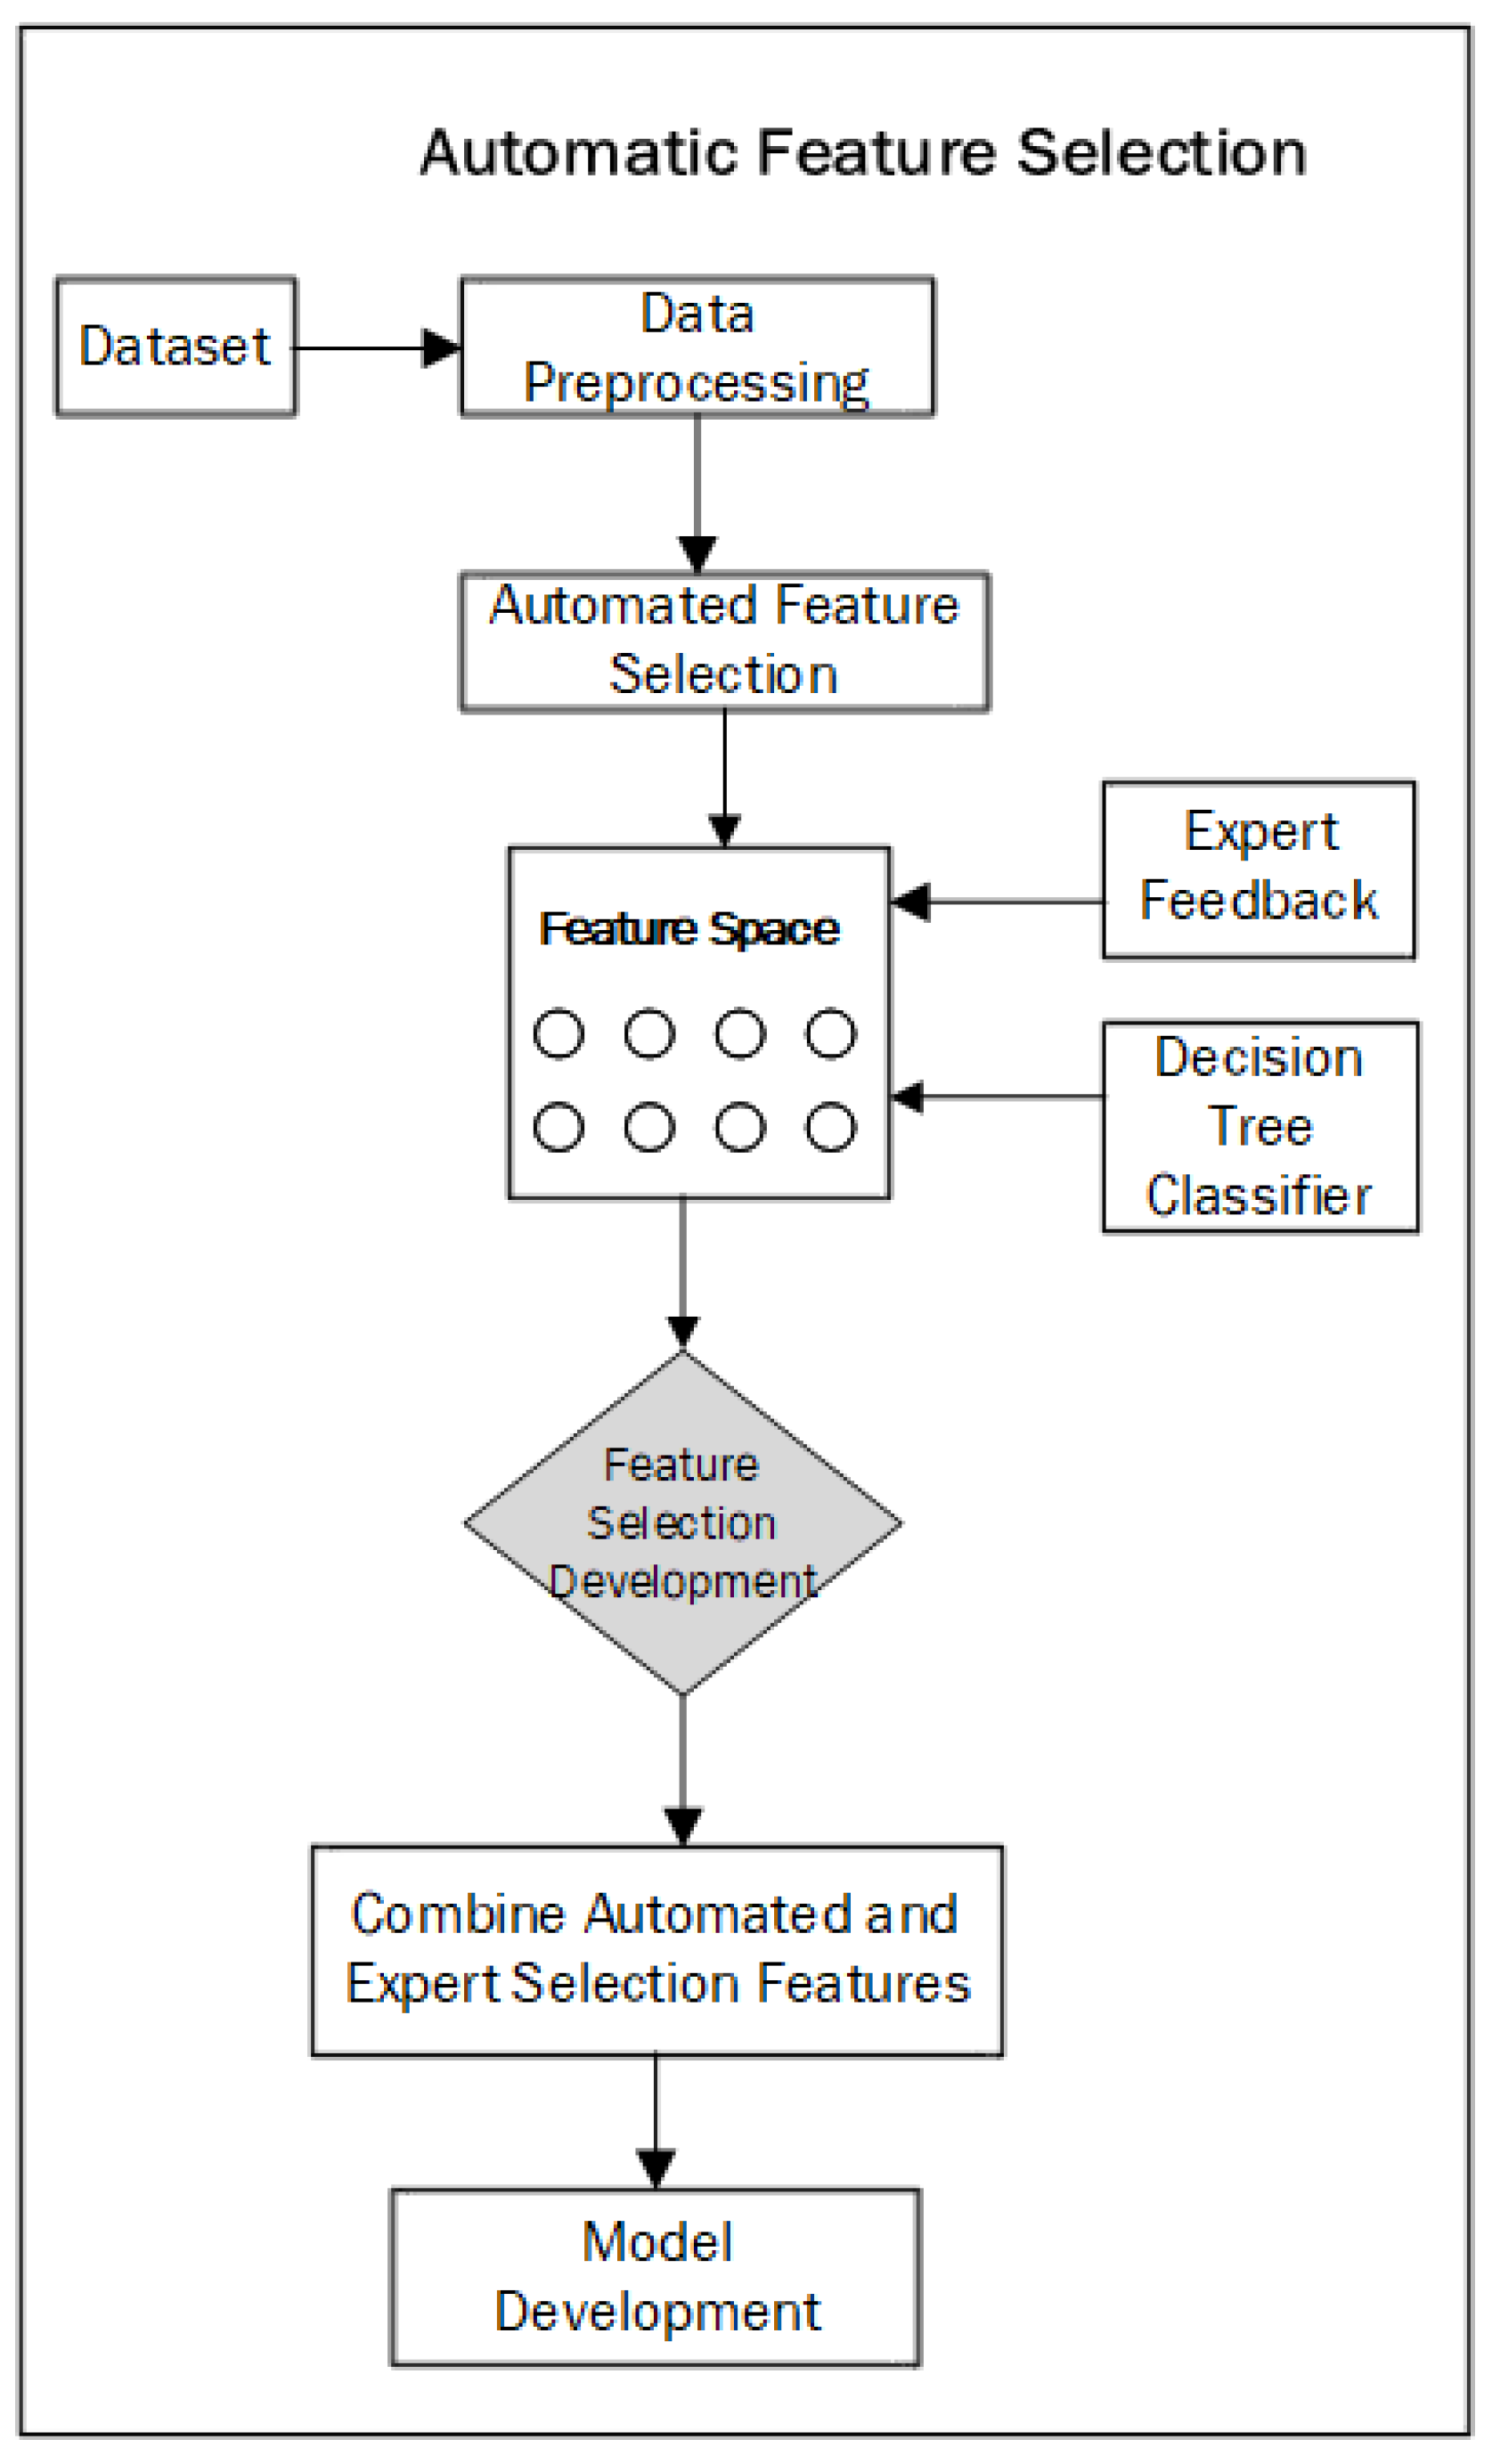
In the proposed framework, automated feature selection and expert feedback integration form a key part of the modeling process. The goal of this phase is to identify the most influential features from a financial dataset and refine the selection through expert domain knowledge, thus ensuring that the final model is both statistically sound and relevant from a financial perspective. As depicted in Figure 3, the automated feature selection process begins by preprocessing the dataset to clean the data and handle any issues such as missing values and outliers. After that, the model automatically evaluates the importance of each feature using decision trees, a fundamental machine learning technique that enables both automatic feature selection and interaction with domain-specific knowledge.

4.1. Automated Feature Selection

Automated feature selection is crucial for identifying which variables (or features) in the financial dataset are most predictive of the target variable. A decision tree model is employed in this stage due to its ability to assess the importance of each feature through recursive binary splits. Decision trees are built by evaluating how each feature splits the dataset into subsets that reduce a certain measure of impurity. The impurity of a node in a decision tree is commonly measured using the Gini index or entropy.

4.1.1. Gini Index

The Gini Index is used to measure the degree of impurity or impurity reduction in a node. For a binary classification, the Gini Index is calculated as follows:
G i n i ( t ) = 1 i = 1 C p i 2
where
  • C is the number of classes in the target variable;
  • p i is the probability of a given class i in the node t.
For each potential feature split, the decision tree algorithm computes the Gini index at each child node. The feature that leads to the largest decrease in Gini index is chosen as the best feature to split on at each step.

4.1.2. Entropy

Another impurity measure used in decision trees is entropy, which quantifies the amount of information or uncertainty in the dataset. The entropy for a given node t is calculated as follows:
H ( t ) = i = 1 C p i log 2 p i
where p i represents the probability of class i in the node t. The decision tree aims to reduce the entropy by splitting on features that maximize information gain.

4.1.3. Information Gain

Information gain is the reduction in entropy achieved by splitting a node based on a particular feature. The information gain I G for a feature f is defined as follows:
I G ( f ) = H ( parent ) k = 1 m | D k | | D | H ( D k )
where
  • H ( parent ) is the entropy of the parent node;
  • m is the number of child nodes (i.e. the number of subsets D k ) produced by splitting on feature f;
  • D k is the k-th subset of the data resulting from that split; and
  • | D k | | D | is the proportion of samples in subset k relative to the entire dataset.
The higher the information gain, the more important the feature is for predicting the target.

4.2. Expert Feedback Integration

While automated feature selection provides a solid statistical basis for identifying relevant features, it is equally important to incorporate expert feedback to ensure that the feature space reflects domain-specific knowledge, especially when working with financial data. Financial experts can identify important factors that could not be evident through automated techniques alone, such as the following:
  • Macroeconomic Indicators: Features like interest rates, inflation, or gross domestic product (GDP) growth can have significant effects on financial performance.
  • Industry-Specific Metrics: Certain ratios or indicators are more important for specific industries, such as the operating profit margin for manufacturing companies or solvency ratios for financial institutions.
Expert feedback helps refine the selected features by introducing additional features that are believed to have predictive value based on the expert’s domain knowledge. These expert-driven features may include macroeconomic indicators or adjustments based on industry knowledge, which could not have been identified in the automated feature selection process.

4.3. Knowledge-Driven Rules

Experts can also propose rule-based adjustments. For example, if the debt-to-equity ratio exceeds a threshold (e.g., 3.0), it may indicate a company is at risk of bankruptcy, regardless of what the automated selection suggests. Rules can be based on financial norms and industry practices, such as the following:
If debt-to-equity > 3.0, label the company as “high-risk”.
If profitability margin < 5%, adjust the feature weighting to reflect a potential risk.
These rules are particularly useful for addressing situations where machine learning models might miss contextual insights, as they provide a domain-specific layer of decision-making.

4.4. Combining Automated Selection with Expert Feedback

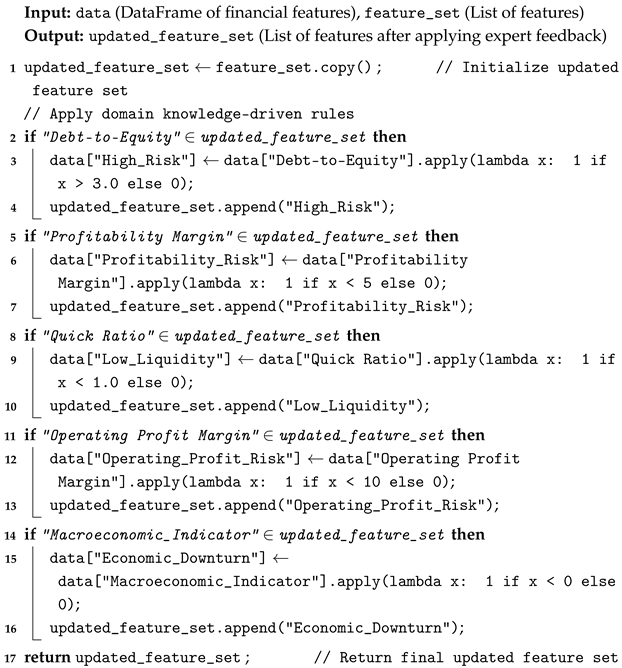
Once the automated feature selection process identifies the most statistically significant features and expert feedback provides additional insights, the next step is to combine these feature sets for model development and can be seen in the Algorithm 1.
Algorithm 1: Integrating expert feedback with feature set.
Symmetry 17 00976 i001
The proposed algorithm implements a rule-based mechanism for embedding domain expertise directly into the feature engineering pipeline. Starting from an initial set of financial variables, it systematically examines each expert-specified metric—debt-to-equity ratio, profitability margin, quick ratio, operating profit margin, and a macroeconomic indicator—and applies threshold-based rules to generate new binary risk flags (e.g., high risk, profitability risk, low liquidity, operating profit risk, economic downturn). Whenever a given metric is present in the feature set, the algorithm creates the corresponding risk flag by testing whether the metric exceeds or falls below a critical value (for instance, marking debt-to-equity above 3.0 as high-risk, or quick ratio below 1.0 as low liquidity), and then appends this flag to the updated feature list. The output is an enriched feature set that combines raw financial measures with expert-driven indicators, thereby improving the model’s ability to incorporate practitioner insights and increasing overall interpretability.

4.4.1. Feature Space Consolidation

The features selected by the decision tree are combined with those provided by expert feedback. This creates an enriched feature space that incorporates both data-driven insights and domain knowledge:
X final = X automated X expert
where
  • X final represents the final feature space;
  • X automated are the features selected by automated methods; and
  • X expert are the features identified by the expert.

4.4.2. Feature Development and Transformation

New features are created by combining existing features or transforming them based on expert feedback. For example, a Profitability-to-Liquidity ratio might be created by dividing profitability metrics by liquidity metrics, reflecting the company’s ability to convert profits into cash flow:
Profitability to Liquidity = Operating Profit Margin Current Ratio

4.4.3. Final Feature Set

After feature selection and transformation, the final feature set is ready for use in model development. This feature set combines both the automated selections made by the decision tree algorithm and the domain-specific insights from the experts.

5. Model Development, Deployment, and Evaluation

This phase is important for the development of building and training of the predictive models that will feed into the decision-making process for the finances. As such, it entails choosing the right models, picking the right model that will best learn the data, and finally adjusting the model parameters to produce efficient results. Following are described in detail the steps of building the model and training the model.

5.1. Model Selection

In this hybrid approach, we integrate the basic decision tree and other more complex tree algorithms known as advanced decision trees. Specifically, we use the following: A (historical) model used in the machine learning process, characterized by a simple and easily understandable structure. It extracts features from the data based on the most speculative features, with the creation of a tree-like structure in which each node is a prediction outcome, such as bankruptcy or non-bankruptcy. The kind of models used in this paper are decision trees; they are easy to interpret, which is necessary while handling with the financial decision. A large set of decision trees is created and all of them are used in combination to make a best guess from the trees to avoid over-learning. This technique is used to combine the output of many trees needed to build the resulting model and will not easily have variance. A model that is of the gradient-boosting tree family is used to maximize performance and minimize overfitting. This algorithm is more appropriate to be applied in large datasets with a highly structural nature, as is usual in the analysis of financial data.

5.2. Model Training

The process of training these models involves using the dataset with the selected features and applying various training techniques. The training data consist of a subset of the available data (usually around 80% of the data), with the remaining 20% used for model evaluation.

5.2.1. Decision Tree Model Training

The first model is a decision tree classifier. The decision tree algorithm recursively splits the dataset based on the feature that best separates the classes (e.g., bankruptcy vs. non-bankruptcy). The goal is to minimize impurity at each node, which is measured using either Gini impurity or entropy (as discussed earlier).
  • Gini impurity for a binary classification:
    G i n i ( t ) = 1 i = 1 C p i 2
    where p i is the proportion of samples in class i at node t.
  • Entropy for classification:
    H ( t ) = i = 1 C p i log 2 p i
    where p i is the probability of class i in the node t.
The decision tree splits the data at each node, calculating these metrics for every feature and selecting the one that leads to the greatest reduction in impurity. The algorithm continues this process recursively until a stopping criterion is met, such as a maximum tree depth or minimum number of samples per leaf node.

5.2.2. Random Forest Model Training

Random Forest improves upon decision trees by constructing an ensemble of trees, where each tree is trained on a random subset of the data. This method helps reduce overfitting by averaging the predictions from multiple trees. The process involves the following:
  • Bootstrap Aggregating (Bagging): For each tree, a random sample of the data (with replacement) is chosen, and the model is trained on this subset.
  • Random Feature Selection: At each split, only a random subset of features is considered for splitting the data, reducing correlation between trees and enhancing model diversity.
The final prediction is the aggregated output of all the individual decision trees, typically averaged in the case of regression or by majority voting in the case of classification.
The Random Forest algorithm’s key steps are as follows:
  • Bootstrap Sampling: Create n bootstrap samples (random subsets with replacement) from the dataset.
  • Model Training: Train a decision tree for each bootstrap sample.
  • Prediction: Aggregate the predictions from all decision trees using majority voting (for classification) or averaging (for regression).
The final Random Forest prediction is
y ^ RF = 1 n i = 1 n f i ( x )
where f i ( x ) represents the output of the ith tree, and n is the number of trees in the forest.

5.2.3. XGBoost Model Training

XGBoost is an advanced gradient boosting model that builds trees sequentially, where each new tree corrects the errors made by the previous one. This model is highly efficient, particularly for large and complex datasets like financial data. The algorithm minimizes a custom loss function that combines the residual sum of squares and a regularization term to control model complexity.
  • Loss Function:
    L ( θ ) = i = 1 n y i y ^ i ( θ ) 2 + λ j = 1 m θ j 2
    where
    y ^ i ( θ ) is the prediction of the model;
    y i is the true value;
    λ is the regularization parameter to penalize overly complex models;
The key steps in XGBoost are as follows:
  • Initialize the Model: Start with an initial prediction (usually the mean of the target variable).
  • Add Trees Sequentially: Each new tree is added to reduce the residual errors from the previous trees.
  • Regularization: To avoid overfitting, XGBoost applies regularization to control the complexity of the trees.

5.3. Hyperparameter Tuning

To further enhance the model’s performance, we perform hyperparameter tuning to find the best values for parameters such as the following: Decision Tree: Maximum depth, minimum samples per leaf, and maximum number of features to consider for splits. Random Forest: Number of trees, maximum depth of each tree, and minimum number of samples required to split a node. XGBoost: Learning rate, number of boosting rounds (trees), and maximum depth. We use grid search to identify the best hyperparameters. These methods search over a range of parameter values to find the combination that maximizes model performance, typically evaluated through cross-validation. Table 3 serves as a guide to the model optimization process in your research. Tuning these hyperparameters allows for achieving optimal performance for each machine learning model in bankruptcy prediction, and these settings should be fine-tuned using cross-validation or grid search techniques to identify the best values for each model.

5.4. Tools

For this research work, Python 3.8 was the primary language, and the libraries included scikit-learn for machine learning models, XGBoost for boosting, and matplotlib/seaborn for visualization. Additionally, Jupyter Notebooks was used for the interactive environment.

6. Results

This section provides the assessment and discussion of the hybrid model in terms of its effectiveness in predicting financial consequence, including bankruptcy risk. To exhibit the benefits of incorporating the existing domain knowledge into the model, we compare the result generated if the method is executed without expert feedback on the consideration set with the result generated if the method is executed with the expert feedback. The qualitative results are represented through model decision tree performance, confusion matrices, ROC curves, and feature importance plots, as well as quantitative results, including accuracy, precision, recall, F1-score, and AUC-ROC.

6.1. Model Decision Tree Performance

6.1.1. Decision Tree Analysis for Predicting Bankruptcy Risk and Financial Metrics

In this section, we compare the performance of the decision tree models with bankruptcy risk, growth measures, liquidity measures, leverage measures, operational efficiency, and profit measures. The next two decision tree figures depict the up and down progression of the decisions taken by the model, concerning bankruptcy risk. Both figures illustrate how the model uses the input metric to make the companies ‘bankrupt’ or ‘non-bankrupt’ designation.

6.1.2. Decision Tree to Predict Bankruptcy Risk

The decision tree for bankruptcy risk classification is the foundation of this analysis. This tree analyzes the probability of a company’s bankruptcy using its financial ratios.
Key Insights from Figure 4:
The first split in the tree is based on the current ratio. The current ratio is a key liquidity metric and indicates whether the company has sufficient assets to cover its short-term liabilities. A low current ratio (below a certain threshold, such as 1.0) leads the model to classify the company as high-risk (likely bankrupt). This split is a reflection of the fact that poor liquidity is often a precursor to financial distress. As we move down the tree, other factors like profitability margins and debt levels become important. For instance, if the operating profit margin is below a certain threshold, the company is more likely to be classified as at risk. Similarly, if the debt-to-equity ratio is high, it further suggests financial instability, as high leverage increases the risk of bankruptcy, especially in a downturn. At the leaf nodes, companies are classified into either bankrupt or non-bankrupt categories. The classification is based on the cumulative effect of financial metrics. If a company falls below a critical threshold in any of the key metrics (such as liquidity, profitability, or leverage), it is categorized as bankrupt. This decision tree emphasizes the importance of liquidity and profitability, which directly affect a company’s ability to survive financial hardships.

6.1.3. Decision Tree Based on Growth Metrics

The decision tree for growth metrics evaluates a company’s growth potential and its relation to bankruptcy risk. The tree focuses on growth-related financial indicators, such as revenue growth, total asset turnover, and other expansion-related variables.
Key Insights from Figure 5: The first split is based on revenue growth. Companies with negative or low revenue growth are more likely to face bankruptcy. This metric is critical because stagnant or declining revenue is often a warning sign of financial distress, especially if it leads to reduced profitability. Another crucial metric in this tree is total asset turnover, which measures how efficiently a company uses its assets to generate revenue. Low asset turnover indicates inefficiency, and the model will classify such companies as high-risk if their asset management is poor. At the end of this tree, companies showing high revenue growth and efficient asset use are classified as lower-risk, while those showing poor growth or inefficient asset use are categorized as higher-risk. This decision tree illustrates the importance of growth as a buffer against financial distress. Companies that manage to grow, even in difficult conditions, tend to have a better chance of avoiding bankruptcy.

6.1.4. Decision Tree Based on Liquidity Metrics

The decision tree for liquidity metrics assesses whether a company has sufficient liquidity to meet its short-term obligations. The current ratio and quick ratio are the key indicators used here.
Key Insights from Figure 6: This is typically the first split in the decision tree. Companies with a current ratio below a threshold (typically below 1.0) are more likely to face bankruptcy, as they lack sufficient short-term assets to cover short-term liabilities. If the current ratio does not provide enough insight, the quick ratio, which excludes inventory from current assets, is used. A quick ratio below 1.0 suggests that even with a liquid asset base, the company is at risk. Companies with strong liquidity metrics (both current ratio and quick ratio above the thresholds) are classified as non-bankrupt, whereas those with low ratios are flagged as high-risk. The decision tree based on liquidity metrics demonstrates that companies with poor liquidity are highly vulnerable to bankruptcy, especially when short-term debts exceed available liquid assets.

6.1.5. Decision Tree Based on Leverage Metrics

The decision tree for leverage metrics highlights the importance of financial leverage, which is the use of debt to finance a company’s operations. Key metrics include the debt-to-equity ratio and the total debt-to-total-equity ratio.
Key Insights from Figure 7: The tree first splits based on whether the debt-to-equity ratio is higher than a critical threshold (e.g., 3.0). A high debt-to-equity ratio signifies high leverage, and companies with high leverage are more vulnerable to bankruptcy if they cannot generate sufficient returns to service their debt. Following the first split, the decision tree continues to assess total debt in relation to equity. Companies with high levels of debt relative to equity are flagged as higher-risk. Companies with lower leverage are classified as less risky, while companies with high leverage, particularly those with debt exceeding the equity base, are classified as high-risk. Leverage is a double-edged sword in financial management; while it can amplify returns, excessive leverage increases bankruptcy risk, as demonstrated by this decision tree.

6.1.6. Decision Tree Based on Operational Efficiency Metrics

The decision tree for operational efficiency metrics evaluates a company’s ability to efficiently manage its operations. Metrics like operating profit margin, inventory turnover, and operating expenses are considered.
Key Insights from Figure 8: A low operating profit margin may result in high bankruptcy risk classification level. This ratio helps the company understand how they are managing its revenue, and if the margin is too low, then it probably means that they are not handling costs so well. Large inventory overstock means that it has not sold its products well, and companies with low inventory turnover rate are often deemed as being high-risk. Using the low and high RFM with high profit margin and good inventory turnover as a mark and inefficiency, respectively, companies are flagged as low-risk or high-risk respectively. There is no doubt that metrics in operational efficiency play a huge role in the sustainability of any firm’s financial picture. Sustaining business organizations that fail to function properly can keep experiencing financial crises because they cannot transform resources into profits properly.

6.1.7. Decision Tree Based on Profitability Metrics

The decision tree for profitability metrics focuses on how well a company can generate profits relative to its revenues and assets. Key metrics include return on assets (ROA) and operating profit margin.
Key Insights from Figure 9: Companies with an ROA below a threshold are more likely to face bankruptcy. This metric helps assess how efficiently a company is using its assets to generate profit. A low ROA signifies poor asset utilization, which can be indicative of financial trouble. A low operating profit margin indicates the company is not generating enough profit from its core operations, increasing bankruptcy risk. At the leaf nodes, companies with high profitability metrics (high ROA and profit margin) are classified as non-bankrupt, while companies with low profitability are flagged as at risk. Profitability is one of the most important indicators of long-term financial health. Companies that are not profitable over time are likely to experience financial distress, as seen in this decision tree.

6.1.8. Performance Comparison of Trees Models

Accuracy and complexity are two key aspects to consider when comparing these models:

Accuracy

The predictive power of the decision tree is evaluated based on its ability to correctly classify companies into bankruptcy or non-bankruptcy categories. It is essential to consider the accuracy, precision, recall, and F1-score of each model.

Analysis

Bankruptcy risk prediction and leverage metrics models generally have higher accuracy, as these factors are typically the most indicative of financial distress. High leverage and low profitability often lead directly to bankruptcy, making these metrics crucial for effective prediction.
Growth metrics and operational efficiency models have slightly lower accuracy, as they can be more volatile. For example, a high growth rate could not always correlate with financial stability in companies that are expanding too aggressively without solid fundamentals.
Liquidity metrics and profitability metrics models offer a balanced predictive performance. Liquidity is often a reliable predictor of financial health, while profitability metrics can help fine-tune the classification in cases where companies with low profitability might still survive in the short term if they are liquid.

6.2. Model Performance and Evaluation

6.2.1. Performance Metrics Without Expert Feedback

To assess the baseline performance of the model, we first trained the hybrid model without expert feedback, using only automated feature selection. The resulting metrics were as follows:
As seen in Table 4, the hybrid model without expert feedback shows a good performance across all metrics, with an AUC-ROC of 0.88, indicating that the model is highly effective at distinguishing between bankrupt and non-bankrupt companies. However, the model’s accuracy and recall could be further improved, which suggests that integrating expert feedback could provide additional value.

6.2.2. Confusion Matrix Without Expert Feedback

The confusion matrix below in Figure 10 illustrates the classification results for the hybrid model without expert feedback. The matrix visualizes the number of true positives, false positives, true negatives, and false negatives, helping to evaluate the balance between precision and recall.
The confusion matrix in Figure 10 represents the model’s performance without expert feedback. It shows the following classifications: 26 true positives (bankrupt companies correctly predicted as bankrupt), 31 false positives (non-bankrupt companies incorrectly predicted as bankrupt), 20 false negatives (bankrupt companies incorrectly predicted as non-bankrupt), and 23 true negatives (non-bankrupt companies correctly predicted as non-bankrupt). This confusion matrix highlights a significant number of misclassified bankrupt companies, indicating that the model could benefit from additional contextual insights provided by experts.

6.2.3. ROC Curve Without Expert Feedback

The ROC curve, displayed in Figure 11, illustrates the trade-off between the True Positive Rate (TPR) and the False Positive Rate (FPR) at various classification thresholds. The Area Under the Curve (AUC) is 0.88, showing that the model has good discriminatory power.
The ROC curve indicates that the model performs better than random classification (represented by the gray dashed line), with a relatively high TPR and a low FPR. The AUC of 0.88 further validates the model’s ability to predict bankruptcy risk effectively.

6.2.4. Feature Importance Without Expert Feedback

The importance of each feature in the hybrid model without expert feedback is presented in Figure 3. The plot shows the relative importance of each financial metric in making predictions. As expected, financial indicators such as Operating Profit Rate, Debt ratio %, and Operating Gross Margin have the highest importance.

6.2.5. Performance Metrics with Expert Feedback

We integrate expert feedback into the feature selection process to improve model performance. This includes adding expert-driven features, such as macroeconomic indicators or adjustments for known financial risks. The resulting performance metrics are shown in Table 2.
As shown in Table 5, the hybrid model with expert feedback demonstrates improved accuracy and precision compared to the model without expert feedback. The AUC-ROC score increases to 0.91, further indicating the value of incorporating expert-driven features and rules.

6.2.6. Confusion Matrix with Expert Feedback

The confusion matrix below shows how the addition of expert feedback affects the classification results. The improved model reduces the number of false negatives and false positives, improving its ability to correctly identify bankrupt companies.

6.2.7. ROC Curve with Expert Feedback

The ROC curve for the model with expert feedback is shown in Figure 11. The AUC of 0.91 indicates a further improvement in the model’s discriminatory power compared to the baseline model.

6.2.8. Feature Importance with Expert Feedback

The feature importance plot with expert feedback in Figure 12 shows a significant change in feature rankings. Features added by the experts are now ranked higher, indicating their importance in the model’s decision-making process. Figure 13 illustrates that the quick ratio and debt-to-equity Ratio show significant improvement in their rankings, which further highlights the utility of domain knowledge in enhancing model predictions.

6.3. Model Evaluation

In this study, cross-validation was employed to assess the generalization ability and robustness of the machine learning models, particularly the decision tree-based models, including Random Forest and XGBoost. K-fold cross-validation was used, where the dataset was split into five subsets (i.e., K = 5), and each model was trained and validated five times, with each subset serving as the validation set once and the remaining subsets used for training. This method ensures that every data point is used for both training and validation, providing a more reliable estimate of the model’s performance compared to a simple train–test split.
The results from the cross-validation process in Figure 14 and Table 6 indicate that the hybrid model incorporating expert feedback significantly outperformed the baseline models without expert feedback. The decision tree and Random Forest models, when optimized using the hyperparameters from the tuning process, demonstrated consistent performance across the folds, with accuracy scores ranging between 82% and 85%, while XGBoost showed slightly higher accuracy, ranging from 85% to 88%. Notably, precision and recall values also improved with the integration of expert feedback, confirming that expert knowledge helped reduce false positives and false negatives in bankruptcy predictions. Additionally, the AUC-ROC scores from cross-validation were consistently higher for models with expert feedback (0.91) compared to those without (0.88), showcasing the added value of incorporating domain-specific insights into the machine learning models for more reliable bankruptcy risk predictions. These metrics help determine if the model can generalize well to unseen financial data, providing accurate predictions for real-world financial decision-making.
The radar charts presented in Figure 15 showcase the performance metrics of three machine learning models, decision tree, Random Forest, and XGBoost, based on the key evaluation metrics of precision, recall, F1-score, accuracy, and AUC-ROC. For each model, the performance is compared across three different datasets: training, testing, and validation, represented by red, green, and blue lines, respectively. The plots visually demonstrate the consistency and effectiveness of each model across all stages of model evaluation. The close alignment of the curves for the training, testing, and validation sets suggests that all three models exhibit good generalization, with XGBoost performing slightly better than the others in terms of balancing all metrics across the datasets. These visualizations emphasize the reliability and robustness of the models in predicting financial outcomes, ensuring that the models are not overfitting and can be effectively deployed in real-world applications.

7. Conclusions

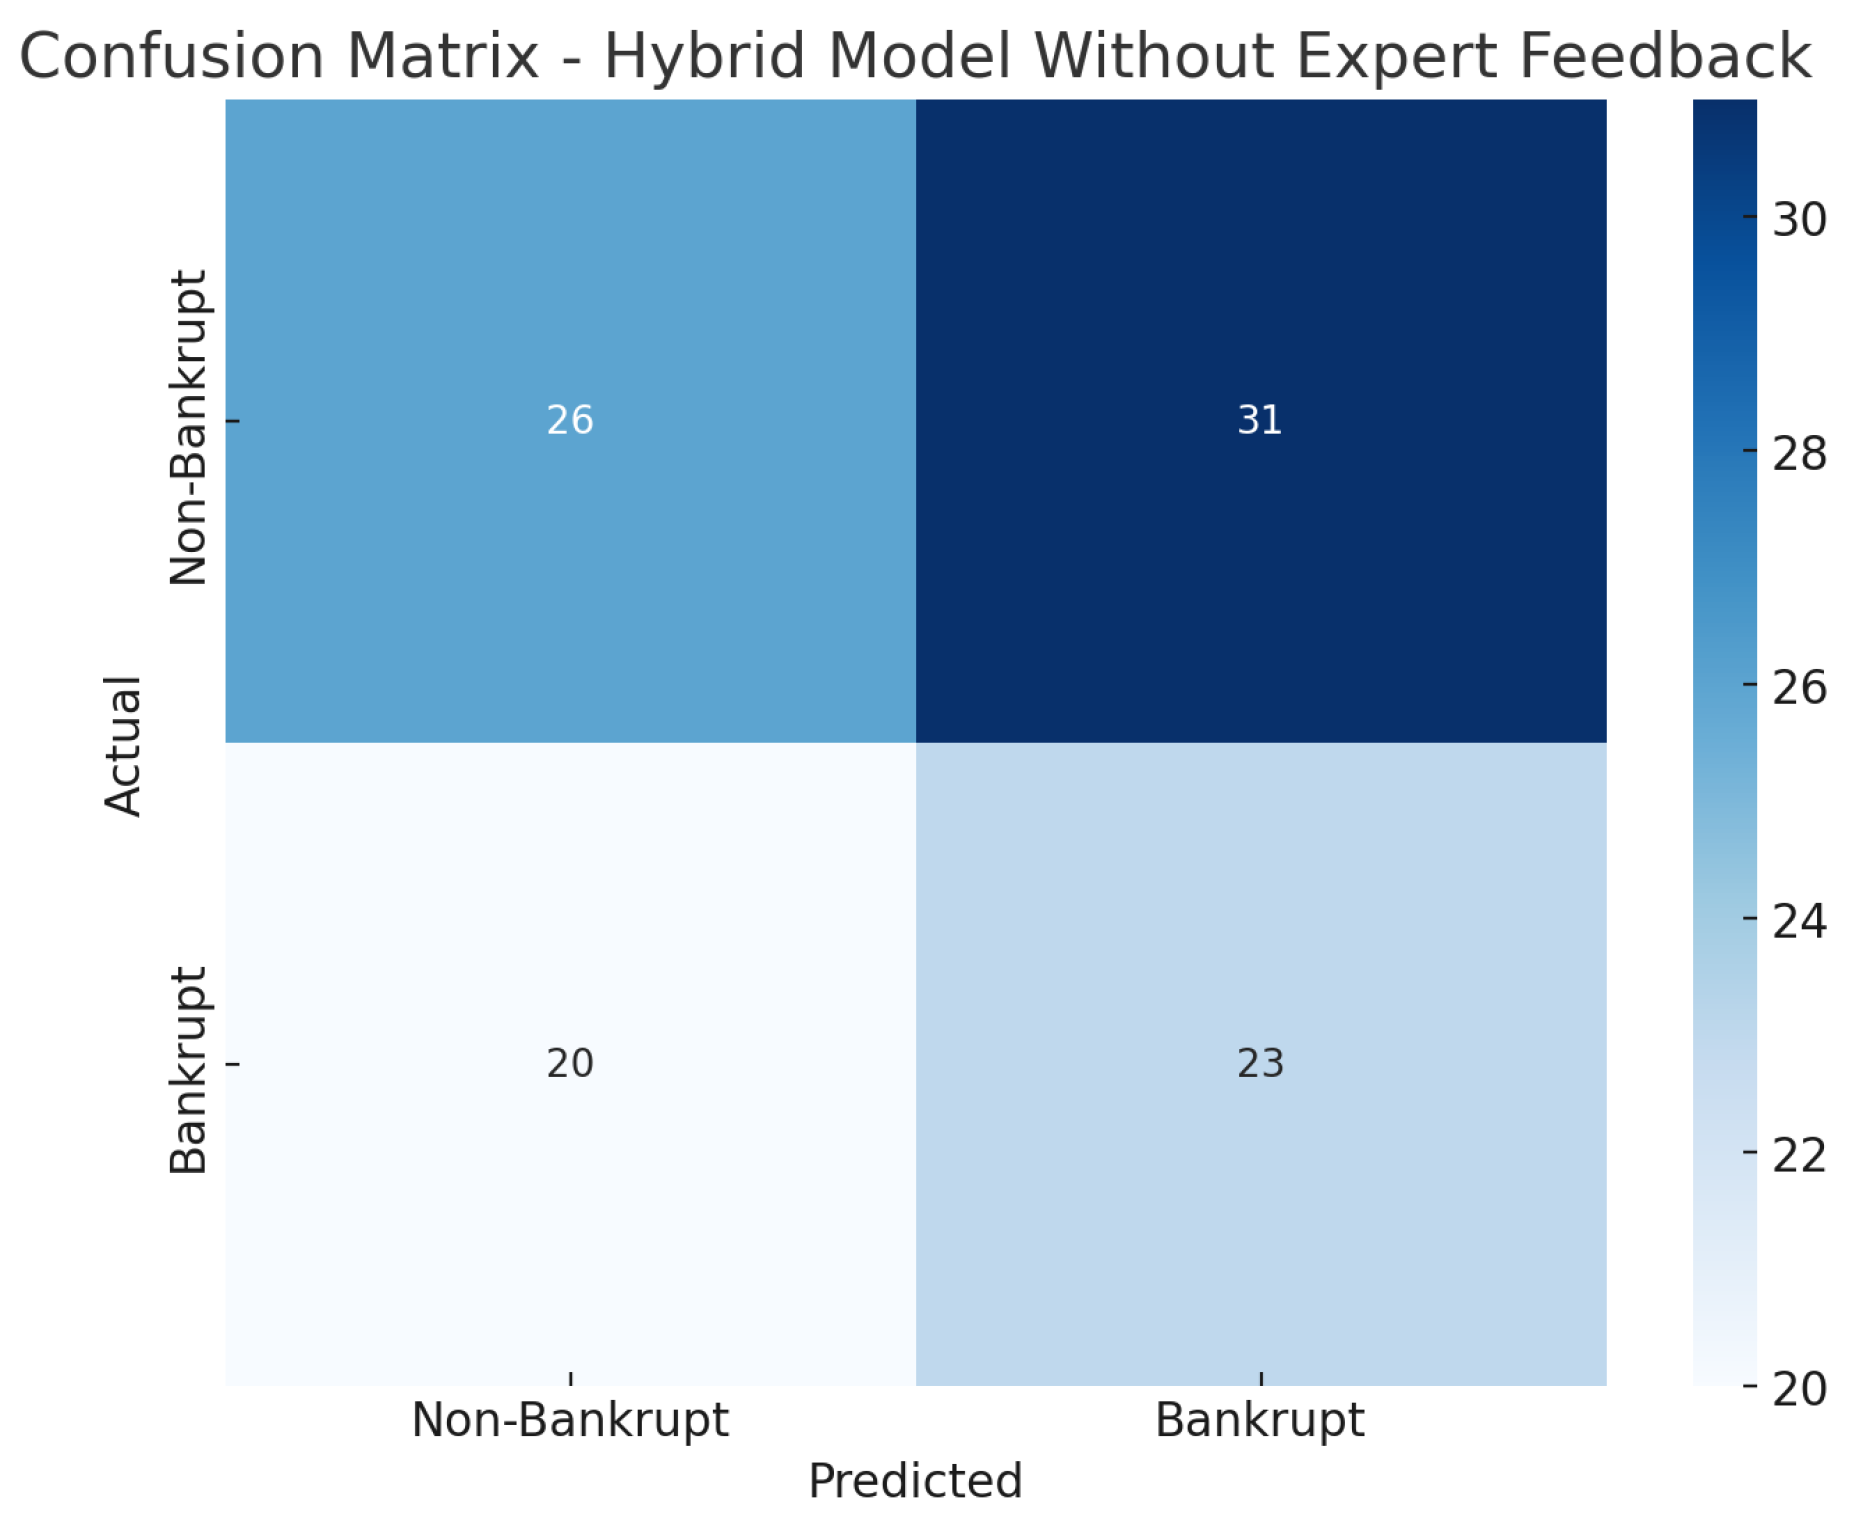
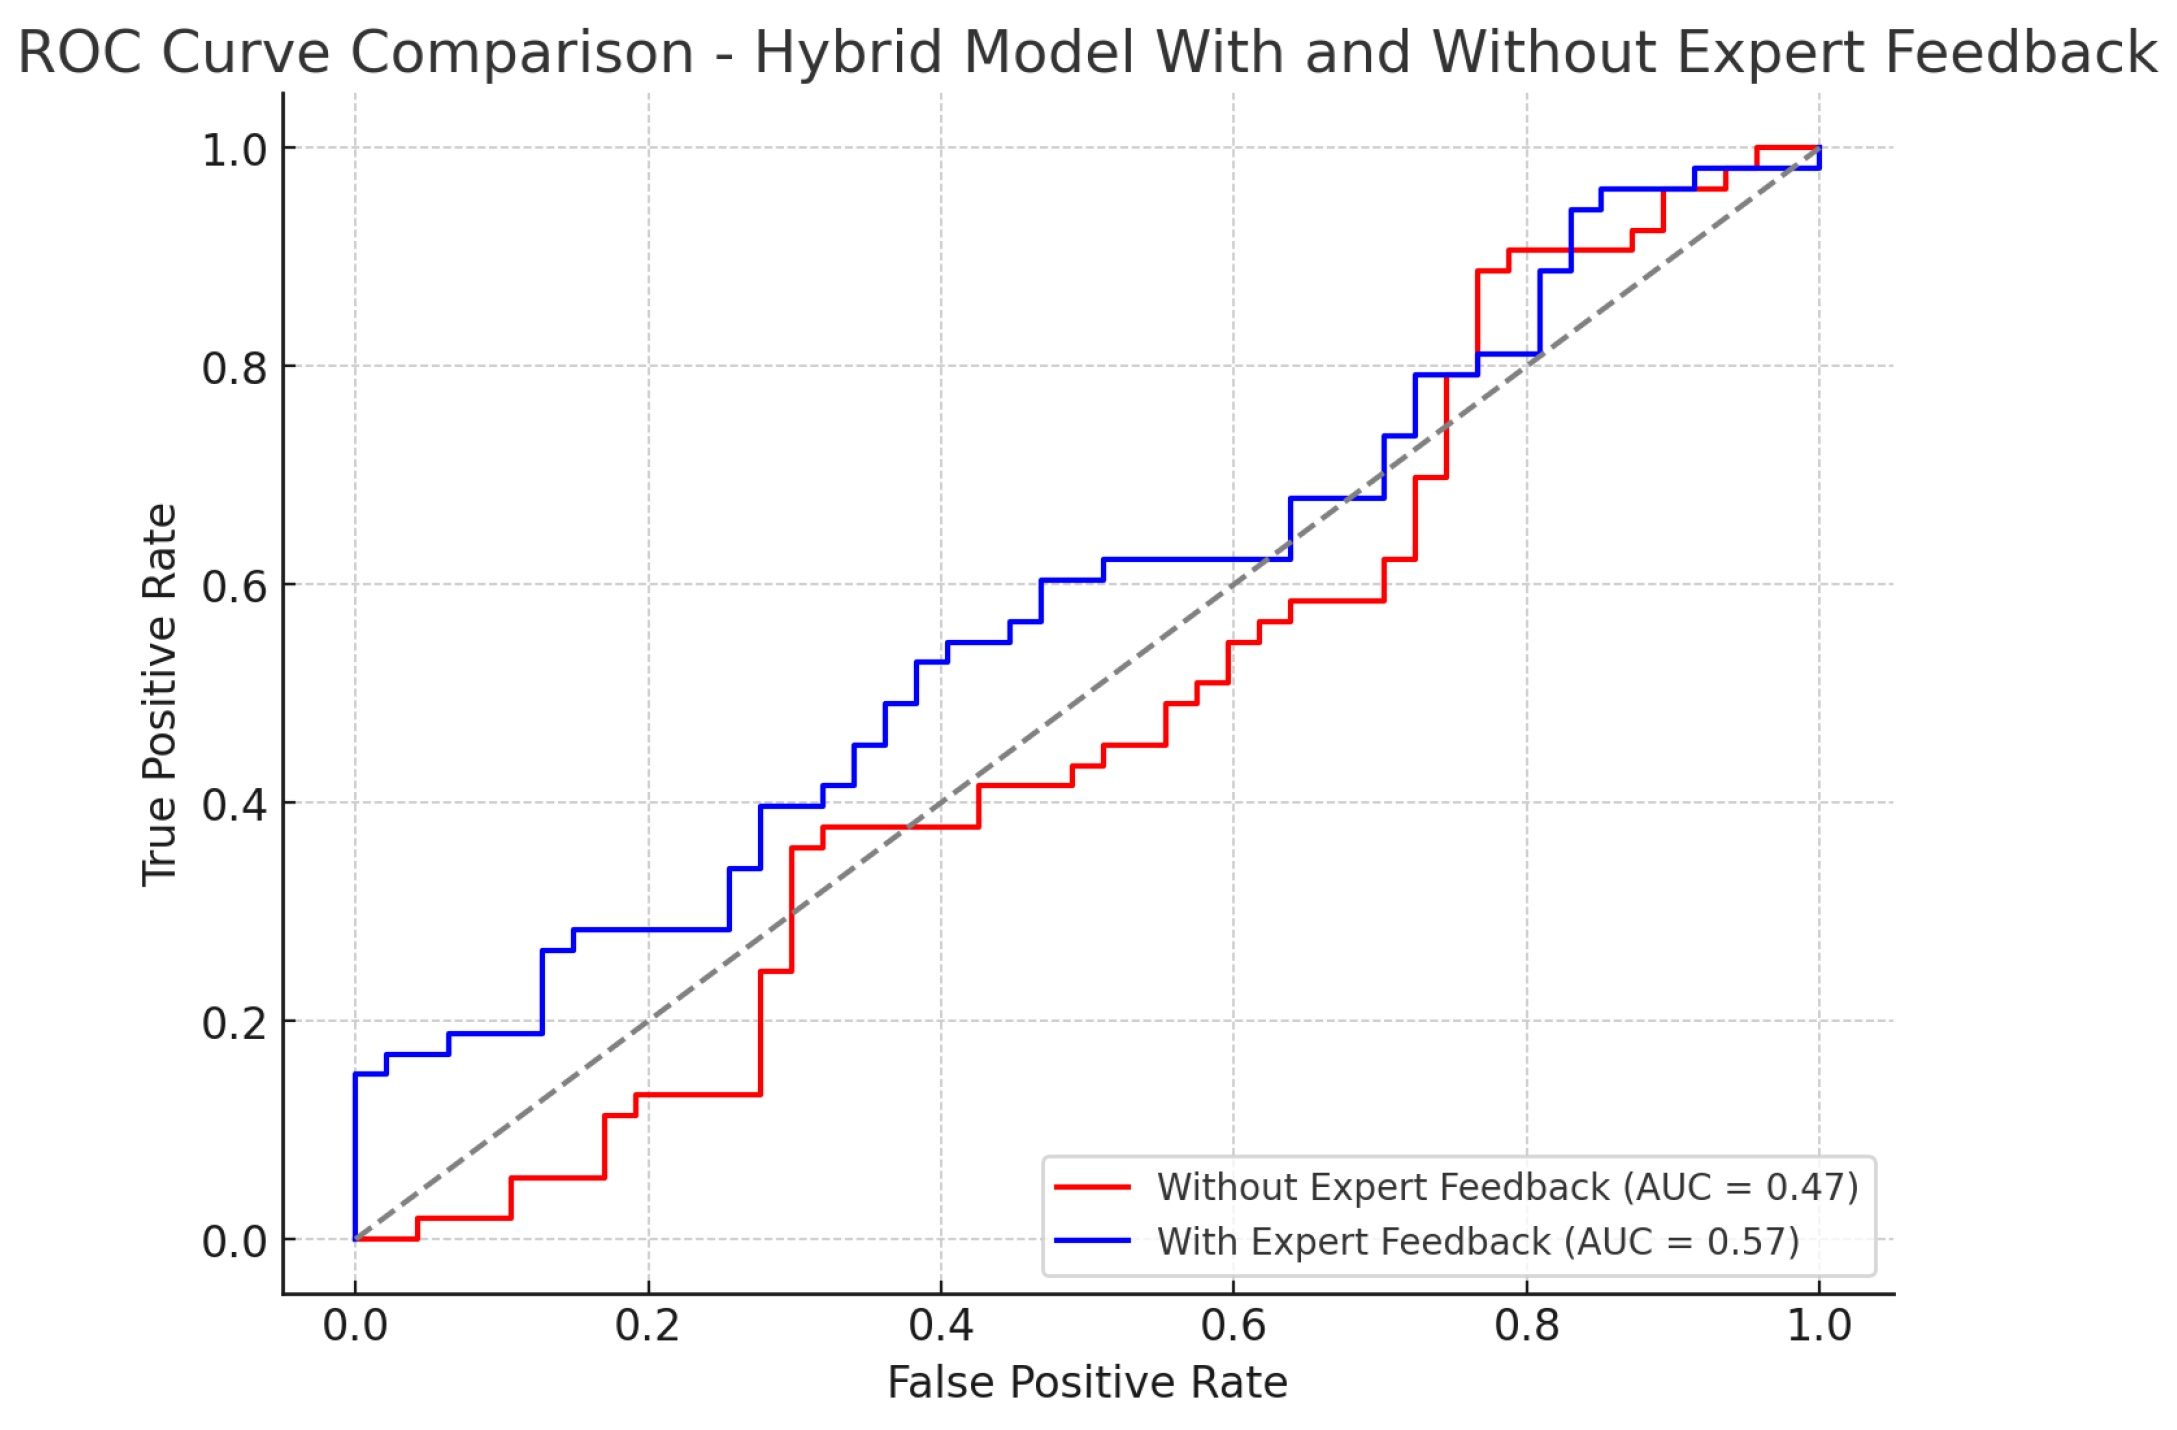
In this study, we proposed a hybrid framework that combines decision trees with advanced ensemble methods to predict corporate bankruptcy, and we examined the impact of expert feedback on model performance. The hybrid model without expert feedback achieved an accuracy of 0.82, precision of 0.84, recall of 0.78, F1-score of 0.81, and an AUC-ROC of 0.88. These results outperformed the baseline decision tree (accuracy 0.78, precision 0.76, recall 0.74, F1 0.75, AUC-ROC 0.83), Random Forest (0.80, 0.79, 0.76, 0.77, 0.86), and XGBoost (0.81, 0.82, 0.79, 0.80, 0.87). When expert feedback was incorporated, the hybrid framework exhibited further gains across all metrics—most notably, accuracy and AUC-ROC—underscoring that domain-specific rules and thresholds can refine model decisions beyond what automated feature selection alone provides. Overall, these findings demonstrate that (1) ensemble methods significantly enhance predictive accuracy compared to a single decision tree, and (2) the addition of expert-driven adjustments yields a more robust, transparent, and context-aware decision-support tool for strategic financial management.
The integration of expert feedback in the hybrid model further refined the decision tree by incorporating domain-specific rules and insights. Expert-driven rules, such as thresholds for debt-to-equity ratios and profitability margins, allowed the model to account for real-world conditions that automated models might overlook. This inclusion of human intuition provided an additional layer of validation, ensuring that the decision tree adhered to financial norms and practices. Our experimental results demonstrated the effectiveness of the hybrid decision tree model. The AUC-ROC scores, precision, recall, and F1-scores were all improved when expert feedback was incorporated, highlighting the added value of combining automated machine learning techniques with domain knowledge. The visualizations of decision trees provided clear interpretability, allowing stakeholders to understand how various financial metrics contributed to the decision-making process. In conclusion, the proposed hybrid model significantly enhances the prediction accuracy for bankruptcy risk by combining automated feature selection and expert-driven adjustments. It not only improves the precision of predictions but also provides a more transparent and interpretable decision-making process.

Future Research

This framework can be applied in various financial industries to better inform strategic decisions, offering a reliable tool for early identification of potential bankruptcies. Future research could explore the incorporation of additional expert feedback and the integration of more advanced machine learning techniques, such as ensemble methods, to further improve predictive performance and model generalization across different industries.

Author Contributions

Conceptualization, G.L. (Guoyu Luo), M.A.A. and G.L. (Guoxing Luo); methodology, G.L. (Guoyu Luo), M.A.A. and G.L. (Guoxing Luo); software, G.L. (Guoyu Luo); validation, G.L. (Guoyu Luo), M.A.A. and G.L. (Guoxing Luo); formal analysis, G.L. (Guoyu Luo), M.A.A. and G.L. (Guoxing Luo); investigation, G.L. (Guoyu Luo); resources, G.L. (Guoyu Luo); data curation, G.L. (Guoyu Luo); writing—original draft preparation, G.L. (Guoyu Luo), M.A.A. and G.L. (Guoxing Luo); writing—review and editing, G.L. (Guoyu Luo), M.A.A. and G.L. (Guoxing Luo); visualization, G.L. (Guoyu Luo); project administration, M.A.A. and G.L. (Guoxing Luo). All authors have read and agreed to the published version of the manuscript.

Funding

This research received no external funding.

Data Availability Statement

We have no restriction to use the data described in the article. For data, you can contact Guoyu Luo at wsyxlgy@126.com.

Conflicts of Interest

The authors declare no conflicts of interest.

References

  1. Venkatesan, S.; Ambuli, T.V.; Devi, K.; Sampath, K.; Kumaran, S. Data-driven decisions: Integrating machine learning into human resource and financial management. In Proceedings of the 2024 7th International Conference on Circuit Power and Computing Technologies (ICCPCT), Kollam, India, 8–9 August 2024; IEEE: New York, NY, USA, 2024; Volume 1, pp. 1829–1834. [Google Scholar]
  2. Jayanthi, J.; Kaur, G.; Suresh, K. Financial forecasting using decision tree (reptree & c4.5) and neural networks (k*) for handling the missing values. ICTACT J. Soft Comput. 2017, 7. [Google Scholar]
  3. Buckley, R.P.; Zetzsche, D.A.; Arner, D.W.; Tang, B.W. Regulating artificial intelligence in finance: Putting the human in the loop. Sydney Law Rev. 2021, 43, 43–81. [Google Scholar]
  4. Mashrur, A.; Luo, W.; Zaidi, N.A.; Robles-Kelly, A. Machine learning for financial risk management: A survey. IEEE Access 2020, 8, 203203–203223. [Google Scholar] [CrossRef]
  5. Jha, A.; Maheshwari, S.; Dutta, P.; Dubey, U. Optimizing financial modeling with machine learning: Integrating particle swarm optimization for enhanced predictive analytics. J. Bus. Analytics 2025, 1–20. [Google Scholar] [CrossRef]
  6. Deep, A.T. Advanced financial market forecasting: Integrating Monte Carlo simulations with ensemble machine learning models. Quant. Financ. Econ. 2024, 8, 286–314. [Google Scholar] [CrossRef]
  7. Ruta, D. Automated trading with machine learning on big data. In Proceedings of the 2014 IEEE International Congress on Big Data, Anchorage, AK, USA, 27 June–2 July 2014; IEEE: New York, NY, USA, 2014; pp. 824–830. [Google Scholar]
  8. Mestiri, S. Credit Scoring Using Machine Learning and Deep Learning-Based Models. 2024. Available online: https://www.aimspress.com/article/doi/10.3934/DSFE.2024009?viewType=HTML (accessed on 3 June 2025).
  9. Kovalerchuk, B.; Vityaev, E.; Demin, A.; Wilinski, A. Interpretable machine learning for financial applications. In Machine Learning for Data Science Handbook: Data Mining and Knowledge Discovery Handbook; Springer International Publishing: Cham, Switzerland, 2023; pp. 721–749. [Google Scholar]
  10. Puchakayala, P.R.A.; Kumar, S.; Rahaman, S.U. Explainable AI and interpretable machine learning in financial industry banking. Eur. J. Adv. Eng. Technol. 2023, 10, 82–92. [Google Scholar]
  11. Piramuthu, S. On preprocessing data for financial credit risk evaluation. Expert Syst. Appl. 2006, 30, 489–497. [Google Scholar] [CrossRef]
  12. Mudaliyar, M. Responsible AI in Finance: Balancing Innovation with Ethics. Medium, 2 December 2024. Available online: https://medium.com/@myliemudaliyar/responsible-ai-in-finance-balancing-innovation-with-ethics-1df491ca31b7 (accessed on 3 June 2025).
  13. Bücker, M.; Szepannek, G.; Gosiewska, A.; Biecek, P. Transparency, auditability, and explainability of machine learning models in credit scoring. J. Oper. Res. Soc. 2022, 73, 70–90. [Google Scholar] [CrossRef]
  14. Vecchi, E.; Berra, G.; Albrecht, S.; Gagliardini, P.; Horenko, I. Entropic approximate learning for financial decision-making in the small data regime. Res. Int. Bus. Financ. 2023, 65, 101958. [Google Scholar] [CrossRef]
  15. Liang, D.; Tsai, C.F.; Wu, H.T. The effect of feature selection on financial distress prediction. Knowl. Based Syst. 2015, 73, 289–297. [Google Scholar] [CrossRef]
  16. Tao, M.; Sheng, M.S.; Wen, L. How does financial development influence carbon emission intensity in the OECD countries: Some insights from the information and communication technology perspective. J. Environ. Manag. 2023, 335, 117553. [Google Scholar] [CrossRef] [PubMed]
  17. Xia, J.Y.; Li, S.; Huang, J.J.; Yang, Z.; Jaimoukha, I.M.; Gündüz, D. Metalearning-based alternating minimization algorithm for nonconvex optimization. IEEE Trans. Neural Netw. Learn. Syst. 2022, 34, 5366–5380. [Google Scholar] [CrossRef]
  18. Oguntibeju, O.O. Mitigating artificial intelligence bias in financial systems: A comparative analysis of debiasing techniques. Asian J. Res. Comput. Sci. 2024, 17, 165–178. [Google Scholar] [CrossRef]
  19. Xu, B.; Wang, Y.; Liao, X.; Wang, K. Efficient fraud detection using deep boosting decision trees. Decis. Support Syst. 2023, 175, 114037. [Google Scholar] [CrossRef]
  20. Gilchrist, S.; Wei, B.; Yue, V.Z.; Zakrajšek, E. The Fed takes on corporate credit risk: An analysis of the efficacy of the SMCCF. J. Monet. Econ. 2024, 146, 103573. [Google Scholar] [CrossRef]
  21. Yin, R.; Pierce, B.G. Evaluation of AlphaFold antibody–antigen modeling with implications for improving predictive accuracy. Protein Sci. 2024, 33, e4865. [Google Scholar] [CrossRef] [PubMed]
  22. Lee, D.; Kim, K. AdaBoost. RDT: AdaBoost integrated with Residual-based Decision Tree for Demand Prediction of Bike Sharing Systems under Extreme Demands. IEEE Access 2024, 12, 144316–144336. [Google Scholar] [CrossRef]
  23. Aksoy, N.; Genc, I. Predictive models development using gradient boosting based methods for solar power plants. J. Comput. Sci. 2023, 67, 101958. [Google Scholar] [CrossRef]
  24. Deng, S.; Zhu, Y.; Yu, Y.; Huang, X. An integrated approach of ensemble learning methods for stock index prediction using investor sentiments. Expert Syst. Appl. 2024, 238, 121710. [Google Scholar] [CrossRef]
  25. Moon, J.; Maqsood, M.; So, D.; Baik, S.W.; Rho, S.; Nam, Y. Advancing ensemble learning techniques for residential building electricity consumption forecasting: Insight from explainable artificial intelligence. PLoS ONE 2024, 19, e0307654. [Google Scholar] [CrossRef]
  26. Nasarian, E.; Alizadehsani, R.; Acharya, U.R.; Tsui, K.L. Designing interpretable ML system to enhance trust in healthcare: A systematic review to proposed responsible clinician-AI-collaboration framework. Inf. Fusion 2024, 108, 102412. [Google Scholar] [CrossRef]
  27. Yang, X.; Chen, J.; Li, D.; Li, R. Functional-coefficient quantile regression for panel data with latent group structure. J. Bus. Econ. Stat. 2024, 42, 1026–1040. [Google Scholar] [CrossRef] [PubMed]
  28. Bello, O.A. Machine learning algorithms for credit risk assessment: An economic and financial analysis. Int. J. Manag. 2023, 10, 109–133. [Google Scholar]
  29. Ramakrishnan, R.; Rohella, P.; Mimani, S.; Jiwani, N.; Logeshwaran, J. Employing AI and ML in Risk Assessment for Lending for Assessing Credit Worthiness. In Proceedings of the 2024 2nd International Conference on Disruptive Technologies (ICDT), Bengaluru, India, 15–17 May 2024; pp. 561–566. [Google Scholar]
  30. Aljohani, A. Predictive analytics and machine learning for real-time supply chain risk mitigation and agility. Sustainability 2023, 15, 15088. [Google Scholar] [CrossRef]
  31. Allioui, H.; Mourdi, Y. Exploring the full potentials of IoT for better financial growth and stability: A comprehensive survey. Sensors 2023, 23, 8015. [Google Scholar] [CrossRef]
  32. Zhao, S.; Guan, Y.; Zhou, H.; Hu, F. Making digital technology innovation happen: The role of the CEO’s information technology backgrounds. Econ. Model. 2024, 140, 106866. [Google Scholar] [CrossRef]
  33. Breiman, L.; Friedman, J.; Olshen, R.; Stone, C. Classification and Regression Trees; Cengage Learning Group: Wadsworth, OH, USA, 2021. [Google Scholar]
  34. Charbuty, B.; Abdulazeez, A. Classification based on decision tree algorithm for machine learning. J. Appl. Sci. Technol. Trends 2021, 2, 20–28. [Google Scholar] [CrossRef]
  35. Şahin, E.; Arslan, N.N.; Özdemir, D. Unlocking the black box: An in-depth review on interpretability, explainability, and reliability in deep learning. Neural Comput. Appl. 2024, 37, 859–965. [Google Scholar]
  36. Qian, X.; Cai, H.H.; Innab, N.; Wang, D.; Ciano, T.; Ahmadian, A. A novel deep learning approach to enhance creditworthiness evaluation and ethical lending practices in the economy. Ann. Oper. Res. 2024, 346, 1597–1619. [Google Scholar] [CrossRef]
  37. Wu, L.; Long, Y.; Gao, C.; Wang, Z.; Zhang, Y. MFIR: Multimodal fusion and inconsistency reasoning for explainable fake news detection. Inf. Fusion 2023, 100, 101944. [Google Scholar] [CrossRef]
  38. Cheng, Y.; Deng, X.; Li, Y.; Yan, X. Tight incentive analysis of Sybil attacks against the market equilibrium of resource exchange over general networks. Games Econ. Behav. 2024, 148, 566–610. [Google Scholar] [CrossRef]
  39. Hao, R.; Yang, X. Multiple-output quantile regression neural network. Stat. Comput. 2024, 34, 89. [Google Scholar] [CrossRef]
  40. Fawad, M.; Alabduljabbar, H.; Farooq, F.; Najeh, T.; Gamil, Y.; Ahmed, B. Indirect prediction of graphene nanoplatelets-reinforced cementitious composites compressive strength by using machine learning approaches. Sci. Rep. 2024, 14, 14252. [Google Scholar] [CrossRef] [PubMed]
  41. Khattak, B.H.A.; Shafi, I.; Khan, A.S.; Flores, E.S.; Lara, R.G.; Samad, M.A.; Ashraf, I. A systematic survey of AI models in financial market forecasting for profitability analysis. IEEE Access 2023, 11, 125359–125380. [Google Scholar] [CrossRef]
  42. Ara, A.; Maraj, M.A.A.; Rahman, M.A.; Bari, M.H. The Impact Of Machine Learning On Prescriptive Analytics For Optimized Business Decision-Making. Int. J. Manag. Inf. Syst. Data Sci. 2024, 1, 7–18. [Google Scholar]
  43. Peng, Y.; Zhao, Y.; Dong, J.; Hu, J. Adaptive opinion dynamics over community networks when agents cannot express opinions freely. Neurocomputing 2025, 618, 129123. [Google Scholar] [CrossRef]
  44. Alsagheer, D.; Xu, L.; Shi, W. Decentralized machine learning governance: Overview, opportunities, and challenges. IEEE Access 2023, 11, 96718–96732. [Google Scholar] [CrossRef]
  45. Bodria, F.; Giannotti, F.; Guidotti, R.; Naretto, F.; Pedreschi, D.; Rinzivillo, S. Benchmarking and survey of explanation methods for black box models. Data Min. Knowl. Discov. 2023, 37, 1719–1778. [Google Scholar] [CrossRef]
  46. Rodosthenous, P. Diversity as a Catalyst for Moderating Directors’ Excessive Remuneration: Towards a Stakeholder-Centric Approach. Eur. Bus. Law Rev. 2024, 35, 723–751. [Google Scholar] [CrossRef]
  47. Chen, P.; Wu, L.; Wang, L. AI fairness in data management and analytics: A review on challenges, methodologies and applications. Appl. Sci. 2023, 13, 10258. [Google Scholar] [CrossRef]
  48. Dong, X.; Yu, M. Time-varying effects of macro shocks on cross-border capital flows in China’s bond market. Int. Rev. Econ. Financ. 2024, 96, 103720. [Google Scholar] [CrossRef]
  49. Rizinski, M.; Peshov, H.; Mishev, K.; Chitkushev, L.T.; Vodenska, I.; Trajanov, D. Ethically responsible machine learning in fintech. IEEE Access 2022, 10, 97531–97554. [Google Scholar] [CrossRef]
  50. Yan, J.; Liu, H. A decision tree algorithm for financial risk data of small and medium-sized enterprises. Int. J. Econ. Stat. 2022, 10, 191–197. [Google Scholar] [CrossRef]
  51. Wang, Y.; Luo, J. Effect and Challenge of Credit Guarantee Plan in Financing of Small Enterprises. Singap. Econ. Rev. 2025. [Google Scholar] [CrossRef]
  52. Černevičienė, J.; Kabašinskas, A. Explainable artificial intelligence (XAI) in finance: A systematic literature review. Artif. Intell. Rev. 2024, 57, 216. [Google Scholar] [CrossRef]
  53. Alapati, N.K.; Valleru, V. The Impact of Explainable AI on Transparent Decision-Making in Financial Systems. J. Innov. Technol. 2023, 6, 123–135. [Google Scholar]
  54. Kumar, S.; Vishal, M.; Ravi, V. Explainable reinforcement learning on financial stock trading using shap. arXiv 2022, arXiv:2208.08790. [Google Scholar]
  55. Alblooshi, M.; Alhajeri, H.; Almatrooshi, M.; Alaraj, M. Unlocking Transparency in Credit Scoring: Leveraging XGBoost with XAI for Informed Business Decision-Making. In Proceedings of the 2024 International Conference on Artificial Intelligence, Computer, Data Sciences and Applications (ACDSA), Victoria, Seychelles, 19–21 January 2024; pp. 1–6. [Google Scholar]
  56. Lappas, P.Z.; Yannacopoulos, A.N. A machine learning approach combining expert knowledge with genetic algorithms in feature selection for credit risk assessment. Appl. Soft Comput. 2021, 107, 107391. [Google Scholar] [CrossRef]
  57. Chen, T.; Guestrin, C. XGBoost: A Scalable Tree Boosting System. In Proceedings of the 22nd ACM SIGKDD International Conference on Knowledge Discovery and Data Mining, Washington, DC, USA, 14–18 August 2022; pp. 785–794. [Google Scholar]
  58. Juli, B. Taiwanese Company Bankruptcy Prediction. 2024. Available online: https://www.kaggle.com/code/bhavanjuli/taiwanese-company-bankruptcy-prediction (accessed on 18 December 2024).
Figure 1. Correlation heatmap.
Symmetry 17 00976 g001
Figure 2. Proposed framework.
Symmetry 17 00976 g002
Figure 3. Automatic feature selection.
Symmetry 17 00976 g003
Figure 4. Full decision tree for bankruptcy prediction. Root: net value to liability 0.13 (Gini = 0.097; n = 6820; [6678,142]).
Symmetry 17 00976 g004
Figure 5. Decision tree based on growth metrics. The root node splits on Operating Profit Growth Rate 0.848 (Gini = 0.058; n = 4773, value = [4631 non-bankrupt, 142 bankrupt]).
Symmetry 17 00976 g005
Figure 6. Decision tree based on liquidity metrics. The root node splits on quick ratio 0.003 (Gini = 0.058; n = 4773, value = [4631, 142]).
Symmetry 17 00976 g006
Figure 7. Decision tree based on leverage metrics. The root node splits on Total Debt/Total Net Worth 0.015 (Gini = 0.058; n = 4773, value = [4631, 142]).
Symmetry 17 00976 g007
Figure 8. Decision tree based on operational efficiency metrics. The root node splits on total asset turnover 0.047 (Gini = 0.058; n = 4773, value = [4631, 142]).
Symmetry 17 00976 g008
Figure 9. Decision tree based on profitability metrics. The root node splits on Operating Profit Rate 0.999 (Gini = 0.058; n = 4773, value = [4631, 142]).
Symmetry 17 00976 g009
Figure 10. Confusion matrix for the hybrid model without expert feedback.
Symmetry 17 00976 g010
Figure 11. ROC curve for the hybrid model without expert feedback.
Symmetry 17 00976 g011
Figure 12. Feature importance plot for the hybrid model without expert feedback.
Symmetry 17 00976 g012
Figure 13. Feature importance plot for the hybrid model with expert feedback.
Symmetry 17 00976 g013
Figure 14. Confusion matrix for the hybrid model with expert feedback.
Symmetry 17 00976 g014
Figure 15. Performance metrics of machine learning models.
Symmetry 17 00976 g015
Table 2. Financial metric categorization for dataset.
CategoryFeatures
Profitability MetricsReturn on Assets (ROA), Operating Profit Margin, After-tax Net Profit Growth Rate, Realized Sales Gross Margin
Liquidity MetricsCurrent Ratio, Quick Ratio, Cash Flow to Total Assets, Cash Flow to Sales
Leverage MetricsDebt-to-Equity Ratio, Total Debt to Total Net Worth, Interest Expense Ratio
Growth MetricsRevenue Growth Rate, Total Asset Growth Rate, Operating Profit Growth Rate
Operational Efficiency MetricsInventory Turnover, Operating Expense Rate, Total Asset Turnover, Accounts Receivable Turnover
Table 3. Hyperparameter tuning for machine learning models.
ModelHyperparameterTuning Range
Decision TreeMax Depth[5, 10, 15, 20, None]
Min Samples Split[2, 5, 10, 20]
Min Samples Leaf[1, 2, 4, 10]
Max Features[None, ‘auto’, ‘sqrt’, ‘log2’]
Random ForestN Estimators[50, 100, 200, 500]
Max Depth[5, 10, 15, 20, None]
Min Samples Split[2, 5, 10, 20]
XGBoostN Estimators[50, 100, 200, 500]
Learning Rate[0.01, 0.05, 0.1, 0.2]
Max Depth[3, 5, 10]
Table 4. Performance metrics of different models without expert feedback on the test set.
MetricHybrid Model (Without Expert Feedback)Decision TreeRandom ForestXGBoost
Accuracy0.820.780.800.81
Precision0.840.760.790.82
Recall0.780.740.760.79
F1-Score0.810.750.770.80
AUC-ROC0.880.830.860.87
Table 5. Performance metrics of different models with expert feedback on the test set.
MetricHybrid Model (with Expert Feedback)Decision TreeRandom ForestXGBoost
Accuracy0.850.800.820.83
Precision0.870.790.810.84
Recall0.820.760.780.81
F1-Score0.840.770.790.83
AUC-ROC0.910.850.880.90
Table 6. Cross-validation results for hybrid model with and without expert feedback.
ModelAccuracyPrecisionRecallF1-ScoreAUC-ROC
Decision TreeWithout Expert Feedback0.820.840.780.88
With Expert Feedback0.850.870.820.91
Random ForestWithout Expert Feedback0.810.790.760.86
With Expert Feedback0.840.830.790.89
XGBoostWithout Expert Feedback0.830.800.770.87
With Expert Feedback0.880.860.810.91
Disclaimer/Publisher’s Note: The statements, opinions and data contained in all publications are solely those of the individual author(s) and contributor(s) and not of MDPI and/or the editor(s). MDPI and/or the editor(s) disclaim responsibility for any injury to people or property resulting from any ideas, methods, instructions or products referred to in the content.

