Abstract
Compared with planar layering, the morphology of spatial GMA deposition beads formed by curved layering is influenced by gravity, resulting in asymmetric and complex cross-sections. To quantitatively describe the bead orientation and cross-sectional shape, this study introduces the path inclination angle and path direction angle, along with five characteristic parameters—height, width, eccentricity, upper plumpness, and lower plumpness—using piecewise polynomial fitting for profile modeling. A full-factorial experiment was conducted to establish the relationship between deposition speed, bead spatial orientation, and cross-sectional features. The obtained fitting equation had a mean relative error of less than 2.5%, and an overlapping strategy was proposed to achieve flat, curved GMA layers. The proposed bead characterization method, parameter planning model, and overlap strategy were validated through deposition experiments on cylindrical surfaces without a positioner, providing a foundation for high-precision curved GMA additive manufacturing.
1. Introduction
Additive manufacturing (AM), as a disruptive alternative to conventional sub-tractive processes, including turning, milling, planning, and grinding, has driven innovations in product design and manufacturing paradigms [1,2,3]. Its industrial adoption, however, is constrained by the unresolved contradiction between forming accuracy and efficiency in metal AM technologies such as laser AM, electron beam AM, and gas metal arc AM [4,5,6,7]. Layered slicing critically influences this trade-off: the traditional planar slicing method, as shown in Figure 1, generates excessive layers for high-curvature components, reducing stacking efficiency and inducing step effects that degrade surface finish [8,9,10]. Studies by Smith et al. [11] and Zhao et al. [12] further confirm that abrupt geometric transitions between planar layers exacerbate surface roughness. For this purpose, scholars have proposed the idea of curved layering [13], which uses a set of spatial curved surfaces instead of planes to cut three-dimensional models. The curved layering technique enhances forming accuracy while maintaining manufacturing efficiency, particularly suited for thin-walled structures with significant surface curvature variations.
Figure 1.
Comparison of planar layering and curved layering methods.
For GMA additive manufacturing (GMA-AM), the curved layering method is also a current research hotspot. The GMA-AM process based on curved layering is shown in Figure 2. Although the curved layering method has advantages in forming efficiency and accuracy, it can also bring about forming problems for spatial GMA beads. In addition to being affected by process parameters, the forming shape of spatial GMA beads is also affected by other factors such as surface normal, curvature, spatial path orientation [14,15,16], and gravity-induced drag effect, which often leads to asymmetric cross-sectional morphology. Describing these asymmetric profiles, deriving geometric prediction models, and establishing overlap strategies are fundamental for reasonable path and parameter planning in GMA curved layering AM. However, there is currently a lack of relevant research in this area.
Figure 2.
Schematic diagram of curved layered GMA-AM process.
Many research works have been conducted on modeling the geometric morphology and process parameters, but most focus on deposition beads on a horizontal plane. In 2006, Aiyiti et al. [17] regarded the cross-sectional profile of the deposition bead as an arc function and proposed a flat-top overlap model to guide path planning in planar layering. Based on this, in 2015, Ding et al. [18] from the University of Wollongong used a parabolic fitting for the cross-sectional profile of deposition beads, presented the effect of overlap spacing on the surface flatness of the deposition layer, and proposed a tangent overlap model (TOM) based on the flat-top overlap model. Han et al. [19] pointed out that different process parameters will result in different plumpness of deposition beads, while the plumpness values of traditional parabola, cosine, and arc functions are fixed. He proposed that the use of the exponential function can more accurately predict deposition shape with different plumpness levels. In 2023, Chen et al. [20] proposed a recursive model for deposition beads overlap based on coordinate transformation and axisymmetric droplet shape analysis. The results of the overlap experiment on the flat plate showed that the model was more accurate than the parabolic overlap model.
Compared to deposition beads on a plane, spatial GMA deposition beads are influenced by more factors, and their forming regularities are more complex, often exhibiting asymmetric cross-sectional characteristics. Currently, simulation is mainly used to predict the forming process of additive manufacturing [21]. Hu et al. [22,23] established a computational fluid dynamics model of the molten pool that considers droplet impact, gravity, arc force, heat transfer, and mass transfer. The influence mechanism of gravity on the flow of the molten pool at different positions and the formation of the deposition bead was revealed, and a segmented clustering method was proposed to divide the complex surface into a certain number of simple sub-regions, thereby realizing a curved surface path planning strategy that minimizes the influence of gravity. Cao et al. [24] investigated the mechanisms affecting the molten pool morphology on an inclined substrate through numerical simulations and high-speed imaging. They proposed a strategy to suppress the asymmetry of the deposition path by adjusting the welding torch orientation. However, their study focused exclusively on the influence of the substrate inclination angle on the forming process. Some researchers have also achieved smoother and flatter deposition beads on curved surfaces by incorporating oscillation [25]. However, the introduction of oscillation will increase the width of the deposition bead, thereby limiting the contour fitting accuracy of the GMA-AM.
The current research mainly has the following deficiencies:
- (1)
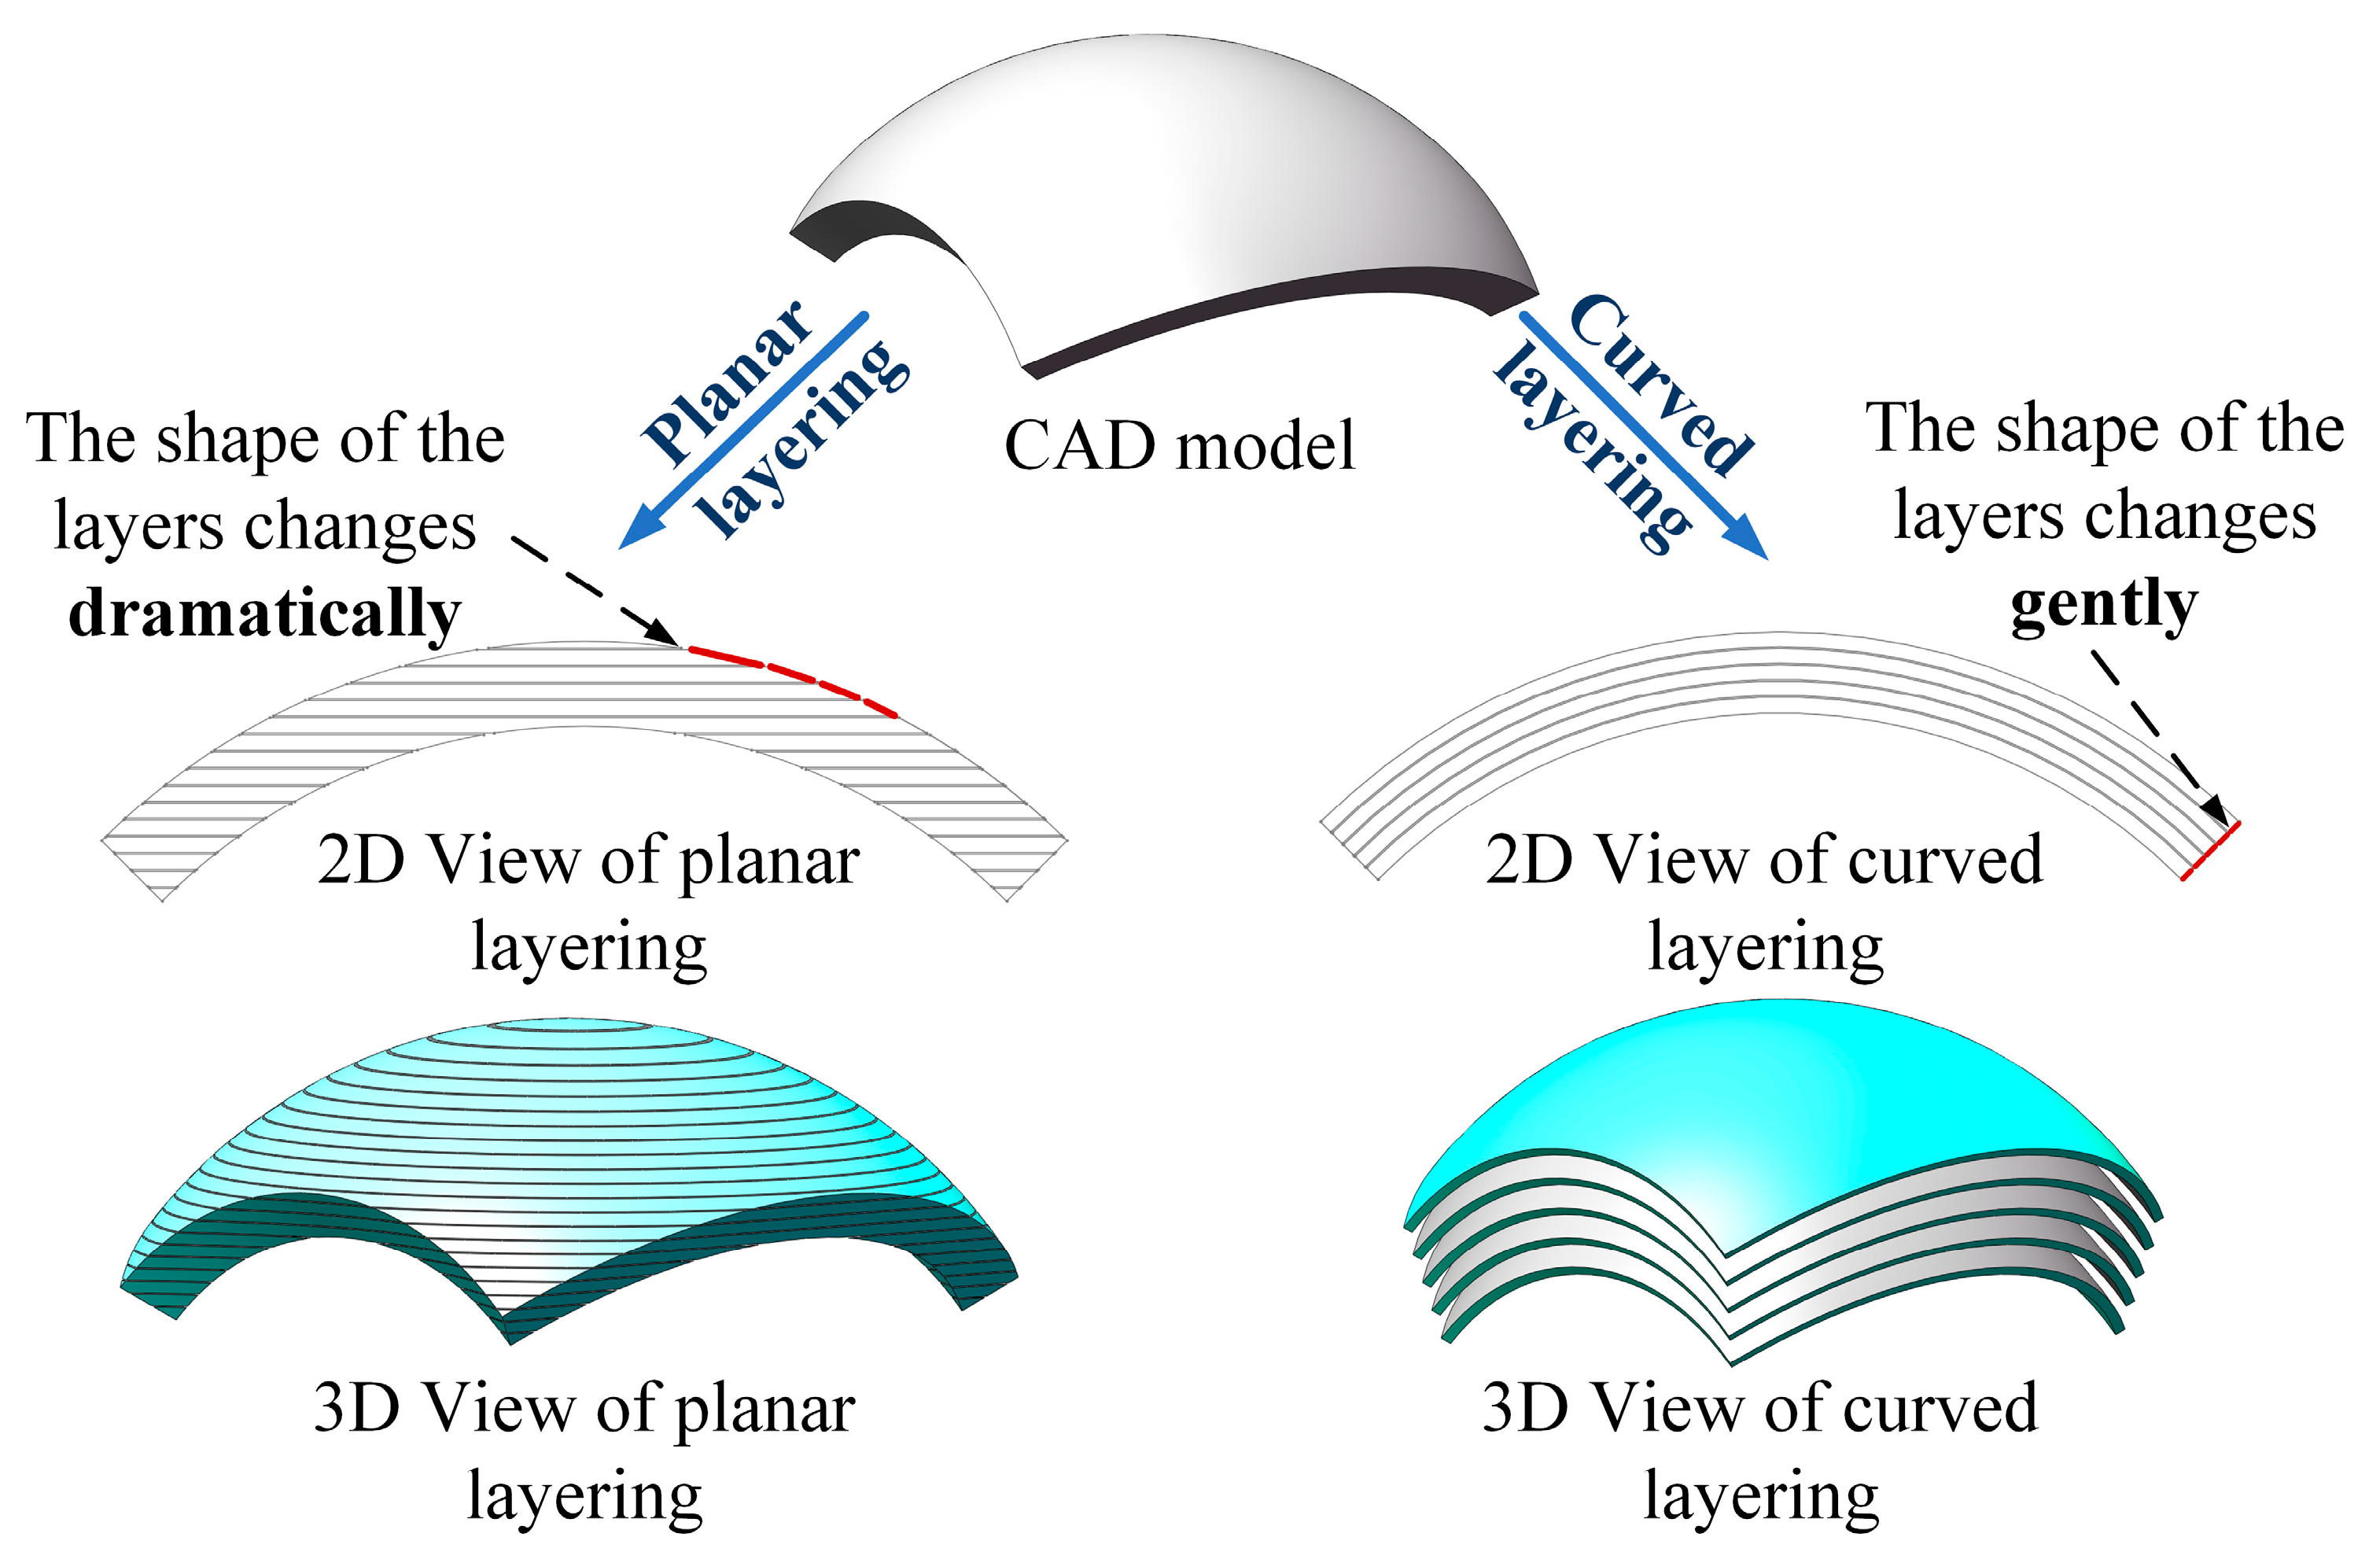
- There is currently a lack of mathematical description of the asymmetric cross-section of the spatial deposition bead on the curved surface, and the modeling research of the cladding bead is still mainly based on the symmetrical bead on the plane.
- (2)
- Although current scholars have noticed the influence of the forming complexity of the spatial deposition path on the GMA-AM based on the curved surface layering and have used simulation methods to predict it, there is a lack of mathematical models to predict the deposition formation and plan the deposition parameters, which limits the application of GMA-AM based on the curved surface layering.
This paper proposes the use of path inclination and path direction angles to quantitatively describe the orientation of spatial deposition beads and introduces parameters such as eccentricity and plumpness to characterize the asymmetrical cross-sectional profile features for the first time. A mathematical model for predicting the geometry of spatial GMA beads and overlap strategy is established, then the forming law of spatial GMA beads is analyzed. Finally, deposition experiments of equidistant-height GMA beads and equidistant-thickness GMA curved layers on a cylindrical surface are carried out without using a positioner to verify that the proposed deposition geometric prediction and overlap model are reasonable and effective. The main research contents and the relationship between each part of this paper are shown in Figure 3.
Figure 3.
Schematic diagram of the research methodology.
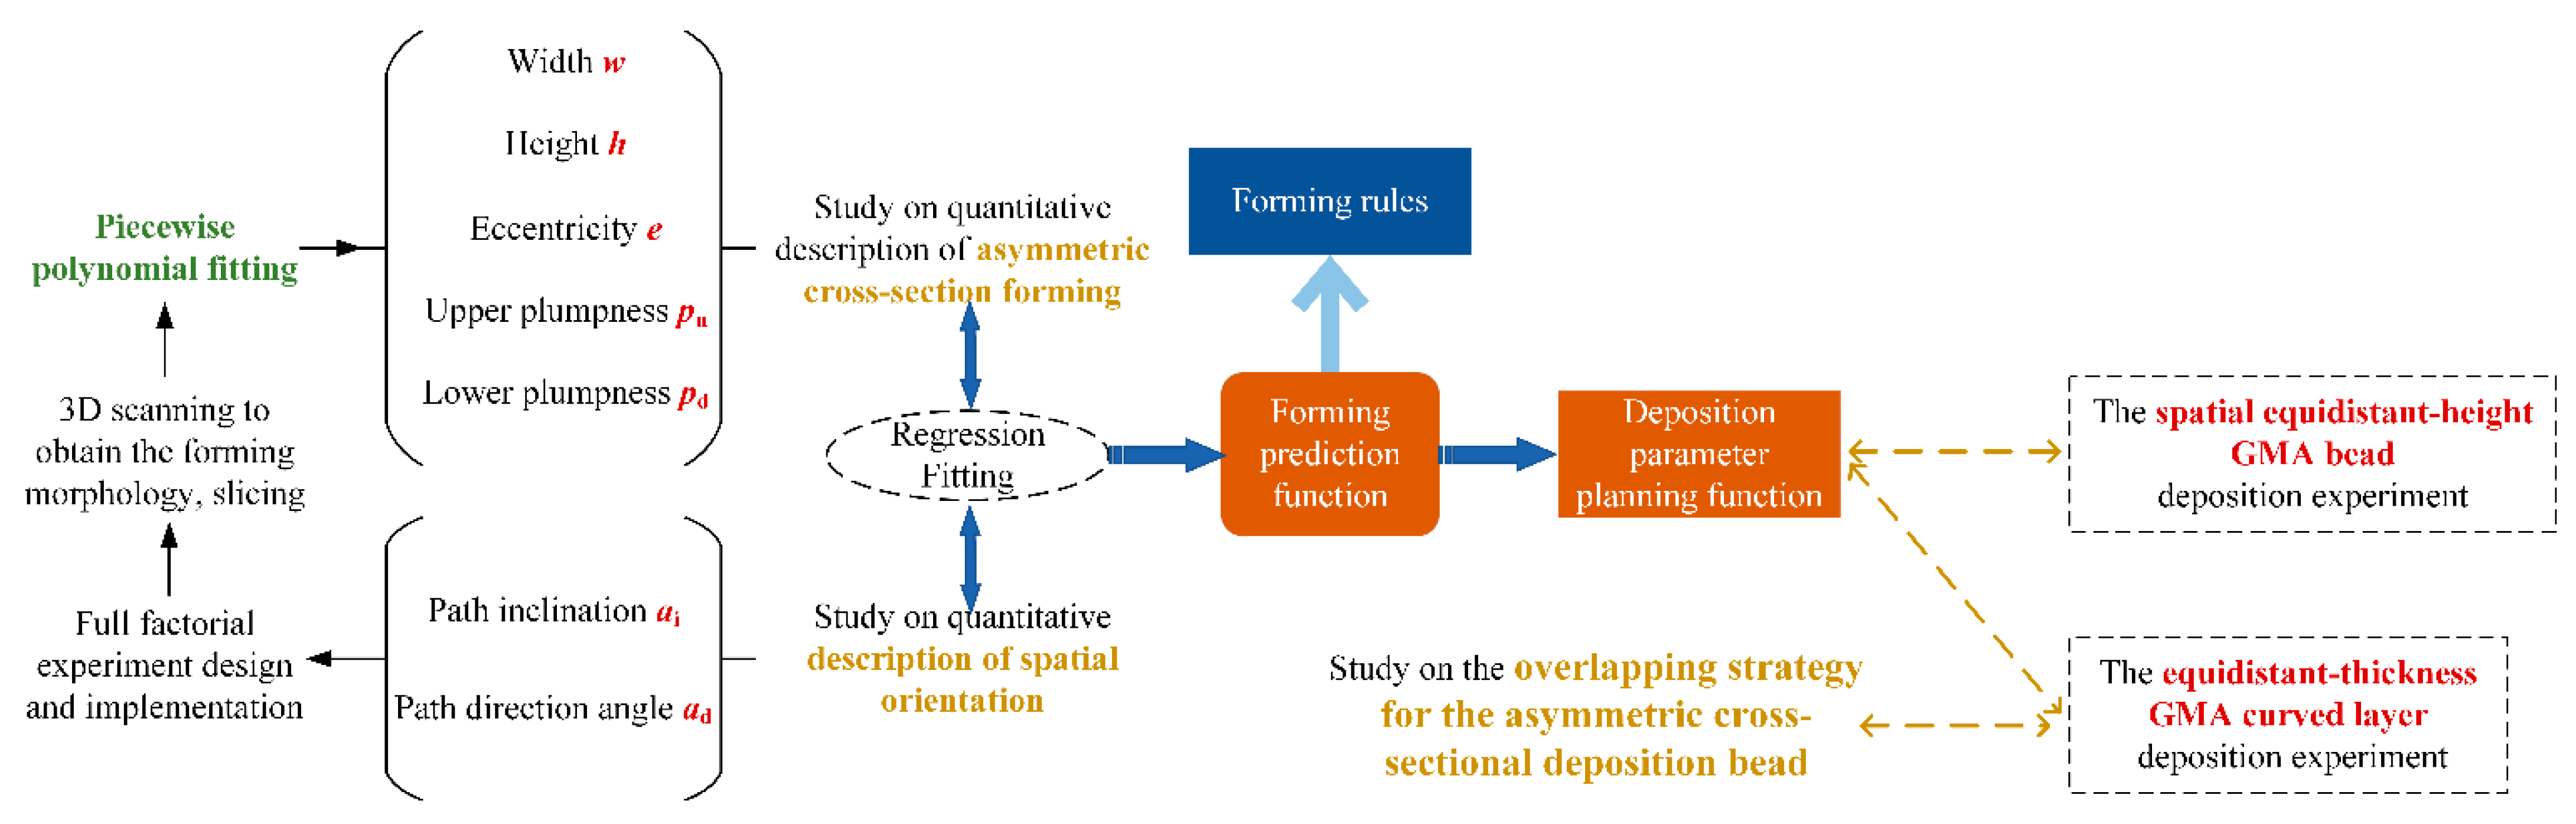
2. Definition of Asymmetric Cross-Sectional Geometric Characteristics and Contour Fitting Function
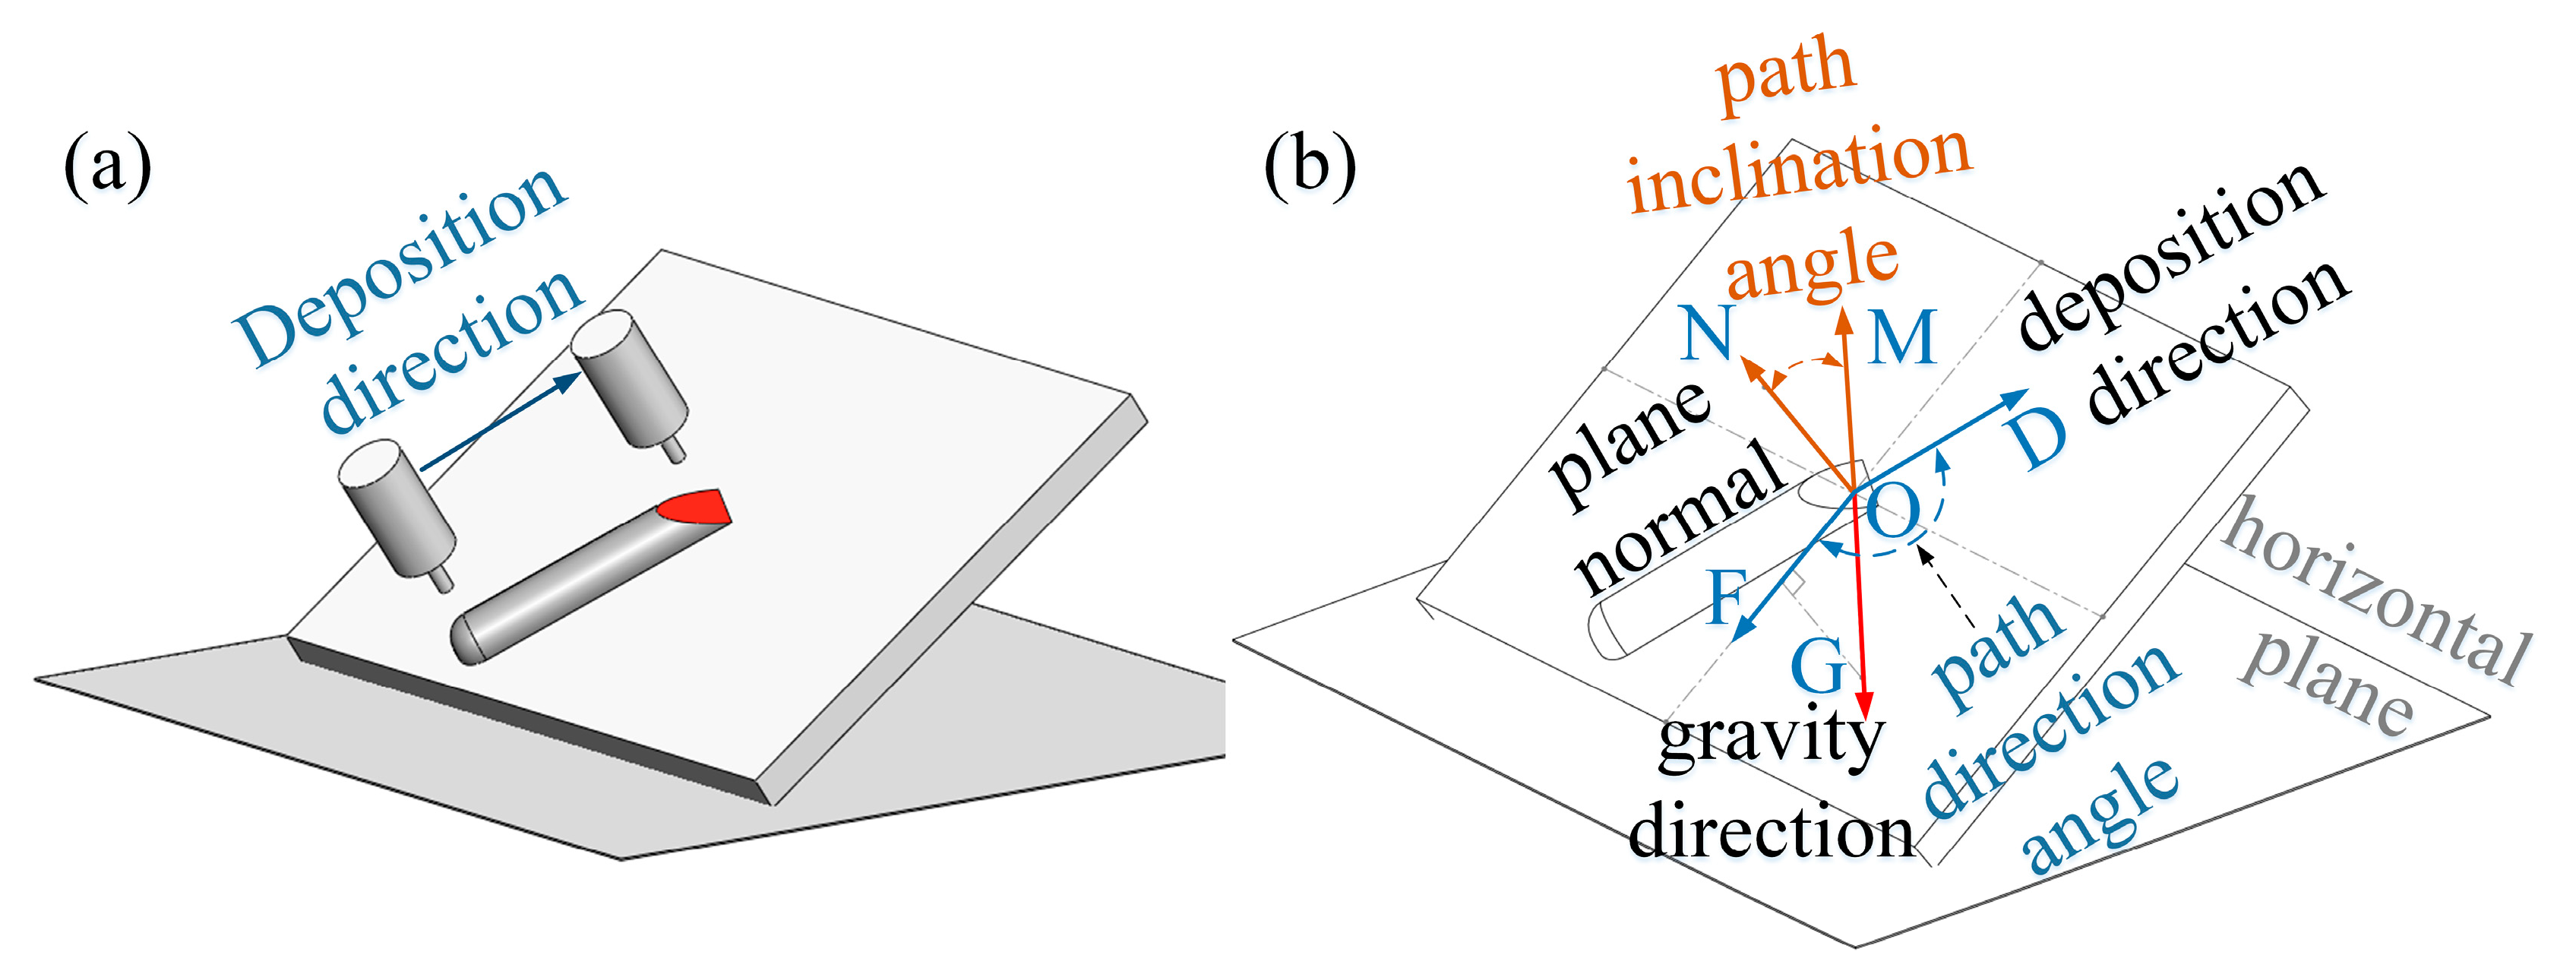
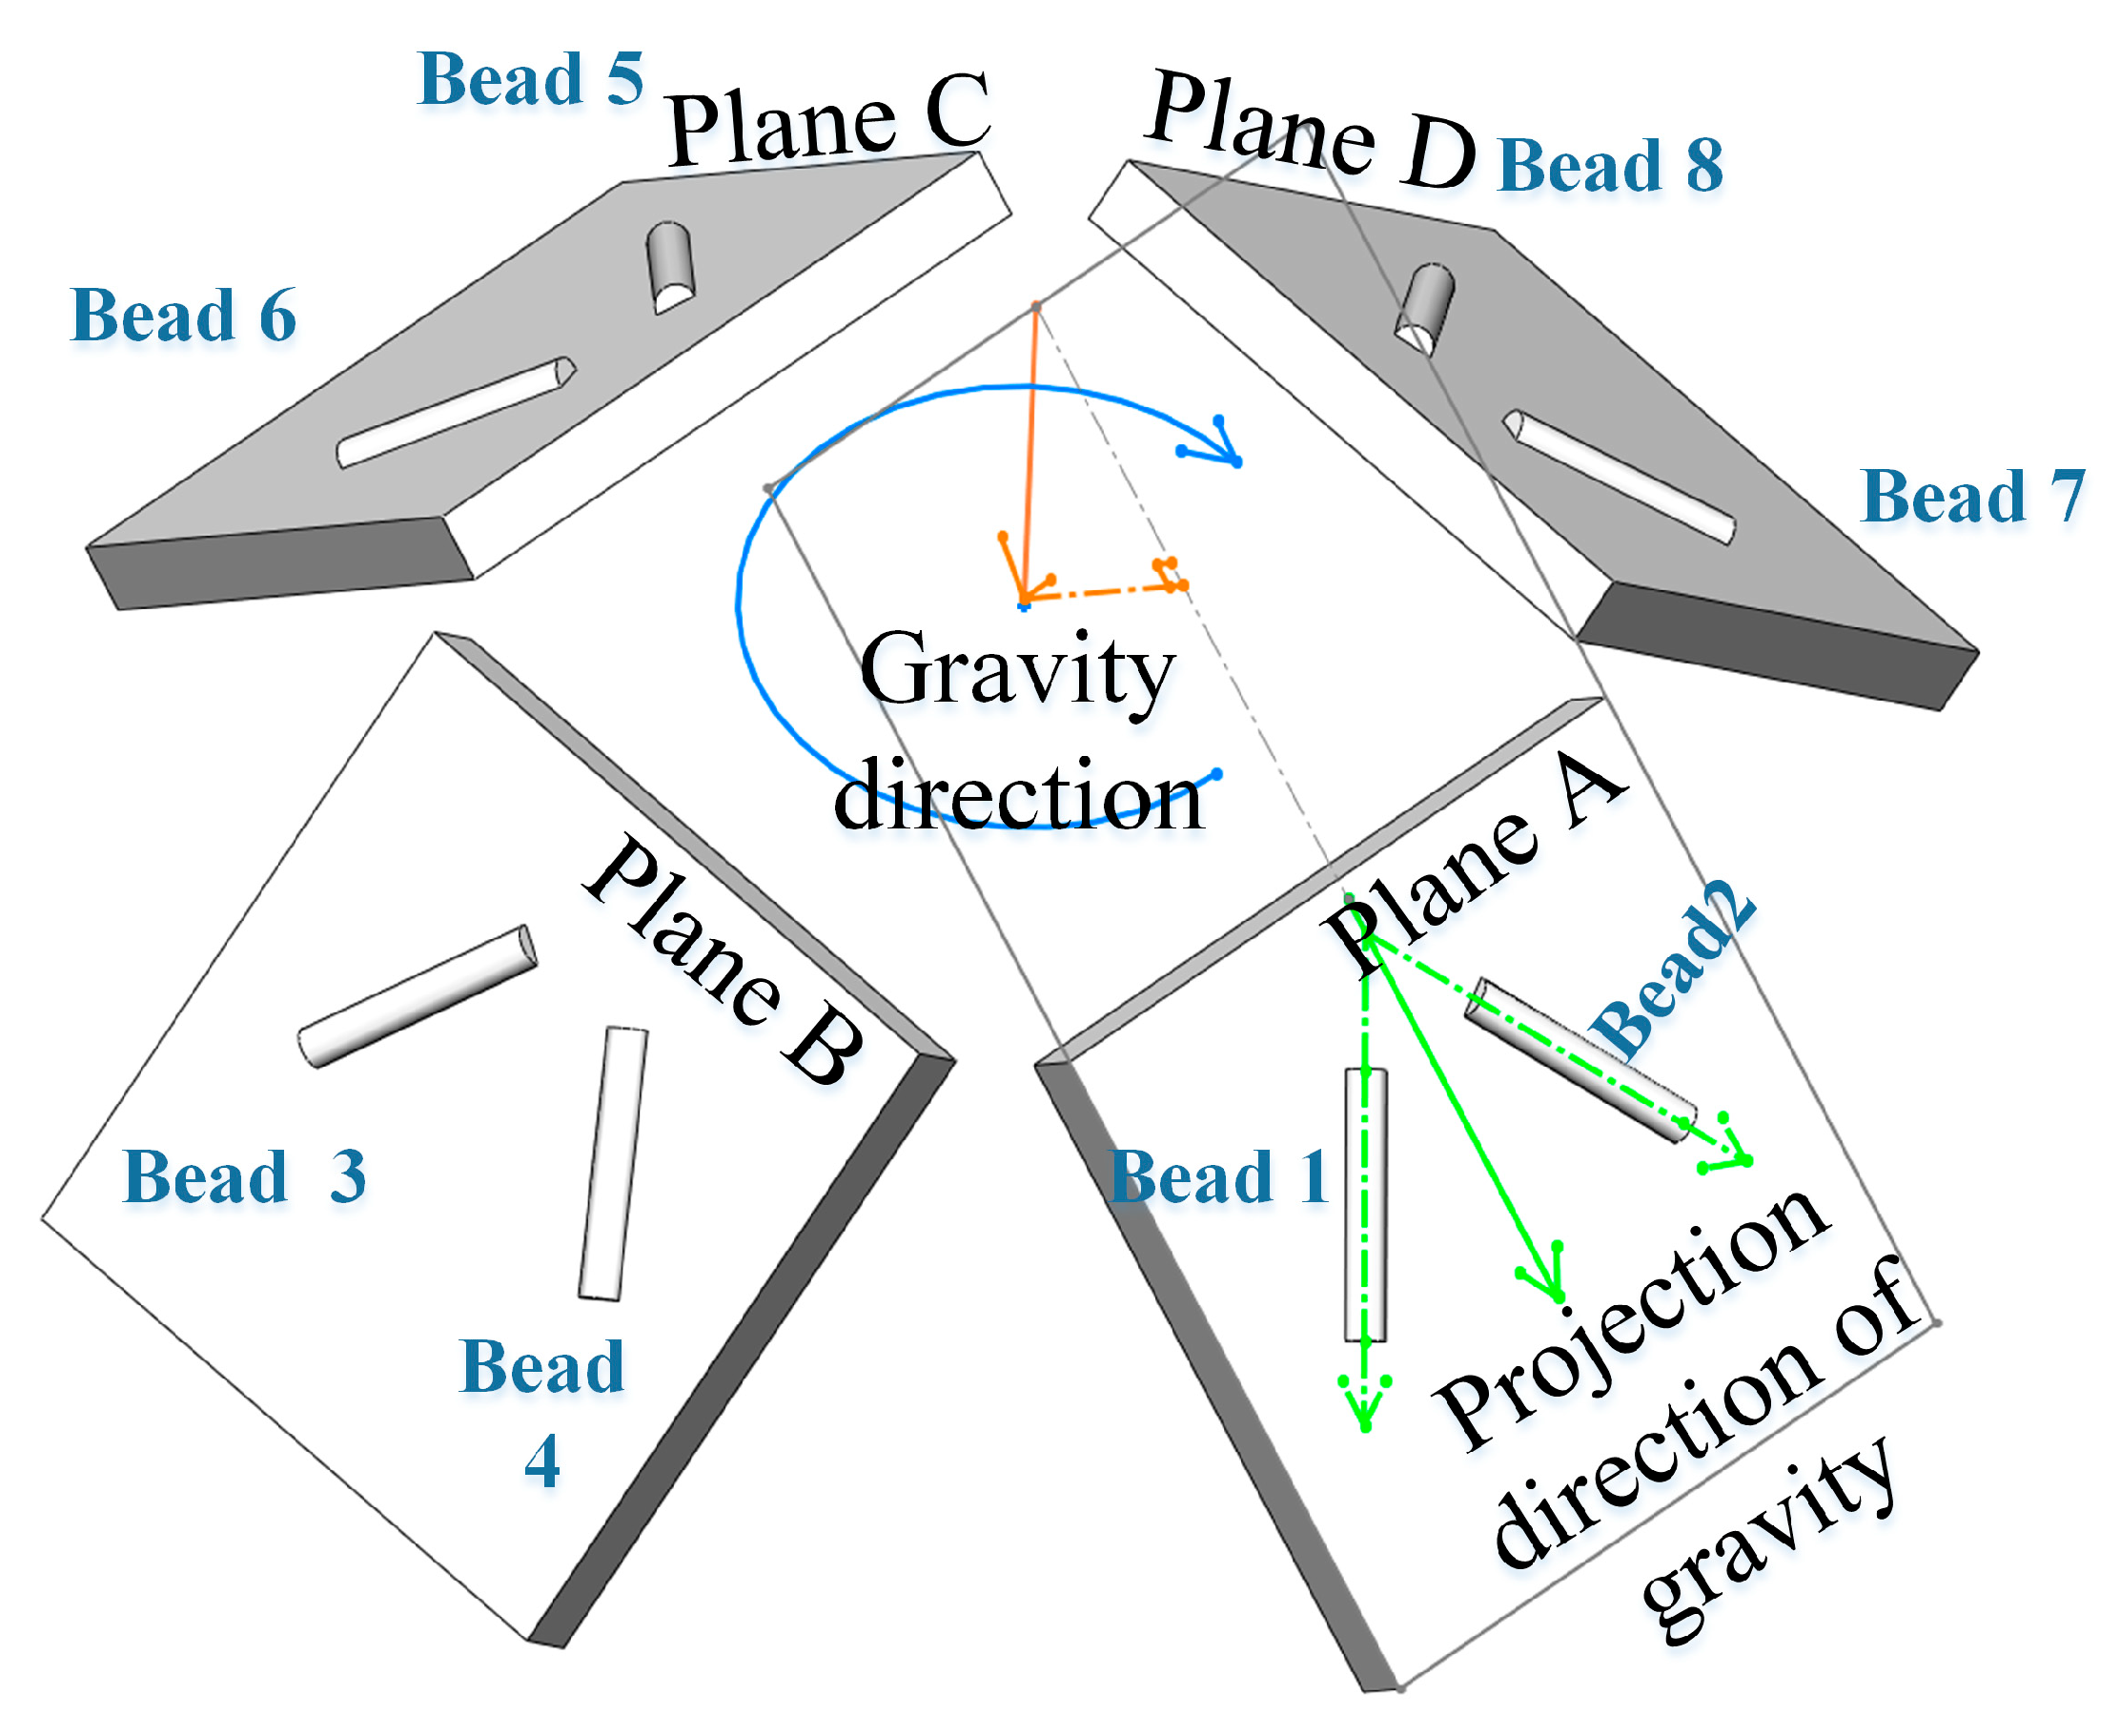
2.1. Description of the Orientation for the Spatial Deposition Bead
The curvature and direction of the deposition bead vary at each position on a curved surface, making it impossible to use a unified physical quantity to describe them. This paper, grounded in calculus, proposes that the tangent and normal direction to a small segment of the deposition bead on a curved surface remain constant, as shown in Figure 4. This equivalently transforms a small segment of the deposition bead on a curved surface into a straight bead on a flat plane, where the normal of the plane is equal to the normal of the surface at the position of the spatial curved beam, and the direction of the straight beam is equal to the tangent of the spatial beam.
Figure 4.
Equivalent result of spatially curved beads [26].
In order to describe the direction of the deposition bead in space, the concepts of path inclination and path direction angle are proposed. The path inclination is defined as the angle between the normal of the flat plane in space and the opposite direction of gravity; the path direction angle is defined as the angle between the path direction on the flat plane and the projection direction of gravity on the plane, as shown in Figure 5. The value range of the path inclination is 0° to 90°, and the value range of the path direction angle is 0° to 180°. As shown in Figure 4, represents the direction of gravity, represents the opposite direction of gravity, represents the normal direction of the flat plane, is the projection of gravity on the plane, is the path direction, the path inclination is ∠NOM, and the path direction angle is ∠DOF. When the plane in space is on a horizontal plane, the path inclination is 0°. At this time, the projection direction of gravity on the plane cannot be calculated, and the path direction angle is specified to be 0° in this situation.
Figure 5.
Schematic diagram of path inclination and path direction angle: (a) three-dimensional schematic diagram of the spatial deposition bead; (b) path inclination and path direction definitions.
The purpose of quantitatively describing the spatial direction of the deposition bead is to lay the foundation for establishing a prediction model for the morphology of the deposition bead. This requires a functional mapping relationship between the described angles and the forming morphology; that is, under the same deposition conditions, the formation of the spatial deposition bead with the same path inclination and path direction angles should be consistent. The following is an analysis of the rationality for selecting the path inclination angle and path direction angle to describe the direction of the deposition bead.
When the path inclination angle and path direction angle are determined, different spatial deposition paths can be obtained. As shown in Figure 6, the path inclination angles and path directions of beads 1–8 are the same. When the path inclination angle is determined, the angle between the normal of the spatial plate and the opposite direction of gravity is fixed, a set of spatial plates that are axisymmetric to the direction of gravity can be obtained, such as the spatial plane A, B, C, and D in the figure. For plane A, when the path direction angle is determined, two beads that are axisymmetric to the direction of gravity projection can be obtained, such as deposition beads 1 and 2 in the figure.
Figure 6.
Different spatial beads with the same path inclination angle and path direction angle.
Through force analysis, the influence of gravity on deposition beads 1 and 2 is the same, so when other deposition conditions are unchanging, the forming morphology of deposition should be equal. All other beads with the same path inclination angle and path direction angle can be obtained by rotating and translating the deposition beads 1 or 2 about the direction of gravity. Both movements will not change the effect of gravity on the deposition bead and thus will not change the forming morphology.
In conclusion, it is reasonable to quantitatively describe the direction of spatial deposition beads using path inclination and path direction angle, and it is sufficient to use these two angles to describe the influence of gravity on forming
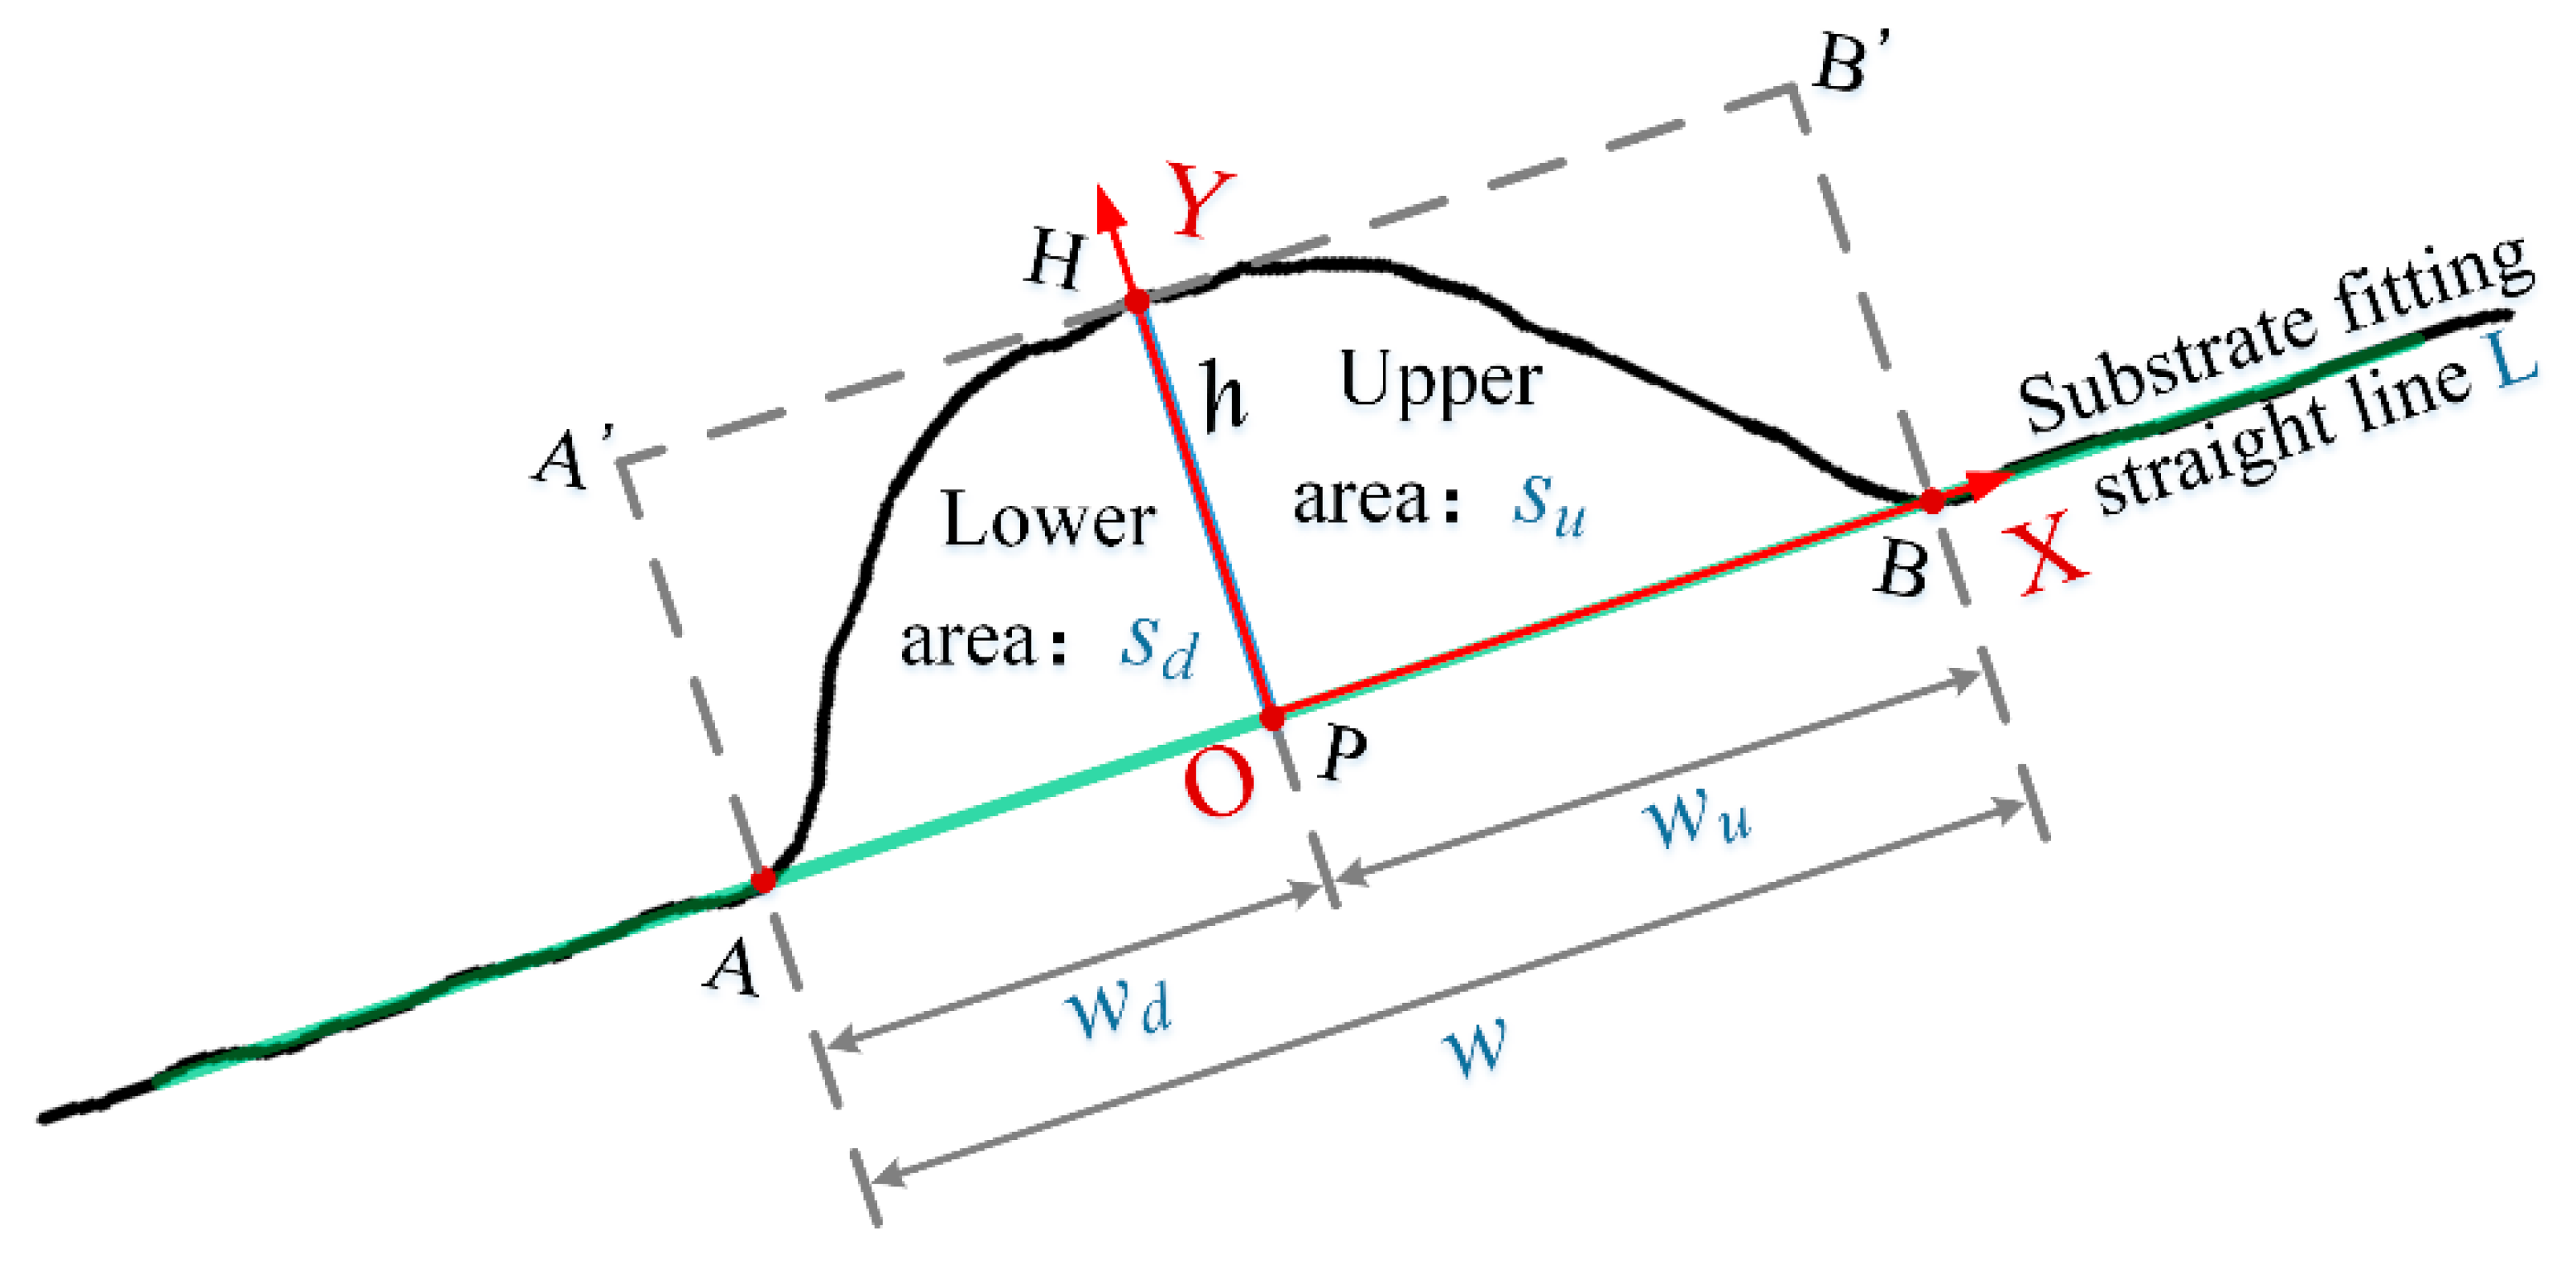
2.2. Geometric Characteristics of the Asymmetric Cross-Sectional Deposition Bead
Due to the drag effect of gravity, the cross-sectional morphology of the spatial deposition bead has asymmetric characteristics and cannot be simply described using the two features of height and width. Figure 7 shows the actual three-dimensional shape of a spatial deposition channel with a current of 130 A, voltage of 21.2 V, deposition speed of 6 mm/s, path inclination angle of 60°, and path direction angle of 90°. Figure 7a is a schematic diagram of the spatial orientation of the deposition bead and a three-dimensional model derived by a three-dimensional scanner, and Figure 7b is a cross-sectional view obtained by slicing the three-dimensional model. From the figure, it can be seen that the spatial deposition bead tilts towards the gravity side, often resulting in an asymmetric cross-section, and the side closer to the gravity direction is more saturated.
Figure 7.
Actual three-dimensional appearance of spatial deposition bead: (a) scanned model and spatial orientation of the deposition bead; (b) the asymmetric cross-section.
Considering the asymmetry of the cross-section, the highest point does not necessarily appear at the center of the contour profile, and the plumpness of the profile on both sides is different under the action of gravity. This paper uses five geometric characteristics, including height, width, eccentricity, upper plumpness, and lower plumpness, to describe the asymmetric cross-section, as shown in Figure 8. The definition and calculation method of each eigenvalue are as follows:
Figure 8.
Geometric characteristics of the asymmetric cross-section.
- (1)
- Using the points on the plane and the least squares method, fit the straight line L;
- (2)
- The point H, which is the farthest from line L among all contour points, is defined as the highest point. The distance from point H to line L is defined as the height of the deposition bead, represented by h. The projection points of point H on the straight-line L are denoted as P;
- (3)
- Calculate the intersection point between the contour of the deposition path and the straight line L, denoted as A and B. Define the distance between points A and B as the width of the deposition path, denoted as w;
- (4)
- The distance between BP is denoted as wu, and the eccentricity is defined as wu/w, represented by e;
- (5)
- The profile is divided into two parts by the line segment HP. The area of the upper part is calculated as su, and the area of the lower part is recorded as sd. The upper plumpness is the ratio of the upper part to the area of the rectangle APHA’ surrounding it, which is su/(wu∗h), denoted as pu; the same applies to the lower plumpness, denoted as pd.
2.3. Contour Fitting Function
The fitting of the cross-sectional contour is the basis for predicting the formation of deposition beads, path planning, and parameter planning. Scholars generally use parabolic, circular, and cosine functions to fit the profile of the bead, but these functions are not effective for asymmetric cross-sections. This paper uses segmented polynomial functions to fit the upper and lower contours of the cross-section based on its shape feature.
In Figure 7, a coordinate system is established with point P as the origin, PB as the X-axis and PH as the Y-axis. Fit the contours on both sides separately using the polynomial of Formula 1.
In order to ensure that the fitted contour at the intersection of the two sides is smooth and derivable, the polynomial degree t ≥ 1 is taken. At this point, the corresponding contour plumpness value range is [0.5, 1). The values of t, a1, and a2 can be calculated using Formula 2 based on the principle of equal plumpness:
where p is the upper or lower plumpness value, and w and h are the width and height of the deposition bead, respectively.
In order to compare with other fitting functions, taking the GMA deposition bead obtained under the parameters of path inclination angle of 30°, path direction angle of 90°, current of 100 A, and deposition speed of 6 mm/s as an example, the real three-dimensional morphology obtained through scanning and slicing is shown in Figure 9. The contour feature values are extracted and fitted using piecewise polynomial fitting, parabolic, circular arc, and cosine functions, respectively. The standard deviations obtained by comparing the fitted curve with the true contour are 0.16 mm, 0.21 mm, 0.44 mm, and 0.22 mm. Through observation, it can be seen that compared to other typical contour fitting functions; piecewise polynomials can better adapt to the characteristics of asymmetric cross-sections and variable plumpness of spatial deposition beads.
Figure 9.
Contour fitting results in different functions.
3. Forming Law and Modeling of Spatial GMA Deposition Bead
3.1. The Forming Experiment
In order to better reveal the influence of path inclination angle and path direction angle on the formation of deposition bead and establish an accurate regression model, a full factorial experiment was designed in this paper.
However, due to the many influencing factors on the formation of spatial deposition beads, in order to reduce the number of tests, fixed process parameters such as current, voltage, nozzle height, and flow rate of protection gas were used, and only focus on the relationship between deposition speed, path direction angle, path inclination angle, and the forming result. At the same time, in order to reduce the poor formation of the spatial beads caused by the flow of the molten pool, this article adopts a small deposition parameter with a current of 130 A, a matching voltage of 21.2 V, and a nozzle height of 12 mm. The process windows that can be well-formed through preliminary process experiments are shown in Table 1.
Table 1.
Process parameter window.
The path inclination angle is selected at every 15°, with a total of 4 levels; the path direction angle is selected at every 30°, with a total of 5 levels; the deposition speed is selected at every 2 mm/s, with a total of 4 levels. Since the path direction angle is meaningless when the path inclination angle is 0°, and only 4 groups of experiments are required, there are a total of 64 groups in this experiment. Each deposition bead is scanned and sliced, and the geometric characteristic values are calculated. Then, take the average of the characteristic values of 10 cross-sections as the corresponding characteristic values under the forming conditions. Specific experimental data and actual cross-sectional morphology are shown in Appendix A.
The three-factor quadratic regression equation was used to establish the model; the form of the equation is as follows:
where is the regression fitting output value, is the experimental input, are the constant term, linear term coefficient, interaction term coefficient and quadratic term coefficient, respectively.
Fitting analysis was performed using Minitab 17 software. The significance probability (p-value) threshold was set at 0.05, and stepwise regression was applied for model selection. After optimization, the final regression equations for height and width were obtained as follows:
In the formula, ai represents the substrate inclination angle, ad represents the path direction angle, and s represents deposition speed. In order to verify the fitting effect of the regression equation, the mean relative errors (MRE), coefficient of determination (R2) and root mean square error (RMSE) between the experimentally obtained eigenvalues and the fitted values of the regression equation were calculated, As shown in Table 2. The fitting result is good, and the error could meet the requirements of GMA additive manufacturing.
Table 2.
R2 and RMSE values.
3.2. Analysis of Forming Law
In order to better reveal the influence of path inclination and path direction angle on the forming of spatial GMA deposition beads, a curve was established using the fitted equations to show how the geometric characteristic values of the forming cross-section change with the spatial orientation of the deposition bead. Analysis shows that the values of variation in the characteristics differ significantly at different deposition speeds, but the trends of curves are basically similar. Figure 10 shows the variation surfaces of height, width, eccentricity, upper plumpness, and lower plumpness at a deposition speed of 6 mm/s with respect to the path inclination and path direction angle.
Figure 10.
Characteristic values of bead with respect to path inclination and path direction angle: (a) height; (b) width; (c) eccentricity; (d) upper plumpness; (e) lower plumpness.
- (1)
- Height (h): When the path inclination is fixed, as the path direction angle rises, the height of the bead gradually becomes larger, and this trend becomes more and more obvious as the path inclination angle increases. When the path direction angle is fixed and less than 90°, corresponding to a downward welding condition, the height of the bead gradually diminishes as the path inclination increases. However, when the path direction angle exceeds 90°, corresponding to an upward welding condition, the height of the bead gradually expands as the path inclination increases.
- (2)
- Width (w): The width is primarily influenced by the path inclination. As the path inclination increases, the effect of gravity on the molten pool becomes more significant, resulting in an increase in width. When the path inclination is fixed, the width tends to decrease as the path direction angle rises, and this trend is more pronounced at higher path inclinations.
- (3)
- Eccentricity (e): The eccentricity rises with the increase of the path direction angle and path inclination angle and reaches the maximum value near the path direction angle of 90°. The horizontal welding position in the corresponding welding is most likely to cause the eccentricity of the deposition bead.
- (4)
- Upper plumpness (pu): Overall, the upper saturation decreases as the path direction angle and the path inclination angle increase. When the path direction angle is fixed and near 0°, the upper saturation shows a positive correlation with the path inclination angle; when the path direction angle is fixed, and near 90°, the upper saturation exhibits a negative correlation with the path inclination angle.
- (5)
- Lower plumpness (pd): The lower plumpness value does not show an opposite trend to the upper plumpness value but is mainly affected by the path inclination, with the maximum value appearing near the maximum path inclination of 45° and the path direction angle of 30°.
Based on the above analysis, the following conclusions of the forming law can be drawn:
- (1)
- As the path direction angle increases, the morphology of the deposition bead changes from short and wide to thin and tall, and this trend becomes more pronounced with the increase of the path inclination angle and the decrease of the speed.
- (2)
- When the path direction angle is near 90°, corresponding to the horizontal welding position in welding, the eccentricity of the deposition path is the largest; that is, the downward tilt phenomenon is the most serious.
- (3)
- The upper and lower plumpness value performance is complex and does not show opposite trends. The figure shows that at maximum eccentricity, the upper plumpness is at a minimum, while the lower plumpness does not reach its maximum. This is because the plumpness value is not only affected by the eccentricity but also by the characteristics of the deposition path formation. For example, compared with the path direction angle of 0° and the path inclination of 45°, the corresponding deposition bead is wider and lower. There is no eccentricity, but the upper and lower plumpness values of the path are greater.
4. The Overlapping Strategy for the Asymmetric Cross-Sectional Deposition Bead
The reasonable offset distance between adjacent deposition beads plays a decisive role in the overlap effect and forming surface flatness. If the offset distance is too large, it will cause gullies between beads, seriously affecting the forming accuracy and surface flatness, and will also cause forming defects. If the offset distance is too small, the latter bead will be raised by the previous bead, causing the height in the same layer to gradually increase, which will also affect the forming accuracy. A lot of research has been conducted on the overlapping strategies between deposition beads on the plane, and overlapping theories such as TOM [26] have been proposed. However, there are no reports on the overlapping strategies for the asymmetric spatial curved deposition bead.
Following the overlapping theory on the flat plane, this paper gives the offset distance planning principles for spatial deposition beads. As shown in Figure 11, in order to obtain a flattened deposition layer with a fixed thickness, the overlap distance d needs to be adjusted so that the upper inter-pass groove area SCGE and the lower overlap area SGDB are equal according to the law of conservation of mass.
Figure 11.
Schematic diagram of the overlapping model for the asymmetric cross-sectional bead.
The formula can be obtained as follows:
SCGE + Su + Sd = SCMNE + SGDB
In the formula, Su and Sd respectively represent the areas on the upper and lower sides of the deposition bead, SCMNE is the area of rectangular CMNE, and SCGE and SGBD are the upper inter-path gully area and the lower inter-path overlap area, respectively.
Since SCGE = SGBD, we can simplify it to get:
where wu, wp are the width of the upper and lower part in the cross-section, respectively, and d is the theoretical offset distance between adjacent beads.
Further simplification, the calculation formula for the theoretical offset distance d is:
In order to verify that the above offset distance planning algorithm is suitable for spatial deposition beads, the overlap experiments, which were designed by a three-factor, three-level partial factorial experimental, were carried out within the process window.
The three levels of path inclination were set to 15°, 30°, and 45° respectively; the three levels of path direction angles were 0°, 60°, and 120° respectively; and the three levels of speed were 4 mm/s, 7 mm/s, and 10 mm/s. The experimental design is shown in Table 3. After deposition, three-dimensional models of beads were obtained through scanning and were sliced to observe the overlap effect.
Table 3.
Overlapping experiments.
Figure 12 shows the appearance of the overlapped formation, and Figure 13 shows the cross-sectional slice diagram. It can be observed that the overlapped test of the deposition paths under various parameters obtained a smooth layer, which verifies the overlapping model of asymmetric cross-sectional beads proposed in this paper.
Figure 12.
Appearance of spatial beams: (a) overlapping results of Exp 1–3; (b) overlapping results of Exp 4–6; (c) overlapping results of Exp 7–9.
Figure 13.
Sectional slice of the spatial beams.
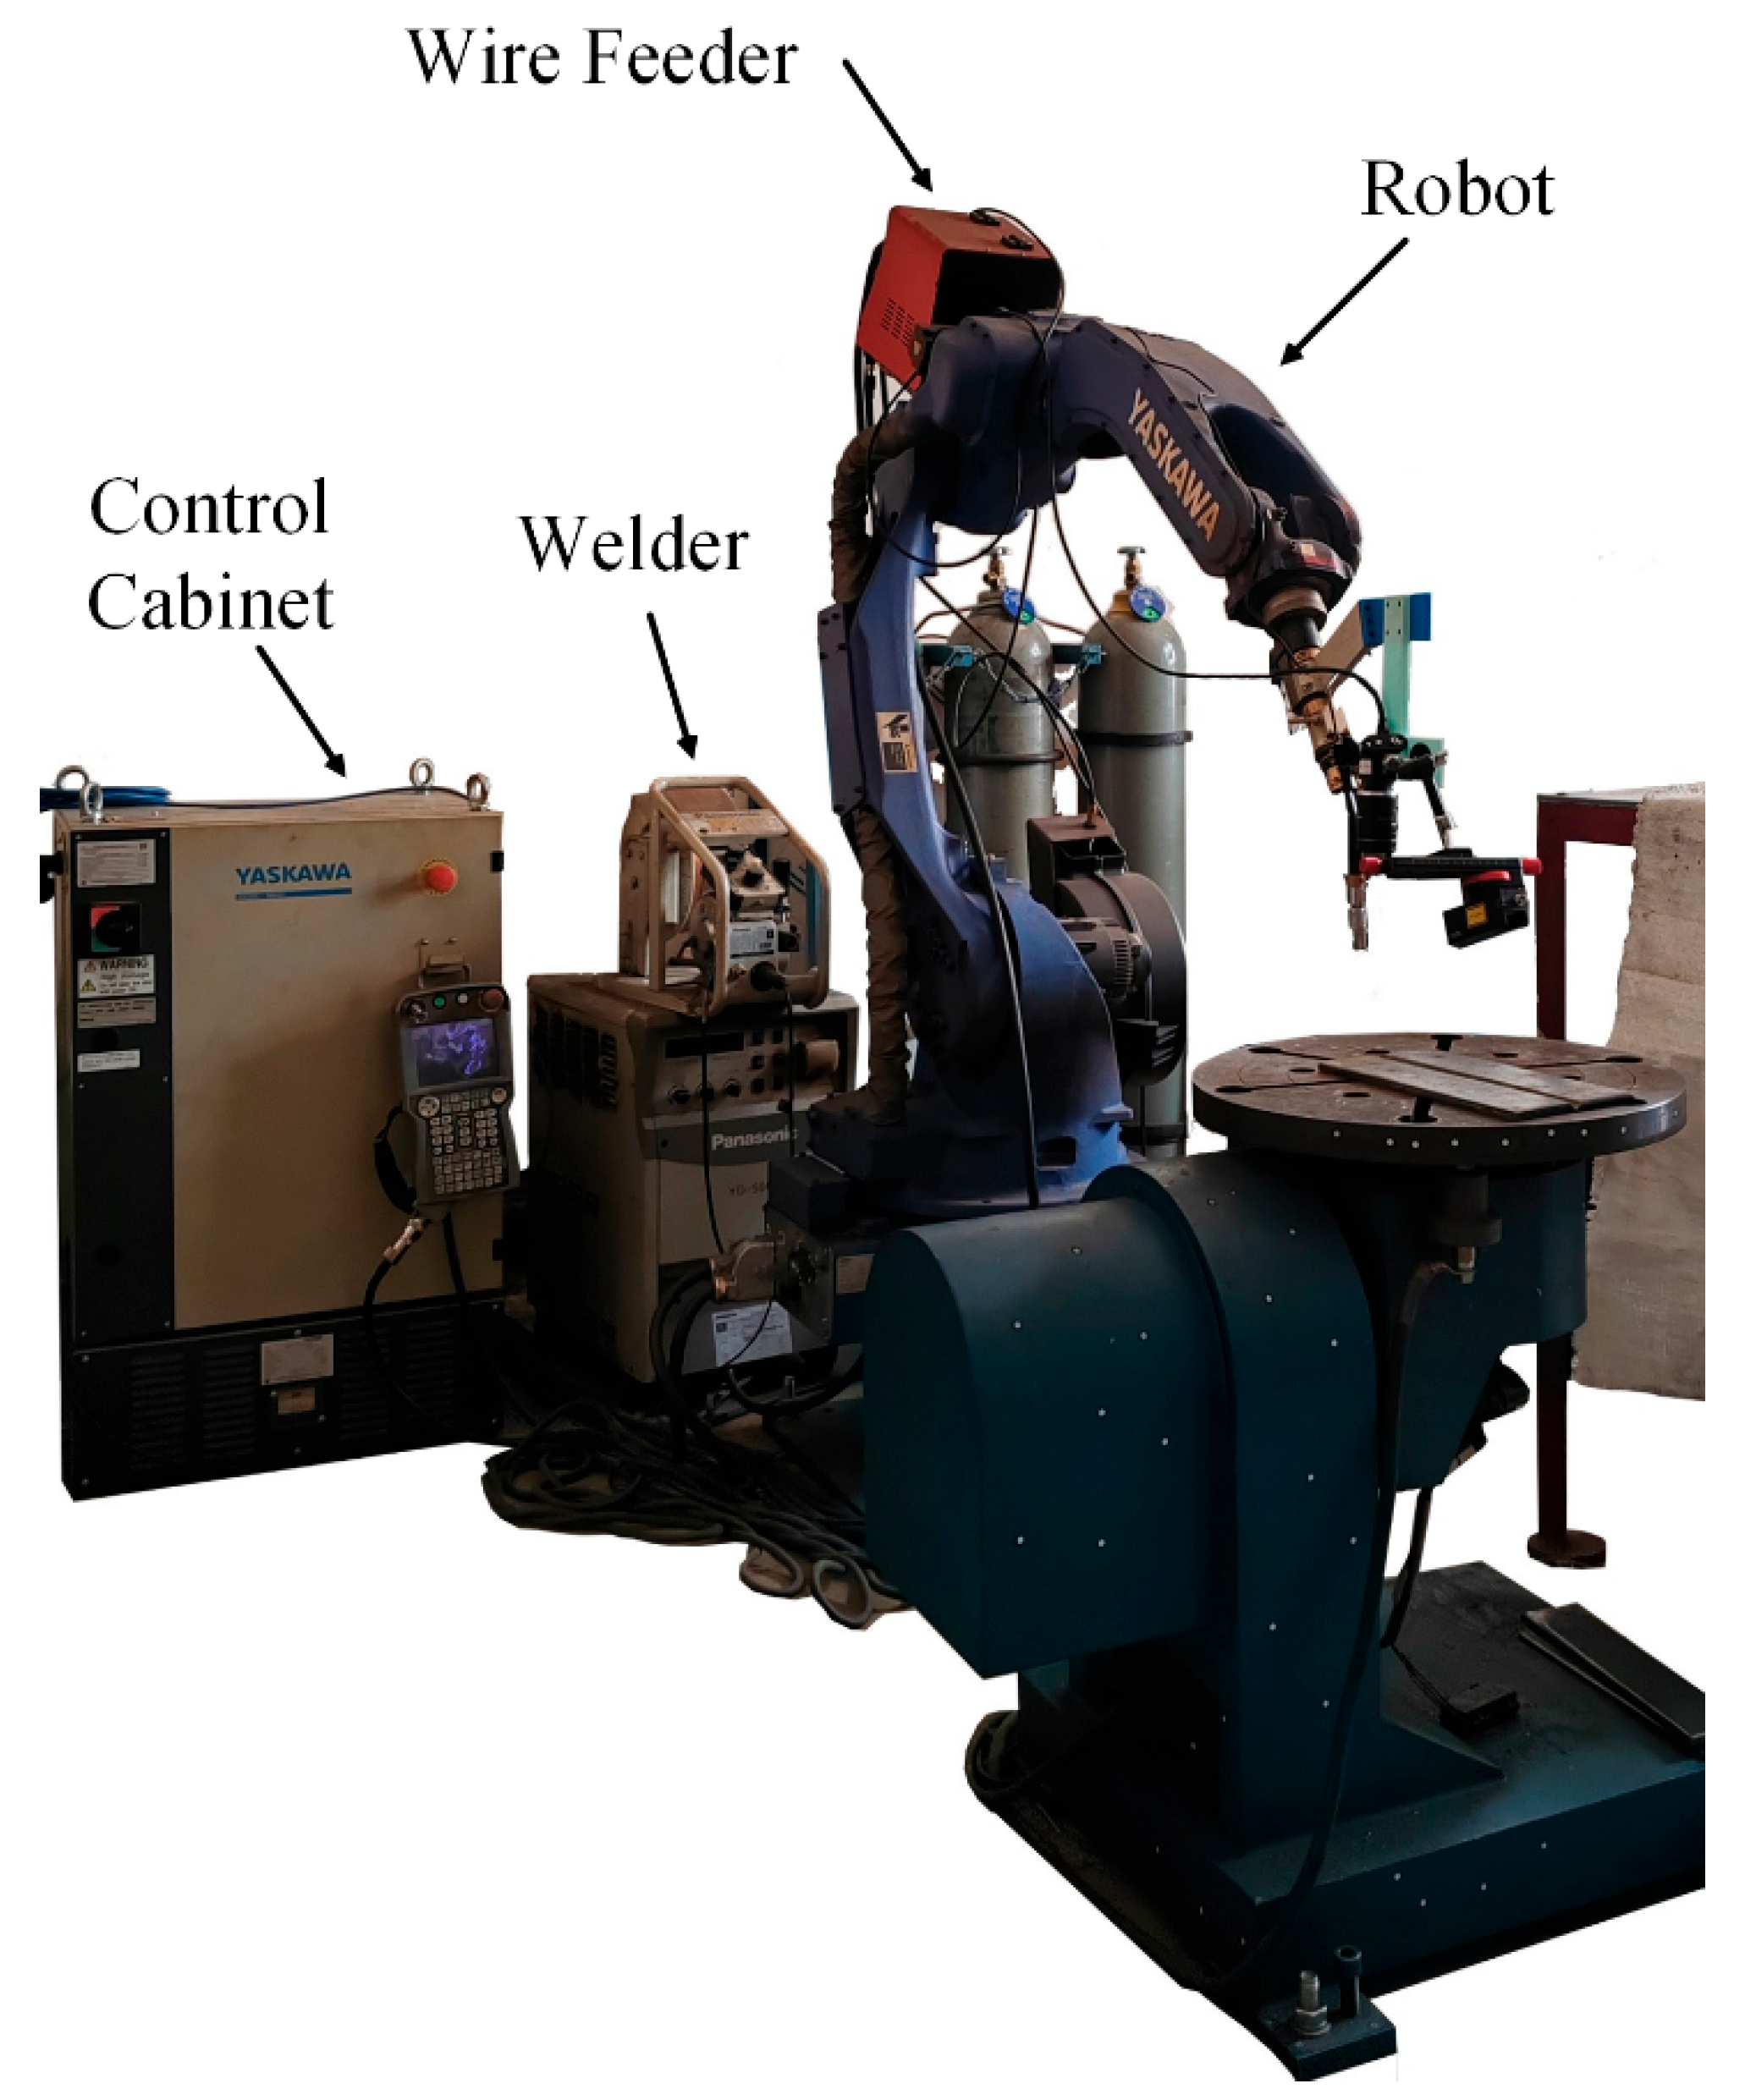
5. Experimental Setup
5.1. Deposition Experiment of the Spatial Equidistant-Height GMA Bead
The experimental system diagram is shown in Figure 14, which mainly consists of a 6-freedom welding robot, a welder, and a wire feeder. Table 4 presents the key parameters and models of the experimental equipment, covering the welder, robot manipulator, and shielding gas details to lay a clear foundation for understanding the experimental configuration.
Figure 14.
Experimental system.
Table 4.
Experimental Equipment Specifications.
How to obtain equidistant-height GMA bead on a spatial curved surface, and thus obtain a thickness controllable GMA deposition layer, is a necessary condition for curved layered GMA-AM to ensure forming accuracy. Since the formation of the spatial bead is influenced not only by the deposition parameters but also by the path inclination and path orientation angle, it is necessary to adjust the deposition parameters to control the formation height along the path on the curved surface in order to achieve the uniform height of the spatial bead.
For a planned spatial curved deposition path, the path direction angle, path inclination angle and deposition height at each position are known. Substituting them into the path height prediction regression Formula 3, a quadratic equation for deposition speed can be obtained. The solution within the process window is retained as the predicted value of deposition speed by solving the equation.
To verify the feasibility of using the above-mentioned deposition speed planning method, a cylindrical substrate with a diameter of 200 mm was used, and a bead was formed on it. The position and dimensions of the deposition bead are illustrated in Figure 15. The path inclination angle of the deposition bead from the arc on point to the arc off point changes from 0° to 45° and the path direction angle is always maintained at 90°.
Figure 15.
The position and dimensions of the curved deposition bead.
Evenly sample 50 points along the path, calculate the path inclination angle and path direction angle of each path point in sequence, set the height of the deposition bead to 2.0 mm, and use current and voltage of 100 A and 21.2 V. Determine the deposition speed for each bead point using the proposed speed planning methodology, and generate a robotic executable program. The planned deposition speed values are shown in Figure 16. It can be seen that as the path inclination angle increases, the planned deposition speed decreases. This is because at a path direction angle of 90°, for the same deposition speed, as the path inclination angle increases, the deposition bead’s height gradually decreases. By reducing the speed, the impact of the path inclination angle on the collapse of the bead can be mitigated. To make a comparison, a constant speed is used for deposition at the same position, serving as the control group for the experiment. The constant deposition speed is set as the average value of the speeds along the variable speed curve.
Figure 16.
Deposition speed planning of two schemes.
The actual bead formations from the two groups of experiment are shown in Figure 17. The GMA bead on the left was obtained using the variable-speed height control method, while the one on the right was produced with a constant-speed method. For better observation and comparison, 50 points along the path were evenly selected. The contours of each cross-sectional plane were obtained by slicing software, which is Cura 15.04 developed by Ultimaker in Geldermalsen, Netherlands. And their heights were extracted. The slicing positions are shown in Figure 18.
Figure 17.
Deposition bead appearance of two groups: (a) Forming morphology; (b) scanned model.
Figure 18.
Calculation of the sectional profile of the deposition bead: (a) cylindrical fitting; (b) intersection calculations.
The height distribution of the deposition path obtained by the two groups of the experiment is shown in Figure 19. As is well known, GMA deposition has the characteristics of high starting arc end and low arc off end. In order to avoid the impact of this characteristic on the test results, the height data of the path points between the middle stable No. 10–40 slices are selected for analysis. As can be seen from the figure, the height distribution of the path obtained by the constant speed scheme is in the range of [1.83, 2.26] and has an overall downward trend. In contrast, the height distribution obtained by the variable speed and height-control scheme is in the range of [1.94, 2.10] and basically maintains the set height of 2.0 mm, with no downward trend. Since arc welding is a quasi-steady-state process, even the height of the deposition bead on the horizontal plane will also fluctuate by about 0.1 mm under these constant deposition parameters. It can be considered that the welding speed planning method proposed in this section can accurately control the height of the spatially curved bead.
Figure 19.
Height distribution: (a) constant-speed scheme; (b) the variable-speed and height-control scheme.
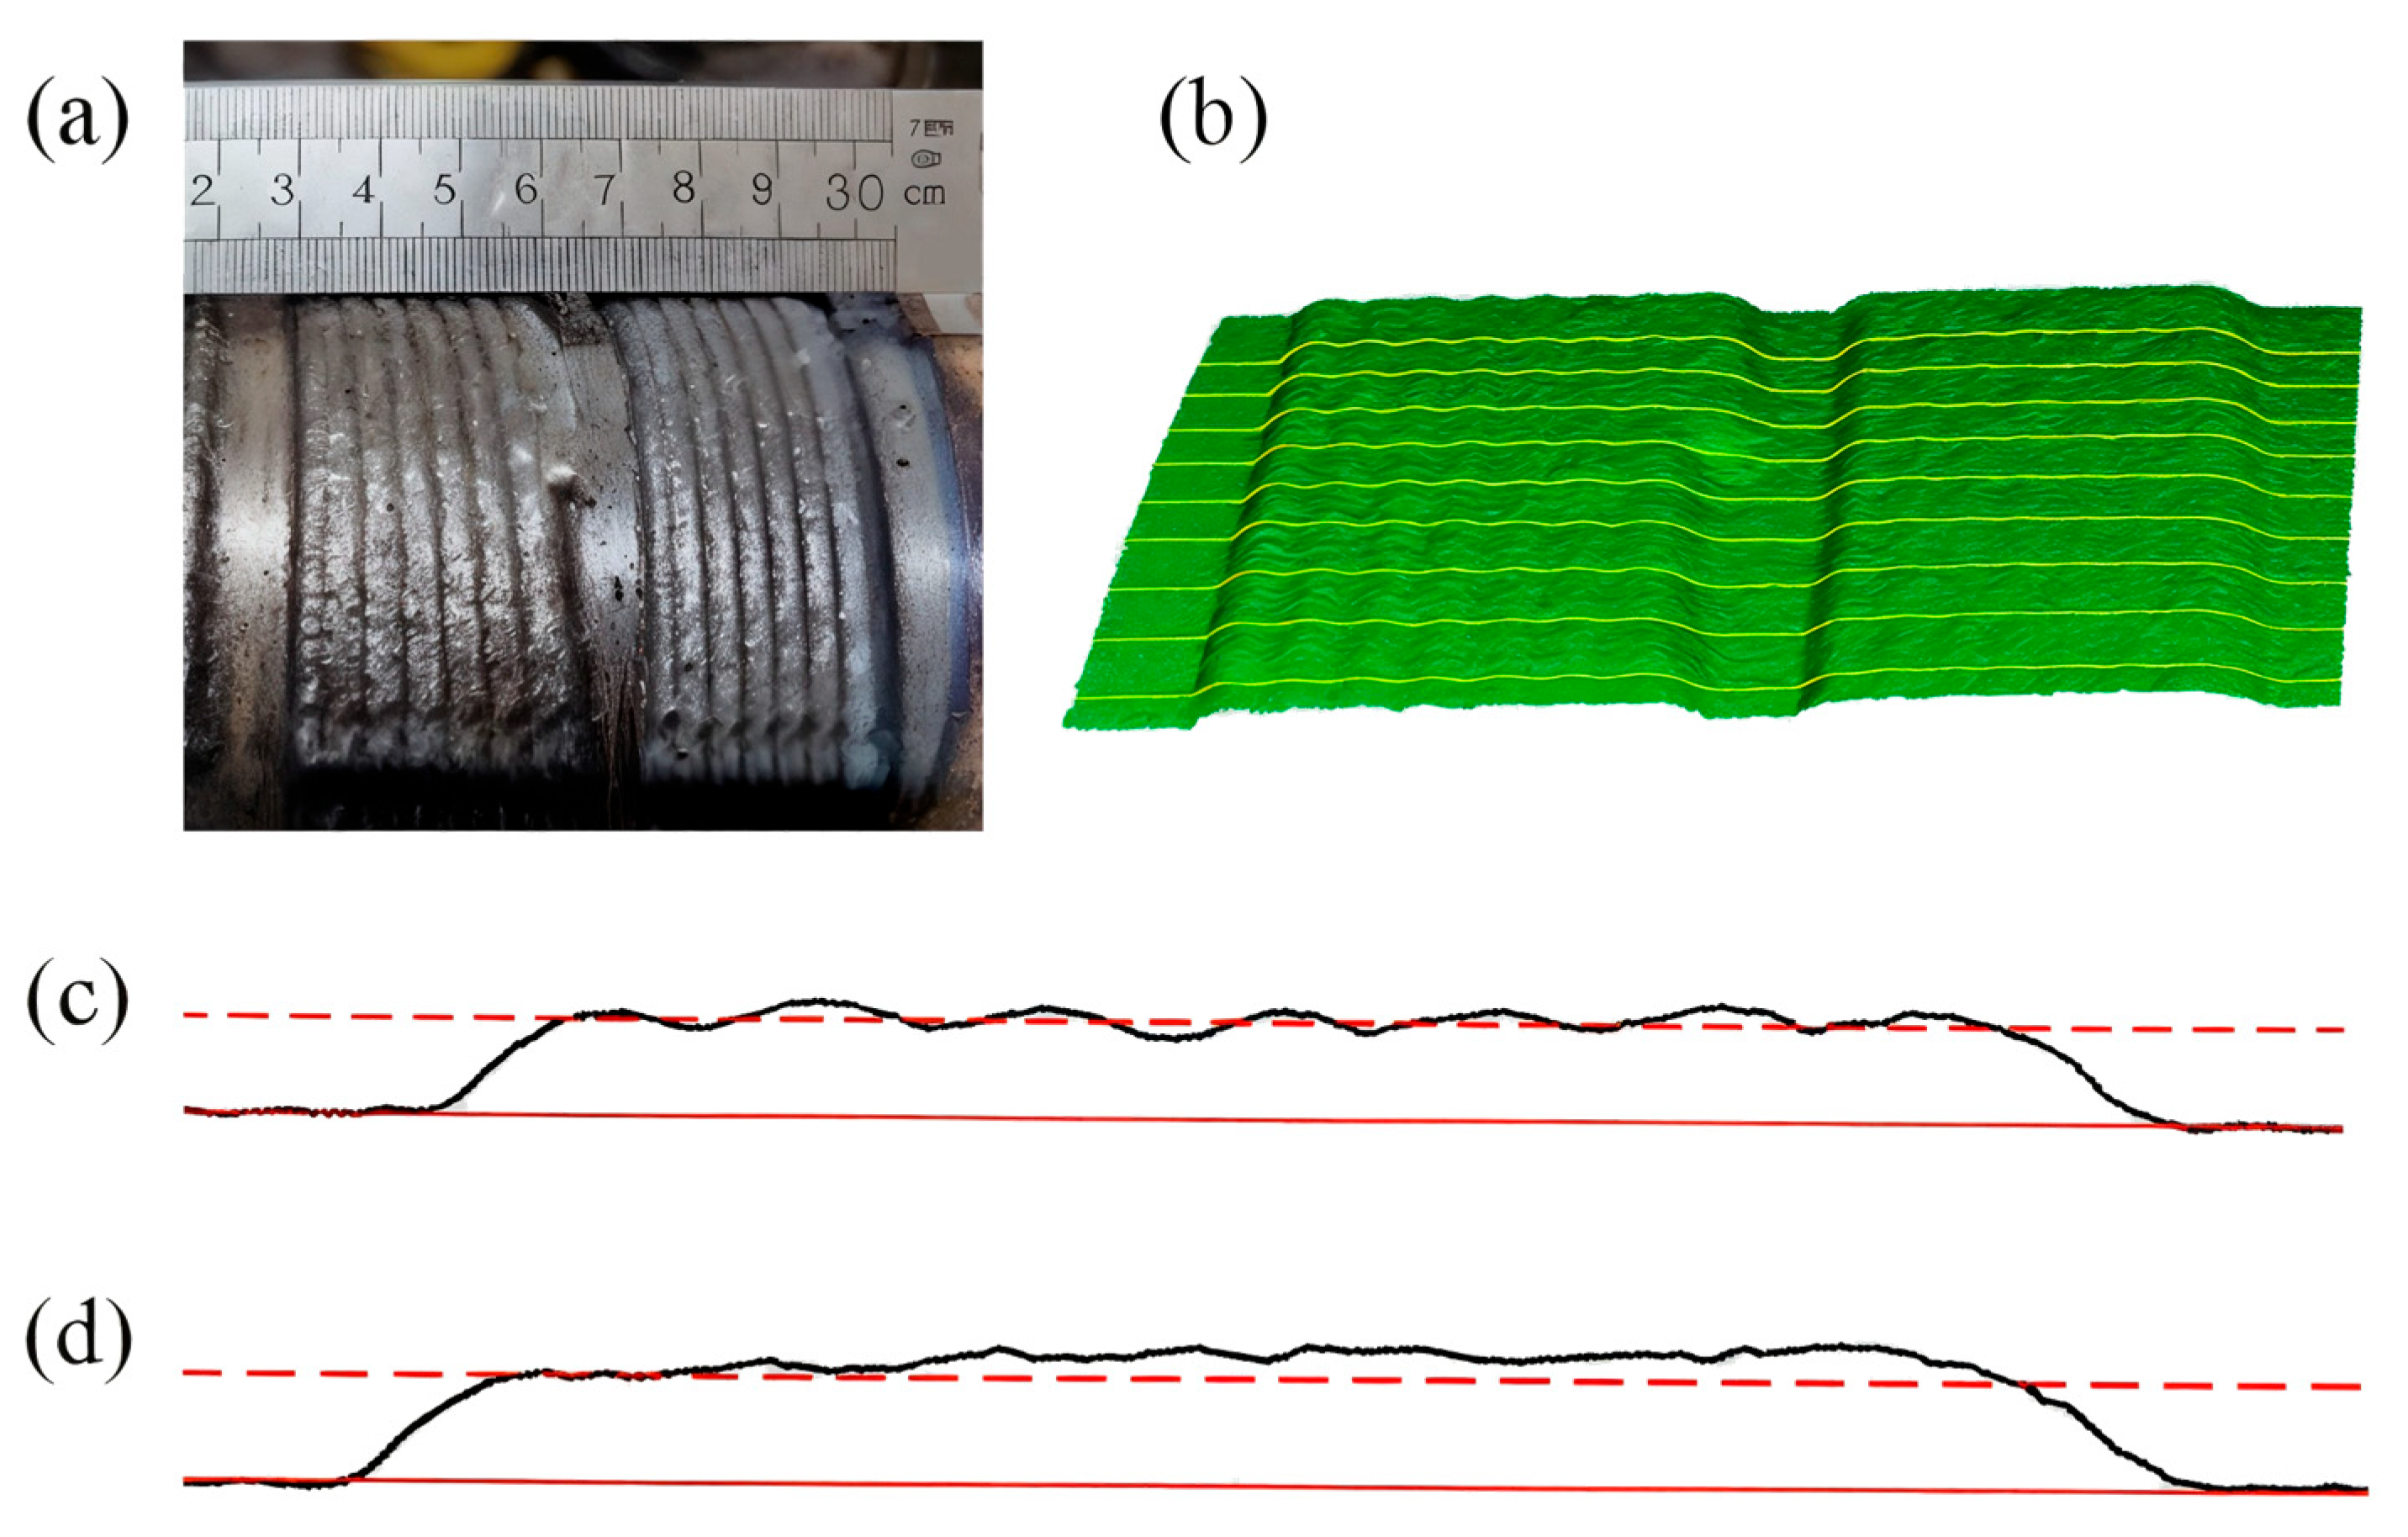
5.2. Deposition Experiment of the Equidistant-Thickness GMA Curved Layer
In order to obtain a well-overlapped and flattened GMA deposition layer on the curved surface and further verify the asymmetric cross-sectional overlapping strategy proposed in this paper, multiple beads deposition experiments were conducted on the cylindrical with a layer height set at 1.85 mm shown in Figure 20a.
Figure 20.
Curved surface for deposition and path planning: (a) curved surface; (b) varying spacing path planning; (c) equidistant spacing path planning.
From the experiments in the previous section, it can be seen that in order to ensure the height of the deposition bead, a lower deposition speed is often used when the path inclination angle is large to counteract the influence of gravity, but this will result in a larger bead width. This article adopts an iterative programming approach to dynamically plan the path and deposition speed. Firstly, specify an initial path on the surface and plan the deposition speed for each point on the path based on its path inclination angle, path direction angle, and set layer height, then predict the forming width and plumpness of the deposition channel. Based on the asymmetric cross-sectional overlapping model, the adjacent deposition bead’s positions are planned to obtain a new path. Repeat the above process until the planned deposition path covers the area on the curved surface that needs to be deposited, and the path planning result is shown in Figure 20b.
For comparison, an experiment was conducted using constant parameters and equidistant offset distance for path planning and deposition without considering the influence of spatial direction on forming. The path planning is shown in Figure 20c.
The forming morphology of the deposition layer obtained through the two-group experiment is shown in Figure 21a. In order to show the overlapped effect of the two kinds of path planning methods more intuitively, a morphological scan was performed. To avoid the influence of the GMA process characteristic, which often has the high arc on end and the low arc off end, the middle section of the deposition beads was selected for slicing, as shown in Figure 21b. The typical cross-sectional morphologies of the two deposition layers are shown in Figure 21c,d, respectively. It can be seen from the cross-section that the overlap effect of varying spacing path planning, which considers the forming characteristics of spatial deposition beads and uses an asymmetric cross-sectional overlapping strategy, is better with a uniform height distribution, while the height of the deposition layer gets by the equidistant path planning tends to gradually increase.
Figure 21.
Forming results (a) formed morphology; (b) scanning and slicing; (c) cross-section of varying spacing paths; (d) cross-section of equidistant paths.
The experimental results show that the spatial GMA deposition bead prediction model and asymmetric cross-sectional overlapping model established in this paper provide a solution for achieving equal thickness GMA deposition layers on the spatial curved surface without using a displacement machine
6. Conclusions
In this study, it is proposed to use two physical quantities, path inclination angle and path direction angle, to quantitatively describe the direction of the spatial deposition path, use five characteristics to describe the cross-sectional profile of the path and establish a piecewise polynomial fitting equation. Through full factor test and quadratic regression equation fitting, the relationship model between the deposition speed, the spatial direction of the deposition beam, and the five characteristic quantities of forming morphology are established. Finally, in order to obtain a flattened spatial curved deposition layer, an asymmetric cross-sectional overlapping strategy for the spatial bead is given, the following conclusions can be drawn specifically:
- (1)
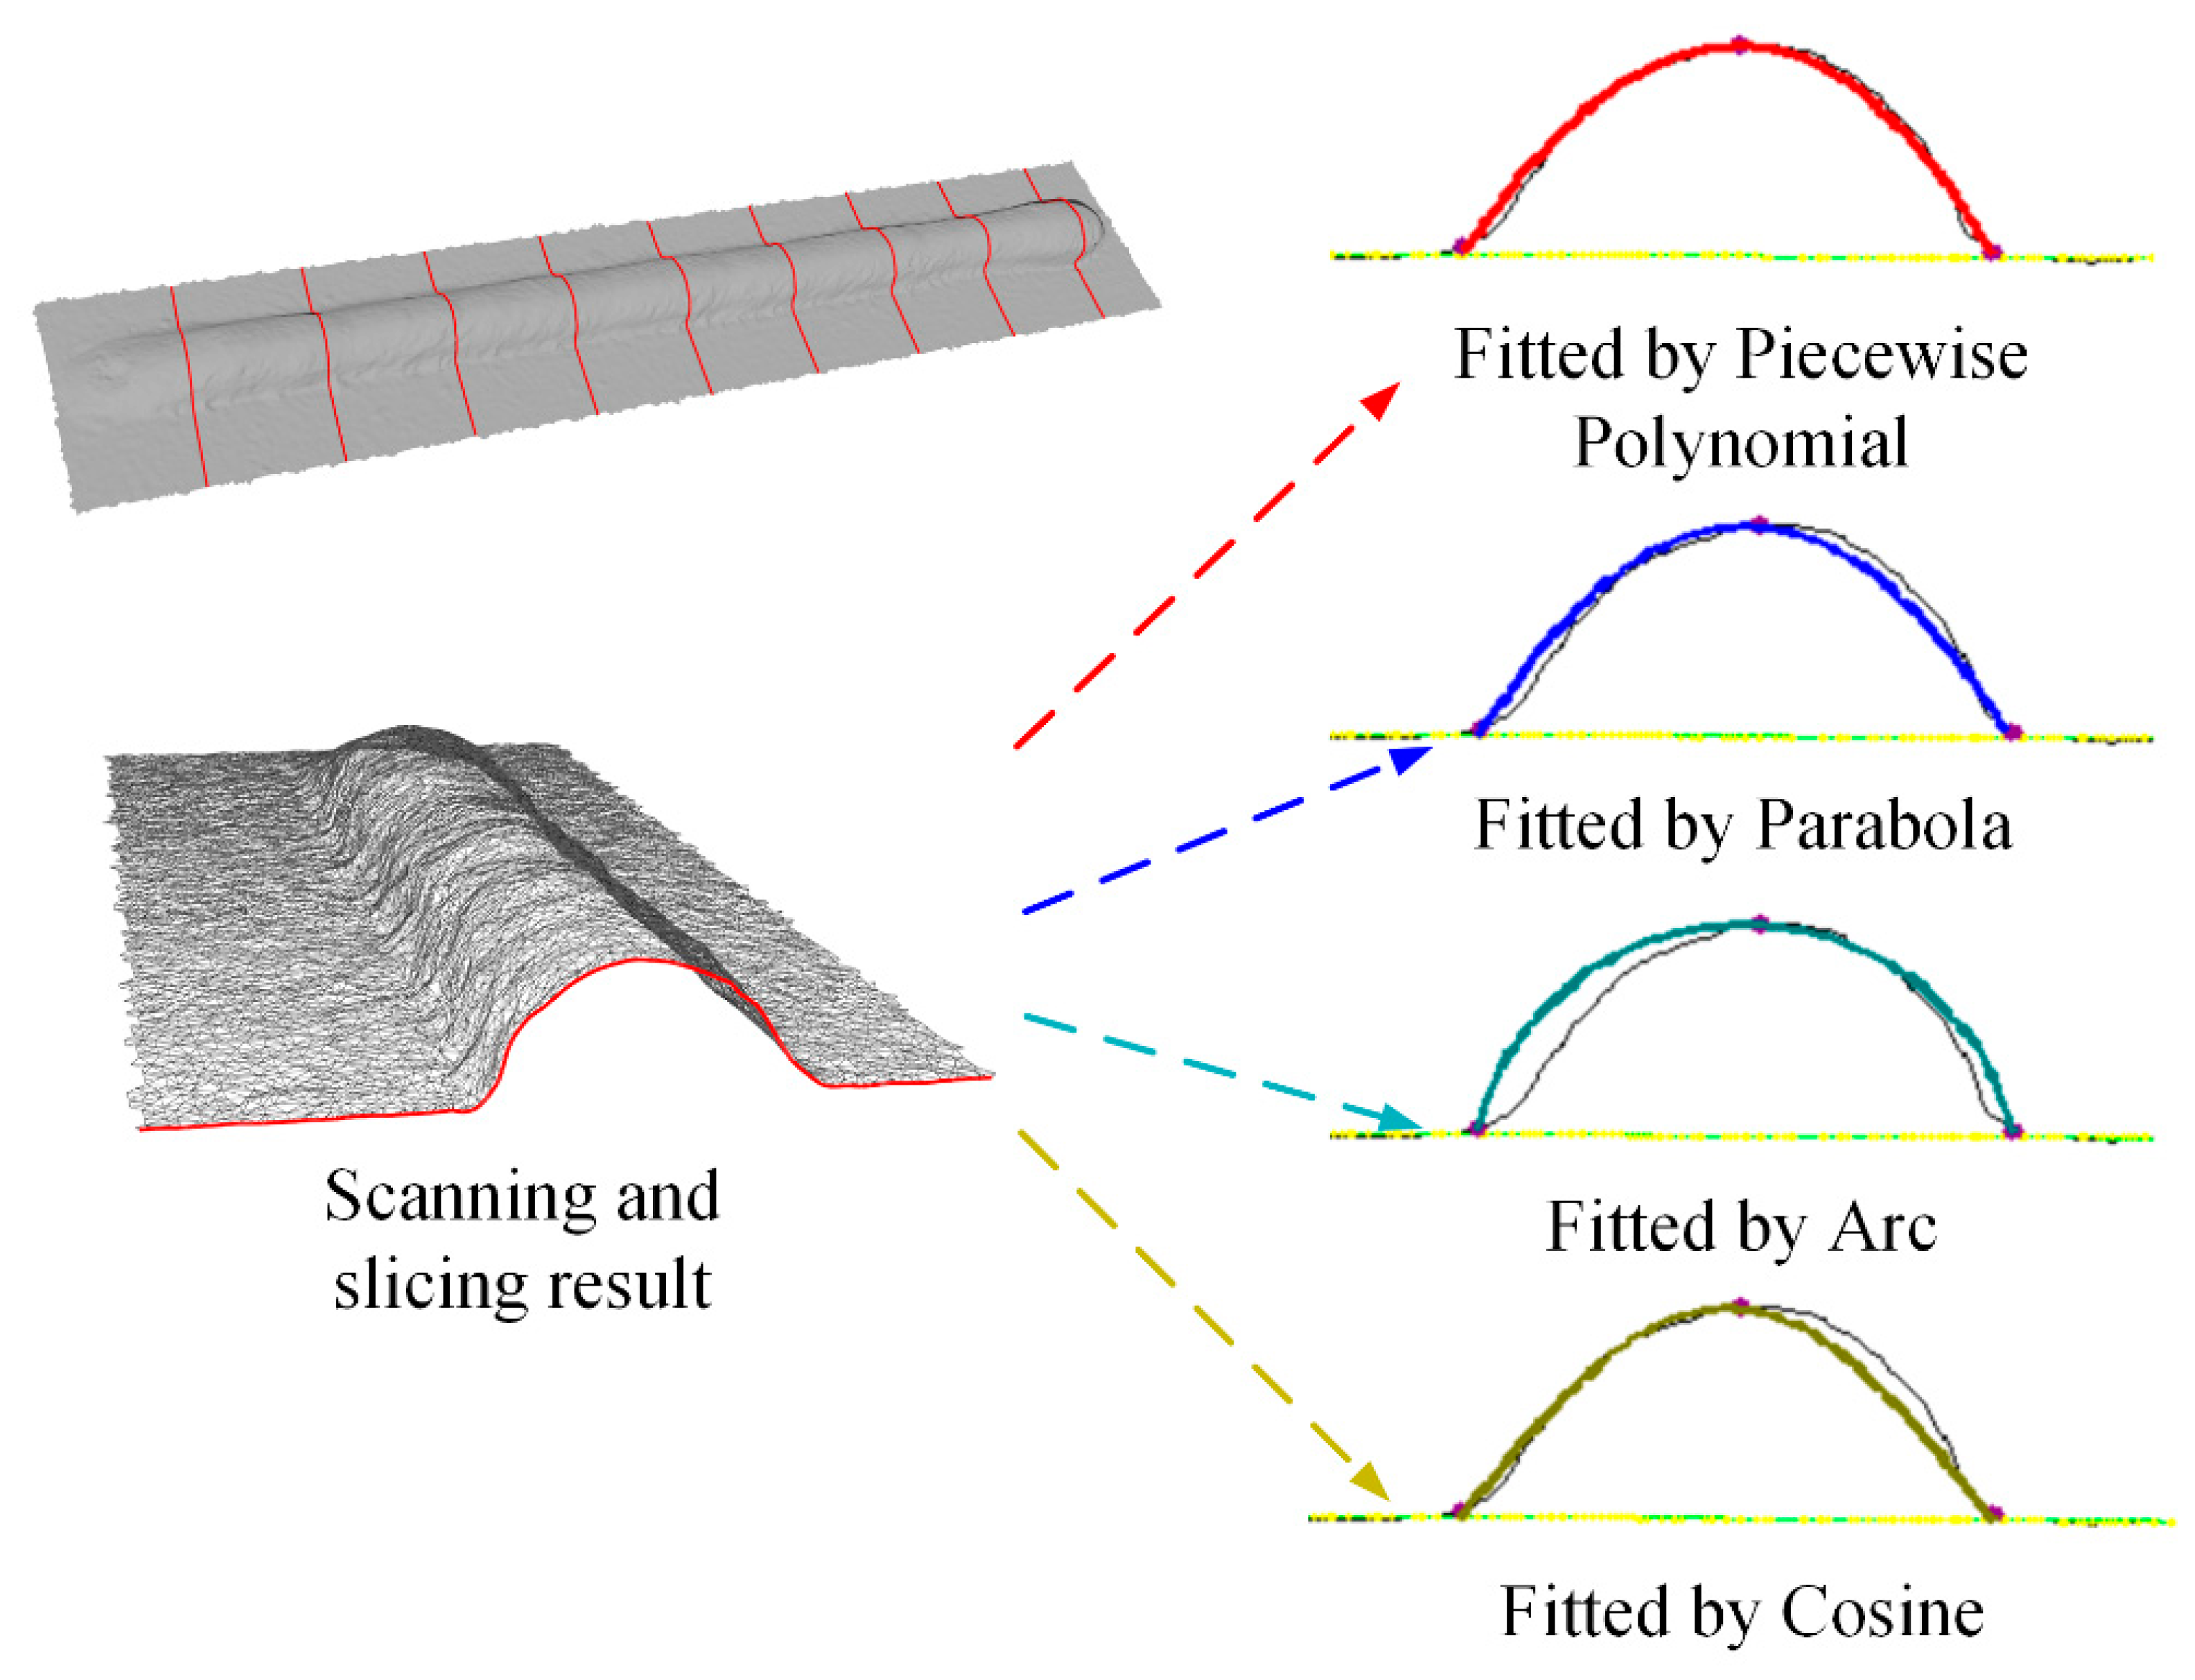
- Compared with the traditional contour fitting function, the piecewise polynomial proposed in this paper has better fitting accuracy for the asymmetric cladding channel section. The typical sections are fitted using piecewise polynomial fitting, parabola, arc, and cosine functions. The standard deviations obtained by comparing the fitting curve with the true contour are 0.16 mm, 0.21 mm, 0.44 mm, and 0.22 mm, respectively.
- (2)
- A prediction model for the geometric characteristics of the spatial bead was established. The R2 values of characteristics are all close to 1.0, and the mean relative deviations value fittings were within 2.5%; the fitting effect is good.
- (3)
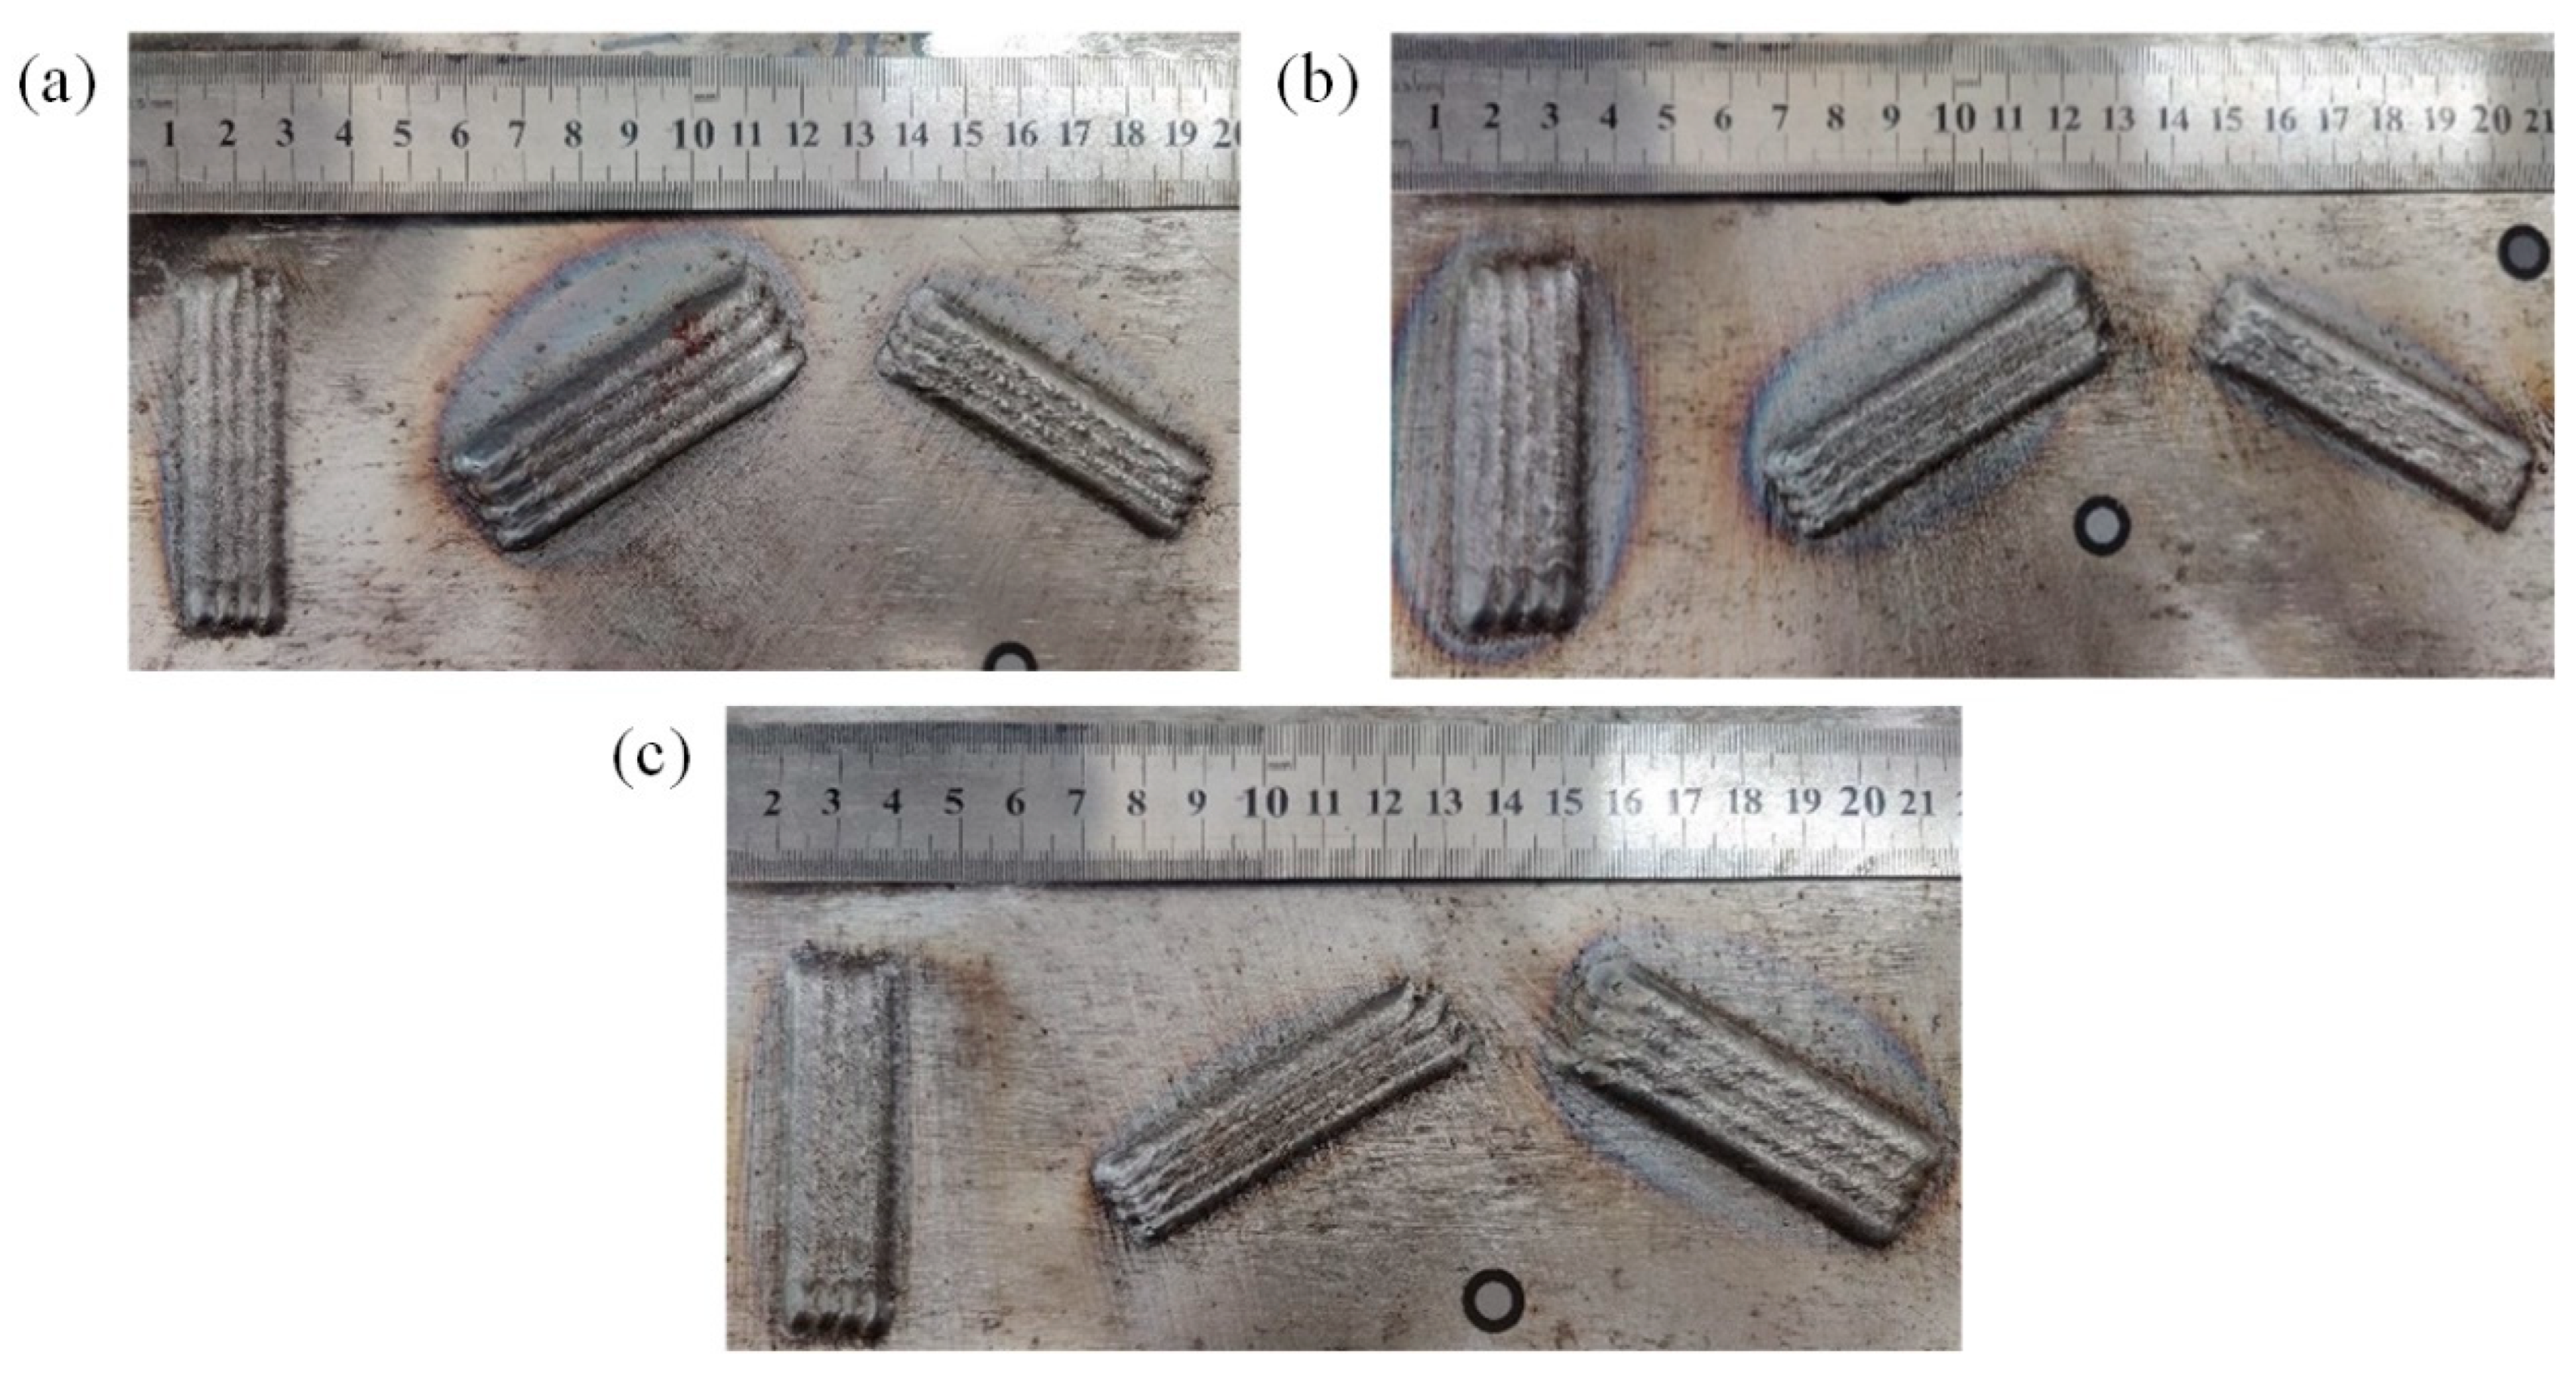
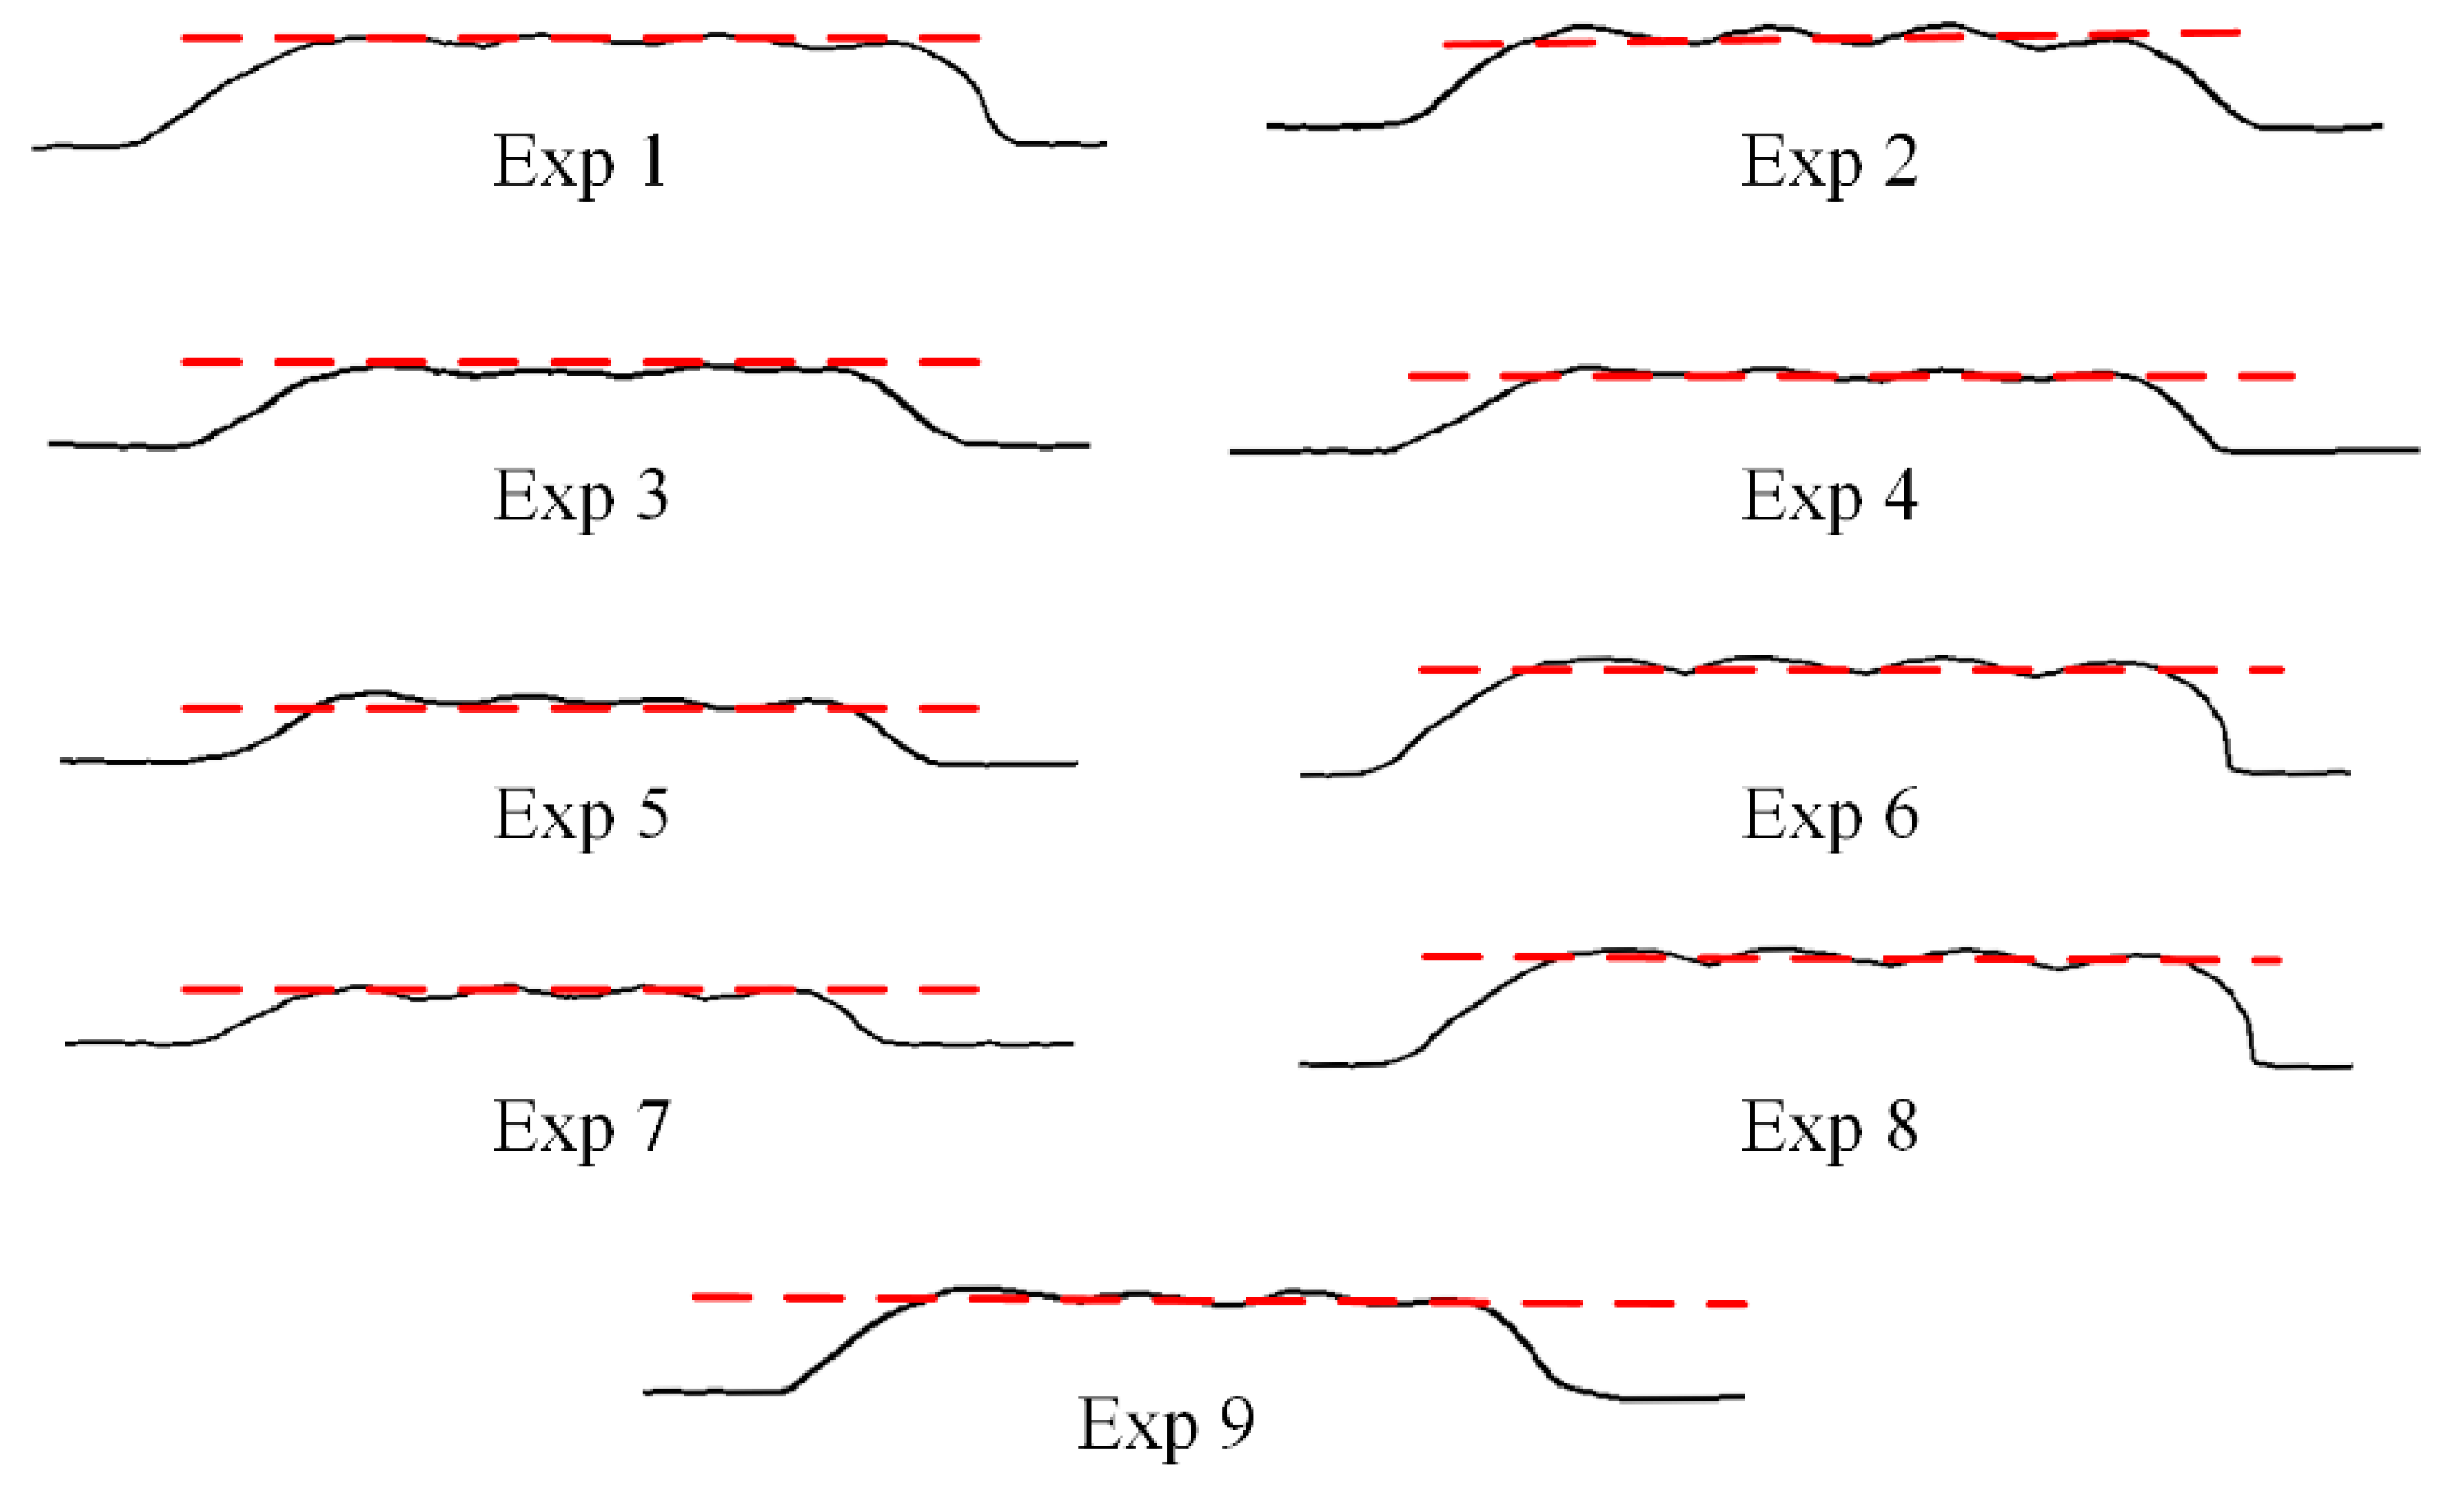
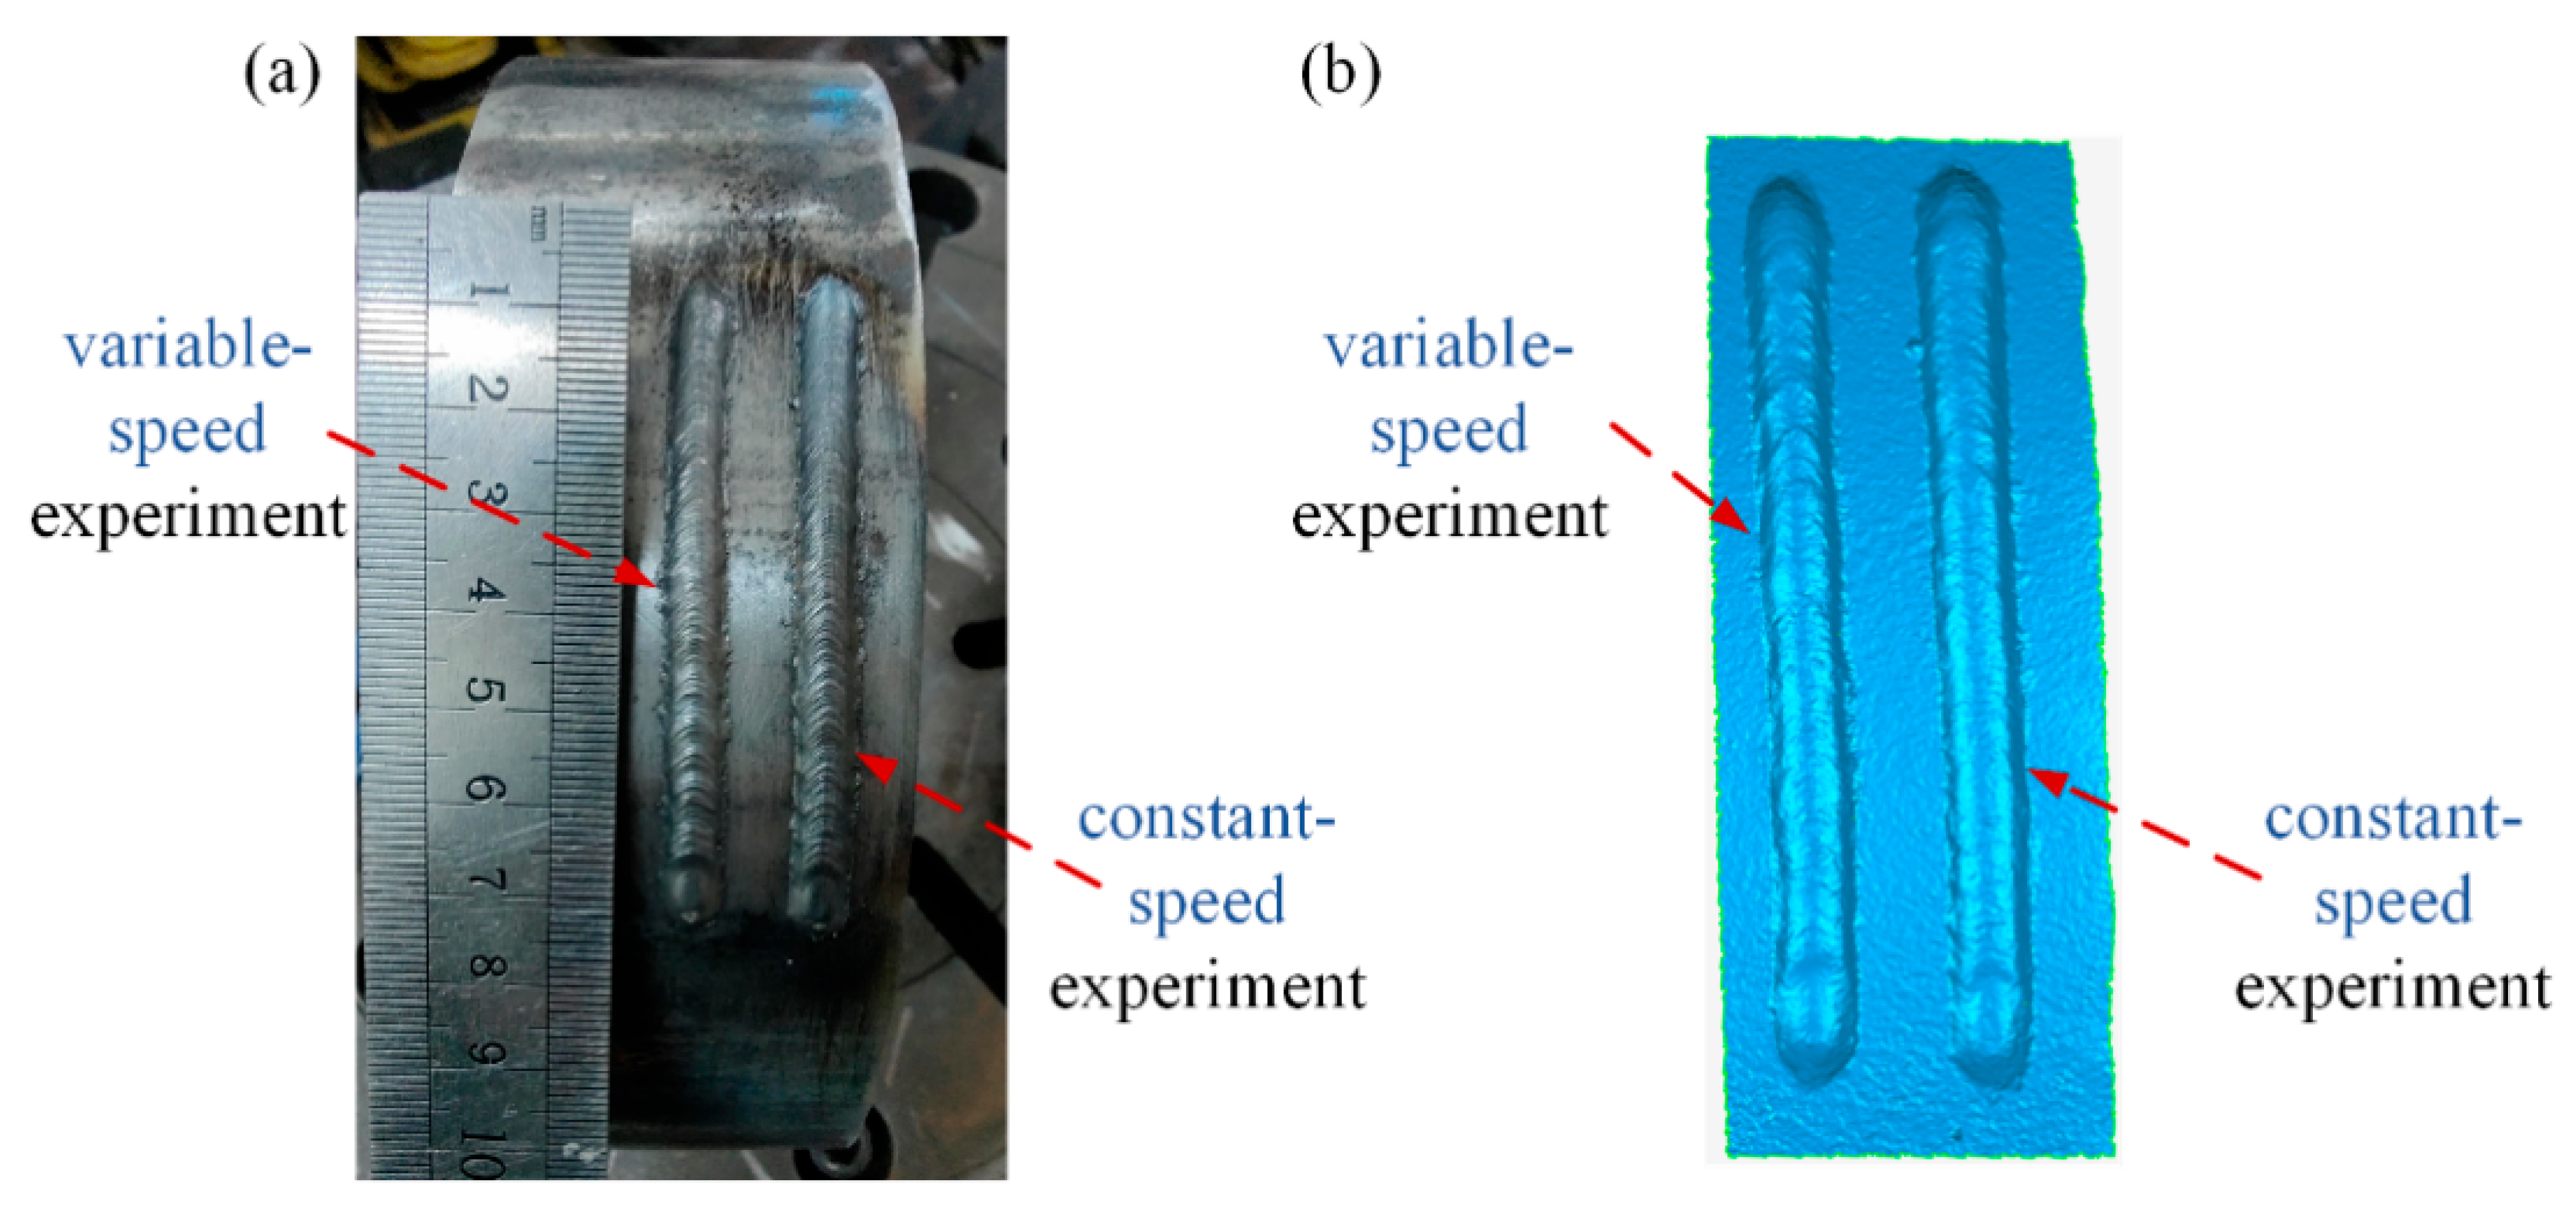
- A comparative verification test was carried out on a cylinder, and the result showed that by setting different deposition speeds, the height variation range of the obtained spatially curved GMA deposited bead (excluding the arc starting end and the arc ending end) is within 0.2 mm.
This study is limited by the number of experimental conditions considered and does not account for the effects of process parameters such as deposition current, deposition voltage, and the inclination angle of the welding torch on bead formation. These parameters exhibit complex coupling relationships, and their variations can significantly affect the metal transfer mode, potentially leading to abrupt changes in the morphology of the deposited bead. Capturing such nonlinear and coupled behavior may require more sophisticated mathematical models for accurate prediction. Furthermore, in defining the spatial trajectory of the deposition bead, the local substrate at each point along the path is idealized as a planar surface. While this assumption simplifies the modeling process, it may reduce prediction accuracy, particularly in cases involving irregular substrates with highly variable curvature.
Future research can expand the experimental quantity by designing automatic testing equipment or using simulation methods while integrating advanced deep learning models such as GAN and PointNet++ to predict the three-dimensional morphology of the deposition bead and establish a more accurate and comprehensive GMA spatially curved deposition bead prediction model and parameter planning method that considers all important influencing factors.
Author Contributions
Methodology, X.L., Y.L. and G.Z.; Software, X.L.; Validation, G.C.; Formal analysis, H.Y.; Investigation, X.L.; Data curation, G.C.; Writing—original draft, G.Z.; Writing—review & editing, G.Z. All authors have read and agreed to the published version of the manuscript.
Funding
This work is financially supported by the Heilongjiang Postdoctoral Funded Project under Grant No. LHB-Z23159, the National Key R&D Program No. 2024YFB4709401, the State Key Laboratory of Advanced Welding and Joining Independent Funded Project and the National Natural Science Foundations of China (NSFC) under Grant 52075121.
Data Availability Statement
The data that support the findings of this study are available from the corresponding author upon reasonable request.
Conflicts of Interest
The authors declare no conflict of interest.
Appendix A
Table A1.
Experimental data.
Table A1.
Experimental data.
| No. | ai (°) | ad (°) | s (mm/s) | h (mm) | w (mm) | e | pu (%) | pd (%) | Morphology |
|---|---|---|---|---|---|---|---|---|---|
| 1 | 0 | 0 | 4 | 2.86 | 6.81 | 0.503 | 68.15 | 69.89 | ![]() |
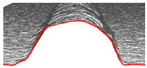
| 2 | 0 | 0 | 6 | 2.27 | 5.84 | 0.508 | 65.06 | 67.32 | ![]() |
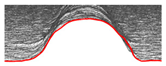
| 3 | 0 | 0 | 8 | 1.87 | 5.77 | 0.508 | 62.03 | 62.46 | ![]() ![]() |
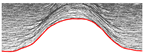
| 4 | 0 | 0 | 10 | 1.64 | 5.40 | 0.499 | 60.96 | 60.68 | ![]() |
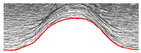
| 5 | 15 | 0 | 4 | 2.73 | 7.13 | 0.520 | 66.47 | 71.93 | ![]() |
| 6 | 15 | 0 | 6 | 2.10 | 6.39 | 0.518 | 64.36 | 69.26 | ![]() |
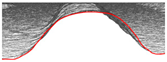
| 7 | 15 | 0 | 8 | 1.71 | 6.05 | 0.509 | 63.34 | 65.68 | ![]() |
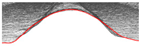
| 8 | 15 | 0 | 10 | 1.49 | 5.60 | 0.498 | 62.61 | 62.39 | ![]() |
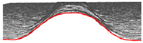
| 9 | 15 | 30 | 4 | 2.73 | 7.22 | 0.527 | 65.56 | 72.96 | ![]() |
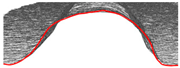
| 10 | 15 | 30 | 6 | 2.07 | 6.61 | 0.516 | 64.23 | 68.56 | ![]() |
| 11 | 15 | 30 | 8 | 1.73 | 6.40 | 0.522 | 60.10 | 65.53 | ![]() |
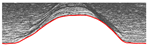
| 12 | 15 | 30 | 10 | 1.50 | 5.93 | 0.513 | 59.20 | 62.38 | ![]() |
| 13 | 15 | 60 | 4 | 2.80 | 6.92 | 0.533 | 66.10 | 75.41 | ![]() |
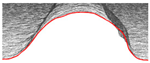
| 14 | 15 | 60 | 6 | 2.13 | 6.31 | 0.518 | 64.18 | 69.05 | ![]() |
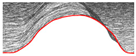
| 15 | 15 | 60 | 8 | 1.73 | 6.16 | 0.520 | 60.12 | 64.99 | ![]() |
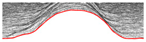
| 16 | 15 | 60 | 10 | 1.48 | 5.85 | 0.513 | 60.38 | 63.71 | ![]() |
| 17 | 15 | 90 | 4 | 2.74 | 6.99 | 0.520 | 66.15 | 71.68 | ![]() |
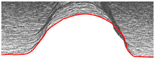
| 18 | 15 | 90 | 6 | 2.09 | 6.73 | 0.509 | 61.37 | 63.56 | ![]() |
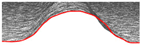
| 19 | 15 | 90 | 8 | 1.72 | 6.45 | 0.515 | 57.50 | 61.17 | ![]() |
| 20 | 15 | 90 | 10 | 1.45 | 5.92 | 0.511 | 57.85 | 60.42 | ![]() |
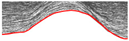
| 21 | 15 | 120 | 4 | 2.83 | 7.17 | 0.519 | 64.41 | 69.44 | ![]() |
| 22 | 15 | 120 | 6 | 2.13 | 6.98 | 0.517 | 58.67 | 62.86 | ![]() |
| 23 | 15 | 120 | 8 | 1.75 | 6.51 | 0.514 | 57.06 | 60.40 | ![]() |
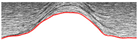
| 24 | 15 | 120 | 10 | 1.55 | 6.10 | 0.517 | 55.05 | 59.01 | ![]() |
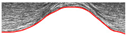
| 25 | 30 | 0 | 4 | 2.69 | 7.18 | 0.516 | 67.56 | 72.04 | ![]() |
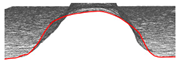
| 26 | 30 | 0 | 6 | 1.99 | 6.76 | 0.517 | 64.22 | 68.73 | ![]() |
| 27 | 30 | 0 | 8 | 1.62 | 6.47 | 0.518 | 62.06 | 66.78 | ![]() |
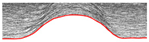
| 28 | 30 | 0 | 10 | 1.36 | 6.11 | 0.507 | 62.01 | 63.88 | ![]() |
| 29 | 30 | 30 | 4 | 2.70 | 7.31 | 0.528 | 65.52 | 73.47 | ![]() |
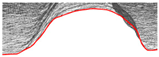
| 30 | 30 | 30 | 6 | 1.99 | 6.88 | 0.524 | 63.98 | 70.29 | ![]() |
| 31 | 30 | 30 | 8 | 1.62 | 6.45 | 0.515 | 62.51 | 66.45 | ![]() |
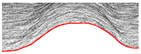
| 32 | 30 | 30 | 10 | 1.37 | 6.04 | 0.507 | 63.30 | 65.19 | ![]() |
| 33 | 30 | 60 | 4 | 2.79 | 6.94 | 0.538 | 64.87 | 75.76 | ![]() |
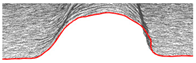
| 34 | 30 | 60 | 6 | 2.09 | 6.84 | 0.532 | 60.06 | 68.21 | ![]() |
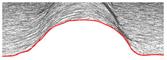
| 35 | 30 | 60 | 8 | 1.69 | 6.30 | 0.518 | 60.85 | 65.46 | ![]() |
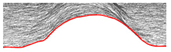
| 36 | 30 | 60 | 10 | 1.40 | 6.14 | 0.516 | 59.465 | 63.586 | ![]() |
| 37 | 30 | 90 | 4 | 2.84 | 7.23 | 0.539 | 60.53 | 70.92 | ![]() |
| 38 | 30 | 90 | 6 | 2.13 | 6.99 | 0.528 | 57.36 | 64.15 | ![]() |
| 39 | 30 | 90 | 8 | 1.74 | 6.38 | 0.527 | 57.3054 | 64.0814 | ![]() |
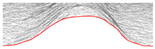
| 40 | 30 | 90 | 10 | 1.47 | 5.93 | 0.522 | 57.46 | 62.74 | ![]() |
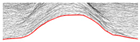
| 41 | 30 | 120 | 4 | 2.88 | 6.93 | 0.528 | 64.68 | 72.4 | ![]() |
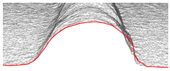
| 42 | 30 | 120 | 6 | 2.20 | 6.72 | 0.528 | 56.56 | 63.30 | ![]() |
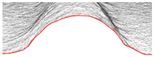
| 43 | 30 | 120 | 8 | 1.82 | 6.36 | 0.515 | 56.26 | 59.77 | ![]() |
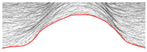
| 44 | 30 | 120 | 10 | 1.55 | 5.79 | 0.517 | 56.11 | 60.05 | ![]() |
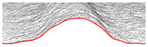
| 45 | 45 | 0 | 4 | 2.59 | 7.57 | 0.512 | 71.08 | 74.50 | ![]() |
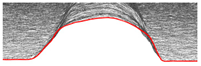
| 46 | 45 | 0 | 6 | 1.94 | 6.93 | 0.506 | 67.60 | 69.20 | ![]() |
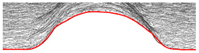
| 47 | 45 | 0 | 8 | 1.55 | 6.50 | 0.509 | 66.74 | 69.01 | ![]() |
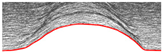
| 48 | 45 | 0 | 10 | 1.31 | 6.24 | 0.507 | 63.84 | 68.41 | ![]() |
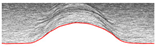
| 49 | 45 | 30 | 4 | 2.62 | 7.63 | 0.536 | 65.71 | 76.06 | ![]() |
| 50 | 45 | 30 | 6 | 1.99 | 7.06 | 0.523 | 64.20 | 70.30 | ![]() |
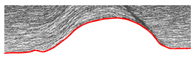
| 51 | 45 | 30 | 8 | 1.54 | 6.49 | 0.515 | 65.21 | 69.18 | ![]() |
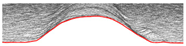
| 52 | 45 | 30 | 10 | 1.32 | 5.99 | 0.526 | 61.89 | 68.55 | ![]() |
| 53 | 45 | 60 | 4 | 2.75 | 7.11 | 0.552 | 63.62 | 78.24 | ![]() |
| 54 | 45 | 60 | 6 | 2.07 | 6.61 | 0.542 | 60.92 | 72.07 | ![]() |
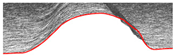
| 55 | 45 | 60 | 8 | 1.67 | 6.46 | 0.532 | 59.29 | 67.31 | ![]() |
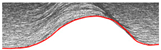
| 56 | 45 | 60 | 10 | 1.41 | 6.09 | 0.529 | 58.89 | 66.27 | ![]() |
| 57 | 45 | 90 | 4 | 2.87 | 7.09 | 0.556 | 61.22 | 76.77 | ![]() |
| 58 | 45 | 90 | 6 | 2.15 | 6.88 | 0.535 | 57.91 | 66.62 | ![]() |
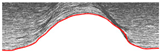
| 59 | 45 | 90 | 8 | 1.75 | 6.61 | 0.526 | 56.21 | 62.31 | ![]() |
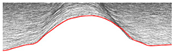
| 60 | 45 | 90 | 10 | 1.51 | 6.05 | 0.531 | 56.28 | 63.88 | ![]() |
| 61 | 45 | 120 | 4 | 3.05 | 6.83 | 0.557 | 59.41 | 74.73 | ![]() |
| 62 | 45 | 120 | 6 | 2.31 | 6.72 | 0.529 | 55.77 | 62.68 | ![]() |
| 63 | 45 | 120 | 8 | 1.93 | 6.43 | 0.518 | 53.27 | 57.34 | ![]() |
| 64 | 45 | 120 | 10 | 1.65 | 5.77 | 0.510 | 56.03 | 58.41 | ![]() |
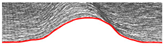
References
- Islam, M.K.; Hazell, P.J.; Escobedo, J.P.; Wang, H. Biomimetic armour design strategies for additive manufacturing: A review. Mater. Des. 2021, 205, 109730. [Google Scholar] [CrossRef]
- Ge, T.; Li, Y.; Gao, D.; Yang, C.; Li, F. Hybridizing additive manufacturing and sheet forming process to manufacture complex components with multi-features: A review. J. Manuf. Process. 2024, 124, 345–364. [Google Scholar] [CrossRef]
- Ye, J.; El Desouky, A.; Elwany, A. On the applications of additive manufacturing in semiconductor manufacturing equipment. J. Manuf. Process. 2024, 124, 1065–1079. [Google Scholar] [CrossRef]
- Tanwar, R.S.; Jhavar, S. Ti based alloys for aerospace and biomedical applications fabricated through wire+ arc additive manufacturing (WAAM). Mater. Today Proc. 2024, 98, 226–232. [Google Scholar] [CrossRef]
- Cano-Vicent, A.; Tambuwala, M.M.; Hassan, S.S.; Barh, D.; Aljabali, A.A.; Birkett, M.; Arjunan, A.; Serrano-Aroca, Á. Fused deposition modelling: Current status, methodology, applications and future prospects. Addit. Manuf. 2021, 47, 102378. [Google Scholar] [CrossRef]
- Elser, A.; Königs, M.; Verl, A.; Servos, M. On achieving accuracy and efficiency in Additive Manufacturing: Requirements on a hybrid CAM system. Procedia CIRP 2018, 72, 1512–1517. [Google Scholar] [CrossRef]
- Mansor, M.S.M.; Raja, S.; Yusof, F.; Muhamad, M.R.; Manurung, Y.H.; Adenan, M.S.; Hussein, N.I.S.; Ren, J. Integrated approach to Wire Arc Additive Manufacturing (WAAM) optimization: Harnessing the synergy of process parameters and deposition strategies. J. Mater. Res. Technol. 2024, 30, 2478–2499. [Google Scholar] [CrossRef]
- López-Arrabal, A.; Guzmán-Bautista, Á.; Solórzano-Requejo, W.; Franco-Martínez, F.; Villaverde, M. Axisymmetric non-planar slicing and path planning strategy for robot-based additive manufacturing. Mater. Des. 2024, 241, 112915. [Google Scholar] [CrossRef]
- Lau, T.Y.; Chen, L.; He, D.; Li, Z.; Tang, K. Partition-based print sequence planning and adaptive slicing for scalar field-based multi-axis additive manufacturing. Comput. -Aided Des. 2023, 163, 103576. [Google Scholar] [CrossRef]
- Luo, R.C.; Tzou, J.H. Implementation of a new adaptive slicing algorithm for the rapid prototyping manufacturing system. IEEE/ASME Trans. Mechatron. 2004, 9, 593–600. [Google Scholar] [CrossRef]
- Zhang, K.; Li, D.; Gui, H.; Li, Z. An adaptive slicing algorithm for laser cladding remanufacturing of complex components. Int. J. Adv. Manuf. Technol. 2019, 101, 2873–2887. [Google Scholar] [CrossRef]
- Chen, Q.; Xu, J.; Zhang, S. Cylindricity and flatness optimization for mechanical parts in additive manufacturing based on tolerance adaptive slicing. Int. J. Adv. Manuf. Technol. 2021, 115, 3839–3857. [Google Scholar] [CrossRef]
- Pérez-Castillo, J.L.; Cuan-Urquizo, E.; Roman-Flores, A.; Olvera-Silva, O.; Romero-Muñoz, V.; Gómez-Espinosa, A.; Ahmad, R. Curved layered fused filament fabrication: An overview. Addit. Manuf. 2021, 47, 102354. [Google Scholar] [CrossRef]
- Li, Y.; Xiong, J.; Yin, Z. Molten pool stability of thin-wall parts in robotic GMA-based additive manufacturing with various position depositions. Robot. Comput. -Integr. Manuf. 2019, 56, 1–11. [Google Scholar] [CrossRef]
- Liu, H.; Wang, S.; Chen, H.; Xiong, J. Drop and hump behaviors in robotic arc-directed energy deposition with vertical position. Addit. Manuf. 2024, 82, 104049. [Google Scholar] [CrossRef]
- Kazanas, P.; Deherkar, P.; Almeida, P.; Lockett, H.; Williams, S. Fabrication of geometrical features using wire and arc additive manufacture. Proc. Inst. Mech. Eng. Part B J. Eng. Manuf. 2012, 226, 1042–1051. [Google Scholar] [CrossRef]
- Aiyiti, W.; Zhao, W.; Lu, B.; Tang, Y. Investigation of the Overlapping Parameters of MPAW-based Rapid Prototyping. Rapid Prototyp. J. 2006, 12, 165–172. [Google Scholar] [CrossRef]
- Ding, D.; Pan, Z.; Cuiuri, D.; Li, H. A Multi-Bead Overlapping Model for Robotic Wire and Arc Additive Manufacturing (WAAM). Robot. Comput. -Integr. Manuf. 2015, 31, 101–110. [Google Scholar] [CrossRef]
- Han, Q.; Li, X.; Dong, M.; Zhang, G. Enhanced Curve-fitting Model of the Bead Section Profile and the Corresponding Overlapping Model for Twin-electrode Gas Tungsten Arc-based Additive Manufacturing. Int. J. Adv. Manuf. Technol. 2021, 116, 1151–1167. [Google Scholar] [CrossRef]
- Chen, C.; He, H.; Zhou, S.; Lian, G.; Huang, X.; Feng, M. Prediction of multi-bead profile of robotic wire and arc additive manufactured components recursively using axisymmetric drop shape analysis. Virtual Phys. Prototyp. 2023, 18, e2254563. [Google Scholar] [CrossRef]
- Kaščák, Ľ.; Varga, J.; Bidulská, J.; Bidulský, R. Simulation of 316L Stainless Steel Produced the Laser Powder Bed Fusion Process. Materials 2023, 16, 7653. [Google Scholar] [CrossRef] [PubMed]
- Hu, Z.; Hua, L.; Qin, X.; Ni, M.; Ji, F.; Wu, M. Molten pool behaviors and forming appearance of robotic GMAW on complex surface with various welding positions. J. Manuf. Process. 2021, 64, 1359–1376. [Google Scholar] [CrossRef]
- Hu, Z.; Hua, L.; Qin, X.; Ni, M.; Liu, Z.; Liang, C. Region-based path planning method with all horizontal welding position for robotic curved layer wire and arc additive manufacturing. Robot. Comput. -Integr. Manuf. 2022, 74, 102286. [Google Scholar] [CrossRef]
- Cao, H.; Huang, R.; Yi, H.; Liu, M.; Jia, L. Asymmetric molten pool morphology in wire-arc directed energy deposition: Evolution mechanism and suppression strategy. Addit. Manuf. 2022, 59, 103113. [Google Scholar] [CrossRef]
- Ni, M.; Zhou, Y.; Hu, Z.; Qin, X.; Xiong, X.; Ji, F. Forming optimization for WAAM with weaving deposition on curved surfaces. Int. J. Mech. Sci. 2023, 252, 108366. [Google Scholar] [CrossRef]
- Li, X. The Forming Characteristics and Path Planning of Curved Layering Robotic GMA Additive Manufacturing. Doctoral Dissertation, Harbin Institute of Technology, Harbin, China, 2023. [Google Scholar]
Disclaimer/Publisher’s Note: The statements, opinions and data contained in all publications are solely those of the individual author(s) and contributor(s) and not of MDPI and/or the editor(s). MDPI and/or the editor(s) disclaim responsibility for any injury to people or property resulting from any ideas, methods, instructions or products referred to in the content. |
© 2025 by the authors. Licensee MDPI, Basel, Switzerland. This article is an open access article distributed under the terms and conditions of the Creative Commons Attribution (CC BY) license (https://creativecommons.org/licenses/by/4.0/).


