Abstract
The material in the mold of the injection-molding machine releases significant latent heat of solidification during the cooling process. The efficient recovery and utilization of this waste heat is crucial for improving energy efficiency. A novel integrated energy management system for mold cooling/heat pump/material preheating is proposed in this paper. Taking the symmetrical thermodynamic performance of the heat pump components as the basis and optimizing the system configurations, four system configurations were investigated: MC/BHP/MPCC, MC/RHP/MPCC, MC/HP/MP-IEMS, and MC/DCHP/MP-IEMS, utilizing EBSILON software. The performance of the systems was evaluated through the coefficient of performance (COP) and whole cycle energy efficiency (η). The T-q, T-s, and P-h diagrams were analyzed. It was found that, under comparative operating conditions, both the MC/HP/MP-IEMS and MC/DCHP/MP-IEMS systems exhibited significantly higher COP and η than the MC/BHP/MPCC and MC/RHP/MPCC systems. MC/HP/MP-IEMS achieves a COP of 13.66 and η of 22.09. Similarly, MC/DCHP/MP-IEMS achieves a COP of 14.00 and η of 22.53. The paper optimizes the other three systems using MC/BHP/MPCC as the comparison condition. Optimal cycle performances are achieved with COP and η values of 9, 16, 16, and 9, 26, 25, respectively. A comparison of the thermodynamic performance of five different refrigerants revealed that R123 and R245fa have superior overall performance. This study provides theoretical support for the engineering implementation of integrated energy management systems for injection-molding machines.
1. Introduction
The injection-molding machine is the main equipment for processing different shapes of plastic products using molds. It is widely used in the fields of national defense, electronics, automotive, medicine, and agriculture. About 70–80% of the existing plastic products are processed by the injection-molding process [1]. Polymer materials have a high specific energy consumption (SEC) value in the stage of production, amounting to about 100 GJ/Mg per unit mass of product [2]. Moreover, the energy utilization efficiency is relatively low in the injection-molding process, with only 50% to 60% of the total energy used for the molding process [3]. In 2015, 178 countries around the world signed the Paris Agreement, which aims to slow down global warming through global efforts to achieve peak carbon and carbon neutrality targets. At the United Nations General Assembly on 22 September 2020, China put forward its “double carbon” goal, i.e., to peak carbon emissions by 2030 and to achieve carbon neutrality by 2060 [4]. The injection-molding industry is an industry with higher energy consumption and larger carbon emissions. It is of great significance to realize the energy-saving improvement of the injection-molding machine system to achieve the goal of “double carbon”. Currently, the widely adopted energy-saving and efficiency-enhancing methods for injection-molding machines primarily include improvements in mechanical structures and optimizations of process parameters [5,6].
Structural innovations, such as advanced hydraulic and hybrid systems [7,8,9], and energy-efficient servo control mechanisms [10,11], have demonstrated significant energy savings. However, these solutions often require high capital investment and increased maintenance complexity, limiting their widespread adoption [12]. Meanwhile, process parameter optimization offers a low-cost approach to reducing energy consumption [13]. Studies have analyzed the effects of cycle time, nozzle temperature, screw speed, and cooling configurations on energy efficiency [14,15,16,17,18]. Although process optimization enhances efficiency, its impact is constrained by the need for precise measurement tools and limited flexibility in adjusting parameters over time.
By analyzing the melt plasticizing and molding process of injection-molding machines, it can be observed that materials release a significant amount of latent heat of solidification into the environment during the mold cooling process. This not only results in low energy efficiency of the equipment but also causes environmental pollution. Therefore, recovering the latent heat of solidification from the materials in the mold and utilizing it for heating in the process flow, by establishing a mold cooling heat recovery system, represents an important direction for energy saving and consumption reduction in injection-molding machines in the future.
Industrial waste heat can be divided into three levels: high temperature, medium temperature, and low temperature, which are 400 °C, 100–400 °C, and 100 °C [19,20], respectively. The waste heat can be recovered by passive technology or active technology. Passive techniques involve the direct use of heat at the same or lower temperature levels, such as recovering or reusing industrial waste heat through the use of heat exchangers and thermal energy storage units to heat or preheat other processes. In contrast, active techniques require converting the waste heat into another form of energy or upgrading its energy quality for reuse [19]. Examples of active techniques include the use of adsorption systems, mechanically driven heat pumps, and organic Rankine cycles in engineering for heating, cooling, or power generation. Hussam Jouhara et al. [20] summarized systems suitable for recovering and utilizing waste heat at different temperature levels. For instance, in the medium-to-low temperature range, piezoelectric generation, fluid heating/preheating, etc., can be applied; whereas in the high-temperature range, it can be utilized for power generation in factories, among other applications.
A critical yet underexplored issue in injection molding is the significant latent heat released during the mold cooling process. This wasted heat contributes to energy losses and environmental inefficiencies. The temperature of waste heat generated in the molding process of materials in the injection-molding machine is usually lower than 100 °C, which belongs to low-temperature waste heat recovery. In industrial waste heat, waste heat below 100 °C accounts for 63% of the total amount of low-temperature waste heat. It is a major energy that has not yet been developed sufficiently. At present, there is no cost-effective commercial solution [21,22,23,24]. Moreover, in the injection-molding production system, there has been a lack of research on the coupling relationship among mold cooling, heat pumps, and material preheating. Therefore, this paper proposes an integrated energy management system for injection-molding machine mold cooling/heat pump/material preheating. This system employs a heat pump to recover heat from the mold cooling water and generate hot air for preheating the raw materials. This paper investigates the coupling characteristics among mold cooling, heat pumps, and material preheating. It also optimizes the coupled cycle system and corresponding thermodynamic parameters. Based on this, the applicability of various refrigerants in this system is studied. Consequently, the optimal cycle configuration, operating parameters, and most suitable refrigerants are obtained, providing theoretical support for engineering practices aimed at energy conservation and consumption reduction in injection-molding equipment.
2. Physical Mechanism and Simulation Software
2.1. Mold Cooling/Heat Pump/Material Preheating Combined Cycle System
The process of the mold cooling/heat pump/material preheating combined cycle system in this study is shown in Figure 1. In Figure 1, after exiting the mold cooling system, the cooling water enters the evaporator to exchange heat with the refrigerant R245fa before flowing back to the mold temperature controller. The mold temperature controller is a device used to regulate the temperature of the cooling water flowing into the mold, achieving a reduction in the temperature of the heated return cooling water by mixing it with room-temperature water from a tank until it reaches the set temperature. Meanwhile, the refrigerant is heated within the evaporator and then enters the compressor for pressurization. The high-pressure refrigerant flows into the condenser to exchange heat with ambient air, thereby achieving condensation and heat release. The heated air is directed into the hopper for preheating and drying the raw materials, while the refrigerant continues to flow through the expansion valve for throttling before returning to the evaporator, completing the closed-loop cycle of the refrigerant. Taking the preheating of PC materials as an example, when the cooling water exits the mold, its temperature is approximately 76 °C. Further improvements will be made based on the model structure shown in Figure 1. By introducing a heat pump, the quality of the heat carried by the cooling water is upgraded, resulting in an increase in the production of air temperature to 110 °C.
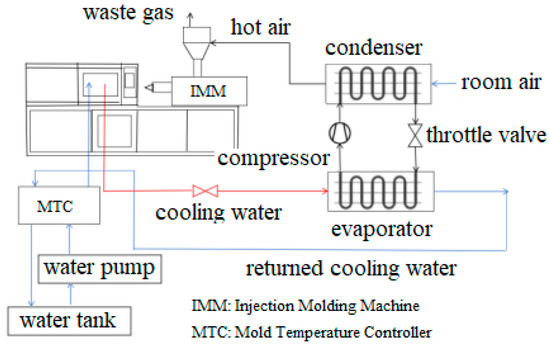
Figure 1.
Mold cooling/heat pump/material preheating combined cycle system.
2.2. Mathematical and Physical Modeling
The basic heat pump system includes a compressor, evaporator, condenser, and expansion valve (or throttle valve). These key components operate together to achieve effective heat transfer and conversion. Among them, the thermophysical formulas of the compressor, throttle valve, and regenerator are symmetrical on both sides, which indicates the conservation of energy and the reversibility of the thermodynamic processes involved. The energy exchange between the cold side and hot side of the evaporator and condenser is symmetrical, demonstrating the balance of energy transformation and flow within a thermodynamic system.
- (1)
- Compressor
The compressor is a critical component in the heat pump system, and its primary function is to increase the pressure of the refrigerant. In the heat pump system, when the gaseous refrigerant is compressed, the average distance between gas molecules decreases, leading to an increase in the density and pressure of the gas. This process can be represented by Equation (1).
where, and represent the pressure and volume of the gas before being compressed; and and represent the pressure and volume of the compressed gas.
- (2)
- Throttle valve
The throttle valve is used to regulate and control the flow rate and pressure of the refrigerant. By altering the cross-sectional area through which the fluid passes, precise control over the flow rate can be achieved. The refrigerant undergoes an isenthalpic throttling process within the valve, resulting in a decrease in outlet pressure while the enthalpy remains constant before and after the throttling, as shown in Equation (2).
where, and are the enthalpy of the refrigerant at the inlet and outlet of the throttle valve, respectively.
- (3)
- Evaporator
The evaporator is a crucial component in the heat pump cycle. In the evaporator, the refrigerant absorbs heat from the heat source and evaporates into saturated steam or superheated steam. Consequently, the heat absorption process of the refrigerant consists of two parts: the latent heat of vaporization absorbed when the two-phase gas-liquid refrigerant evaporates isothermally into saturated steam, and the sensible heat absorbed when the saturated steam is further heated and its temperature rises. The total heat is represented by Equation (3).
where, represents the heat absorbed by the evaporator. m is the mass flow of the refrigerant. is the latent heat of evaporation of gas-liquid two-phase refrigerant. c is the specific heat capacity of the refrigerant. M is the mass of the work medium. T is the temperature of the refrigerant under a certain pressure; Ts is the saturation temperature of the refrigerant under the same pressure.
- (4)
- Condenser
The condenser is the device in the heat pump cycle that generates thermal output for the user. Its primary function is to release heat from the superheated gas entering the condenser and condense it into a subcooled liquid. The heat released by the refrigerant in the condenser can be expressed as the sum of the sensible heat released during the cooling process of the superheated gas, the latent heat released during the isothermal condensation process, and the sensible heat energy released during the subcooling process, as shown in Equation (4).
where, represents the heat released from the condenser. is the mass flow of the refrigerant. is the latent heat of condensation of the refrigerant. and represent the specific heat capacity of gaseous and liquid refrigerants, respectively. and are the masses of the gaseous and liquid refrigerant mass, respectively. and are the temperature of gaseous and liquid refrigerants under certain pressure, respectively. and are the saturation temperature of gaseous refrigerant and liquid refrigerant under a certain pressure.
- (5)
- Regenerator
The regenerator is a device for recovering waste heat from the condenser outlet. The device can promote the heat exchange between the refrigerant at the outlet of the condenser and the refrigerant at the outlet of the evaporator. This will increase the temperature of the cold fluid, thus reducing the energy required for subsequent heating of the cold fluid and improving the thermal efficiency of the whole system. The energy conservation relationship between cold fluid and hot fluid is shown in Equation (5).
where, and represent the heat absorption of the cold fluid and the heat release of the hot fluid, respectively, which are equal. and represent the specific heat capacity of cold fluid and hot fluid, respectively. and are the masses of cold fluid and hot fluid, respectively. and represent the outlet and inlet temperatures of the cold fluid, respectively. and represent the outlet and inlet temperatures of the hot fluid, respectively.
The thermal efficiency of the regenerator is shown in Equation (6).
where, is the thermal efficiency of the regenerator. is the actual heat exchange capacity of the regenerator. is the theoretically possible maximum heat exchange capacity.
2.3. Thermal Performance Evaluation Index
In this study, the thermal performance of the system is evaluated by the coefficient of performance (COP) and the effective energy efficiency (). The coefficient of performance (COP) of the heat pump is defined as the ratio of the heat exchanged in the condenser to the electric energy consumed, which is given by Equation (7).
The effective energy efficiency () is an efficiency index based on the second law of thermodynamics. Effective energy efficiency is defined as the ratio of the output useful work to the total power consumed by the system, which is given by Equation (8).
2.4. Simulation Software
EBSILON is a professional thermal system modeling and simulation software developed by Germany’s STEAG Power Group (Essen, Germany). It is widely used in the design, optimization, retrofitting, and operational analysis of thermal power plant systems. Based on physical equations and thermodynamic principles, this software enables precise simulation of complex thermal cycles and supports the modeling of various thermal systems, including conventional coal-fired power plants, gas turbines, concentrated solar power stations, and heat pump systems. EBSILON boasts significant flexibility and an extensive component library, capable of meeting the simulation needs of complex thermal systems in the industrial sector. Xiao [25] conducted detailed dynamic simulations of the VITCAL 350-HT-Pro heat pump system using EBSILON software. By comparing with real data, the deviation between simulated data and actual operation data is under 5%. Szymiczek [26] conducted simulations of heat pumps involved in a borehole project using EBSILON 15.0. The study investigated the relationship between the coefficient of performance (COP) values and supply temperature. Upon comparison with measured historical data, the polynomial determination coefficient (R2) was found to exceed 0.99, indicating a strong fit between the model and the observed data. Therefore, EBSILON software can be used to simulate the mold cooling/heat pump/material preheating the integrated energy management system of the injection-molding machine, which can ensure the accuracy of the results.
3. Results and Discussion
The basic parameters of the simulation model of the heat pump cycle system are set as follows. Refrigerant R245fa is used in the heat pump system. The heat source of the heat pump is the cooling water of the mold, and the corresponding inlet and outlet temperatures are 76 °C and 75 °C, respectively. The cooling water flow rate in the pipeline is about 12 L/min. The air inlet and outlet temperatures of the condenser are 20 °C and 110 °C, respectively. The temperature difference at the hot end of the evaporator is 3 °C. The efficiencies of both the motor and compressor are set at 0.85. The mass flow rate of refrigerant is 0.01 kg/s.
Based on the parameter settings of the above boundary conditions, four types of integrated energy management systems for injection-molding machines, including mold cooling, heat pumps, and material preheating, are investigated. To determine the optimal configurations, operating parameters, and most suitable refrigerants for this study, the energy consumption, heat production, coefficient of performance (COP), and overall cycle energy efficiency of the systems are calculated.
3.1. Parametric Analysis of Different Mold Cooling/Heat Pump/Material Preheating Combined Cycle Configurations
3.1.1. Mold Cooling/Basic Heat Pump/Material Preheating Combined Cycle (MC/BHP/MPCC)
Figure 2 shows the mold cooling/basic heat pump/material preheating combined cycle configuration (MC/BHP/MPCC). The model contains four core components: evaporator, compressor, condenser, and throttle valve. These components are connected with each other through pipes to form a closed circulation system for effective energy recovery.
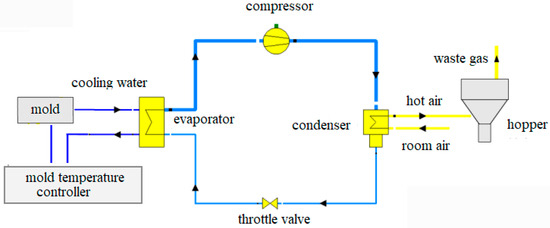
Figure 2.
Simulation of mold cooling/basic heat pump/material preheating combined cycle (MC/BHP/MPCC).
Table 1 lists the simulation results of the inlet and outlet of each component in MC/BHP/MPCC. The refrigerant with a gas void fraction of 0.40 in the evaporator absorbs the heat of the cooling water of the heat source and turns it into superheated steam. The inlet temperature of the refrigerant is 66.19 °C, and the superheat degree at the outlet is 6.81 °C. The pressure stays the same, but the enthalpy increases. On the hot side, the cooling water temperature drops from 76 °C to 74.74 °C, meaning no extra energy is needed to heat the return water when it goes back to the mold temperature controller. After passing through the compressor, the refrigerant’s pressure rises from 5.3 bar to 15.5 bar and its temperature from 73 °C to 112.16 °C. The enthalpy increases from 460.47 kJ/kg to 483.41 kJ/kg, while the entropy remains essentially unchanged because the compression process is approximately adiabatic, with little heat exchange between the system and its surroundings. The high-temperature, high-pressure gaseous refrigerant enters the condenser, where it releases heat and liquefies into a supercooled refrigerant, resulting in a temperature decrease from 112.16 °C at the inlet to 109.40 °C at the outlet. During this process, its enthalpy decreases correspondingly, from 483.41 kJ/kg at the inlet to 354.86 kJ/kg at the outlet, and the entropy also decreases as the system transitions from a disordered state to an ordered state. Simultaneously, heat is transferred to the cold-side air, raising its temperature from 20 °C to 110 °C, which is the drying temperature for the PC material feedstock. Finally, passing through the throttle valve, the refrigerant’s pressure falls to 5.5 bar and temperature to 66.19 °C. The enthalpy remains constant, but the entropy increases slightly because the throttling process is irreversible, leading to an increase in system entropy. After passing through the throttle valve, the low-temperature, low-pressure liquid refrigerant once again enters the evaporator to complete a cycle. The operation of the entire heat pump system achieves the transfer of heat from a low-temperature heat source to a high-temperature heat source through the circular flow of refrigerant in these four components, thereby fulfilling the purpose of heating.

Table 1.
Simulation results of inlet and outlet of various components in the MC/BHP/MPCC.
The results of the evaluation indexes of the MC/BHP/MPCC are given in Table 2. The total power consumption in Table 2 refers to the electricity consumed by the compressor. The heat production of the heat pump represents the energy of the air used for material preheating, specifically the energy required to generate air at 110 °C. The whole cycle energy efficiency here equals the coefficient of performance (COP) for heating in the heat pump which is given by Equation (9). This parameter is retained for comparison with subsequent configurations.
Table 2.
Simulation results of MC/BHP/MPCC system.
3.1.2. Mold Cooling/Regenerative Heat Pump/Material Preheating Combined Cycle Model (MC/RHP/MPCC)
Figure 3 illustrates the mold cooling/regenerative heat pump/material preheating combined cycle model (MC/RHP/MPCC). The regenerator serves to recover the heat energy from the refrigerant at the condenser outlet, utilizing it to preheat the refrigerant exiting the evaporator. This measure diminishes both the cooling load in the condenser and the heating requirement in the evaporator. In addition, the introduction of a regenerator can also effectively reduce the temperature of the liquid refrigerant flowing into the throttle valve and reduce energy waste. In this study, the pressure setting of the heat pump is the same as that of MC/BHP/MPCC, and the hot end temperature difference of the regenerator is set to 2 °C.
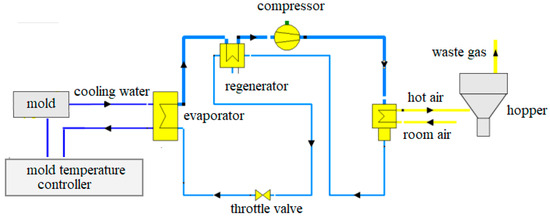
Figure 3.
Simulation model of MC/RHP/MPCC.
It is evident from the simulation results that the evaporator’s performance aligns closely with that of the MC/BHP/MPCC system. Due to the introduction of the regenerator, the temperature of the refrigerant is further increased from 74 °C as it exits the evaporator to 107.40 °C before entering the compressor. The temperature of the refrigerant at the compressor outlet rises to 143.91 °C, with a temperature rise of 36.51 °C. The refrigerant exiting the condenser enters the regenerator to release heat, causing its temperature to decrease from 109.40 °C down to 86.40 °C. Finally, the liquid refrigerant passes through the throttle valve, resulting in a temperature drop from 86.40 °C to 66.20 °C. After passing through the throttle valve, the low-temperature, low-pressure liquid refrigerant re-enters the evaporator to complete a cycle.
The MC/RHP/MPCC simulation results, as depicted in Figure 3, are summarized in Table 3. The cold side of the condenser generates 2.08 kW of heat for hot air, which is 0.51 kw higher than that of the MC/BHP/MPCC system. At the same time, the power consumption of the heat pump also increases. Overall, due to the integration of the regenerator, the energy at the condenser outlet is effectively recovered, leading to a significant improvement in the system’s heat utilization efficiency and the optimization of the overall energy distribution. This makes the MC/RHP/MPCC system more advantageous in terms of heating performance. Similar to the MC/BHP/MPCC system, the whole cycle energy efficiency of the entire cycle in the MC/RHP/MPCC system is represented by the COP of the heat pump, which is provided here for comparison with other heat pump systems.
Table 3.
Simulation results in MC/RHP/MPCC system.
3.1.3. Mold Cooling/Heat Pump/Material Preheating Integrated Energy Management System (MC/HP/MP-IEMS)
Given that the heat pump operates with a constant refrigerant flow rate and pressure, the quantity of heat discharged by the refrigerant in the condenser remains consistent. The symmetry in heat exchange between the cold and hot sides of the condenser implies that the energy required to heat the air on the cold side matches the heat emitted by the refrigerant. Consequently, the heat output of the heat pump can be enhanced by increasing the temperature of the air entering the condenser. This can be effectively accomplished by integrating a cooling water-to-air heat exchanger into the system. In this study, the pressure settings of the heat pump are identical to those utilized in the MC/BHP/MPCC and MC/RHP/MPCC systems. Additionally, the cooling water-air heat exchanger is configured to maintain a temperature difference of 5 °C at its hot end. The simulation results, which illustrate these improvements, are presented in Figure 4.
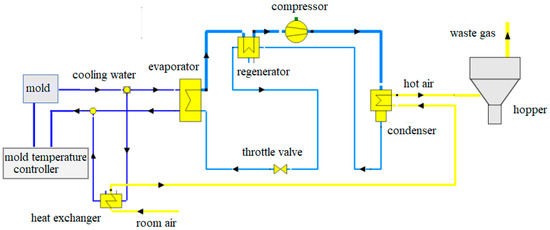
Figure 4.
Simulation model of MC/HP/MP-IEMS.
The evaluation indexes of the MC/HP/MP-IEMS system shown in Figure 4 are shown in Table 4. Among them, the total power consumption, heat production, and heating performance of the heat pump are the same as those defined above. The whole cycle energy efficiency of the whole cycle needs to consider the heat for preheating air in the first stage. Therefore, the whole cycle energy efficiency is calculated according to Equation (10).
where, Qair is the heat for generating the hot air on the cold side of the condenser, kW; Qair1 is the heat for generating the hot air on the cold side of the cooling water-air heat exchanger, kW; W is the power of the motor, kW.
Table 4.
Simulation results of MC/HP/MP-IEMS.
According to Table 4, room-temperature air first undergoes heat exchange with cooling water, raising its temperature to 68 °C. This heated air then enters the condenser to continue heat exchange with the refrigerant, increasing its temperature further to 110 °C. Both the MC/HP/MP-IEMS and MC/RHP/MPCC systems release nearly identical amounts of heat during the condensation process. However, due to a decrease in the temperature difference between the inlet and outlet of the condenser’s cold side, the air mass flow rate increases. This results in higher heat production from the system, reaching 4.411 kW, which is 2.12 times that of the MC/RHP/MPCC system. Consequently, the increase in heat pump heat production leads to an improvement in both the Coefficient of Performance (COP) and the whole cycle energy efficiency (η). Specifically, as the numerator in the relevant calculation Equation (10) rises, so do the values of COP and η. Furthermore, when compared to MC/BHP/MPCC, there is a notable increase: COP is enhanced by 138%, equivalent to a value of 13.66, and the whole cycle energy efficiency is boosted by 286%, corresponding to a value of 22.09.
3.1.4. Mold Cooling/Dual-Stage Compression Heat Pump/Material Preheating Integrated Energy Management System (MC/DCHP/MP-IEMS)
In heating heat pump systems, two-stage compression is often introduced to enhance energy-saving effects. The basic principle involves introducing low-temperature, low-pressure gaseous refrigerant into the first-stage compressor, where it is compressed to an intermediate pressure. This process increases the temperature and pressure of the refrigerant but keeps the compression ratio relatively low, thereby reducing energy losses during compression. Subsequently, the refrigerant passes through an intermediate heat exchanger to release heat and exchange thermal energy with the air, lowering its temperature. The cooled refrigerant then enters the second-stage compressor, where it is further compressed to high pressure. By reducing the compression ratio in each stage, two-stage compression minimizes energy losses during compression and improves the whole cycle energy efficiency of the system. Figure 5 shows the simulation of MC/DCHP/MP-IEMS.
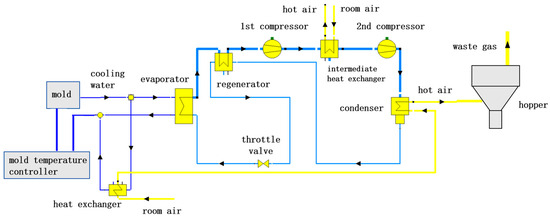
Figure 5.
Simulation model of MC/DCHP/MP-IEMS.
Table 5 presents the simulation results of the MC/DCHP/MP-IEMS model, where the outlet temperature on the hot side of the intermediate heat exchanger is set at 110 °C. The total power consumption is the sum of the power consumption of the two motors. The heat production by the heat pump is the sum of the energy of the hot air generated on the cold side of the condenser and the energy of the hot air generated on the cold side of the intermediate heat exchanger. The coefficient of performance in the heat pump is the ratio of the heat production of the heat pump to the total power consumption, and its calculation formula is shown in Equation (11).
where, Qair is the hot air energy generated at the cold side of the condenser, kW; Qair2 is the hot air energy generated at the cold side of the intermediate heat exchanger, kW. W1 is the power consumption of the first stage compression motor, kW. W2 is the power consumption of the second-stage compression motor, kW.
Table 5.
Simulation results of MC/DCHP/MP-IEMS.
The whole cycle energy efficiency calculation of the whole cycle is shown in Equation (12).
where, Qair1 is the hot air energy produced on the cold side of the cooling water-air heat exchanger, kW.
Due to the reduction of compression ratio in each stage achieved by stage compression, the power consumption is decreased, resulting in a smaller denominator for COP and η. Additionally, multistage compression and intermediate cooling lowers the temperature of the refrigerant when it enters the condenser. This reduces the thermal load of the condenser and enhances the heat exchange efficiency of the system. Furthermore, the heat released by the working fluid in the intermediate heat exchanger provides partial heat for material preheating. The heat production by the heat pump is 4.41 kW. Compared to the MC/HP/MP-IEMS, the overall COP and η have increased slightly, albeit with a more complex structure than the other three systems.
3.2. Performance Comparison of Different Integrated Energy Management Systems for Mold Cooling/Heat Pump/Material Preheating
3.2.1. T-q Diagrams for Four Integrated Energy Management Systems
Figure 6a depicts the T-q diagram for MC/BHP/MPCC, which illustrates the relationship between the temperature (T) and heat transfer (q) for the fluids on both sides of the evaporator and condenser. The dashed-dotted lines on the left represent the cold and hot sides of the evaporator, while the solid lines on the right represent the cold and hot sides of the condenser. On the hot side of the evaporator, the mold cooling water releases heat of 1.06 kW, causing its temperature to drop from 76 °C to 74.7 °C (A1–A2). Simultaneously, the refrigerant on the cold side of the evaporator absorbs this heat, increasing its temperature from 66.19 °C to 73 °C (B1–B2–B3). Prior to the inflection point B2, the heat increases from 0 to 0.98 kW while the temperature remains constant, indicating that this phase is dominated by phase change, where latent heat is absorbed without a temperature change. From the inflection point B2 to the endpoint B3, both the temperature and heat increase simultaneously, suggesting that the refrigerant continues to absorb heat after completing the phase change, leading to a further temperature rise. On the hot side of the condenser, the heat of 1.29 kW is released, causing the refrigerant temperature to decrease from 112.16 °C to 109.40 °C (C1–C2–C3). Prior to the inflection point C2, both heat and temperature decrease. This phase represents the cooling of the refrigerant from a superheated vapor at a high temperature and pressure to a saturated vapor. From the inflection point C2 to the endpoint C3, the refrigerant transitions from a saturated vapor to a saturated liquid, with a decrease in enthalpy and a constant temperature. Meanwhile, the air on the cold side of the condenser absorbs this heat, increasing its temperature from 20 °C to 110 °C, which is suitable for material preheating and drying.
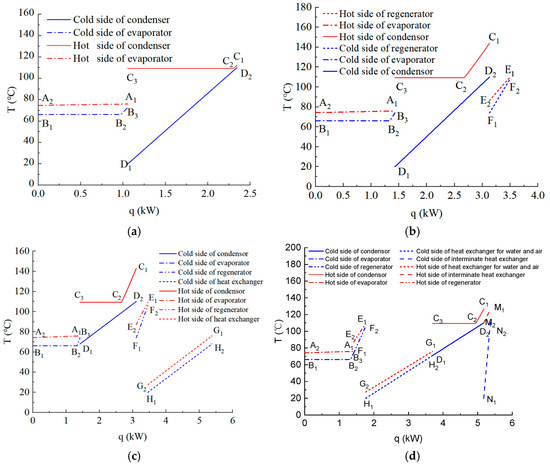
Figure 6.
Temperature vs. transferred heat of components for the four systems. (a) MC/BHP/MPCC. (b) MC/RHP/MPCC. (c) MC/HP/MP-IEMS. (d) MC/DCHP/MP-IEMS.
Figure 6b presents the T-q diagram for the MC/RHP/MPCC system. On the left side, the dashed-dotted lines represent the hot and cold sides of the evaporator. The solid lines in the middle depict the hot and cold sides of the condenser, while the dashed lines on the right show the hot and cold sides of the regenerator. Compared to the MC/BHP/MPCC system, the addition of a regenerator between the evaporator and the compressor raises the refrigerant temperature at the compressor inlet and outlet. Consequently, the inlet temperature on the hot side of the condenser is significantly higher than that in the MC/BHP/MPCC system, while the cold-end temperature difference in the condenser remains unchanged. The hot-end temperature difference in the condenser is also notably higher than that in the MC/BHP/MPCC system. In the MC/RHP/MPCC system, the heat released on the hot side of the condenser increases, with 1.7 kW of heat being transferred to the cold side air, causing the refrigerant temperature to drop from 143.91 °C to 109.40 °C. The refrigerant exiting the condenser then flows into the regenerator, where it releases 0.36 kW of heat to heat up the refrigerant flowing into the regenerator from the evaporator side.
Figure 6c shows the T-q diagram for the MC/HP/MP-IEMS system. On the left, the dashed-dotted lines represent the evaporator. The solid lines in the middle depict the condenser, while the double-dashed lines in the middle represent the regenerator. The dashed lines on the right indicate the cooling water-air heat exchanger. In the MC/HP/MP-IEMS system, the evaporator-side coefficients are basically the same as those in the MC/RHP/MPCC system. The inlet and outlet temperatures of the refrigerant on the hot side of the condenser are similar to those in the MC/RHP/MPCC system. However, the inlet air temperature on the cold side has increased from 20 °C in the MC/RHP/MPCC system to 68 °C, resulting in a significant increase in the mass flow rate of air being heated on the cold side. This implies that the same amount of heat on the hot side can now handle a higher flow rate of air on the cold side. The heat released on the hot side of the regenerator and the heat absorbed on the cold side are approximately the same as their corresponding values in the MC/RHP/MPCC system.
Figure 6d depicts the T-q diagram of the MC/DCHP/MP-IEMS system. In this figure, The symbols of the evaporator, condenser, regenerator, and cooling water-air heat exchanger are the same as those of the MC/HP/MP-IEMS system. The hot and cold sides of the intermediate heat exchanger are shown in the short line group on the right. After two-stage compression, the temperature of the refrigerant entering the condenser is 125.522 °C, which is significantly lower than 143.91 °C at the inlet of the condenser in MC/RHP/MPCC system and MC/HP/MP-IEMS system. This reduces the hot-end temperature difference in the condenser, while the cold-end temperature difference remains the same as in MC/HP/MP-IEMS. The condenser releases about 1.48 kW of heat, lower than that in the MC/RHP/MPCC and MC/HP/MP-IEMS systems. The regenerator’s heat absorption and release on the cold and hot sides, respectively, are nearly identical to those in MC/HP/MP-IEMS, at about 0.35 kW. In the intermediate heat exchanger, 0.2 kW of heat is released by the refrigerant, cooling it from 127.14 °C to 110 °C, and absorbed by the hot air, raising its temperature from 20 °C to 114 °C for material drying. Advantages of this system include reduced compressor and condenser loads, and two heat sources for generating hot air. However, its structure is more complex than the other systems.
3.2.2. T-s Diagram of Four Integrated Energy Management Systems
Figure 7a presents the T-s diagram for the MC/BHP/MPCC system, illustrating the intrinsic operational laws of the refrigerant in the heat pump cycle system as it relates to temperature and entropy. In the T-s diagram, the refrigerant in the evaporator absorbs heat from the mold cooling water (5–6–1), with its temperature rising from 66.19 °C to 73 °C and its entropy increasing from 1.48 kJ/(kg·K) to 1.80 kJ/(kg·K). The process (5–6) represents the refrigerant absorbing heat from a wet vapor state to become saturated vapor, during which the temperature remains constant while the entropy increases. The refrigerant then enters the compressor (1–2), where its temperature rises from 73 °C at the compressor inlet to 112.16 °C at the outlet, with the entropy remaining nearly unchanged, as the compressor operates close to an isentropic adiabatic process. Subsequently, the refrigerant enters the condenser to release heat (2–3–4), with its temperature dropping from 112.16 °C to 109.40 °C and its entropy increasing from 1.81 kJ/(kg·K) to 1.47 kJ/(kg·K). During this stage, the refrigerant cools from a superheated vapor state to a saturated vapor state, with both entropy and temperature decreasing slightly (2–3). Subsequently, as the refrigerant transitions from a saturated vapor state to a saturated liquid state (3–4), its temperature remains constant while its entropy continues to decrease. Finally, the refrigerant enters the throttling valve (4–5), where its temperature further decreases from 109.40 °C at the valve inlet to 66.19 °C at the outlet. This process is an isenthalpic expansion throttling process, during which the entropy increases while both the temperature and pressure decrease.
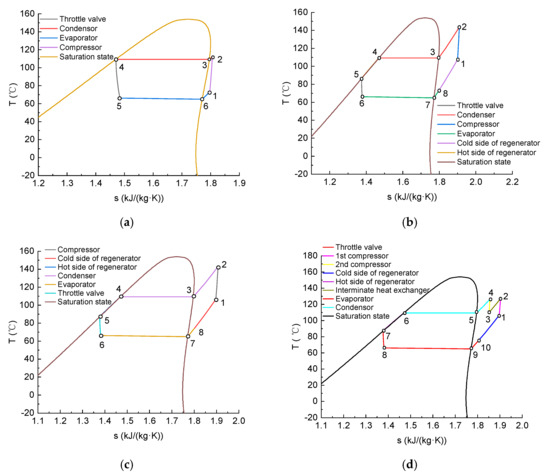
Figure 7.
Temperature vs. entropy for the four integrated energy management systems. (a) MC/BHP/MPCC. (b) MC/RHP/MPCC. (c) MC/HP/MP-IEMS. (d) MC/DCHP/MP-IEMS.
Figure 7b presents the T-s diagram for the MC/RHP/MPCC system. The evaporator section is similar to that of the MC/BHP/MPCC system. However, in the MC/RHP/MPCC system, after leaving the evaporator, the refrigerant enters a regenerator to continue the cycle, where it further absorbs heat (8–1), increasing its temperature to 107.40 °C and its entropy to 1.89 kJ/(kg·K). The refrigerant then enters the compressor, where its temperature rises due to pressure increase, reaching 143.911 °C at the compressor outlet. The temperature increase of the refrigerant in MC/RHP/MPCC is 36.51 °C, which is 2.65 °C lower than that in the MC/BHP/MPCC system. Subsequently, the refrigerant releases heat in the condenser (2–3–4), the heat is the sum of the heat released by the cooling of superheated steam and the heat released by the condensation of saturated steam to saturated liquid. The proportion of heat released during cooling in MC/RHP/MPCC is significantly higher than that in the corresponding MC/BHP/MPCC. The temperature of the refrigerant at the outlet of the condenser is 109.40 °C. After condensation, the refrigerant enters the regenerator (4–5) to further release heat, lowering its temperature and entropy to 86.40 °C and 1.37 kJ/(kg·K), respectively. Compared to the MC/BHP/MPCC system, the thermal load at the condenser is reduced in the MC/RHP/MPCC system. However, MC/RHP/MPCC consumes more power due to the increased area enclosed by its processes.
Figure 7c depicts the T-s diagram of the MC/HP/MP-IEMS system. The internal parameters of its heat pump match those of the MC/RHP/MPCC system. Additionally, the hot-side parameters of both condensers are similar. The only difference lies in temperature changes at the cold-side inlet of the condenser in the MC/HP/MP-IEMS, which has no significant impact on the internal parameters of the heat pump. Therefore, the T-s diagrams of both systems are nearly identical.
Figure 7d presents the T-s diagram of the MC/DCHP/MP-IEMS system. Compared to MC/HP/MP-IEMS, MC/DCHP/MP-IEMS introduces a second stage of compression. After the first stage of compression, the refrigerant’s temperature rises, and it then releases heat in an intermediate heat exchanger, causing its temperature to drop. This process is reflected on the T-s diagram as a break in the compression curve at the intermediate heat exchanger (1–2–3), indicating that the refrigerant undergoes a cooling before being compressed by the second stage. Subsequently, the refrigerant enters the second stage of compression (3–4), where its temperature rises again to approximately 126.52 °C, but this is still lower than the temperature after the single-stage compression in MC/HP/MP-IEMS. The refrigerant’s enthalpy decreases to 524.86 kJ/kg, which is significantly lower than the temperature and enthalpy at the compressor outlet in both MC/RHP/MPCC and MC/HP/MP-IEMS. On the T-s diagram, the cycle curve for MC/DCHP/MP-IEMS is more compact, indicating that the system has optimized heat distribution through the use of two-stage compression and an intermediate heat exchanger, reducing the thermal load on the condenser while increasing the temperature of the hot air. This results in a higher whole-cycle energy efficiency.
3.2.3. P-h Diagram of Four Integrated Energy Management Systems
Figure 8a depicts the p-h diagram of MC/BHP/MPCC. In the evaporator, the refrigerant absorbs heat from the mold-cooling water. The process (5–6–1) of heating the refrigerant from wet steam to saturated steam and then to superheated steam is approximately isobaric, with the enthalpy increasing from 354.86 kJ/kg to 460.76 kJ/kg. After that, the refrigerant enters the compressor (1–2), where it is compressed by consuming mechanical energy, increasing its thermal energy potential. The refrigerant enters the compressor with a pressure of 5.3 bar and an enthalpy of 460.76 kJ/kg, exiting with a pressure of 15.5 bar and an enthalpy of 483.41 kJ/kg. Subsequently, the refrigerant enters the condenser to release heat (2–3–4), cooling from superheated steam to saturated steam and then liquefying to saturated liquid at a constant pressure of 15.5 bar, reducing its enthalpy to 354.86 kJ/kg. Finally, the refrigerant enters the throttle valve (4–5), where the pressure decreases from 15.5 bar to 5.5 bar, and the enthalpy remains unchanged.
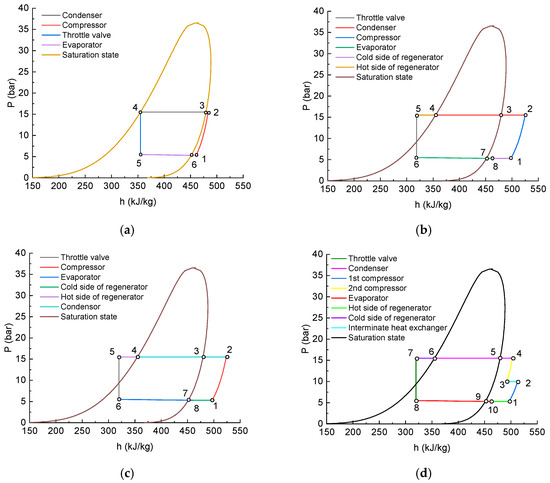
Figure 8.
Pressure vs. enthalpy for the four integrated energy management systems. (a) MC/BHP/MPCC. (b) MC/RHP/MPCC. (c) MC/HP/MP-IEMS. (d) MC/DCHP/MP-IEMS.
Figure 8b presents the p-h diagram for the MC/RHP/MPCC system. The refrigerant undergoes isobaric evaporation in the evaporator (6–7–8) at the same pressure as in MC/BHP/MPCC. However, due to the incorporation of a regenerator in MC/RHP/MPCC, the enthalpy of the refrigerant entering the compressor increases to 497.73 kJ/kg, with the enthalpy at the compressor outlet being 524.86 kJ/kg. The enthalpy at the hot side inlet of the condenser is higher in MC/RHP/MPCC compared to MC/BHP/MPCC. Meanwhile, the enthalpy at the hot side outlet of the condenser is the saturation enthalpy of the refrigerant at 15.5 bar in both MC/BHP/MPCC and MC/RHP/MPCC. Therefore, the enthalpy difference between the inlet and outlet of the condenser’s hot side is greater in MC/RHP/MPCC than in MC/BHP/MPCC, indicating that the condenser in MC/RHP/MPCC releases more heat than its counterpart in MC/BHP/MPCC. Subsequently, the refrigerant enters the hot side of the regenerator to continue releasing heat, resulting in a temperature drop and a transition from saturated liquid to supercooled liquid, with the enthalpy decreasing to 318.71 kJ/kg. Finally, the supercooled refrigerant enters the throttling valve, where the pressure decreases while the enthalpy remains unchanged. In MC/RHP/MPCC, the regenerator preheats the refrigerant before it enters the compressor, leading to an increased enthalpy at the start of the compression process. Additionally, the decreased temperature of the refrigerant at the inlet of the throttling valve minimizes the temperature drop during the throttling process. On the P-h diagram, the cycle curve of the MC/RHP/MPCC system appears more “flattened”, indicating a more gradual energy change during these processes. Despite an increased cycle area, the whole cycle energy efficiency and heating capacity of the system are enhanced, primarily due to the regenerator optimizing heat distribution and improving heat exchange efficiency.
Figure 8c shows the P-h diagram of the process in MC/HP/MP-IEMS, which is the same as that in MC/RHP/MPCC.
Figure 8d presents the P-h diagrams of the refrigerant in MC/DCHP/MP-IEMS. The pressures and enthalpies of the refrigerant in the processes of evaporation (8–10), the cold side of the regenerator (10–1), the hot side of the regenerator (6–7), and throttling (7–8) are the same as those of MC/RHP/MPCC and MC/HP/MP-IEMS. However, the compression stages (1–2, 3–4) differ significantly from those in MC/RHP/MPCC and MC/HP/MP-IEMS. In MC/RHP/MPCC and MC/HP/MP-IEMS, the pressure is increased from 5.3 bar to 15.5 bar through a single compression process. In contrast, in MC/DCHP/MP-IEMS, the pressure is first increased from 5.3 bar to 10 bar through the first stage of compression. Subsequently, heat is released in an intermediate heat exchanger while the pressure remains constant, followed by a second stage of compression to increase the pressure from 10 bar to 15.5 bar. The benefit of this design is that it reduces the compression ratio of the compressor, resulting in a lower enthalpy value of 524.86 kJ/kg, which is significantly lower than the enthalpy at the compressor outlet in MC/RHP/MPCC and MC/HP/MP-IEMS. Due to the decreased temperature at the compressor outlet, the temperature of the refrigerant entering the hot side of the condenser is also reduced. Consequently, the energy released by the refrigerant as it transitions from superheated vapor to saturated liquid on the hot side of the condenser decreases. The enthalpy difference between the inlet and outlet of the hot side of the condenser is 147.96 kJ/kg, which is lower than the heat released by the condenser in the MC/RHP/MPCC system and MC/HP/MP-IEMS, where the enthalpy difference is 170.00 kJ/kg. Compared to the MC/HP/MP-IEMS system, the compression process in MC/DCHP/MP-IEMS exhibits a “zigzag” pattern on the P-h diagram, indicating that the system optimizes heat distribution through the intermediate heat exchanger and reduces compressor energy consumption. Additionally, the lower enthalpy value at the inlet of the condenser in MC/DCHP/MP-IEMS results in a decreased enthalpy drop during the condensation process, enhancing condensation efficiency.
3.3. Comparison of Thermal Performance of Different Mold Cooling/Heat Pump/Material Preheating Integrated Energy Management Systems Under Different Working Conditions
To facilitate the study of the impact of configuration on performance, the pressure of optimized configuration in Section 3.1 and Section 3.2 are maintained consistent with those of the MC/BHP/MPCC configuration. Notably, the MC/BHP/MPCC configuration already represents the optimal operating condition, where the pressure of the refrigerant as it exits the throttling valve, flows through the evaporator, and enters the compressor is 5.5 bar, and the pressure as it exits the compressor, flows through the condenser, and enters the throttling valve is 15.5 bar. This configuration achieves the maximum values for both its COP and η. The results obtained using the aforementioned method in this section are defined as the comparison conditions. However, the parameters of the other three configurations have further optimization potential. Therefore, we have conducted optimizations for these three configurations specifically for these two pressure values, and the results obtained are defined as the optimal operating conditions for each configuration. The refrigerant pressure at the outlet of the throttling valve is set to 5.5 bar. For MC/RHP/MPCC, MC/HP/MP-IEMS, and MC/DCHP/MP-IEMS, the optimal operating conditions are achieved when the pressure at the inlet of the throttling valve (Pv,i) is 11.5 bar, 13.5 bar, and 14 bar, respectively.
Figure 9 illustrates the total power consumption of four integrated energy management systems under comparative and optimal conditions. Under optimal conditions, the MC/RHP/MPCC system transfers the same heat as in the comparison. Lower inlet and outlet temperatures reduce refrigerant temperature and compressor load, lowering power consumption. While MC/HP/MP-IEMS also incorporates a regenerator, it has a cooling water/air heat exchanger that preheats the air entering the cold side of the condenser. As a result, the air on the cold side of the condenser continues to warm up from a higher initial temperature. When setting the pressure on the hot side of the condenser, it is essential to consider that the pinch point of the refrigerant should be as close as possible to the cold side. The MC/HP/MP-IEMS has a higher pinch point and condenser-side pressure compared to the MC/RHP/MPCC, leading to higher power consumption. The MC/DCHP/MP-IEMS system’s intermediate heat exchanger reduces refrigerant temperature between compressors and after the second stage. To avoid excessively low temperatures, its pressure is set to higher than that of the MC/HP/MP-IEMS. Therefore, its total power consumption increases slightly. However, under comparison conditions, with the same pressure set for all systems and a cooling water/air heat exchanger in the MC/HP/MP-IEMS, the heat pump load is reduced, decreasing power consumption. Additionally, the two-stage compression in the MC/DCHP/MP-IEMS system enables a gradual increase in refrigerant temperature, reducing the refrigerant’s load and consequently decreasing total power consumption.
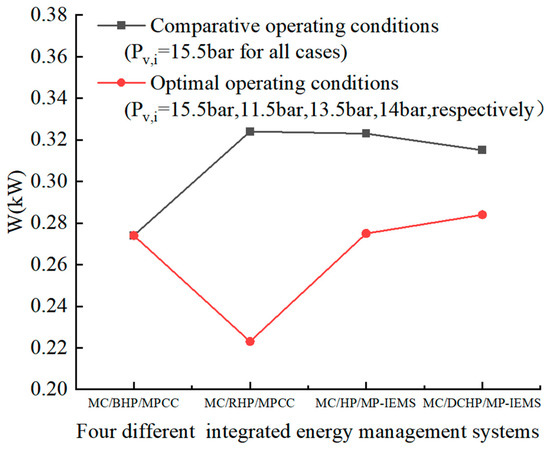
Figure 9.
Comparison of total power consumption of four integrated energy management systems.
Figure 10 presents the heat production of four integrated energy management systems under both comparative and optimal operating conditions. The heat production of MC/BHP/MPCC, MC/RHP/MPCC and MC/HP/MP-IEMS gradually increases, whereas the heat production of MC/DCHP/MP-IEMS remains relatively unchanged compared to MC/HP/MP-IEMS. The comparative results of the four integrated energy management systems show little difference from their optimal results, indicating that system optimization should focus on reducing total power consumption, as the system’s heat production is largely predetermined and has minimal impact on the heat generated from the gas.
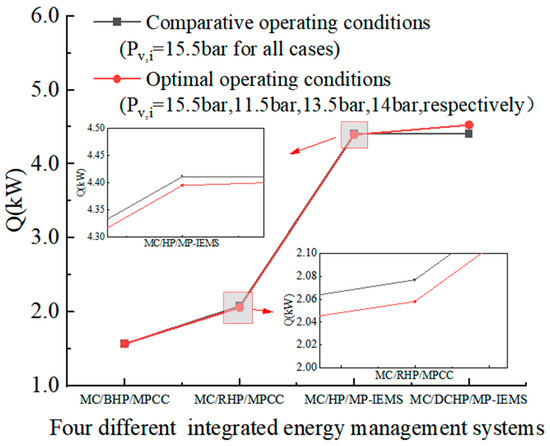
Figure 10.
Comparison of heat production generated by four integrated energy management systems.
Figure 11 shows the coefficient of performance in heat pumps of four different integrated energy management systems under both comparative and optimal operating conditions. In the comparative conditions, the COP of the MC/RHP/MPCC and MC/BHP/MPCC systems are relatively similar, both hovering around 6. However, the MC/HP/MP-IEMS system significantly increases its COP value to around 14 due to preheating the ambient air, while the COP of the MC/DCHP/MP-IEMS is slightly higher than that of the MC/HP/MP-IEMS. In the optimal results, by reducing the system pressure, the COP values of the MC/RHP/MPCC and MC/HP/MP-IEMS systems are significantly improved, rising to approximately 9 and 16, respectively. Meanwhile, the COP of the MC/DCHP/MP-IEMS is slightly below 16 due to an increase in power consumption.
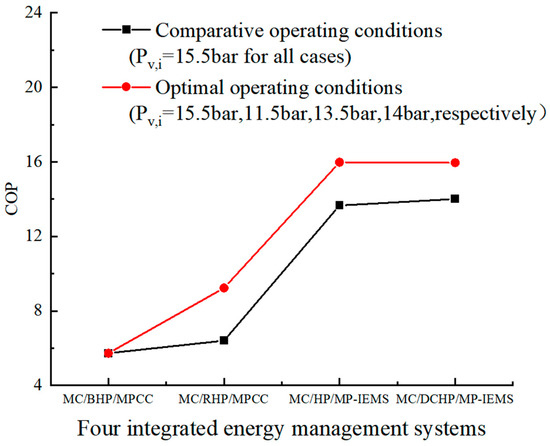
Figure 11.
Comparison of heating performance for four integrated energy management systems.
Figure 12 presents the whole cycle energy efficiency of four integrated energy management systems under both comparative and optimal operating conditions. There is no significant difference between the efficiency and the COP in their changing trend. Since the impact of preheating ambient air is considered in the whole cycle energy efficiency, there is a significant improvement in the whole cycle energy efficiency of MC/HP/MP-IEMS and MC/DCHP/MP-IEMS, which exceeds 25 under optimal operating conditions.
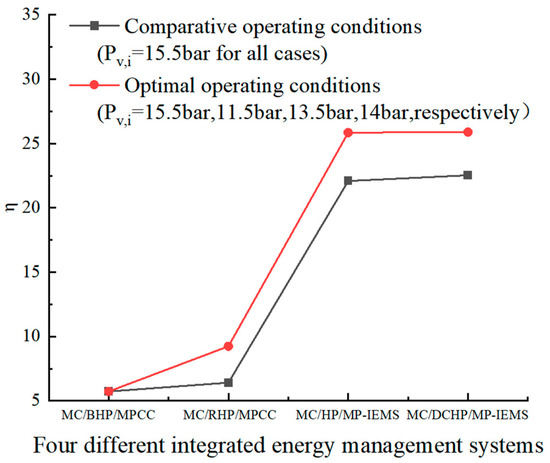
Figure 12.
Comparison of energy efficiency for four integrated energy management systems.
After evaluating the four integrated energy management systems, both MC/HP/MP-IEMS and MC/DCHP/MP-IEMS demonstrate superior performance in terms of the coefficient of performance (COP) and whole cycle energy efficiency (η) compared to MC/BHP/MPCC and MC/RHP/MPCC. Although MC/DCHP/MP-IEMS offers a slight edge in efficiency, its complex structure may lead to higher operational challenges. In contrast, MC/HP/MP-IEMS achieves high energy efficiency with a simpler structure and fewer components, thereby reducing the risk of failures. Moreover, the ease of operation of MC/HP/MP-IEMS makes it more suitable for industrial applications.
From an economic perspective, the advantages of MC/HP/MP-IEMS are particularly evident. Its simple structure not only reduces maintenance costs and the risk of failures but also decreases the initial investment and operating expenses. This simplicity results in lower initial investment and operating costs for the system, enhancing its economic feasibility in industrial settings. In contrast, although MC/DCHP/MP-IEMS achieves a slight improvement in efficiency, its complex structure may lead to higher maintenance costs and operational challenges, thereby offsetting its efficiency benefits to some extent.
3.4. Effect of Refrigerant Types on Thermal Performance of Different Mold Cooling/Heat Pump/Material Preheating Integrated Energy Management Systems
Considering COP, whole cycle energy efficiency and the complexity of the system, MC/HP/MP-IEMS demonstrates the best performance among the four integrated energy management systems. Therefore, this section will take the MC/HP/MP-IEMS as an example to investigate the thermophysical properties and cycle performance parameters of different refrigerants under identical operating conditions. The objective is to identify refrigerants with excellent cycle performance, environmental friendliness, and stable thermodynamic properties for high-temperature heat pumps. This will provide data support and theoretical foundations for future in-depth research under operating conditions with higher condensation temperatures.
Refrigerant properties, such as thermal stability and boiling point, significantly influence the overall performance of heat pump systems. These properties determine the efficiency and operating range of the heat pump. For instance, a refrigerant with a low boiling point can effectively absorb heat at lower temperatures, enhancing the system’s heating capacity. Conversely, thermal stability ensures that the refrigerant remains stable across a wide temperature range, preventing degradation and maintaining system reliability. The choice of refrigerant is crucial for optimizing heat pump efficiency and ensuring long-term operation.
Given that the temperature of the hot air generated in this study reaches 110 °C, the condensation temperature of the refrigerant should exceed 110 °C. Furthermore, the condensation temperature of the refrigerant should be lower than its critical temperature. Therefore, refrigerants with critical temperatures between 130 °C and 200 °C were screened from the REFPROP software, and the screening results are shown in Table 6.
Table 6.
Properties of refrigerant.
The simulation results are shown in Figure 13. The boundary conditions and mass flow rate used in the simulation are the same as in Section 3.1. The simulation results depict the performance of different refrigerants under optimal operating conditions. According to the results shown in Figure 13, R123 exhibits excellent performance in terms of total power consumption, coefficient of performance in heat pump (COP), and whole cycle energy efficiency. In particular, the COP of R123 can reach 17.69, and the whole cycle energy efficiency can achieve 28.61, both significantly outperforming those of other refrigerants. The low total power consumption (0.23 kW) and high whole-cycle energy efficiency (28.608) of R123 confirm its superior performance in heat pump systems. The low total power consumption implies that R123 consumes less electrical energy during operation, which contributes to reducing operational costs. This indicates that R123 provides high energy utilization efficiency and low operational costs in high-temperature heat pump systems.
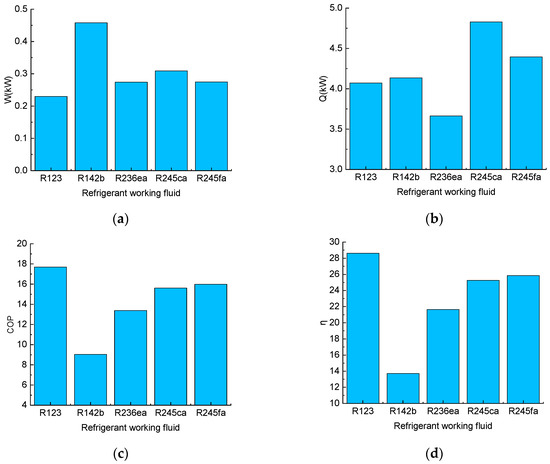
Figure 13.
Heat performance of different refrigerants in the MC/HP/MP-IEMS system. (a) total power consumption. (b) heat production. (c) COP (d) whole cycle energy efficiency.
R245fa exhibits a moderate total power consumption of 0.275 kW, indicating that it consumes an appropriate amount of power during operation. With a heat production of 4.40 kW, it demonstrates the ability to provide a substantial amount of thermal energy per unit of time. Due to its favorable heat transfer characteristics, both the COP and the whole cycle energy efficiency are enhanced to be 15.98 and 25.85, respectively, albeit slightly lower than that of R123. Nevertheless, R245fa still exhibits good cycle performance in high-temperature heat pump systems. Following R245fa, R245ca, R236ea, and R142b rank lower in terms of their COP values and η values, respectively.
In summary, R123 exhibits the best performance in high-temperature heat pump systems, particularly at high condensation temperatures. Its low total power consumption, high COP values, and high overall energy efficiency (η) make it an ideal refrigerant. However, R123 belongs to the hydrochlorofluorocarbons (HCFCs) category of refrigerants, which have ozone-depleting potential [27]. According to the Montreal Protocol, R123 will be phased out by 2030. Therefore, R245fa, which exhibits the second-best performance, is selected as the most suitable refrigerant for this study. R245ca can also serve as a potential alternative.
4. Conclusions
This study constructed a model of integrated energy management systems for mold cooling/heat pump/material preheating of injection-molding machines. With the symmetry of the thermodynamic performance of the heat pump components, the configuration and parameters of the coupled system were optimized. Four configurations were investigated: MC/BHP/MPCC, MC/RHP/MPCC, MC/HP/MP-IEMS, and MC/DCHP/MP-IEMS. Based on these configurations, the characteristics of refrigerants that match the system parameters were investigated. The main conclusions obtained are as follows.
- (1)
- Simulation analysis was performed on four integrated energy management systems, examining the pressure, temperature, specific enthalpy, void fraction, and heat at the inlet and outlet of each component during their cycles. This analysis yielded energy consumption, heat production, coefficient of performance (COP), and whole cycle energy efficiency (η) for each system. Additionally, T-q, T-s, and P-h diagrams were analyzed. The results revealed that MC/HP/MP-IEMS and MC/DCHP/MP-IEMS exhibited the best thermodynamic performance. Both systems consumed 0.32 kW of energy. Compared to MC/BHP/MPCC, MC/HP/MP-IEMS improves COP by 138% (from 13.66) and η by 286% (from 22.09), while MC/DCHP/MP-IEMS enhances COP by 144% (from 14.00) and η by 293% (from 22.53). However, given the complexity of the structure of MC/DCHP/MP-IEMS, MC/HP/MP-IEMS is recommended as the optimal integrated energy management system solution for injection-molding machines.
- (2)
- The paper compares energy consumption, heat production, COP, and whole cycle energy efficiency of different integrated energy management systems using MC/HP/MP-IEMS as an example, under both comparative and optimal conditions. In MC/RHP/MPCC, MC/HP/MP-IEMS, and MC/DCHP/MP-IEMS, the optimal condition is obtained when the outlet pressure of the throttle valve is 5.5 bar, and the outlet pressure of the compressor is 11.5 bar, 13.5 bar, and 14 bar, respectively. Under these conditions, COP and η values increase to approximately 9, 16, 16, and 9, 26, 25, respectively.
- (3)
- The paper investigates the thermodynamic properties of five different refrigerants using MC/HP/MP-IEMS as an example. Among them, R123 exhibits the best performance with a COP value of 17.69 and whole cycle energy efficiency of 28.61. However, due to its ozone-depleting potential, R123 will be phased out by 2030. R245fa, which is slightly inferior to R123 in terms of total power consumption, performs remarkably well with a COP of 16 and a whole-cycle energy efficiency of 25.5, making it a viable alternative. R245ca can also serve as a substitute. The remaining two refrigerants, R236ea, and R142b, demonstrate inferior overall performance compared to the aforementioned three.
In the current study, we have focused on optimizing the thermal performance of the integrated energy management system for injection-molding machines through theoretical analysis and simulation. However, the potential of machine learning models, particularly Long Short-Term Memory (LSTM) neural networks, to further enhance system performance should not be overlooked. LSTM networks can process time-series data to predict system performance metrics such as the coefficient of performance (COP) and overall cycle energy efficiency (η). By analyzing historical data, these models can identify optimal system configurations and dynamically adjust parameters in real time to adapt to varying operating conditions. This capability not only improves energy efficiency but also enhances system reliability through early fault detection. Future work could explore integrating LSTM models with existing optimization techniques to achieve more intelligent and adaptive energy management systems [28,29,30].
Author Contributions
Conceptualization, Y.D. and P.X.; Methodology, Y.D. and W.Y.; Software, Y.T. and H.H.; Validation, H.H.; Formal analysis, T.W.; Investigation, Y.T.; Writing—original draft, Y.T.; Writing—review & editing, H.H.; Visualization, T.W. and P.X.; Supervision, W.Y. All authors have read and agreed to the published version of the manuscript.
Funding
Financial support by Fundamental Research Funds for the National Natural Science Foundation of China (NSFC) project (Grant No. 52476049) and the Fundamental Research Funds for the Central Universities (Grant No. buctrc202138 and buctrc202301) is gratefully acknowledged.
Data Availability Statement
Data are contained within the article.
Conflicts of Interest
The authors declare no conflict of interest.
Nomenclature
| Abbreviations | |
| COP | coefficient of performance |
| MC/BHP/MPCC | mold cooling/basic heat pump/material preheating combined cycle |
| MC/RHP/MPCC | mold cooling/regenerative heat pump/material preheating combined cycle |
| MC/HP/MP-IEMS | mold cooling/heat pump/material preheating integrated energy management system |
| MC/DCHP/MP-IEMS | mold cooling/dual-stage compression heat pump/material preheating integrated energy management system |
| PC | polycarbonate |
| Symbols | |
| T | temperature, °C |
| P | pressure, bar |
| q | transferred heat, kW |
| h | specific enthalpy, kJ/kg |
| m | mass flow rate, kg/s |
| X | gas void fraction, % |
| W | total power consumption, kW |
| W1 | 1st compression power consumption, kW |
| W2 | 2nd compression power consumption, kW |
| s | entropy, kJ/(kg·K) |
| Q | heat generation of the system, kW |
| Greek symbols | |
| actual value | |
| η | system efficiency |
| Subscripts | |
| air | hot air generated in the condenser |
| air1 | hot air generated in the cooling water/air heat exchanger |
| air2 | hot air generated in the intermediate heat exchanger |
| cf | cold fluid |
| C | condensate |
| vaporization | |
| hot fluid | |
| regenerator | |
| inlet | |
| Theoretical maximum value | |
| outlet | |
| compressor | |
| saturation | |
| time | |
| throttle valve | |
| liquid refrigerant | |
| absorb |
References
- Liu, H.; Zhang, X.; Quan, L.; Zhang, H. Research on energy consumption of injection molding machine driven by five different types of electro-hydraulic power units. J. Clean. Prod. 2020, 242, 118355. [Google Scholar] [CrossRef]
- Iwko, J.; Wroblewski, R.; Steller, R. Experimental study on energy consumption in the plasticizing unit of the injection molding machine. Polimery 2018, 63, 362–371. [Google Scholar] [CrossRef]
- Lovrec, D.; Ti, V.; Taner, T. Dynamic behaviour of different hydraulic drive concepts-comparison and limits. Int. J. Simul. Model 2017, 16, 448–457. [Google Scholar] [CrossRef]
- Xinhua News Agency. Opinions of the Central Committee of the Communist Party of China and the State Council on Fully and Faithfully Implementing the New Development Philosophy to Achieve Carbon Peaking and Carbon Neutrality. Available online: https://www.gov.cn/xinwen/2021-10/25/content_5644687.htm (accessed on 25 October 2021).
- Park, H.S.; Nguyen, T.T. Optimization of injection molding process for car fender in consideration of energy efficiency and product quality. J. Comput. Des. Eng. 2014, 1, 256–265. [Google Scholar] [CrossRef]
- Lucchetta, G.; Masato, D.; Sorgato, M. Optimization of mold thermal control for minimum energy consumption in injection molding of polypropylene parts. J. Clean. Prod. 2018, 182, 217–226. [Google Scholar] [CrossRef]
- Mattila, J.; Virvalo, T. Energy-efficient motion control of a hydraulic manipulator. IEEE Int. Conf. Robot. Autom. 2000, 3, 3000–3006. [Google Scholar]
- Matsuo, S.; Himeno, T.; Bessho, M.; Tsutsui, K.; Kato, N.; Mizuno, T. World’s first 3,000 ton mold clamping force electric injection molding machine. Mitsubishi Heavy Ind. Ltd. Tech. Rev. 2006, 43, 1–6. [Google Scholar]
- Imamura, T.; Sawada, Y.; Ichikawa, M.; Nakamura, H. Energy-saving hybrid hydraulic system comprising highly efficient IPM motor and inverter, for injection molding and manufacturing machine. In Proceedings of the JFPS International Symposium on Fluid Power, Toyama, Japan, 15–18 September 2008; Volume 9, pp. 117–120. [Google Scholar]
- Zhang, H.; Ren, L.; Gao, Y.; Jin, B. A comprehensive study of energy conservation in electric-hydraulic injection-molding equipment. Energy 2017, 10, 1768. [Google Scholar] [CrossRef]
- Takahashi, K.E.; Okamoto, M.; Hiraki, E.; Tanaka, T. Simulation analysis of energy-saving effect of an energy recovery system for electric motor drive system in the injection molding machine. In Proceedings of the Power Electronics & Motion Control Conference, Ohrid, Macedonia, 21 October 2010. [Google Scholar]
- Lu, N.Y.; Gong, G.X.; Yang, Y.; Lu, J.H. Multi-objective process parameter optimization for energy saving in injection molding process. J. Zhejiang Univ. Sci. A (App. Phys. Eng.) 2012, 13, 382–394. [Google Scholar] [CrossRef]
- Yin, K.H. Dynamic Optimisation for Energy Efficiency of Injection Moulding Process. Ph.D. Thesis, University of Nottingham, Nottingham, UK, 2015. [Google Scholar]
- Mianehrow, H.; Abbasian, A. Energy monitoring of plastic injection molding process running with hydraulic injection molding machines. J. Clean Prod. 2017, 148, 804–810. [Google Scholar] [CrossRef]
- Meekers, I.; Refalo, P.; Rochman, A. Analysis of process parameters affecting energy consumption in plastic injection moulding. Procedia CIRP. 2018, 69, 342–347. [Google Scholar] [CrossRef]
- Moussaoui, H. Achieving energy savings and process optimization in plastic injection molding: A design of experiments study. J. Clean. Prod. 2024, 477, 143835. [Google Scholar] [CrossRef]
- Othman, N.A. Sustainable Manufacturing: Optimization of Electrical Energy Consumption in Plastic Injection Molding Process. Master’s Thesis, Universiti Utara Malaysia, Kedah, Malaysia, 2015. [Google Scholar]
- Rashid, O.; Low, K.W.Q.; Pittman, J.F.T. Mold cooling in thermoplastics injection molding: Effectiveness and energy efficiency. J. Clean Prod. 2020, 264, 121375. [Google Scholar] [CrossRef]
- Brückner, S.; Liu, S.; Miró, L.; Radspieler, M.; Cabeza, L.F.; Lävemann, E. Industrial waste heat recovery technologies: An economic analysis of heat transformation technologies. Appl. Energy 2015, 151, 157–167. [Google Scholar] [CrossRef]
- Jouhara, H.; Khordehgah, N.; Almahmoud, S.; Delpech, B.; Chauhan, A.; Tassou, S.A. Waste heat recovery technologies and applications. Therm. Sci. Eng. Prog. 2018, 6, 268–289. [Google Scholar] [CrossRef]
- Mahmoudi, A.; Fazli, M.; Morad, M.R. A recent review of waste heat recovery by organic rankine cycle. Appl. Therm. Eng. 2018, 143, 660–675. [Google Scholar] [CrossRef]
- Zhao, Y.; Liu, G.; Li, L.; Yang, Q.; Tang, B.; Liu, Y. Expansion devices for organic rankine cycle (ORC) using in low temperature heat recovery: A review. Energy Convers. Manag. 2019, 199, 111944. [Google Scholar] [CrossRef]
- Wang, E.; Yu, Z.; Zhang, H.; Yang, F. A regenerative supercritical-subcritical dual-loop organic rankine cycle system for energy recovery from the waste heat of internal combustion engines. Appl. Energy 2017, 190, 574–590. [Google Scholar] [CrossRef]
- Michael, L.; O’Toole, K. A new technology for cost effective low grade waste heat recovery. Energy Procedia 2017, 123, 188–195. [Google Scholar]
- Xiao, S.Q.; Nefodov, D.; Richter, M.; Wördemann, M.; Urbaneck, T. Large heat pumps with hot water store in local heating systems–Investigation of operation strategies. J. Energy Storage 2023, 63, 106924. [Google Scholar] [CrossRef]
- Szymiczek, J.; Szczotka, K.; Banaś, M.; Jura, P. Efficiency of a compressor heat pump system in different cycle designs: A simulation study for low-enthalpy geothermal resources. Energies 2022, 15, 5546. [Google Scholar] [CrossRef]
- Heath, E.A. Amendment to the Montreal protocol on substances that deplete the ozone layer. Int. J. Mater. Res. 2017, 56, 193–205. [Google Scholar]
- Xie, Y.; Hu, P.; Zhu, N.; Lei, F.; Xing, L.; Xu, L.; Sun, Q. A hybrid short-term load forecasting model and its application in ground source heat pump with cooling storage system. Renew. Energy 2020, 161, 1244–1259. [Google Scholar] [CrossRef]
- Yong, H.E.; Chung, Y.; Min, S.P.; Hong, S.B.; Min, S.K. Deep learning-based prediction method on performance change of air source heat pump system under frosting conditions. Energy 2021, 228, 120542. [Google Scholar]
- Wang, C.R.; Yu, X.; Han, C. Performance prediction of a ground source heat pump system using denoised long short-term memory neural network optimised by fast non-dominated sorting genetic algorithm-II. Geothermics 2014, 120, 103002. [Google Scholar]
Disclaimer/Publisher’s Note: The statements, opinions and data contained in all publications are solely those of the individual author(s) and contributor(s) and not of MDPI and/or the editor(s). MDPI and/or the editor(s) disclaim responsibility for any injury to people or property resulting from any ideas, methods, instructions or products referred to in the content. |
© 2025 by the authors. Licensee MDPI, Basel, Switzerland. This article is an open access article distributed under the terms and conditions of the Creative Commons Attribution (CC BY) license (https://creativecommons.org/licenses/by/4.0/).