Article

Impact and Post-Impact Compression Buckling Behavior of Symmetrical Foam-Filled Hat-Stiffened Panels

1
Hubei Key Laboratory of Modern Manufacturing Quantity Engineering, School of Mechanical Engineering, Hubei University of Technology, Wuhan 430068, China
2
Shanghai Institute of Aerospace Systems Engineering, Shanghai 201100, China
3
AVIC SAC Commercial Aircraft Company Ltd., Shenyang 201108, China
4
National Frontiers Science Center for Industrial Intelligence and Systems Optimization, Northeast University, Shenyang 110819, China
*
Author to whom correspondence should be addressed.
Symmetry 2025, 17(4), 570; https://doi.org/10.3390/sym17040570
Submission received: 3 March 2025 / Revised: 3 April 2025 / Accepted: 6 April 2025 / Published: 9 April 2025
(This article belongs to the Special Issue Symmetry in Impact Mechanics of Materials and Structures)

Abstract

:
This study investigates the mechanical behavior and failure mechanisms of SFHCPs under low-velocity impact and compression after impact (CAI) conditions. Symmetric foam-filled hat-stiffened composite panels (SFHCPs) are widely used in critical load-bearing structures such as vessels and aircraft due to their high strength-to-weight ratio and integrated stiffener design. However, due to the material’s high sensitivity to impact, it is necessary to conduct a systematic evaluation of its application reliability. By integrating experimental testing and numerical simulation, the buckling modes characterized by symmetry and envelope number were adopted as key performance indicators. The integration of an optical buckling measurement method with iterative finite element model (FEM) updates significantly enhances model accuracy and computational efficiency. Experimental results indicate that for specimens impacted at the mid-section of the stiffener the residual compressive strength drops sharply from 106 kN to 40.6 kN (a reduction of 61.7%), with the buckling mode changing from a symmetric four-wave pattern in the undamaged state to localized buckling in the impact region, leading to brittle failure. The integration of FPP data improved the accuracy of the FEM, highlighting the critical influence of the symmetry of the buckling mode in optimizing impact-resistant composite structures.

1. Introduction

Fiber-reinforced resin composites, characterized by superior corrosion resistance, high specific strength, and enhanced design flexibility, are widely used in aerospace applications [1]. Composite panels with foam-filled hat stiffeners have been effectively applied in engineering structures owing to their excellent impact resistance [2]. The hat stiffener exhibits a fully enclosed geometry containing multiple geometric parameters with significant optimization potential [3]. Furthermore, the integration of soft foam materials with excellent energy absorption capacity has made this configuration a prevalent form of composite stiffened structures for impact resistance enhancement [4,5,6]. Low-speed impacts are one of the most common threats to composite stiffened structures. When a composite stiffened panel experiences an external impact, it results in a permanent indentation on the skin surface and induces a larger internal damage area, ultimately leading to a reduction in the local stiffness of the impacted region [7,8,9,10]. When composite panels with internal impact damage are subjected to loads, their buckling and post-buckling behavior become more complex. The internal damage also induces significant local deformation, which can lead to failure modes such as fiber breakage, matrix cracking, delamination, debonding, and stiffener/skin separation. These failure mechanisms may ultimately result in the sudden collapse of the entire composite stiffened panel, leading to catastrophic consequences [11]. Therefore, investigating the mechanical behavior of SFHCPs under low-velocity impact, as well as their residual strength and stability under CAI, is of great significance for the design of impact-energy-absorbing composite structures.
Many scholars have conducted both experimental and numerical studies on the mechanical behavior of composite laminates under low-velocity impact and CAI, and they have conducted more detailed discussions on the propagation mechanisms of impact-induced damage and its effects on the residual compressive strength of composite panels. Wang et al. [12] established an analytical model using the energy principle and variational method in mechanics, and based on this model they predicted the CAI residual compressive strength of foam sandwich panels with lattice webs. Yang et al. [13] fabricated several foam core sandwich panels using six types of face sheets (comprising pure carbon fiber, glass fiber, and hybrid fibers) via vacuum-assisted resin infusion (VARI), and subsequently investigated the impact response and residual compressive strength of different sandwich structures through CAI tests. Although existing numerical models can be utilized to analyze and optimize the design of impact-resistant composite structures, as well as accurately predict their buckling characteristics and failure modes, a substantial amount of experimental data are still required to rigorously validate their accuracy [14,15]. Al-Saymaree et al. [16] used digital image correlation (DIC) technology to track the out-of-plane displacement and modal transitions of thin-walled stiffened plates in real time, and based on the finite element model (FEM), revealed the sensitivity of seam defects to local buckling. Wu et al. [17] proposed integrating a fiber Bragg grating (FBG) sensor network with machine learning algorithms to establish a strain–displacement mapping relationship through ANSYS (version 2022) simulations, thereby achieving dynamic shape reconstruction of flexible thin-walled structures. Zhang et al. [18] employed 3D laser scanning to quantify the geometric defects of additively manufactured cylindrical shells, and by combining full-field strain monitoring using DIC with compression test data, they validated the numerical model’s capability in predicting local buckling loads. Compared with other optical measurement methods, fringe projection profilometry (FPP) not only offers the advantages of non-contact, full-field measurement but also achieves large depth-of-field measurements [19,20], making it more suitable for monitoring the discontinuous surface morphology of stiffened wall structures [21]. Moreover, the abundant experimental data provided by FPP, especially the real-time buckling data of stiffened plates, is highly beneficial for guiding the correction of numerical models, thereby enabling a more efficient establishment of more accurate numerical models for effectively analyzing the CAI failure mechanism of composite stiffened plates.
In summary, it is necessary to further investigate and validate the CAI failure mechanism of SFHCPs using a method that combines FPP with numerical models [22,23]. This paper investigates the impact and post-impact compression behavior of SFHCPs. Based on the dimensions and fabrication process of the SFHCP specimens, impact tests, and corresponding CAI experiments were performed. The full-field deflection of the stiffened panels was measured using phase-shift encoded FPP. By integrating the photoelastic results, an FEM for post-impact compression was developed. The CAI test process for symmetric foam-filled hat-stiffened panels with impact damage was simulated, and the propagation of impact-induced damage during CAI testing, as well as its effects on the buckling behavior and final failure mode of the stiffened panels, was analyzed.

2. Experiment

2.1. SFHCP Specimen Descriptio

The SFHCP specimens feature a hat-stiffened composite laminate structure with dimensions of 440 mm × 260 mm, featuring cross-sectional geometry and dimensions, as Figure 1 illustrates. The skin and stiffener are fabricated from ZT7G/LT-03A composite material with a single-ply thickness of 0.125 mm, where the 0° fiber direction aligns with the panel’s length. The skin has a thickness of 2 mm and a symmetric layup sequence of [45/90/0/−45/0/−45/45/0]S, while the stiffener is 0.5 mm thick with a layup sequence of [−45/90/45/0], where the outermost layer of the stiffener flange is oriented at 0°. The core material utilizes PMI-B75-X foam, and the panel-to-panel bonding employs LWF-2B adhesive film. The foam core’s bottom R-zone is filled with ZT7G/LT-03A unidirectional tape wrapped in one layer of LWF-2B film. The stiffened panels were fabricated via a co-bonding and co-curing process, wherein the skin is first pre-cured and then adhesively bonded and co-cured with the foam core and stiffeners. Unspecified dimensional tolerances are determined through coordinated design or adhere to general tolerances per the HB5800 standard [24]. All specimens undergo non-destructive testing in compliance with the composite structure non-destructive testing acceptance criteria.
SFHCPs have been widely utilized in critical load-bearing structures of transport systems (e.g., vessels and aircraft) due to their high strength-to-weight ratio and integrated rib design. However, the impact sensitivity of composite materials necessitates careful evaluation of the feasibility of SFHCPs in such applications. This study focuses on the most impact-vulnerable region of SFHCPs (the mid-span of stiffeners) through CAI experiments. By integrating optical measurements of buckling modes, we characterize the mechanical behavior of SFHCPs under post-impact compression. A numerical model was employed to analyze failure modes, and design optimization recommendations were ultimately proposed.

2.2. Course of an Impact

2.2.1. Principles of Impact Energy Selection

Low-velocity impact is defined as “a falling weight of 10–20 pounds dropped from a height of a few feet” [25], and it is easy to calculate that this impact energy is below 100 J, but more studies use an even lower impact energy (<40 J). In the research on the CAI tests of composite stiffened panels, impact energies of 15~30 J [26], 6.5~29.5 J [27], and 32 J [28] have been used. Even in the experimental studies of low-velocity impact on impact-resistant fabric composite structures, the selected impact energy is only 35 J [6].
On the other hand, considering that the experiment is an approximate simulation of the actual working conditions, low-velocity impact tests are also conducted to simulate situations such as a tool falling onto a composite structure. Therefore, many scholars also regard invisible impact damage as a criterion for defining low-velocity impact [26]. This definition is more precise and aligns with the actual working conditions. In fact, most low-velocity impact damage occurs within the composite material and is not visible to the naked eye. This hidden threat increases the risk of failure in composite load-bearing structures, highlighting the critical need for further research.
In the impact test, the impact energy is obtained by calculating the product of the dropped weight’s mass and the release height. In this study, the selection of impact energy considered two factors: one is the impact energy range (<30 J); the other is that the impact damage is invisible. Specifically, the impact pit is not discernible to the naked eye at a distance of 1.5 m from the impact site on the SFHCP specimen. The second criterion is based on the experience of visual inspection of the impact pit, which is also the situation where the composite panel will not be maintained in actual application.
Before conducting low-velocity impact tests, it is necessary to determine the appropriate impact energy through experiments. This involves impacting the composite materials within a certain energy range (<30 J) and identifying the critical impact energy value at which the impact damage is not visible to the naked eye. This critical value serves as the low-velocity impact energy.

2.2.2. Impact Position

This study considers the impact of low-velocity impact on the CAI mechanical properties of SFHCPs at the symmetric center of the hat-stiffened side. The impact location is at the symmetric center of the hat-stiffened side, as marked ‘♣’ in Figure 1a. In comparison, there is also SFHCP specimen A, which is an intact SFHCP that has not been impacted. Additionally, to facilitate comparison, impact tests were carried out on the skin in the non-foam core region of the panel (marked ‘♠’ in Figure 1a) and on the center of the skin at the back of the hat-stiffener (marked ‘◆’ in Figure 1a).

2.2.3. Impact Fixture

According to the standard ASTM D7136 [29] for carrying out low-speed impact test, falling hammer impact test machine (BTF-2000, 300 J, Changchun Pitefu Technology Co., Ltd., Changchun, China) was used on the stiffened panel to carry out a low-speed impact test to prefabricate the impact damage [25], which is shown in Figure 2a. The test fixture for the low-velocity impact SFHCP specimen was also designed according to the ASTM D7136 standard [29], with specific design dimensions shown in Figure 2d. The SFHCP specimen was clamped at the near corners of the four right angles by point contact to ensure that the stiffened panel did not move during the impact, as shown in Figure 2c. The shape of the hemispherical impact hammer is shown in Figure 2b.
The impact hammer possesses a mass of 1.932 kg, while the diameter of its head measures 12.7 mm. The drop height is calculated based on the preset impact energy, and the impact hammer is lifted to the preset height and released after stabilization. The drop hammer falls freely through two guide rails, and the hemispherical steel impact hammer head fixed on the drop hammer impacts the SFHCP specimen in the designated area with the set energy. Following the initial impact, the drop hammer immediately rebounds. It is necessary to promptly engage the secondary impact prevention device via the associated air pump to limit the downward movement of the drop hammer and prevent a secondary impact.

2.2.4. Impact Energy Determination

Regarding the impact location ‘Hat Stiffener Center ♣’, since the impact is on the stiffener where the number of composite layers is only 1/4 that of the panel, an impact energy of 7 J can produce an indentation with a depth of 1.55 mm (slightly visible to the naked eye at a distance of 1.5 m). To verify the validity of this impact energy (7 J), three repeated impact tests were conducted on the impact location ‘Hat Stiffener Side Center ♣’, with the critical impact energy set at 7 J each time, resulting in similar impact indentations. The experimental matrix is shown in Table 1.

2.3. CAI Tests

2.3.1. SFHCP Specimen and Fixture Installation

The compression test fixture was designed based on the standard ASTM D7137 [30], with the bottom and top of the fixture secured to the lower and upper ends of the SFHCP specimen using bolts to establish fixed boundary conditions, as shown in Figure 3a. The sides of the fixture consist of two wedge blocks, which contact the sides of the SFHCP specimen through the wedge edges, as shown in Figure 3b, Simply supported boundary conditions can be achieved by restricting only the out-of-plane displacements of the SFHCP specimen, while allowing its out-of-plane rotation. The purpose of this fixture design is to make the compression testing process as close as possible to the actual working conditions of the SFHCP specimen, meaning that the displacement of the surface flanges on both sides is restricted while out-of-plane rotation is unaffected. The installation of the SFHCP specimen and fixture is shown in Figure 3c.

2.3.2. Loading and Measuring Process

A pre-loading test was conducted before the formal test to ensure that the strain at the symmetrical positions of the SFHCP specimen was similar after the fixture and SFHCP specimen positions were adjusted. The pre-loading test used the same loading rate and clamping method as the formal test. However, only 10% of the ultimate load of the SFHCP specimen was applied, with this ultimate load value obtained from the ABAQUS (6.14-4) simulation predictions during the experimental design phase. The CAI test used a universal testing machine (CCS20T, Jinan Chenda Testing Machine Manufacturing Co., Ltd., Jinan, China) to apply the load, using a displacement control mode and maintaining a displacement loading rate of 0.5 mm/min until the SFHCP specimen failed.

3. Results and Discussion

3.1. Load–Displacement Curves

The load–displacement curves from CAI tests on specimens A (undamaged) and B (impact-damaged) are presented in Figure 4. It can be seen that the SFHCP specimen A without impact damage has a much higher load-carrying capacity, about 106 kN. In contrast, for the SFHCP specimen with impact damage, its remaining compressive strength has significantly decreased, and the load-carrying capacity of SFHCP specimen B (impact at the center of the hat stiffener) has dropped to 40.6 kN.
The damage caused by the impact at the center of the hat stiffener can be said to have a catastrophic effect on the load-carrying capacity of the SFHCP specimen, which is consistent with the observed and reported results in the studies that the gradual bending of the damaged stiffener leads to the overall bending of the panel and the growth of delamination between the stiffener and the skin [22,23].

3.2. Full-Field Buckling Mode

During the loading process, the buckling mode of the SFHCP was measured using the FPP. The specific model of the projector used is a Toshiba TLP-X2000 3LCD(Toshiba Corporation, Tokyo, Japan), with a standard resolution of 1024 × 768 pixels, a contrast ratio of 600:1, and a brightness of 2600 lumens. The specific model of the camera used is a Guppy F-080B(Allied Vision Technologies GmbH, Stadtroda, Germany), with an image resolution of 1024 × 768 pixels. Before the experiment, to overcome the interference of factors such as ambient light and mechanical vibration in the experimental scene, necessary preparations such as shading and vibration reduction were carried out, and the surface of the SFHCP specimen was wired and painted to ensure that the measured area met the diffuse reflection conditions. A robust optical measurement scheme using the 4-step phase-shifting method combined with the multi-frequency unwrapping method was adopted.
The evolution of buckling modes is a fundamental characteristic of the deformation of stiffened panels under compression. The FPP measurement results of the two SFHCP specimens are shown in Figure 5, and the initial buckling mode and the post-buckling mode exhibit significant similarities in terms of wave number and symmetry. Specimen A has distinct symmetrical buckling waveforms on both sides of the stiffener, with four almost symmetrical wave peaks and troughs distributed on the left- and right-side panels, as shown in Figure 5a. This buckling phenomenon is consistent with the observations reported in the study [31].
For SFHCP specimen B, which has impact damage on the hat-stiffened side as shown in Figure 5b, the reduced stiffness of the impact-damaged bars, combined with the pronounced protrusion of flexural waveforms in the bar area, led to load concentration, causing the stiffened panel to sustain direct damage without significant local buckling throughout the compression process. As the load increases, the damaged area delaminates and expands and the stiffener rapidly loses its original load-bearing capacity, leading to the overall bending failure of the stiffened panel.

4. Finite Element Simulation

4.1. Finite Element Model

Based on the ABAQUS (6.14-4) numerical simulation software, a low-velocity impact model and a CAI finite element model were established, and the finite element method was used to investigate the internal damage of symmetric composite stiffened panels during the impact process. Hashin failure criterion [32] was used to analyze the damage evolution and fracture of symmetric composite stiffened panels after impact compression.
The stiffened panel consists of the skin, stiffener, foam core, and filler. The skin layup is [45/90/0/−45/0/−45/45/0]S, and the stiffener layup is [−45/90/45/0]. The skin and stiffener each have a layer thickness of 0.125 mm. The entire SFHCP specimen was modeled, with the dimensions and layup of each component being identical to the actual specimen. An integrated modeling approach was adopted because the use of traditional shell elements together with cohesive elements has been proven to be the fastest method and the relative error of CAI strength is relatively low [33]. Zero-thickness cohesive elements were inserted between all connected components. In this study, SR4 elements were used for modeling the stiffener and skin, C3D8R solid elements were used for modeling the foam core and R-region filler, and COH3D8 cohesive elements based on the traction-separation model were used to simulate the interfaces between the stiffener and skin, and between the foam core and R-region filler. The hat-shaped stiffener was filled with a foam core, and the bottom of the foam core was filled with R-region filler. A “tie” binding connection was used between different components. The interface parameters are shown in Table 2, and the elastic and strength parameters of the single-layer board are presented in Table 3 and Table 4, respectively. Where Kn is the normal stiffness, Ks and Kt are both tangential stiffnesses of the cohesive manufacturer’s SFHCP specimen design. tn0, ts0, and tt0 and GnC, GtC, and GsC correspond to the ultimate strength and fracture toughness of the interface layer in the three directions at the beginning of the cracking process, respectively. E1, E2, and E3 are the elastic modulus along the fibers in the plane, the elastic modulus perpendicular to the fibers in the plane, and the elastic modulus in the thickness direction, respectively. G12, G13, and G23 are the three shear moduli, and v12 is the in-plane Poisson’s ratio. Xt, Xc, and Yt, and Yc, Zt, and Zc represent the tensile and compressive strengths in the three directions, respectively. S12, S13, and S23 are the shear strengths in the three directions. The FEM boundary conditions are set such that the Uy component is constrained on both sides. 
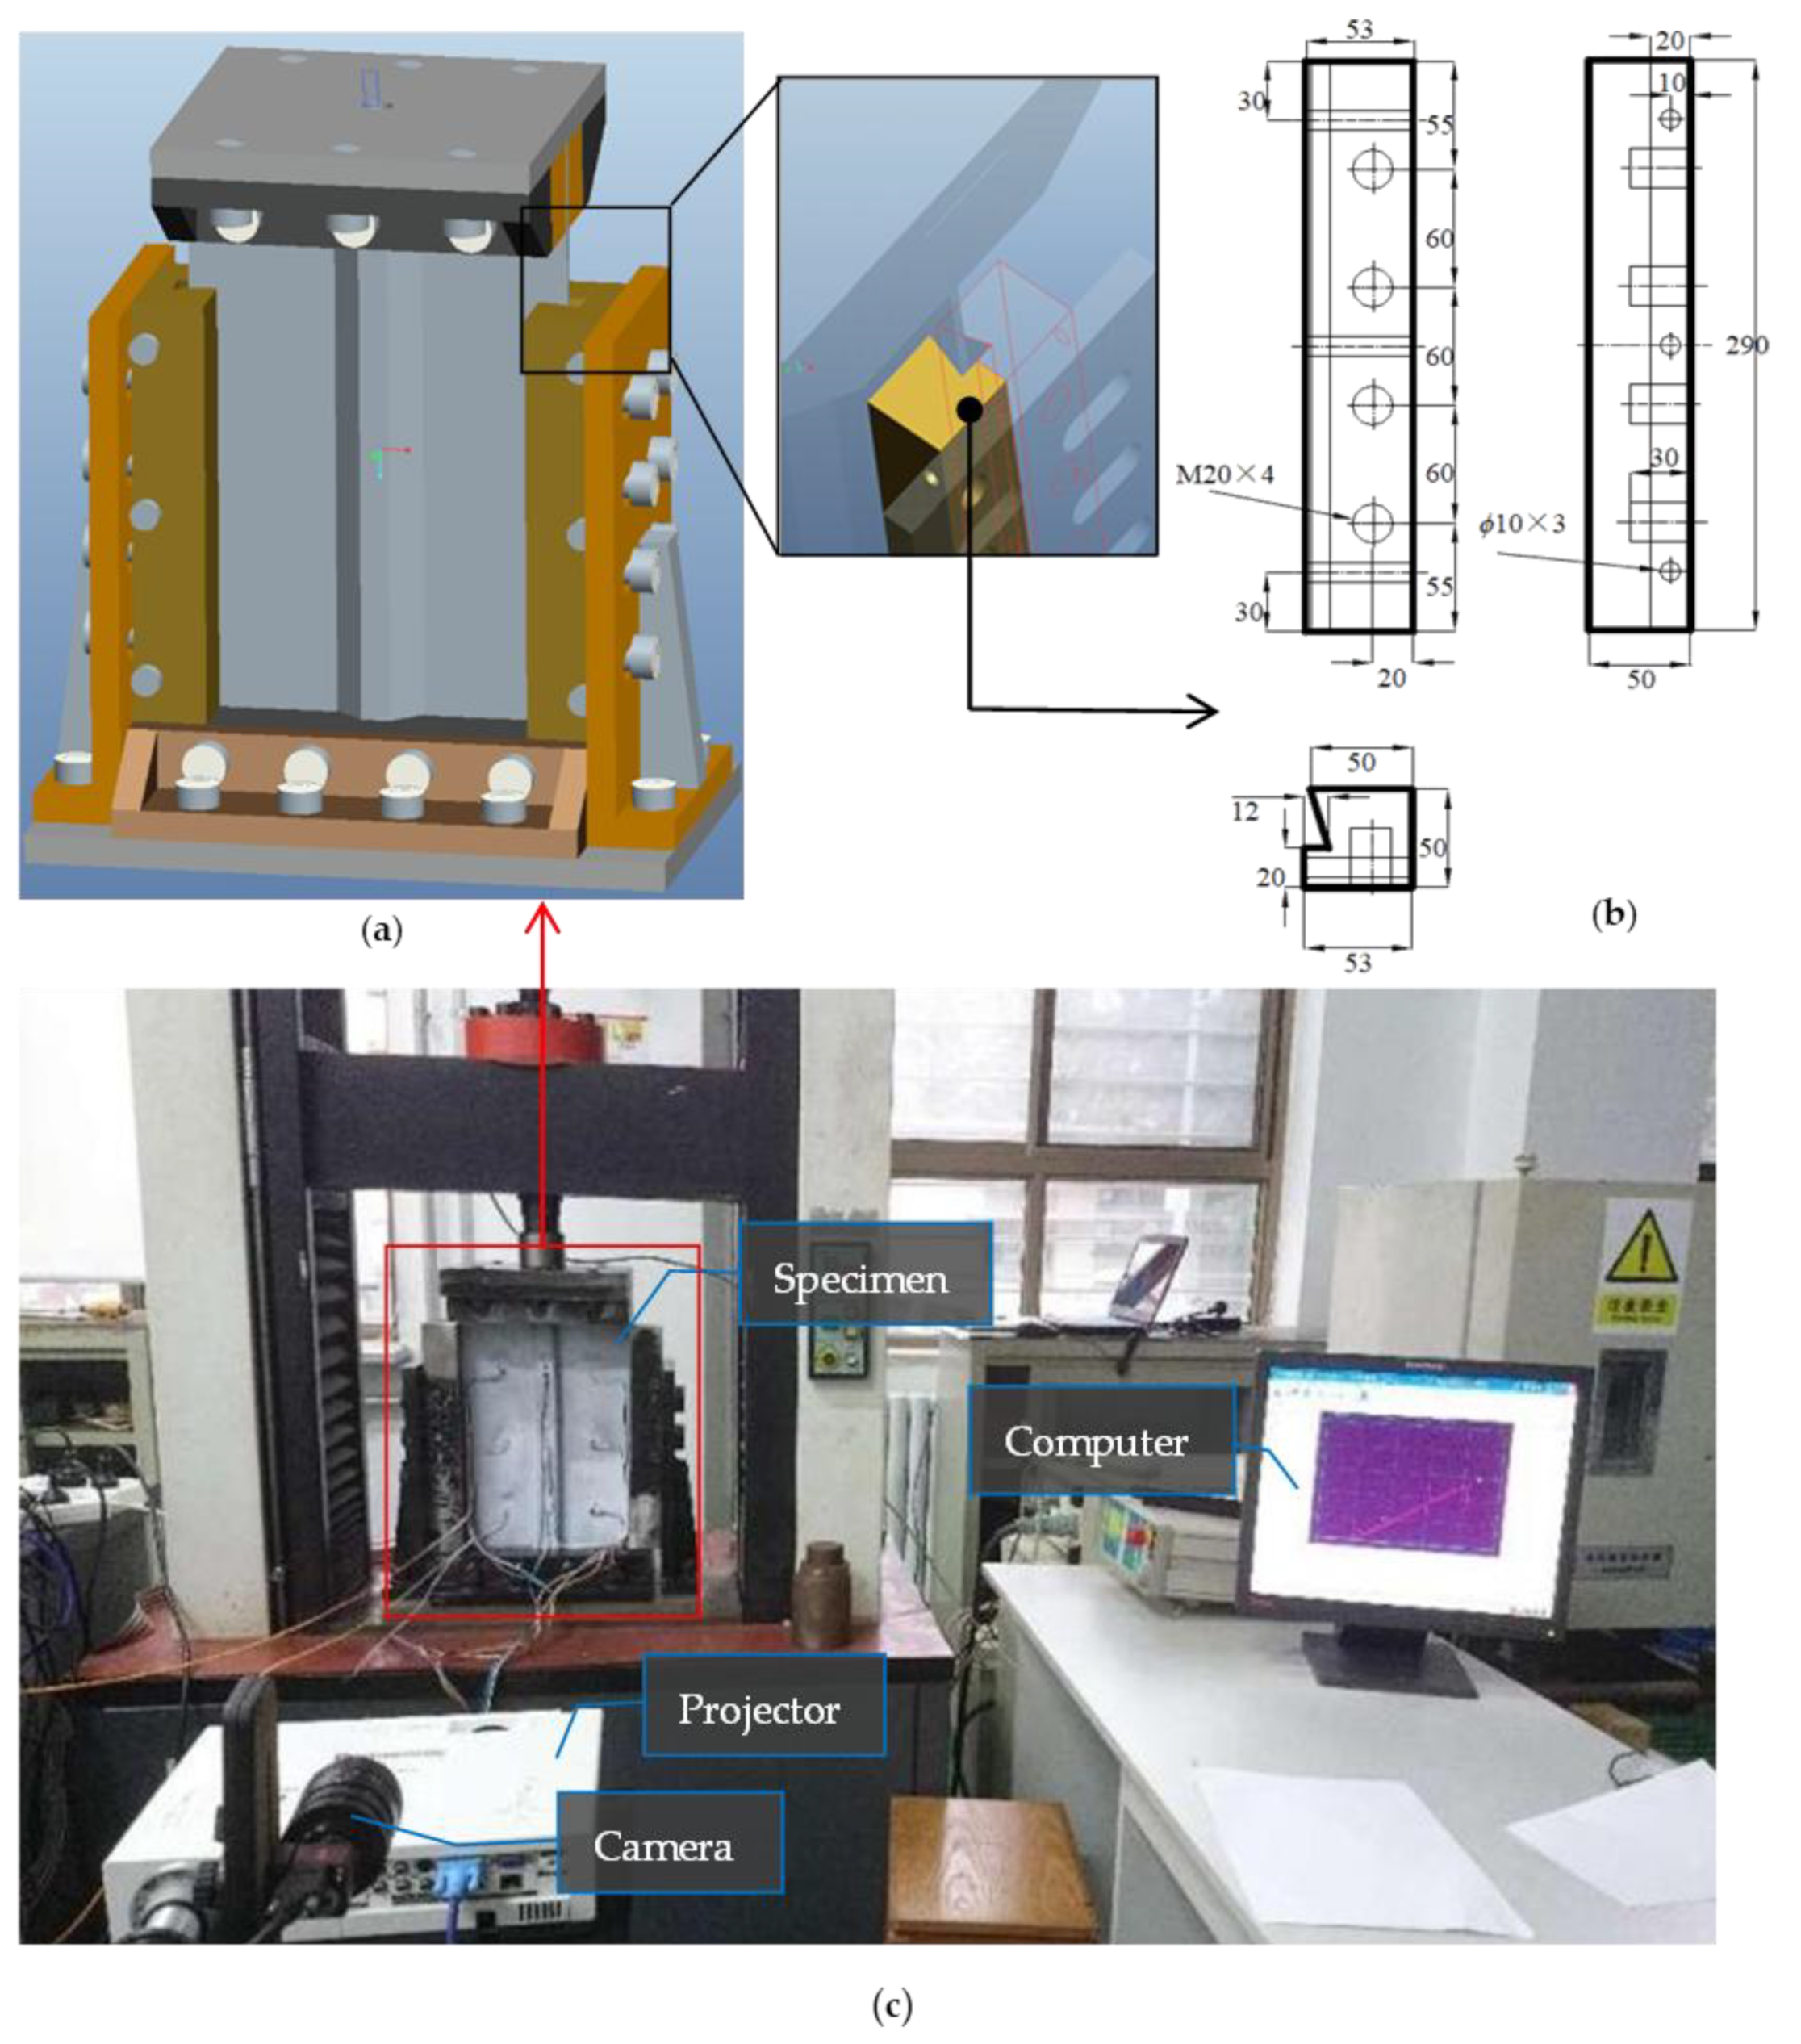
Figure 6a shows the boundary conditions for the finite elements of the SFHCP specimens. At the same time, the fixed constraints of Ux = Uy = Uz = 0 and URx = Ury = Urz = 0 are applied at the fixed end. The displacement load Uz is applied at the loading end with the constraints Ux = Uy = 0 and URx = Ury = Urz = 0.
When meshing the model, considering the accuracy of the numerical simulation results and the size of the computational scale, the dimensions in the FEM are the same as those of the actual SFHCP specimens. The overall mesh of the model is uniformly divided, with a mesh size of 5 mm for the skin panel and hat stiffener, resulting in 19,646 elements and 43,508 nodes. The foam core has a mesh size of 3 mm, and there are slight variations in mesh size at the corners of the stiffener, resulting in 167,340 elements and 199,948 nodes. The impact of finite element meshing of the SFHCP specimen is shown in Figure 6b.
To make the finite element simulation results more accurate, a strategy that combines optical measurement data to gradually improve the FEM was established. The entire analysis process of the FEM is detailed in Figure 7.
Step 1, obtain the SFHCP specimen dimensions and material parameters from the manufacturer’s SFHCP specimen design, and refer to the relevant literature on CFRP [34,35] to obtain material elastic parameters as a reference. Based on the specimen dimensions and material parameters, and considering the actual boundary conditions under the experimental setup, establish a FEM. Before the formal experiment, use this model for preliminary calculations to obtain the buckling load and ultimate load of the SFHCP specimen, which will be used to guide the design of the fixture and the formulation of the loading scheme.
Step 2, after the formal experiment, the existing FEM is improved by combining the symmetric buckling mode diagram obtained from FPP. Considering that the initial buckling mode of the stiffened panel often directly affects or even determines its post-buckling mode, and compared with the complex and tedious post-buckling analysis, the initial buckling mode can be conveniently and quickly obtained through eigenvalue buckling analysis. Therefore, before the post-buckling analysis, the original FEM can be reasonably screened according to the initial buckling mode. Specifically, the buckling mode obtained from the eigenvalue buckling analysis of the original FEM is compared with the initial buckling mode obtained from FPP. If there are differences in the number of waves, waveform, symmetry, and buckling load, the original FEM is refined by screening material elastic parameters within the reference range and adjusting boundary conditions to assign different degrees of freedom to the skin/stiffener so as to finally obtain simulation results that match the actual initial buckling mode. Since only eigenvalue buckling analysis is needed to screen the parameters, the trial-and-error time is greatly saved, the computational efficiency is improved, and a FEM that is more consistent with the actual working conditions is obtained, effectively improving the analysis accuracy.
Step 3, the matched buckling mode is introduced into the improved FEM in the form of initial geometric imperfections, and then post-buckling analysis is carried out. In the post-buckling analysis, material stiffness degradation and geometric nonlinearity are considered. Incremental loading is used, and the laminated material parameters are read to calculate the stiffness matrix, stress, and strain. The failure criteria are applied to determine whether a failure occurs. If failure occurs, the stiffness matrix is degraded and the stress is updated; if not, the load is increased, and the same process is repeated until the structure loses its load-bearing capacity, at which point the analysis is considered complete.
The material elastic parameters and boundary conditions were updated through the FEM update scheme. The buckling modes obtained by the updated FEM and the original FEM are shown in 
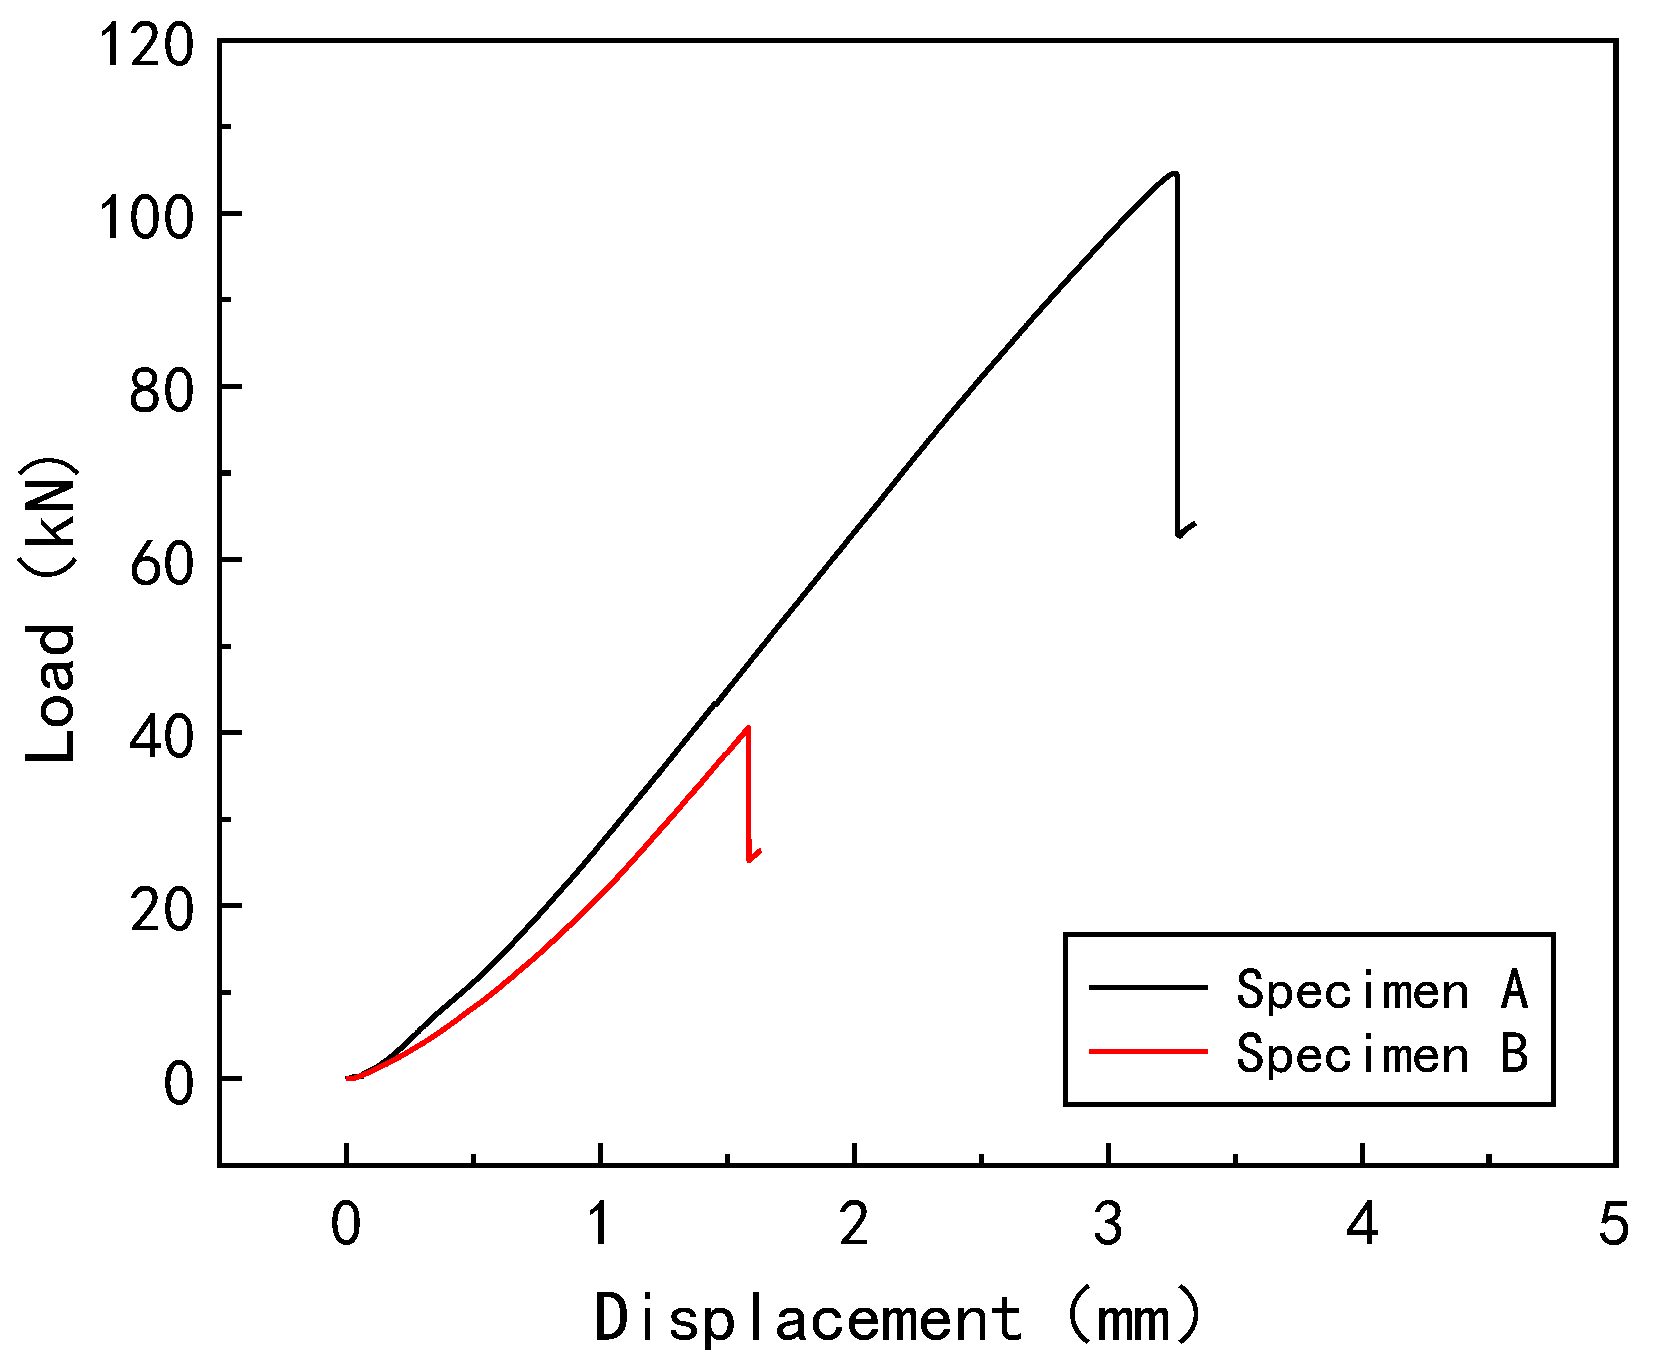
Figure 8. It can be seen that the buckling mode obtained by the updated FEM is closer to the measurement results of the FPP. The load–displacement curve obtained from the step-by-step loading simulation is illustrated in Figure 9. The simulated ultimate load of 103.616 kN demonstrates a percentage error of 2.25% compared to the experimental measurement (106 kN) from FPP. Not only are the number of waves four but the wave packets are also concentrated in the center of the panel, away from the side edges. During the compression process, the boundary conditions were updated to restrict the out-of-plane displacement on both sides, with one end fixed and the other end subjected to compressive displacement load. The specific material’s mechanical properties are shown in Table 5 and Table 6. Among them, Table 5 lists the elastic parameters, Table 6 lists the strength parameters, and Table 7 includes the interface parameters [36].
In Table 5, Table 6 and Table 7, EX and EY are the modulus of elasticity of the composites in the two main directions of elasticity, GXY is the shear modulus of elasticity in the two main directions of the surfaces, PRXY is the Poisson’s ratio in the two main directions of the surfaces, Kn is the normal stiffness, and Ks and Kt are the tangential stiffness of the cohesive interfacial layer. tn0, ts0, and tt0, and GnC, GtC, and GsC correspond to the ultimate strength and fracture toughness of the interfacial layer in three directions, when it starts to crack, respectively, and can provide directions related to when the interfacial layer starts to crack.
The low-velocity impact damage process of the stiffened panel was simulated using Abaqus/Explicit. The impact location was the symmetric center position on the hat-stiffened side of the foam core region, corresponding to SFHCP specimen B. During the impact process, frictionless hard contact was defined between the outer surface of the impactor and the impacted side of the skin, and the four sides of the skin and stiffened panel were fixed. The impactor was a steel punch with a radius of 12.7 mm, and C3D8R elements were used. The foam core material only has an impact damping effect, without considering stiffness reduction. In ABAQUS finite element software, the restart method was used to introduce the impact results as the initial state for the post-impact compression calculation, and the mesh division was consistent with the impact model.

4.2. Impact Damage Analysis

The impact simulation analysis carried out through the FEM obtained the distribution of four types of impact damage in SFHCP specimen B, namely fiber compression damage, fiber tension damage, matrix compression damage, and matrix tension damage. In the simulation results, the distributions of fiber compression damage, fiber tension damage, and matrix compression damage showed no significant difference from the intuitively observed indentation. The extent of such damage was limited, and there was almost no invisible internal damage. Thus, only the distribution of the fourth type of damage, matrix tension damage, was present, as shown in Figure 10.
The matrix tension damage distribution of SFHCP specimen B (impact at the center of the hat stiffener) is shown in Figure 10, where the side with the hat stiffener is displayed. It can be seen that the belt-like distribution of matrix tension damage is near the impact location, and fiber compression damage and matrix compression damage also have similar distributions but with smaller areas, while fiber tension damage is only distributed near the impact point. The reason for this impact damage distribution may be that there are too few composite layers on the stiffener and the transverse geometric size is small, resulting in some materials being brittle and breaking during the impact.

4.3. Post-Impact Compression Damage Analysis

The buckling mode of the stiffened panel is closely related to the spatial distribution and temporal evolution of low-velocity impact damage on the stiffened panel [26,37]. Figure 11 shows the simulation results of the damage distribution of each layer of the undamaged SFHCP specimen A after compression failure. From the optical measurement results, it can be seen that when SFHCP specimen A withstands the ultimate load, the maximum deformation is concentrated in the middle region of the stiffened panel. The wave peaks and troughs on the panel alternate, which aligns with the finite element simulation results. This indicates that the compressive energy is effectively distributed across the buckling of the entire panel, confirming the soundness of both the geometric structure and the laminate design. As can be seen from Figure 11, the damage areas are mainly concentrated on the first four layers of the skin and stiffener, which are integrated, and on the flanges of each layer of the panel, and the damage areas are relatively symmetrically distributed with respect to the two horizontal and vertical central axes. In the figure, the symmetry of the damaged regions is determined by the specimen’s symmetric stacking sequence and buckling mode. Moreover, interlayer damage tends to occur in areas with severe buckling, such as within the stiffeners and the panel. In contrast, the densely distributed damage along the boundaries is caused by the combined effects of composite material boundary phenomena and the strong constraint forces that suppress out-of-plane displacement (buckling). The main damage forms of the skin are matrix compression damage and fiber compression damage, while the stiffener has all four types of damage. Since specimen A did not undergo any impact, it incurred no initial damage, and the damage observed during the compression failure process was predominantly progressive in nature.
The reasons for the above phenomena are threefold: (1) The symmetry of the stiffened panel structure, load, and boundary conditions results in the overall symmetry of the damage distribution. (2) The stiffener has only four layers of ply, and these four layers are integrated with the first four layers of the panel. Under the condition that the stiffener bears most of the compressive load, the most severe damage occurs in these four layers. (3) The occurrence of more tensile damage in the last four layers of the skin is related to the fact that the first four layers of the structure experience more compressive damage and the final bending direction of the panel. Similarly, the areas of concentrated damage on the skin closely align with the regions of severe final deformation of the plate.
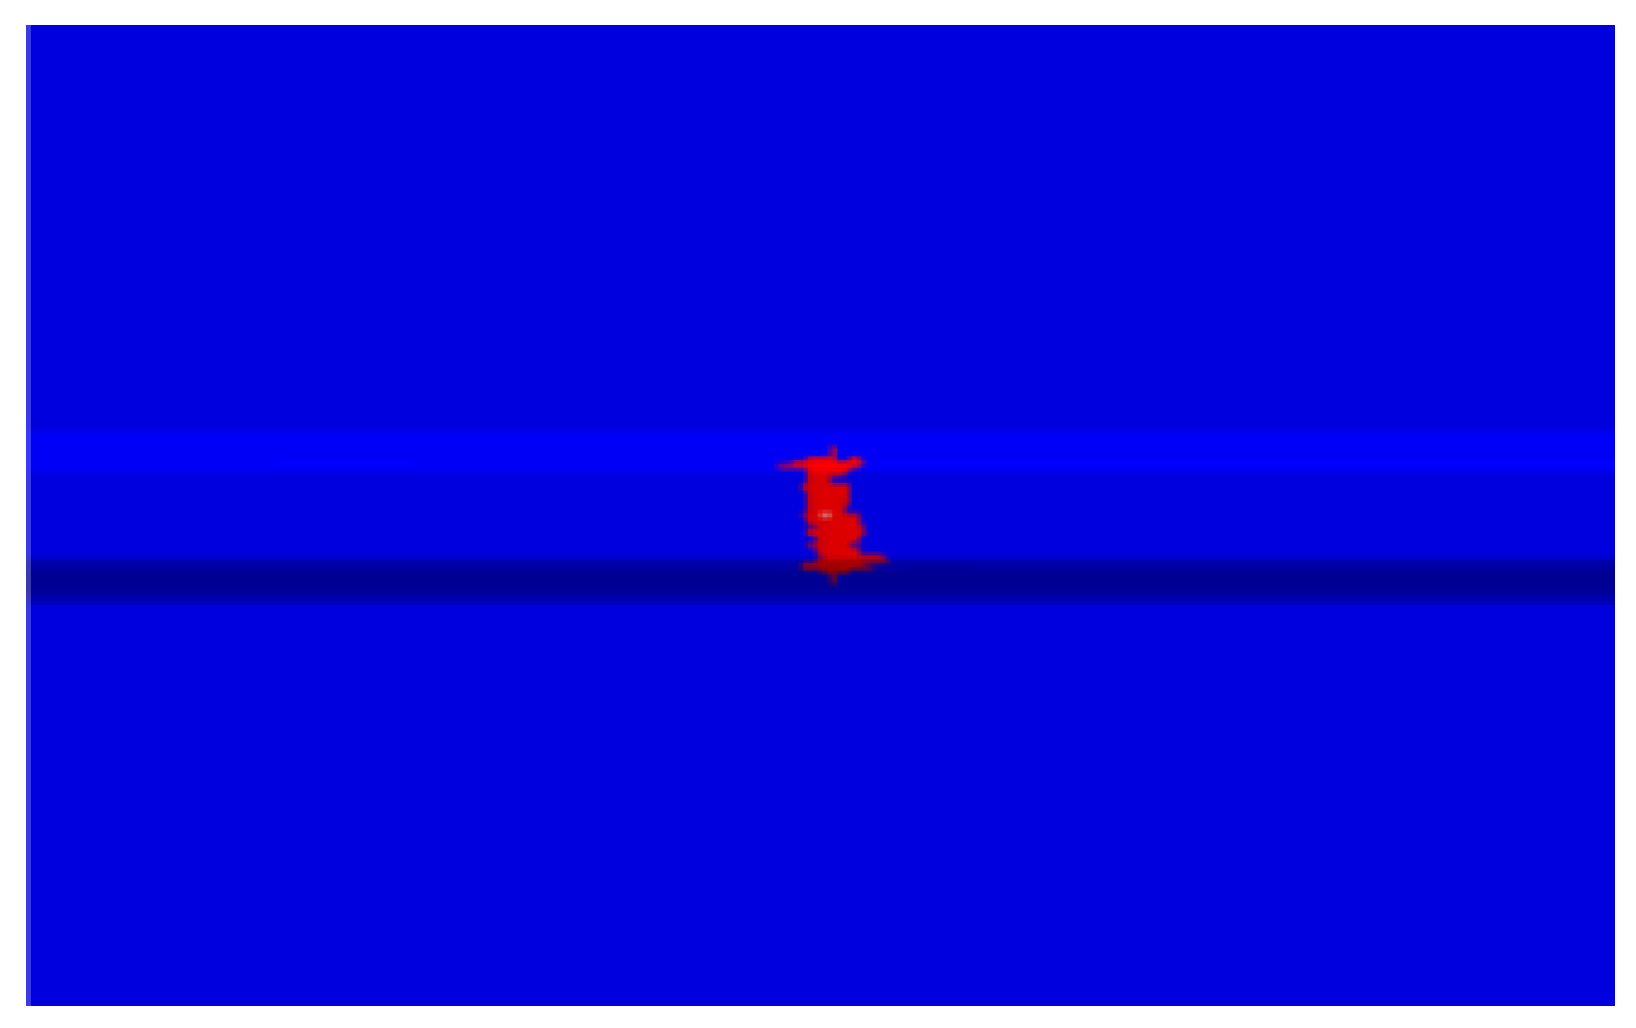
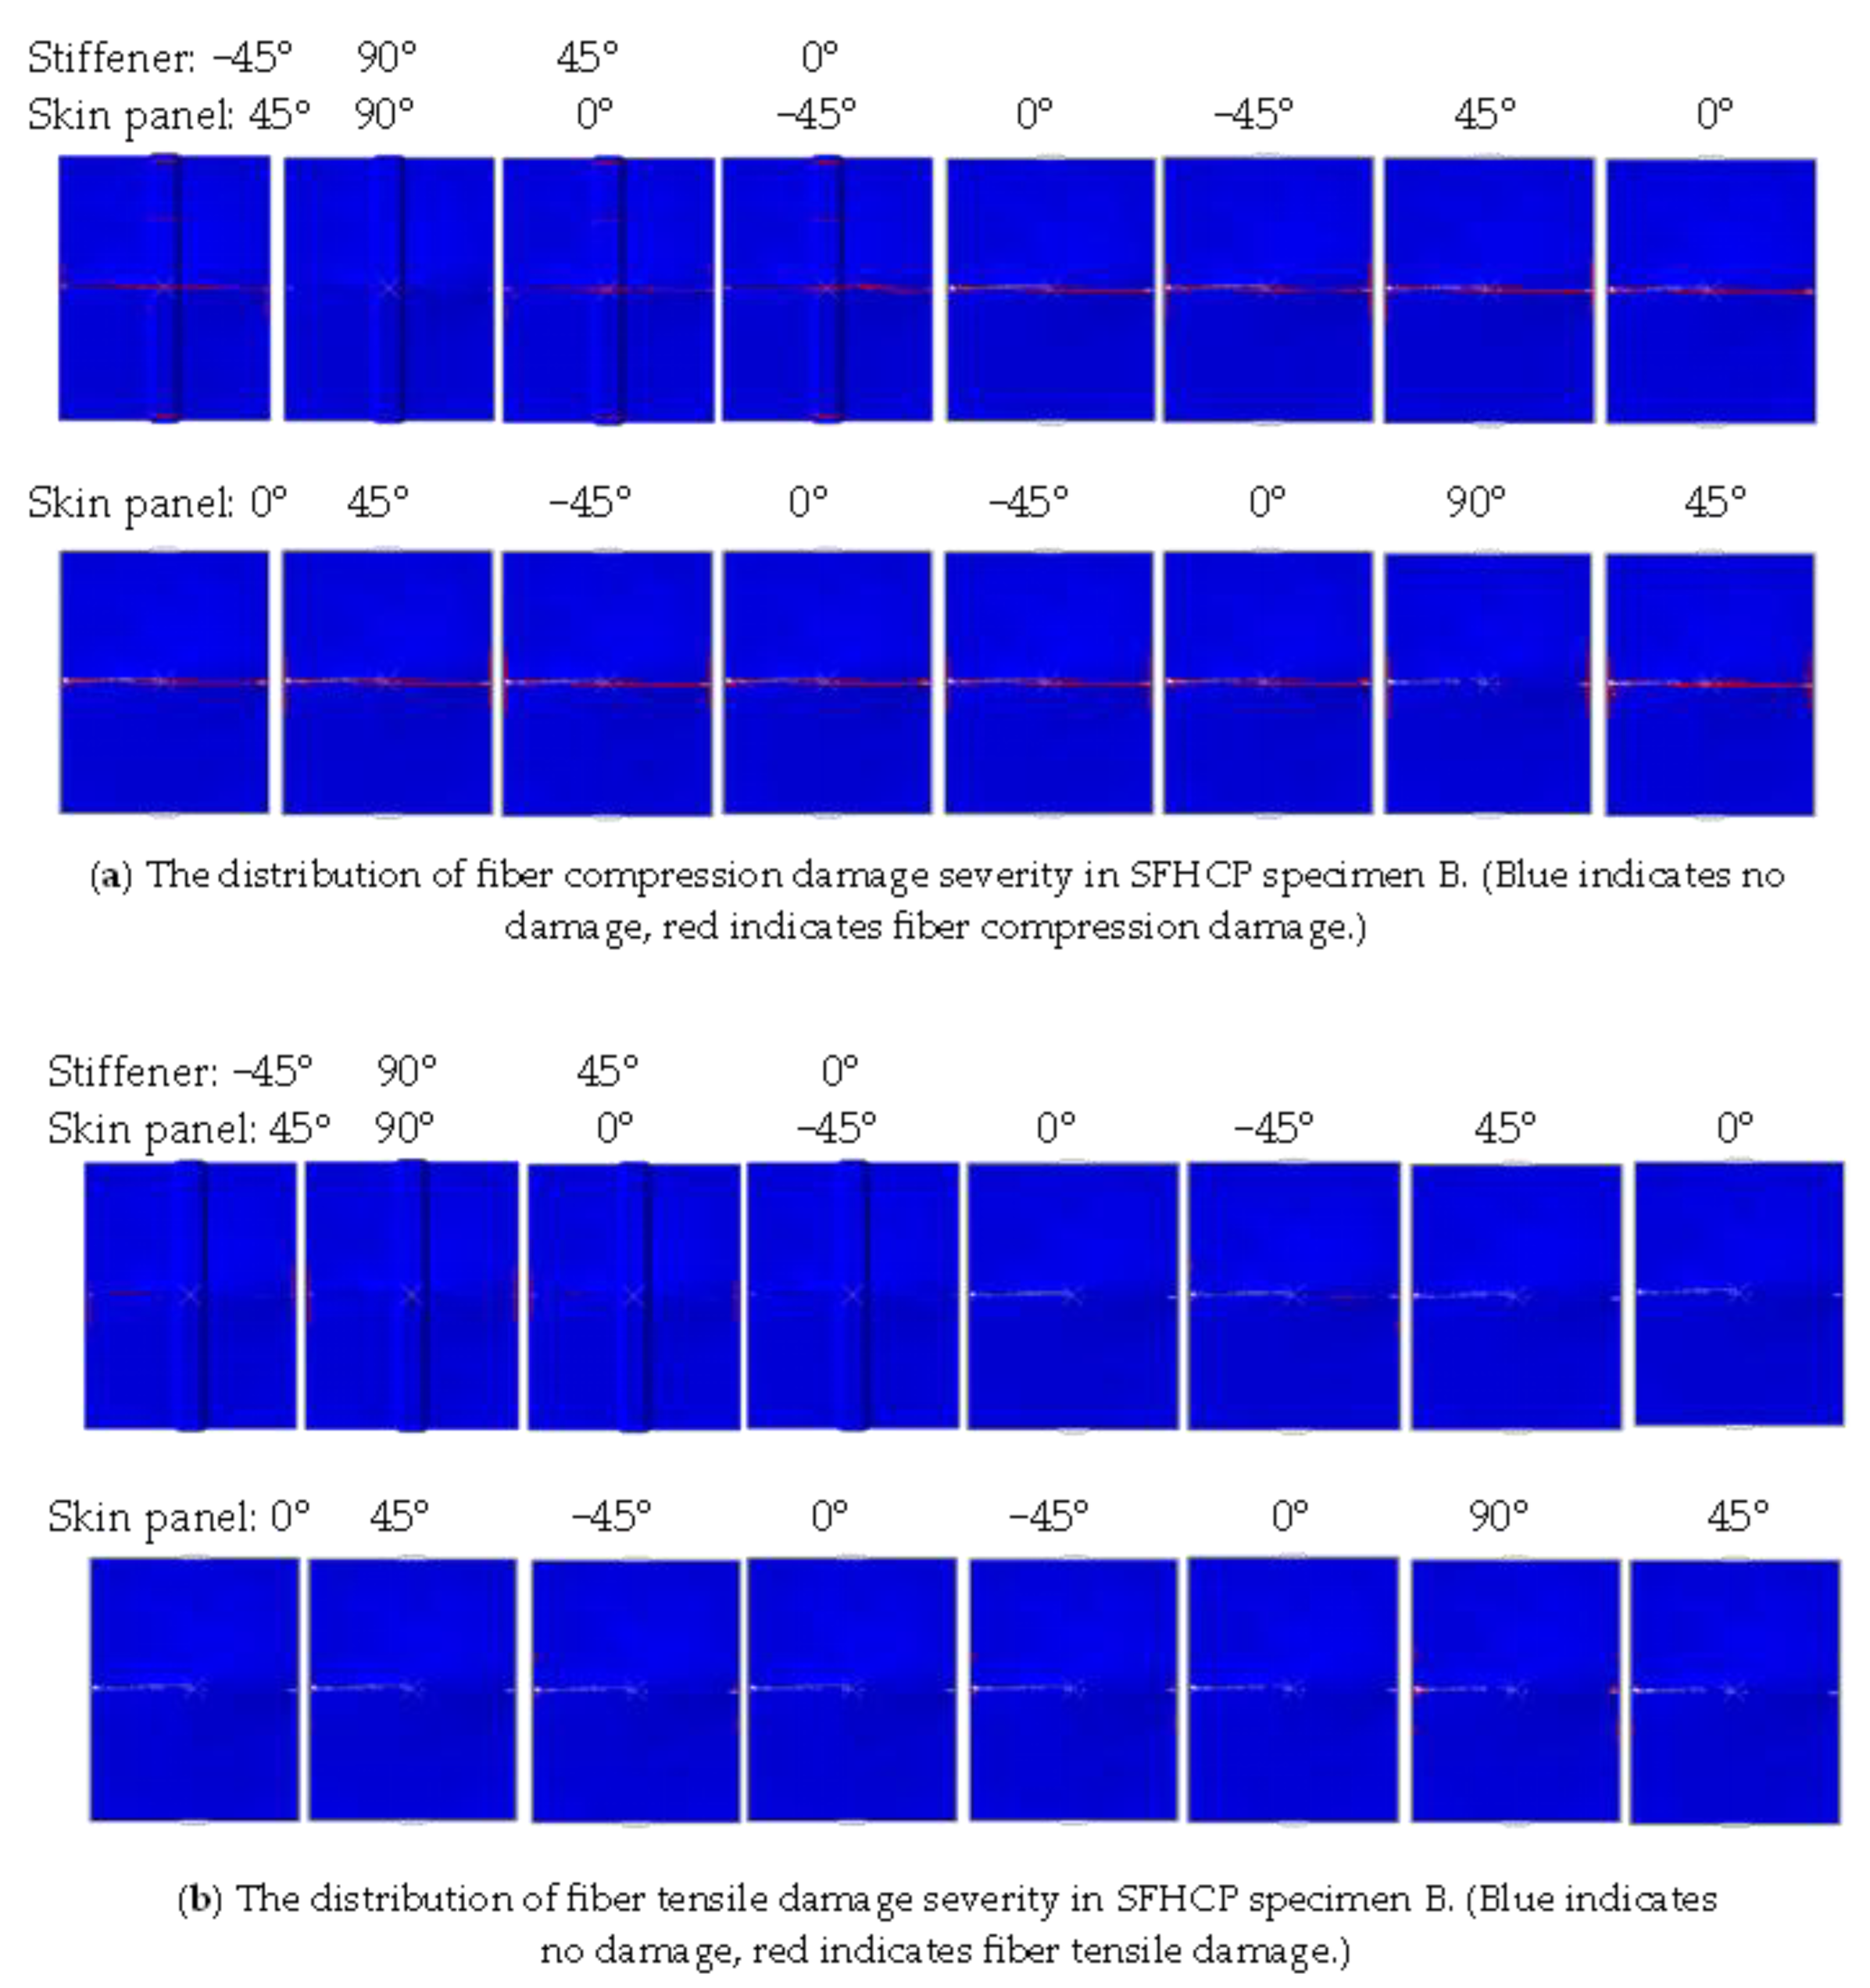
Figure 12 shows the simulation results of the damage distribution in SFHCP specimen B after CAI failure. From the optical measurement results, it is known that the stiffener of SFHCP specimen B has a certain pre-bending due to the impact, which leads to a very rapid failure process. This results in the failure of the stiffened panel being more towards “brittle fracture”, hence it is inferred that the damage of SFHCP specimen B has not spread over a large area. This damage is primarily caused by the initial damage from impact, with minimal progressive damage. Additionally, the buckling regions are observed to be concentrated near the stiffeners as the impact damage has weakened their stiffness. Compared to the undamaged specimen A, specimen B exhibits significantly lower compressive load-bearing capacity. This can be explained by the panel’s buckling failure mode, as the stiffeners play a crucial role in determining the compressive load-bearing capacity of the stiffened plate. As can be seen from Figure 12, the damage area of this SFHCP specimen is relatively small. These damage areas are mainly concentrated near the transverse central axes of each layer and the flanges of each layer of the panel, and the damage areas are symmetrically distributed relative to the two horizontal and vertical central axes. The symmetry of the damaged regions in the figure is not only determined by the symmetric stacking sequence and buckling mode of the specimen but also influenced by the distribution of low-velocity impact damage. As a result, the symmetry in the distribution of matrix tensile damage in specimen B is less pronounced. Since specimen B underwent direct bending failure during compression with minimal buckling, the interlayer damage was mainly concentrated along both sides of the central line of the stiffened plate. Additionally, as the fixture no longer constrained buckling at the boundaries, the damage distribution at the boundaries was significantly smaller compared to specimen A. The main damage form of the skin is matrix tension damage, while the main damage forms of the stiffener are matrix tension damage and matrix compression damage. Overall, the damaged area of specimen B is relatively small, with a large portion of the material remaining intact despite the specimen’s failure. This not only results in material waste but also leads to a lower load-bearing capacity. These findings indicate that specimen B exhibits extremely high impact damage sensitivity in the central region of the stiffeners on the foam core side.
Additionally, there was no significant expansion around the impact pit. The reasons for this phenomenon are threefold: (1) The impact damage to the stiffener affects both the material and structural levels, leading to significant changes in the buckling mode and damage distribution. (2) Since the main load-bearing fibers on the stiffener are broken due to impact, the primary forms of damage to the stiffener are matrix tension damage and matrix compression damage. (3) Because the stiffened panel did not buckle but was directly bent, the damaged areas of the material are almost entirely concentrated near the transverse central axis, and the impact damage along with other damages have hardly spread.
Three clear conclusions can be drawn from the simulation results of the above two SFHCP specimens: (1) Damage to the stiffener has a significant impact on the mechanical performance of the stiffened panel, which is consistent with the research conclusions of other scholars [38]. The reason is that the stiffener is the main load-bearing structure in the stiffened panel, leading to its high sensitivity to damage. (2) There is often a significant difference in stiffness between the stiffener and the skin panel, and the bonding area between them is more prone to material damage and delamination. (3) The damage distribution of both SFHCP specimens is almost concentrated in the first five layers and the last five layers, with minimal damage in the middle eight layers, indicating that the material utilization rate of this stiffened panel is not high when used as a pressure-bearing structure and further optimization of the design is possible.

5. Conclusions

A hollow, closed, symmetric thin-plate structure subjected to low-velocity impact will suffer damage in the area around the impact point, resulting in reduced stiffness and causing the structure to fail to meet the designed mechanical properties. In this study, the SFHCPs replace the structure mentioned above with foam-filled hat-stiffeners. Through a combination of experiments and simulations, the evolution of buckling modes in SFHCPs, both with and without impact damage, during compression testing was compared and analyzed. The influence of impact damage located at the center of the hat-stiffener on the CAI behavior of the panel was discussed, and several conclusions were drawn from the research. The conclusions are as follows:
(1)
Impact damage at the symmetric center of hat-stiffened panels reduces residual compressive strength by 61.7% (from 106 kN to 40.6 kN), driven by buckling mode instability under localized damage. To address this, a buckling mode-driven FEM update strategy was developed, enhancing CAI behavior prediction accuracy and enabling adaptive experimental designs such as the optical measurement timing synchronized with buckling evolution. Furthermore, FEM validation revealed that the refined boundary conditions and mesh consistency between impact/compression models significantly improved simulation reliability.
(2)
Damage characterization demonstrated concentrated failure in the first/last five layers (minimal intermediate-layer damage), highlighting suboptimal material utilization and redesign potential. Crucially, FPP measurements contrasted symmetric four-wave buckling in undamaged panels with asymmetric wave packet localization near impact zones in damaged specimens, thereby directly linking stiffness reduction to catastrophic failure. These findings underscore the critical role of buckling symmetry in structural integrity and provide actionable insights for optimizing impact-resistant composite systems.

Author Contributions

Conceptualization, D.L.; Methodology, D.L. and Y.S.; Software, D.L. and Z.Z. (Zhijia Zheng); Validation, D.L., X.W. (Xiao Wei) and D.W.; Formal analysis, D.L. and W.F.; Investigation, D.L., Y.S. and X.W. (Xuanze Wang); Resources, Z.Z. (Zhongsheng Zhai); Data curation, Z.Z. (Zhijia Zheng), Y.S. and D.W.; Writing—original draft, D.L. and Z.Z. (Zhijia Zheng); Writing—review & editing, Z.Z. (Zhijia Zheng); Visualization, X.W. (Xiao Wei); Supervision (oversaw the research design, methodology, and overall quality control), S.D.; Project Administration (coordinated research activities and ensured project milestones were met), Z.G. and X.W. (Xuanze Wang); Funding acquisition, Z.Z. (Zhongsheng Zhai). All authors have read and agreed to the published version of the manuscript.

Funding

This research was funded by the National Natural Science Foundation of China grant number No.12302239, the Doctoral Research Initiation Foundation of Hubei University of Technology grant number No. XJ2022009102 and the Open Foundation of Hubei Key Laboratory of Modern Manufacturing Quantity Engineering grant number No.KFJJ-2023015.

Data Availability Statement

The raw data supporting the conclusions of this article will be made available by the authors on request.

Conflicts of Interest

Author Dawei Wang was employed by the company AVIC SAC Commercial Aircraft Company Ltd. The remaining authors declare that the research was conducted in the absence of any commercial or financial relationships that could be construed as a potential conflict of interest.

Abbreviations

List of abbreviations and indications:
SFHCPSymmetric Foam-filled Hat-stiffened Composite Panel
CAICompression After Impact
FEMFinite Element Model
FPPFringe Projection Profilometry
VARIVia the Vacuum-Assisted Resin Infusion
DICDigital Image Correlation
FBGFiber Bragg Grating
GFRPGlass Fiber Reinforced Plastic

References

  1. Tran, P.; Nguyen, Q.T.; Lau, K. Fire performance of polymer-based composites for maritime infrastructure. Compos. Part B Eng. 2018, 155, 31–48. [Google Scholar] [CrossRef]
  2. Sutherland, L. A review of impact testing on marine composite materials: Part I—Marine impacts on marine composites. Compos. Struct. 2018, 188, 197–208. [Google Scholar] [CrossRef]
  3. Jin, B.C.; Li, X.; Mier, R.; Pun, A.; Joshi, S.; Nutt, S. Parametric modeling, higher order FEA and experimental investigation of hat-stiffened composite panels. J. Compos. Struct. 2015, 128, 207–220. [Google Scholar] [CrossRef]
  4. Falcó, O.; Lopes, C.S.; Sommer, D.E.; Thomson, D.; Vila, R.L.; Tijs, B. Experimental analysis and simulation of low-velocity impact damage of composite laminates. Compos. Struct. 2022, 287, 115278. [Google Scholar] [CrossRef]
  5. Ismail, K.I.; Sultan, M.T.H.; Shah, A.U.M.; Jawaid, M.; Safri, S. Low velocity impact and compression after impact properties of hybrid bio-composites modified with multi-walled carbon nanotubes. Compos. Part B Eng. 2019, 163, 455–463. [Google Scholar] [CrossRef]
  6. Zhang, D.; Sun, Y.; Chen, L.; Pan, N.J.M. A comparative study on low-velocity impact response of fabric composite laminates. Mater. Des. 2013, 50, 750–756. [Google Scholar] [CrossRef]
  7. Abrate, S. Impact Engineering of Composite Structures; Springer Science & Business Media: Berlin, Germany, 2011. [Google Scholar]
  8. Abrate, S. Composite structures: Impact on composites 2002. Compos. Struct. 2003, 61, 1. [Google Scholar] [CrossRef]
  9. Wei, Z.; Wang, H.; Li, Y.; Wang, B. Rigidity-toughness coupling in architected composite materials for enhanced impact resistance. Int. J. Mech. Sci. 2024, 272, 17. [Google Scholar] [CrossRef]
  10. Sutherland, L.S.; Soares, C.G. The use of quasi-static testing to obtain the low-velocity impact damage resistance of marine GRP laminates. Compos. Part B Eng. 2012, 43, 1459–1467. [Google Scholar] [CrossRef]
  11. Cestino, E.; Romeo, G.; Piana, P.; Danzi, F. Numerical/experimental evaluation of buckling behaviour and residual tensile strength of composite aerospace structures after low velocity impact. Aerosp. Sci. Technol. 2016, 54, 1–9. [Google Scholar] [CrossRef]
  12. Wang, J.; Li, J.; Gangarao, H.; Liang, R.; Chen, J. Low-velocity impact responses and CAI properties of synthetic foam sandwiches. Compos. Struct. 2019, 220, 412–422. [Google Scholar] [CrossRef]
  13. Yang, B.; Wang, Z.; Zhou, L.; Zhang, J.; Tong, L.; Liang, W. Study on the low-velocity impact response and CAI behavior of foam-filled sandwich panels with hybrid facesheet. Compos. Struct. 2015, 132, 1129–1140. [Google Scholar] [CrossRef]
  14. Sutherland, L.; Soares, C.G. Impact behaviour of typical marine composite laminates. Compos. Part B Eng. 2005, 37, 89–100. [Google Scholar] [CrossRef]
  15. Sutherland, L.S. A review of impact testing on marine composite materials: Part IV—Scaling, strain rate and marine-type laminates. Compos. Struct. 2018, 200, 929–938. [Google Scholar] [CrossRef]
  16. Prato, A.; Al-Saymaree, M.; Featherston, C.; Kennedy, D. Buckling and post-buckling of thin-walled stiffened panels: Modelling imperfections and joints. Thin-Walled Struct. 2022, 172, 108938. [Google Scholar] [CrossRef]
  17. Wu, H.; Dong, R.; Xu, Q.; Liu, Z.; Liang, L. Foss-based method for thin-walled structure deformation perception and shape reconstruction. Micromachines 2023, 14, 794. [Google Scholar] [CrossRef]
  18. Zhang, R.; Amraei, M.; Piili, H.; Gardner, L. Microstructure, Mechanical Properties and Cross-sectional Behaviour of Additively Manufactured Stainless Steel Cylindrical Shells. Ce/Papers 2022, 5, 568–573. [Google Scholar] [CrossRef]
  19. Zhang, S.; Engineering, L. High-speed 3D shape measurement with structured light methods: A review. Opt. Lasers Eng. 2018, 106, 119–131. [Google Scholar] [CrossRef]
  20. Van der Jeught, S.; Dirckx, J.J. Real-time structured light profilometry: A review. Opt. Lasers Eng. 2016, 87, 18–31. [Google Scholar] [CrossRef]
  21. Bai, R.; Bao, S.; Lei, Z.; Liu, C.; Chen, Y.; Liu, D.; Yan, C. Experimental study on compressive behavior of I-stiffened CFRP panel using fringe projection profilometry. Ocean Eng. 2018, 160, 382–388. [Google Scholar] [CrossRef]
  22. Sun, W.; Guan, Z.; Ouyang, T.; Tan, R.; Zhong, X. Effect of stiffener damage caused by low velocity impact on compressive buckling and failure modes of T-stiffened composite panels. Compos. Struct. 2018, 184, 198–210. [Google Scholar] [CrossRef]
  23. Feng, Y.; Zhang, H.; Tan, X.; He, Y.; An, T.; Zheng, J. Effect of impact damage positions on the buckling and post-buckling behaviors of stiffened composite panel. Compos. Struct. 2016, 155, 184–196. [Google Scholar] [CrossRef]
  24. HB 5800-1999; General Tolerance. Aviation Industry Corporation of China: Beijing, China, 1999.
  25. Tuo, H.; Lu, Z.; Ma, X.; Xing, J.; Zhang, C. Damage and failure mechanism of thin composite laminates under low-velocity impact and compression-after-impact loading conditions. Compos. Part B Eng. 2019, 163, 642–654. [Google Scholar] [CrossRef]
  26. Tuo, H.; Lu, Z.; Ma, X.; Zhang, C.; Chen, S. An experimental and numerical investigation on low-velocity impact damage and compression-after-impact behavior of composite laminates. Compos. Part B Eng. 2019, 167, 329–341. [Google Scholar] [CrossRef]
  27. Tan, W.; Falzon, B.G.; Chiu, L.N.; Price, M. Predicting low velocity impact damage and Compression-After-Impact (CAI) behaviour of composite laminates. Compos. Part A Appl. Sci. Manuf. 2015, 71, 212–226. [Google Scholar] [CrossRef]
  28. Shabani, P.; Li, L.; Laliberte, J.; Qi, G. Compression after impact (CAI) failure mechanisms and damage evolution in large composite laminates: High-fidelity simulation and experimental study. Compos. Struct. 2024, 339, 118143. [Google Scholar] [CrossRef]
  29. ASTM D7136/D7136M-20; Standard Test Method for Measuring the Damage Resistance of a Fiber-Reinforced Pol-ymer Matrix Composite to a Drop-Weight Impact Event. ASTM International: West Conshohocken, PA, USA, 2020.
  30. ASTM D7137/D7137M-17; Standard Test Method for Compressive Residual Strength Properties of Damaged Polymer Matrix Composite Plates. ASTM International: West Conshohocken, PA, USA, 2012.
  31. Zhou, J.; Ouyang, T.; Guan, Z.; Li, Z.; Sun, W.; Wang, X.; Hu, H. Investigation on impact damage and shear after impact (SAI) behavior of grid stiffened panels. Compos. Struct. 2021, 277, 114640. [Google Scholar] [CrossRef]
  32. Merhar, M. Application of Failure Criteria on Plywood under Bending. Polymers 2021, 13, 4449. [Google Scholar] [CrossRef]
  33. Zou, J.; Lei, Z.; Bai, R.; Liu, D.; Liu, H.; Huang, X.; Yan, C. Damage evolution and failure mechanism of asymmetric composite laminates under low-velocity impact and compression after impact. Thin-Walled Struct. 2023, 182, 110177. [Google Scholar] [CrossRef]
  34. Shabanijafroudi, N.; Ganesan, R. A new methodology for buckling, postbuckling and delamination growth behavior of composite laminates with delamination. Compos. Struct. 2021, 268, 113951. [Google Scholar] [CrossRef]
  35. Rhead, A.T.; Butler, R.; Hunt, G.W. Compressive Strength of Composite Laminates with Delamination-Induced Interaction of Panel and Sublaminate Buckling modes. Compos. Struct. 2017, 171, 326–334. [Google Scholar] [CrossRef]
  36. Zou, J.; Lei, Z.; Bai, R.; Liu, D.; Yan, C. Damage and failure analysis of composite stiffened panels under low-velocity impact and compression after impact. Compos. Struct. 2020, 262, 113333. [Google Scholar] [CrossRef]
  37. Zhu, K.; Zheng, X.; Peng, J.; Sun, J.; Huang, R.; Yan, L. The relationship between the impact position interference and CAI strength of composite sandwich structures under double impacts. Compos. Part B Eng. 2024, 268, 111092. [Google Scholar] [CrossRef]
  38. Al-Azzawi, A.; Mccrory, J.; Wu, Z.; Featherston, C. A novel semi-analytical approach for predicting the buckling and postbuckling behaviour of Glare fibre metal laminates. Thin-Walled Struct. 2022, 181, 109987. [Google Scholar] [CrossRef]
Figure 1. (a) Planar geometry (top view) of the SFHCP specimen, (b) cross-sectional geometry (front view) of the SFHCP specimen, (c) diagram of bonding GFRP (Unit: mm).
Symmetry 17 00570 g001aSymmetry 17 00570 g001b
Figure 2. Impact test device for the composite stiffened panel, (a) setup of impact test, (b) hemispherical impact bar, (c) clamp form, and (d) structure sizes of the fixture base.
Symmetry 17 00570 g002
Figure 3. Experimental equipment, (a) compression fixture model, (b) geometric design schematic of wedge-shaped block, and (c) compression test site.
Symmetry 17 00570 g003
Figure 4. The load–displacement curves of undamaged stiffened panel A and the impact-damaged stiffened panel B.
Symmetry 17 00570 g004
Figure 5. FPP measured buckling results under different loads for (a) SFHCP specimen A, (b) SFHCP specimen B (Red represents protrusion and blue represents depression.).
Symmetry 17 00570 g005
Figure 6. (a) Boundary conditions for finite elements of SFHCP specimens. (b) SFHCP specimen impact finite element meshing.
Symmetry 17 00570 g006
Figure 7. Flow chart of the FEM analysis.
Symmetry 17 00570 g007
Figure 8. Comparison of finite element results with experimental results. (Red represents protrusion and blue represents depression).
Symmetry 17 00570 g008
Figure 9. Load–displacement curves of the FEM and specimen A.
Symmetry 17 00570 g009
Figure 10. Distribution of matrix tensile damage after impact, SFHCP specimen B. (Blue indicates no damage, red indicates matrix tensile damage).
Symmetry 17 00570 g010
Figure 11. Simulation results of SFHCP specimen A after CAI failure, (a) fiber compression damage, (b) fiber tensile damage, (c) matrix compression damage, and (d) matrix tensile damage.
Symmetry 17 00570 g011aSymmetry 17 00570 g011b
Figure 12. Simulation results of SFHCP specimen B after CAI failure, (a) fiber compression damage, (b) fiber tensile damage, (c) matrix compression damage, and (d) matrix tensile damage.
Symmetry 17 00570 g012aSymmetry 17 00570 g012b
Table 1. Impact result of stiffened plate.
TypeImpact LocationNumberImpact Energy (J)Visible Damage at 1.5 m (Y/N)Pit Depth (mm)
Skin Stiffened plateNoneANoneNoneNone
Intersection of the longitudinal symmetry line and the symmetry line of the unilateral non-foam core region♠-129.5Y1.25
♠-229.5Y2.00
♠-329.5Y1.14
♠-429.5Y0.33
♠-529.5Y0.39
♠-629.5Y0.41
♠-729.5Y1.85
♠-825Y1.48
♠-925Y1.33
Central position on the hat-stiffened side♣-17Y1.48
♣-27Y1.56
♣-3 (B)7Y1.55
Central position on the non-hat-stiffened side◆-128Y3.27
◆-226Y2.87
◆-325Y1.56
Table 2. Cohesive interface parameters.
Kn/MPaKs/MPaKt/MPatn0/MPats0/MPatt0/MPaGnC/Nm−1GtC/Nm−1GsC/Nm−1
106106106520200.10533
Table 3. CFRP matrix composite materials elastic parameters.
E1/GPaE2/GPaE3/GPav12G12/GPaG13/GPaG23/GPa
1478.548.540.324.374.373.57
Table 4. CFRP matrix composite materials strength parameters.
Xt/MPaXc/MPaYt/MPaYc/MPaZt/MPaZc/MPaS12/MPaS13/MPaS23/MPa
2700150086.4212.886.4212.8111.9111.996
Table 5. Elastic parameters of the composites.
EX/GPaEY/GPaGXY/GPaPRXY
1299.424.020.278
Table 6. Strength parameters of the composites.
XT/MPaXC/MPaYT/MPaYC/MPaS12, S23/MPa
1832111849.6164111
Table 7. The parameters of cohesive interface.
Kn/MPaKs/MPaKt/MPatn0/MPats0/MPatt0/MPaGnC/N·m−1GtC/N·m−1GsC/N·m−1
106106106520200.10533
Disclaimer/Publisher’s Note: The statements, opinions and data contained in all publications are solely those of the individual author(s) and contributor(s) and not of MDPI and/or the editor(s). MDPI and/or the editor(s) disclaim responsibility for any injury to people or property resulting from any ideas, methods, instructions or products referred to in the content.

