Article

Symmetrical Resilience: Detection of Cyberattacks for SCADA Systems Used in IIoT in Big Data Environments

Information Security Engineering, Graduate School of Natural and Applied Sciences, Gazi University, 06560 Ankara, Turkey
*
Author to whom correspondence should be addressed.
Symmetry 2025, 17(4), 480; https://doi.org/10.3390/sym17040480
Submission received: 12 December 2023 / Revised: 25 March 2024 / Accepted: 9 April 2024 / Published: 23 March 2025
(This article belongs to the Section Computer)

Abstract

:
In recent years, Internet of Things (IoT) systems are used in Industrial Internet of Things (IIoT) systems due to their widespread use in industrial sectors, providing convenience to users in SCADA systems, like other domains. In addition to the diverse technological advancements discussed, the inherent symmetry within the network structures of SCADA systems utilized in the IIoT echoes a fundamental balance sought in digital frameworks. However, along with the advantages of IIoT systems, there are also disadvantages, one major drawback being their vulnerability to attacks. It has been observed that advanced methods such as artificial intelligence, unlike traditional detection techniques, are more successful at detecting attacks on IIoT systems used in SCADA systems. The proposed model was developed to detect cyberattacks on SCADA systems using machine learning and deep learning models. The SCADA network traffic consists of over 7 million rows and has a size of 627 MB. Attack network traffic refers to the type of traffic aimed at causing damage to the system. The attack traffic in this study includes five different attacks. Normal traffic is the type of traffic that facilitates the system’s usual communication. Prepared network traffic is not a different type of traffic. Prepared network traffic, as named, is the state of the traffic dataset that has been made ready for analysis with models. The prepared network traffic was examined using eight machine learning models, including the CART, Decision Tree, KNN, Logistic Regression, Naive Bayes, Random Forest, SVM, and XGBoost models, as well as seven deep learning models, namely, CNN, GRU, LSTM, MLP, RNN, CNN-LSTM, and LSTM-CNN. During the evaluation of the models, performance parameters such as the accuracy, F-score, precision, and recall were considered, and the results are presented accordingly. Upon examining the dataset with various models, the highest outcomes were achieved using the MLP model. The investigation utilizing the MLP model resulted in an accuracy of 99.95%, a precision of 99.63%, a recall of 99.49%, and an F-score of 99.56%. These values were obtained with a batch-size combination of 100 and 20 epochs. By addressing cyberattack detection in SCADA systems used in the IIoT within a big data environment, the study encompasses a multidisciplinary approach, touching upon cybersecurity, big data analytics, AI, information security, and IoT-related concerns, all of which are focal points within the scope of the journal. This breadth and depth of coverage make the study highly relevant and aligned with the diverse interests of the journal.

1. Introduction

IoT systems are used in various fields, including the industrial and manufacturing sectors. Initially designed to collect and transmit data from devices, the Internet of Things (IoT) has become a widespread connection method in different application areas. However, the increasing popularity of the IoT has brought significant constraints and challenges in terms of privacy and security, allowing access to sensitive data due to weak protocols, unaware use of IoT devices, and limited security guidelines [1]. While industrial automation and control applications traditionally operate in closed systems, the need for increased connectivity and access to higher computational resources has led to the adoption of the IoT in these domains, referred to as the Industrial IoT (IIoT) [2]. The IIoT connects smart and embedded objects to cloud computing platforms, enabling real-time, intelligent, and autonomous access, analysis, and communication and the exchange of process, product, and service information in industrial environments [3]. In particular, with the emergence of Industry 4.0, the use of IIoT systems in the industrial sector has been rapidly increasing. IIoT applications can be found in areas such as smart factories and energy production systems, including smart grids [4]. They are widely preferred in large-scale organizations due to their performance and ease of use. Supervisory Control and Data Acquisition (SCADA) systems collect data from remote sensors and industrial equipment and transmit them to a central station [5]. The IIoT plays a vital role in these systems, which are extensively used in critical infrastructure sectors, such as the energy, oil, metallurgy, natural gas, railway, water supply, and chemical industries [6]. Interconnected critical infrastructures provide essential materials and services for national security and economic operations. However, with the rise of Industry 4.0, Smart Manufacturing 2025, and the IIoT, hacker attacks have begun to target critical infrastructure [7]. SCADA system security poses a new challenge in the field of IIoT risk assessment. SCADA, which runs about 80% of the services in the United States, is responsible for controlling smart grids [8]. Like the intricate dance of symmetrical patterns, the quest for cyberattack detection within SCADA systems, nestled in the vast landscape of the IIoT, mirrors the harmonious pursuit of balance and order amidst the complexities of big data environments. North America and Asia are the regions most affected by severe cyberattacks, with the largest data losses occurring in North America [9]. A recent study conducted at MIT developed a data-driven prioritization scoring scheme for SCADA attacks [10]. SCADA systems use telecommunication or third-party networks. They operate based on event-driven data transmission as the detected values change. SCADA systems require a Human–Machine Interface (HMI) for control. Because they operate on commercial Windows PCs, they are susceptible to operating-system and Windows-based attacks. Connecting SCADA-based IIoT systems to IT networks increases the risk of backdoor attacks with TCP/IP-based methods [11]. These systems, which facilitate daily life and have become widespread in many fields, also attract the attention of cyberattackers. Vulnerabilities in the systems can be identified and exploited for attacks. If the necessary cybersecurity measures are not taken by 2030, it is estimated that the cost of cyberthreats to IIoT and IoT systems will reach USD 90 trillion [12]. Cyberattackers exploit these valuable targets by attempting new attacks every day. The integration of modern technologies like the IoT and IIoT into SCADA systems has increased their vulnerability to security breaches. In the event of an attack, it is crucial to carry out an in-depth forensic analysis to pinpoint the exact cause and identify the perpetrators. However, the unique, dynamic nature and specific resource requirements of SCADA systems challenge traditional IT forensic methods in effectively identifying and categorizing these security incidents. Therefore, implementing a robust digital forensic incident response (DFIR) strategy is vital for safeguarding SCADA systems against cyberthreats [13]. In response, defense mechanisms need to be developed, and precautionary measures need to be taken. Continuous updates of security measures are essential for ensuring cybersecurity. Therefore, in an environment in which traditional methods no longer effectively stop attackers, new models and approaches are being developed. In recent years, machine learning and deep learning models have been frequently used, especially in the field of cybersecurity, and particularly for attack detection [14]. These models are commonly preferred in intrusion detection systems (IDSs) in the cybersecurity field. Unlike traditional methods, machine learning and deep learning models offer high detection accuracies and low error rates. This makes them suitable for various IDSs. To facilitate learning, the models need to analyze the dataset with predefined models. Therefore, the importance of data is evident in this field as well. Especially for deep learning models, a large volume of data is required for effective learning. It is estimated that the digital data generated will reach 175 zettabytes by 2025. The size of the data is crucial for more detailed and accurate learning [15]. However, to process data in machine learning and deep learning models, the data need to be prepared for use. The raw data obtained from the system undergo preprocessing steps to make them ready for analysis with the models. Once the data are prepared, learning is performed by analyzing them with the models. After completing the learning process, the models can detect attacks in IDSs. The data examined in this study consist of network data related to SCADA systems. The dataset includes normal network traffic and attack network traffic. The dataset was analyzed using eight machine learning models (Classification and Regression Tree (CART), Decision Tree, K Nearest Neighbors, Logistic Regression, Naive Bayes, Random Forest, Support Vector Machine, XGBoost) and seven deep learning models (Convolutional Neural Network (CNN), Gated Recurrent Unit (GRU), Long Short-Term Memory (LSTM), Recurrent Neural Network (RNN), Multilayer Perceptron (MLP), CNN-LSTM, LSTM-CNN (hybrid)). The contributions of this study to the literature can be listed as follows:
  • Providing detailed information about frequently occurring attacks in SCADA systems to shed light on developers working in this field;
  • The dataset used in the developed model is obtained from IIoT devices used in SCADA, making the model applicable to both the SCADA and IIoT domains for detecting attacks;
  • Increasing the number of applications in the field by using artificial intelligence technology, unlike the traditional attack detection methods;
  • Comparing the results with other studies in the field, demonstrating the superior performance of the proposed approach;
  • Providing a different perspective to experts in this field in terms of applying not only machine learning but also deep learning and hybrid models;
  • Comparing the results by applying different hyperparameters to all the models, laying the foundation for future studies;
  • Investigating the vulnerabilities and threats faced by SCADA systems in the Industrial Internet of Things (IIoT) emphasizes the critical aspect of safeguarding against cyberattacks. The focus of this study on detecting and mitigating these threats aligns with the journal’s emphasis on cybersecurity measures in modern technological frameworks;
  • The inclusion of big data environments signifies the handling and analysis of substantial volumes of data generated by SCADA systems. This involves employing advanced analytics to derive meaningful insights, which resonates with the journal’s interest in big data applications and analytics techniques;
  • The utilization of artificial intelligence (AI) and machine learning in identifying patterns or anomalies within SCADA-generated data reflects an innovative approach to cyberthreat detection. This connection aligns with the journal’s focus on AI applications in various technological domains;
  • The study inherently addresses concerns about information security, authentication mechanisms, and the technologies deployed to safeguard data and systems. This aspect directly corresponds to the journal’s interest in exploring cutting-edge technologies for ensuring information security;
  • By examining cyberthreats within SCADA systems, an integral part of the broader IoT landscape, the study addresses the security challenges prevalent in interconnected devices, aligning with the journal’s focus on IoT-related concerns;
  • The comprehensive nature of this study, which explores cyberattack detection in SCADA systems within the IIoT while navigating a big data environment, encapsulates a multidisciplinary approach. It seamlessly weaves together cybersecurity, big data analytics, AI, information security, and IoT-related challenges. This holistic coverage enriches the study’s relevance and establishes a direct link to the diverse interests of the journal’s readership, providing insights into critical areas of the technological advancements and security paradigms.
Section 2 of the study reviews other works conducted in the literature. Section 3 provides information about SCADA systems and security topics. Section 4 explains the methodology, dataset, and models used in the study. Section 5 provides a detailed description of the proposed model. Section 6.1 explains the stages of the implementation. Section 6.2 presents the results, along with their evaluations. Section 7 concludes the study.

2. Literature Review

In this section, other applications related to SCADA systems in the literature are examined. During the examination of these applications, the fields of application, methods used, datasets used, and results obtained were analyzed, and they are presented in Table 1. In the study conducted by the authors of [16], the ANN and Random Forest learning models were used to analyze the widely accepted datasets in the literature, namely, the WUSTL-2018, N-BaIoT, and BoT-IoT datasets. The developed IDS was stated to perform anomaly detection in two phases. The highest accuracy percentage of 96% was achieved using the Decision Tree algorithm. In another study [17], the WUSTL-2018 dataset was examined. The dataset was analyzed using the Random Forest, Logistic Regression, and Multilayer Perceptron models. The F-score values resulting from the analysis with the models were shared. Only machine learning models were used to analyze the dataset in this study. In another study [18], anomaly-based intrusion detection on packets generated in the SCADA laboratory environment was mentioned. It was stated that the data generated in the SCADA environment underwent the necessary preprocessing and were subjected to classification in .csv format. Thus, abnormal network traffic could be identified. The highest accuracy percentage of 99.81% was achieved with the Random Forest model. In another study [19], the dataset generated in the SCADA test environment was examined. The XGBoost model was used in the analysis, and an accuracy percentage of 98.86% was achieved. In another study [20], a network traffic dataset in the test environment was analyzed using the CNN deep learning model. An accuracy percentage of 99.84% was achieved with the CNN algorithm. It was offered that the developed model could be integrated with SCADA systems and used in intrusion detection systems. In another study [21], a new intrusion detection model for identifying malicious traffic using the Mesh Intruder scheme was mentioned. The study was conducted using the Deep Learning Neural Network model. The highest accuracy percentage was determined as 78.69% in the analysis. In another study [22], information was provided about the importance of the anomaly detection system used in ICSs for the security of SCADA systems. The feature dimension reduction process was performed using the CNN model. The accuracy percentage was determined as 99.30%. It was explained that high success was achieved in binary and multiclassification with the proposed model. In another study [23], a traffic set obtained from the oil and gas industry infrastructure was analyzed using machine and deep learning models. The highest detection rate of 100% was obtained with the CNN model. The study examined the datasets in terms of result parameters such as the ROC curve, F-score, precision–recall curve, mean average precision, and accuracy. In another study [24], the dataset was analyzed using the LSTM, FNN, and hybrid FNN-LSTM models. The dataset consisted of the SCADA testbed and KDD’99 datasets. The study compared the results based on the F-score. The highest result of 99.68% was achieved with the FNN-LSTM model. In another study [25], the SwaT dataset was analyzed using machine and deep learning models. The authors put forth that reconnaissance attacks were detected through anomaly detection using the Random Forest and DNN models along with the MLP model. The highest accuracy percentage of 99% was achieved with the DNN algorithm. Another study [26] suggested that intrusion detection systems (IDSs) for the Industrial Internet of Things (IIoT) face challenges due to the large amount, speed, and diversity of the data generated by IIoT devices. The study suggested that deep learning methods can help overcome these challenges by automatically learning the relationships between features in the data and improving the intrusion detection accuracy. The study was conducted using the Convolutional Neural Network (CNN) and Long Short-Term Memory (LSTM) models. The results of both models were combined for intrusion detection decisions. The highest correct detection percentage recorded in the study was 99%. In another study [27], the dataset used was obtained from 100 IIoT devices in a simulation environment. The proposed model calculated the trust value between the IIoT devices using machine learning models, unlike traditional weighted calculations. The proposed model aimed to determine the trust value accurately using the neutrosophic SVM method. In addition, the simulation results showed that the proposed model achieved 100% accuracy compared to the existing solution. In another study [28], intrusion detection using the NSL-KDD and Bot-IoT datasets commonly used in the literature was performed. The highest accuracy result was achieved with the KNN model. The trained models were stated to be usable in intrusion detection systems (IDSs) used in IIoT systems. In another study [29], a dataset consisting of IoT and IIoT data was analyzed using three neural network models. While a 97.85% correct detection rate was achieved with the binary classification method, a 97.14% correct detection rate was reached with the multiclass classification method. In another study [30], a new method using the autoencoder model was proposed to detect False Data Injection (FDI) attacks in a complex hydraulic-sensor-based system. The FDI attacks were performed in two different scenarios called case 1 and case 2. Another study] [31], investigated artificial intelligence methods using machine and deep learning models to improve the IDS performance. It was found that the ensemble classifier method can find the best combination among multiple prediction algorithm models. An Artificial Neural Network (ANN) was used together with the Adam optimizer to update the model weights based on the training data and achieve the best performance. Among the models discussed in the study, the SE-DNN model was determined as the best model. This model provided gains ranging from 0.8% to 1.5% compared to the accuracy recall and F1-score presented by the reference classifier. An average correct detection rate of 99.7% was achieved with the proposed model. In another study [32], a weighted classification scheme was proposed as a solution to the class imbalance problem. The proposed scheme establishes an initial decision mechanism for packet classification using supervised machine learning. The Decision Tree model used in the study achieved an accuracy percentage of 69%, while the proposed model improved this rate to 94%. In another study [33], an IDS model was proposed using the Random Forest model for IIoT networks. The PCC method was applied for feature selection. It was stated that the most suitable combination was obtained by applying these methods separately and in different combinations. The proposed model was applied to the Bot-IoT and Wustl_IIoT_2021 datasets. The Random Forest model achieved a correct detection rate of 99.99%. In another study [34] a machine learning approach was proposed for automatic device recognition and anomaly detection through network traffic analysis. Feature selection was performed to improve the classification performance based on the learned model from the device identification module. The application was implemented on real data from a smart factory. The best performance, with an accuracy rate of 97.6%, was achieved with XGBoost. In another study [35], a multiagent system (MAS) based on deep learning with a privacy-preserving data transmission (BDL-PPDT) scheme was developed in a clustered IIoT environment. The goal of the BDL-PPDT technique is to achieve secure data transmission in the clustered IIoT environment. The BDL-PPDT technique includes a two-stage process. The presented BDL-PPDT technique achieved the best result with an accuracy rate of 98.15%. In another study [36], the proposed algorithm had a relatively high detection accuracy and relatively low training time compared to the current technology. At the system architecture level, a hybrid detection architecture was proposed. The highest accuracy percentage of 93.2% was achieved with the LGBM model. In another study [37], the most common four protocols used in the SCADA IIoT and their security sensitivities were examined. The study addressed new attack types through machine learning, such as backdoor, command injection, and SQL injection. Additionally, feature importance ranking was performed to highlight the most important features in distinguishing attack traffic from normal traffic. An accuracy percentage of 99.99% was achieved with the Random Forest model. In another study [38], the impact of Adversarial Machine Learning (AML) attacks on intrusion detection for IoT and large-scale IIoT networks was investigated, and FGSM-based attacks were examined in the study. The results showed that the performance of the Artificial Neural Network (ANN) model decreased under FGSM attacks. In another study [39], two techniques were proposed for selecting examples instead of randomly selecting malicious software examples to retrain a model. The proposed selection method outperformed the random-selection strategy. Moreover, the proposed selection method achieved a 6% performance improvement compared to the random-selection method. The highest accuracy percentage of 98.5% was achieved with the SVM model. Another study [40], represents a significant advancement in the field of aircraft trajectory prediction by introducing a secure and resilient framework that addresses current challenges in dealing with adversarial threats. The ultimately developed GAN-BLT algorithm demonstrated a superior performance among the three defense strategies, achieving a deception rate of only 2.8%. In another study [41], the accuracies of traditional and cutting-edge regression algorithms for predicting aircraft trajectories were compared, finding that modern algorithms exhibited higher regression accuracies but were less resilient to specialized adversarial attacks. It was observed that traditional classifiers were more resistant to adversarial attacks, while the adversarial training of all the models increased the error rates, presenting a security concern for learning-based systems. Additional information about the studies is presented in Table 1.
As seen in Table 1, the WUSTL-2018 dataset has been examined in other studies found in the literature. Due to its relatively recent nature compared to other datasets in the literature, there are limited studies directly focusing on this dataset. It is anticipated that the number of studies related to the examined dataset will increase as a result of this study. One distinguishing aspect of this study from others is the detailed theoretical explanation of attacks conducted in SCADA systems, supported by visual representations. Furthermore, in terms of the types of models used in the application, it is one of the rare studies conducted in this field, as it examines three different types of models: machine learning, deep learning, and hybrid models. Additionally, a total of 14 models were used during the examination of the dataset, which is again a rarity in this field. Moreover, the accuracy results obtained with the models used in this study are higher than those of all other studies.

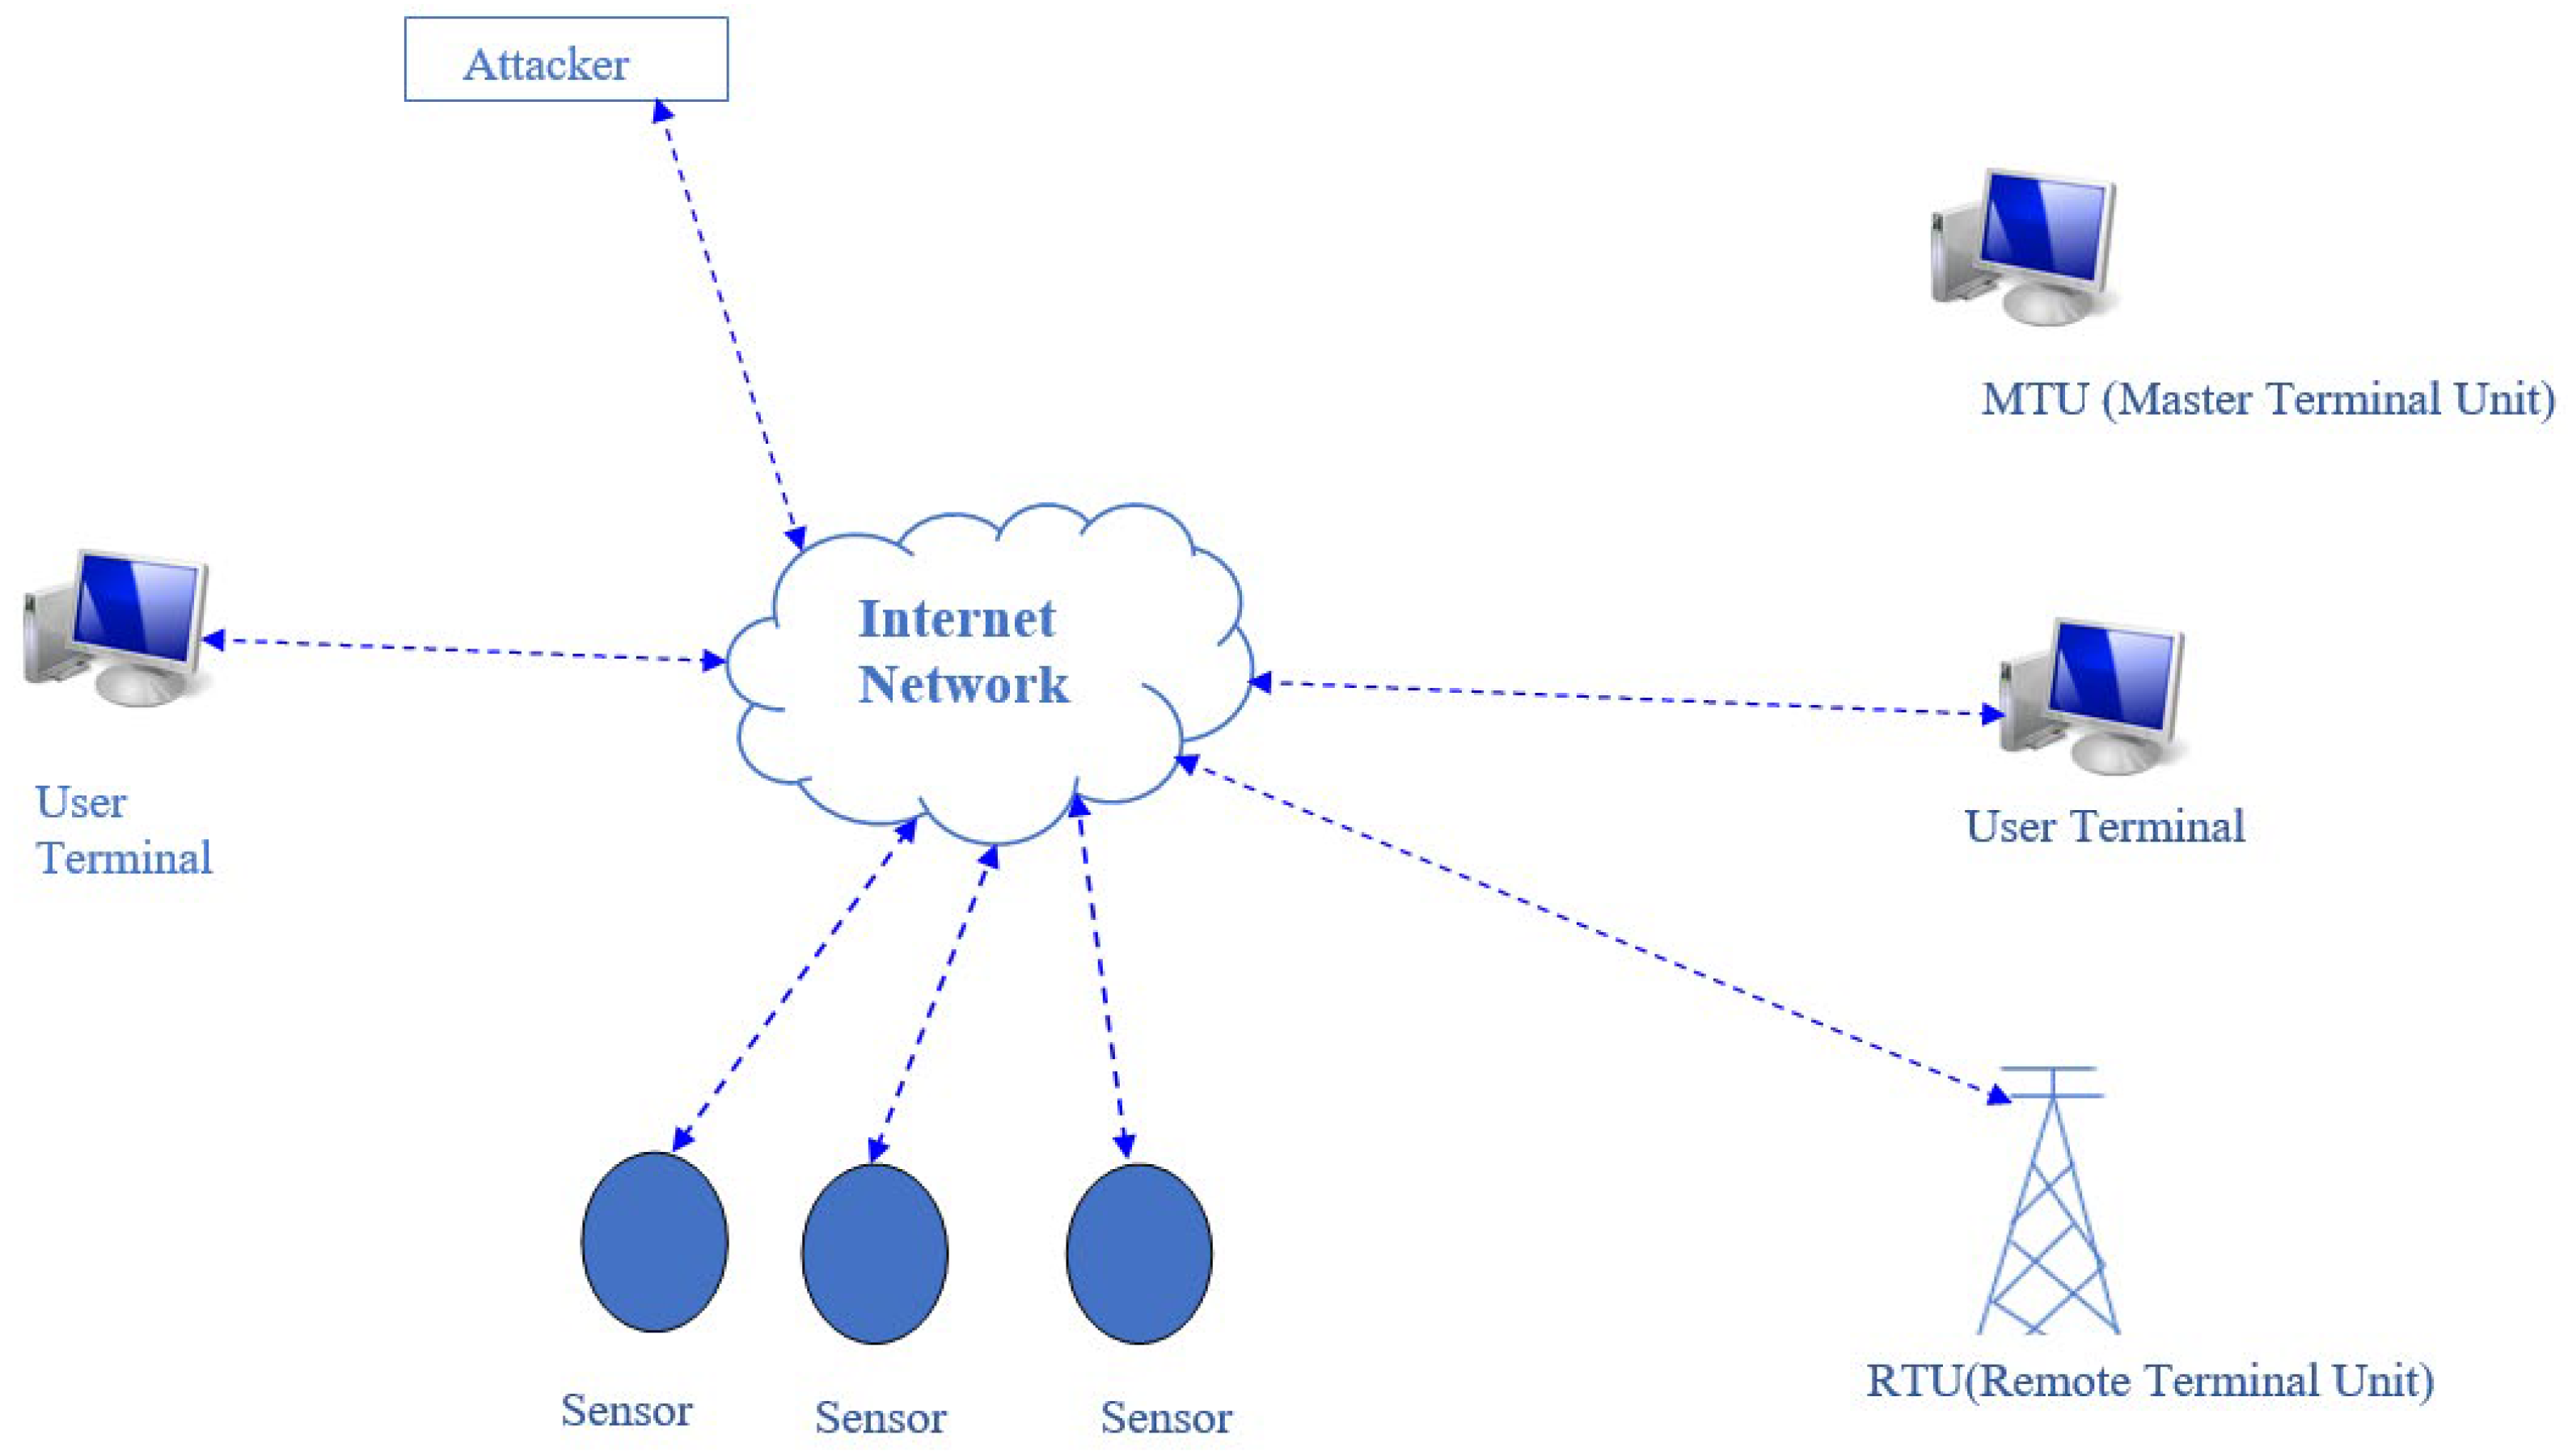
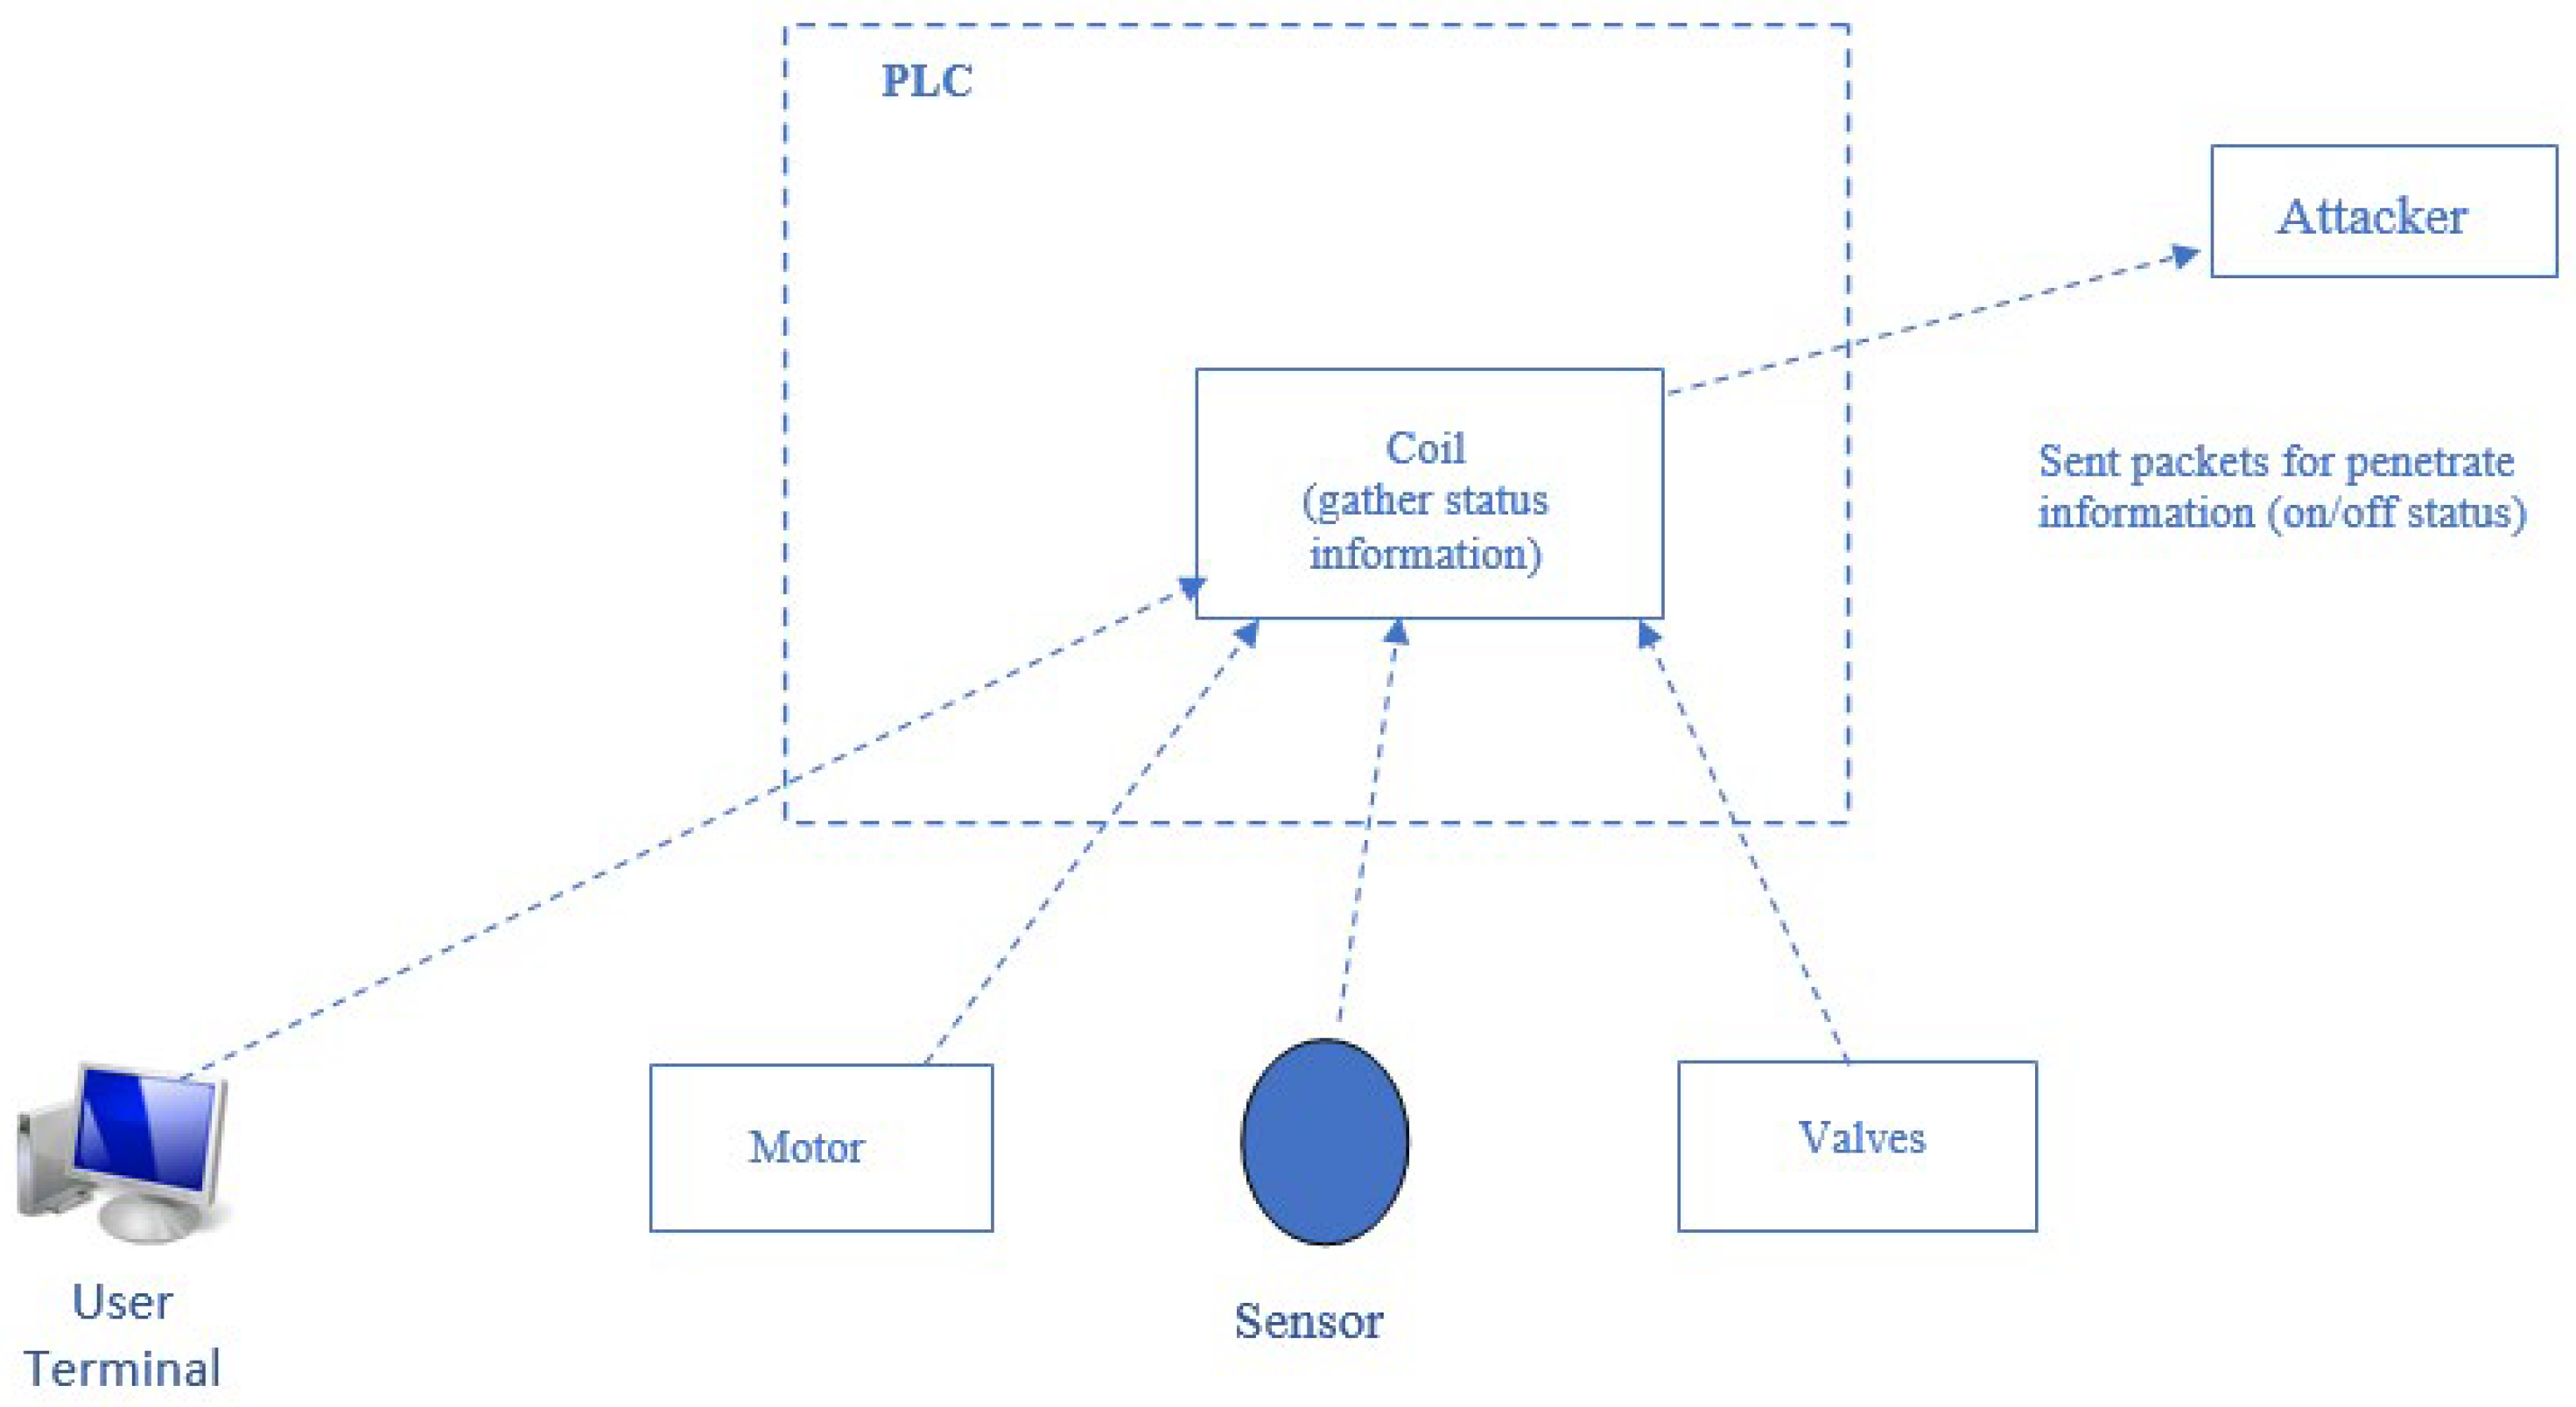
3. SCADA and Security

SCADA facilitates communication between devices in systems. Systems such as sensors, actuators, and critical infrastructure are controlled and monitored through the SCADA Programmable Logic Controller (PLC). They are essential and fundamental infrastructures that provide necessary services for a country, including sectors such as the economy, healthcare, energy, and defense, and that establish connections between them. SCADA systems are crucial for the efficient, autonomous, controlled, and secure management of systems. In the specified sectors, SCADA systems perform operations such as control, monitoring, communication, and alarming. Therefore, SCADA systems interact with all devices from the centralized control center to the edge systems. Due to this interaction, there is an information communication channel for each device in SCADA systems. Because SCADA works in integration with control centers, it is physically located separately from the system. It also possesses advanced communication and complex computation capabilities. Moreover, modern control systems have data servers, HMI stations, and other servers and support units. With these software and hardware features, they ensure the synchronized and orderly control of all integrated systems. SCADA is responsible for maintaining communication and synchronization within the integrated system as well as with other networks (the internet, other outside networks). Communication with external networks is established via gateways based on IP addresses. Gateways handle the routing of incoming and outgoing traffic, enabling communication between the two networks Figure 1 illustrates the SCADA network architecture.
As seen in Figure 1, the SCADA architecture consists of four main components. The first level, known as the field level, comprises sensors and actuators. These devices collect data related to the industrial process and control them sequentially. The second level, also known as the direct control level, consists of communication devices, local control devices, such as PLCs, and Remote Terminal Units (RTUs). These control devices communicate with field devices, receive data inputs, and issue commands to control actuators. The third level is the facility supervision level, where communication takes place. It includes local control systems that collect data from level 1 control devices and send commands to them. These systems gather data and send appropriate commands to ensure the smooth execution of the process. The fourth level is the production control level, which encompasses the control systems throughout the system. These systems collect data from level 2 control systems to generate continuous reports for production-planning purposes. Additionally, they perform functions such as alerts and reporting at the site or regional level. The production-planning level consists of business systems used to manage ongoing processes. These systems are responsible for creating and managing production schedules, coordinating with suppliers and customers, and ensuring that the production process aligns with the business objectives.
The synchronous and autonomous operation of SCADA systems is directly related to the error-free and smooth functioning of the software. Any intentional or unintentional interference, whether from internal or external sources, can partially or completely disrupt the system’s operation. With the advent of Industry 5.0/IIoT transformation, SCADA systems have been integrated with cyberphysical systems, cloud technology, big data analytics, artificial intelligence, and machine learning [42]. This integration has simplified the maintenance, infrastructure costs, and configurations of these systems. With these features, SCADA enables rapid alerting, system monitoring, notification of changes through alarms, and advanced communication capabilities. As SCADA operates on a distributed-system logic, communication needs to be fresh, live, and reliable, reaching even the remote endpoints. Figure 2 illustrates the hierarchical structure of the SCADA system.
As shown in Figure 2, SCADA consists of four fundamental hierarchical levels. The Supervisor Control System is responsible for collecting data from the endpoints and sending commands to these units. The Data Acquisition section is where the data is collected and sent to the SCADA computers. Data Exchange involves the reception and transmission of data exchange, communication protocols, and commands. Data Storage refers to the section where the data is stored in the cloud or servers.
The collaboration with the web enables SCADA systems to operate even in remote locations. However, this convenience also brings along cyberattacks. The modernization of SCADA systems, the standardization of communication protocols, and increased interdevice communication have resulted in an increase in cyberattacks. Successful attacks on SCADA systems can lead to financial losses, environmental pollution, the loss of human lives, and more. Various measures are being developed to prevent cyberattacks. To develop these methods, there is a need for real or test environment examples of network attack data. Different types of attacks are carried out in SCADA systems at various dimensions and layers. In this study, five different types of attacks were conducted at the network level, including port-scanning, address-scanning, device identification (aggressive mode), and exploit attacks. The performed attacks are shown in Figure 3.
The attacks shown in Figure 3 are explained in detail with accompanying visuals in this section.

3.1. Port-Scanning Attack

This type of attack is used to determine the protocol used in the SCADA network. It is performed by sending packets to the targets using the Nmap tool at intervals from 1 to 3 s, taking advantage of the TCP protocol’s inability to establish fully connected connections. Detection of this attack is therefore difficult [15]. Port-scanning attacks in SCADA systems involve using a port-scanning tool to discover open ports in the SCADA network. SCADA networks are used to manage and supervise industrial processes, such as manufacturing, water treatment, and power generation. They are frequently connected to the internet or other external networks for remote monitoring and management purposes. This type of attack is particularly dangerous, as it can allow attackers to gain access to critical infrastructures, such as nuclear power plants, dams, water treatment facilities, and power plants. Once open ports are identified, an attacker can attempt to gain control or manipulate the SCADA system by exploiting vulnerabilities in the system through these ports. To prevent port-scanning attacks in SCADA systems, it is important to implement strong security measures, such as network segmentation, access controls, and intrusion detection systems. Regular security audits and vulnerability assessments should also be conducted to identify and rectify any weaknesses in the system.
As shown in Figure 4, this is a type of attack that aims to detect open ports belonging to devices connected to the SCADA network. The attacker first gains access to the system through the internet network. Then, they send specific network packets to the main system components, such as RTUs, PLCs, sensors, and end-system components, such as users. By utilizing these network packets, the open ports are identified, and the attacker can infiltrate the respective device through these ports, rendering the system unusable or inaccessible, or manipulate its functionality.

3.2. Address-Scanning Attack

An address-scanning attack is a type of cyberattack targeting SCADA systems used in industries to monitor and control industrial processes. The attacker attempts to discover the IP addresses of devices connected to the system and exploit security vulnerabilities to gain unauthorized access. Tools such as port-scanning tools or network-mapping tools can be used for the attack, and social engineering tactics can also be employed. The objective of the attack is to scan the network, extract network addresses, and identify the address of the Modbus server among these addresses. Each system typically has one Modbus server, and if this server becomes unavailable, the entire SCADA system can suffer significant damage. Therefore, this attack aims to identify the address of this critical device. The attack is particularly dangerous, as it can cause disruptions in critical infrastructure. To prevent address-scanning attacks, security measures, such as firewalls, intrusion detection systems, and access controls, should be implemented. Additionally, regular security audits and vulnerability assessments should be conducted to identify and mitigate weaknesses. Figure 5 illustrates the address-scanning attack model.
Figure 5 represents the address-scanning attack, which involves infiltrating SCADA systems over the internet to discover the IP addresses of devices. The attacker gains access to the SCADA system through the internet and targets system components such as RTUs, end sensors, user computers, intermediate communication devices, and PLCs by sending packets. The objective is to obtain address information through these attacks. In these attacks, packets transmitted over the internet can take the form of handshake packets or data packets.

3.3. Device Identification Attack

A device identification attack in a SCADA (Supervisory Control and Data Acquisition) system is a type of cyberattack that focuses on gaining access to the unique identification information of the devices connected to the system, such as IP addresses, MAC addresses, or serial numbers. The objective of this attack is to gather information about the connected devices and utilize this information to launch other attacks or weaken the security of the SCADA system. Attackers can exploit these details to identify vulnerabilities in the devices or in the system itself and target specific attacks, such as Denial of Service (DoS) attacks. Preventing device identification attacks requires the implementation of strong security measures, including the use of secure communication protocols, regular software and firmware updates, access controls for sensitive data, and authentication mechanisms. Additionally, monitoring network traffic and system logs can help detect suspicious activities that may lead to device identification attacks and prevent significant damage. In this type of attack, IDs are assigned and used to identify devices in a SCADA network connected to Modbus. Furthermore, IDs can be utilized to gather information about vendors and firmware versions. Device identification attacks in SCADA systems focus on the discovery of specific devices within the network using various techniques, such as network scanning, fingerprinting, or traffic analysis, enabling the collection of information, such as IP addresses, operating systems, and software versions, associated with these devices. Once the target devices have been identified, the attacker may attempt to gain access to the device or take control of the SCADA system by launching additional attacks, such as password cracking or attack software.
SCADA systems are particularly vulnerable to device identification attacks, as they provide attackers with a clear understanding of the network structure and the critical assets that need to be protected. Therefore, implementing strong security measures, such as access controls, network segmentation, and intrusion detection systems, is crucial for preventing and detecting such attacks. Additionally, conducting regular security audits and vulnerability assessments can help uncover potential weaknesses in the system and assist in remediation efforts. Figure 6 illustrates the device identification attack in detail.
In Figure 6, as observed, the attacker sends specialized packets from either the internet or within the system through any open endpoint to the internal network, aiming to identify the addresses of devices, such as ID, MAC, and IP addresses. As depicted in Figure 6, the attacker sends specific network packets to devices such as routers and switches from within the system or over the internet, collecting information about the system’s main and end components, including RTUs, sensors, users, and the Master Terminal Unit (MTU).

3.4. Device Identification Attack (Aggressive Mode)

In this attack, similar to the device identification attack, information related to the IDs of devices connected to Modbus in the network is collected. As depicted in Figure 6, this involves gathering information from devices connected to the network. However, the difference from the device identification attack is that more detailed information about the network devices is conveyed to the attacker.

3.5. Exploit Attack

The purpose of the exploit attack is to read the value of the coil. The coil is responsible for indicating the ON/OFF status of devices (such as motors, valves, and sensors) controlled by the PLC. All network traffic is monitored by the ARGUS tool. This monitored traffic is recorded in .csv format [15]. Figure 7 illustrates how the exploit attack is performed.
As shown in Figure 7, the ON/OFF status information of member devices, such as computers, motors, sensors, and valves, is sent to the coil. The attacker gains access to the information of these member devices by directly connecting to the coil or through the PLC. This is achieved using customized packets, such as network packets.

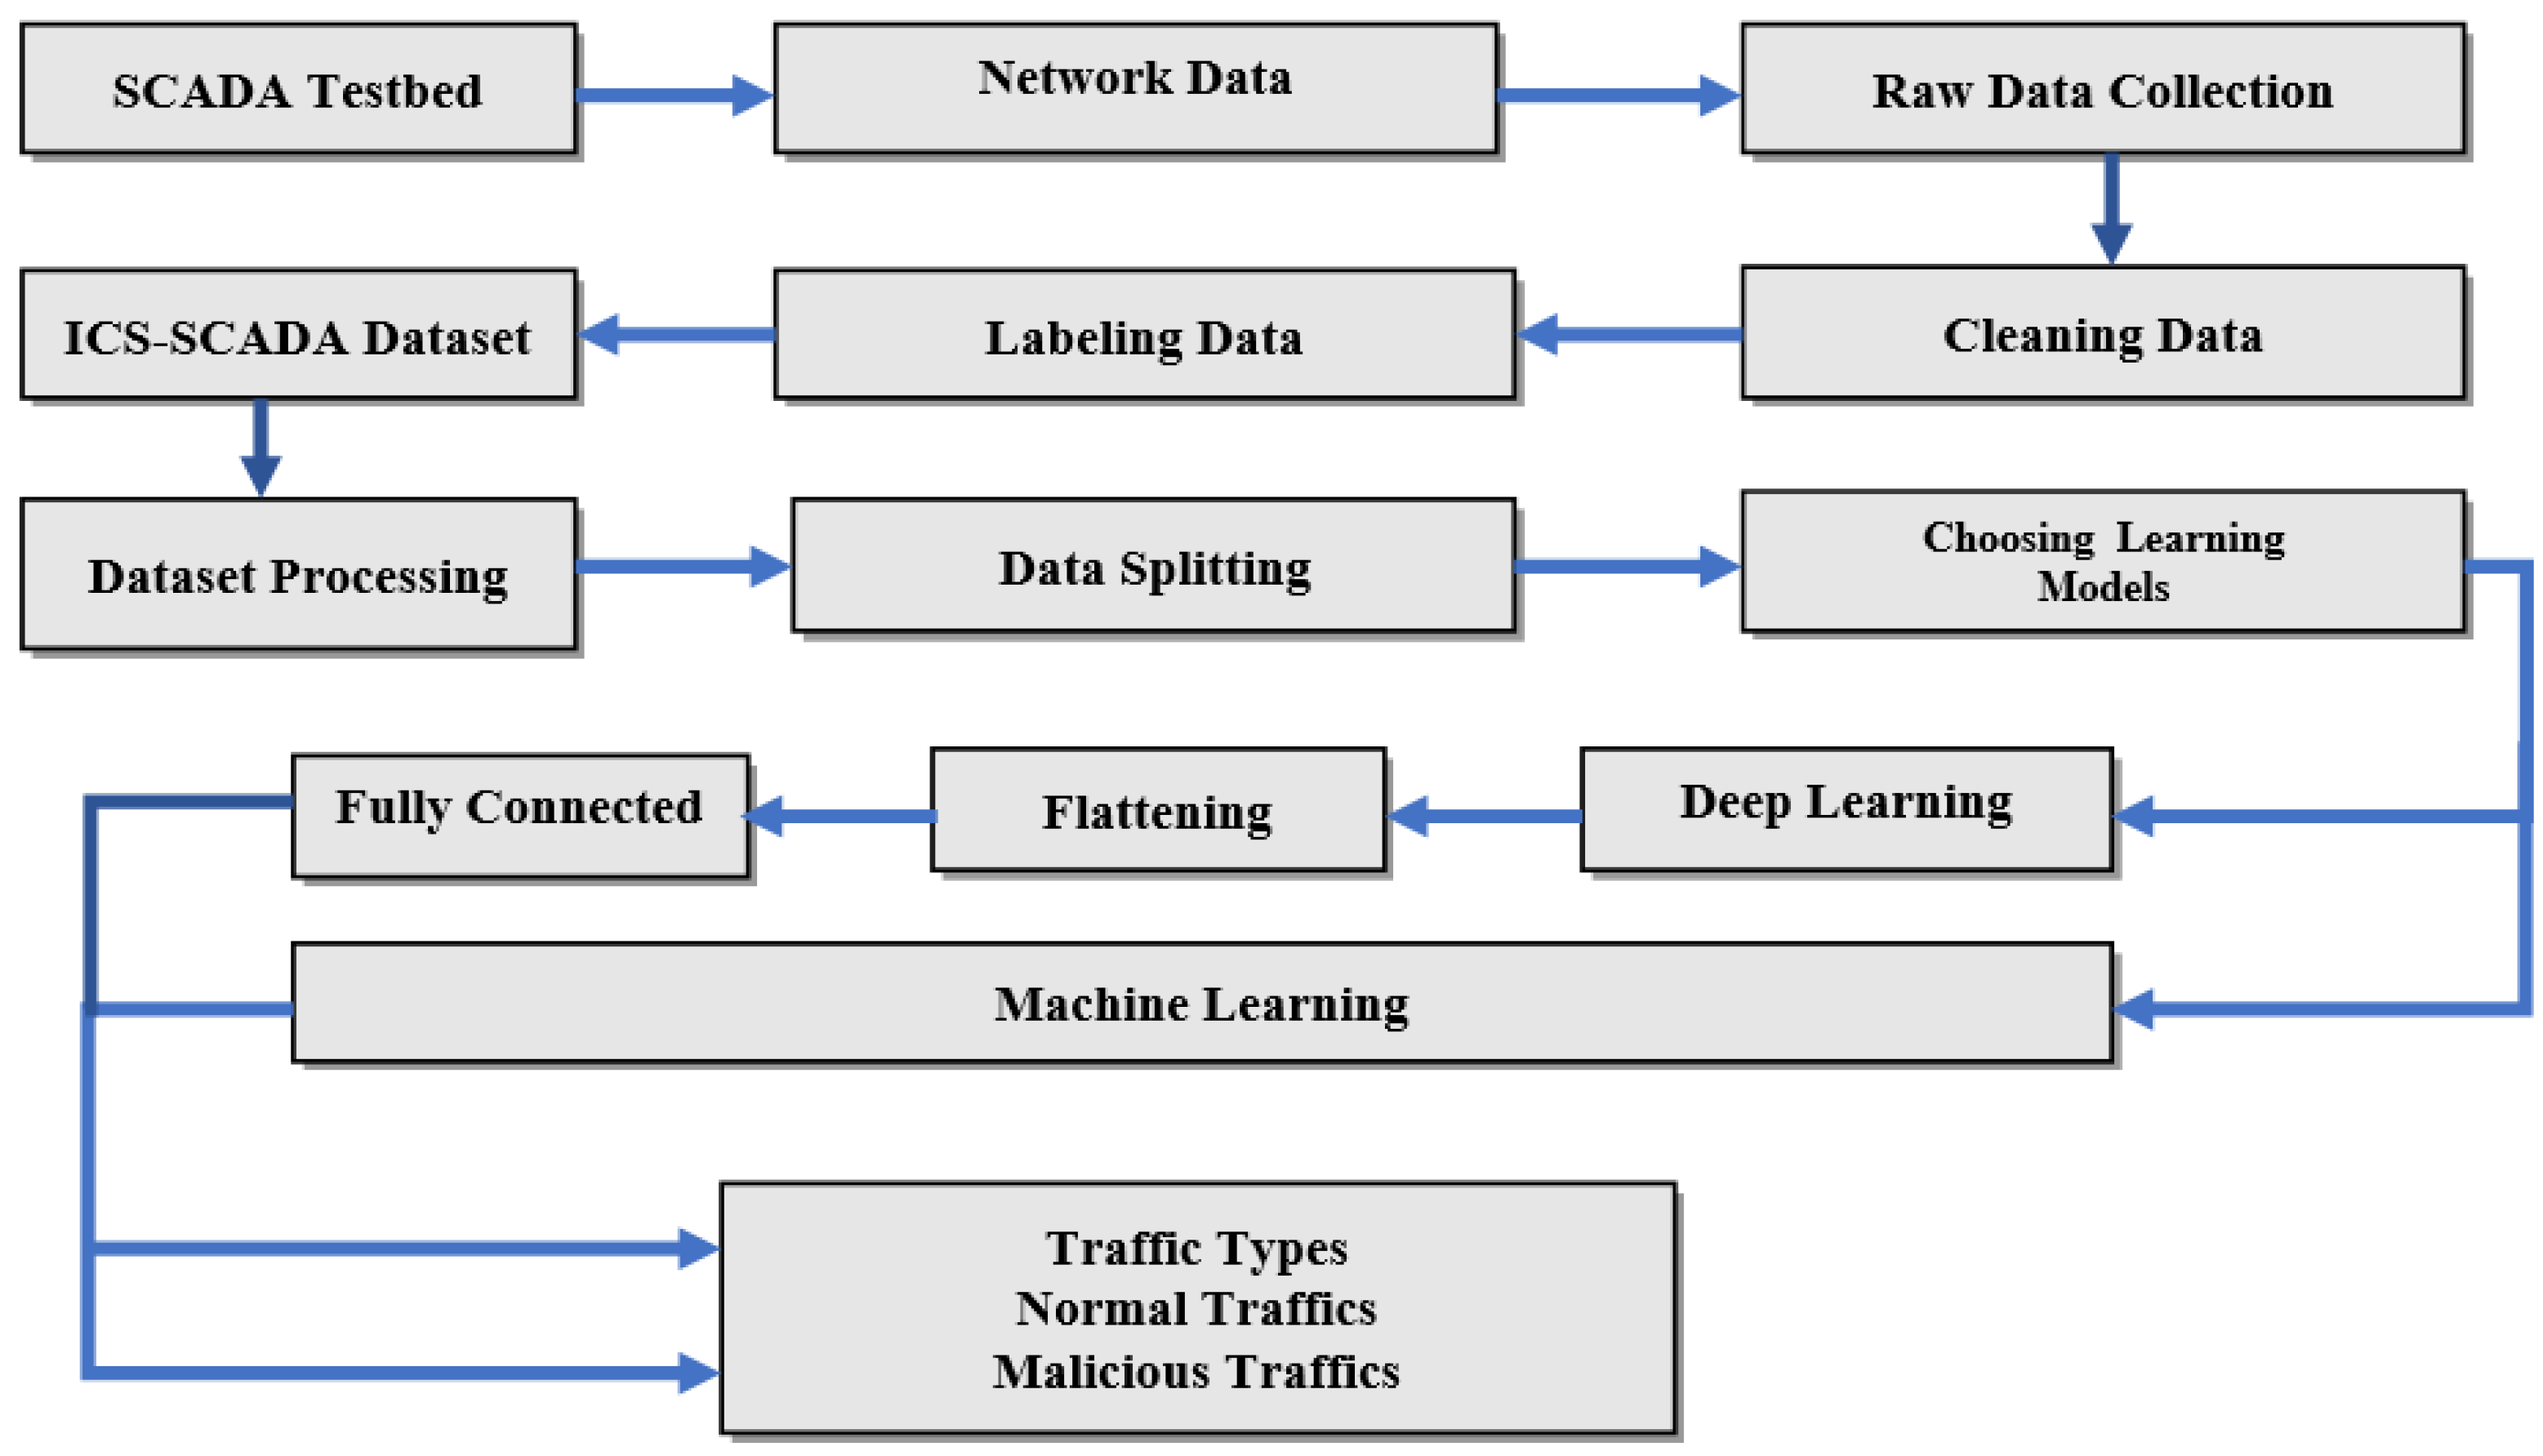
4. Materials and Methods

This section provides information about the network traffic data analyzed in the study, as well as the methods and techniques used for the data analysis.

4.1. Dataset

The dataset used in this study was obtained from a SCADA simulation environment that closely resembles a real-world scenario. The dataset includes network data related to the SCADA system. This dataset is widely acknowledged in the literature, as it has been utilized in reputable works, such as ref. [16]. Therefore, it would not be wrong to assume that there is no doubt regarding the integrity and validity of the dataset. The network traffic consists of two types: normal traffic and attack traffic. Attack network traffic denotes the kind of traffic designed to harm the system. This study’s attack traffic encompasses five distinct attacks. Normal traffic refers to traffic that supports the system’s standard communication processes. Prepared network traffic does not represent a separate category of traffic. Instead, “prepared” network traffic is the condition of the traffic dataset that has been prepared for model analysis. During the generation of attack traffic, reconnaissance attacks were utilized. The created SCADA network environment was scanned with various attacks to identify devices with vulnerabilities and their corresponding ID numbers. This process was carried out using different tools. The types of attacks used for these operations are presented in Table 2. Additionally, the vulnerabilities present in the identified devices and the specific nature of these vulnerabilities were determined within the test environment through the conducted attacks.
The WUSTL-IIoT-2018 dataset, as shown in Table 2, has a size of 627 MB and consists of 93.93% normal traffic and 6.07% attack traffic. The dataset comprises 7,037,983 rows and 7 columns (features) [15]. The dataset as a whole (including both “attack traffic and normal traffic”) contains 6 features. The number of features does not change according to the type of traffic. The type of traffic is determined by the values taken by the features. Just like in other datasets in the literature, it is not specifically emphasized that the number of features in this dataset is fixed. The models in the study draw conclusions based on the values of these features. In Table 3, a subset of the dataset is presented, with information about its contents.
In Table 3, it can be observed that the dataset consists of 7 features, and the values taken by the relevant features are provided. The “Target” feature indicates the type of traffic (attack or normal). As shown in the table, the traffic is labeled either as normal or attack traffic.

4.2. Data Preprocessing

When datasets are in their raw form, they cannot be directly used with models. Special characters (:, ?, -, \) that cause error codes are removed from the dataset in an appropriate manner. The raw dataset may contain textual parts, irrelevant parts for learning models, or parts that cause error code generation. It is not possible to analyze the dataset with models with these parts. Data obtained in a real or test environment undergo a cleansing process before they are ready for use with models. After this process, the data-preprocessing stage is initiated. The data preprocessing consists of three stages. The first stage is the encoding process. The textual parts of the dataset are transformed into numerical values by applying the encoding process. Also, the class label that indicates the class to which the data belong is represented by numerical expressions. Therefore, if the label indicating the class to which a row belongs is textual, a numerical transformation process is applied. The second stage is the feature reduction process. Features that do not directly affect the outcome burden the local hardware and sometimes make it insufficient. Additionally, a high number of features increases the computational intensity and energy consumption. Therefore, feature reduction can be performed on the data. Feature reduction both shortens the analysis process and overcomes hardware limitations. Hence, features that do not affect the outcome are removed during the categorization of the data. The third stage is the normalization process. If the distribution of the feature values is in a wide numerical range, normalization is applied to represent the values within the range of 0–1. The aim of the normalization is to prevent parameters with large numerical values from having an excessive impact on the outcome. After the normalization process, the dataset is ready for use with the models. All these preparation processes are carried out in the data-preprocessing phase.
In this study, the special character (“) was removed from each row of the dataset before proceeding to the data-preprocessing stage. The first stage of data preprocessing, the encoding process, was applied to the class attribute. The class attribute of the rows is represented by two types of traffic: attack and normal traffic. The feature values of these rows belonging to the class attribute are represented by the numbers 0 and 1 through label encoding. Table 4 provides information about the label-encoding process and its description.
In Table 4, the rows with a value of 0 represent normal traffic, while the rows with a value of 1 represent attack traffic. The second stage of feature reduction was not applied in this study. Because each feature directly influences the outcome and there is no limited resource problem, the feature reduction process was not implemented. The third stage, normalization, was applied to all the features, positioning the values of the features within the range of 0–1. It is especially important to apply the normalization process to the features numbered 1, 3, and 6, which have significantly larger values compared to the other features.

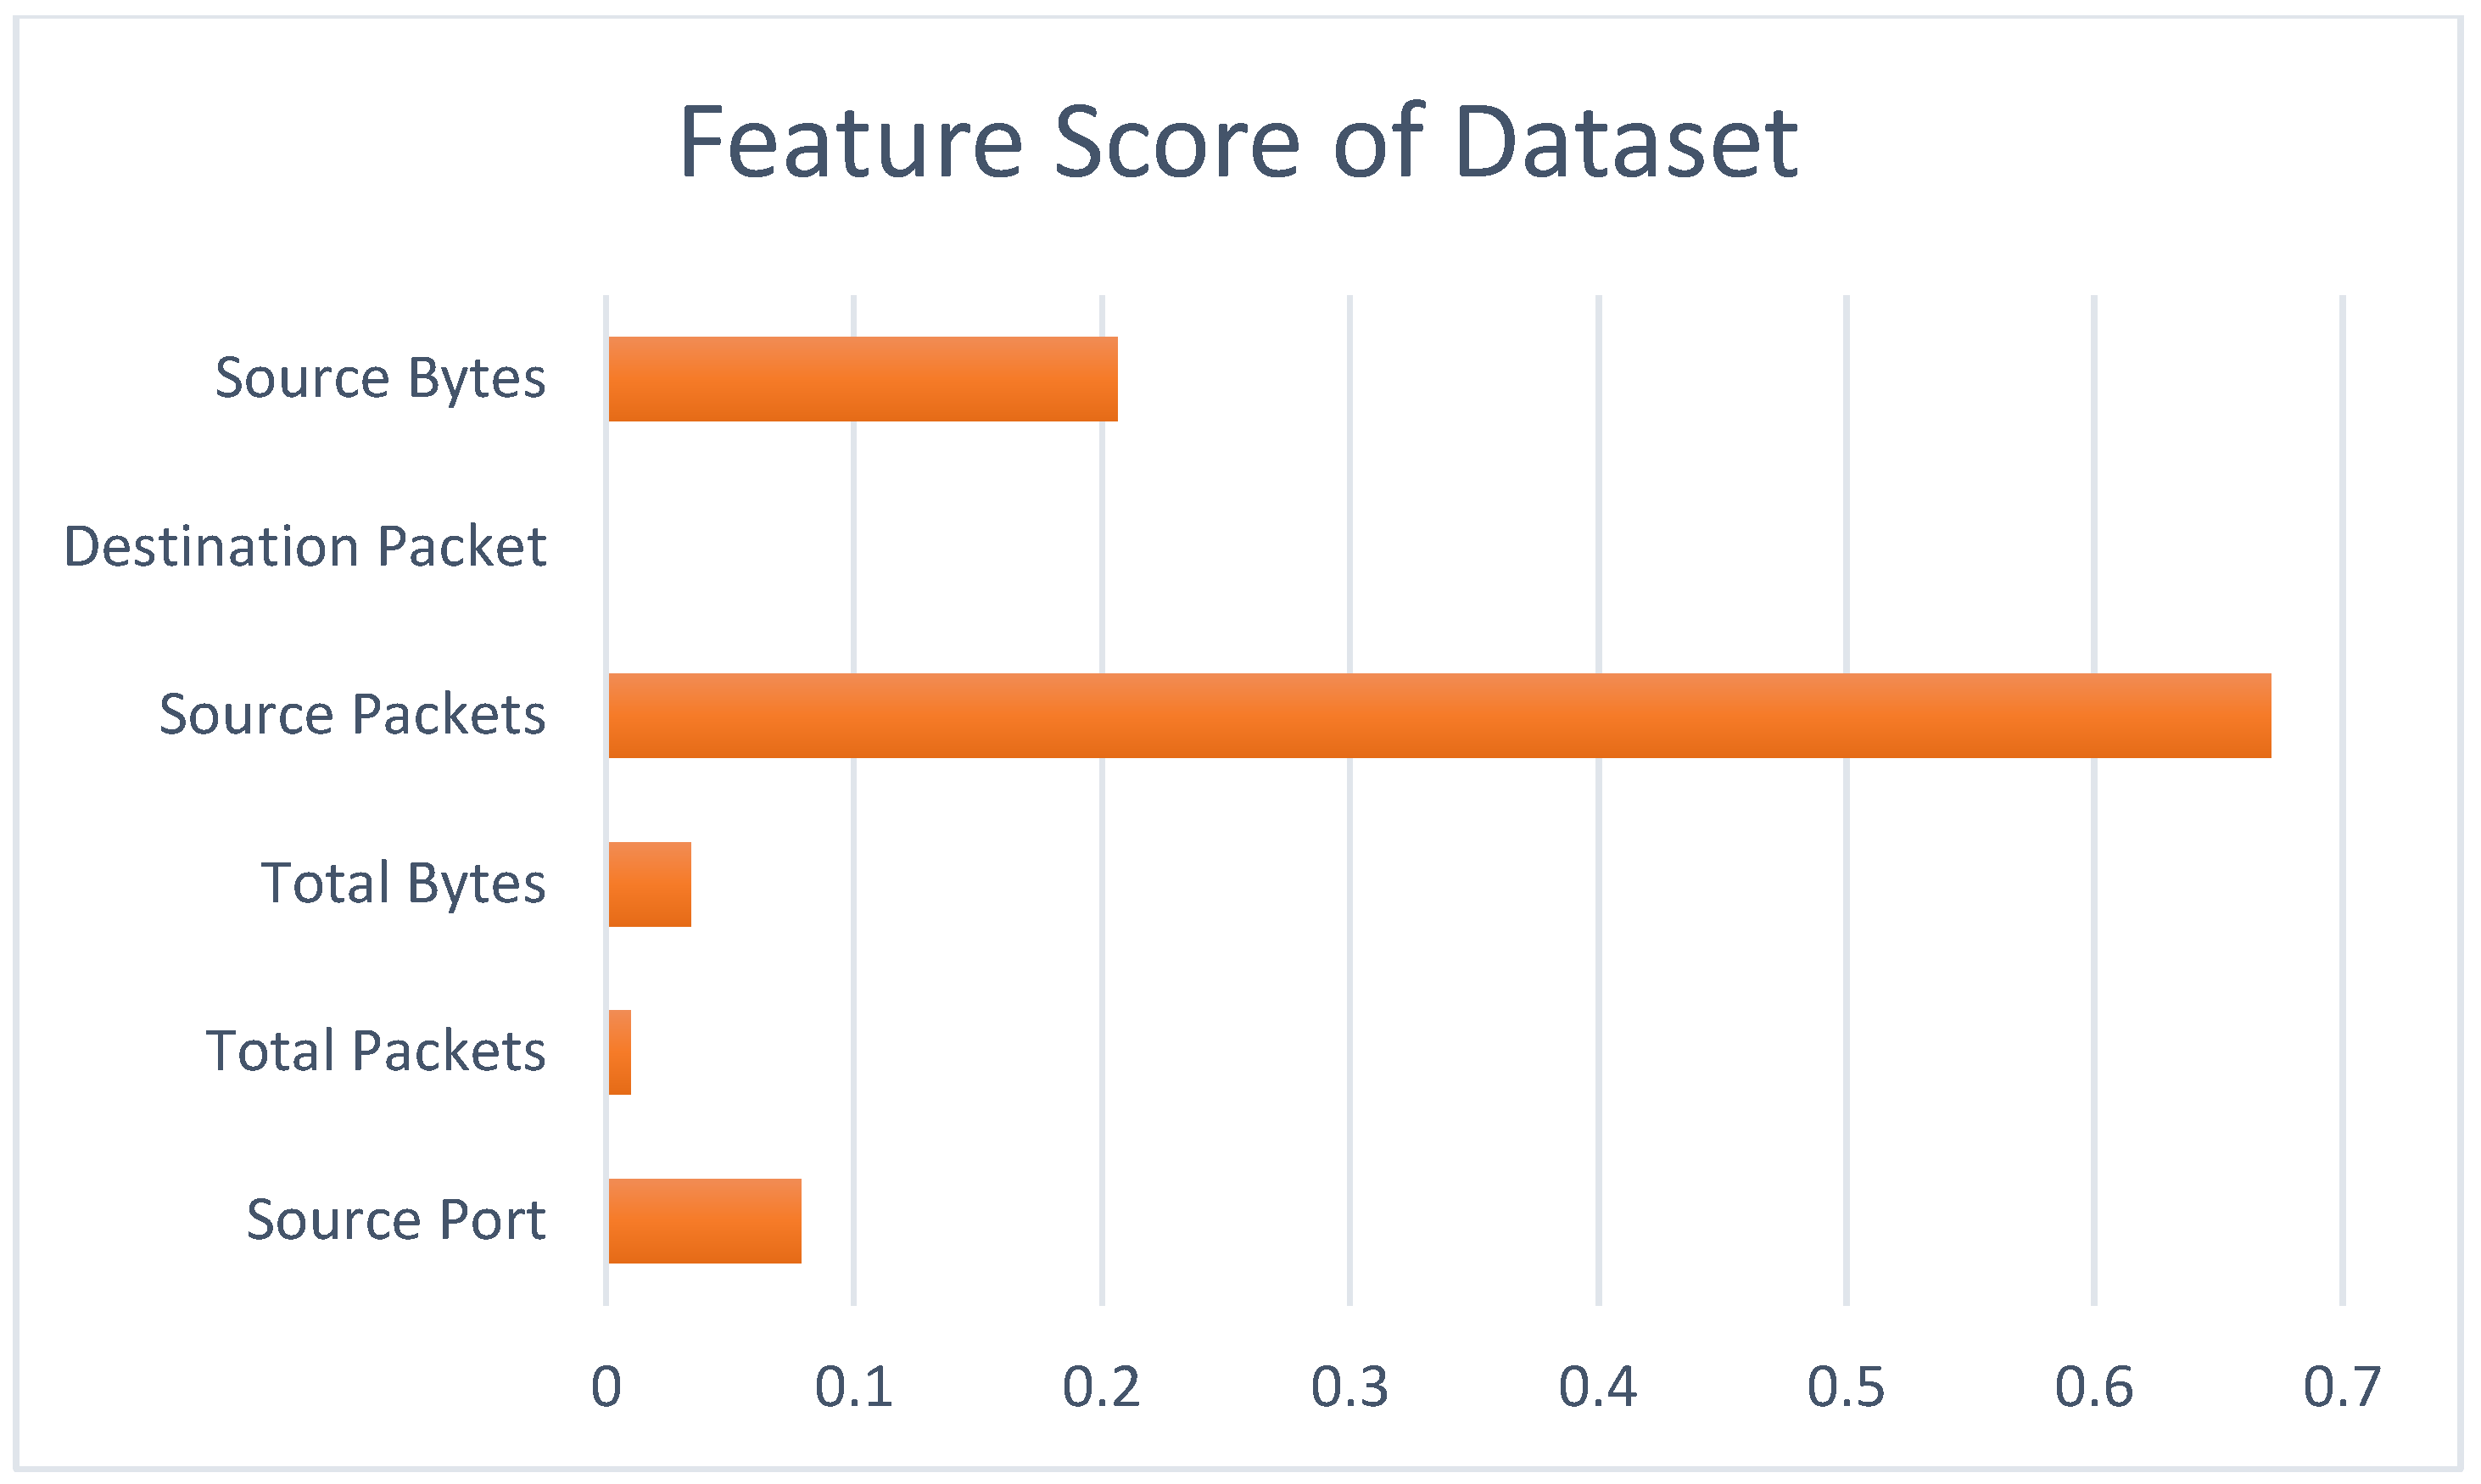
4.3. Feature Selection by Random Forest and PCA

Feature selection is the process of selecting the most effective and appropriate set of features for classification by removing features that have the least impact on the outcome. Feature selection reduces the computational burden in machine learning and deep learning algorithms. Particularly in learning processes with limited resources, feature reduction can be applied. In this study, there was no need for feature reduction during the data classification. All the features were used to classify the data. The aim was to contribute to the literature and provide insights for future studies using the dataset by investigating the impact of the features on the outcome. In this study, the Random Forest algorithm was used to determine the impact of the features. The Random Forest algorithm is a popular supervised ensemble algorithm used for classification and regression tasks. The Random Forest algorithm relies on the results of multiple decision trees, which are subsets of the dataset, through majority voting. The decision trees start branching based on the feature with the highest information gain at each node. The selection of the feature for branching depends on its importance. Computing the importance rankings of the features in the dataset is effective at feature selection and reducing features with low impacts. The ability to rank features according to their importance allows the use of the Random Forest algorithm for feature selection. The importance of a feature in the Random Forest algorithm is determined based on how much it increases the purity of the nodes compared to other trees [43]. The feature score graph, showing the impact of the features on the outcome, is presented in Figure 8.
Table 5 displays the detailed numerical results of the feature score values. According to the table, the Source Packets feature has the highest feature score value, indicating its strong impact on the outcome. The feature score values of the other features are also presented, allowing for a comprehensive comparison of their importance rankings in the classification process.
When examining Table 5, it can be observed that the Destination Packet feature has the lowest feature score value. This implies that the Source Packets feature has the highest impact on the outcome, while the Destination Packet feature has the least impact. In other words, the Source Packets feature is considered the most influential, whereas the Destination Packet feature has the least influence on the classification results. We analyzed the dataset with the Random Forest and, subsequently, with the PCA model, and the results are displayed in Figure 9.
The detailed numerical values of the graph in Figure 9 are shown in Table 6.
As shown in Table 6, when the features are ranked according to the PCA method, it can be observed that the Source Packets feature has the highest impact, while the Destination Packet feature has the lowest impact. The results were found to be consistent with each other. Before the feature reduction process, the full size of the dataset with 6 features was 185,067,864 bytes. However, after the reduction process, the size decreased to 160,258,284 bytes. This represents an approximate reduction of 14% in the dataset size. Based on this information, a feature reduction process was undertaken, selecting the three features with the highest impacts (Source Packets, Source Bytes, and Source Port) for re-training. Thus, the models were trained both with the entire dataset and with the dataset after applying the feature reduction process, thereby demonstrating the effect of the feature reduction process on the outcome. The outcomes are shared in the Section 6.2.

5. Proposed Model

In this section, the developed model is described step by step. To obtain the network traffic data to be used in the model, a test environment was prepared, and the system was executed. The obtained raw network data underwent simplification and preprocessing. The preprocessed dataset was then analyzed using machine learning and deep learning models. The goal of the study, which was intrusion detection, involved examining the dataset using various models. The network traffic was classified into the normal and attack traffic categories using these models. The trained models were evaluated on a separate test set that was not used during the training phase, and the results were recorded. The model that achieved the highest accuracy in detecting attacks was determined. This selected model can be integrated into network-based intrusion detection systems (IDSs). When deployed in IDSs, the developed model outperforms traditional detection systems by providing low error rates and high detection rates. The flowchart of the proposed model is presented in Figure 10.
As seen in Figure 10, the examined dataset was obtained from the test environment in its raw form and underwent step-by-step simplification and transformation processes to make them ready for use with the models. Subsequently, machine learning and deep learning models were employed to analyze the dataset.

6. Experiments and Evaluations

In the proposed model, the WUSTL-IIoT-2018 dataset was analyzed using eight machine learning models and seven deep learning models, including two hybrid models. To overcome hardware limitations, Google infrastructure was utilized for the model analysis. All model-related operations were performed in the Google Colaboratory environment. The analysis processes in the application utilized libraries such as Pandas, MLib, Scikit-learn, and PyCharm. The Apache Spark platform was chosen as the working environment, and the programming language used was Python. During the analysis with deep learning models, hyperparameters were used. The tuning process was conducted to determine the optimal hyperparameter values. The values were determined through a trial-and-error approach, considering both different values and commonly preferred values in the literature. The classification process was performed using the binary classification (normal and attack traffic) approach. To ensure the objectivity of the results, the dataset was divided into two parts for training and testing purposes: 70% of the dataset was used for model training, while the remaining 30% was reserved for testing. The portion allocated for testing was strictly not used with the models for any purpose other than testing (e.g., training). When detecting attack traffic, the results were evaluated and compared based on the F-score, accuracy, recall, and precision values.

6.1. Model Parameters

In this section, the parameters used for obtaining results with the models are provided. Firstly, in the Decision Tree model, the max_depth was set to 5. For the KNN model, the n_neighbors were set to 5. Logistic Regression was performed with default parameter values. In the Naive Bayes model, smoothing was set to 1.0 and the modelType was set to “multinomial”. The Random Forest model had the max_depth set to 5. In the SVM model, the kernel was set to “poly”. The XGBoost model was executed with the eval_metric set to “mlogloss” and the max_depth set to 5. As for the deep learning models, the CNN model used Conv (1D) with a pool size of 2, a filter size of 32, a dense layer with 128 neurons, five neurons, a dropout of 0.1, a kernel size of 2, the ReLU activation function, and a softmax activation function for the output layer with five neurons. The GRU model had three layers: an input layer with a density of 64 neurons, a hidden layer with a density of 150 neurons, and an output layer with a density of 5 neurons. The activation function used was ReLU/softmax, and the dropout was set to 0.1. In the LSTM model, the input layer had a density of 128 neurons and a dropout of 0.1, and the output layer had a density of 5 neurons with the ReLU/softmax activation function. The RNN model consisted of an input layer with a density of 128 neurons, a hidden layer with a density of 128 neurons, and an output layer with a density of 5 neurons. The activation function used was ReLU/softmax, and the dropout was set to 0.1. In the CNN-LSTM model, the first layer used a CNN (1D) with densities of 64, 128, and 5 neurons, a kernel size of 3, and a filter size of 32. The second layer was an LSTM layer with an input layer density of 128 neurons and the ReLU/softmax activation function. In the LSTM-CNN model, an LSTM model was used in the input layer, and a CNN model was used in the output layer. The LSTM layer had a density of 128 neurons and a dropout of 0.1, while the CNN layer had a kernel size of 3, a filter size of 32, a density of 128 neurons, and a pool size of 2. In the MLP model, three hidden layers were used. The hidden layers consisted of 64, 128, and 256 neurons. Because binary classification was performed, a single neuron was used in the output layer. The sigmoid function was used in the output layer. Binary cross-entropy was used as the loss function. The Adam function was used as the optimization algorithm. For the deep learning models, the common parameters used were a batch_size of 100 and epochs of 10/20/30. The dataset was in the binary classification structure but included five different types of attacks. Although five attacks were used in the development of the dataset, the class column consists of two types of classes: “attack traffic or normal traffic”, indicating that binary classification is involved. Even though the types of attacks are different, the binary classification method was successful due to the high similarity in the features between the different attacks. Different types of attacks exist. Therefore, the categorical cross-entropy function could have been used as the loss function. However, when binary (0–1) labels are used as classes, binary cross-entropy is used as the loss function. If different class labels had been used for each piece of attack traffic information while generating the dataset, the success rate could have been increased by using a multiclass function, like categorical cross-entropy. Optimization was performed using the Adam optimizer. The Adam optimizer is an optimization algorithm used for gradient-based optimization problems. This algorithm is an enhanced version of stochastic gradient descent (SGD) that combines the methods of momentum and RMSprop. In essence, the Adam optimizer adjusts the learning rate adaptively, allowing the model to reach the global minimum more quickly and effectively. The Adam optimizer adjusts the learning rate adaptively based on the update history of each parameter. This ensures that the model has suitable learning rates for different parameters. Adam has a low memory requirement because it eliminates the necessity of storing historical gradient information in previous time steps. The Adam optimizer combines the advantages of both momentum and RMSprop, enabling a more balanced and rapid optimization process.

6.2. Results and Comparison

In this section, the results of the dataset analysis with the models are presented. Prior to the analysis with the models, the relationships between the features of the dataset were examined. The developed model used a dataset with seven features. The correlations between the features in the dataset were calculated using the Pearson correlation coefficient, and they are shown in Figure 11.
In Figure 11, the relationships between the seven features in the WUSTL-2018-IIoT dataset were examined. A Pearson correlation matrix (PCM) was used to obtain Figure 10, which provides the degrees of the relationships between the features. In these relationships, a value of +1 represents the highest correlation, while −1 represents the lowest correlation. Looking at the diagonal axis in Figure 10, the same features intersect on this axis, so the correlation values have the highest value of 1. The correlation values are distributed in the range from +1 to −1. The colors of the correlation values are shown in shades ranging from dark green to white. A correlation value of 1 is represented by the dark-green color, while a correlation value of −1 is represented by the white color. After analyzing the feature relationships, the dataset was examined using machine learning, deep learning, and hybrid learning models, and the results are shown in the column chart in Figure 12.
In Figure 12, the percentage results of the precision, recall, F-score, and accuracy parameters for the examined dataset using the CART, Logistic Regression, Naive Bayes, Decision Tree, Random Forest, SVM, XGBoost, KNN machine learning, CNN, LSTM, GRU, MLP, RNN deep learning, and LSTM-CNN and CNN-LSTM hybrid models are presented in a column chart format. When analyzing the results of the deep learning models, higher accuracy rates, as mentioned in the literature, were achieved. The percentage results of the machine learning models are lower compared to those of the deep learning models. The dataset under study is more suitable for models based on binary classification. In the class column of the dataset, normal traffic is represented by the number 0, while attack traffic is represented by the number 1. Therefore, it is more suitable for binary classification, as it consists of two types of class values. In the literature, the most used models for binary classification can be listed as the Logistic Regression, Decision Tree, Random Forest, and Support Vector Machine models. In our study, the results are shared using the mentioned models along with other models. Although high results were achieved with models suitable for binary classification, the highest result was obtained in the MLP model. The reason for this is that, although the dataset class consists of 0–1, it is observed that there are different attacks when looking at the content of the attack traffic. This is due to different types of attack traffic having different feature values. As a result, the dataset becomes more complex, and models like Logistic Regression and Decision Tree become somewhat insufficient in classification. Therefore, more complex models should be preferred for these complex types of data, just as in our study. Hence, while analyzing the dataset, not only binary classification models but also different machine learning and deep learning models were preferred. Thus, higher results were obtained in the MLP model. The detailed numerical values of the results are provided in Table 7.
Table 7 shows that the Naive Bayes model achieved the lowest success rate with a 94.26% accuracy among all the models, while the MLP model achieved the highest success rate with a 99.950% accuracy. The highest result percentage is shown in bold. Among the deep learning models, the RNN model achieved the lowest success rate. In contrast, the Random Forest model achieved the highest success rate among the machine learning models. The results of the analysis conducted with the deep learning and hybrid models, based on the batch-size and epoch values, are presented in the column chart in Figure 13.
Figure 13 shows the effect of the epoch values on the results. It can be observed that the epoch values have an impact on the outcomes. However, it is important to note that increasing the epoch value should be performed cautiously to avoid the overfitting of the model. Therefore, high values for the epoch parameter should be avoided. More detailed numerical results regarding the models are provided in Table 8.
In Table 8, the effects of epoch parameters with values of 10, 20, and 30 and a batch-size parameter with a value of 100 are shown. The highest accuracy result is highlighted in bold. The highest accuracy percentage of 99.950% was achieved with the MLP model using 20 epochs and a batch size of 100. In Table 9, the hyperparameter values determined through the tuning process for the models are shared. These hyperparameters include the epoch, batch size, learning rate, etc., and they were selected to achieve the best results.
Indeed, the hyperparameter values in Table 9 are crucial for achieving the highest accuracy percentage. Each parameter value has an impact on the outcome of the application. Therefore, the selected values are the result of experimentation and finding the values that yield the best results.
The confusion matrix, which is depicted in Figure 13, was created based on the MLP model. The confusion matrix displays the quantities of the actual values versus those of the predicted values. The dataset consists of 7,037,986 rows. Because 70% of the dataset is allocated for training and 30% for testing, the test portion comprises approximately 2,109,609 rows. The distribution of these rows used for testing the models is presented in the form of a confusion matrix in Figure 14, pertaining to the MLP model. (You can delete green table. We added new table. New table is below of green table).
In Figure 14, the distribution of the dataset based on the traffic classes is compared with the distribution predicted by the models. The vertical axis represents the actual number of samples belonging to each traffic class. The horizontal axis represents the model’s predictions. Another performance indicator that provides insights into the success of the study is the ROC curves, which are presented in Figure 15.
When the axes of Figure 15 are examined, the True-Positive-Rate (TPR) and False-Positive-Rate (FPR) values can be seen. These values provide information about the success of the study. A high TPR value and a low FPR value are desirable for achieving a high performance. If we define it on the graph, this means that for a high success rate, the graph should be positioned in the upper left corner. The closer the graph is to this position, the higher the success rate of the application. The graphs were created for the CNN, LSTM, MLP, RNN, CNN-LSTM, and LSTM-CNN models, which achieved the most successful results.
The entire dataset was examined as a whole with machine and deep learning models, and the results are presented in Table 7. The dataset comprises seven features, including six attributes for classification purposes and one class attribute used to confirm the accuracy of the results. To determine the impact of each feature on the outcome, the feature importance was calculated using both the Random Forest and Principal Component Analysis (PCA). This analysis revealed that the features “Source Bytes”, “Source Packets”, and “Source Port” have higher impacts on the outcome compared to the other attributes. Consequently, a feature reduction process was undertaken, resulting in a new dataset with only these three significant features. This reduced dataset was then retrained using the CNN, LSTM, MLP, RNN, CNN-LSTM, and LSTM-CNN models. The results of the models are shown in Table 10.
As shown in Table 10, after the feature reduction process, the simplified dataset with three features was retrained with the CNN, LSTM, MLP, RNN, CNN-LSTM, and LSTM-CNN models, and the results are presented in Table 10. With the reduced dataset, the CNN model achieved an accuracy of 99.266%, the LSTM model achieved an accuracy of 99.868%, the MLP model achieved an accuracy of 99.948%, the RNN model achieved an accuracy of 94.307%, the CNN-LSTM model achieved an accuracy of 99.872%, and the LSTM-CNN model achieved an accuracy of 99.869%. When current studies are examined, it is observed that the usage rate of the traditional approaches in attack detection is rapidly decreasing, and artificial intelligence technologies are now being used in this field as well. Combining models in different ways to minimize false detection rates is among the innovations made in attack detection. This innovation was used in this study, and differences in the results were observed. After the literature was reviewed, the highest accuracy rate related to the dataset and the examination with the most diverse models were used in this study.

7. Conclusions and Future Works

The widespread use of SCADA systems in various fields demonstrates their usefulness, but it has also made them a target for cyberattackers due to the increasing adoption of these systems. Any cyberattack on SCADA systems, particularly in critical and complex infrastructures, such as nuclear facilities, power generation plants, and industrial facilities, is anticipated to lead to challenging and potentially irreversible problems. Therefore, ensuring the security of SCADA systems is of vital importance. In this study, the network traffic of a system created with IIoT (Industrial Internet of Things) devices belonging to SCADA systems was examined. The analyzed network traffic data consisted of both normal and attack traffic. The network data of the SCADA system were analyzed using machine learning, deep learning, and hybrid learning models. As there is a scarcity of studies applying machine learning, deep learning, and hybrid learning models in the field of SCADA systems, this research is expected to contribute to the literature. The hyperparameter values used in the models were determined through a tuning process to achieve the best results in the data analysis. The impact of changing the epoch and batch-size values in the models on the results was also examined. The developed model achieved a 99.950% accuracy rate with the MLP model. The most efficient model, which is the MLP hybrid model, employs ReLU and softmax as the activation functions. It is trained with an epoch value of 20 and incorporates a dropout rate of 0.5. The model utilizes units of 64, 128, and 256 across its architecture. The Adam optimizer is adopted as the optimization algorithm, while categorical cross-entropy serves as the loss function. Additionally, the model comprises three hidden layers. For future work, hybrid models that were not implemented in this study can be explored. Additionally, applying data-balancing techniques to the dataset can further improve the results. Furthermore, the dataset and developed models used in this study can be applied to different datasets for result comparisons.

Author Contributions

The authors contributed equally and significantly in writing this paper. All authors have read and agreed to the published version of the manuscript.

Funding

This research received no external funding.

Data Availability Statement

WUSTL2018 dataset was used. Dataset link: https://www.cse.wustl.edu/~jain/iiot/index.html (accessed date: 8 April 2024).

Conflicts of Interest

The authors declare that there are no conflicts of interest regarding the publication of this paper.

References

  1. Tawalbeh, L.; Muheidat, F.; Tawalbeh, M.; Quwaider, M. IoT Privacy and Security: Challenges and Solutions. Appl. Sci. 2020, 10, 4102. [Google Scholar] [CrossRef]
  2. Boyes, H.; Hallaq, B.; Cunningham, J.; Watson, T. The industrial internet of things (IIoT): An analysis framework. Comput. Ind. 2018, 101, 1–12. [Google Scholar] [CrossRef]
  3. Yu, X.; Guo, H. A Survey on IIoT Security. IEEE Access 2020, 8, 228659–228671. [Google Scholar] [CrossRef]
  4. Panda, M.; Patra, M.R. Network intrusion detection using naive bayes. Int. J. Comput. Sci. Netw. Secur. 2007, 7, 258–263. [Google Scholar]
  5. Teixeira, M. IIOT-2018 Dataset for ICS (SCADA) Cybersecurity Research. WUSTL. Available online: https://www.cse.wustl.edu/~jain/iiot/index.html (accessed on 9 April 2024).
  6. Goetz, E.; Shenoi, S. Lessons Learned from the Maroochy Water Breach. In Critical Infrastructure Protection; Springer: New York, NY, USA, 2008. [Google Scholar]
  7. Analysis of the Cyber Attack on the Ukrainian Power Grid. Available online: https://www.researchgate.net/publication/378730818_Analysis_of_Ukraine_power_grid_cyber-attack_2015 (accessed on 9 April 2024).
  8. Cherdantseva, Y.; Burnap, P.; Blyth, A.; Eden, P.; Jones, K.; Soulsby, H.; Stoddart, K. A review of cyber security risk assessment methods for SCADA systems. In Proceedings of the IEEE International Conference on Cyber Security and Protection of Digital Services (Cyber Security), Bristol, UK, 1–3 September 2022; pp. 1–8. [Google Scholar]
  9. Yadav, G.; Paul, K. Architecture and security of SCADA systems: A review. In Proceedings of the IEEE International Conference on Advanced Networks and Telecommunication Systems (ANTS), Janeiro, Brazil, 15–18 December 2015. [Google Scholar]
  10. Gregory, F.; Caldera, C.; Shrobe, H. IoT cyber security risk modeling for SCADA systems. IEEE Internet Things J. 2018, 5, 4486–4495. [Google Scholar]
  11. Igure, V.M.; Laughter, S.A.; Williams, R.D. Security issues in SCADA networks. Proc. IEEE 2003, 91, 944–961. [Google Scholar] [CrossRef]
  12. AL-Hawawreh, M.; Moustafa, N.; Sitnikova, E. Identification of malicious activities in industrial internet of things based on Deep Learning Models. J. Inf. Secur. Appl. 2018, 41, 1–11. [Google Scholar] [CrossRef]
  13. Binnar, P.; Bhiruda, S.; Kazi, F. Security analysis of cyber physical system using digital forensic incident response. Cyber Secur. Appl. 2024, 2, 100034. [Google Scholar] [CrossRef]
  14. Relan, N.G.; Patil, D.R. Implementation of network intrusion detection system using variant of decision tree algorithm. In Proceedings of the 2015 International Conference on Nascent Technologies in the Engineering Field (ICNTE), Navi Mumbai, India, 9–10 January 2015; pp. 1–5. [Google Scholar]
  15. Jayalaxmi, P.; Kumar, G.; Saha, R.; Conti, M.; Kim, T.-H.; Thomas, R. DeBot: A deep learning-based model for BOT detection in industrial internet-of-things. Comput. Electr. Eng. 2022, 102, 108214. [Google Scholar] [CrossRef]
  16. Priya, V.; Sumaiya Thaseen, I.; Gadekallu, T.R. Robust Attack Detection Approach for IIoT Using Ensemble Classifier. IEEE Access 2019, 7, 157100–157109. [Google Scholar]
  17. Vulfin, A.M.; Vasilyev, V.I.; Kuharev, S.N.; Homutov, E.V.; Kirillova, A.D. Algorithms for detecting network attacks in an enterprise industrial network based on data mining algorithms. IEEE Conf. Netw. Softwarization NetSoft 2018, 2001, 289–293. [Google Scholar] [CrossRef]
  18. Siddavatam, I.; Satish, S.; Mahesh, W.; Kazi, F. An Ensemble Learning for Anomaly Identification in SCADA System. In Proceedings of the 7th International Conference on Power Systems ICPS, Pune, India, 21–23 December 2017; pp. 1–5. [Google Scholar]
  19. Li, M.; Wang, S.; Fang, S.; Zhao, J. Anomaly Detection of Wind Turbines Based on Deep Small-World Neural Network. Appl. Sci. 2020, 10, 1243. [Google Scholar] [CrossRef]
  20. Yang, H.; Cheng, L.; Chuah, M.C. Deep-Learning-Based Network Intrusion Detection for SCADA Systems. In Proceedings of the 2019 IEEE Conference on Communications and Network Security CNS, Washington, DC, USA, 10–12 June 2019; pp. 1–6. [Google Scholar]
  21. Benisha, R.B.; Raja Ratna, S. Detection of interruption attack in the wireless networked closed loop industrial control systems. Telecommun. Syst. 2020, 73, 359–370. [Google Scholar] [CrossRef]
  22. Lai, Y.; Zhang, J.; Liu, Z. Industrial Anomaly Detection and Attack Classification Method Based on Convolutional Neural Network. Secur. Commun. Netw. 2019, 2019, 1–11. [Google Scholar] [CrossRef]
  23. Naseer, S.; Faizan, R.; Dominic, P.D.D.; Saleem, Y. Learning Representations of Network Traffic Using Deep Neural Networks for Network Anomaly Detection: A Perspective towards Oil and Gas IT Infrastructures. Symmetry 2020, 12, 1882. [Google Scholar] [CrossRef]
  24. Gao, J.; Gan, L.; Buschendorf, F.; Zhang, L.; Liu, H.; Li, P.; Dong, X. Omni SCADA Intrusion Detection Using Deep Learning Algorithms. IEEE Internet Things J. 2021, 8, 1321–1332. [Google Scholar] [CrossRef]
  25. Alqurashi, S.; Shirazi, H.; Ray, I. On the Performance of Isolation Forest and Multi-Layer Perceptron for Anomaly Detection in Industrial Control Systems Networks. IEEE Trans. Ind. Inform. 2021, 17, 3485–3493. [Google Scholar]
  26. Chen, L.; Ye, Z.; Jin, S. A Security, Privacy, and Trust Methodology for IIoT. IEEE Access 2021, 9, 62036–62049. [Google Scholar]
  27. Khan, M.A.; Alghamdi, N.S. A neutrosophic WPM-based machine learning model for device trust in industrial internet of things. J. Ambient. Intell. Humaniz. Comput. 2023, 14, 3003–3017. [Google Scholar] [CrossRef]
  28. Guezzaz, A.; Azrour, M.; Benkirane, S.; Mohy-Eddine, M.; Attou, H.; Douiba, M. A Lightweight Hybrid Intrusion Detection Framework using Machine Learning for Edge-Based IIoT Security. Int. Arab. J. Inf. Technol. 2022, 19, 573–580. [Google Scholar] [CrossRef]
  29. de Elias, E.M.; Carriel, V.S.; De Oliveira, G.W.; Dos Santos, A.L.; Nogueira, M.; Junior, R.H.; Batista, D.M. A Hybrid CNN-LSTM Model for IIoT Edge Privacy-Aware Intrusion Detection. In Proceedings of the 2022 IEEE Latin-American Conference on Communications (LATINCOM), Rio de Janeiro, Brazil, 30 November–2 December 2022; pp. 1–6. [Google Scholar]
  30. Aboelwafa, M.M.N.; Seddik, K.G.; Eldefrawy, M.H.; Gadallah, Y.; Gidlund, M. A Machine-Learning-Based Technique for False Data Injection Attacks Detection in Industrial IoT. IEEE Internet Things J. 2020, 7, 8362–8372. [Google Scholar] [CrossRef]
  31. Silva Oliveira, G.A.; Lima, P.S.S.; Kon, F.; Terada, R.; Batista, D.M.; Hirata, R., Jr.; Hamdan, M. A Stacked Ensemble Classifier for an Intrusion Detection System in the Edge of IoT and IIoT Networks. In Proceedings of the 2022 IEEE Latin-American Conference on Communications LATINCOM, Rio de Janeiro, Brazil, 30 November–2 December 2022; pp. 1–6. [Google Scholar]
  32. Chkirbene, Z.; Erbad, A.; Hamila, R.; Gouissem, A.; Mohamed, A.; Guizani, M.; Hamdi, M. A Weighted Machine Learning-Based Attacks Classification to Alleviating Class Imbalance. IEEE Syst. J. 2021, 15, 4372–4381. [Google Scholar] [CrossRef]
  33. Mohy-eddine, M.; Guezzaz, A.; Benkirane, S.; Azrour, M. An effective intrusion detection approach based on ensemble learning for IIoT edge computing. J. Comput. Virol. Hacking Tech. 2022, 19, 469–481. [Google Scholar] [CrossRef]
  34. Tien, C.W.; Huang, T.Y.; Chen, P.C.; Wang, J.H. Automatic Device Identification and Anomaly Detection with Machine Learning Techniques in Smart Factories. In Proceedings of the 2020 IEEE International Conference on Big Data (Big Data), Chengdu, China, 10–13 April 2020; pp. 3003–3017. [Google Scholar]
  35. Lakshmanna, K.; Kavitha, R.; Geetha, B.T.; Nanda, A.K.; Radhakrishnan, A.; Kohar, R. Deep Learning-Based Privacy-Preserving Data Transmission Scheme for Clustered IIoT Environment. Comput. Intell. Neurosci. 2022, 2022, 8927830. [Google Scholar] [CrossRef]
  36. Yao, H.; Gao, P.; Zhang, P.; Wang, J.; Jiang, C.; Lu, L. Hybrid Intrusion Detection System for Edge-Based IIoT Relying on Machine-Learning Aided Detection. IEEE Netw. 2019, 33, 75–81. [Google Scholar] [CrossRef]
  37. Zolanvari, M.; Teixeira, M.; Jain, R. Effect of Imbalanced Datasets on Security of Industrial IoT Using Machine Learning. In Proceedings of the 2018 IEEE International Conference on Communications (ICC), Toronto, ON, Canada, 22–25 July 2018; pp. 1–6. [Google Scholar]
  38. Jadidi, Z.; Pal, S.; Nayak, N.; Selvakkumar, A.; Chang, C.-C.; Beheshti, M.; Jolfaei, A. Security of Machine Learning-Based Anomaly Detection in Cyber Physical Systems. In Proceedings of the 2022 International Conference on Computer Communications and Networks ICCCN, Honolulu, HI, USA, 25–28 July 2021; pp. 1–6. [Google Scholar]
  39. Khoda, M.E.; Imam, T.; Kamruzzaman, J.; Gondal, I.; Rahman, A. Robust Malware Defense in Industrial IoT Applications Using Machine Learning with Selective Adversarial Samples. IEEE Trans. Ind. Appl. 2020, 56, 4415–4426. [Google Scholar] [CrossRef]
  40. Hashemi, S.M.; Hashemi, S.A.; Botez, R.M. Reliable Aircraft Trajectory Prediction Using Autoencoder Secured with P2P Blockchain. In Proceedings of the International Symposium on Unmanned Systems and the Defense Industry, Madrid, Spain, 18 October 2023. [Google Scholar]
  41. Hashemi, S.M.; Botez, R.M.; Grigorie, T.L. New Reliability Studies of Data-Driven Aircraft Trajectory Prediction. Aerospace 2020, 7, 145. [Google Scholar] [CrossRef]
  42. Wang, W.; Harrou, F.; Bouyeddou, B.; Senouci, S.M.; Sun, Y. Cyber-attacks detection in industrial systems using artificial intelligence-driven method. IEEE Trans. Ind. Inform. 2020, 16, 2505–2513. [Google Scholar] [CrossRef]
  43. Breiman, L. Random forests. Mach. Learn. 2001, 45, 5–32. [Google Scholar] [CrossRef]
Figure 1. SCADA network architecture.
Symmetry 17 00480 g001
Figure 2. SCADA hierarchical structure.
Symmetry 17 00480 g002
Figure 3. SCADA attacks.
Symmetry 17 00480 g003
Figure 4. Port-scanning attack.
Symmetry 17 00480 g004
Figure 5. Address-scanning attack.
Symmetry 17 00480 g005
Figure 6. Device identification attack.
Symmetry 17 00480 g006
Figure 7. Exploit attack.
Symmetry 17 00480 g007
Figure 8. Random Forest feature scores as a result of Random Forest feature selection for WUSTL-2018-IIoT.
Symmetry 17 00480 g008
Figure 9. PCA feature scores as a result of Random Forest feature selection for WUSTL-2018-IIoT.
Symmetry 17 00480 g009
Figure 10. Flowchart of proposed model.
Symmetry 17 00480 g010
Figure 11. Pearson correlation matrix result for WUSTL2018.
Symmetry 17 00480 g011
Figure 12. Performance comparison of models for WUSTL2018 dataset for binary classification.
Symmetry 17 00480 g012
Figure 13. Performance comparison of deep learning models for WUSTL 2018 dataset according to batch-size and epoch parameters.
Symmetry 17 00480 g013
Figure 14. Confusion matrix.
Symmetry 17 00480 g014
Figure 15. ROC curves.
Symmetry 17 00480 g015aSymmetry 17 00480 g015b
Table 1. Comparison of other works on intrusion detection.
Reference No.YearAuthorsDatasetModelsParameter Result
[16]2019V. Priya et al.WUSTL-2018
N-BaIoT
BoT_IoT
Decision Tree
SVM
Naive Bayes
Accuracy: 96%
[17]2018M. Vulfin et al.WUSTL-2018Random Forest
Logistic Regression
Multilayer Perceptron
F-score: 91–95%
[18]2017I. Siddavatam, S. Satish, W. Mahesh, F. KaziSCADA testbedRandom ForestAccuracy: 99.81%
[19]2018S.Wang et al.SCADA testbedXGBoostAccuracy: 98.86%
[20]2019H. Yang, L. Cheng, M. ChuahSCADA testbedCNNAccuracy: 99.84%
[21]2017R. Benisha R. Ratna---------DL-NNAccuracy:
78.69%
[22]2019Y. Lai, J Zhang, Z. LiuSCADA testbed
KDD
NSL-KDD
DARPA
CNNAccuracy:
99.30%
[23]2019S. Naseer et al.ISCX-2012CNN
RNN-LSTM
Autoencoder
Accuracy:
99–100%
[24]2021J. Gao et al.SCADA testbed
KDD’99
LSTM
FNN
FNN-LSTM
F-score:
99.68%
[25]2021S. Alqurashi, H Shirazi, I. RaySwaTDNN
MLP
SVM
Accuracy:
99%
[26]2021M. Alani E. Damiani U. GhoshWUSTL-2021CNN-LSTMAccuracy:
99%
[27]2021M. Khan, N Alghamdi-----------Neutrosophic SVMAccuracy:
100%
[28]2022A. Guezzaz et al.NSL-KDD
BoT-IoT
KNN
PCA
Accuracy:
99.10%
[29]2022M Elias et al.Edge-IIoTsetCNN-LSTMAccuracy:
97.85%
[30]2020N. Aboelwafa et al.TesbedAutoencodersMean-squared error:
Case 1: 0.0064
Case 2: 0.0051
[31]2022S. Oliveira et al.TON_IoTSE-DNNPrecision: 99.7%
F-score: 99.7%
Recall: 99.7%
Accuracy: 99.7%
[32]2021Zina ChkirbeneUNSW and NSL-KDDDecision TreeAccuracy: 94%
[33]2022M. Mohy-eddin A. Guezzaz
S. Benkirane
M. Azrour
Bot-IoT and the wustl_iiot_2021Random ForestAccuracy: 99.99%
[34]2020W. Tien et al.l.Real environmentsDecision TreeAccuracy: 99.99%
[35]2022K.Lakshmanna et al.-----------BDL-PPDTAccuracy: 98.15%
[36]2019H. Yao et al.-----------Light GBMAccuracy: 93.2%
[37]2019M. Zolanvari, M. A. Teixeira and R. Jain-----------Random ForestAccuracy: 99.99%
[38]2022Zahra Jadidi et al.ModbusFGSM-ANNPrecision: 83.06%
Recall: 99.49%
F-score: 90.53%
[39]2020M. Khod et al.Malware datasetSVMAccuracy: 98.5%
[40]2023S. Hashemi et al. Trajectory datasets LSTM GAN
GAN-BLT
Fooling rate: 2.8%
[41]2020S. Hashemi et al. Trajectory datasets --- 68.97%
Accuracy:
Table 2. Detailed explanation of dataset.
FeatureValue
Duration of capture25 h
Dataset size627 MB
Number of observations7,049,989
Percentage of port-scanning attacks0.0003%
Percentage of address-scanning attacks0.0075%
Percentage of device identification attacks0.0001%
Percentage of device identification attacks (aggressive mode)4.9309%
Percentage of exploiting attacks1.1312%
Percentage of all attacks (total)6.07%
Percentage of normal traffic93.93%
Table 3. Sample of dataset.
Source PortTotal PacketsTotal BytesSource PacketsDestination PacketSource BytesTarget (Class)
54,9661811521086440
50,9634248221241
13714131614013160
64,8071811521086440
64,80920127610106440
44,2924276221521
64,816301960161410640
1740354908722041500
7,249,31912780840
55,0604276221521
42,0502152201521
41,6184276221521
56,69920127610106440
56,6472136201360
Table 4. Digital transformation table.
Label NumberType of Traffic
0Normal network traffic
1Attack traffic
Table 5. Random Forest feature score results.
Feature NameFeature Score
Source Port 0.219584636
Total Packets 0.02156103
Total Bytes 0.121049478
Source Packets 0.347070595
Destination Packet 0.001457459
Source Bytes 0.289276802
Table 6. PCA feature score results.
Feature NameFeature Score
Source Port0.0786986
Total Packets0.0099080
Total Bytes0.0339848
Source Packets0.6710430
Destination Packet0.0000771
Source Bytes0.2062886
Table 7. Comparison results according to precision, recall, F-score, and accuracy.
Model NamePrecisionRecallF-ScoreAccuracy
CART96.51%98.63%97.22%98.63%
Decision Tree96.83%98.83%98.18%98.83%
KNN95.62%98.66%97.67%98.66%
Logistic Regression85.88%96.88%89.88%96.88%
Naive Bayes88.85%94.26%91.48%94.26%
Random Forest97.17%99.44%98.11%99.44%
SVM98.35%99.31%99.07%99.31%
XGBoost95.91%97.82%96.86%97.82%
CNN98.77%99.87%98.97%99.87%
GRU88.87%94.27%91.50%94.27%
LSTM99.59%99.87%99.86%99.87%
MLP99.6399.4999.5699.95
RNN88.86%94.26%91.48%94.26%
CNN-LSTM98.87%99.87%99.66%99.87%
LSTM-CNN98.87%99.87%99.75%99.87%
Table 8. Results of deep learning model according to precision, recall, F-score, accuracy.
Model NameEpochBatch SizePrecisionRecallF-ScoreAccuracy
CNN1010098.764%99.755%98.965%99.755%
2098.771%99.870%98.974%99.870%
3098.769%99.862%98.983%99.862%
LSTM1010099.572%99.862%99.861%99.862%
2099.589%99.868%99.858%99.868%
3099.575%99.864%99.844%99.864%
GRU1010088.866%94.269%91.488%94.269%
2088.867%94.272%91.495%94.272%
3088.865%94.269%99.488%94.269%
MLP1010099.617%99.482%99.550%99.946%
2099.630%99.497%99.562%99.950%
3099.625%99.490%99.557%99.949%
RNN1010088.856%94.263%91.480%94.263%
2088.856%94.263%91.480%94.263%
3088.856%94.263%91.480%94.263%
CNN-LSTM1010098.864%99.870%99.864%99.870%
2098.866%99.871%99.856%99.871%
3098.862%99.869%99.861%99.869%
LSTM-CNN1010098.862%99.869%99.669%99.869%
2098.871%99.874%99.751%99.874%
3098.868%99.865%99.660%99.865%
Table 9. Hyperparameters of MLP.
HyperparametersValues
Activation functionReLU, Sigmoid
Number of epochs20
Units64, 128, 256, 1
OptimizerAdam
LossBinary Cross-Entropy
Hidden layer3
Accuracy99.950%
Recall99.497%
Precision99.630%
F-score99.562%
Specific99.881%
Training time2838.377 s
Total parameter128.452 (501.77 KB)
Table 10. After feature selection, performance results of CNN, LSTM, GRU, RNN, CNN-LSTM, and LSTM-CNN algorithms according to epoch numbers.
Model NameEpochBatch SizePrecisionRecallF-ScoreAccuracy
CNN2010098.860%99.266%99.183%99.266%
LSTM2010099.769%99.868%99.859%99.868%
MLP2010098.582%99.944%99.917%99.948%
RNN2010088.937%94.307%91.543%94.307%
CNN-LSTM2010099.674%99.872%99.793%99.872%
LSTM-CNN2010099.367%99.869%99.488%99.869%
Disclaimer/Publisher’s Note: The statements, opinions and data contained in all publications are solely those of the individual author(s) and contributor(s) and not of MDPI and/or the editor(s). MDPI and/or the editor(s) disclaim responsibility for any injury to people or property resulting from any ideas, methods, instructions or products referred to in the content.

