Abstract
Due to their crucial impacts on the stability of the power system and their significant power demand, industrial loads, with their symmetrical and asymmetrical properties, have been gaining more recognition in the composite load modeling field. The established composite load model, known as the complex load (CLOD) model and used in commercial simulators (Power System Simulation for Engineering (PSS®E) and PowerWorld Simulator), has been used to represent composite loads efficiently. This model has a limited number of parameters combined with high accuracy. In the literature, the mathematical representation of this model is incomplete due to the complexity of some components of this model. This paper proposes a detailed mathematical representation of the CLOD model to enhance its capability and efficiency in capturing the dynamic response. Heuristic and regression techniques are utilized to estimate and tune the parameters of the proposed model. Compared with existing composite models, the proposed model requires a minimum set of parameters and low computational demand while ensuring accuracy with ease of implementation in large-scale industrial circuits. For model verifications, the output of the proposed model is compared with the output from the PSS®E model under different symmetric and asymmetric load distribution structures representing common customer classes, including residential, commercial, and industrial loads.
1. Introduction
Electrical loads can be presented as symmetry models in the literature to simplify their complexity. This usually matches the needed accuracy in many applications and fulfills many educational purposes. However, with the nonlinear dynamics of the electrical loads during transient and sub-transient periods and when modeling accuracy cannot be sacrificed, it is essential to study, model, analyze, and understand the loads asymmetrically. This paper investigates and models the industrial electrical loads’ needed symmetry and asymmetry properties to match the dynamic and steady-state behavior.
Load modeling is one of the essential topics in power system studies [1]. It aims to write an accurate mathematical representation for either low-voltage (LV) loads, such as home appliances, or an aggregated load at a specified load bus. Expressing loads’ active and reactive power consumption as a function of voltage helps to explore, analyze, and predict their behavior under various operating conditions, which can be crucial for maintaining voltage stability [2,3,4], power system planning and design [5,6], the effective evaluation of energy consumption during voltage control [7,8], understanding the load characteristics during small and large disturbances [9], and assessing and managing distribution generation (DG) in smart-grid areas [10,11].
Generally, there are two load model types: static and dynamic. Static load models (ST-LMs) [12], such as the exponential load model (EXP-LM) and the polynomial load model (ZIP-LM), instantaneously represent the load’s power as a function of voltage magnitude. The EXP-LM describes load behavior based on simple exponential equations. The ZIP-LM illustrates the load using polynomial equations consisting of mixed three exponential parts: constant impedance (Z), constant current (I), and constant power (P). ST-LMs are simple, easy to implement, and have physical meaning. However, they can provide an inaccurate expression of the load characteristics [13]. Moreover, it would be challenging to use these models to represent the highly nonlinear load-to-voltage dependence in distribution systems, such as power electronic devices and distributed generation (DG) units [14,15].
Although ST-LMs can be successfully executed in steady-state operations such as power flow simulations, they fail to express loads during dynamic studies on power systems, including but not limited to long-term stability, voltage stability, and dynamic characteristics of motors [13,16,17]. Such studies require dynamic models that catch load characteristics during transients when disturbances occur.
Dynamic load models (DY-LMs) represent the load as a set of voltage and time differential equations. In the literature, many types of DY-LMs have been widely used to represent load dynamics, including the induction machine load models (IM-LMs) such as the third-order IM-LM [18] and the fifth-order IM-LM [19], the exponential recovery load model (ER-LM) [20], artificial neural network-based models (ANN-LMs) [21], and composite load models.
To illustrate the composite load, ST-LMs and DY-LMs are aggregated into one combined model, representing the composite load as a whole. In order to investigate the dynamic behavior of composite loads, the vast majority of USA utilities use IM-LM in combination with ZIP-LM or EXP-LM to represent loads [22].
To capture the dynamic behavior of the aggregated load, including the transmission system, as well as observing the electrical distance, a highly accurate model has been developed by the Western Electricity Coordinating Council (WECC) [23]. WECC models combine three-phase and single-phase motors, electronic load DY-LMs, and ST ZIP-LMs into a composite model. In [24], the model has been improved further to consider the dynamics of distributed energy resources (DERs).
Although the WECC model provides an accurate representation of the composite load dynamics, the complexity of the model poses challenges when implemented in large-scale systems. The active subspace method has been used in [25] to perform a parameter reduction in the WECC model. The research produces a low-dimensional model that preserves the composite model’s most important characteristics. In [26], support vector regression (SVR) has been used for parameter identification of a combination of the ST-ZIP-LM with an electronic load. Another composite model, the complex load (CLOD) model, was developed by Siemens and can be found in several commercial programs such as PTI/PSS®E-V35 and PowerWorld-V21 to represent loads in dynamic studies. The CLOD model represents the load at a specific bus by combining several submodels into an aggregated model. These submodels include large motors, small motors, discharge lighting, transformer saturation, constant power loads, and the remaining load [27]. The CLOD model has been recognized and employed by utilities to represent the composite load in their dynamic studies. It provides an accurate load representation with minimal model complexity, making it more favorable than other models for large-scale power systems [28]. Figure 1 shows the structure of the CLOD model where both the symmetry and asymmetry properties are embedded.
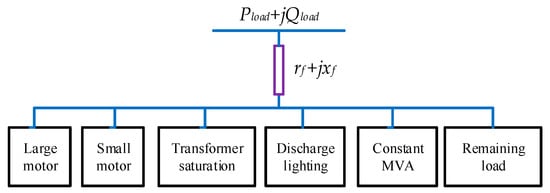
Figure 1.
The schematic diagram of the PSS®E CLOD model.
The CLOD model has been known for its superior ability to represent the dynamic of composite loads, especially industrial circuits with extensive motor loads. Utilizing the CLOD model in [29] has shown favorable outcomes compared to other industrial models in capturing the frequency response after disturbances in large-scale power systems. Ref. [30] developed a generalized CLOD-based load model to represent the dynamics of heavily motorized circuits.
Combining the traditional ST-LMs and DY-LMs, such as the exponential or polynomial with an induction motor model (EXP+IM or ZIP+IM) as in [31], can suffer from a lack of accuracy and mischaracterize the composite load dynamics. The WECC composite model is considered a comprehensive model that provides a highly accurate depiction of the dynamics of composite loads [32]. However, the complexity of this model poses issues of convergence, data requirements, parameter calibration, scalability, and integration with other models. The CLOD model represents multiple dynamic loads with a single model that requires a limited number of parameters. It governs the dynamic simulation and makes it more favorable to be implemented than other models, especially for large-scale power systems. However, since it is not possible for researchers to access the source code inside commercial programs, the mathematical expression of this model has not been established. In addition, the inputs of the CLOD model embedded in commercial programs require only the percentage of each aggregated load while not providing options to perform any parameter modification for each part of the model, which compromises the accuracy of the composite model, especially on large-scale power systems.
In this paper, the mathematical representation of the CLOD model is individually derived for each element at the load bus. The fifth-order IM-LM [19] is employed to represent both large and small motor loads. The range of parameter variations is established for both motor loads. Parameter identification for the motor load model is accomplished using heuristic algorithms, including particle swarm optimization (PSO) and genetic algorithms (GAs) [33,34]. Linear regression models are also proposed to represent the discharge lighting and the constant VA loads during transient and steady-state operating periods.
For transformer saturation cases [35], the literature does not offer a clear methodology for representing the dynamics of this load due to the complexity and highly nonlinear behavior associated with the saturation effects. Therefore, this paper proposes a quadratic regression ZIP-LM-based method to characterize the dynamics of the saturation transformer load, and it does not rely on physical data or transformer look-up tables. Least-square (LS) curve fitting is applied to estimate the parameters of the proposed regression models. The main advantages of this work can be summarized as follows:
- (1)
- The proposed model offers variable load parameters with a variable load composition structure; that is, compared with the CLOD model in commercial programs, the value of the parameters for each load is fixed and unchangeable by the users. Varying the parameters for each part of the aggregated load increases the modeling accuracy and allows it to represent more types of loads with different structures.
- (2)
- The model becomes more comprehensive: writing a mathematical representation of the CLOD makes the model adaptive to be combined with other common load models such as the ZIP-LM, electronic load, and DG integration.
- (3)
- The proposed model can be easily integrated and used in simulation tools other than commercial programs.
- (4)
- It can be developed further as a time-varying model. As the load-to-voltage dependency varies with time, time-varying load models are more favorable to handle the continuous and unexpected fluctuations in load parameters due to the stochastic load behavior and inconsistent output of DGs.
- (5)
- It creates opportunities for additional studies in various fields: it supports advanced research such as dynamic order reduction and parameter sensitivity, which leads to a further decrease in complexity while preserving the essential features of the model.
2. Mathematical Representation of the CLOD Model
This section describes the mathematical representation of each load of the CLOD model in detail. This model includes the mathematical representation of the large motor, the small motor, discharge lighting, transformer saturation, constant MVA, and the remaining load. To include the oscillation, the nonperiodic behavior, DC shift, nonlinear dynamics, and the nonlinear relation between the voltage and the current after applying disturbances, the nonregular reactions of the submodels generally lean toward asymmetry but not entirely as it is also valid for ideal and steady-state symmetry patterns.
2.1. Large and Small Motors
With a high percentage reaching up to 70%, motors consume a substantial amount of the energy supplied by power systems [13]. It represents a wide range of dynamic load behaviors on a specific bus. Usually, the IM is in the CLOD model; “large motor load” refers to the aggregated high-inertia motors’ load, such as large industrial centrifuges, large industrial fans, elevators, and air handling systems [19]. The “small motor” load includes aggregated low-inertia motors such as air conditioning compressor motors, positive displacement pumps, and centrifugal pumps [36]. This work uses the fifth-order IM-LM to represent large or small motors in the proposed CLOD model. The fifth-order IM-LM has been used to represent the dynamic components of three-phase induction motors in the WECC composite load model [24]. It captures induction motors’ dynamic behavior during subtransient and transient periods. Utilizing a high-order model enhances the accuracy of the modeling, improves our understanding of the system’s dynamics, and enables more sensitivity analysis. The mathematical representation of the fifth-order IM-LM is written as follows [19]:
where and represent the subtransient voltage of the motor on the q–d axes, respectively. and are the transient voltage of the motor on the q–d axes. and are the rotor time constants during subtransient and transient periods, respectively. and are the motor reactances during the subtransient and transient periods, respectively. is the motor slip. is the motor inertia. is the load torque (); is the mechanical power. and are the motor synchronous reactance and resistance, respectively. and represent the terminal current of the motor on the q–d axes, respectively. , , , and are the quadratic, linear, constant, and nonlinear speed coefficients of the mechanical torque, respectively. is the damping torque coefficient. is the initial load torque. and are the synchronous and asynchronous speed of the rotor, respectively. and are the terminal voltages of the motor load on the q–d axes, respectively. and are the active and reactive power consumed by the motor, respectively.
Equations (1) and (2) represent state equations of the voltage on the q–d axes during the subtransient period. Equations (3) and (4) represent state equations of the voltage on the q–d axes during the transient period. Equation (5) represents the slip equation of the motor. Equations (6) and (7) are the motor current equations in the q–d axes. Equations (8) and (9) represent the mechanical part equations of the model. Equations (10) and (11) represent the motor’s active and reactive power.
2.2. Discharge Lighting
In the CLOD model, the discharge lighting component represents the aggregated discharge lighting loads at the load bus. According to the PSS®E users’ manual [37], discharge lighting loads’ active and reactive power vary based on the supplied voltage. Using a piecewise function of the voltage provided, the behavior of the discharge lighting load can be explained as follows: If the supplied voltage is higher than the threshold voltage of the discharge lighting (), the active power follows constant current load characteristics. The reactive power is modeled using the EXP-LM raised to the power of .
If the supplied voltage value lies between and the minimum supply voltage of the discharge light load (), active and reactive power are modeled as a linear function of the supplied voltage. If the supplied voltage is lower than , it is assumed that the real part of the load will be zero; that is, the light will be extinguished. Based on these rules, the mathematical representation of discharge lighting can be written as a piecewise function as in Equations (12) and (13):
2.3. Transformer Saturation
Suppose the terminal voltage transformer exceeds the nominal value or operates at frequencies below the nominal frequency. In that case, the transformer may experience over-excitation [35], which means that the magnetic flux in the ferromagnetic core is higher than its rated capacity, resulting in core saturation [38,39]. The transformer’s saturation curve represents the core’s nonlinear behavior; it represents the magnetizing current as a function of the terminal voltage. The nonlinear saturation curve can be simplified using piecewise linearization and is replaced by two regions with linear characteristics [40], as shown in Figure 2.
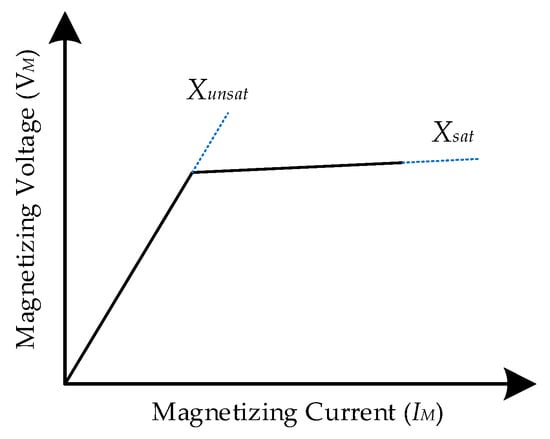
Figure 2.
Piecewise linearization of the transformer saturation curve.
In the literature, there is no mathematical representation for saturated transformers that can help in dynamic load modeling studies. This work assumes that the change in active power due to saturation can be small and insignificant. However, the saturation effect significantly increases the magnetizing current, resulting in an extensive rise in the transformer’s reactive power, a reduction in power factor, and an increase in the harmonic distortion. The effects of saturation on the transformer’s active and reactive power can be described as follows:
where is the magnetizing voltage of the transformer load. is the magnetizing reactance of the transformer load. and are the active power and reactive power consumed by the saturated transformer load, respectively. and are the active power and reactive power consumed by the unsaturated transformer load, respectively.
Accurate modeling of saturation effects requires more information about the highly nonlinear magnetization characteristics of the transformer, such as the transformer’s magnetization curve and the core material’s nonlinear characteristics. However, these data can be unavailable and difficult to obtain. Moreover, producing an aggregated model representing the effects of all saturation transformers at a specific bus based on the physical transformer model can be difficult due to the highly nonlinear characteristics of the saturation effects. In this work, the transformer load is modeled using a piecewise function based on the supplied voltage as follows: If the supplied voltage is below its nominal value, the transformer’s load reactive power varies based on the linear magnetizing inductance of the transformer. If the supplied voltage is raised above the nominal, the common polynomial ZIP-LM is utilized to represent the dynamic behavior of the saturation transformer during disturbances voltage of the transformer:
where is the unsaturated transformer load coefficient. , , and are the constant impedance, current, and power coefficients of the saturated transformer load, respectively.
The proposed model of the saturation effects is direct, easy to implement, does not require any physical data or look-up tables of the transformers, and can be easily used to represent aggregated transformer loads combined with high accuracy.
2.4. Constant MVA
In general, the power consumption of constant power loads remains constant as the supplied voltage varies. Constant power loads draw higher current if the provided voltage decreases below the nominal value. If the provided voltage increases, constant power loads draw lower currents to preserve the constant consumption. The mathematical representation of constant MVA loads during the steady-state operation can be written as follows:
where and are the steady-state active and reactive power of the constant MVA load, respectively. and are the active and reactive power of the constant MVA load, respectively. However, when disturbances occur, voltages drastically drop below nominal values, which makes these loads lose their constant power characteristics during disturbances and behave differently during transients.
According to the American National Standard Institute (ANSI) voltage standard C84.1 [41], the service voltage range must be within ∓5.00% of the nominal voltage. This range can be expanded further during an emergency to reach [−8.33%, 5.83%] of the nominal voltage. Considering this information, this paper assumes that the constant MVA devices lose their constant power characteristics and exhibit different behaviors if the supplied voltage drops below 90% of the nominal voltage. This load behavior can be represented as a linear function of the voltage provided. If the supplied voltage exceeds 90% of the nominal voltage, constant MVA loads operate as constant power loads, independent of the voltage provided. This mathematical representation can be represented as a piecewise function as follows:
where and are the active power linear and constant coefficients of the constant MVA load, respectively. and are the reactive power linear and constant coefficients of the constant MVA load, respectively.
This proposed model of the constant MVA results from the trade-off between accuracy and simplicity during transients. In addition, it can be computationally efficient, especially for extensive power systems. It is important to note that this linear regression model can be replaced with higher-order regression models to enhance the accuracy of the constant MVA representation.
2.5. Remaining Load
The remaining loads in the CLOD model are aggregated and modeled using the EXP-LM. The active power consumption changes as the voltage varies, raised to the power of . The voltage exponent, , has a predefined value and must not exceed 6 to avoid divergence issues [28]. Considering that a substantial number of reactive power components are modeled in other load parts of the CLOD model, the reactive power of the remaining load can be modeled using the EXP-LM raised to the power of 2; that is, the reactive power of the remaining load has the constant impendence load characteristics. The mathematical representation for the remaining load can be written as follows [37]:
where and are the active and reactive power consumed by the remaining load, respectively. is the active power exponent of the remaining load. and are the active and reactive power consumed by the remaining load.
By writing a mathematical representation of the CLOD model, the remaining part of the load can be expanded further with other models to include more dynamic behaviors, including but not limited to the electronic load model, transmission line dynamics, and DG dynamic models.
3. Model Validation
To validate the proposed model, PSS®E and the New England 68-bus, 16-generation, 5-area test case were utilized to produce voltage and power measurements at load busses during dynamic simulations. In our study, the power consumed by bus 46 is considered to be voltage-dependent based on the CLOD model. A three-phase bus fault was applied to bus 30 and cleared after 0.1 s. The voltage and active and reactive power of bus 46 are recorded and considered to be the baseline for the derived model. The mathematical model derived in the previous section is tested in MATLAB-V9.4/Simulink. The same input voltage is used for both models to validate the proposed model. The output of the derived model for each individual load is compared with that of the CLOD model embedded in the PSS®E software (version 9.4). Heuristic optimization techniques, including PSO [33] and GA [34], are used for parameter identification for large and small motor loads. Integral time absolute error (IAE) was considered as a performance indicator to assess the accuracy of the estimated parameters, as shown in Equations (23) and (24):
where is the error between the output of the PSS®E and proposed models; it includes the active and reactive power differences between the two models.
Regression-based methods were used to obtain the parameters for other load parts of the CLOD model. MATLAB-V9.4’s Curve Fitting Toolbox [42] was used to tune the parameters of the regression models. R-squared () and root-mean-square error (RMSE) were used to evaluate the accuracy of the fit.
3.1. Motor Model Validation
For the validation of the large motor model, the percentage of the large motor load in the CLOD PSS®E model is set to 100%, and its output is recognized as the reference for the proposed model. In the same fashion, the small motor load model is validated.
To the best of the authors’ knowledge, there are no prior studies in the literature on the parameter specifications for the motor loads in the CLOD model using the fifth-order IM-LM. This paper suggests that the parameter variation for the motor loads ranges based on the fifth-order IM-LM settings in [19,24,32,33]. Table 1 provides the parameter variation ranges for the motor loads in the proposed model. In this study, the torque coefficients A, B, and C are equal to zero. In addition, the initial mechanical torque has a predefined value of one. Figure 3 shows the input voltage for both models.

Table 1.
Parameter variation range of the motor loads.
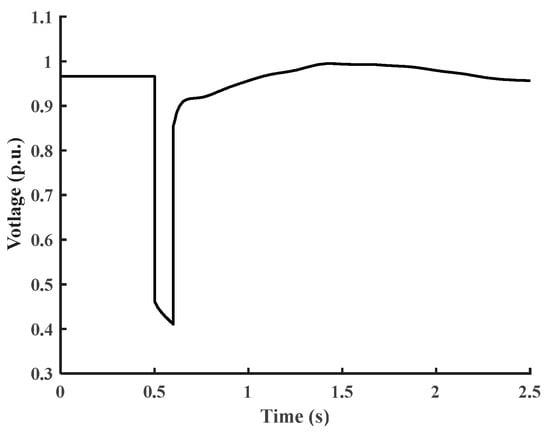
Figure 3.
The input voltage for the mathematical model and the PSS®E model.
The estimated parameters of the large motor model are written in Table 2. Figure 4 and Figure 5 show the dynamic behavior of the large motor for the PSS®E model and the proposed model with tuned parameters using PSO and GA. Similarly, for small motors and the same supplied voltage shown in Figure 3, the estimated parameters of the small motor model are written in Table 3. Figure 6 and Figure 7 show the dynamic response of the small motor for both models.

Table 2.
The estimated parameters of the large motor load.
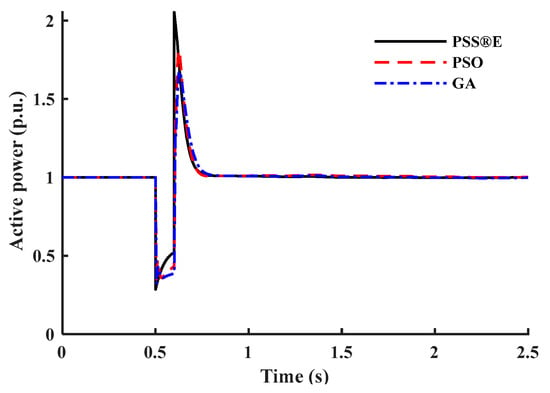
Figure 4.
Active power response of the large motor load in the CLOD model.
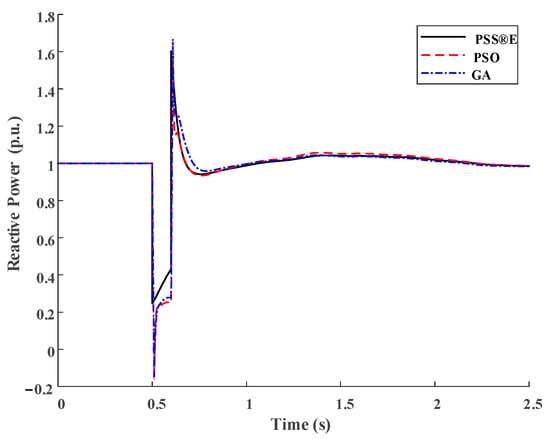
Figure 5.
Reactive power response of the large motor load in the CLOD model.

Table 3.
The estimated parameters of the small motor load.
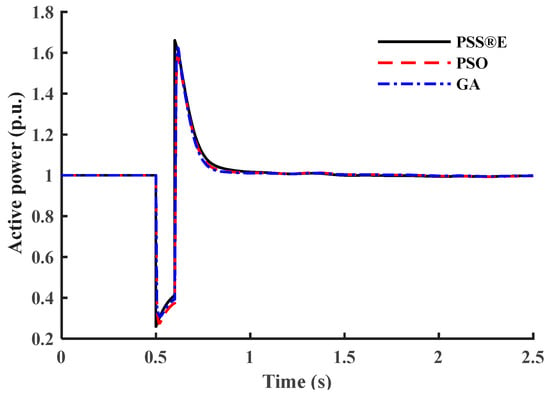
Figure 6.
Active power response of the small motor load in the CLOD model.
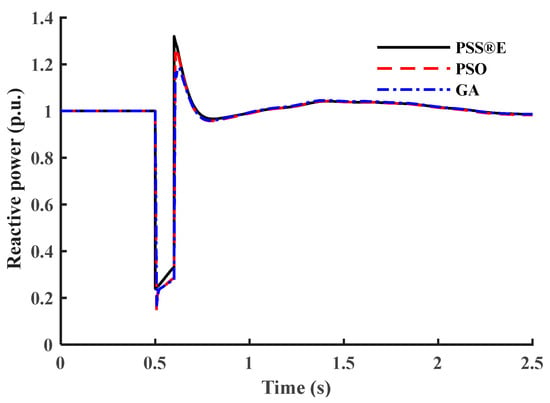
Figure 7.
Reactive power response of the small motor load in the CLOD model.
3.2. Discharge Lighting Model Validation
To verify the proposed discharge lighting model, the percentage of the discharge lighting load in the CLOD model in PSS®E is set to 100%; then, MATLAB’s Curve Fitting Toolbox is utilized to optimally tune the discharge lighting parameters in Equations (12) and (13). The estimated parameters are written in Table 4.

Table 4.
The estimated parameters of the discharge lighting load.
Figure 8 and Figure 9 show the active and reactive power responses of discharge lighting, respectively. In this work, it is not required to estimate and because the input voltage given in Figure 3 exhibits an instantaneous recovery between and .
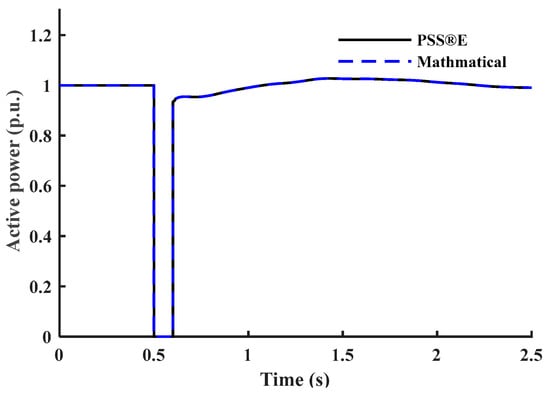
Figure 8.
Active power response of the discharge lighting load.
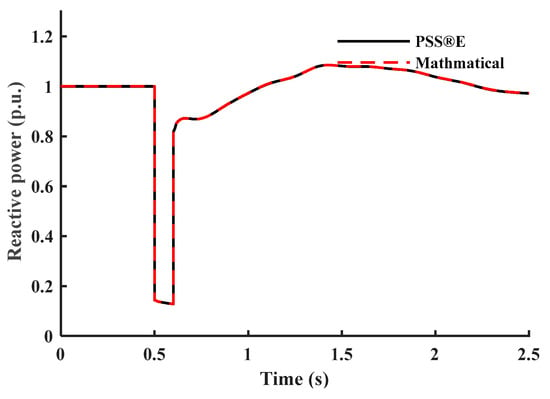
Figure 9.
Reactive power response of the discharge lighting load.
3.3. Transformer Saturation Validation
As mentioned, the effect of the saturation transformer on the active power is insignificant and can be neglected. Using the same procedure, the percentage of the saturation transformer load is set to 100%; then, the reactive power dynamic response is observed. It is important to note that setting the percentage of saturation transformer load to be 100% at a specific bus means that the model only captures the dynamic reactive power response of the saturation effects during transients.
During the steady-state operation, the PSS®E model assumes that the bus is voltage-independent. Quadratic regression analysis using the MATLAB Curve Fitting Toolbox was employed to tune the parameters of the proposed saturation transformer model. The estimated parameters are written in Table 5. Figure 10 shows the reactive power dynamic response of the saturation transformer load for both models.

Table 5.
The estimated parameters of the saturation transformer load.
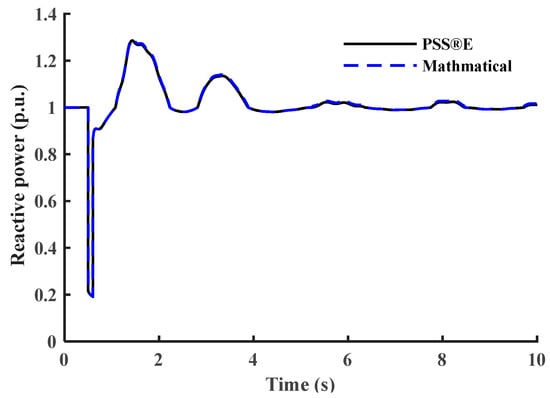
Figure 10.
Reactive power response of the saturation transformer load.
3.4. Constant MVA Model Validation
As the goal is to capture the dynamic behavior of constant MVA loads during transients based on the CLOD model, the percentage of constant MVA loads is set to 100%. Then, the outputs of both models for the same input voltage are compared. Using the MATLAB Curve Fitting Toolbox, the parameters of the proposed model in Equations (19) and (20) are identified, as written in Table 6. Figure 11 and Figure 12 show the dynamic behavior of the constant MVA load.

Table 6.
The estimated parameters of the constant MVA load.
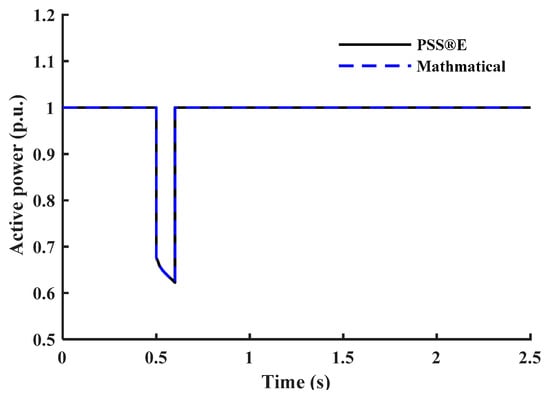
Figure 11.
Active power response of the constant MVA load.
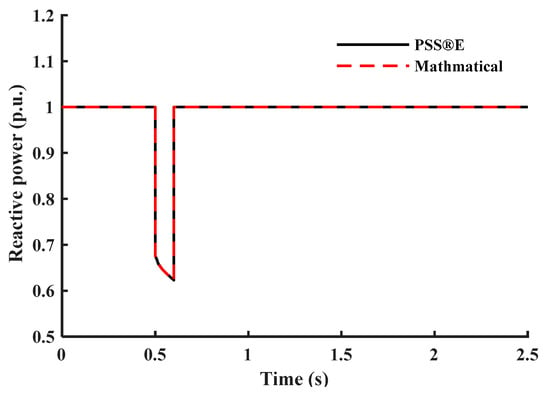
Figure 12.
Reactive power response of the constant MVA load.
3.5. Model Validation for Different Load Compositions
This subsection tests the proposed model’s capability to represent different load composite structures under different load structures. In the PSS®E CLOD model, the load composition percentages are considered the model’s input parameters. Four different composite load structures are chosen randomly as test cases. Case I represents areas where motor loads are dominant, such as industrial circuits. Case II percentages are selected to represent the commercial class with different types of loads. Case III represents residential areas where discharge lighting and constant MVA loads dominate. Case IV percentages are based on WECC generic parameters of the CLOD model [28]. Table 7 provides the load composition structure for each test case. Figure 13, Figure 14, Figure 15, Figure 16, Figure 17, Figure 18, Figure 19 and Figure 20 show the outputs of both models. To highlight the accuracy of the presented models, Table 8 provides the IAE values for each test case. The IAE is always very low, so the presented mathematical models accurately represent the commercial model.

Table 7.
The load composite structures for the test cases.
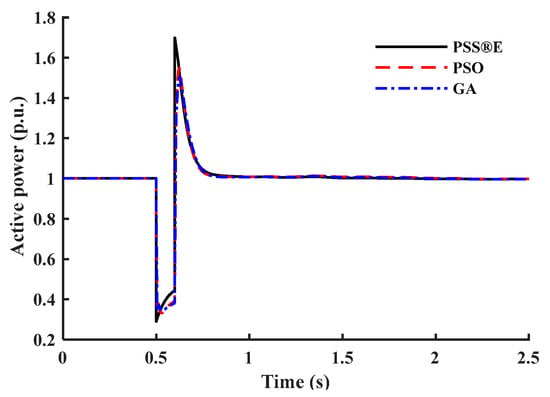
Figure 13.
Active power response of test case I.
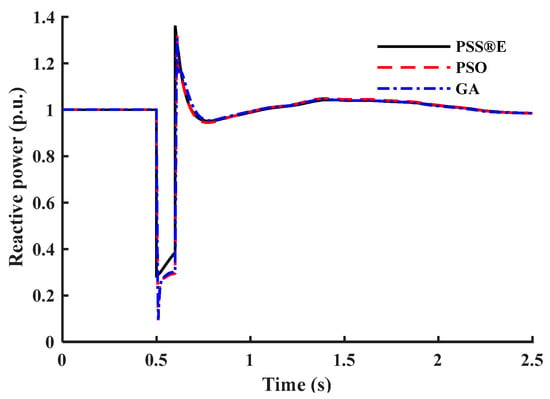
Figure 14.
Reactive power response of test case I.
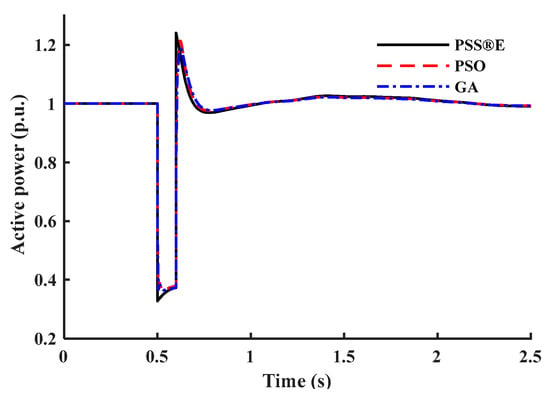
Figure 15.
Active power response of test case II.
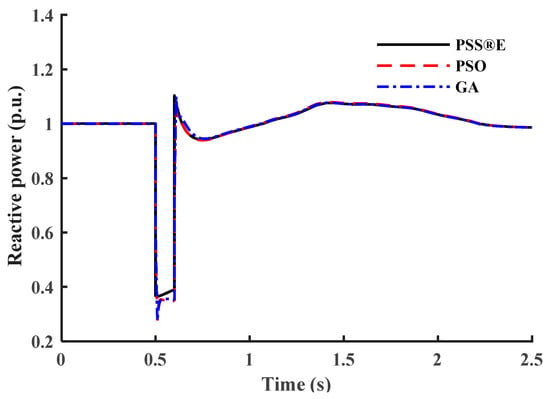
Figure 16.
Reactive power response of test case II.
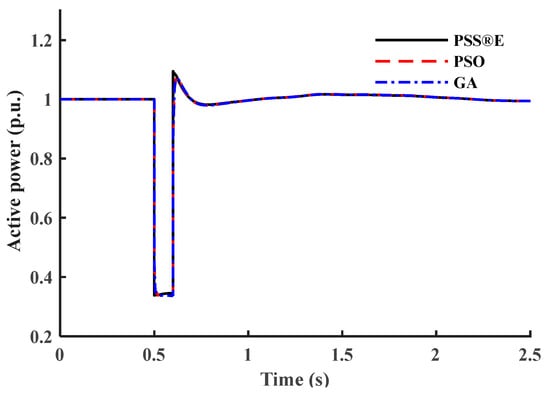
Figure 17.
Active power response of test case III.
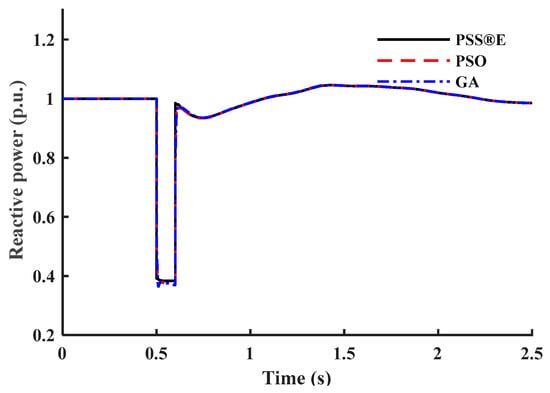
Figure 18.
Reactive power response of test case III.
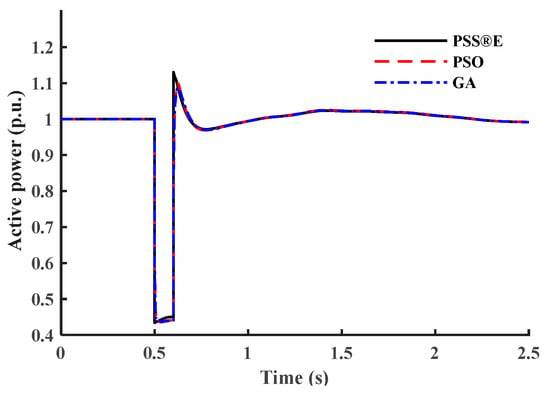
Figure 19.
Active power response of test case IV.
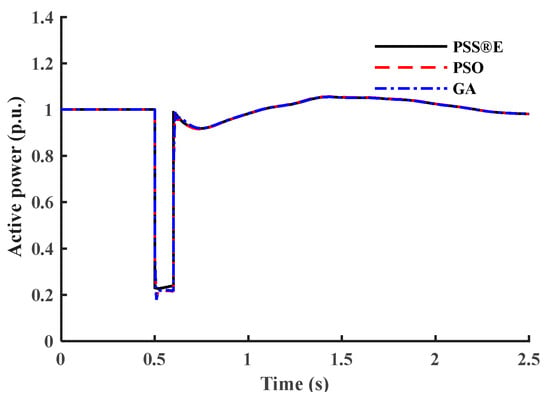
Figure 20.
Reactive power response of test case IV.

Table 8.
IAE values for the test cases.
The results of this study demonstrate that the proposed model effectively captures the dynamic characteristics of composite loads while maintaining consistency with the fundamental structure of the existing CLOD model. However, a key advantage of the proposed approach lies in its ability to incorporate variable parameters, allowing for greater adaptability in representing load dynamics. This enhanced flexibility leads to a more precise and efficient model with minimal computational burden, making it particularly suitable for large-scale power systems where accuracy and performance are essential.
4. Conclusions
This paper proposes a detailed mathematical representation of the composite load model, CLOD. The proposed model includes a mathematical representation of different aggregated loads, including large motors, small motors, discharge lighting, transformer saturation, constant MVA, and the remaining loads. Each submodel of the proposed composite model describes the aggregated load response during subtransient, transient, and steady-state periods.
- The fifth-order IM-LM with a designed parameter variation range has been implemented to illustrate the dynamics of large and small motor loads.
- A piecewise function has been employed for the aggregated discharge lighting to represent the load behavior under various voltage conditions.
- A rigorous ZIP-LM-based regression model has been developed to represent the dynamics of the saturation transformer load without the need for transformer specifications or look-up tables.
- An accurate linear regression model has been proposed to represent the dynamics of the aggregated constant MVA load.
Finally, the well-known EXP-LM model has been used to represent the remaining load. Heuristic optimization techniques and regression tools are employed to identify the parameters of the proposed model. Then, several simulations were conducted using MATLAB/Simulink, and their outputs were compared with the output of the CLOD in PSS®E for accuracy assessment. The results show a high accuracy of the proposed model, with an IAE less than 0.04 for motor loads and an RMSE less than 0.0001 for the other parts of the composite model. The model shows reasonable outcomes for different composite structures, with an IAE of less than 0.03 when employing straightforward optimization techniques.
Compared with the traditional model, the developed model offers enhanced accuracy and improved scalability, and it is applicable to integrate with other models.
The penetration level and the uncertainty of renewable energy resources play a critical role in the dynamic behavior of power systems. Therefore, a promising direction for future research is integrating a renewable energy dynamics submodel into the CLOD framework to better capture its interaction with composite loads in evolving power grids. Another valuable extension would be adapting the model to function as a time-varying system, making it suitable for real-time power system applications. Additionally, performing a sensitivity analysis on key parameters could offer deeper insights into how variations influence the model’s dynamic response, ultimately enhancing its accuracy and practical implementation.
Author Contributions
Conceptualization, I.A. and S.A.; methodology, I.A., S.A., I.A.S. and Y.A; validation, S.H. and Y.A.; formal analysis, S.H. and Y.A.; investigation, I.A., S.A and I.A.S; resources, S.H. and Y.A.; data curation, S.H. and Y.A.; writing—original draft preparation, I.A. and S.A.; writing—review and editing, I.A.S., S.H. and Y.A.; visualization, S.A and S.H; supervision, I.A.S. and Y.A.; All authors have read and agreed to the published version of the manuscript.
Funding
This research received no external funding.
Data Availability Statement
Dataset available on request from the authors.
Conflicts of Interest
The authors declare no conflict of interest.
References
- Arif, A.; Wang, Z.; Wang, J.; Mather, B.; Bashualdo, H.; Zhao, D. Load modeling—A review. IEEE Trans. Smart Grid 2017, 9, 5986–5999. [Google Scholar] [CrossRef]
- Lv, Z.; Jia, B.; Song, Z.; Li, H.; Zhou, S.; Li, Z. Stability Control Method Utilizing Grid-Forming Converters for Active Symmetry in the Elastic Balance Region of the Distribution Grid. Symmetry 2025, 17, 263. [Google Scholar] [CrossRef]
- Bokhari, A.; Alkan, A.; Dogan, R.; Diaz-Aguiló, M.; de León, F.; Czarkowski, D.; Zabar, Z.; Birenbaum, L.; Noel, A.; Uosef, R.E. Experimental determination of the ZIP coefficients for modern residential, commercial, and industrial loads. IEEE Trans. Power Syst. 2013, 29, 1372–1381. [Google Scholar] [CrossRef]
- Deng, C.; Dai, L.; Chao, W.; Huang, J.; Wang, J.; Lin, L.; Qin, W.; Lai, S.; Chen, X. An Advanced Spatio-Temporal Graph Neural Network Framework for the Concurrent Prediction of Transient and Voltage Stability. Energies 2025, 18, 672. [Google Scholar] [CrossRef]
- Chassin, F.S.; Mayhorn, E.T.; Elizondo, M.A.; Lu, S. Load modeling and calibration techniques for power system studies. In Proceedings of the 2011 North American Power Symposium, Boston, MA, USA, 4–6 August 2011; pp. 1–7. [Google Scholar] [CrossRef]
- Bai, W.; Zhu, J.; Zhao, J.; Cai, W.; Li, K. An Unsupervised Multi-Dimensional Representation Learning Model for Short-Term Electrical Load Forecasting. Symmetry 2022, 14, 1999. [Google Scholar] [CrossRef]
- Zhao, J.; Wang, Z.; Wang, J. Robust time-varying load modeling for conservation voltage reduction assessment. IEEE Trans. Smart Grid 2016, 9, 3304–3312. [Google Scholar] [CrossRef]
- Xiao, C.; Ren, Y.; Cao, Q.; Cheng, R.; Wang, L. Propagation Mechanism and Suppression Strategy of DC Faults in AC/DC Hybrid Microgrid. Processes 2024, 12, 1013. [Google Scholar] [CrossRef]
- Stojanović, D.P.; Korunović, L.M.; Milanović, J.J. Dynamic load modelling based on measurements in medium voltage distribution network. Electr. Power Syst. Res. 2008, 78, 228–238. [Google Scholar] [CrossRef]
- Singh, D.; Misra, R.K.; Singh, D. Effect of load models in distributed generation planning. IEEE Trans. Power Syst. 2007, 22, 2204–2212. [Google Scholar] [CrossRef]
- Dimitrakakis, G.S.; Georgakas, K.G.; Topalis, E.S.; Vovos, P.N. Grid Quality Services from Smart Boilers: Experimental Verification on Realistic Scenarios for Micro-Grids with Demand-Side Management Oriented to Self-Consumption. Energies 2024, 17, 2096. [Google Scholar] [CrossRef]
- AlMuhaini, M.; Yahaya, A.; AlAhmed, A. Distributed Generation and Load Modeling in Microgrids. Sustainability 2023, 15, 4831. [Google Scholar] [CrossRef]
- Kundur, P.S.; Malik, O.P. Power System Stability and Control; McGraw-Hill Education: New York, NY, USA, 2022. [Google Scholar]
- Roos, M.H.; Nguyen, P.H.; Morren, J.; Slootweg, J.J. Modeling and experimental validation of power electronic loads and DERs for microgrid islanding simulations. IEEE Trans. Power Syst. 2019, 35, 2279–2288. [Google Scholar] [CrossRef]
- Islavatu, S.; Kumar, P.; Kumar, A.; Salkuti, S.R. Power Quality Analysis by H-Bridge DSTATCOM Control by Icosθ and ESRF SOGI-FLL Methods for Different Industrial Loads. Smart Cities 2022, 5, 1590–1610. [Google Scholar] [CrossRef]
- Shin, K.; Ko, K.; Hwang, J. The Development and Characteristics of an In-Wheel Assembly Using a Variable Speed-Reducing Device. World Electr. Veh. J. 2025, 16, 92. [Google Scholar] [CrossRef]
- Balu, C.; Maratukulam, D. Power System Voltage Stability; McGraw-Hill: New York, NY, USA, 1994. [Google Scholar]
- Feijóo, A.; Cidrás, J.; Carrillo, C. A third order model for the doubly-fed induction machine. Electr. Power Syst. Res. 2000, 56, 121. [Google Scholar] [CrossRef]
- Ma, Z.; Wang, Z.; Wang, Y.; Diao, R.; Shi, D. Mathematical representation of WECC composite load model. J. Mod. Power Syst. Clean Energy 2020, 8, 1015–1023. [Google Scholar] [CrossRef]
- Hill, D.J. Nonlinear dynamic load models with recovery for voltage stability studies. IEEE Trans. Power Syst. 1993, 8, 166–176. [Google Scholar] [CrossRef]
- Ku, B.-Y.; Thomas, R.J.; Chiou, C.-Y.; Lin, C.-J. Power system dynamic load modeling using artificial neural networks. IEEE Trans. Power Syst. 1994, 9, 1868–1874. [Google Scholar] [CrossRef]
- Milanovic, J.V.; Yamashita, K.; Villanueva, S.M.; Djokic, S.Ž.; Korunović, L.M. International industry practice on power system load modeling. IEEE Trans. Power Syst. 2012, 28, 3038–3046. [Google Scholar] [CrossRef]
- Kosterev, D.; Meklin, A.; Undrill, J.; Lesieutre, B.; Price, W.; Chassin, D.; Bravo, R.; Yang, S. Load modeling in power system studies: WECC progress update. In Proceedings of the 2008 IEEE Power and Energy Society General Meeting—Conversion and Delivery of Electrical Energy in the 21st Century, Pittsburgh, PA, USA, 20–24 July 2008; pp. 1–8. [Google Scholar] [CrossRef]
- Western Electricity Coordinating Council. WECC Dynamic Composite Load Model (CMPLDW) Specifications; WECC Tech. Rep.; WECC: Salt Lake City, UT, USA, 2015. [Google Scholar]
- Ma, Z.; Cui, B.; Wang, Z.; Zhao, D. Parameter reduction of composite load model using active subspace method. IEEE Trans. Power Syst. 2021, 36, 5441–5452. [Google Scholar] [CrossRef]
- Wang, C.; Wang, Z.; Wang, J.; Zhao, D. SVM-based parameter identification for composite ZIP and electronic load modeling. IEEE Trans. Power Syst. 2018, 34, 182–193. [Google Scholar] [CrossRef]
- Guo, S.; Overbye, T.J. Parameter estimation of a complex load model using phasor measurements. In Proceedings of the 2012 IEEE Power and Energy Conference at Illinois, Champaign, IL, USA, 24–25 February 2012; pp. 1–6. [Google Scholar] [CrossRef]
- Hoshyarzadeh, A.S.; Zareipour, H.; Keung, P.-k.; Ahmed, S.S. The impact of CLOD load model parameters on dynamic simulation of large power systems. In Proceedings of the 2019 IEEE International Conference on Environment and Electrical Engineering and 2019 IEEE Industrial and Commercial Power Systems Europe (EEEIC/I&CPS Europe), Genova, Italy, 11–14 June 2019; pp. 1–6. [Google Scholar] [CrossRef]
- Bennett, M.; Liu, Y.J.; Systems, E. The impact of large-scale dynamic load modeling on frequency response in the US Eastern Interconnection. Int. J. Electr. Power Energy Syst. 2020, 120, 105983. [Google Scholar] [CrossRef]
- Li, S.; Liang, X.; Xu, W. Dynamic load modeling for industrial facilities using template and PSS/E composite load model structure CLOD. In Proceedings of the 2017 IEEE/IAS 53rd Industrial and Commercial Power Systems Technical Conference (I&CPS), Niagara Falls, ON, Canada, 6–11 May 2017; pp. 1–9. [Google Scholar] [CrossRef]
- Regulski, P.; Vilchis-Rodriguez, D.; Djurović, S.; Terzija, V. Estimation of composite load model parameters using an improved particle swarm optimization method. IEEE Trans. Power Deliv. 2014, 30, 553–560. [Google Scholar] [CrossRef]
- Wang, X.; Wang, Y.; Shi, D.; Wang, J.; Wang, Z. Two-stage WECC composite load modeling: A double deep Q-learning networks approach. IEEE Trans. Smart Grid 2020, 11, 4331–4344. [Google Scholar] [CrossRef]
- Prabpal, P.; Kongjeen, Y.; Bhumkittipich, K. Optimal Battery Energy Storage System Based on VAR Control Strategies Using Particle Swarm Optimization for Power Distribution System. Symmetry 2021, 13, 1692. [Google Scholar] [CrossRef]
- Liao, L.; Leung, V.C.M.; Li, Z.; Chao, H.-C. Genetic Algorithms with Variant Particle Swarm Optimization Based Mutation for Generic Controller Placement in Software-Defined Networks. Symmetry 2021, 13, 1133. [Google Scholar] [CrossRef]
- Tripathy, M. Power transformer differential protection using neural network Principal Component Analysis and Radial Basis Function Neural Network. Simul. Model. Pract. Theory 2010, 18, 600–611. [Google Scholar] [CrossRef]
- Bu, F.; Ma, Z.; Yuan, Y.; Wang, Z. WECC composite load model parameter identification using evolutionary deep reinforcement learning. IEEE Trans. Smart Grid 2020, 11, 5407–5417. [Google Scholar] [CrossRef]
- Siemens. “Program Application Guide”, PSS®E Users’ Manual; Siemens: Munich, Germany, 2013. [Google Scholar]
- Duan, J.; Bao, Y.; Zhang, G.; Wang, X.; Jiang, P.; Niu, W.; Zhang, H.; Zhen, W.; Xia, Y.; Song, R. Modeling and Simulation Analysis of Three-Phase Saturable Transformers: A Study on the Effects of Geomagnetically Induced Current on Transformers. Energies 2025, 18, 824. [Google Scholar] [CrossRef]
- Canal, T.; Zgainski, F.-X.; Renouard, V.-L. Determination of the saturation curve of power transformers by processing transient measurements. Electr. Power Syst. Res. 2021, 195, 107153. [Google Scholar] [CrossRef]
- Price, W.; Taylor, C.; Rogers, G. Standard load models for power flow and dynamic performance simulation. IEEE Trans. Power Syst. 1995, 10, 1302–1313. [Google Scholar] [CrossRef]
- ANSI C84.1-2020; Voltage Ratings for Electric Power Systems and Equipment (60 Hz). ANSI Std.: New York, NY, USA, 2020.
- The MathWorks, Inc. Curve Fitting Toolbox. Natick, Massachusetts, United States. 2020. Available online: www.mathworks.com/products/curvefitting.html (accessed on 8 October 2024).
Disclaimer/Publisher’s Note: The statements, opinions and data contained in all publications are solely those of the individual author(s) and contributor(s) and not of MDPI and/or the editor(s). MDPI and/or the editor(s) disclaim responsibility for any injury to people or property resulting from any ideas, methods, instructions or products referred to in the content. |
© 2025 by the authors. Licensee MDPI, Basel, Switzerland. This article is an open access article distributed under the terms and conditions of the Creative Commons Attribution (CC BY) license (https://creativecommons.org/licenses/by/4.0/).