Abstract
Accurate prediction of drilling speed is essential in mechanical drilling operations, as it improves operational efficiency, enhances safety, and reduces overall costs. Traditional prediction methods, however, are often constrained by delayed responsiveness, limited exploitation of real-time parameters, and inadequate capability to model complex temporal dependencies, ultimately resulting in suboptimal performance. To overcome these limitations, this study introduces a novel model termed CTLSF (CNN-TCN-LSTM with Self-Attention), which integrates multiple neural network architectures within a symmetry-aware framework. The model achieves architectural symmetry through the coordinated interplay of spatial and temporal learning modules, each contributing complementary strengths to the prediction task. Specifically, Convolutional Neural Networks (CNNs) extract localized spatial features from sequential drilling data, while Temporal Convolutional Networks (TCNs) capture long-range temporal dependencies through dilated convolutions and residual connections. In parallel, Long Short-Term Memory (LSTM) networks model unidirectional temporal dynamics, and a self-attention mechanism adaptively highlights salient temporal patterns. Furthermore, a sliding window strategy is employed to enable real-time prediction on streaming data. Comprehensive experiments conducted on the Volve oilfield dataset demonstrate that the proposed CTLSF model substantially outperforms conventional data-driven approaches, achieving a low Mean Absolute Error (MAE) of 0.8439, a Mean Absolute Percentage Error (MAPE) of 2.19%, and a high coefficient of determination (R2) of 0.9831. These results highlight the effectiveness, robustness, and symmetry-aware design of the CTLSF model in predicting mechanical drilling speed under complex real-world conditions.
1. Introduction
In the oil and gas industry, real-time prediction of drilling speed is a fundamental aspect of intelligent operational management. Accurate rate of penetration (ROP) forecasting plays a crucial role in improving operational efficiency, reducing costs, and ensuring drilling safety. Drilling operations are inherently complex, time-consuming, and expensive, with daily expenditures reaching up to 500,000 USD [], which underscores the importance of precise ROP prediction. Reliable drilling speed forecasting not only enables the optimization of drilling parameters and supports informed decision-making but also minimizes non-productive time, thereby reducing overall operational costs [,]. However, traditional prediction methods based on simplified physical models or empirical formulas are often inadequate for capturing the nonlinear, time-dependent, and strongly coupled dynamics of drilling processes [,,,]. To address these limitations, symmetry-based modeling approaches have recently been introduced. By exploiting the inherent symmetrical patterns within drilling data, these methods enhance model robustness and predictive accuracy. Despite these advances, achieving a balance between prediction accuracy and real-time computational performance remains a persistent technical challenge in modern oilfield engineering [,].
The rapid advancement of artificial intelligence (AI) has profoundly reshaped various industries, particularly the oil and gas sector, where AI-driven techniques have brought remarkable improvements in automation and decision-making efficiency [,,,]. Intelligent oilfield development has become a prominent research focus, leveraging AI’s capabilities in data processing, feature extraction, and pattern recognition to optimize operational workflows and enhance predictive accuracy [,,]. As a key subfield of AI, machine learning (ML) has demonstrated strong potential in predicting essential oilfield parameters, such as drilling speed, production rate, and reservoir characteristics []. By integrating symmetry-aware learning algorithms that account for the underlying symmetrical structures in drilling data, researchers are developing more adaptive and accurate ML-based models. These advancements further improve the reliability and real-time performance of predictive systems in increasingly complex drilling environments.
Deep learning models, particularly those combining Convolutional Neural Networks (CNNs) and Long Short-Term Memory Networks (LSTMs), have emerged as powerful tools for geological data analysis and prediction [,]. Hegde [] developed an enhanced drilling penetration prediction model based on a data-driven machine learning framework, demonstrating the capability of machine learning in addressing complex geological challenges. Li [] further proposed a comprehensive workflow encompassing data acquisition, preprocessing, model construction, and performance evaluation, which significantly improved the accuracy of drilling efficiency prediction and achieved notable advantages over traditional approaches. In a related study, Skrobek [] tackled the problem of predicting the performance of fixed-bed and fluidized-bed adsorption systems by introducing a deep learning framework integrating LSTM, BiLSTM, and GRU architectures. Experiments with silica gel composite adsorbents achieved high prediction precision, with an R2 value exceeding 0.97, thereby enhancing the efficiency of adsorption cooling systems. Similarly, Alsaihati [] developed an integrated hybrid model that combines a random forest meta-model with artificial neural networks and adaptive neuro-fuzzy inference systems as base learners. Validation using real well data revealed that this approach substantially outperformed both its individual base learners and conventional empirical models, achieving a low absolute mean percentage error of 7.8% and a high coefficient of determination (R2) of 0.94. Despite these advances, deep learning-based models still face several practical limitations. Their performance often depends on the availability of large volumes of high-quality data, extensive training durations, and significant computational resources. Such requirements may hinder their scalability and robustness in real-time industrial applications, leading to imbalances in model performance and resource utilization.
Beyond model selection, data preprocessing and optimization strategies play a crucial role in enhancing predictive accuracy. Gan [] proposed a rate of penetration (ROP) prediction framework that integrates wavelet filtering, mutual information-based variable optimization, and a hybrid bat algorithm, effectively improving the performance of support vector regression through hyperparameter optimization. Ashrafi [] introduced a hybrid learning model by coupling four evolutionary algorithms with artificial neural networks, demonstrating superior capability in managing nonlinear features and noise interference, thereby improving the robustness and adaptability of drilling speed prediction. Moreover, Khalifa [] proposed a machine learning-based rock type classification approach that enables real-time identification of lithology using drilling data. By integrating nine drilling parameters and employing the open Volve oilfield dataset, the model ensured dataset impartiality through feature selection and sample balancing techniques, achieving a testing accuracy of 95%. However, the computational complexity and intensive parameter tuning associated with these methods may restrict their applicability in large-scale real-time data environments, where rapid response and model efficiency are essential.
In the context of real-time prediction and dynamic model adaptability, Soares [] developed a real-time learning framework that enhances model stability and prediction accuracy under varying operational conditions. By continuously capturing and integrating drilling process data, this method improves the flexibility and responsiveness of traditional analytical models. Subsequent studies have demonstrated that real-time data feedback and continuous learning mechanisms not only enhance predictive accuracy but also expand model applicability and adaptability across diverse drilling environments [,]. In the domain of drilling operation optimization and control, Gan [] introduced a dynamic ROP prediction model based on a moving window strategy. By incorporating correlation analysis among drilling parameters, this approach provides robust support for intelligent drilling optimization and real-time decision-making. Nevertheless, real-time learning methods impose substantial demands on data transmission speed, computational hardware capability, and model update efficiency, which may limit their scalability when dealing with highly dynamic and complex industrial data streams.
Beyond real-time adaptability, the interpretability of models has emerged as an equally critical yet challenging research focus. Model interpretability and predictive performance are inherently interdependent, and achieving a suitable balance between the two remains a central issue in intelligent drilling modeling. Pei [] improved the interpretability of fully connected neural networks (FNNs), thereby facilitating more effective optimization of drilling parameters and enhancing decision-making transparency. Similarly, Caicedo [] proposed an innovative computational strategy for rock strength estimation, enabling improved prediction of drill bit performance and offering valuable insights for enhancing drilling efficiency and cost reduction. Despite these advancements, achieving a balance between interpretability and high predictive accuracy continues to be a major challenge, particularly in the context of complex, data-intensive drilling operations [].
Unlike conventional hybrid models that typically combine modules in a generic manner, the proposed CNN-TCN-LSTM with Self-Attention (CTLSF) model is designed with a task-specific architecture tailored for drilling speed prediction. It integrates CNN, TCN, LSTM, and a self-attention mechanism in a coordinated and purposeful way. Specifically, CNN is used to extract localized spatial features from sequential drilling data. The TCN module then applies dilated convolutions and residual connections to effectively capture long-range dependencies while maintaining computational efficiency. The LSTM module further models the temporal dynamics of the sequence in a forward direction, capturing how drilling conditions evolve over time. To enhance the model’s focus on critical time steps, a self-attention mechanism is applied after the LSTM layer, allowing the model to adaptively assign greater importance to the most informative temporal features. This carefully designed architecture, combined with dimensionality reduction through global pooling and compact fully connected layers, sets CTLSF apart from existing hybrid models. It is specifically developed to address the challenges of multivariate, nonlinear, and strongly time-dependent drilling parameter prediction, offering high task relevance and practical value.
Firstly, as shown in Figure 1, the historical drilling data and current moment data are saved to the drilling database according to the measurement equipment, and then, each parameter is transmitted from the database to the subnetwork and, finally, jointly passed into the data-driven model for ROP prediction. For specific details of the model, please refer to Table 1. This study also systematically outlines the experimental workflow, and Figure 2 illustrates the detailed experimental framework of the method. The proposed symmetry-aware architecture balances feature extraction across different network paths, ensuring stable gradient propagation and reducing bias toward specific feature patterns. This design enhances learning efficiency and helps the model capture important patterns in complex drilling data, improving both stability and generalization.
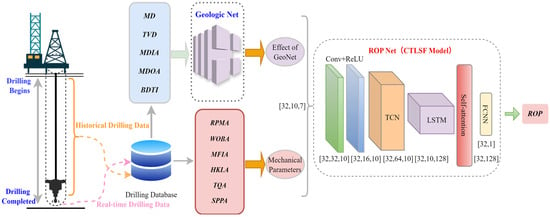
Figure 1.
The proposed model, the structure of a real-time mechanical drilling speed prediction method.

Table 1.
CTLSF model architecture and tensor shapes.
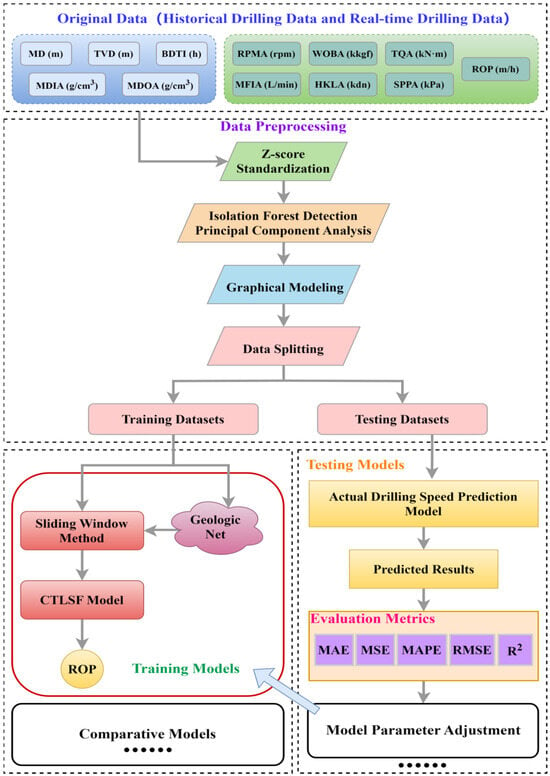
Figure 2.
Data-driven modeling research process.
- Z-score standardization and outlier removal were performed on oilfield drilling data, and the data from different wells were divided into training data and test data at a ratio of 3:1.
- Combine graph modeling techniques to analyze the correlation of different parameters in drilling data. Based on the data-driven method, a geologic subnetwork is constructed to extract the strong correlation parameters and train the neural network, so as to obtain the geologic fusion influence factor.
- Construction of the CNN-TCN-LSTM with Self-Attention (CTLSF) drilling speed prediction model was started to determine the hyperparameters, such as maximum number of iterations, hidden layer dimensions, learning rate, and batch size.
- The CTLSF model is trained, and the weights and bias values are optimized based on the output error of each iteration.
- The identified CTLSF models were tested with the test dataset, and the corresponding Mean Absolute Error (MAE), Mean Absolute Percentage Error (MAPE), Mean Squared Error (MSE), Root Mean Squared Error (RMSE), and the Coefficient of Determination (R2) evaluation metric values were calculated, and the model hyperparameters were appropriately adjusted according to the metric values.
- The data-driven model of this study was used to compare and analyze with the current mainstream predictive models, which ultimately led to the study’s conclusions.
It is important to note that this study was conducted under several simplifying assumptions. Specifically, it was assumed that all wells were drilled using similar equipment, including rig type and bit condition (e.g., wear). This assumption helps minimize data variability caused by equipment differences and ensures consistency across the dataset. Based on this methodology and experimental procedure, the study successfully developed an efficient and accurate drilling speed prediction model, which provides practical technical support for real-time drilling speed forecasting in oilfield operations.
2. Materials and Methods
In the following sections, the basic principles and important functions of the CNN, TCN, LSTM, and SAM are mainly briefly introduced. At the end of the section, an overview of the composition and implementation process of the CTLSF oilfield drilling speed prediction model proposed in this study is presented.
2.1. CNN
Convolutional Neural Network (CNN) is a deep learning model architecture first proposed by Yann LeCun et al. in 1998. It has been widely used in computer vision tasks such as image recognition, target detection, and image segmentation []. The basic structure of a Convolutional Neural Network includes a convolutional layer, a pooling layer, and a fully connected layer [], as shown in Figure 3. CNN is able to automatically learn and recognize local patterns and features in time series data by means of local perception, demonstrating a powerful feature extraction capability, which is especially suitable for processing complex and time series input data.

Figure 3.
CNN basic structure diagram.
2.2. TCN
Temporal convolutional network is a deep learning architecture. The model has shown excellent performance in the field of sequence modeling by virtue of the advantages of recurrent neural networks in capturing long-term dependencies in sequences []. The core innovation of TCN is the introduction of causal convolution, extended convolution, and residual connectivity modules. Among them, causal convolution ensures the causal nature of the network, i.e., the output at the current moment depends only on the current and past inputs, avoiding information leakage. Its mathematical form is described as follows:
where xt is the input at the current time step of the sequence, yt is the output at the current time step, and represents the function that establishes the relationship between the output and the input. Dilated convolution builds upon traditional convolution by introducing a dilation factor that expands the receptive field of the convolution operation. The mathematical expression for the s-th neuron in a dilated convolution is as follows:
where s represents the input sequence information, is the dilation factor, × denotes the convolution operation, k is the size of the convolution kernel, and s − d·i indicates the past direction in time. Figure 4a illustrates an example of dilated convolution. As the dilation factor increases, the receptive field of the TCN expands, allowing for the reception of more information. To mitigate the vanishing gradient problem in deep networks, TCN incorporates residual connections. As shown in Figure 4b, each residual block consists of a convolutional layer, ReLU activation function, weight normalization, and a dropout layer. The mathematical representation of the residual block is as follows:
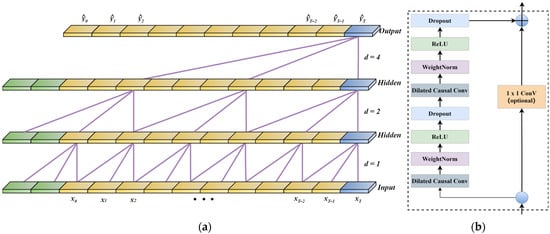
Figure 4.
(a) TCN network extended convolutional map; (b) residual module.
2.3. LSTM
The Long Short-Term Memory (LSTM) network is a specialized type of recurrent neural network (RNN) designed to effectively address the limitations of traditional RNNs in capturing long-term dependencies []. Conventional RNNs often suffer from vanishing or exploding gradient problems during the modeling of long sequences, which significantly reduces their ability to represent long-range dependencies. In contrast, LSTM Networks introduce memory cells and gating mechanisms, substantially improving their capacity and stability in modeling long-term sequences, both theoretically and empirically []. As shown in Figure 5, the LSTM Network is composed of multiple LSTM subunits arranged in a hierarchical structure, with each subunit consisting of a forget gate, an input gate, and an output gate.
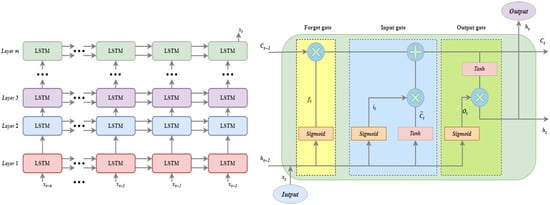
Figure 5.
LSTM Network structure and logical structure of LSTM Network subunits.
The forget gate determines which information in the memory cell of the current time step should be forgotten or discarded.
Its activation value is represented as
The input gate controls the influence of the input information at the current time step on the memory cell state, determining how new information is stored in the cell state.
Its computation is represented as
The output gate determines the hidden state ht at the current time step by extracting information from the cell state and passing it to the next layer or output of the network.
Its calculation is expressed as
2.4. Self-Attentional Mechanism
The self-attention mechanism (SAM) is a method used to calculate the dependencies between elements in a sequence, making it particularly effective for processing long sequences of data []. It generates weighted representations for each element by calculating its relevance to all other elements in the sequence. The computation process of the self-attention mechanism involves three key components: queries, keys, and values. As shown in Figure 6, the process begins by calculating the dot product between the query vector Q and the key vector K to evaluate the relevance between each pair of elements in the sequence. Next, the softmax function is applied to normalize the resulting relevance, transforming them into a probability distribution. Finally, the normalized weights are used to perform a weighted sum of the value vector V, generating the final representation. The computation is expressed as
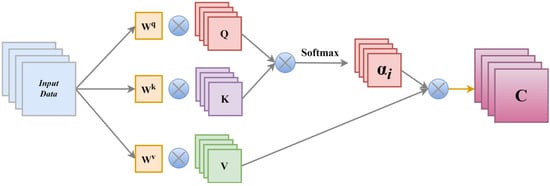
Figure 6.
Structure of the self-attention mechanism.
In the equation, WK, WQ, and WV are the weight matrices learned during training, which are used to transform the input into the query, key, and value vectors, respectively, with C representing the final output.
2.5. CTLSF Model
The core idea of the proposed CTLSF model lies in leveraging the collaborative effect of multiple modules to fully extract multi-level feature information from the data. First, the CNN module performs initial feature extraction on the input time series data through dual convolution operations. The convolutional layers capture local spatial features, extract low-level features from the data, and smooth the time series signals, thereby reducing the complexity of the raw data. Next, TCN utilizes dilated convolution to gradually expand the receptive field while maintaining computational efficiency, enabling the model to handle longer time steps without increasing computational costs. On this basis, a bidirectional LSTM is employed to capture contextual information from both directions of the input sequence, enabling the model to fully learn bidirectional dependencies and further improve prediction accuracy. Additionally, self-attention computes the weight relationships between different time steps, empowering the model to selectively focus on the most critical parts of the input sequence.
Compared with traditional single-network models, CTLSF demonstrates superior feature fusion capabilities in processing time series data and excels at capturing long-term dependencies, significantly enhancing the accuracy and robustness of oilfield mechanical drilling rate prediction. Therefore, the proposed CTLSF model offers a novel approach for time series forecasting tasks and holds great potential for a wide range of applications.
3. Related Preparations
This section focuses on the data preprocessing phase, aiming to improve the data quality by systematically handling outliers and missing values. A graph-based modeling approach is employed to explore the correlations among multidimensional oilfield drilling data, constructing subnetworks for highly correlated attributes. A sliding window mechanism is then applied to input the geological influence factor and drilling data into the prediction model in chronological order. This ensures that the prediction model is fully trained on representative data, thereby enhancing its generalization capability for unseen samples. This step plays a critical role in reducing data noise, optimizing model performance, and improving the overall prediction accuracy.
3.1. Data Preparation
In this study, the available Volve dataset released by Equinor was utilized. This dataset originates from the Volve oilfield in the Norwegian Continental Shelf of the North Sea. Due to its high accessibility and comprehensive nature, the dataset serves as a valuable resource for external validation and cross-domain comparative studies, making it an ideal choice for evaluating and validating the proposed model.
3.1.1. Datasets Overview and Parameter Distribution
Among the numerous open-access wells in the Volve oilfield of the North Sea, the data completeness and the distribution ranges of various drilling attributes vary significantly across wells. Therefore, this study selected drilling data from four wells with complete observational records as the data source for drilling rate prediction. The selected wells are labeled as W4, W5, W6, and W7. Specifically, W4, W5, and W6 were used as the training dataset to capture the overall drilling process patterns, while W7 was used as the test dataset to evaluate the model’s accuracy in predicting mechanical-specific energy. This selection ensures that the experimental dataset not only represents the geological diversity within the oilfield but also includes a wide range of operational data. Preserving complete well data for testing better simulates real-world drilling scenarios where models must predict the ROP for entirely new wells, and this partitioning strategy effectively validates the model’s generalization capability across geological heterogeneity. The diversity and comprehensiveness of these data are critical for ensuring the accuracy and reliability of prediction modeling and analysis. Table 2 summarizes the depth range and data volume of each well.

Table 2.
Drilling data information.
As shown in Table 3, each well contains a variety of attributes essential for oilfield drilling operations. These attributes collectively provide a comprehensive understanding of the drilling activities and geological features. Taking the W4 well data as an example, a detailed overview of the range and values of these modeling parameters is provided in Table 3.

Table 3.
W4 drilling parameter information.
3.1.2. Z-Score Standardization
Z-score normalization is a commonly used data preprocessing method that eliminates the impact of differences in scale and magnitude between features.
This is achieved through the following formulas:
where x is the raw data, σ is the standard deviation, and µ is the mean of the data. In this study, Z-score normalization was applied to all parameters, ensuring a more uniform distribution of the input data in the feature space. This improved both the model’s convergence speed and prediction accuracy. The effects of the normalization are shown in Figure 7. Z-score normalization was applied independently to each feature dimension to ensure comparability across features.
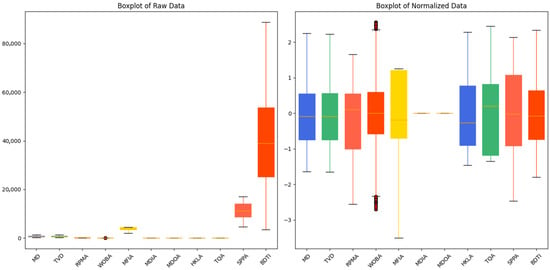
Figure 7.
Comparison of numerical standardization for drilling.
3.1.3. Outlier Detection
To ensure data quality, further detection and processing of outliers in the dataset were performed. Outliers may arise from measurement errors, data acquisition noise, or extreme conditions and can negatively impact the stability and generalization performance of the model. In this section, the Isolation Forest algorithm was employed for anomaly detection to identify outliers in the data. Isolation Forest is an unsupervised machine learning algorithm specifically designed for anomaly detection, which isolates outliers by randomly partitioning the feature space. In the algorithm design, the contamination parameter was set to 0.05, indicating that approximately 5% of the data points were considered outliers. The algorithm labels each data point, where −1 denotes an outlier and 1 denotes a normal point. Finally, representative features such as MD, WOBA, and RPMA were selected to construct a 3D scatterplot, with colors indicating outliers and normal points, as shown in Figure 8.
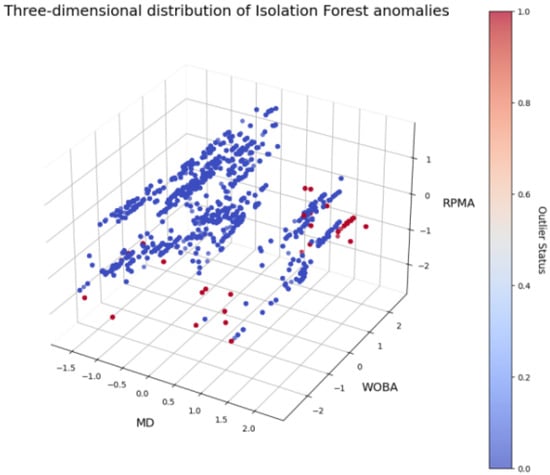
Figure 8.
Three-dimensional distribution of anomalies.
3.2. Sliding Window Size Analysis
The sliding window is an important preprocessing step in time series analysis, used to extract local features from continuous data while preserving the temporal information. As shown in Figure 9, a sliding window of length L is applied to process the data sequence. As new samples arrive, the sliding window moves forward along the sequence. At each window update, the model is trained multiple times using the data within the window, thereby predicting the next ROP value. In this study, different window sizes were set and experiments were conducted to analyze the impact of window size on model performance. As shown in Table 4, set the window size to 5, 10, and 20, respectively, for the experiment, and the results indicate that smaller windows retain more fine-grained information but increase the computational complexity, while larger windows reduce the capture of detailed features but improve computational efficiency and model robustness. Ultimately, a window size of 10 was selected, as it exhibited the best balance between prediction accuracy and computational complexity, providing a reliable basis for further model optimization.
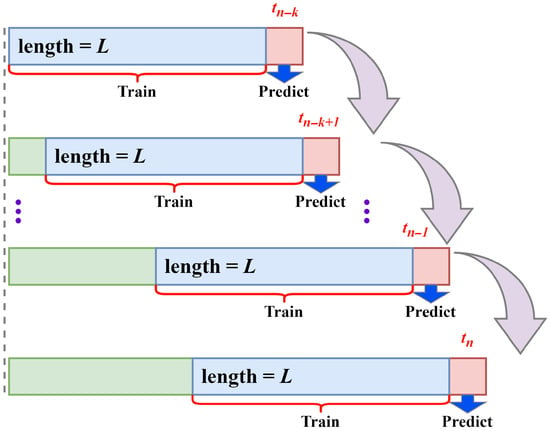
Figure 9.
Schematic diagram of the sliding window method.

Table 4.
Window size experiment.
3.3. Correlation Analysis
To thoroughly analyze the impact of drilling parameters on the rate of penetration (ROP), this study employed mutual information to quantitatively assess 11 parameters, aiming to reveal the correlation between each input feature and the target variable ROP. As shown in Figure 10, parameters such as MD, TVD, and BDTI exhibit a strong influence on ROP, whereas MDOA, MFIA, and MDIA have a relatively limited impact.
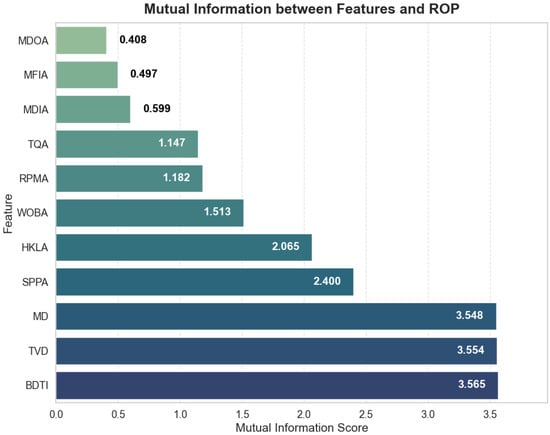
Figure 10.
Mutual information scores barplot between features and ROP.
The drilling rate is influenced by a variety of complex factors, and there exists a certain degree of correlation between the input parameters. Therefore, careful selection of the input features is crucial in the construction of data-driven models. Correlation analysis, as one of the common methods for feature selection, provides a scientific basis for quantitatively characterizing the relationships between variables. In this study, graphical modeling techniques are employed to represent variables as nodes in a network, with edges indicating their correlations. The Pearson correlation coefficient is used to construct the correlation matrix, which quantitatively describes the linear relationships between the variables. Furthermore, a heatmap is used to visualize the correlation matrix, with a color gradient clearly illustrating the strength and direction of the correlations. Strongly correlated parameters are more prominently displayed in the heatmap, revealing potential key relationships.
Applying this method to dataset W4, the analysis results are shown in Figure 11. Among the 11 input parameters under study, the correlation experiment indicates that MD, TVD, MDIA, MDOA, and BDTI exhibit strong correlations. Therefore, a geological subnetwork can be constructed based on these highly correlated parameters, and these parameters can be incorporated as input features into the neural network model. This enables the training of a comprehensive influence factor, providing more accurate and effective data support for the prediction of the mechanical drilling rate.
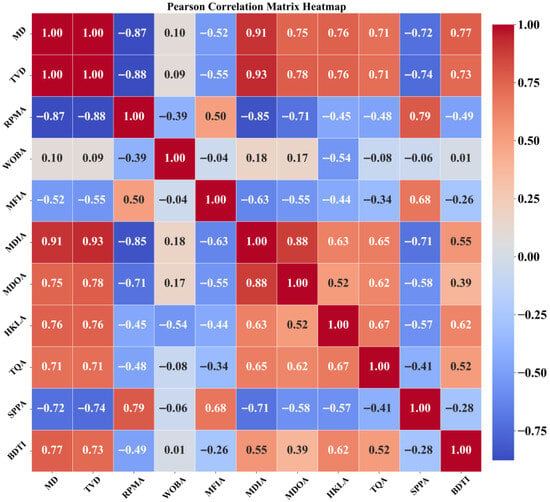
Figure 11.
Pearson correlation matrix heatmap.
3.4. Subnetwork Construction
As shown in Figure 12, the geological subnetwork is designed not merely as a standard MLP for dimensionality reduction or fusion, but as a domain-guided module tailored to extract deep representations from strongly correlated geological inputs. While it employs a fully connected neural network structure—including an input layer, two hidden layers, and an output layer—the novelty lies in its dedicated role and selective input mechanism within the entire model framework. Specifically, based on Pearson correlation analysis and geological domain knowledge, we select five highly interrelated parameters (MD, TVD, MDLA, MDOA, and BDTI) that characterize subsurface structural and lithological information. These are processed independently in this subnetwork to preserve internal correlations and enhance their semantic contribution, before being fused with dynamic drilling signals in the later stages of the model. This modular and hierarchical fusion design allows the network to mitigate multi-collinearity risks and avoid the curse of dimensionality that often occurs when high-dimensional static parameters are directly mixed with time-varying features.
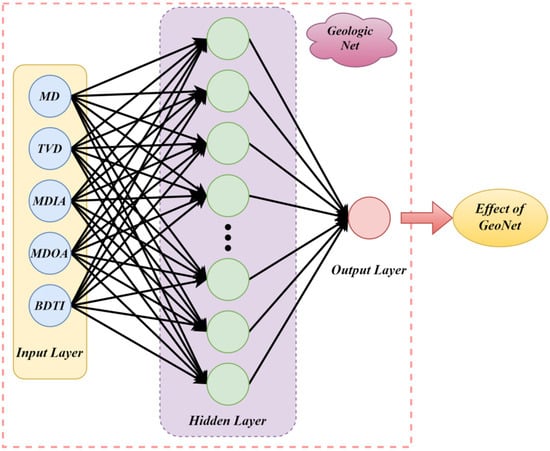
Figure 12.
Geologic network structure.
Furthermore, the geological subnetwork provides an interpretable latent representation, serving as a compact geological influence factor for subsequent multi-source coupling in drilling rate prediction. Thus, the originality of this subnetwork lies not in its architectural complexity but in its task-specific, geologically informed functional design that contributes to both prediction accuracy and interpretability.
3.5. Model Evaluates Metrics
To evaluate the performance of the proposed oilfield drilling rate prediction model, this study employs several commonly used regression evaluation metrics, including the MAE, MAPE, MSE, RMSE, and the R2.
The definitions and explanations of these metrics are as follows:
where represents the actual drilling rate in the oilfield, denotes the predicted drilling rate, and n is the total number of drilling data points in the experimental dataset. The model with the lowest values for these metrics is considered the best predictive model.
4. Results and Discussion
This section aims to provide a systematic evaluation of the predictive performance of the proposed CTLSF model. Specifically, the evaluation focuses on four key performance metrics: the MAE, MAPE, MSE, RMSE, and R2. Based on the validation results for both raw and filtered datasets, the performance of the CTLSF model is compared with that of the current mainstream data-driven models, providing a comprehensive quantification of the model’s strengths and weaknesses. Furthermore, to further validate the accuracy and robustness of the CTLSF model, experiments were conducted under different dataset conditions to deeply analyze the model’s performance, uncovering its potential advantages and limitations in prediction tasks and laying a solid foundation for its further application and optimization.
To ensure fair comparison and result stability, all experiments were conducted in the same computing environment: an AMD Ryzen9 7945 processor, NVIDIA GeForce RTX 4060 (8G), CPU clock speed of 2.5 GHz, and 32.0 GB of RAM. In addition, the specifics of the parameter configuration of the CTLSF model are shown in Table 5.

Table 5.
Model parameterization.
4.1. Model Capability Analysis
To evaluate the predictive performance of the data-driven model, this study applied the aforementioned preprocessing methods to filter the W4, W5, W6, and W7 drilling datasets and incorporated geological influence factor to construct the final filtered dataset for experimentation. Meanwhile, the raw datasets for all four wells were retained to assess the model’s robustness under noisy conditions. The experimental results for the CTLSF model are shown in Figure 13 and Figure 14.
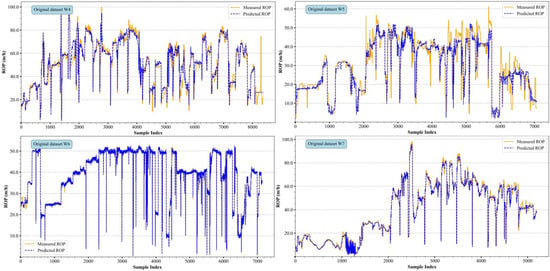
Figure 13.
Test results of the CTLSF model with the original dataset.
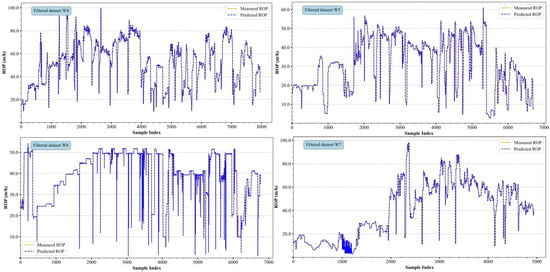
Figure 14.
Test results of the CTLSF model with filtered datasets.
Under the influence of noise in the raw dataset, the predictive accuracy of the data-driven model was significantly lower than that observed in the filtered dataset. This phenomenon is primarily due to the presence of outliers and large fluctuations in the raw data, which conventional prediction models find challenging to adapt to the complex drilling process and extreme conditions. As shown in Figure 12, the horizontal coordinate x-axis represents the sample training time sequence, i.e., the beginning sample point to the end of the consecutive sample points, and the vertical coordinate y-axis represents the ROP value corresponding to the current sample point; in addition, the yellow solid line represents the real sample point, and the blue dotted line represents the ROP value corresponding to the current sample point predicted by the data-driven model. The figure includes subplots for the four different datasets, each illustrating the model’s performance in different drilling areas. From the overall trend, the measured and predicted values are closely aligned, indicating that the model designed in this study can effectively capture the drilling rate variation patterns, demonstrating a certain level of robustness. However, in regions with significant drilling rate fluctuations or intense oscillations, some deviations between the predicted and measured values still exist, which may reflect the model’s insufficient adaptability when handling high-frequency fluctuations.
In the final experimental dataset constructed for this study, the performance metrics of the CTLSF model showed significant improvement, with the predicted ROP values closely aligning with the measured values, demonstrating the outstanding predictive capability of the data-driven model. Compared to the raw data, the model’s MAE on the processed W4 dataset was significantly reduced to 0.8439, and the MAPE decreased by 8.8%. This result indicates that data preprocessing and the analysis of correlations between model parameters played a crucial role in improving the prediction accuracy.
For the raw datasets of W4 and W5, the prediction errors are more apparent. Specifically, the W4 data showed a MAE value of 3.8947 and a MAPE value of 10.99% in a single test, while the W5 data showed a MAE value of 3.6534 and a MAPE value of 18.56%. The drilling rate fluctuations in these datasets were relatively large, posing a greater challenge for the model. In contrast, the model performed significantly better on the W6 dataset, with a MAE value of 0.5311 and a MAPE value of 1.77%, demonstrating a strong ability to capture the abrupt changes in the actual ROP.
As shown in Figure 15, the scatterplots of the measured and predicted values for the four wells clearly illustrate the predictive performance of the CTLSF model across different drilling rate ranges. The data points exhibited tight clustering along the 1:1 ideal prediction line (slope = 1, intercept = 0), with over 90% of the predictions falling within ±10% of the measured value, and only a very small number of points were not accurately predicted to be farther from the ideal prediction line. Most of the data points are closely distributed around the ideal prediction line, indicating that the model can accurately capture the variation trends of the actual drilling rate within these ranges. The predicted values closely align with the measured values, highlighting the model’s superior predictive ability across the majority of the drilling rate intervals.
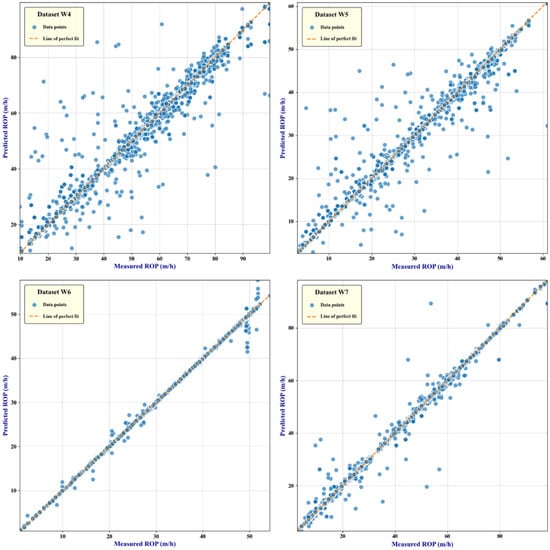
Figure 15.
Scatterplot relationship between the predicted ROP and measured ROP.
4.2. Model Comparison
To evaluate the advantages of the proposed CTLSF prediction model over the current mainstream models, we compared it with models such as LSTM, SA-LSTM, and CNN-LSTM and tested each model’s noise robustness on the raw data. As shown in Table 6, although the CTLSF model, by incorporating dual convolution and TCN structures, has a larger number of parameters than the other mainstream models—resulting in a longer per-epoch computation time—it outperforms the other models in both raw noisy data and filtered data. In the filtered data, the CTLSF model achieves an R2 value of 0.9831 and a MAE of only 0.8439, significantly outperforming the other comparison models. This demonstrates that the CTLSF model holds significant research value in drilling rate prediction, as it can more effectively handle noise interference and provide accurate predictions. It is important to note that MAPE calculates the relative error percentage.

Table 6.
Performance of each model under the test set.
The data from Table 6 were visualized in a radar chart, generating Figure 16. Each model is evaluated based on the five aforementioned metrics, with the orange area representing the model’s performance on the raw noisy data, and the purple area reflecting the model’s performance on the filtered data. From the four subplots, it is clearly evident that the area of the purple region is significantly smaller than that of the orange region. This indicates that data preprocessing, parameter correlation analysis, and subnetwork partitioning play crucial roles in enhancing the model’s performance, effectively improving its ability to perform well on filtered data. Among all models, the CTLSF model performed the best, demonstrating its stronger modeling capabilities for complex time series data. In contrast, the LSTM and CNN-LSTM models had higher errors on unfiltered data and were significantly affected by noise in the raw data. Although SA-LSTM showed some improvement over traditional LSTM, it still fell short of CTLSF in terms of overall performance across all metrics. It is important to note here that MSE is a large value, and to show it clearly, we divide the value of MSE by 10 to visualize the expression.
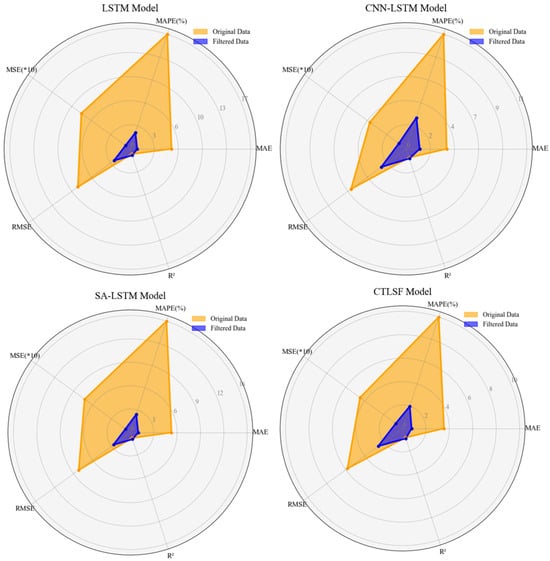
Figure 16.
Radar plots of the predictive performance of each model with raw and filtered data.
Furthermore, based on the W4 drilling dataset, we compared the predicted values of each model, with different colors representing different prediction models. As shown in Figure 17, the predicted curve of the CTLSF model closely follows the actual measurement curve, showing a tighter fit than the other models. Additionally, in the filtering data experiment, the CTLSF model demonstrates a clear advantage, effectively capturing the extreme points of the measured values, further validating its superiority in prediction accuracy.
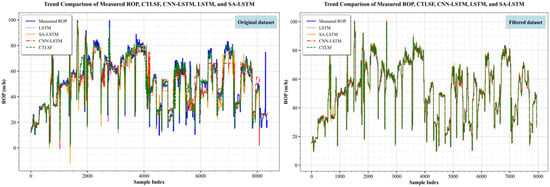
Figure 17.
Comparative effect of the performance of each model with raw and filtered data.
4.3. Iterative Loss Assessment
As shown in Figure 18, after more than 1000 epochs of iteration, the performance of all models tends to stabilize, and the loss value per iteration reaches a steady state. However, upon closer inspection of the first 100 epochs, significant differences in the loss reduction trends among the models can be observed. Specifically, the initial loss value of the CTLSF model is notably lower than that of other models, and it exhibits a faster decline in loss, eventually stabilizing with a superior performance. In contrast, models such as LSTM start with a higher initial loss, exhibit a slower reduction rate, and display some fluctuations during subsequent iterations. In conclusion, it can be seen in Figure 18 that the CTLSF model converges faster in prediction, and the model is more stable during training. The performance is better compared to other models.
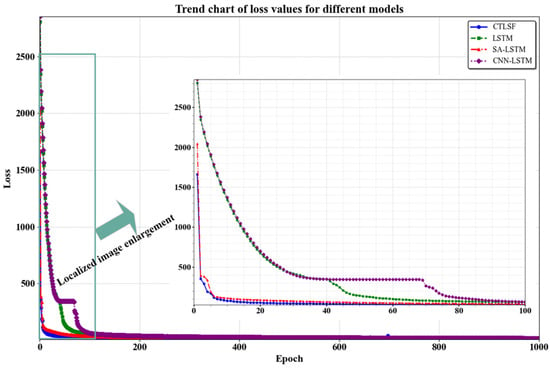
Figure 18.
Comparison of a decreasing trend of loss values for each model.
5. Conclusions
In conclusion, this study proposes a TCN-LSTM model that integrates dual convolutional structures and a self-attention mechanism. The use of convolution is a key architectural strength, enabling the model to effectively extract local temporal features. Temporal Convolutional Networks are employed to capture short-term dependencies, while Long Short-Term Memory networks are utilized to model long-term temporal relationships in the drilling rate time series. The self-attention mechanism further enhances the model’s ability to dynamically allocate attention across different time steps and feature dimensions, thereby improving prediction accuracy by emphasizing relevant patterns within the data.
The proposed CTLSF model has demonstrated outstanding performance, as evidenced by a low MAE of 0.8439, a MAPE of 2.19%, and an R2 value of 0.9831. It maintains robust predictive accuracy even under noisy data conditions while achieving high precision on clean datasets, indicating strong stability across varying data qualities. This level of adaptability and accuracy offers a clear advantage over traditional ROP prediction models, particularly in handling complex nonlinear relationships and long-term dependencies. However, despite its strong performance on conventional field data, the model encounters limitations when applied to extremely complex and rare geological conditions—such as irregular formations involving faults or caverns. Under such conditions, the model architecture may struggle to capture abrupt and highly nonlinear variations in drilling rate, leading to a noticeable decline in prediction accuracy. Additionally, the CTLSF model involves a relatively high computational cost, approximately three times slower than a standard LSTM, which may pose challenges for real-time industrial applications. In future work, we plan to validate the model on multiple oilfield datasets with varying geological conditions to further assess its generalization capability.
The data-driven nature of the model has dual advantages. It not only provides effective technical support for the real-time optimization of drilling automation but also opens up new opportunities for the intelligent development of the oil and gas industry. Looking ahead, future research should focus on three key areas: (1) enhancing model adaptability through continuous learning systems; (2) extending physical parameter integration (especially real-time bit wear monitoring); and (3) developing standardized protocols for cross-domain deployment. These advances will further solidify the role of AI solutions in the industry’s transition to fully automated drilling operations. Through ongoing optimization and validation, the model is expected to provide a technical blueprint and practical demonstration of how machine learning can change the traditional drilling optimization paradigm, providing a template for subsequent innovations in petroleum engineering applications.
Author Contributions
Conceptualization, Formal analysis, Funding acquisition, Project administration, Supervision, Writing—original draft, Y.H.; Resources, and Validation, Investigation, W.Y.; Data curation, Methodology, Writing—review and editing, J.H.; Software, and Visualization, Y.Z. All authors have read and agreed to the published version of the manuscript.
Funding
This research was funded by the Science and Technology Research Program of the Chongqing Municipal Education Commission (No. KJQN202403212); BAYU Scholar Program (YS2024074); Doctoral Fund of Chongqing Industry Polytechnic College (No. 2024GZYBSZK1-17).
Data Availability Statement
The original contributions presented in this study are included in the article. Further inquiries can be directed to the corresponding author.
Conflicts of Interest
Author Yihang Zhao was employed by the Electric Power Development Research Institute Co., Ltd. The remaining authors declare that the research was conducted in the absence of any commercial or financial relationships that could be construed as a potential conflict of interest.
Abbreviations
| MD | Measured Depth |
| TVD | True Vertical Depth |
| RPMA | Rotary Per Minute of Annulus |
| WOBA | Weight On Bit Average |
| MFIA | Mud Flow In Average |
| MDIA | Mud Density In Annulus |
| MDOA | Mud Density Out Annulus |
| HKLA | Hook Load Average |
| TQA | Torque Average |
| SPPA | Stand Pipe Pressure Average |
| BDTI | Bit Drill Time |
| ROP | Rate of Penetration |
References
- Ahmed, O.S.; Adeniran, A.A.; Samsuri, A. Computational Intelligence-Based Prediction of Drilling Rate of Penetration: A Comparative Study. J. Pet. Sci. Eng. 2019, 172, 1–12. [Google Scholar] [CrossRef]
- Zhang, C.; Song, X.; Su, Y.; Li, G. Real-Time Prediction of Rate of Penetration by Combining Attention-Based Gated Recurrent Unit Network and Fully Connected Neural Networks. J. Pet. Sci. Eng. 2022, 213, 110396. [Google Scholar] [CrossRef]
- Barbosa, L.F.F.M.; Nascimento, A.; Mathias, M.H.; de Carvalhoet, J.A. Machine learning methods applied to drilling rate of penetration prediction and optimization—A review. J. Pet. Sci. Eng. 2019, 183, 106332. [Google Scholar] [CrossRef]
- Wang, M.; Xiang, D.; Qu, Y.; Li, G. The Diagnosability of Interconnection Networks. Discrete Appl. Math. 2024, 357, 413–428. [Google Scholar] [CrossRef]
- Xiang, D.; Hsieh, S.Y. G-Good-Neighbor Diagnosability under the Modified Comparison Model for Multiprocessor Systems. Theor. Comput. Sci. 2025, 1028, 115027. [Google Scholar]
- Wang, M.; Xiang, D.; Wang, S. Connectivity and Diagnosability of Leaf-Sort Graphs. Parallel Process. Lett. 2020, 30, 2040004. [Google Scholar] [CrossRef]
- Al-AbdulJabbar, A.; Elkatatny, S.; Mahmoud, M.; Abdulraheem, A. Predicting rate of penetration using artificial intelligence techniques. In Proceedings of the SPE Kingdom of Saudi Arabia Annual Technical Symposium and Exhibition, Dammam, Saudi Arabia, 23–26 April 2018; p. SPE-192343. [Google Scholar]
- Elkatatny, S. New approach to optimize the rate of penetration using artificial neural network. Arab. J. Sci. Eng. 2018, 43, 6297–6304. [Google Scholar] [CrossRef]
- Elkatatny, S. Real-Time Prediction of Rate of Penetration While Drilling Complex Lithologies Using Artificial Intelligence Techniques. Ain Shams Eng. J. 2021, 12, 917–926. [Google Scholar] [CrossRef]
- Wang, M.; Ren, Y.; Lin, Y.; Wang, S. The tightly super 3-extra connectivity and diagnosability of locally twisted cubes. Am. J. Comput. Math. 2017, 7, 127–144. [Google Scholar] [CrossRef]
- Wang, M.; Wang, S. Connectivity and Diagnosability of Center k-ary n-Cubes. Discrete Appl. Math. 2021, 294, 98–107. [Google Scholar] [CrossRef]
- Liu, C.F.; Liu, Y.; Zhou, D.H.; Wang, Y.; Dun, Y. An unsupervised chatter detection method based on AE and merging GMM and K-means. Mech. Syst. Signal Process. 2023, 186, 109861. [Google Scholar] [CrossRef]
- Sun, X.; Yang, Z.; Xia, M.; Xia, M.; Liu, C.; Zhou, Y.; Guo, Y. Tool condition monitoring model based on DAE–SVR. Machines 2025, 13, 115. [Google Scholar] [CrossRef]
- Wang, S.; Wang, Y.; Wang, M. Connectivity and matching preclusion for leaf-sort graphs. J. Interconnect. Netw. 2019, 19, 1940007. [Google Scholar] [CrossRef]
- Wang, M.; Lin, Y.; Wang, S. The connectivity and nature diagnosability of expanded k-ary n-cubes. RAIRO-Theor. Inform. Appl.-Inform. Théor. Appl. 2017, 51, 71–89. [Google Scholar] [CrossRef]
- Jiang, J.; Wu, L.; Yu, J.; Wang, M.; Kong, H.; Zhang, Z.; Wang, J. Robustness of Bilayer Railway-Aviation Transportation Network Considering Discrete Cross-Layer Traffic Flow Assignment. Transp. Res. Part D Transp. Environ. 2024, 127, 104071. [Google Scholar] [CrossRef]
- Diaz, M.B.; Kim, K.Y. Improving Rate of Penetration Prediction by Combining Data from an Adjacent Well in a Geothermal Project. Renew. Energy 2020, 155, 1394–1400. [Google Scholar] [CrossRef]
- Bai, K.K.; Sheng, M.; Zhang, H.B.; Fan, H.H.; Pan, S.W. Real-time drilling torque prediction ahead of the bit with just-in-time learning. Pet. Sci. 2025, 22, 430–441. [Google Scholar] [CrossRef]
- Liu, N.; Zhang, D.; Gao, H.; Hu, Y.; Duan, L. Real-time measurement of drilling fluid rheological properties: A review. Sensors 2021, 21, 3592. [Google Scholar] [CrossRef]
- Hegde, C.; Daigle, H.; Millwater, H.; Gray, K. Analysis of Rate of Penetration (ROP) Prediction in Drilling Using Physics-Based and Data-Driven Models. J. Pet. Sci. Eng. 2017, 159, 295–306. [Google Scholar] [CrossRef]
- Li, Q.; Li, J.P.; Xie, L.L. A Systematic Review of Machine Learning Modeling Processes and Applications in ROP Prediction in the Past Decade. Pet. Sci. 2024, 21, 2901–3674. [Google Scholar] [CrossRef]
- Skrobek, D.; Krzywanski, J.; Sosnowski, M.; Kulakowska, A.; Zylka, A.; Grabowska, K.; Nowak, W. Implementation of deep learning methods in prediction of adsorption processes. Adv. Eng. Softw. 2022, 173, 103190. [Google Scholar] [CrossRef]
- Alsaihati, A.; Elkatatny, S.; Gamal, H. Rate of penetration prediction while drilling vertical complex lithology using an ensemble learning model. J. Pet. Sci. Eng. 2022, 208, 109335. [Google Scholar] [CrossRef]
- Gan, C.; Cao, W.H.; Wu, M.; Chen, X.; Hu, Y.L.; Liu, K.Z.; Wang, F.W.; Zhang, S.B. Prediction of Drilling Rate of Penetration (ROP) Using Hybrid Support Vector Regression: A Case Study on the Shennongjia Area, Central China. J. Pet. Sci. Eng. 2019, 181, 106200. [Google Scholar] [CrossRef]
- Ashrafi, S.B.; Anemangely, M.; Sabah, M.; Ameri, M.J. Application of Hybrid Artificial Neural Networks for Predicting Rate of Penetration (ROP): A Case Study from Marun Oil Field. J. Pet. Sci. Eng. 2019, 175, 604–623. [Google Scholar] [CrossRef]
- Khalifa, H.; Tomomewo, O.S.; Ndulue, U.F.; Zhang, Y.; Ali, M. Machine learning-based real-time prediction of formation lithology and tops using drilling parameters with a web app integration. Eng 2023, 4, 2443–2467. [Google Scholar] [CrossRef]
- Soares, C.; Gray, K. Real-Time Predictive Capabilities of Analytical and Machine Learning Rate of Penetration (ROP) Models. J. Pet. Sci. Eng. 2019, 172, 934–959. [Google Scholar] [CrossRef]
- Yang, H.; Li, Z.; Gao, L.; Zhang, J.; Chen, X.; Zhang, L.; Li, R.; Wang, Z. Real-Time Inversion of Formation Drillability and Concurrent Speedup Strategies for Microdrilling Time Optimization. SPE J. 2025, 30, 1806–1821. [Google Scholar] [CrossRef]
- Chen, X.; Du, X.; Weng, C.; Yang, J.; Gao, D.; Su, D.; Wang, G. A real-time drilling parameters optimization method for offshore large-scale cluster extended reach drilling based on intelligent optimization algorithm and machine learning. Ocean Eng. 2024, 291, 116375. [Google Scholar] [CrossRef]
- Gan, C.; Cao, W.H.; Liu, K.Z.; Wu, M. A Novel Dynamic Model for the Online Prediction of Rate of Penetration and Its Industrial Application to a Drilling Process. J. Process Control 2022, 109, 83–92. [Google Scholar] [CrossRef]
- Pei, Z.J.; Song, X.Z.; Wang, H.T.; Shi, Y.Q.; Tian, S.C.; Li, G.S. Interpretation and Characterization of Rate of Penetration Intelligent Prediction Model. Pet. Sci. 2024, 21, 582–596. [Google Scholar] [CrossRef]
- Caicedo, H.U.; Calhoun, W.M.; Ewy, R.T. Unique ROP Predictor Using Bit-Specific Coefficient of Sliding Friction and Mechanical Efficiency as a Function of Confined Compressive Strength Impacts Drilling Performance. In Proceedings of the SPE/IADC Drilling Conference and Exhibition, Amsterdam, The Netherlands, 23–25 February 2005; Society of Petroleum Engineers: Dallas, TX, USA, 2005; p. SPE-92576. [Google Scholar]
- Cao, W.; Mei, D.; Guo, Y.; Ghorbani, H. Deep learning approach to prediction of drill-bit torque in directional drilling sliding mode: Energy saving. Measurement 2025, 250, 117144. [Google Scholar] [CrossRef]
- Bhatt, D.; Patel, C.; Talsania, H.; Patel, J.; Vaghela, R.; Pandya, S.; Modi, K.; Ghayvat, H. CNN Variants for Computer Vision: History, Architecture, Application, Challenges, and Future Scope. Electronics 2021, 10, 2470. [Google Scholar] [CrossRef]
- Swapna, G.; Soman, K.P.; Vinayakumar, R. Automated Detection of Diabetes Using CNN and CNN-LSTM Network and Heart Rate Signals. Procedia Comput. Sci. 2018, 132, 1253–1262. [Google Scholar] [CrossRef]
- Liu, S.; Xu, T.; Du, X.; Zhang, Y.; Wu, J. A Hybrid Deep Learning Model Based on Parallel Architecture TCN-LSTM with Savitzky-Golay Filter for Wind Power Prediction. Energy Convers. Manag. 2024, 302, 118122. [Google Scholar] [CrossRef]
- Huang, R.; Wei, C.; Wang, B.; Yang, J.; Xu, X.; Wu, S.; Huang, S. Well Performance Prediction Based on Long Short-Term Memory (LSTM) Neural Network. J. Pet. Sci. Eng. 2022, 208, 109686. [Google Scholar] [CrossRef]
- Cai, S.; Gao, H.; Zhang, J.; Peng, M. A Self-Attention-LSTM Method for Dam Deformation Prediction Based on CEEMDAN Optimization. Appl. Soft Comput. 2024, 159, 111615. [Google Scholar] [CrossRef]
- Pan, S.; Yang, B.; Wang, S.; Guo, Z.; Wang, L.; Liu, J.; Wu, S. Oil Well Production Prediction Based on CNN-LSTM Model with Self-Attention Mechanism. Energy 2023, 284, 128701. [Google Scholar] [CrossRef]
Disclaimer/Publisher’s Note: The statements, opinions and data contained in all publications are solely those of the individual author(s) and contributor(s) and not of MDPI and/or the editor(s). MDPI and/or the editor(s) disclaim responsibility for any injury to people or property resulting from any ideas, methods, instructions or products referred to in the content. |
© 2025 by the authors. Licensee MDPI, Basel, Switzerland. This article is an open access article distributed under the terms and conditions of the Creative Commons Attribution (CC BY) license (https://creativecommons.org/licenses/by/4.0/).