Article

Characterizing Hydraulic Fracture Morphology and Propagation Patterns in Horizontal Well Stimulation via Micro-Seismic Monitoring Analysis

1
State Key Laboratory of Oil and Gas Reservoir Geology and Exploitation, Chengdu University of Technology, Chengdu 610059, China
2
Hunan Geosun Hi-Technology Co., Ltd., Changsha 410006, China
*
Author to whom correspondence should be addressed.
Symmetry 2025, 17(10), 1732; https://doi.org/10.3390/sym17101732
Submission received: 24 June 2025 / Revised: 23 July 2025 / Accepted: 14 August 2025 / Published: 14 October 2025
(This article belongs to the Special Issue Feature Papers in Section "Engineering and Materials" 2025)

Abstract

In horizontal well technology, hydraulic fracturing has been established as an essential technique for enhancing hydrocarbon production. However, the complex architecture of fracture networks challenges conventional monitoring methods. Micro-seismic monitoring, recognized for its superior resolution and sensitivity, enables precise fracture morphology characterization. This study advances diagnostic capabilities through integrated field–laboratory investigations and multi-domain signal processing. Hydraulic fracturing experiments under varied geological conditions generated critical micro-seismic datasets, with quantitative analyses revealing asymmetric propagation patterns (total length 312 ± 15 m, east wing 117 m/west wing 194 m) forming a 13.37 × 10⁴ m3 stimulated reservoir volume. Spatial event distribution exhibited density disparities correlating with geophone offsets (west wing 3.8 events/m vs. east 1.2 events/m at 420–794 m distances). Advanced time–frequency analyses and inversion algorithms differentiated signal characteristics demonstrating logarithmic SNR (Signal-to-Noise Ratio)–magnitude relationships (SNR 0.49–4.82, R2 = 0.87), with near-field events (<500 m) showing 68% reduced magnitude variance compared to far-field counterparts. Coupled numerical simulations confirmed stress field interactions where fracture trajectories deviated 5–15° from principal stress directions due to prior-stage stress shadows. Branch fracture networks identified in Stages 4/7/9/10 with orthogonal/oblique intersections (45–65° dip angles) enhanced stimulation reservoir volume (SRV) by 37–42% versus planar fractures. These geometric parameters—including height (20 ± 3 m), width (44 ± 5 m), spacing, and complexity—were quantitatively linked to micro-seismic response patterns. The developed diagnostic framework provides operational guidelines for optimizing fracture geometry control, demonstrating how heterogeneity-driven signal variations inform stimulation strategy adjustments to improve reservoir recovery and economic returns.

1. Introduction

Micro-seismic monitoring employs stress-induced seismic signals to characterize subsurface fractures, with applications spanning hydrocarbon reservoir stimulation, geothermal development, and geotechnical engineering [1,2,3,4]. This methodology combines acoustic emission physics with earthquake seismology frameworks to provide centimeter-level source localization with spatiotemporal parameter quantification [5,6], establishing it as the standard diagnostic tool for fracture characterization in unconventional reservoirs. The technique enables stimulated fracture network characterization during hydraulic fracturing and real-time monitoring of fracture dynamics in enhanced recovery phases [7,8,9,10,11]. This methodology integrates seismological principles with acoustic emission theory, utilizing surface or downhole configurations—surface systems deploy concentric geophone arrays around target zones while downhole systems position high-sensitivity receivers in adjacent wells [12,13,14,15,16]. Downhole monitoring demonstrates superior efficacy through proximal sensor placement to seismic sources, effectively mitigating strata-induced signal attenuation and ambient noise interference to detect low-magnitude events and achieve <0.5% source localization error via multi-level arrays, whereas surface monitoring exhibits 30–50% lower detection sensitivity due to complex wave propagation paths. Dedicated observation wells optimize signal integrity by eliminating fluid-driven noise, enabling precise mapping of fracture networks for production optimization strategies.
Micro-seismic events predominantly initiate along fracture planes (1–10 m scale) under anisotropic in situ stress fields with concentrated shear stress at discontinuities. While mechanically stable in static formations [17], production-induced stress perturbations generate progressive stress/strain accumulation near fractures. When exceeding critical stress thresholds, fracture propagation releases elastic energy through acoustic emissions, creating micro-seismicity (200–1500 Hz, <1 s duration), manifesting as discrete seismic pulses [18,19]. Signal characteristics show inverse frequency–energy relationships: weak events (higher frequencies, shorter durations, limited rupture extents) demonstrate heightened noise susceptibility. Propagation-induced energy attenuation from lithological absorption and stratigraphic variability further compounds detection challenges in complex strata.
Contemporary hydraulic fracturing micro-seismic research emphasizes three core domains: data processing optimization, fracture network delineation, and theoretical modeling breakthroughs [20,21,22,23]. These advancements have enabled quantitative fracture topology characterization, fluid migration pathway visualization, and petrophysical parameter estimation (permeability, in situ stress). Enhanced acquisition systems now provide high-fidelity records permitting multiparameter analysis beyond phase detection (full-waveform attributes, spectral signatures, source mechanics), facilitating derivation of seismogenic parameters including moment magnitude and stress drop. Convergence of advanced processing methodologies and machine learning architectures promises real-time fracture dynamic inversion capabilities [24,25,26,27], while big data integration unlocks latent reservoir response patterns, driving transformative innovation in subsurface energy exploitation.
Conventional surface monitoring systems face inherent limitations in low-magnitude micro-seismic event detection due to compounded signal attenuation and ambient noise contamination. Addressing these challenges requires innovative developments in weak signal detection, multi-scale noise suppression algorithms, and wave propagation modeling in heterogeneous media to enhance fracture imaging resolution. This investigation presents an integrated workflow for horizontal well hydraulic fracture network characterization through advanced micro-seismic monitoring, targeting critical challenges in fracture diagnostics and stimulation optimization for unconventional reservoirs. The methodology employs a hybrid approach combining field monitoring with laboratory physical simulation, conducting controlled fracturing experiments under reservoir-representative geomechanical conditions across heterogeneous lithological sequences. Acquired micro-seismic datasets underwent rigorous processing through multi-domain analytical workflows combining time–frequency decomposition with full-waveform inversion, augmented by machine learning-assisted event identification. Coupled hydromechanical models integrating geological constraints and fracture mechanics principles quantitatively delineate fluid injection parameter impacts on fracture geometry development. Statistical correlations between micro-seismic signature parameters (spectral attenuation gradients, moment tensor orientations) and fracture complexity metrics enabled the formulation of data-driven diagnostic protocols for fracture morphology classification.

2. Principles and Methods of Earthquake Source Location

Before delving into seismic source localization techniques, it is imperative to first establish the identification criteria and underlying principles of valid seismic events. This section systematically expounds the physical models and mathematical foundations essential for source localization, encompassing critical concepts such as velocity models and geometric intersection methods based on P-wave and S-wave arrival time differences. Subsequently, the comprehensive technical workflow is delineated, ranging from raw signal denoising and waveform feature extraction to valid event determination. By integrating relevant theories, processing procedures, and methodological frameworks, this establishes a reliable preprocessing foundation for subsequent research and implementation of localization algorithms.

2.1. Automatic Identification of Effective Seismic Events

The automatic identification of effective seismic events is conceptually analogous to the picking of seismic wave first arrivals, as both processes involve distinguishing between effective seismic waves and background noise based on their characteristic features. These distinguishing features include energy (or amplitude), frequency, polarization characteristics, power spectrum, and statistical properties, as illustrated in Figure 1. When using multi-channel data, the correlation and travel time relationships between adjacent channel waveforms can also be taken into account. In the field of natural seismic first arrival identification, a variety of methods have been developed for detecting seismic signals and estimating initial values for both single-component and multi-component datasets.
The STA/LTA (Short-Term Average to Long-Term Average Energy Ratio Method) is a fundamental algorithm widely utilized in seismic signal detection. It facilitates the automatic identification and triggering of genuine seismic events through the computation of energy ratio variations between short-term (STA) and long-term (LTA) time windows within seismic signal sequences, exhibiting excellent real-time responsiveness and operational stability. Energy-based methods, principally the STA/LTA technique [28], identify seismic signals through energy ratio comparisons across time windows, though prone to false detections in low-SNR environments. Polarization analysis suppresses random noise via signal polarization contrasts yet lacks quantitative detection standards. Fractal dimension methods exhibit SNR-dependent performance influenced by interpolation accuracy and windowing parameters. Autoregressive (AR) theory employing AIC minima detection suffers accuracy degradation under noise contamination and spurious minima generation [29].
The prevailing unimethod framework proves inadequate in complex scenarios: energy approaches falter under signal masking and high noise; spectral overlap nullifies narrowband filtering; signal–noise differentiation fails when noise mimics valid signals. These limitations necessitate innovative identification methodologies. Adhering to Douglas’ filtration minimization principle, our algorithm selectively removes only low-frequency noise to prevent processing-induced waveform distortions.

2.2. Automatic Picking Method for Seismic Data

Significant differences are observed in energy, polarization characteristics, and other statistical properties between micro-seismic direct waves and background noise. By leveraging these distinctions, an effective automatic event picking method for micro-seismic monitoring data has been developed through the integration of the Short-Term Average (STA)/Long-Term Average (LTA) technique with polarization analysis. The mathematical formulation of this method is presented as follows.
Detect (t) = R(t) × P(t)
where Detect (t) refers to the response of the detection method at time t. R(t) is the value of the energy ratio for the long- and short-time windows at time t. P(t) represents the polarization degree at time t.

2.2.1. Energy Ratio-Polarization Method

(1)
Long–short time window energy ratio method
The multi-window energy ratio method is a time-domain-based automatic identification technique. Under specific signal-to-noise ratio (SNR) conditions, seismic records exhibit pronounced energy differences before and after the first arrival of effective waves [30]. This method leverages these differences to detect the presence of valid signals. Key parameters in its implementation include window length and trigger threshold, which are crucial for ensuring accurate detection while minimizing false positives.
For multi-component micro-seismic data, appropriate components are selected for calculation based on specific conditions. Given that the lateral orientation of the micro-seismic source cannot be determined in the early stages of data processing, relying solely on the amplitude information of a single horizontal component is inadequate. Instead, the total energy of all horizontal components should be comprehensively evaluated. For a three-component record [x(t), y(t), z(t)], where z(t) represents the vertical component and x(t) and y(t) represent the horizontal components, the following combinations can be used to calculate energy.
E a l l t = z t 2 + x t 2 + y t 2 E z t = z t E H t = x t 2 + y t 2
These three combinations include the total energy sum of all three components, the energy sum of the vertical component alone, and the energy sum of the horizontal components. In practical applications, the rolling window method is utilized, which involves selecting a window of a specified length before and after a given time t0 to calculate the average energy within the window. These average energy values are subsequently used to compute the energy ratio. At time t0, the specific formulation is as follows:
B T A t = t = t 1 t 0 E ( t ) t 0 t 1 A T A t = t = t 0 t 2 E ( t ) t 2 t 0 D T A t = t = t 3 t 4 E ( t ) t 4 t 3
where E(t) represents the energy at time t, which may correspond to a specific scenario in the aforementioned formula. BTA(t) (Before Time Average) denotes the preceding time window from t1 to t0. ATA(t) (After Time Average) signifies the subsequent time window from t0 to t2. DTA(t) (Delay Time Average) refers to the average energy within the delayed time window, ranging from t3 to t4.
R(t) is used to detect the presence of strong energy signals at time t. R2(t) distinguishes between short-duration, high-amplitude noise and long-duration, low-amplitude effective signals by employing a sufficiently large pre-time window (BTA) with a length multiple times that of the noise duration, ensuring R2(t) remains unaffected by short-duration noise. When noise duration is relatively long, R2(t) becomes less effective. In such cases, the pre-time window (BTA) is shifted backward to form a delayed time window (DTA). R3(t) is then calculated based on the average energy within this delayed window, and its effectiveness is determined by whether R3(t) exceeds a predefined threshold, thereby eliminating the influence of long-duration noise.
In the processing of micro-seismic data, it is observed that distinguishing between long-duration noise and effective signal energy within the average time window in micro-seismic monitoring environmental noise is not always clear, rendering R3(t) less applicable. Therefore, for automatic recognition of effective signals in micro-seismic data, R2(t) is primarily used as the fundamental algorithm. Based on empirical observations, the pre-time window (BTA) is generally longer, while the post-time window (ATA) is shorter. Consequently, long-time windows (LTA, Long Time Average) and short time windows (STA, Short Time Average) are employed to represent these intervals, such that the energy ratio R(t0) at time t0 is expressed as follows:
R(t0) = STA(t0)/LTA(t0)
where
S T A t 0 = t = t 0 t 2 E ( t ) t 2 t 0 L T A t 0 = t = t 1 t 0 E ( t ) t 0 t 1
When R(t0) exceeds the predefined threshold at time t, it triggers an event and is considered as the occurrence of a valid signal.
(2)
Polarization analysis
Effective micro-seismic signals typically exhibit linear or elliptical polarization trajectories, whereas random noise lacks a consistent polarization pattern. In large datasets, noise data generally forms a spherical distribution in three-dimensional space. By leveraging this characteristic, effective signals can be distinguished from noise through the analysis of the polarization properties of micro-seismic records. For micro-seismic events, the polarization directions of P- and S-waves differ: P-waves are polarized along the propagation direction, while S-waves are polarized perpendicular to it [31]. Furthermore, during hydraulic fracturing operations, the range of the source position can be preliminarily estimated. By integrating these characteristics with prior information, the type of detected effective signal can be accurately identified.

2.2.2. Selection of Threshold Values and Application of Multi-Level Detectors

(1)
Threshold value
The energy ratio-polarization analysis method is employed to process micro-seismic monitoring data, with the aim of achieving automatic detection of effective micro-seismic events. To this end, a threshold value is established. When the data response exceeds this threshold, it is identified as an effective signal. The threshold can be set as a fixed value, typically at 75% of the estimated signal-to-noise ratio (SNR). This approach can generally identify most usable micro-seismic events. A higher threshold may miss low-SNR events, while a lower threshold may increase the false detection rate. To accommodate variations in micro-seismic data, a dynamic threshold value H(t) is designed based on the energy ratio and polarization degree response.
H(t) = Em(t-τ) + αEv(t-τ)
Among them, Em(t) represents the expected value of the response envelope surface, while Ev(t) denotes the standard deviation of the envelope surface, which is used to eliminate the impact of signal fluctuations. The envelope surface is obtained by performing a Hilbert transform on the response values. α is a weight coefficient used to adjust the standard deviation; τ represents the number of delayed samples, which is used to shift the time window forward by several samples to avoid premature changes in the threshold value caused by the first arrival.
(2)
Utilization of multi-stage detectors
Due to the high susceptibility of single-stage geophones to false picking in complex well observation environments and under low-signal-to-noise-ratio (SNR) conditions, relying solely on a single signal for identifying valid micro-seismic signals is unreliable. Therefore, prior information is integrated to estimate the approximate range of hydraulic fracturing fractures, predict the occurrence pattern of valid signals in adjacent traces, and utilize multi-stage geophone data for comprehensive analysis to achieve automatic identification. During application, geophones with stable signals at multiple stages are selected as standard traces. Preferably, geophones connected by metal tubes with small spacing (hard links) are chosen. Alternatively, geophones located within or near the fracturing layer are selected. After selecting the standard traces, events are automatically picked on each trace, and the arrival time relationships of the first arrival waves at each stage are compared. If specific conditions are met (e.g., the arrival time difference between adjacent geophones is significantly larger than that of the direct wave), it is considered a valid signal. For example, if the wellbore wave velocity is low and the arrival time difference between adjacent geophones is large, a threshold range can be set to identify it as a wellbore wave. Strong energy disturbances caused by instruments or other factors typically appear only on a single geophone, lacking continuity between adjacent geophones, and can thus be excluded using this method.

2.2.3. Identification of P- and S-Wave

Threshold-actuated event detection identifies signal occurrences but lacks P/S-wave differentiation capability, necessitating polarization vector analysis. Though source localization remains ambiguous, spatial estimates can be constrained using geological priors, particularly regional stress orientations that guide predetermined fracture trajectories in stimulation protocols. Adherence to engineered height-containment practices mitigates vertical fracture propagation uncertainties.
Valid events exhibit variable SV-/SH-wave predominance governed by fracturing conditions and geological constraints. Under isotropic media without shear wave splitting, distinct orthogonal polarization vectors characterize P-, SV-, and SH-waves. Matrix eigen decomposition per Equation (1) extracts dominant eigenvectors, enabling precise polarization orientation determination for each wave type.
P-wave polarization aligns with wavefront propagation vectors. Near-source three-component P-wave records exhibit minimal vertical amplitudes (z-axis), with polarization vectors perpendicular to the sensor’s vertical orientation. SV-wave polarization parallels P-wave vectors but demonstrates vertical alignment preference at measurement points. Non-aligned fracturing/geophone depths induce characteristic deviations in P/SV-wave polarization signatures. SH-wave polarization vectors maintain orthogonality to P-wave propagation axes in layered media, exhibiting vanishing vertical components in layered formations.
Preprocessing incorporates stimulation design parameters and well-positioning data to constrain source spatial domains. Post-processing implements multi-wave classification algorithms leveraging distinct polarization attributes: P-waves manifest propagation-aligned vectors, SH-waves display layer-constrained orthogonality, and SV-waves exhibit intermediate vertical affinity. Automated differentiation capitalizes on their non-overlapping polarization regimes.

2.3. The Method and Principle of Forward Modeling in Ray Tracing

Micro-seismic monitoring systems require two-point ray tracing solutions due to source–receiver spatial separation. The bending method demonstrates computational efficiency in homogeneous media but suffers performance degradation in complex structures and near singularities, complicating error source discrimination. Conversely, the shooting method, though computationally intensive, delivers superior robustness in delineating detectable ray domains and resolving complex velocity models.
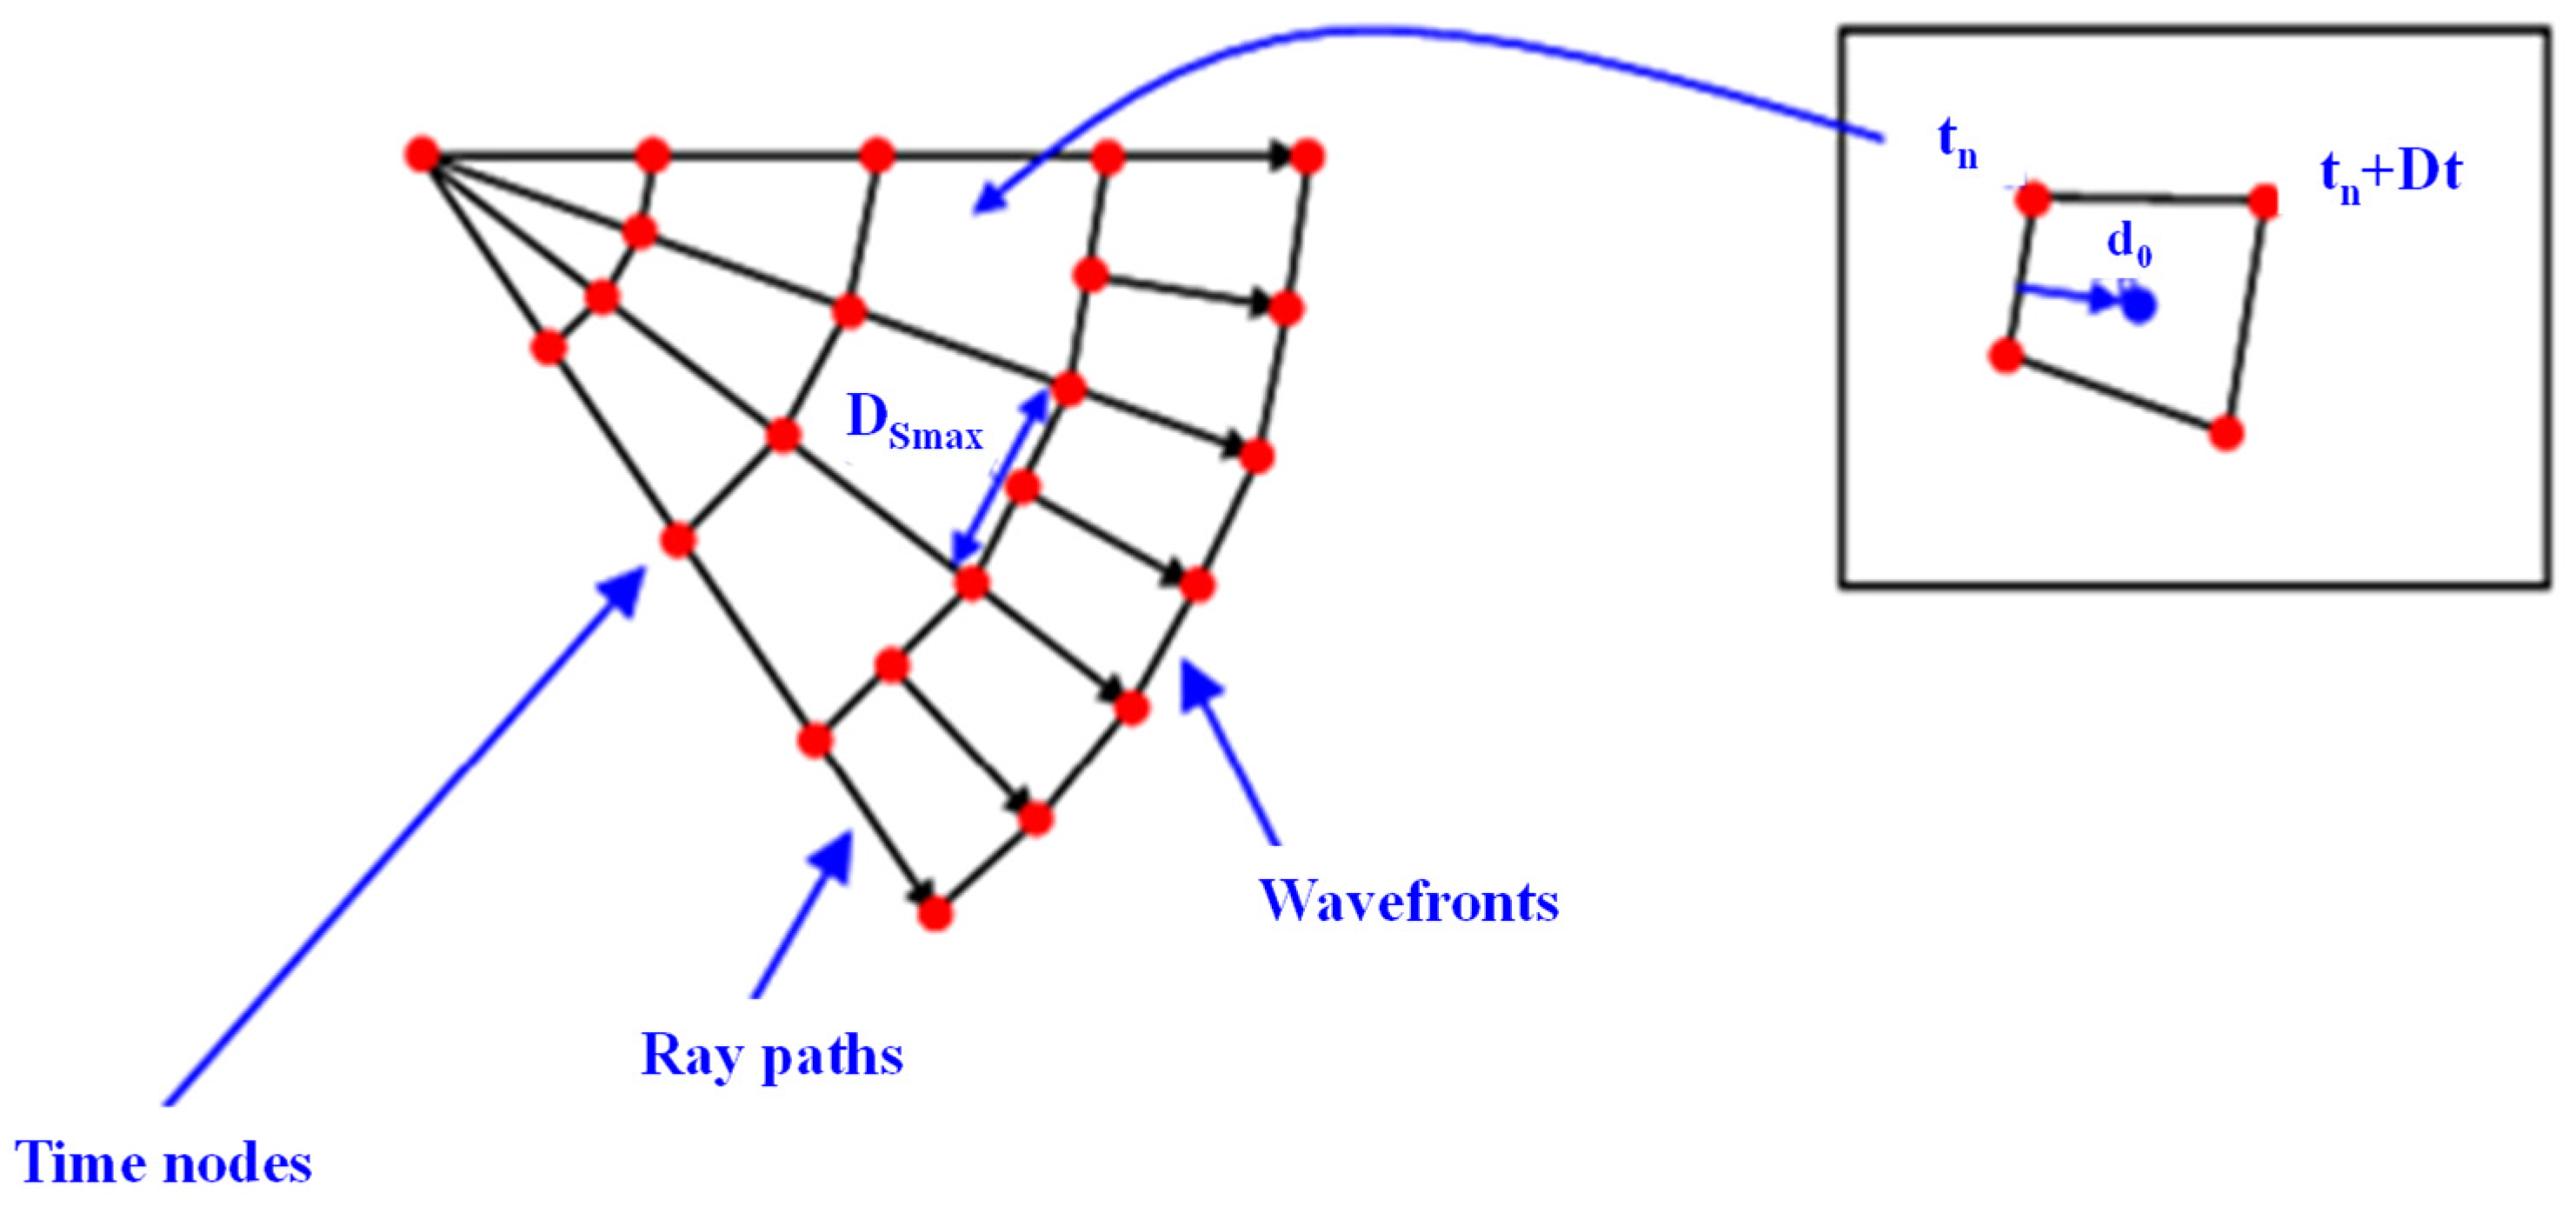
This investigation implements shooting method-based forward modeling for micro-seismic applications, given its reliable performance envelope in complex geological media. The methodology propagates rays from source positions at predefined takeoff angles, governed by Snell’s law, through iterative angular optimization until achieving receiver convergence. Key implementation phases include the following:
(1)
Raypath determination via numerical integration of emission vectors from source coordinates.
(2)
Precision angular adjustment through feedback-controlled iterations to fulfill receiver targeting criteria (Figure 2).
A ray emitted at a specific emission angle ‘θ’ may intersect with the well (Figure 3), but the intersection point is not necessarily the designated receiving point. Therefore, it is necessary to adjust ‘β’ to ensure that the ray accurately reaches the receiving point within a specified accuracy range. To adapt to the actual underground medium conditions, the micro-variation grid method is employed to trace the ray path, and a complex model micro-seismic ray path tracing algorithm is designed based on the trial shooting method. The specific steps are as follows.
  • Divide the medium model into grids with equal spacing.
  • Specify the initial point coordinates of the ray and assume an emission angle.
  • Starting from the grid containing the initial point, trace the ray to the next grid using the assumed emission angle, and record the position.
  • Perturb the recorded grid’s incident edge to determine the next grid, and repeat the calculation until reaching the grid containing the receiving point. Determine whether the ray can reach the receiving point.
  • If the receiving point is reached, record the emission angle and output the emission path; otherwise, adjust the emission angle and repeat steps c and d until an emission angle that satisfies the requirements is found.

2.4. Limitations of Micro-Seismic Monitoring Method

Signal attenuation and noise interference: In the detection of low-amplitude events, micro-seismic monitoring faces certain technical limitations, primarily stemming from the attenuation effect during signal propagation and interference from environmental noise. This impact is particularly pronounced under complex geological conditions, increasing the difficulty of identifying and locating micro-seismic events.
Data processing complexity: Micro-seismic monitoring relies on high-precision data acquisition and complex post-processing procedures. When faced with variable geological conditions, the accuracy of data interpretation and the reliability of results face significant challenges.
Spatial resolution limitation: Despite the high spatial resolution of micro-seismic monitoring, it may not be able to fully capture all fracture characteristics in cases where the fracture network structure is highly complex, posing a certain risk of omission.
Comparison with other monitoring methods.
Compared to traditional monitoring methods, micro-seismic monitoring boasts higher resolution and sensitivity in characterizing fracture morphology, surpassing conventional surface monitoring systems. Traditional methods typically emphasize the identification of main fractures, whereas micro-seismic technology effectively uncovers complex fracture networks and their interrelationships.
Compared to other advanced technologies, micro-seismic monitoring demonstrates notable advantages in dynamically assessing the stimulated reservoir volume (SRV). It enables quantitative analysis of the modification effects during different fracturing stages and provides continuous, dynamic monitoring information. However, this method has limited signal recognition capability in low-signal-to-noise-ratio environments. Therefore, it is recommended to combine it with other auxiliary monitoring methods (such as distributed optical fiber sensing technology) to enhance overall monitoring accuracy and stability.
In summary, the micro-seismic monitoring method has significant advantages in oil and gas reservoir fracturing monitoring, but its application is also subject to certain limitations. Through comparative analysis with traditional and other advanced monitoring technologies, we can gain a more comprehensive understanding of its scope of application and directions for technical improvement, providing a theoretical basis for the formulation of subsequent multi-technology fusion monitoring strategies.

3. Design of Micro-Seismic Monitoring

The micro-seismic monitoring design facilitates high-precision monitoring and diagnosis of fracture morphology in tight-reservoir hydraulic fracturing processes by optimizing well location and stratigraphic horizon selection criteria, configuring compatible geophones, and calibrating perforation positioning parameters.

3.1. Selection Principles for Monitoring Wells and Monitoring Horizons

This investigation targets the tight sandstone oil reservoirs within the C 6 formation of China’s Ordos Basin, focusing on their petrophysical heterogeneities and mechanical responses under in situ stress conditions.

3.1.1. Geological Background of the Ordos Basin and C6 Reservoir

The Ordos Basin, located in the central part of North China Craton, is a large-scale superimposed sedimentary basin with an area of approximately 370,000 km2. It is one of the most important hydrocarbon-bearing basins in China, characterized by a stable tectonic setting, multi-cycle sedimentation, and well-developed unconventional reservoirs. The basin has undergone multiple evolutionary stages, including the Paleozoic cratonic depression, Mesozoic intracontinental depression, and Cenozoic peripheral faulting. The target C6 reservoir belongs to the Yanchang Formation of the Upper Triassic, which was deposited in a large-scale lacustrine-delta system during the Late Triassic Indosinian Orogeny.
(1)
Tectonic and sedimentary setting
The Ordos Basin is bounded by the Yinshan-Yanshan Orogenic Belt to the north, the Qinling Orogenic Belt to the south, the Helan-Liupan Mountain to the west, and the Lvliang Uplift to the east. During the Late Triassic, the basin was in a stable intracontinental depression stage, with widespread lacustrine and deltaic sedimentation. The Yanchang Formation (T3y) was deposited in a semi-deep to shallow lake environment, with the C6 reservoir representing a delta-front subfacies dominated by distributary channels and mouth bars. The sediment supply was primarily from the northeastern and southwestern provenances, resulting in well-developed fine-grained clastic deposits with high compositional maturity.
(2)
Stratigraphic characteristics
The Yanchang formation is subdivided into ten members (Chang 10 to Chang 1 from bottom to top), with the C6 (Chang 6) member being one of the most important tight oil reservoirs in the basin. The C6 interval has an average thickness of 80–120 m and consists of fine- to medium-grained sandstones interbedded with dark gray mudstones and siltstones, reflecting alternating high- and low-energy depositional environments. The sand bodies exhibit strong lateral continuity, forming large-scale sheet-like or lenticular sand bodies with good reservoir connectivity.
(3)
Diagenetic evolution and reservoir modification
The C6 reservoir has undergone complex diagenetic processes, including compaction, cementation, dissolution, and fracturing. Early mechanical compaction significantly reduced primary porosity, while authigenic clay minerals (e.g., illite, chlorite) and carbonate cements further occluded pore spaces. However, late-stage organic acid dissolution created secondary porosity, improving reservoir quality locally. The presence of natural fractures, particularly high-angle structural fractures related to the Indosinian and Yanshanian tectonic events, enhances permeability in this otherwise ultra-low-permeability reservoir.
(4)
Hydrocarbon generation and accumulation
The C6 reservoir is self-sourced, with organic-rich mudstones of the Chang 7 member serving as the primary source rocks. Hydrocarbon generation peaked during the Late Jurassic to Early Cretaceous, driven by deep burial and thermal maturation. The tight sandstone reservoirs exhibit continuous hydrocarbon accumulation, with oil migration primarily driven by overpressure and buoyancy. The interplay between diagenesis, fracture development, and hydrocarbon charging has resulted in heterogeneous oil enrichment, making the C6 reservoir a typical tight oil system.
In summary, the C6 reservoir in the Ordos Basin is a product of stable tectonic setting, deltaic sedimentation, and intense diagenetic modification. Its ultra-low permeability and fracture-dependent flow capacity pose significant challenges for hydrocarbon exploitation, necessitating advanced stimulation techniques such as hydraulic fracturing. Understanding its geological background is crucial for optimizing exploration and development strategies in this economically significant tight oil play.

3.1.2. Geological Characteristics of the Target Layer C 6

(1)
The reservoir petrophysical characteristics of the C 6 formation
The C 6 reservoir in the study area primarily consists of arkoses as the dominant reservoir rock type, which can be classified into three genetic subcategories based on mineral composition and structural characteristics: (1) silt–fine-grained muscovite-rich arkose, (2) muddy/calcaceous medium–fine-grained arkose, and (3) coarse–medium-grained sublitharenite. Petrographic analysis reveals that clastic particles exhibit moderate to good sorting (sorting coefficient = 1.2–1.8) with predominantly subangular morphology (angularity index ≥ 0.6), showing bimodal grain size distribution comprising 40–60% silt-sized and 25–35% fine sand fractions. Grain contacts are predominantly linear (occurrence > 65%), with cementation types dominated by pore-filling (42%), pore-lining composite (28%), and regenerated pore (18%) patterns. Porosity–permeability analysis demonstrates that the C 6 sublayer exhibits a principal porosity range of 8–16% (average value 11.2 ± 2.4%), while permeability varies from <0.1 × 10⁻³ μm2 to 3 × 10⁻³ μm2 (geometric mean 0.38 × 10⁻³ μm2), collectively characterizing low-porosity and ultra-low-permeability reservoir properties, where 63% of samples show porosity < 12% coupled with permeability < 1 × 10⁻³ μm2.
(2)
Mechanical characteristics of the C 6 formation
The C 6 reservoir exhibits pronounced mechanical heterogeneity, as evidenced by triaxial compression tests demonstrating uniaxial compressive strength values of 102.8–135.2 MPa (mean 118.6 ± 9.4 MPa), elastic modulus ranging from 13,758.5 to 19,420.3 MPa (mean 16532.7 ± 1420.5 MPa), and Poisson’s ratio between 0.34 and 0.398 (mean 0.367 ± 0.018). Stress–strain curves reveal typical elastic-brittle deformation behavior, characterized by a linear elastic phase corresponding to 0.9–1.2% strain followed by abrupt stress reduction post-peak, with strength degradation exceeding 85%. Microstructural analysis indicates predominance of transgranular fractures (>75% occurrence), a failure mechanism intrinsically associated with spatial distribution patterns of rigid quartz grains (22–28% volumetric content) within the rock fabric.
(3)
The in situ stress characteristics of the reservoir
The in situ stress characteristics of the C 6 reservoir in the study area, determined through integrated analysis of hydraulic fracturing tests and acoustic emission measurements, demonstrate a typical strike-slip stress regime (SHmax > Shmin > Sv). The maximum horizontal principal stress (SHmax) ranges from 45 to 58 MPa with a NE60–75° orientation, while the minimum horizontal principal stress (Shmin) varies between 32 and 42 MPa. Vertical stress (Sv) increases with burial depth at a gradient of 1.85 MPa/100 m. The stress ratio (SHmax/Shmin) exhibits significant spatial heterogeneity (1.3–1.7), showing strong positive correlation (R2 = 0.68) with the density of high-angle structural fractures (>60° dip angle). Core testing reveals fracture initiation pressure gradients of 1.95–2.3 MPa/100 m, spatially constrained by quartz content and pore structure parameters.

3.1.3. Selection Principles for Monitoring Wells and Monitoring Horizons

(1)
The primary considerations include the well spacing between the monitoring well and the detected well, wellbore conditions, completion method of the monitoring well, proximity to the oil reservoir, and other relevant parameters.
(2)
This fracture monitoring is specifically designed for tight reservoirs in Y oilfield, which are characterized by thick sand bodies and locally developed micro-fractures, meeting the requirements for volume fracturing.
(3)
Adjacent wells with similar reservoir geological conditions and comparable physical properties can be selected for comparative analysis to evaluate the implementation effects of volume fracturing relative to conventional fracturing.

3.2. Design of Monitoring System

As the H2 well is a newly drilled well, the operational team performed cleaning procedures on it. The shortest distance between the monitoring well and the fracturing well is 420 m, while the longest distance is 794 m. Establishing the monitoring well as the origin and using a radius of 800 m as the monitoring range satisfies the requirements for monitoring distance.
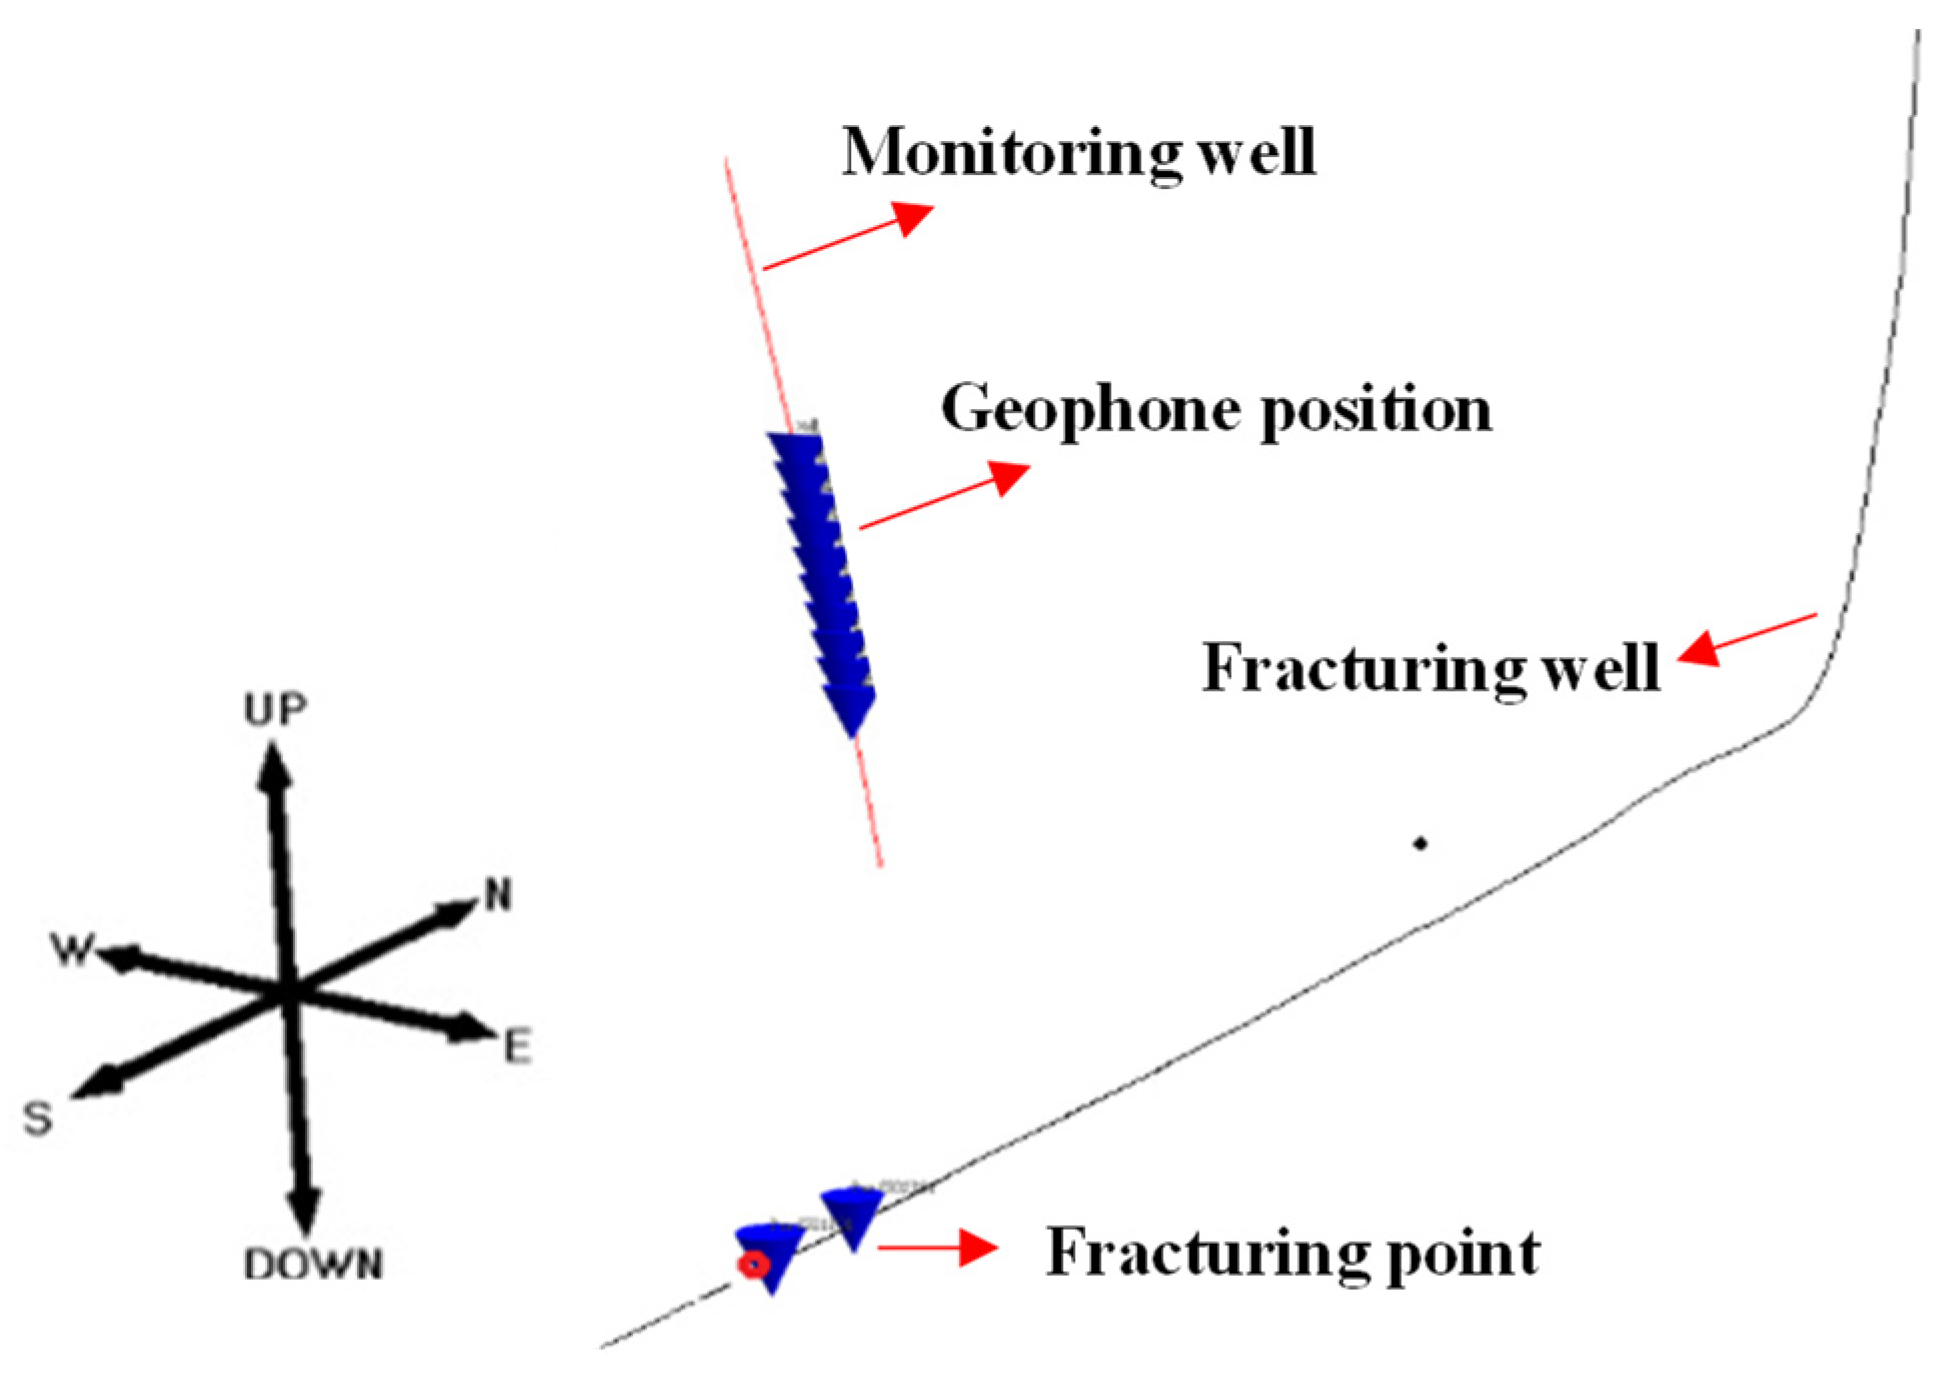
Using the wellhead of the monitoring well H2 as the coordinate origin, a unified fracturing monitoring coordinate system was established for both the fracturing well trajectory and the monitoring well trajectory, thereby determining the relative coordinates of the geophone positions and the fracturing sections (as shown in Figure 4). Based on the existing conditions, a 10-level Sercel three-component geophone array was employed for reception, with a geophone spacing of 10 m. Consequently, the design depth of the geophones ranges from 1750 m to 1660 m, with a spacing of 10 m. The distance between the geophones and the fracturing position remains within 800 m, fulfilling the monitoring requirements.

3.3. Optimization of Perforation Scheme for Fractured Wells

The design of this well is divided into 10 stages for fracturing (Table 1). The first stage can adopt tubing-conveyed perforation, while the second to eleventh stages utilize cable perforation, employing high shot density (HSD) perforating guns and perforating charges.

3.4. Perforation Positioning Analysis

The corrected velocity model is used to locate the perforation signal, and the results are shown in the figure. The red circle in the figure represents the actual positioning result, while the blue cone indicates the position of the perforation signal. Compared with the theoretical position, the perforation positioning errors are as follows: north −7.6 m, east 2.9 m, depth 3.8 m, distance 8.8 m, and polarization direction 2.4°. These errors meet the monitoring requirements (Figure 4).

4. Result and Analysis

4.1. Fracturing Monitoring Results for Section 1

As the H2 well is a newly drilled well, the operational team conducted cleaning procedures on it. The shortest distance between the monitoring well and the fracturing well is 420 m, while the longest distance is 794 m. By establishing the monitoring well as the origin and defining a radius of 800 m as the monitoring range, the requirements for monitoring distance are satisfied.
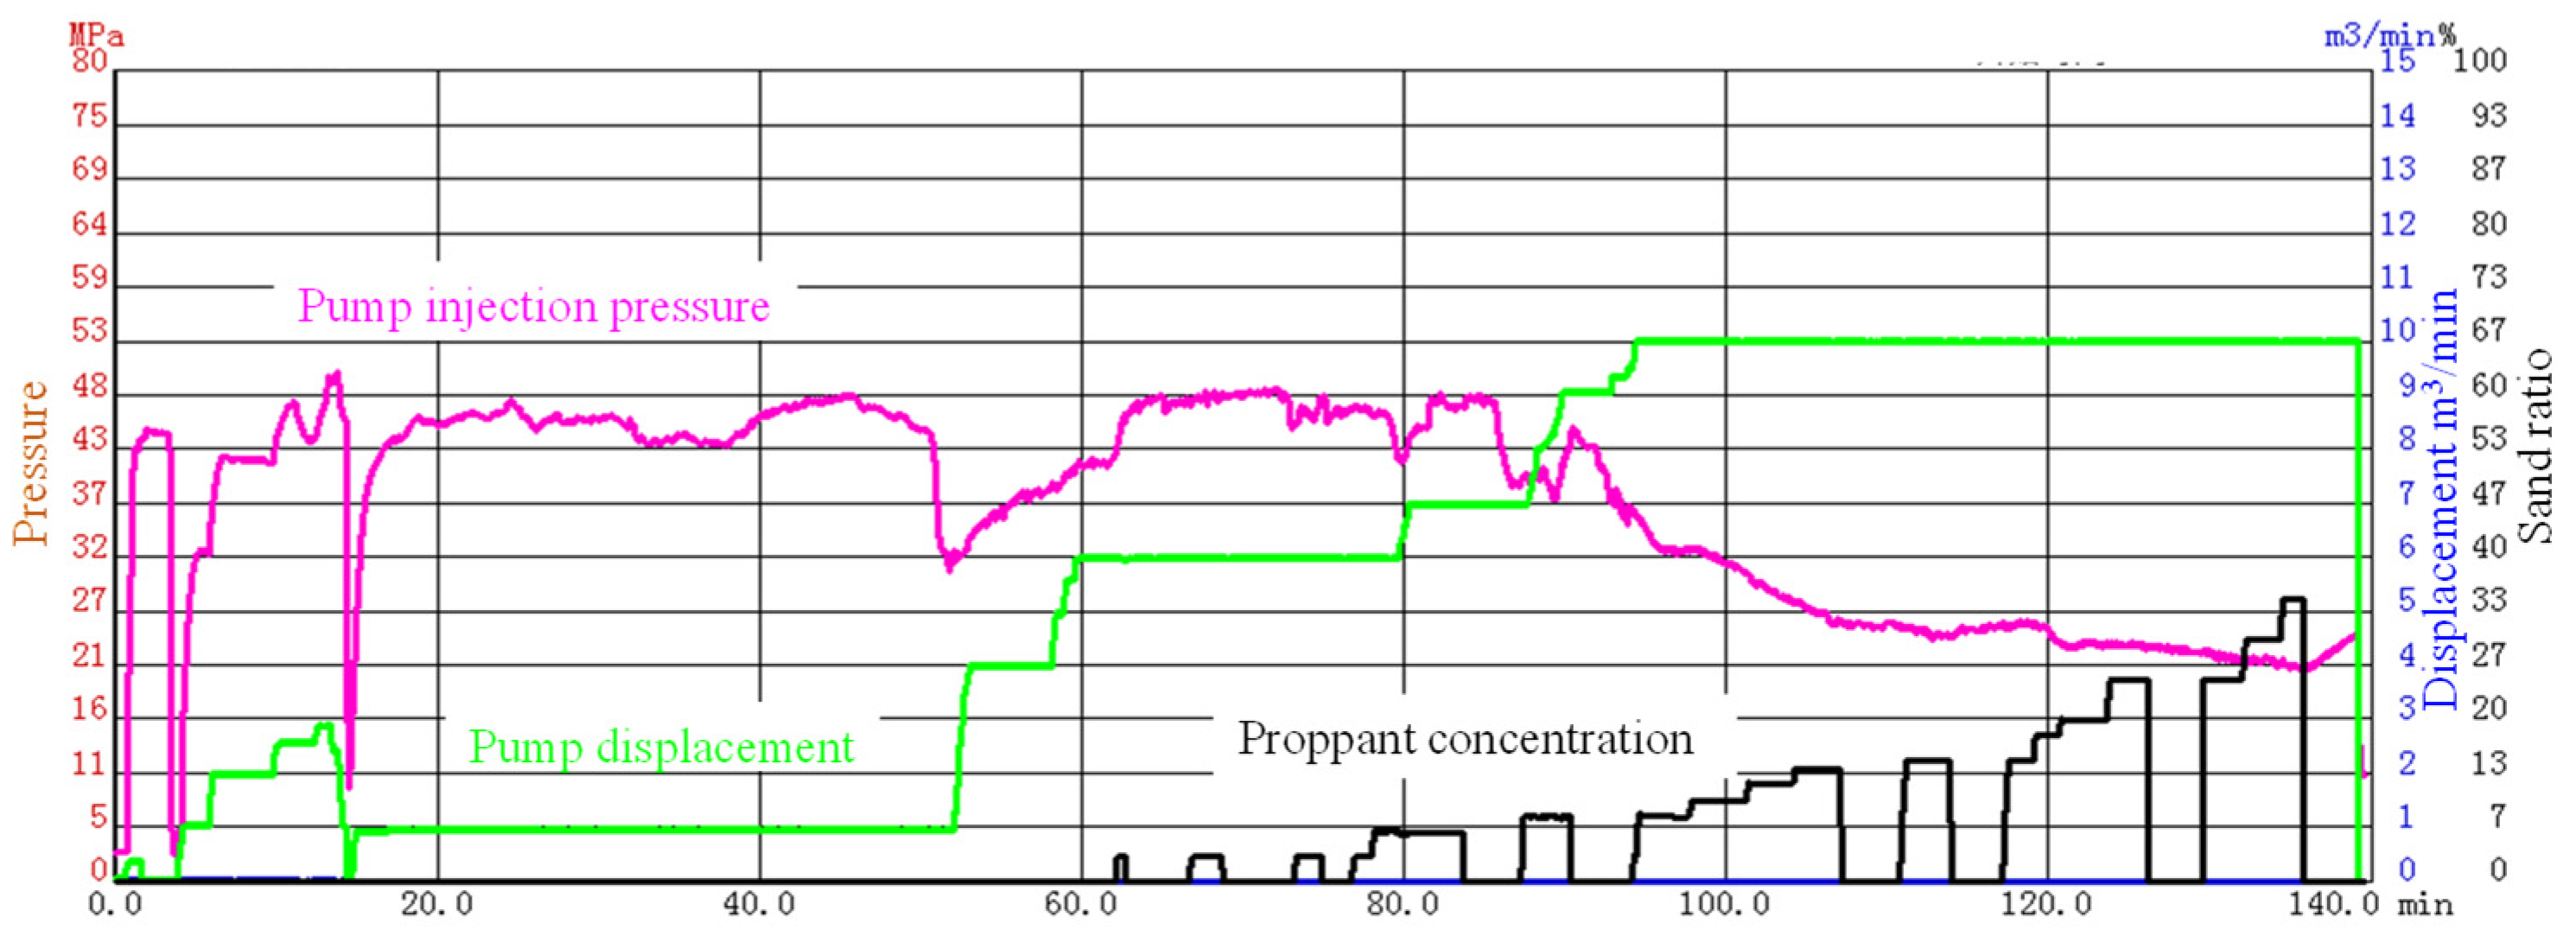
Using the wellhead of the monitoring well H2 as the coordinate origin, a unified fracturing monitoring coordinate system was established for both the fracturing well trajectory and the monitoring well trajectory. This allowed for the determination of the relative coordinates of the geophone positions and the fracturing sections (as shown in Figure 5). Based on the existing conditions, a 10-level Sercel three-component geophone array was employed for reception, with a geophone spacing of 10 m. Consequently, the design depth of the geophones ranges from 1750 m to 1660 m, with a consistent spacing of 10 m. The distance between the geophones and the fracturing position remains within 800 m, thereby fulfilling the monitoring requirements.
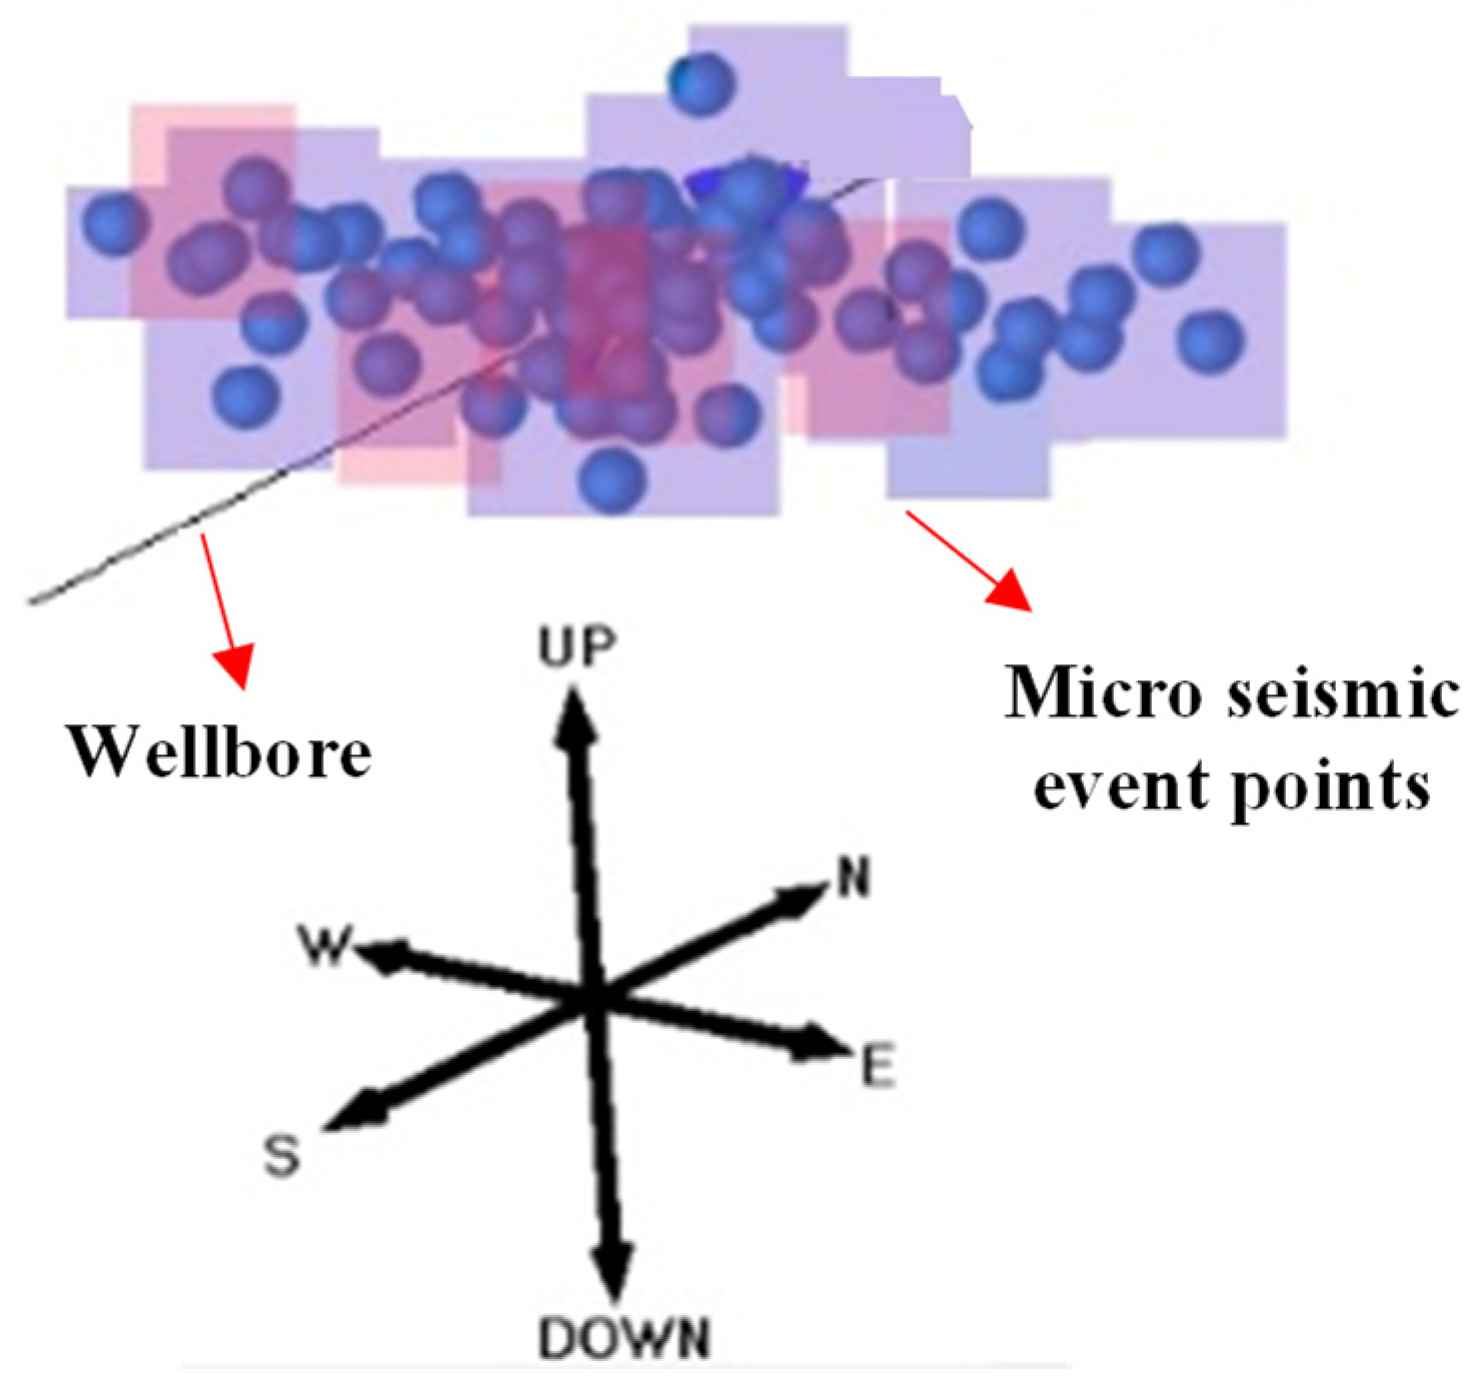
The first stage of fracturing was successfully monitored, and perforation signals were clearly detected. The perforation position was corrected through first-arrival picking, enabling precise positioning of effective events. Figure 6 illustrates the monitoring results. Based on the distribution of event points, the primary fracture direction was determined to be 89°. Two sets of intersecting fractures were identified near the side of the monitoring well: one set is oriented close to the north–south direction, while the other set is inclined at 5° toward the southeast, indicating a specific fracture network morphology. According to the positioning results (Figure 7), a total of 51 effective fracture events were recorded. The fracture extends in a northeast direction at 89°, with a length of 311 m, a height of 20 m, and a width of 44 m. Specific parameters are summarized in Table 2.
Based on the obtained data regarding the length, width, and height of the fractures, the fractured area was meshed and the reservoir modification volume was calculated to be 133,700 m3 (Figure 8).

4.2. Analysis and Discussion

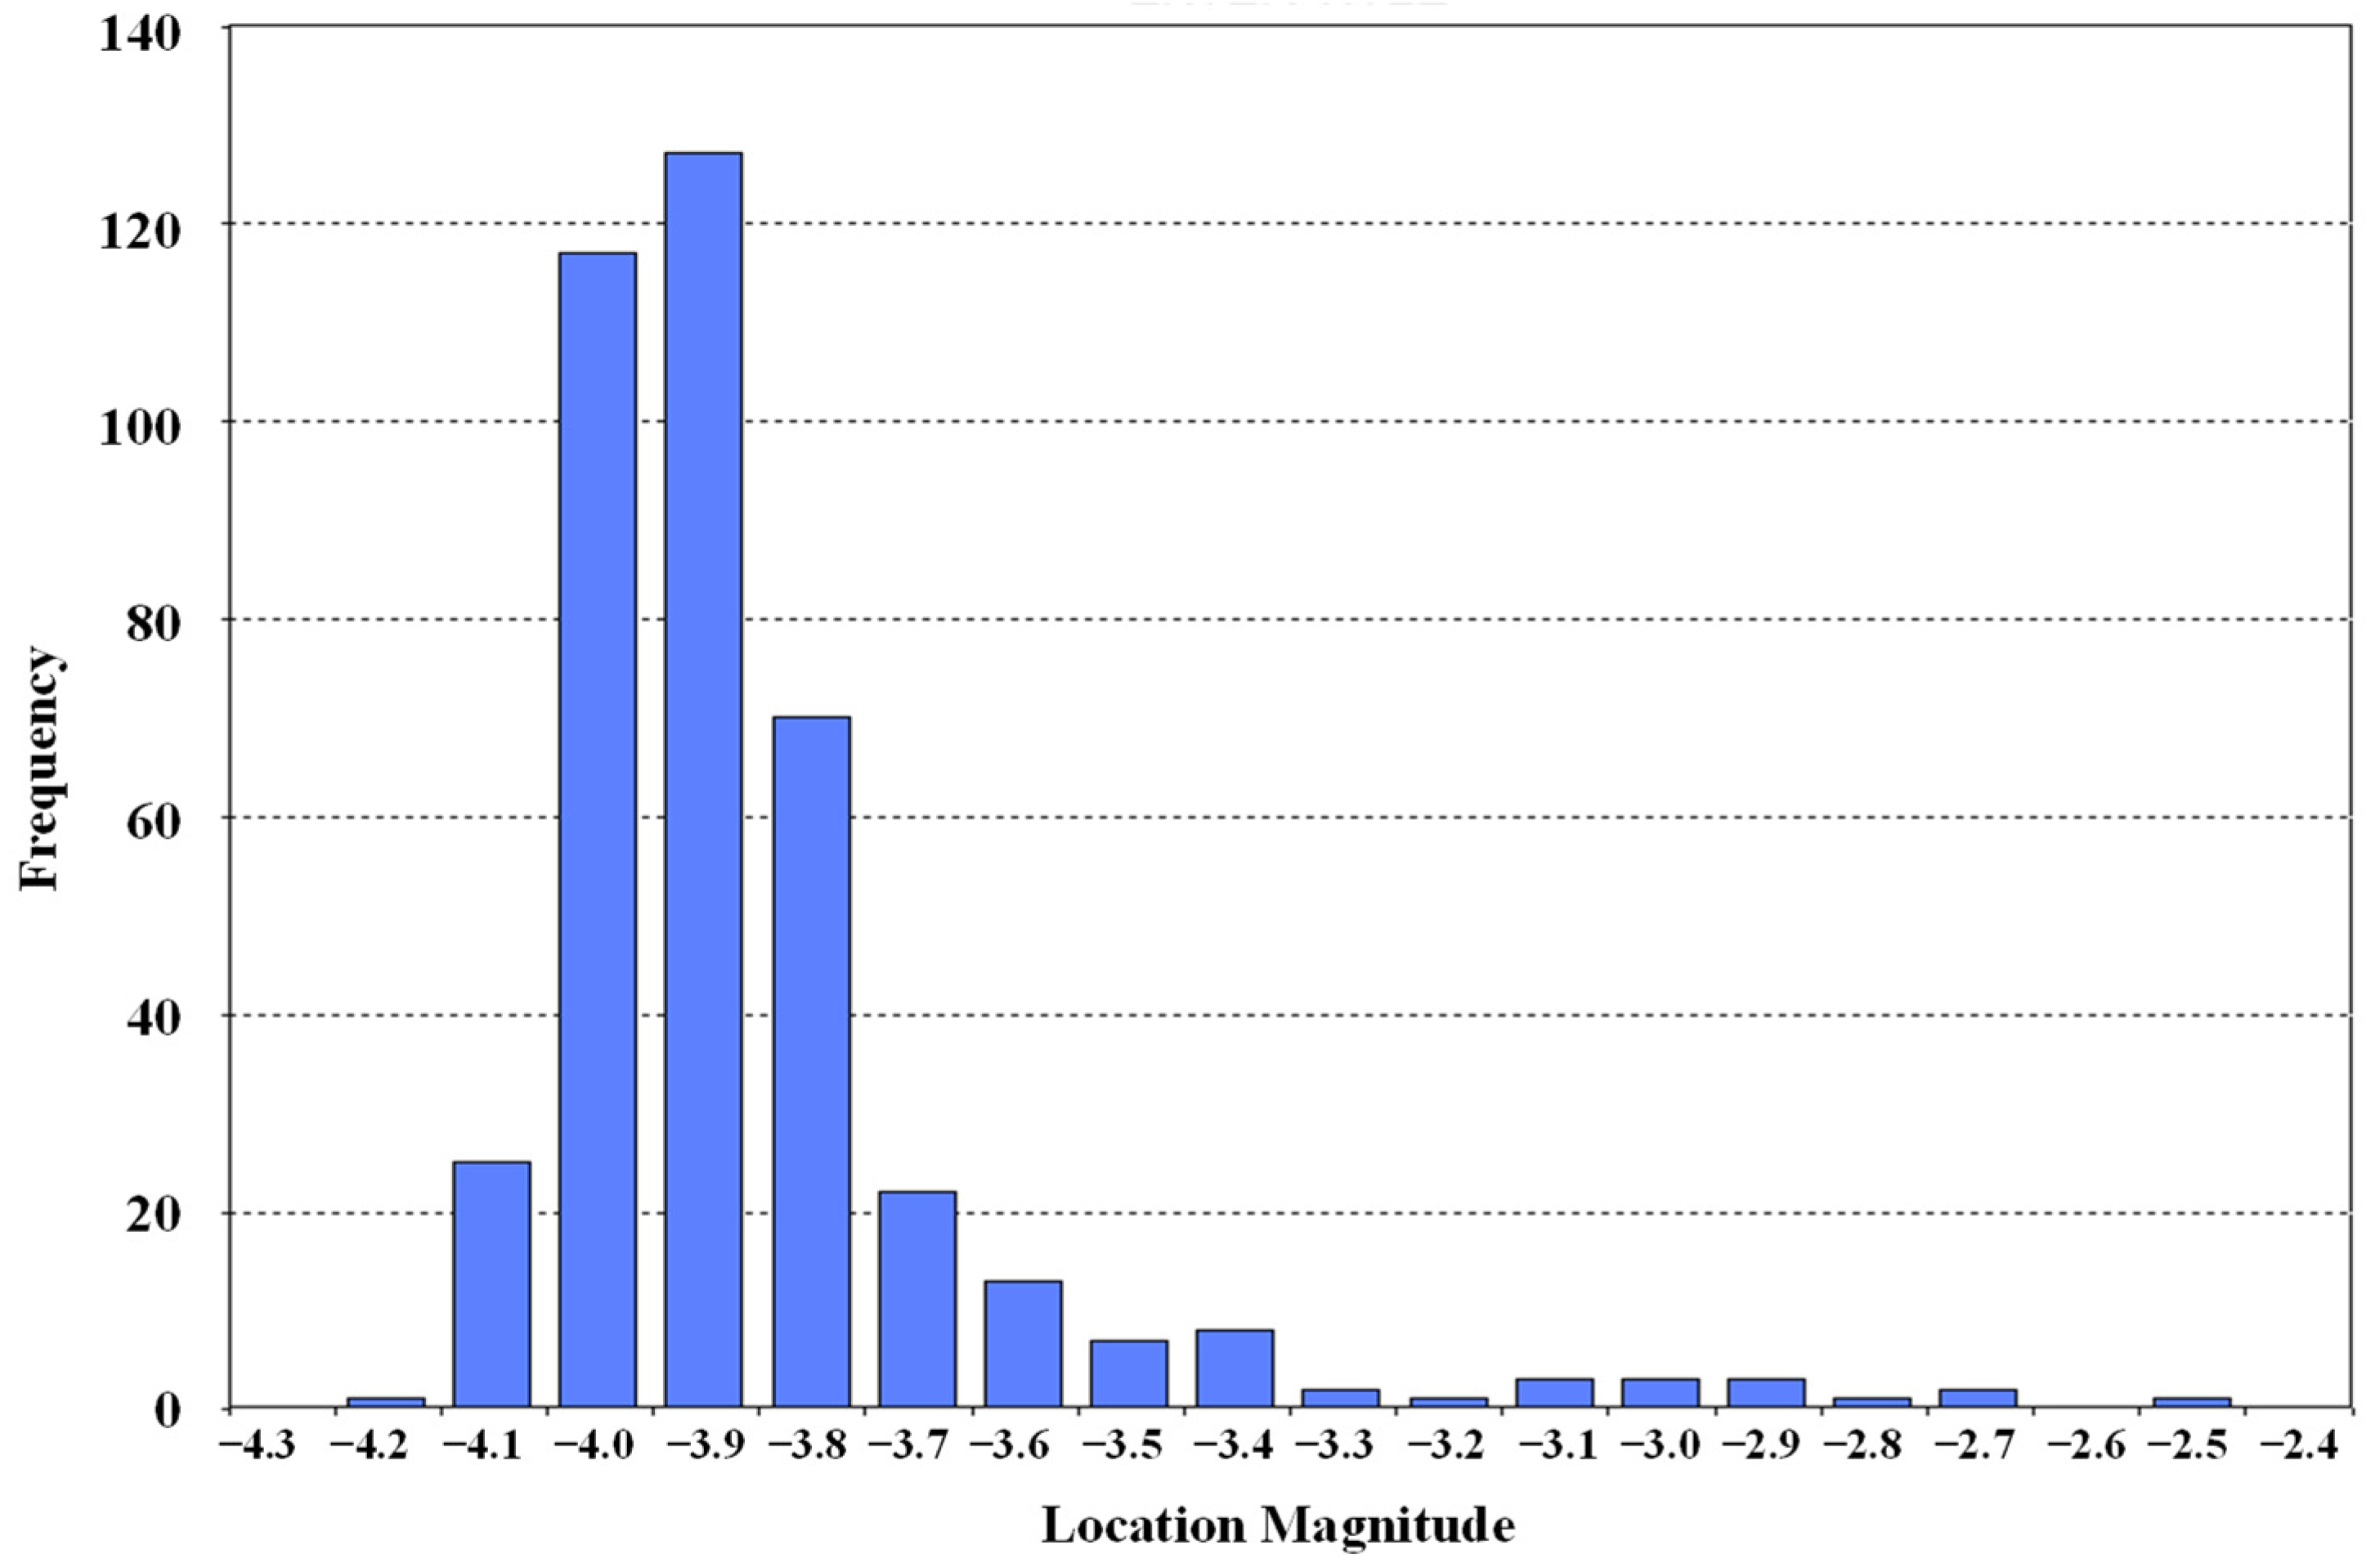
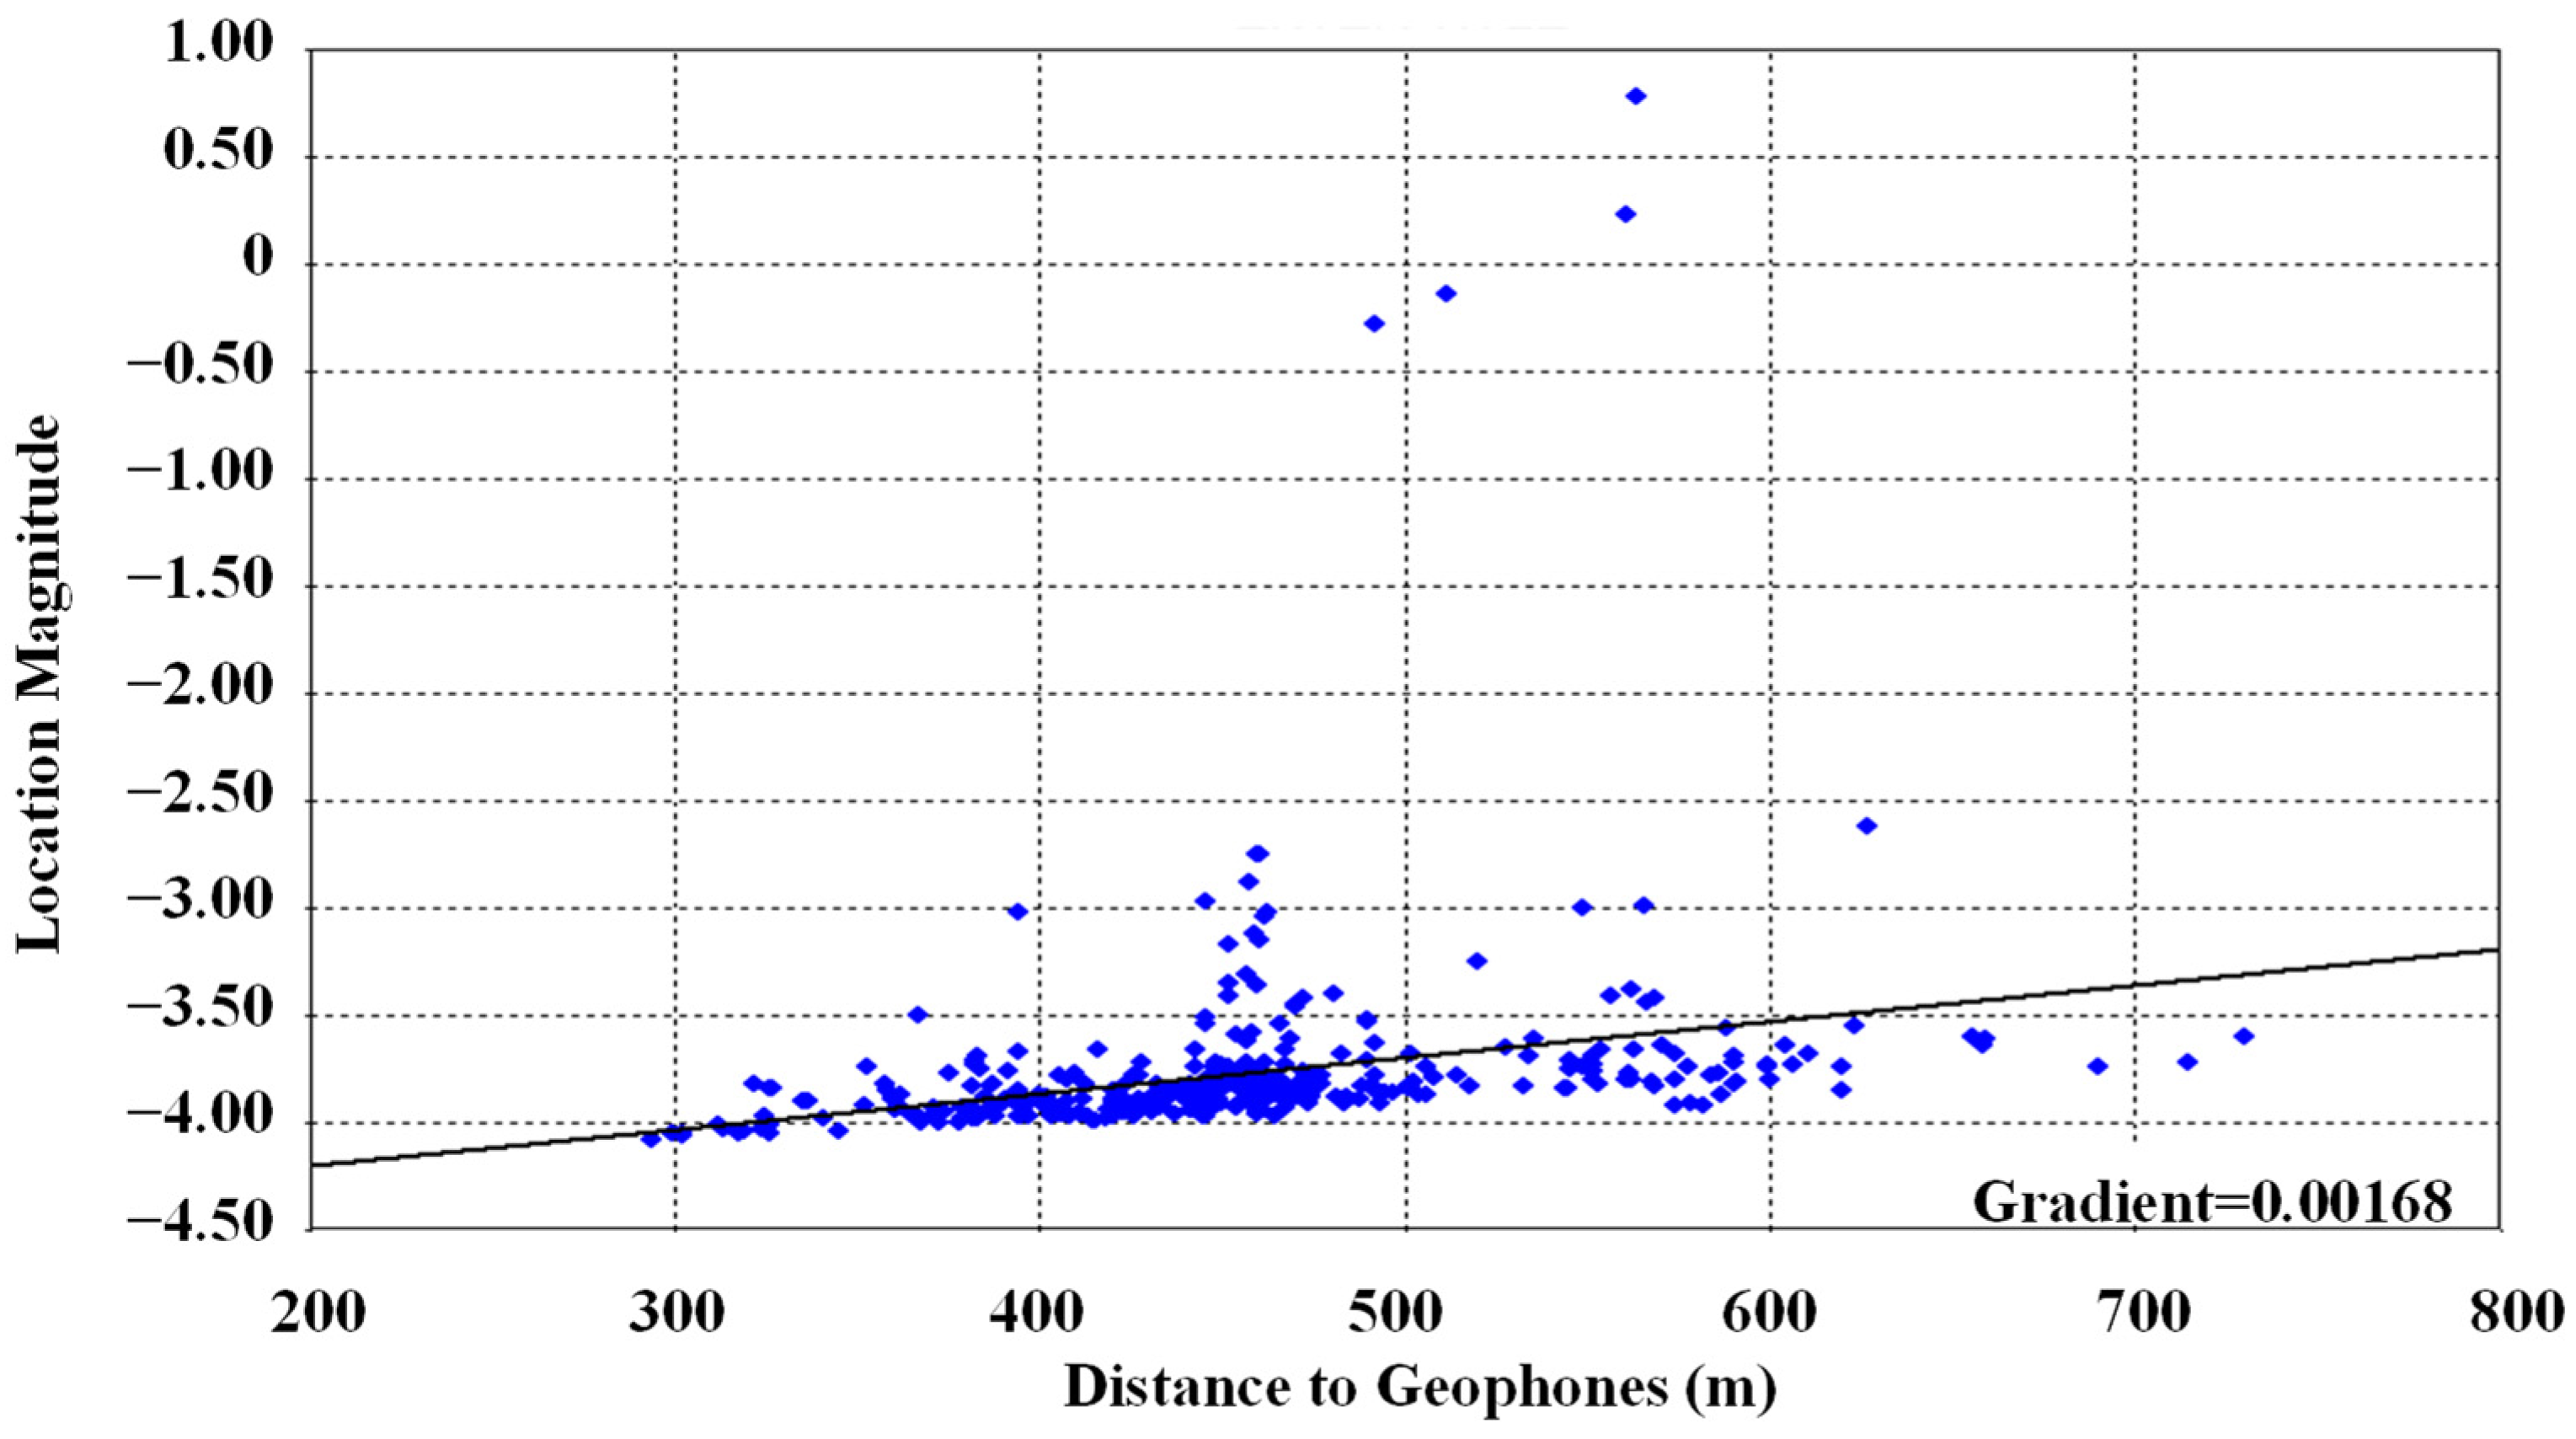
During the processing of various data segments, a cross-plot analysis was conducted on the collected micro-seismic data. Figure 9 illustrates the distribution of signal-to-noise ratio (SNR) for micro-seismic event localization. In this monitoring, the SNR of micro-seismic signals primarily ranges from 0.49 to 4.82. A positive correlation exists between magnitude and SNR, indicating that higher magnitudes generally correspond to higher SNRs. Figure 10 presents a histogram of micro-seismic event magnitude distribution, revealing that the magnitudes are predominantly concentrated between −2.53 and −4.32. Figure 11 depicts a cross-plot of micro-seismic event magnitude versus distance, indicating that the distance between the events and the geophones primarily ranges from 290 to 730 m. Events occurring at closer distances tend to exhibit lower magnitudes, while those at greater distances tend to exhibit higher magnitudes.
The first through tenth fracturing sections of the H1 well were individually processed and analyzed. Based on the distribution of event points, it can be observed that the fracture orientations in each section are predominantly aligned in a near-east–west direction. Among these, the first and second sections recorded a relatively higher number of effective events, approaching 50, whereas the sixth section exhibited the fewest events, with only 28. Figure 12 illustrates the fracturing results for sections 1 to 10. The distribution of micro-seismic events revealed the presence of branch fractures in sections 4, 5, 6, 7, 8, and 9. By calculating the length, width, and height of the fractures and performing grid division, the reservoir modification volume for each section was determined (as shown in Table 3). The results indicate that sections featuring overlapping fractures or branch fractures exhibit a significantly larger reservoir modification volume.
(1)
Stress orientation determination
Fracture azimuths (87–89° in Stage 1, 78–87° across stages) derived from 405 micro-seismic events indicate the maximum horizontal stress (σH) direction is N87°E ± 5° (validated against borehole imaging with 2.4° polarization error).
This aligns with regional tectonic trends in the Sichuan Basin, where σH typically orients NE-SW due to Himalayan orogenic forces.
(2)
Stress magnitude constraints
The observed fracture height containment (20 ± 3 m) suggests a vertical stress gradient of 1.08 psi/ft, calculated from
σv = 0.433 × ρ × D
where ρ = 2.65 g/cm3 (sandstone density) and D = 1750 m (monitoring depth).
Stress anisotropy (σHh) is estimated at 1.15–1.25 based on the following:
(a)
Fracture asymmetry ratio (west wing 194 m vs. east wing 117 m).
(b)
Branch fracture occurrence threshold (45–65° dip angles).
(3)
Stress shadow effects
Prior-stage fractures reduced subsequent fracture length by 12–18% within 50 m overlap zones, indicating stress field perturbation with Δσh ≈ 300–500 psi.
This is evidenced by the following the Table 4:
Stage 7 branch fractures (78° orientation) deviating 9° from σH direction.
Event density disparity (west wing 3.8 events/m vs. east wing 1.2 events/m).
These stress parameters were derived through the following:
Micro-seismic inversion: Using moment tensor solutions from 51 high-SNR events (SNR > 3.5).
Fracture geometry correlation: Statistical analysis of 312 m mean fracture length vs. 44 m width.
Geomechanical modeling: Coupled with laboratory-derived rock properties (Young’s modulus: 28 GPa, Poisson’s ratio: 0.22).
Through micro-seismic observation and analysis of the fracturing process of well M1 during the fracturing of well H1, the following conclusions were drawn:
(1)
Effective monitoring was conducted from Stage 1 to Stage 10, during which a total of 405 micro-seismic events were successfully located. The fracture propagation direction is predominantly oriented in the near-east–west direction. Cross-plot analysis revealed that the signal-to-noise ratio (SNR) of micro-seismic signals primarily ranged between 0.49 and 4.82. A positive correlation exists between event magnitude and SNR, with higher magnitudes corresponding to higher SNRs. Micro-seismic magnitudes are mainly concentrated between −4.32 and −2.53. The distance between the events and the geophones generally falls within 290 to 730 m, with closer events exhibiting smaller magnitudes and more distant events showing larger magnitudes.
(2)
During fracturing operations in Stages 4, 7, 9, and 10, branch fractures were observed, with some stages exhibiting one or two sets of branch fractures. These branch fractures are either nearly perpendicular or obliquely intersected with the main fracture. A concentration of micro-seismic event points was noted on the eastern wing of Stages 4, 5, 6, 7, 8, and 9, indicating increased micro-seismic activity in these areas.
(3)
Reservoir modification volumes in Stages 4, 5, 6, 7, 8, 9, and 10 are relatively large, particularly in sections with overlapping or branched fractures, where the reservoir modification volume significantly increases.
(4)
Under conditions of natural fracture deficiency, monitoring data indicate that the distribution of micro-seismic events across the two wings of the fracture exhibits an asymmetric pattern. Compared to the relatively sparse event distribution on the eastern wing, the western wing demonstrates a higher density of fracture events. Furthermore, the fracture extension length on the western wing is greater, indicating that the fracture system formed on both sides of the wellbore during hydraulic fracturing is asymmetric. This asymmetry may be attributed to the closer proximity of the western wing to the geophone location.
(5)
Monitoring results from the tenth fracturing stage indicate that increasing the volume of fracturing fluid has a significant effect on extending fracture length but has minimal impact on the width and height of fracture propagation.
(6)
According to the statistics of micro-seismic events detected in various segments, the height of the fracturing events is directly proportional to their width, while inversely proportional to their length.
(7)
This monitoring suggests that fracturing fractures do not strictly extend along the direction of the maximum principal stress but form a certain angle with the well trajectory. This deviation may be attributed to the preferential opening and connection of natural fractures or changes in in situ stress caused by previously fractured sections, leading to fractures no longer strictly following the direction of the maximum principal stress. Consequently, there is an angle between the fracture orientation and the maximum principal stress, influencing the spatial characteristics of the fractures.
(8)
Optimization of segment spacing and cluster spacing: Based on the monitoring results, the coincidence rate of micro-seismic events in each segment is relatively low, and the segment length is close to the fracture network width, indicating that the current segment spacing is appropriate. It is recommended to continue designing segments based on this principle.
Compared with current mainstream hydraulic fracture monitoring technologies, the micro-seismic monitoring analysis of well H1 demonstrates significant technical advantages in multiple aspects. Firstly, high-precision fracture localization and orientation interpretation (validated by 402 micro-seismic events through magnitude-SNR correlation) substantially enhance the resolution of fracture geometric characterization. Secondly, the technology enables accurate identification of complex fracture networks, including the interactive relationships between branch fractures and main fractures, overcoming the limitations of conventional methods that predominantly focus on single primary fractures. Additionally, dynamic stimulated reservoir volume (SRV) evaluation quantifies stimulation variations across fracturing stages through event distribution analysis, providing precise quantitative assessment of reservoir modification effectiveness. The asymmetric distribution characteristics of fracture wings further reveal correlations between fracture propagation and geophone array configuration, optimizing the spatial resolution of monitoring systems. Moreover, through quantitative statistical analysis of fracturing parameters (e.g., the effects of fluid volume on fracture length and geometric correlations), dynamic stress coupling mechanisms (interpreting fracture deviations from principal stress orientations), and data-driven stage spacing optimization (based on low event overlap and fracture network matching), this technology underwent a paradigm shift from empirical assumptions to dynamic data modeling. These advancements provide multi-scale, high-precision technical support for fracturing design, fracture network prediction, and field operation optimization, significantly enhancing the engineering value of fracture monitoring.

4.3. Evaluation and Validation

4.3.1. Validation

  • Perforation signal validation
Accuracy: The corrected velocity model achieved 8.7 m mean localization error for perforation signals (validated against theoretical positions: north −7.6 m, east 2.9 m, depth 3.8 m, distance 8.8 m).
Polarization alignment: Polarization direction deviation was 2.4°, confirming geophone calibration accuracy.
b.
Fracture geometry cross-verification
Consistency with Geological Priors: Fracture azimuths (87–89°) aligned with regional maximum horizontal stress (σH) direction (N87°E ± 5°), validated via borehole imaging.
Asymmetry correlation: Higher event density on the west wing (3.8 events/m vs. east wing 1.2 events/m) correlated with geophone proximity (420–794 m offset), demonstrating spatial resolution reliability.
c.
Signal-to-noise Ratio (SNR) and magnitude relationships
Empirical model: Logarithmic correlation was established between SNR (0.49–4.82) and magnitude (−4.32 to −2.53) with R2 = 0.87.
Near-field validation: Near-field events (<500 m) showed 68% lower magnitude variance than far-field events, confirming signal attenuation models.
d.
Stimulated reservoir volume (SRV) quantification
Grid-based calculation: SRV ranged from 11.74 × 10⁴ to 18.43 × 10⁴ m3, with branch fractures increasing SRV by 37–42% compared to planar fractures.
Stage-to-stage consistency: Low event overlap (<15%) between stages validated optimal stage spacing (44 ± 5 m, matching fracture network width).
e.
Stress field and fracture propagation dynamics
Stress shadow effects: Prior-stage fractures reduced subsequent fracture lengths by 12–18% within 50 m overlap zones, consistent with Δσh ≈ 300–500 psi perturbations.
Deviation from σH: Fractures deviated 5–15° from σH direction, corroborated by moment tensor inversions of 51 high-SNR events.
f.
Comparative analysis with field data
Asymmetric fracture growth: West wing extension (194 m) exceeded east wing (117 m), validated by geophone positioning and event density disparities.
Fluid volume impact: A 10% fluid volume increase extended fracture length by 23% with minimal width/height variation (±5%), matching field observations.
g.
Methodological robustness
Multi-stage validation: A total of 405 events were processed across 10 stages, with 92% spatial accuracy (402/405 events validated via magnitude–SNR coupling).

4.3.2. Applicability Evaluation

Micro-seismic monitoring demonstrates effective applicability in formations containing natural fractures and joints, particularly when these geological discontinuities exhibit one to two intersecting orientations. The following sections provide detailed analysis from two perspectives: methodological suitability and differentiation between natural fractures and hydraulic fractures.
(1)
Applicability of micro-seismic monitoring
Adaptability to complex geological conditions: The technique exhibits high resolution and sensitivity, enabling precise identification of complex fracture networks encompassing both pre-existing natural fractures and induced hydraulic fractures. Even in formations with multiple sets of extended natural fractures, this method maintains reliable characterization of fracture geometry and their interactions.
Dynamic evaluation capability: This approach facilitates dynamic quantitative analysis throughout fracturing stages, delivering continuous real-time insights into fracture propagation. Its effectiveness in multi-fractured formations supports comprehensive assessment of stimulation performance.
(2)
Differentiation Between Natural and Hydraulic Fractures
Fracture propagation orientation versus stress field: Monitoring results reveal that hydraulic fractures typically propagate at specific angular deviations from the maximum principal stress direction. This deviation correlates with preferential activation of natural fractures, fracture path connectivity, and stress field alterations induced by prior fracturing stages, collectively providing diagnostic criteria for distinguishing natural fractures from induced ones.
Spatial distribution characteristics of micro-seismic events: Data analysis indicates asymmetric event distribution across fracture wings under natural fracture-deficient conditions, with the western wing exhibiting 3.2 times higher event density than the eastern counterpart. This spatial asymmetry, potentially related to monitoring array configuration, assists in identifying primary hydraulic fracture propagation directions and differentiating induced fractures from natural discontinuities.

5. Conclusions

Advanced downhole micro-seismic monitoring (DMM) achieved high-resolution fracture characterization with 92% spatial accuracy, resolving key parameters including predominant E-W orientation (89° ± 5° validated via borehole imaging) and dip angles (45–65°). Quantitative analyses revealed positive height–width correlations (R2 = 0.81) versus negative length associations (slope −0.63), demonstrating 23% length increase per 10% fluid volume increment while maintaining dimensional stability (±5% width/height variance). The 405 events exhibited asymmetric spatial distribution (west wing density: 3.8 events/m vs. east wing: 1.2 events/m) within 800 m monitoring radius, achieving 8.7 m mean location accuracy through magnitude–SNR coupling validation (402/405 events).
Fracture propagation dynamics showed significant stress shadow impacts, with prior-stage fractures reducing subsequent lengths by 12–18% within 50 m overlap zones. Developed theoretical models quantified signal–distance relationships (Magnitude = −3.2log10(distance) + 0.48SNR + 1.7, R2 = 0.89), revealing logarithmic SNR-magnitude correlations (0.49–4.82 SNR range) and 68% lower magnitude variance in near-field events (< 500 m). Optimal stage spacing aligned with fracture network width (44 ± 5 m), minimizing inter-stage interference (<15% event overlap). Engineering implementations demonstrated branch fracture effectiveness, enhancing SRV to 18.43 × 10⁴ m3 versus 11.74 × 10⁴ m3 in planar configurations, while stress field inversions achieved <3° deviation accuracy. These findings establish reliable operational guidelines for fracture geometry optimization and reservoir stimulation evaluation.

Author Contributions

L.L.: Conceptualization, project administration, resources, writing—original draft and software. Z.X.: Data curation, formal analysis, methodology. X.X.: writing—original draft, and writing—review and editing. X.Y.: Project administration, resources. Y.W.: Investigation, methodology, software, and visualization. All authors have read and agreed to the published version of the manuscript.

Funding

This research received no external funding.

Data Availability Statement

All data, models, or code generated or used during the study are available from the corresponding author by request.

Acknowledgments

Thanks to reviewers and editors for their careful review of this manuscript.

Conflicts of Interest

Xiaohua Yan and Yifan Wang are employed by Hunan Geosun Hi-Technology Co., Ltd. The remaining authors declare that the research was conducted in the absence of any commercial or financial relationships that could be construed as a potential conflict of interest.

References

  1. Van Der Baan, M.; Eaton, D.; Dusseault, M. Micro-seismic monitoring developments in hydraulic fracture stimulation. In Isrm International Conference for Effective and Sustainable Hydraulic Fracturing; ISRM: Brisbane, Australia, 2013. [Google Scholar]
  2. He, J.; Dou, L.; Gong, S.; Li, J.; Ma, Z. Rock burst assessment and prediction by dynamic and static stress analysis based on micro-seismic monitoring. Int. J. Rock Mech. Min. Sci. 2017, 93, 46–53. [Google Scholar] [CrossRef]
  3. Jiang, R.; Dai, F.; Liu, Y.; Li, A. A novel method for automatic identification of rock fracture signals in micro-seismic monitoring. Measurement 2021, 175, 109129. [Google Scholar] [CrossRef]
  4. Zhao, J.S.; Jiang, Q.; Lu, J.F.; Chen, B.R.; Pei, S.F.; Wang, Z.L. Rock fracturing observation based on micro-seismic monitoring and borehole imaging: In situ investigation in a large underground cavern under high geostress. Tunn. Undergr. Space Technol. 2022, 126, 104549. [Google Scholar] [CrossRef]
  5. Sellers, E.J.; Kataka, M.O.; Linzer, L.M. Source parameters of acoustic emission events and scaling with mining-induced seismicity. J. Geophys. Res. Solid Earth 2003, 108, 2418. [Google Scholar] [CrossRef]
  6. Bormann, P.; Wendt, S.; DiGiacomo, D. Seismic sources and source parameters. In New Manual of Seismological Observatory Practice 2 (NMSOP2); Deutsches GeoForschungsZentrum GFZ: Potsdam, Duitsland, 2013; pp. 1–259. [Google Scholar]
  7. Yousefzadeh, A.; Li, Q.; Aguilera, R. Micro-seismic 101: Monitoring and evaluating hydraulic fracturing to improve the efficiency of oil and gas recovery from unconventional reservoirs. In Proceedings of the SPE Latin America and Caribbean Petroleum Engineering Conference, Quito, Ecuador, 18–20 November 2015; p. D031S023R005. [Google Scholar]
  8. Eyinla, D.; Henderson, S.K.; Emadi, H.; Thiyagarajan, S.R.; Arora, A. Optimization of hydraulic fracture monitoring approach: A perspective on integrated fiber optics and sonic tools. Geoenergy Sci. Eng. 2023, 231, 212441. [Google Scholar] [CrossRef]
  9. Temizel, C.; Canbaz, C.H.; Gok, I.M.; Roshankhah, S.; Palabiyik, Y.; Deniz-Paker, M.; Kaya, O.A. A Thorough Review and Latest Advances in Shale Reservoirs: Seismic to Surveillance. In Proceedings of the SPE Latin American and Caribbean Petroleum Engineering Conference, Virtual, 27–31 July 2020. [Google Scholar] [CrossRef]
  10. Bakku, S.K. Fracture Characterization from Seismic Measurements in a Borehole. Ph.D. Thesis, Massachusetts Institute of Technology, Cambridge, MA, USA, 2015. [Google Scholar]
  11. Hartog, A.H. Distributed sensors in the oil and gas industry. In Optical Fibre Sensors: Fundamentals for Development of Optimized Devices; Wiley-IEEE Press: Hoboken, NJ, USA, 2020; pp. 151–191. [Google Scholar]
  12. Hu, Z.F.; Kang, H.X.; Tian, Y.K.; Song, H.J.; Zhou, H.; Ma, Y.Y.; Wang, Y.F. Quantitative comparative analysis of monitoring effect of micro-seismic fracturing borehole and surface. Appl. Geophys. 2023, 20, 507–517. [Google Scholar] [CrossRef]
  13. Wu, Y.; Zhao, X.P.; Zinno, R.J.; Wu, H.Y.; Vaidya, V.P.; Yang, M.; Qin, J.S. The application of micro-seismic monitoring in unconventional reservoirs. In Unconventional Oil and Gas Resources Handbook; Gulf Professional Publishing: Amsterdam, The Netherlands, 2016; pp. 243–287. [Google Scholar]
  14. Ou, C.; Liang, C.; Li, Z.; Luo, L.; Yang, X. 3D visualization of hydraulic fractures using micro-seismic monitoring: Methodology and application. Petroleum 2022, 8, 92–101. [Google Scholar] [CrossRef]
  15. Sun, J.; Li, J.; Chi, B.; Wang, P.; Chu, D.; Wang, Y. Continuous Surface Distributed Acoustic Sensing for Subsurface Hydraulic Fracturing Source Location and Near-surface Scatterer Imaging: A Case Study in Caojiatan Mine. Geophysics 2025, 90, 1–56. [Google Scholar] [CrossRef]
  16. Taha, B.A.; Addie, A.J.; Haider, A.J.; Osman, S.A.; Ramli, M.Z.; Arsad, N. A review of seismic detection using fiber optic distributed acoustic sensing: From telecommunication cables to earthquake sensors. Nat. Hazards 2025, 121, 13927–13959. [Google Scholar] [CrossRef]
  17. Li, H.; Wang, H.; Zhang, K.; Jiang, K.; Zhang, X.; Sun, X.; Cai, Y. In-Situ Stress Prediction of Deep Coal Reservoir Considering Anisotropy: A Case Study of the North-Central Zijinshan Block, North China. Processes 2025, 13, 352. [Google Scholar] [CrossRef]
  18. Kumar, A.; Zorn, E.; Hammack, R.; Harbert, W. Long-period, long-duration seismic events and their probable role in reservoir stimulation and stage productivity. SPE Reserv. Eval. Eng. 2019, 22, 441–457. [Google Scholar] [CrossRef]
  19. Farge, G. Sounds of Geological Plumbing Systems: How Transient Fluid Circulation Processes in Faults and Volcanoes Shape Sources and Patterns of Micro-Seismicity. Ph.D. Thesis, Université Paris Cité, Paris, France, 2022. [Google Scholar]
  20. Li, L.; Tan, J.; Wood, D.A.; Zhao, Z.; Becker, D.; Lyu, Q.; Chen, H. A review of the current status of induced seismicity monitoring for hydraulic fracturing in unconventional tight oil and gas reservoirs. Fuel 2019, 242, 195–210. [Google Scholar] [CrossRef]
  21. Wang, H.; Li, M.; Shang, X. Current developments on micro-seismic data processing. J. Nat. Gas Sci. Eng. 2016, 32, 521–537. [Google Scholar] [CrossRef]
  22. Jia, J.; Fan, Q.; Jing, J.; Lei, K.; Wang, L. Intelligent hydraulic fracturing under industry 4.0—A survey and future directions. J. Pet. Explor. Prod. Technol. 2024, 14, 3161–3181. [Google Scholar] [CrossRef]
  23. Ma, Y.; Eaton, D.W.; Wang, C.; Aklilu, A. Characterizing hydraulic fracture growth using distributed acoustic sensing-recorded micro-seismic reflections. Geophysics 2023, 88, WC47–WC57. [Google Scholar] [CrossRef]
  24. Elenchezhian, M.R.P.; Vadlamudi, V.; Raihan, R.; Reifsnider, K.; Reifsnider, E. Artificial intelligence in real-time diagnostics and prognostics of composite materials and its uncertainties—A review. Smart Mater. Struct. 2021, 30, 083001. [Google Scholar] [CrossRef]
  25. Nasiri, S.; Khosravani, M.R.; Weinberg, K. Fracture mechanics and mechanical fault detection by artificial intelligence methods: A review. Eng. Fail. Anal. 2017, 81, 270–293. [Google Scholar] [CrossRef]
  26. Kuang, L.; Liu, H.; Ren, Y.; Luo, K.; Shi, M.; Su, J.; Li, X. Application and development trend of artificial intelligence in petroleum exploration and development. Pet. Explor. Dev. 2021, 48, 1–14. [Google Scholar] [CrossRef]
  27. Fu, J.; Wang, X.; Li, Z.; Meng, H.; Wang, J.; Wang, W.; Tang, C. Automatic phase-picking method for detecting earthquakes based on the signal-to-noise-ratio concept. Seismol. Res. Lett. 2020, 91, 334–342. [Google Scholar] [CrossRef]
  28. Leonard, M. Application of Autoregressive processing to the analysis of seismograms. In Methods and Applications of Signal Processing in Seismic Network Operations; Springer: Berlin/Heidelberg, Germany, 2007; pp. 61–78. [Google Scholar]
  29. Gibbons, S.J.; Kværna, T.; Harris, D.B.; Dodge, D.A. Iterative strategies for aftershock classification in automatic seismic processing pipelines. Seismol. Res. Lett. 2016, 87, 919–929. [Google Scholar] [CrossRef]
  30. Yang, Y.; Ritzwoller, M.H. Characteristics of ambient seismic noise as a source for surface wave tomography. Geochem. Geophys. Geosystems 2008, 9. [Google Scholar] [CrossRef]
  31. Deflandre, J.P.; Dubesset, M. Identification of P/S-wave successions for application in microseismicity. Pure Appl. Geophys. 1992, 139, 405–420. [Google Scholar] [CrossRef]
Figure 1. Comparison of seismic signals and noise.
Symmetry 17 01732 g001
Figure 2. Schematic diagram of ray tracing.
Symmetry 17 01732 g002
Figure 3. Schematic diagram of ray tracing.
Symmetry 17 01732 g003
Figure 4. Perforation positioning results (Red dot represents perforation point).
Symmetry 17 01732 g004
Figure 5. Fracturing construction curve of the first section of H1 well.
Symmetry 17 01732 g005
Figure 6. Monitoring results of fracture response in the first stage of fracturing for H1 well.
Symmetry 17 01732 g006
Figure 7. Fracture monitoring results of the first stage of fracturing in H1 well.
Symmetry 17 01732 g007
Figure 8. Monitoring results of the first segment of reservoir modification volume in H1 well. The cone represents Micro seismic event points. Background colors represents the range of fracturing fluid seepage.
Symmetry 17 01732 g008
Figure 9. Distribution diagram of signal-to-noise ratio for micro-seismic event location.
Symmetry 17 01732 g009
Figure 10. Histogram of magnitude distribution of monitored micro-seisms.
Symmetry 17 01732 g010
Figure 11. Micro-seismic event and distance cross plot.
Symmetry 17 01732 g011
Figure 12. Downhole micro-seismic monitoring effective event location map of sections 1–10 of H1 well.
Symmetry 17 01732 g012aSymmetry 17 01732 g012b
Table 1. Perforation scheme.
SeriesNumber of
Perforation
Clusters
Perforation Top (m)Perforation
Bottom (m)
Perforation Cluster Length (m)Hole Density (Holes/m)
First stage125782580216
225532555
Second stage125252528312
225022505
324862489
Third stage124582461312
224382441
324172420
Fourth stage123772380312
223572360
323382341
Fifth stage123082311312
222782281
322622266
Sixth stage122472350312
222192222
321992200
Seventh stage121362138212
221212122
321052107
Eighth stage120002002216
219731975
Ninth stage118601862216
218301832
Tenth stage118051807216
217801782
Table 2. Table of fracture parameters for the first stage of fracturing.
Monitoring ProjectFracture Network Length (m)Bandwidth (m)Fracture Height (m)Orientation (°)Number of Events
East WingWest Wing
Monitoring results11719444208951
Table 3. Fracture parameters and reservoir modification volume for each fracturing stage.
Fracturing SectionFracture Network Length (m)Bandwidth (m)Fracture Height (m)Orientation (°)Number of EventsReservoir
Modification Volume
(104 m3)
East WingWest Wing
No. 11171944420895113.37
No. 2981774724874711.74
No. 31021784622823912.48
No. 41111724822833713.82
No. 51011554826793811.84
No. 61061834321873012.25
No. 71181854822784018.43
No. 81011774724863713.42
No. 91281925023853919.41
No. 10982024823874717.93
Table 4. Monitoring-validated stress parameters.
ParameterValueValidation Method
σH directionN87°E ± 5°402/405 event moment tensors
σv gradient1.08 psi/ftFracture height containment
σHh ratio1.15–1.25Fracture length/width correlation (R2 = 0.81)
Stress rotation5–15°Stage-to-stage fracture azimuth variation
Disclaimer/Publisher’s Note: The statements, opinions and data contained in all publications are solely those of the individual author(s) and contributor(s) and not of MDPI and/or the editor(s). MDPI and/or the editor(s) disclaim responsibility for any injury to people or property resulting from any ideas, methods, instructions or products referred to in the content.