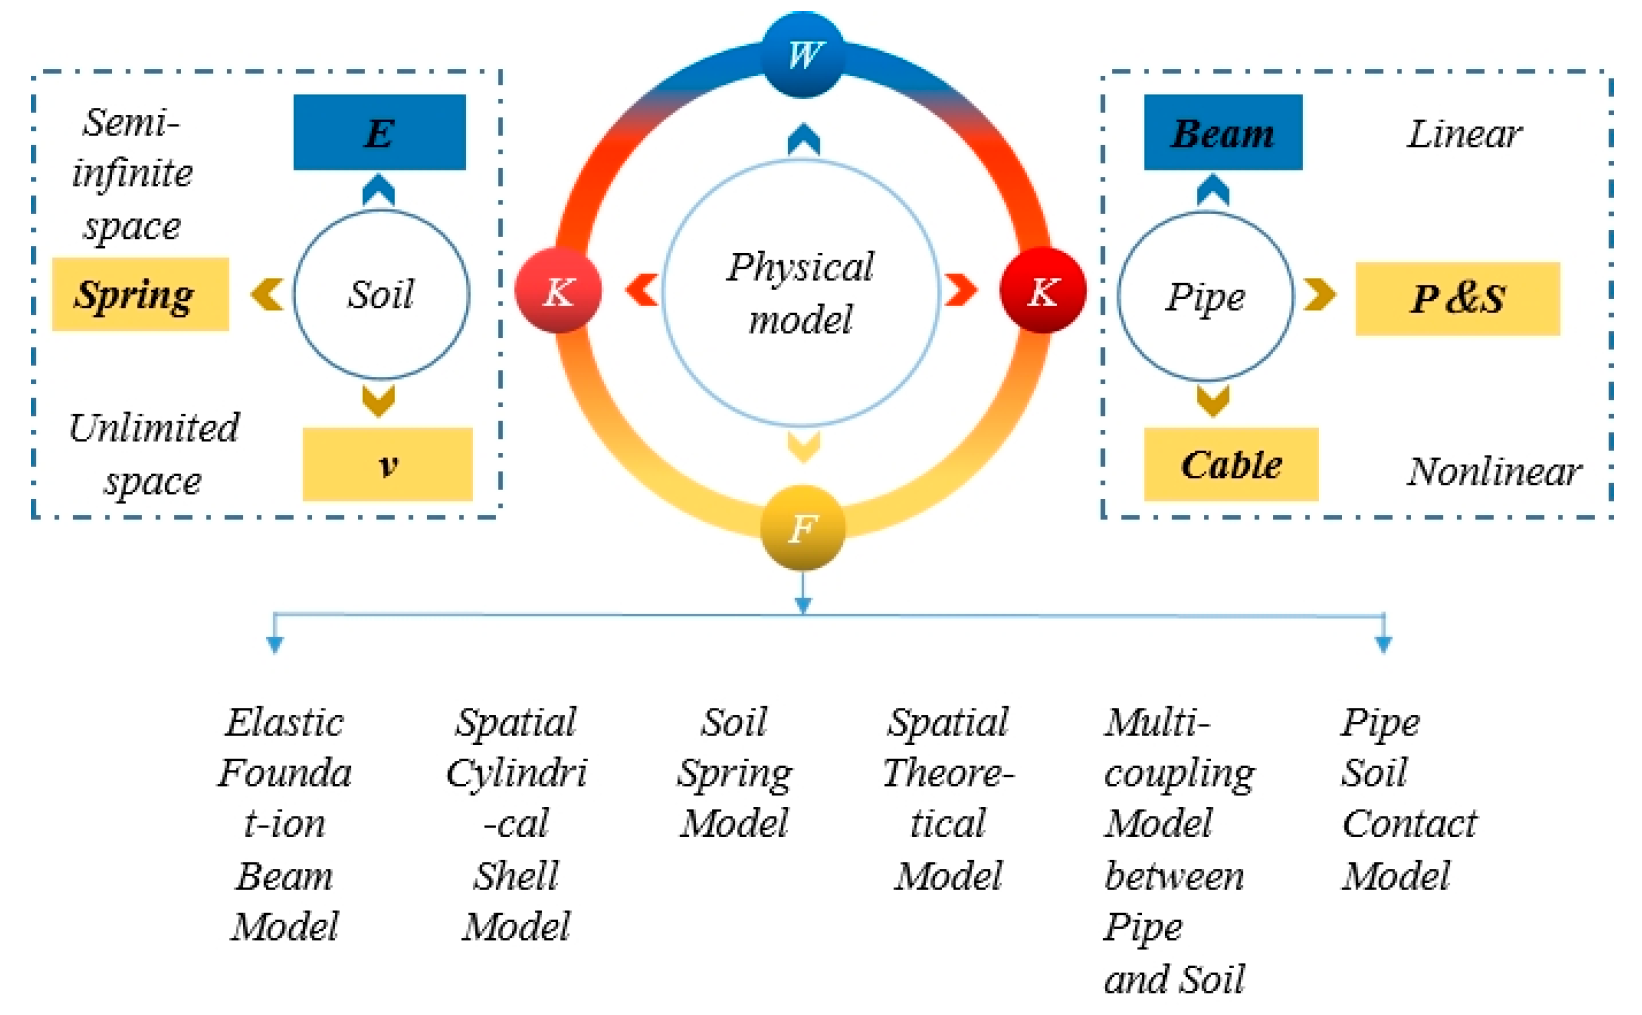
Figure 1.
Theoretical model of pipe–soil interaction. In the figure, E stands for elastic–plastic, ν stands for viscoelastic, and P and S denote plate and shell models.
Figure 1.
Theoretical model of pipe–soil interaction. In the figure, E stands for elastic–plastic, ν stands for viscoelastic, and P and S denote plate and shell models.
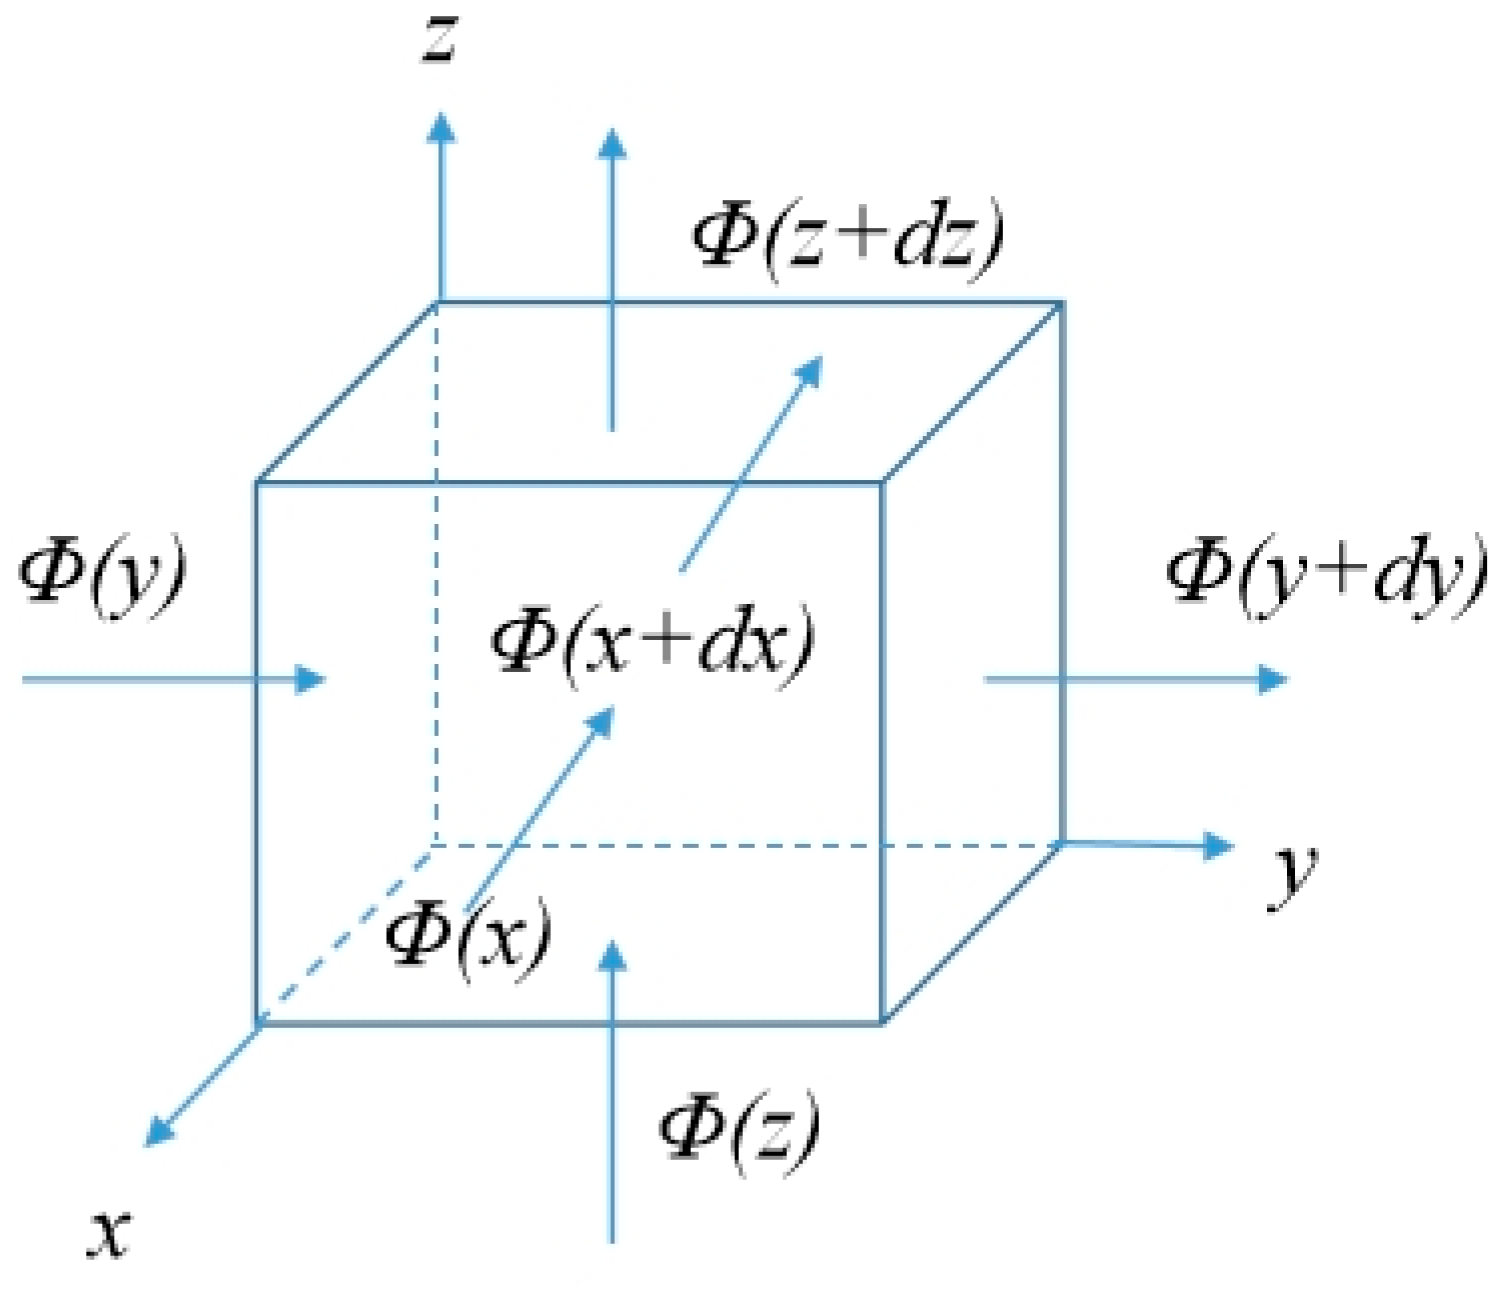
Figure 2.
Schematic diagram of permafrost microelements, Φ represents thermal energy, Φ(x) represents the thermal energy conducted in the x direction.
Figure 2.
Schematic diagram of permafrost microelements, Φ represents thermal energy, Φ(x) represents the thermal energy conducted in the x direction.
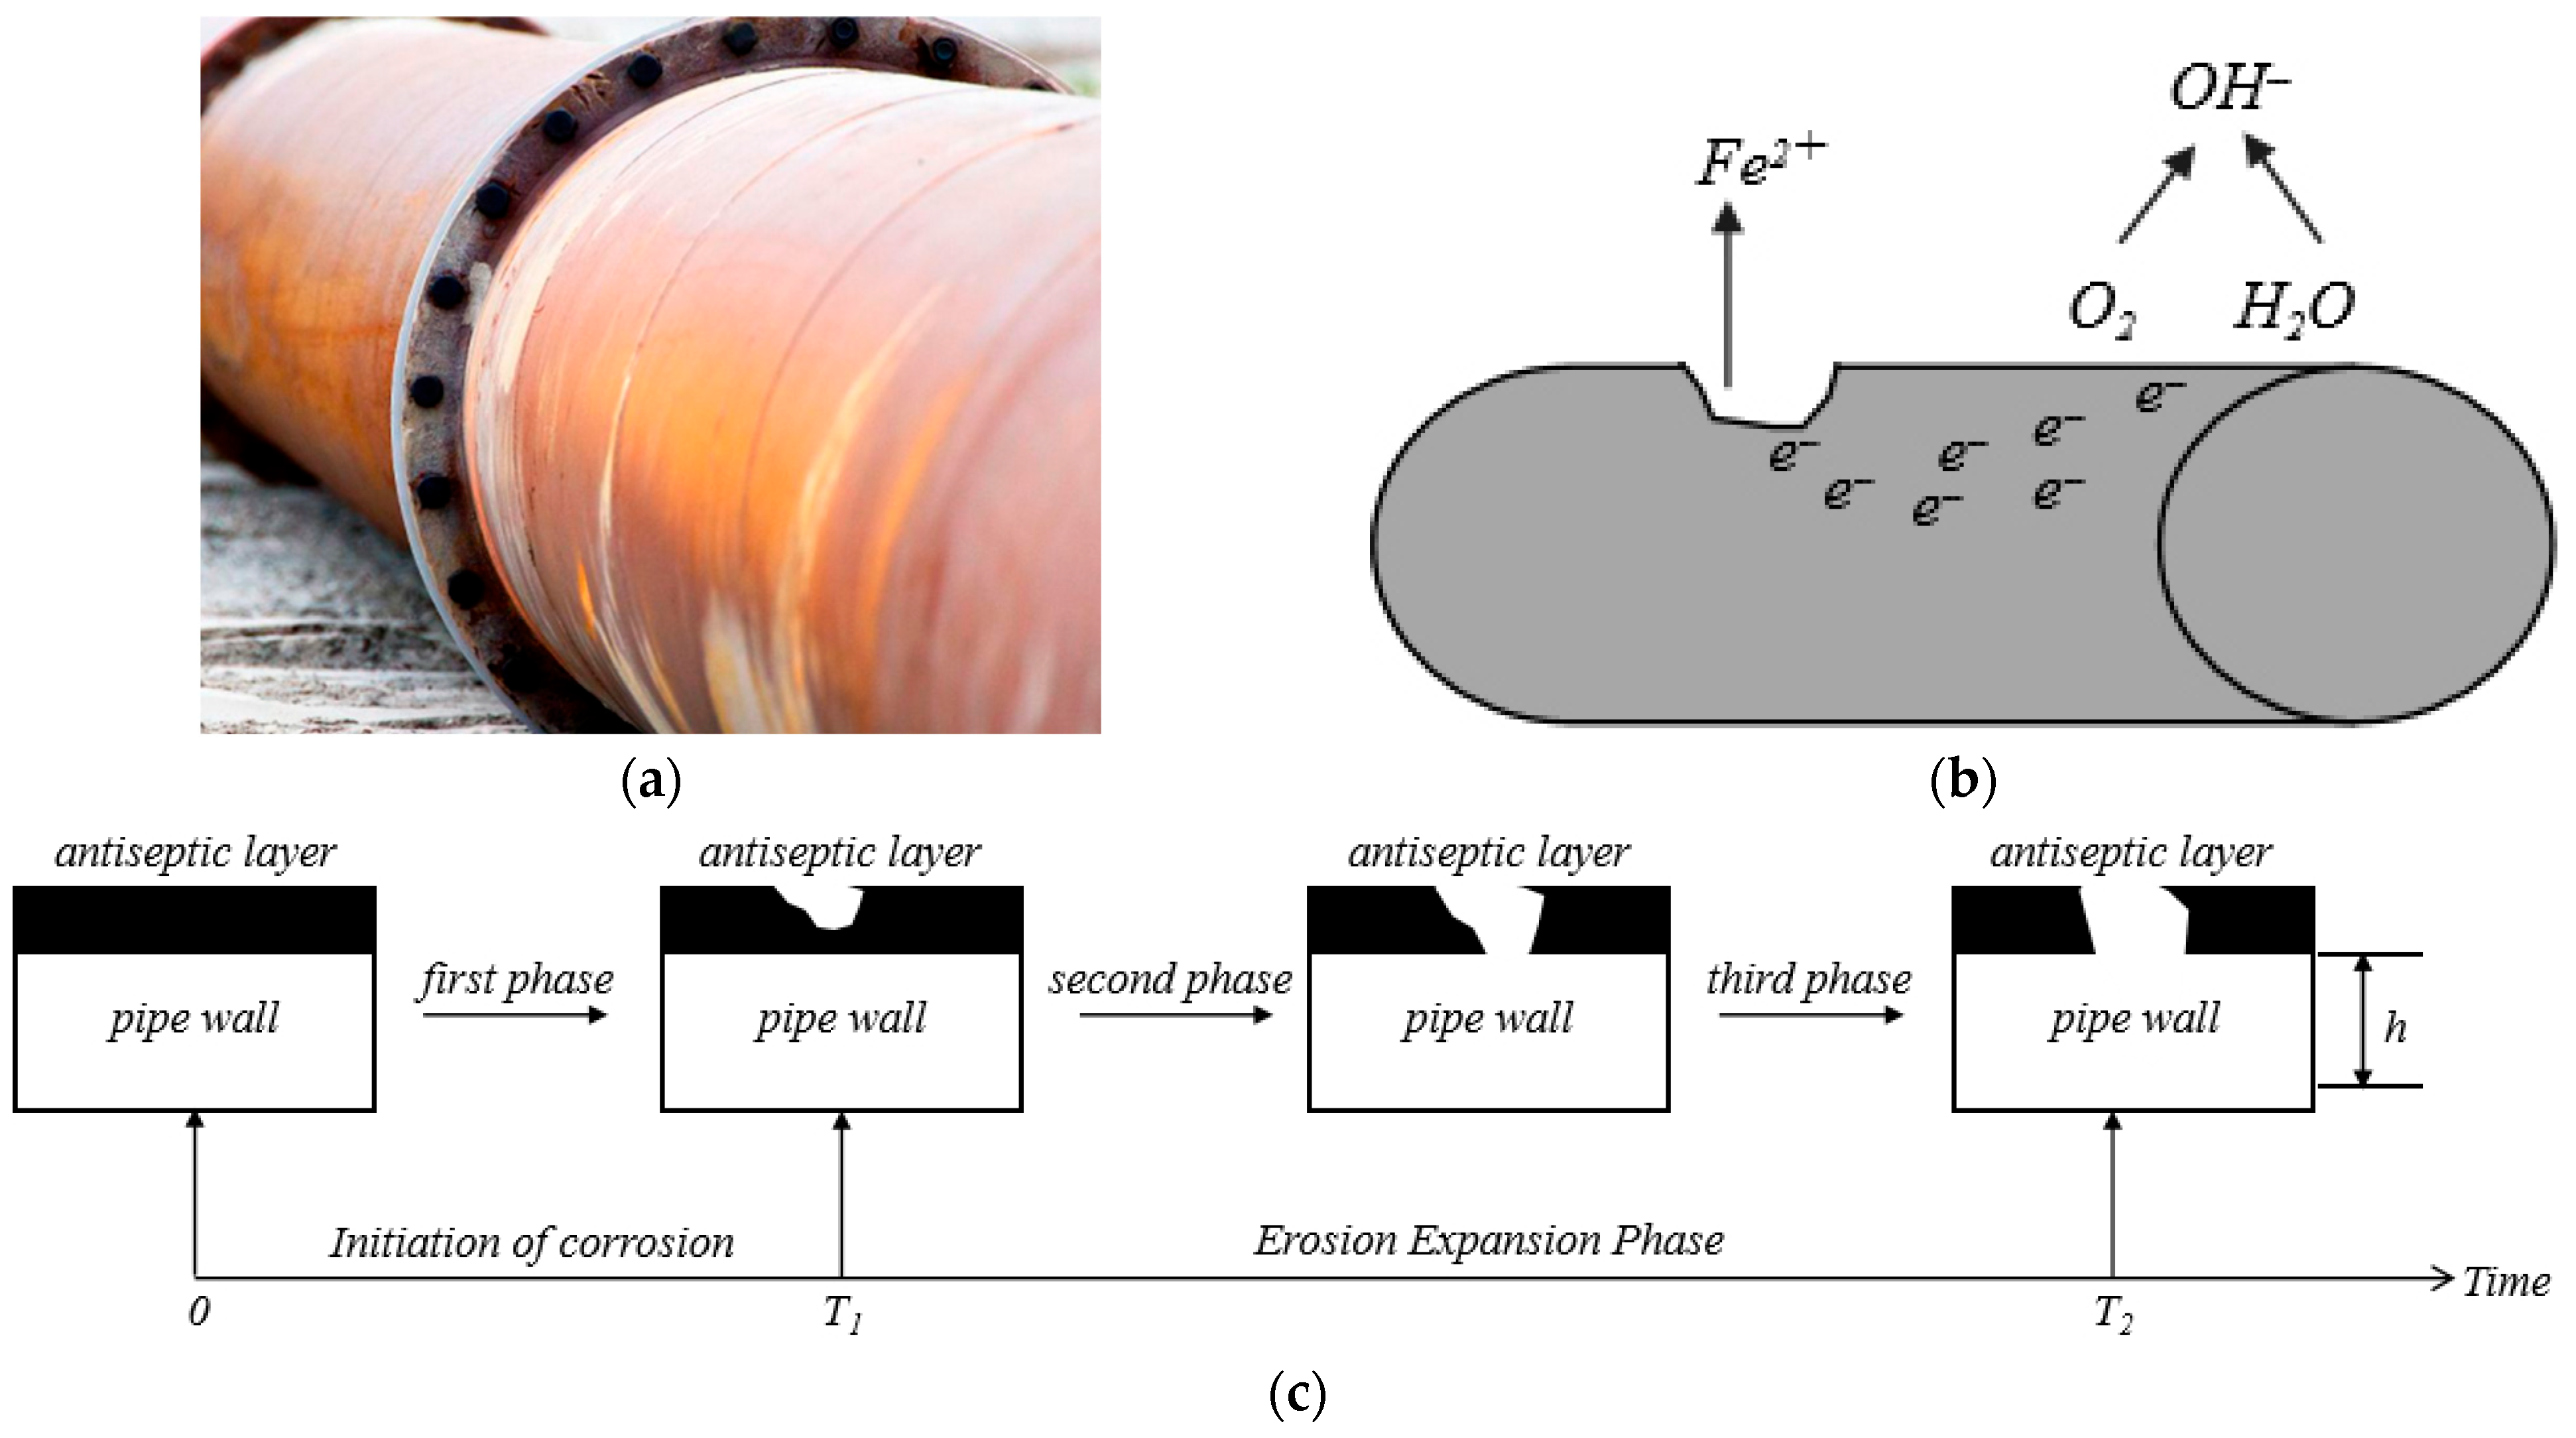
Figure 3.
Pipeline corrosion: (a) description what happens to a pipeline after corrosion occurs; (b) description of the pipeline corrosion mechanism; and (c) description of the process by which corrosion damage occurs in a pipeline.
Figure 3.
Pipeline corrosion: (a) description what happens to a pipeline after corrosion occurs; (b) description of the pipeline corrosion mechanism; and (c) description of the process by which corrosion damage occurs in a pipeline.
Figure 4.
Pipe and soil simulation model: (a) solid model of pipe and soil created; (b) pipe–soil model after meshing.
Figure 4.
Pipe and soil simulation model: (a) solid model of pipe and soil created; (b) pipe–soil model after meshing.
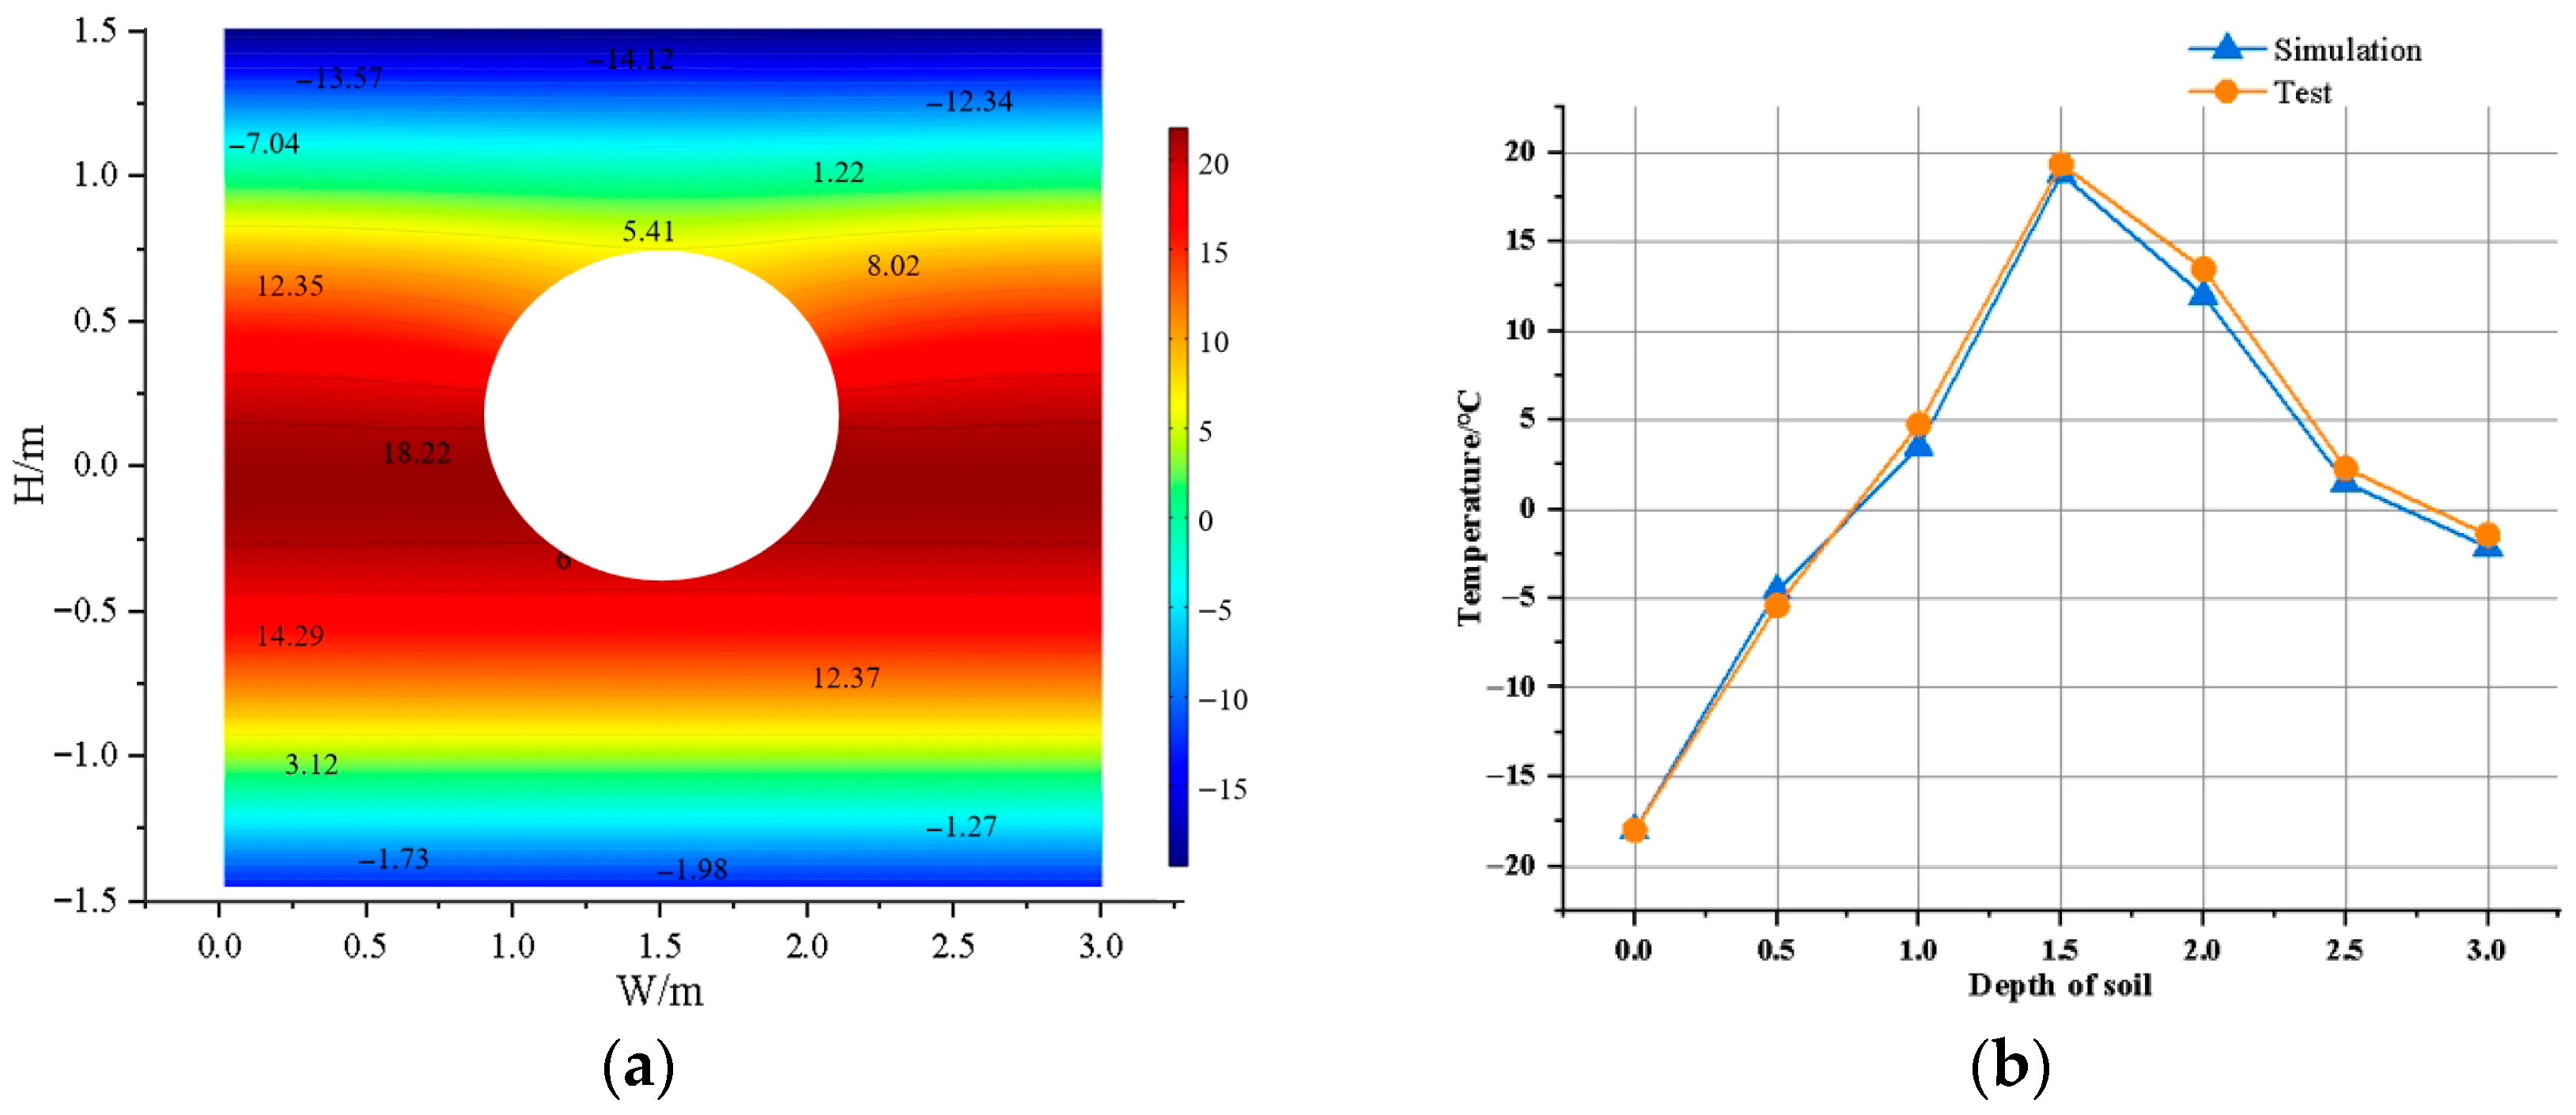
Figure 5.
Simulation results of temperature field. (a) Simulation of pipe–soil cross-section temperature; (b) comparison of simulation temperature and actual test temperature.
Figure 5.
Simulation results of temperature field. (a) Simulation of pipe–soil cross-section temperature; (b) comparison of simulation temperature and actual test temperature.
Figure 6.
Comparison of soil moisture content between simulation test data and measured data.
Figure 6.
Comparison of soil moisture content between simulation test data and measured data.
Figure 7.
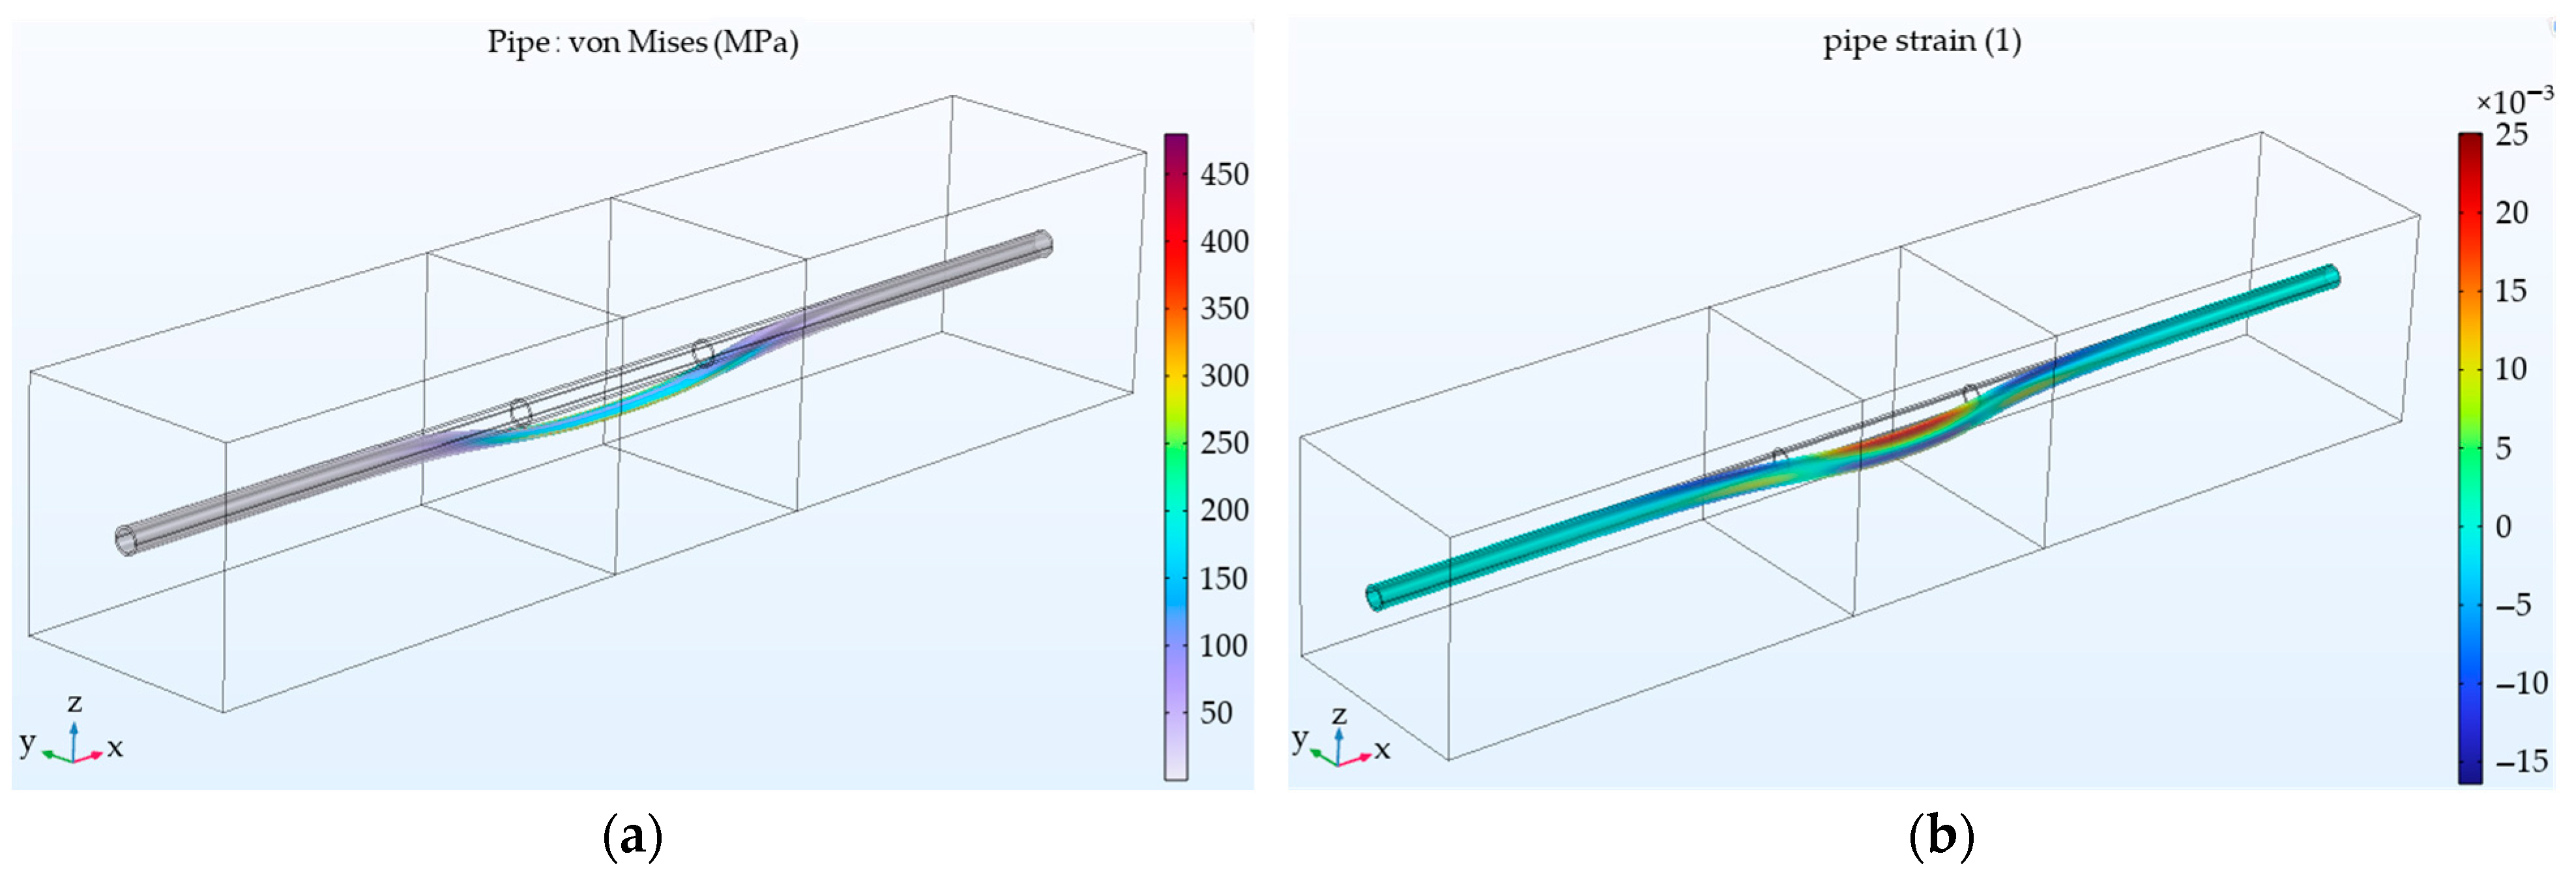
Simulation results (a) describing pipe stress; (b) describing pipe strain.
Figure 7.
Simulation results (a) describing pipe stress; (b) describing pipe strain.
Figure 8.
Equivalent stress vs. strain diagrams for pipes with different initial moisture contents: (a) description of relationship between initial moisture content and pipe equivalent forces l; (b) description of relationship between initial moisture content and pipe equivalent strain.
Figure 8.
Equivalent stress vs. strain diagrams for pipes with different initial moisture contents: (a) description of relationship between initial moisture content and pipe equivalent forces l; (b) description of relationship between initial moisture content and pipe equivalent strain.
Figure 9.
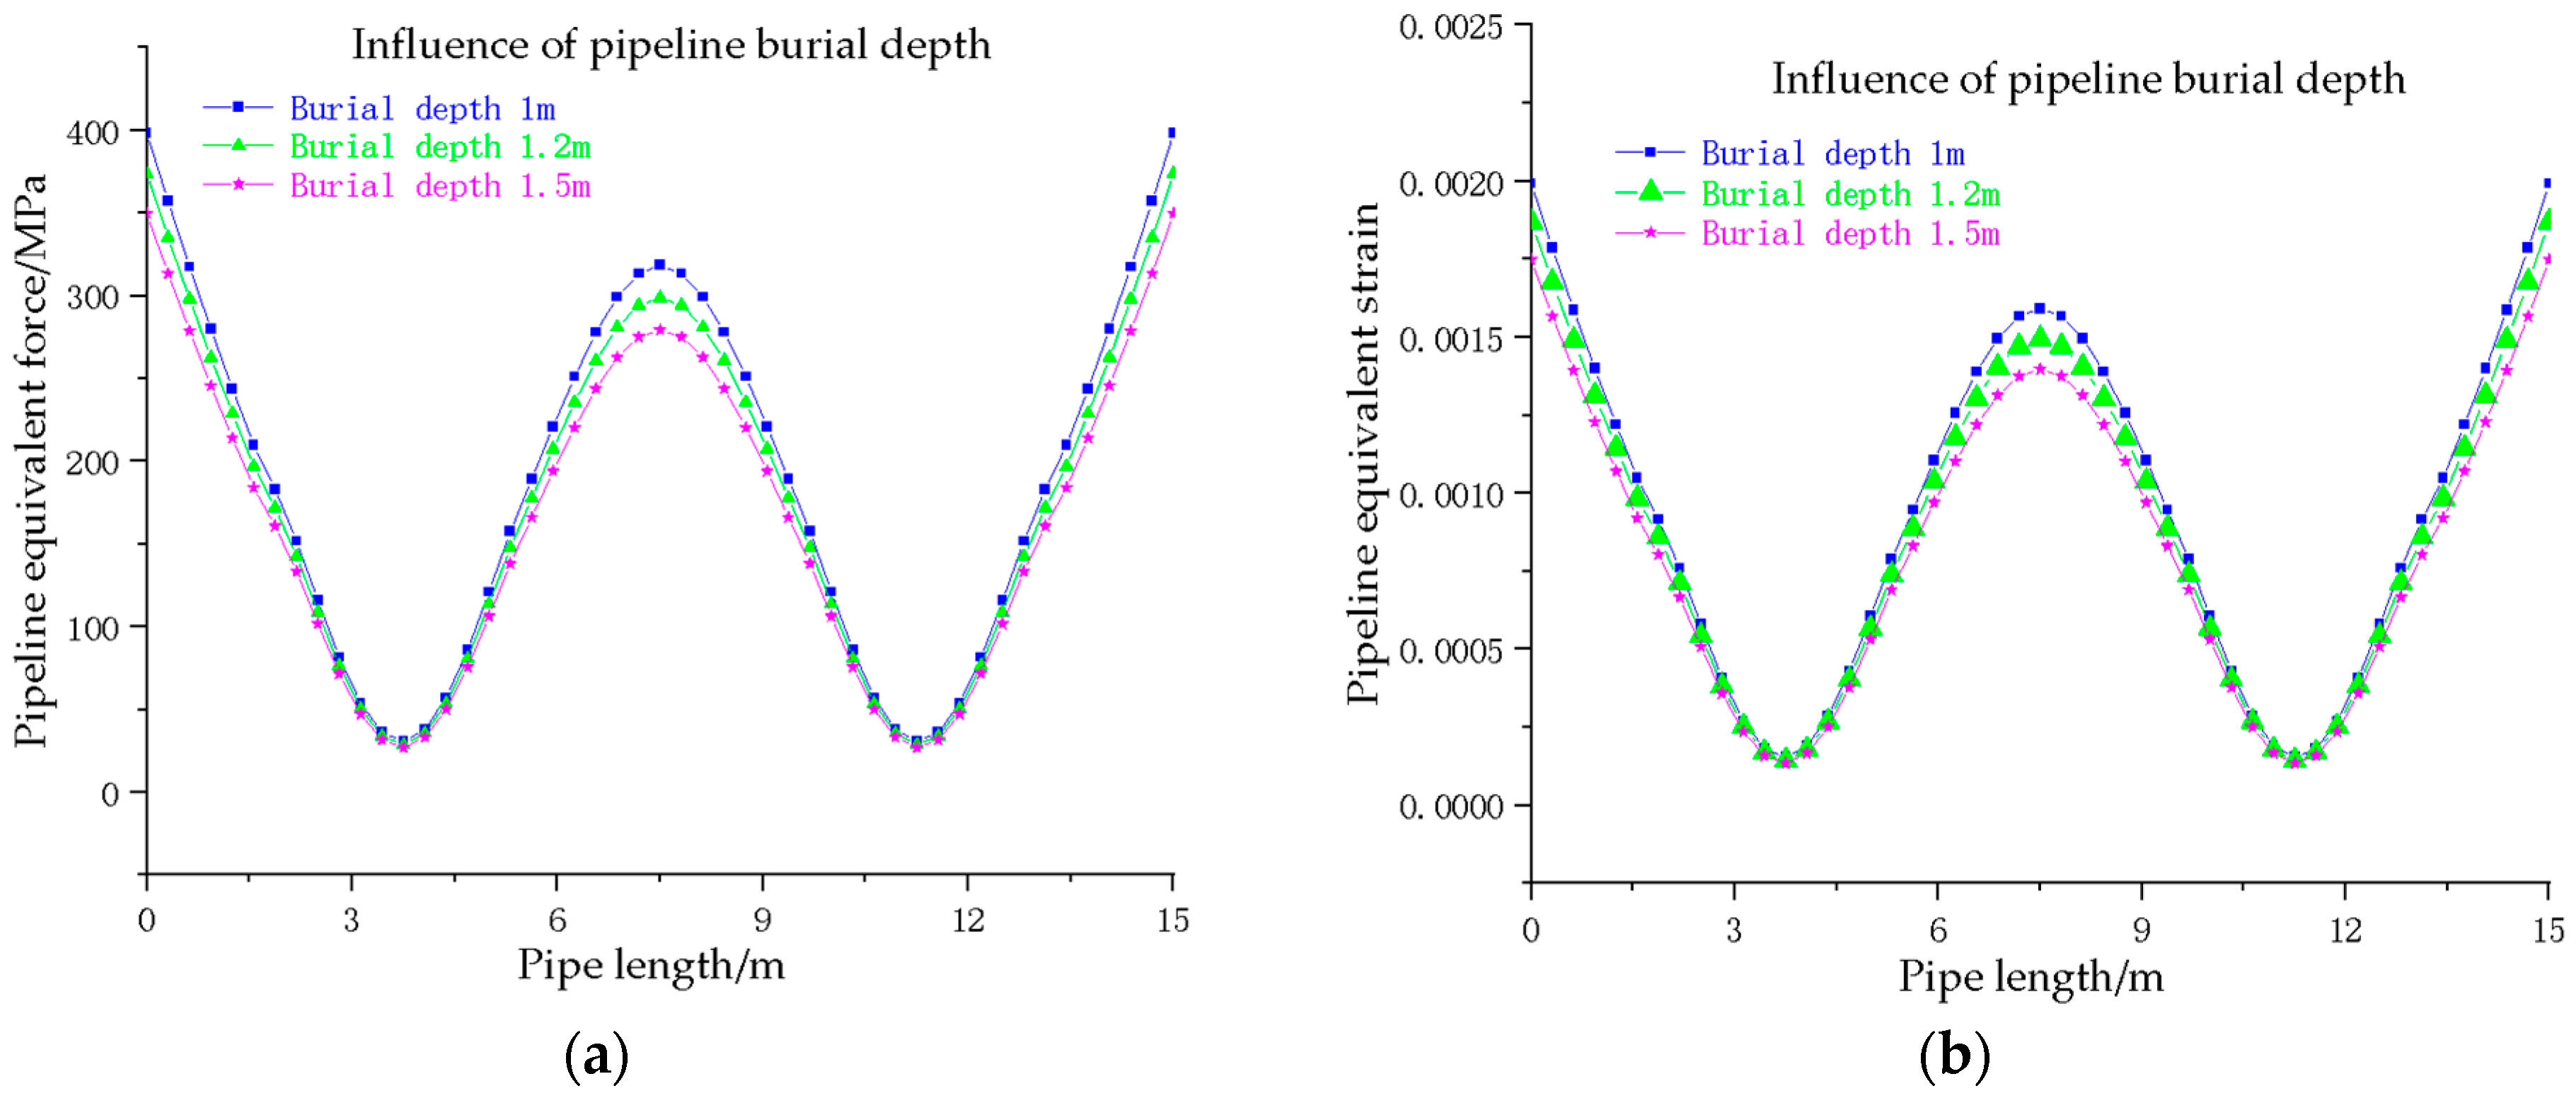
Equivalent force and equivalent strain diagrams for pipelines with different burial depths: (a) characterization of variation in pipeline equivalent stresses at different burial depths; (b) characterization of changes in equivalent strain of pipelines at different burial depths.
Figure 9.
Equivalent force and equivalent strain diagrams for pipelines with different burial depths: (a) characterization of variation in pipeline equivalent stresses at different burial depths; (b) characterization of changes in equivalent strain of pipelines at different burial depths.
Figure 10.
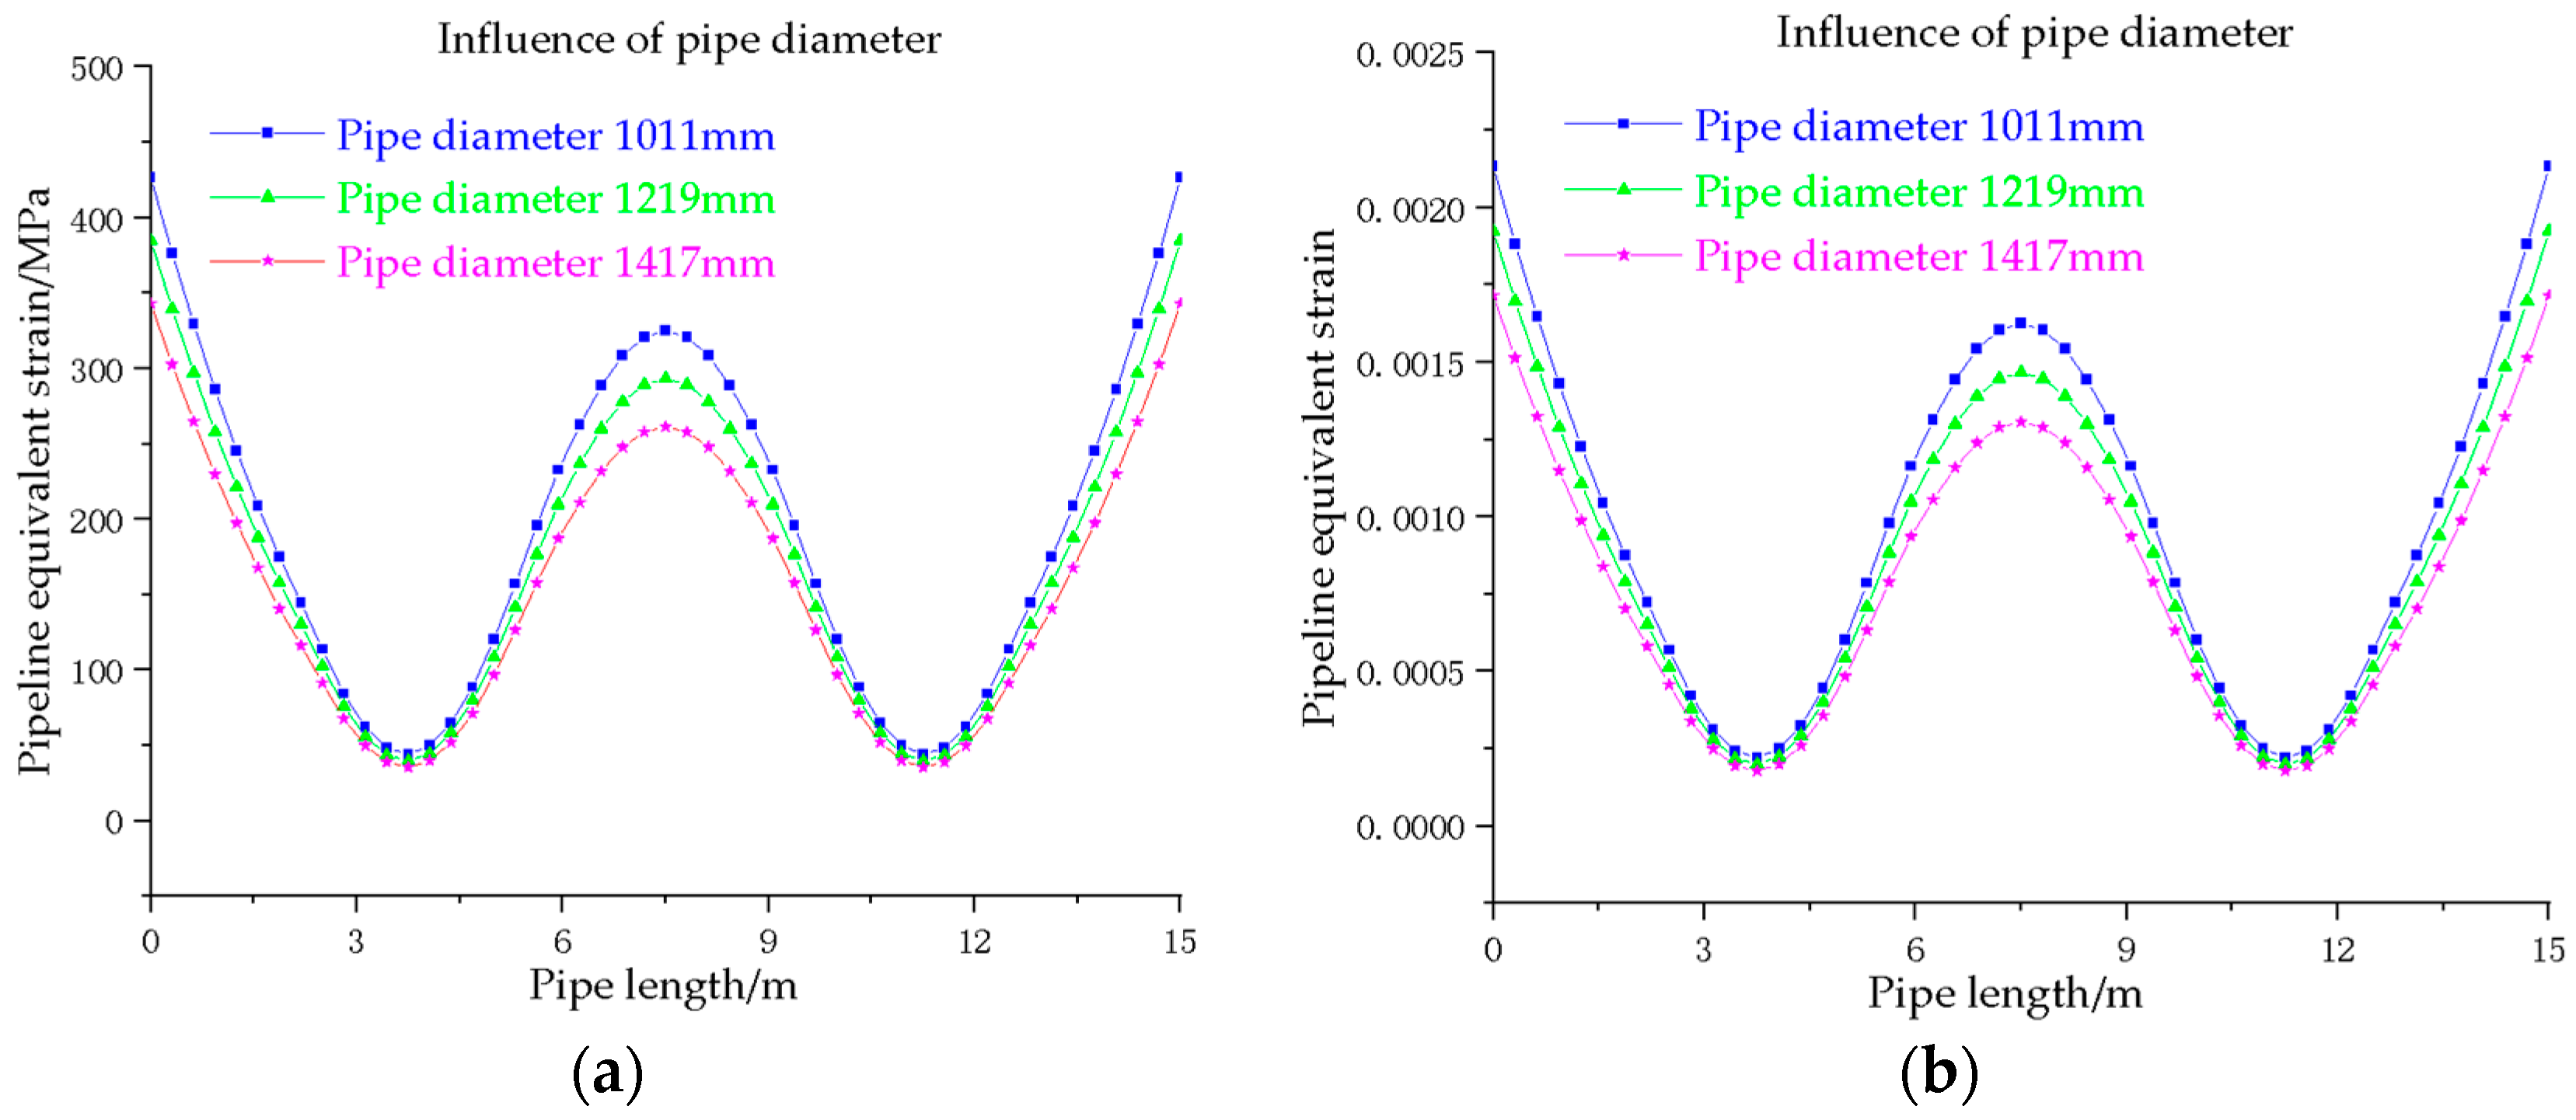
Stress–strain conditions of pipes with different pipe diameters: (a) description of change in pipe equivalent force for different pipe diameters; (b) characterization of variation in pipe equivalent strain for different pipe diameters.
Figure 10.
Stress–strain conditions of pipes with different pipe diameters: (a) description of change in pipe equivalent force for different pipe diameters; (b) characterization of variation in pipe equivalent strain for different pipe diameters.
Figure 11.
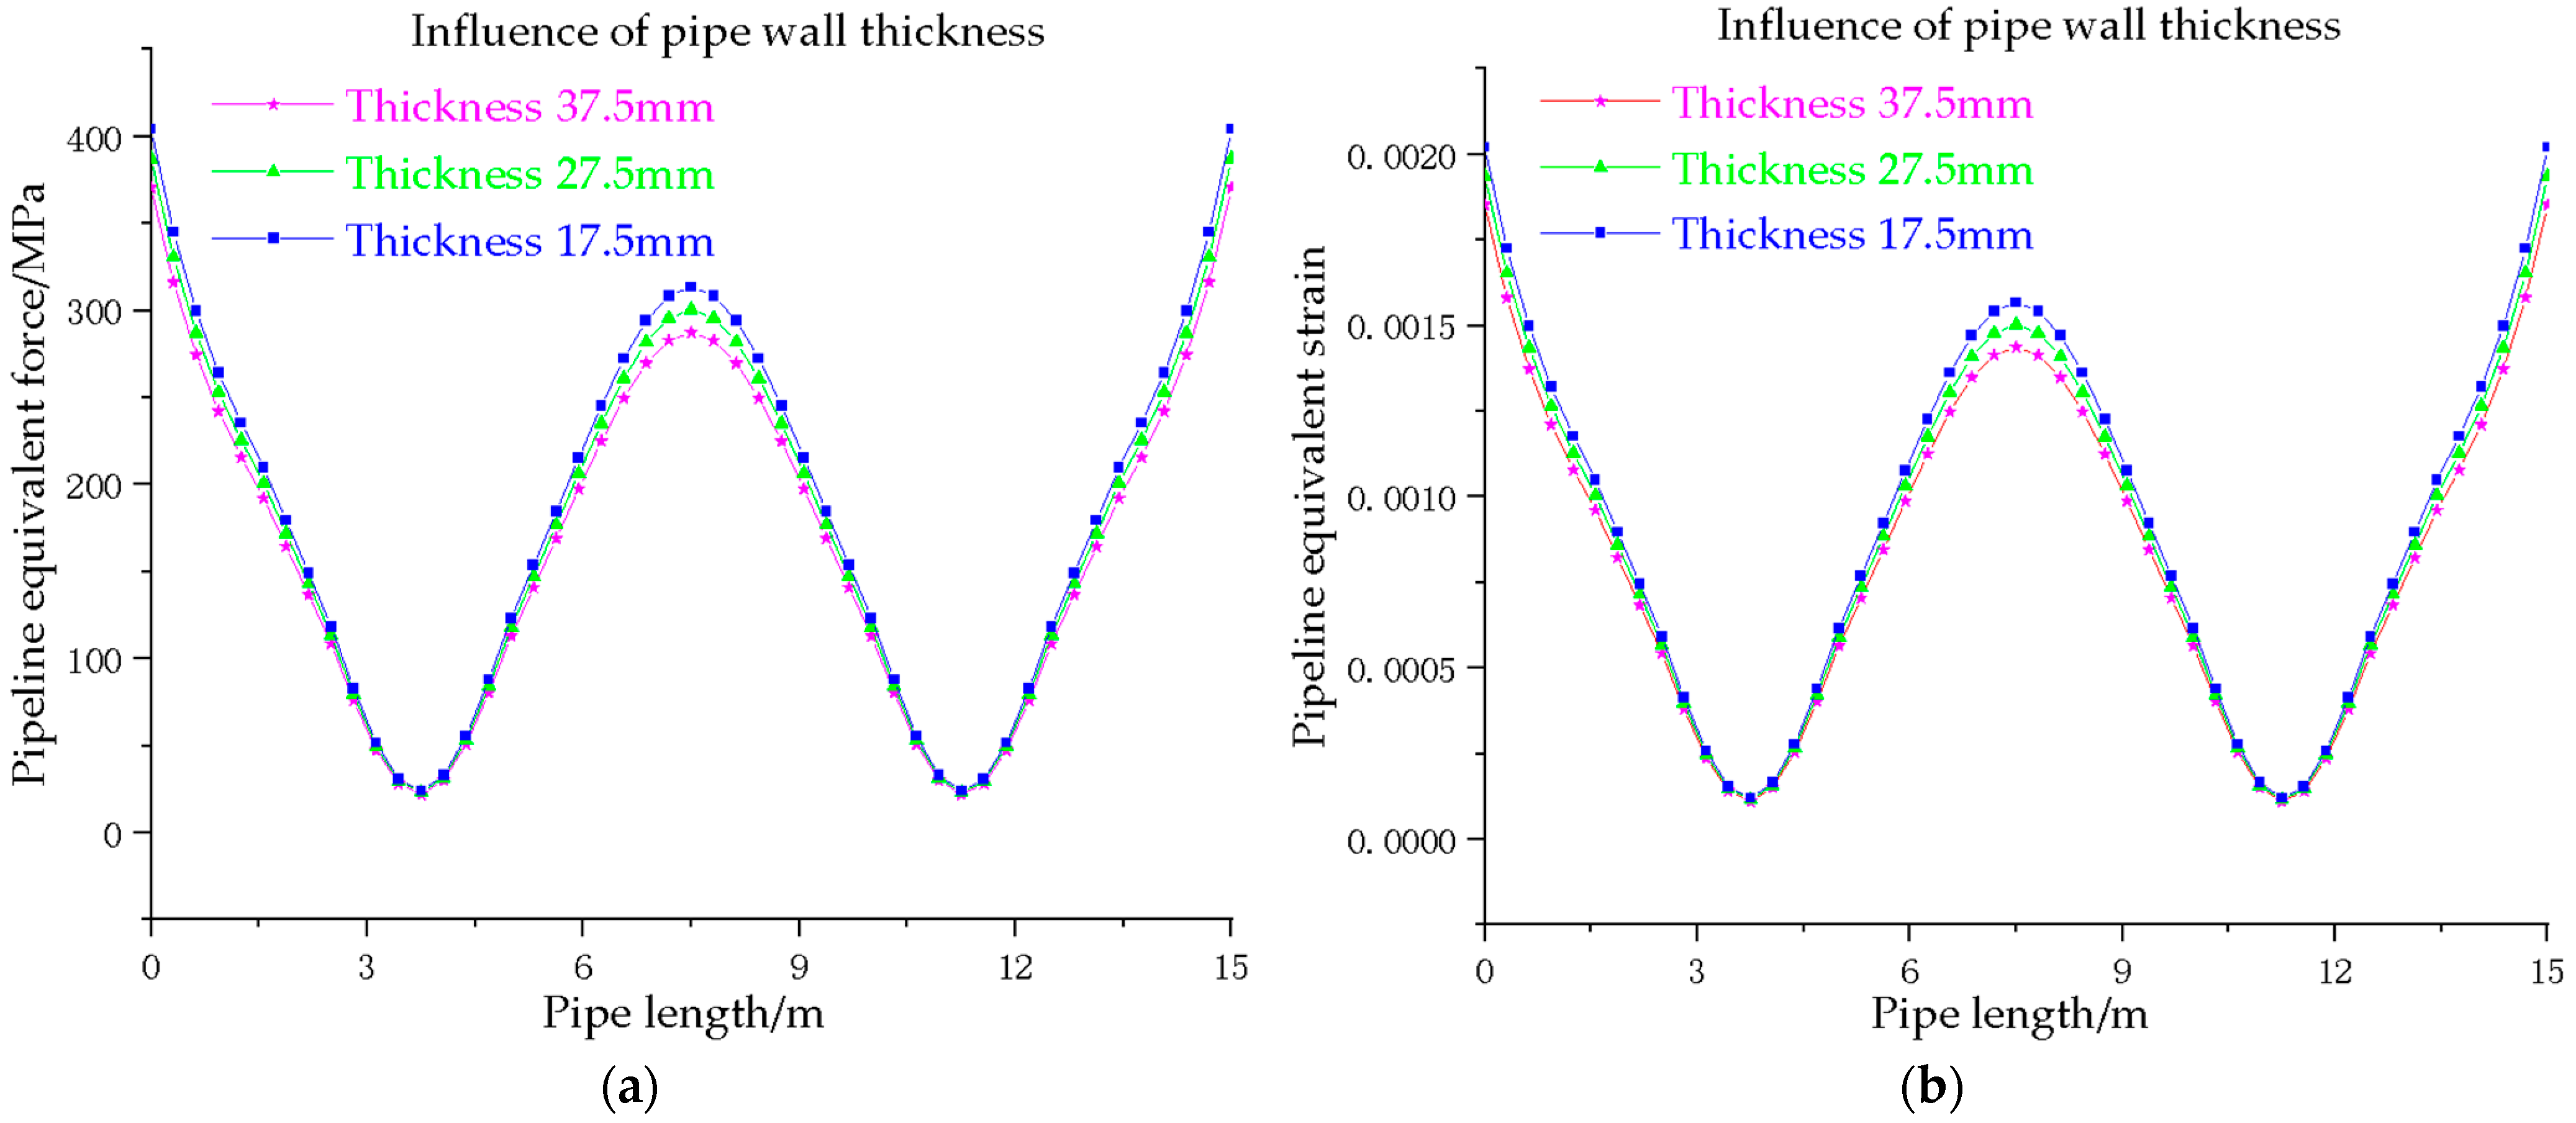
Variation in stress–strain in pipes with different wall thicknesses: (a) characterization of change in pipe equivalent force for different wall thicknesses; (b) characterization of changes in pipe equivalent strain for different wall thicknesses.
Figure 11.
Variation in stress–strain in pipes with different wall thicknesses: (a) characterization of change in pipe equivalent force for different wall thicknesses; (b) characterization of changes in pipe equivalent strain for different wall thicknesses.
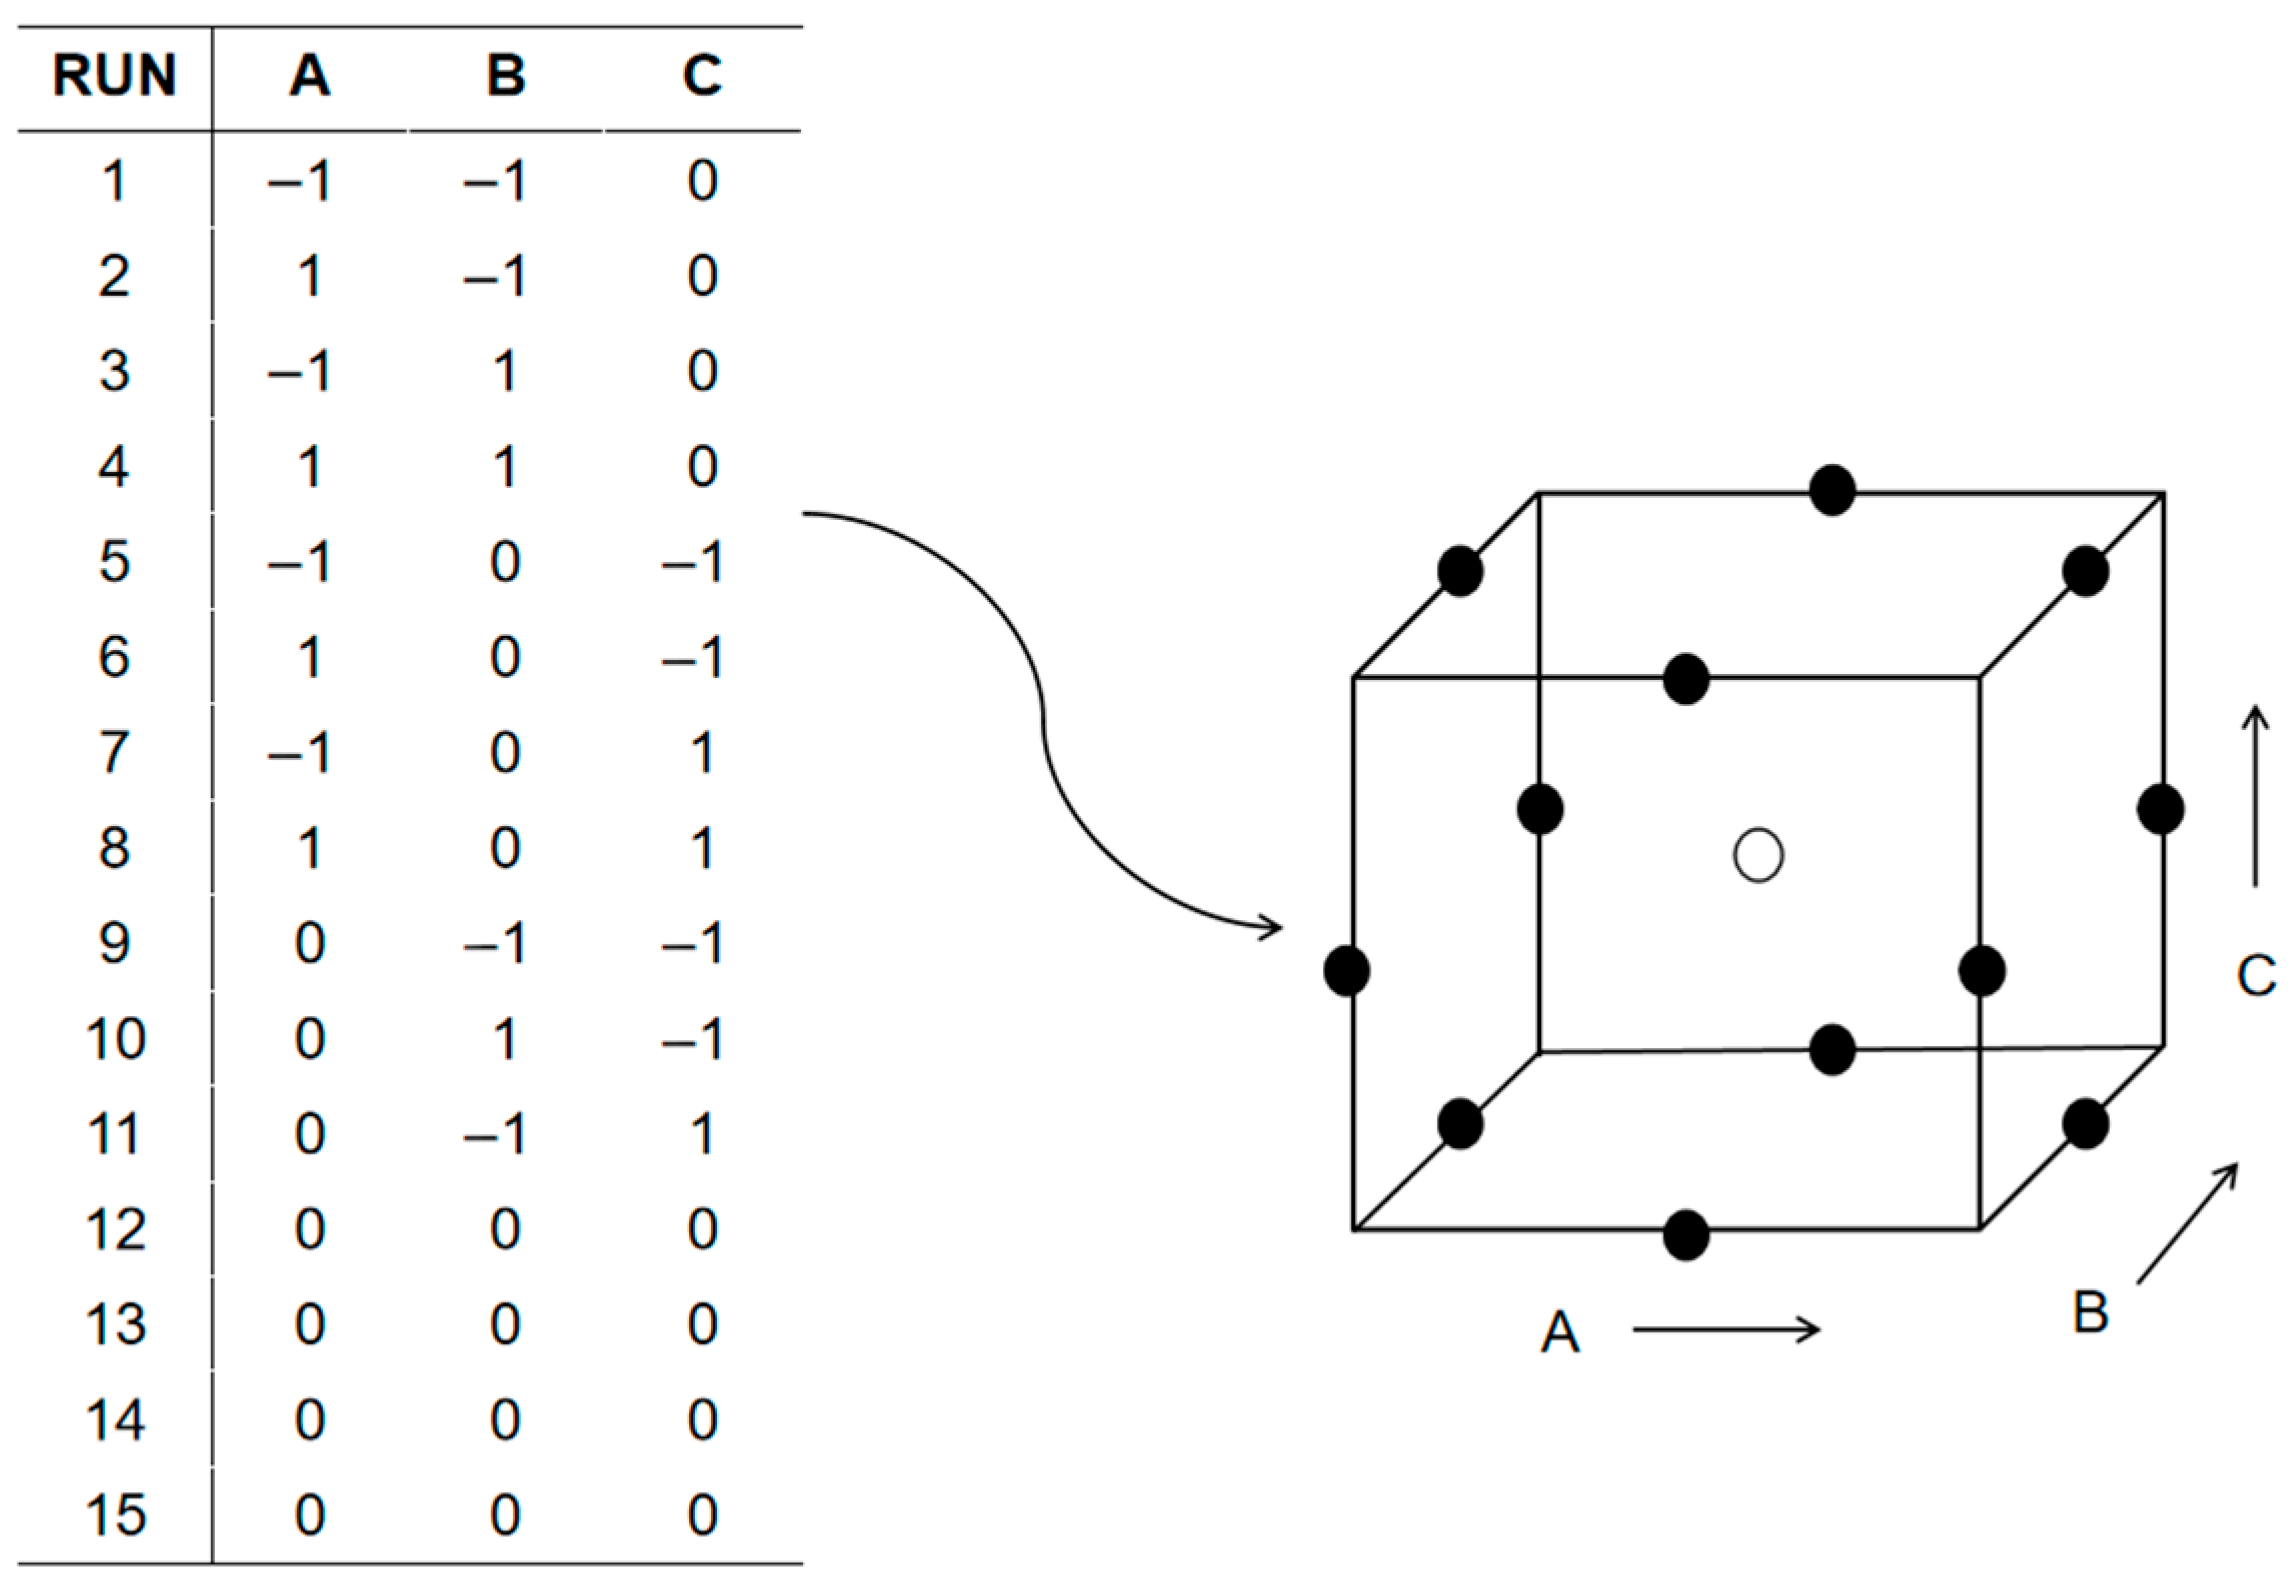
Figure 12.
BBD Design. A, B, and C, respectively, represent three parameters.
Figure 12.
BBD Design. A, B, and C, respectively, represent three parameters.
Figure 13.
Schematic layout of the test chamber.
Figure 13.
Schematic layout of the test chamber.
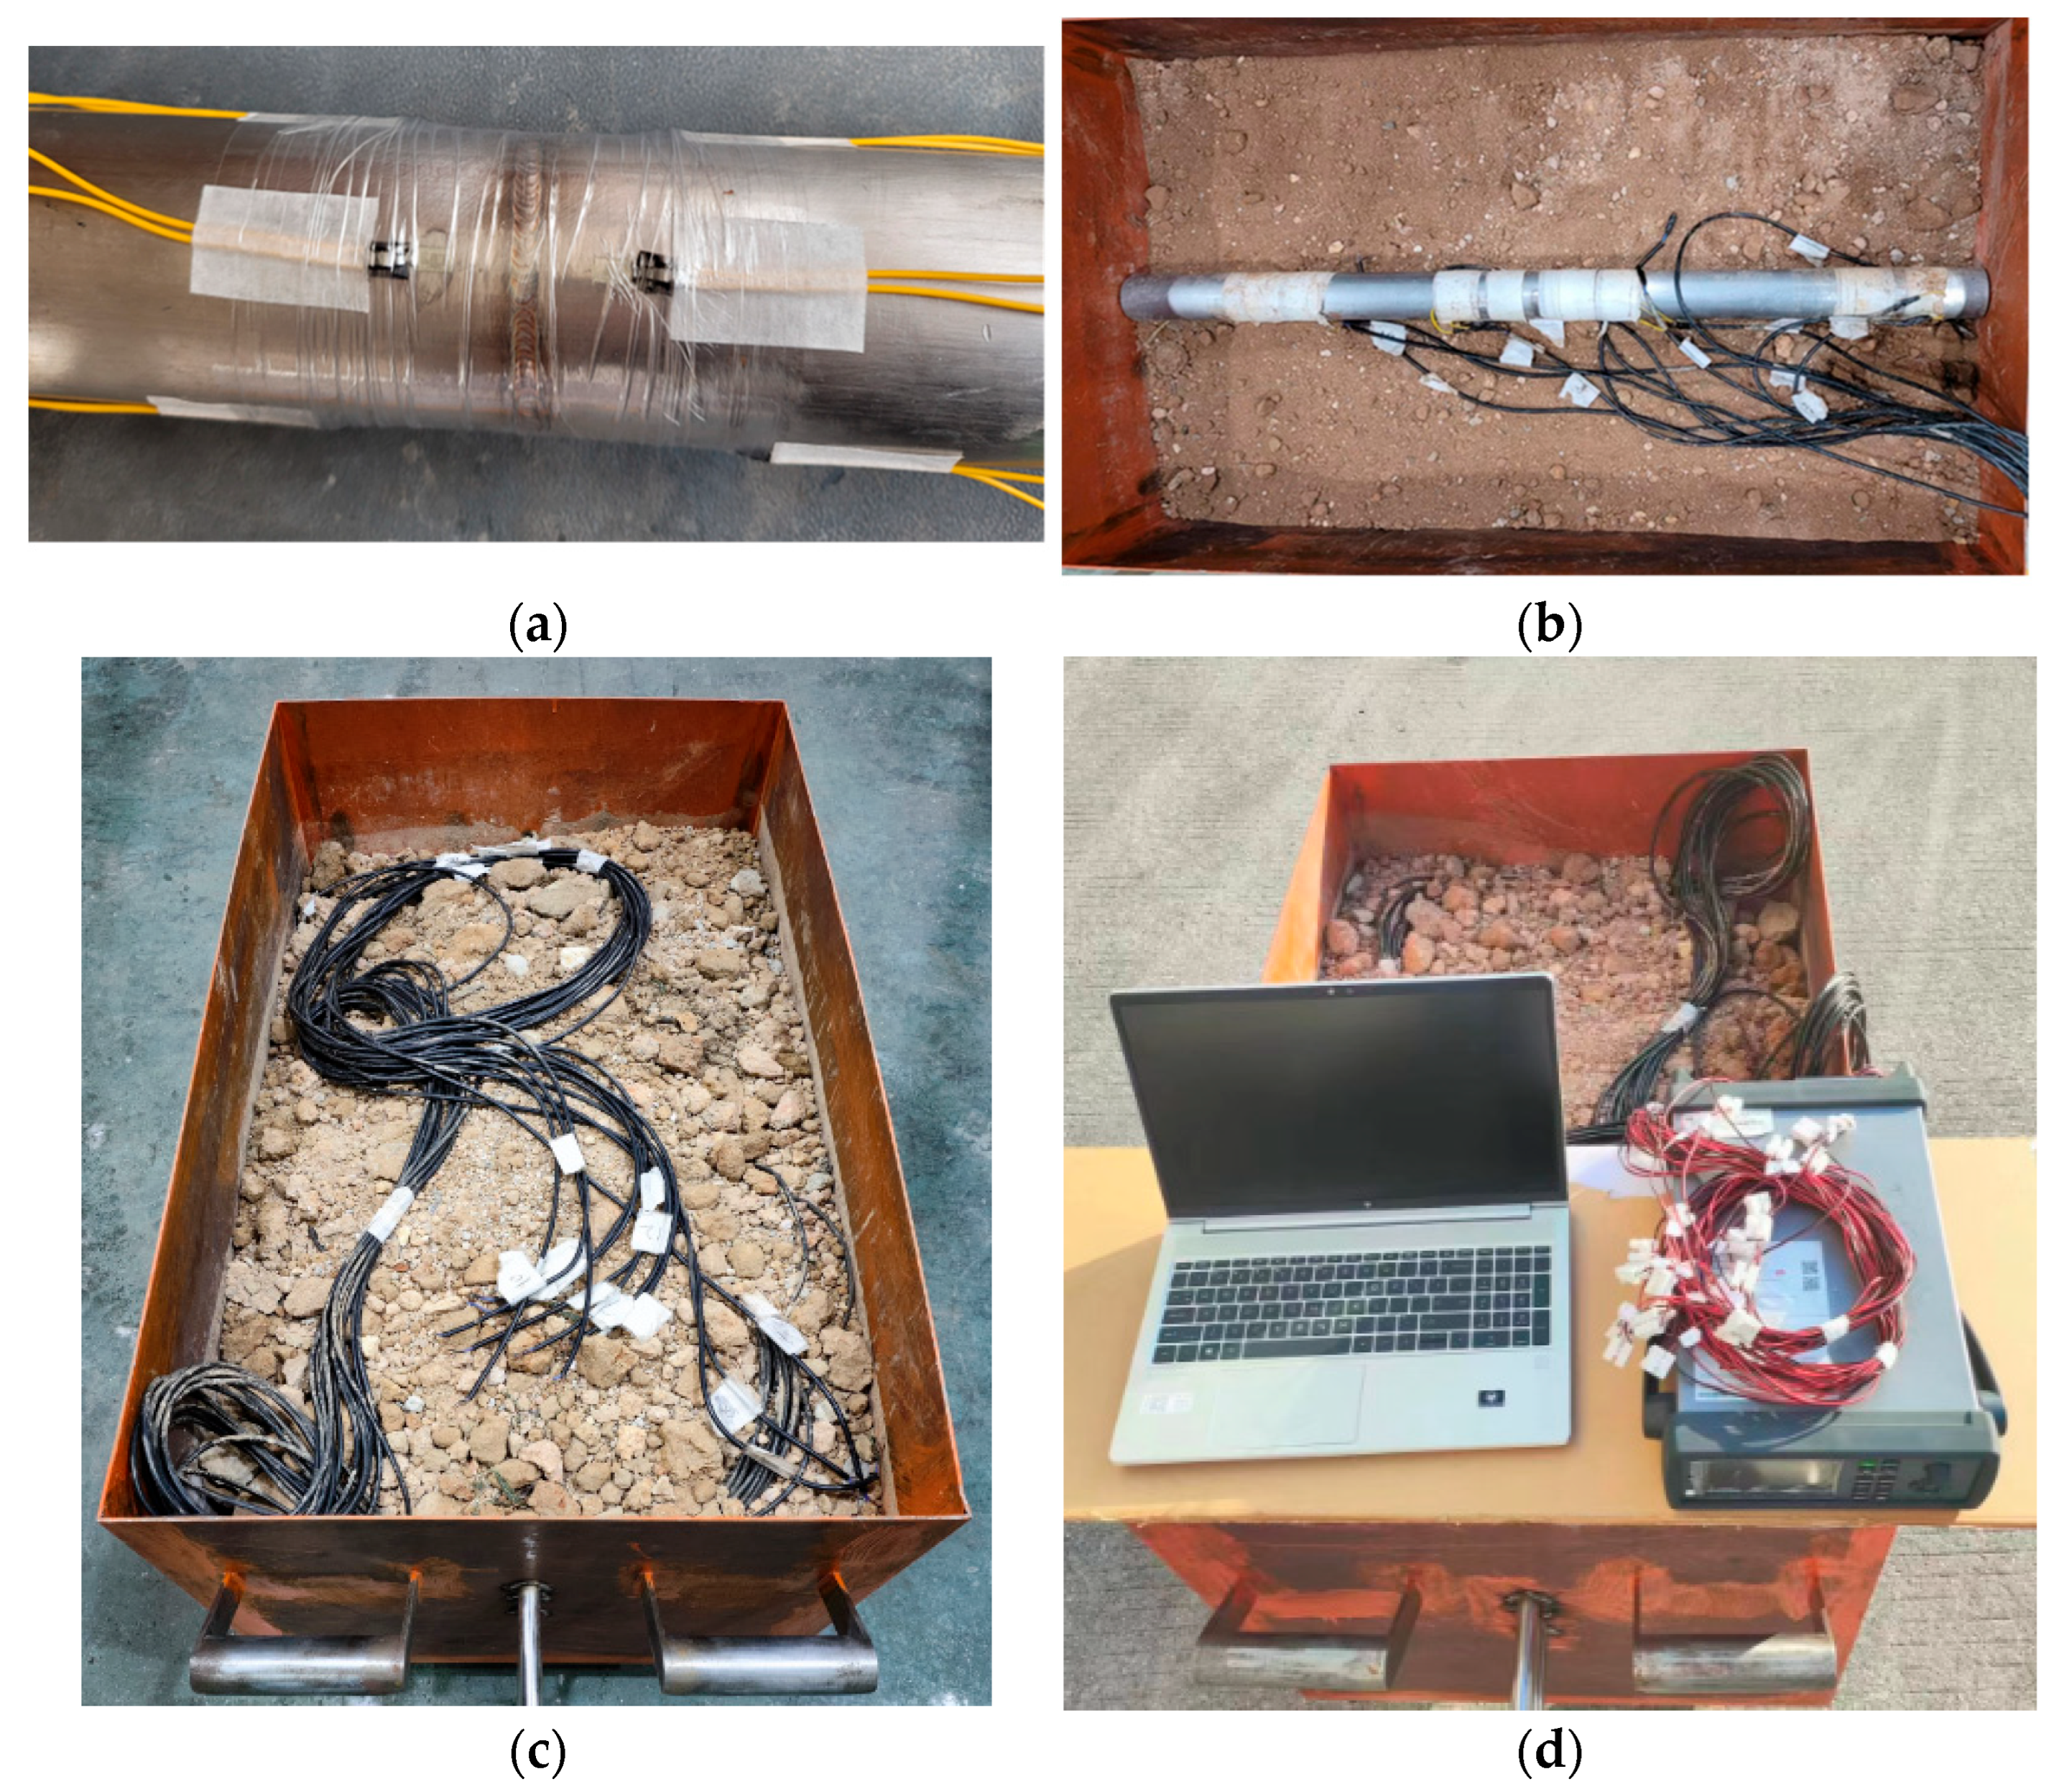
Figure 14.
Permafrost test chart. (a) Strain gauge arrangement; (b) piping arrangement; (c) frostbite process; (d) thawing and sinking process.
Figure 14.
Permafrost test chart. (a) Strain gauge arrangement; (b) piping arrangement; (c) frostbite process; (d) thawing and sinking process.
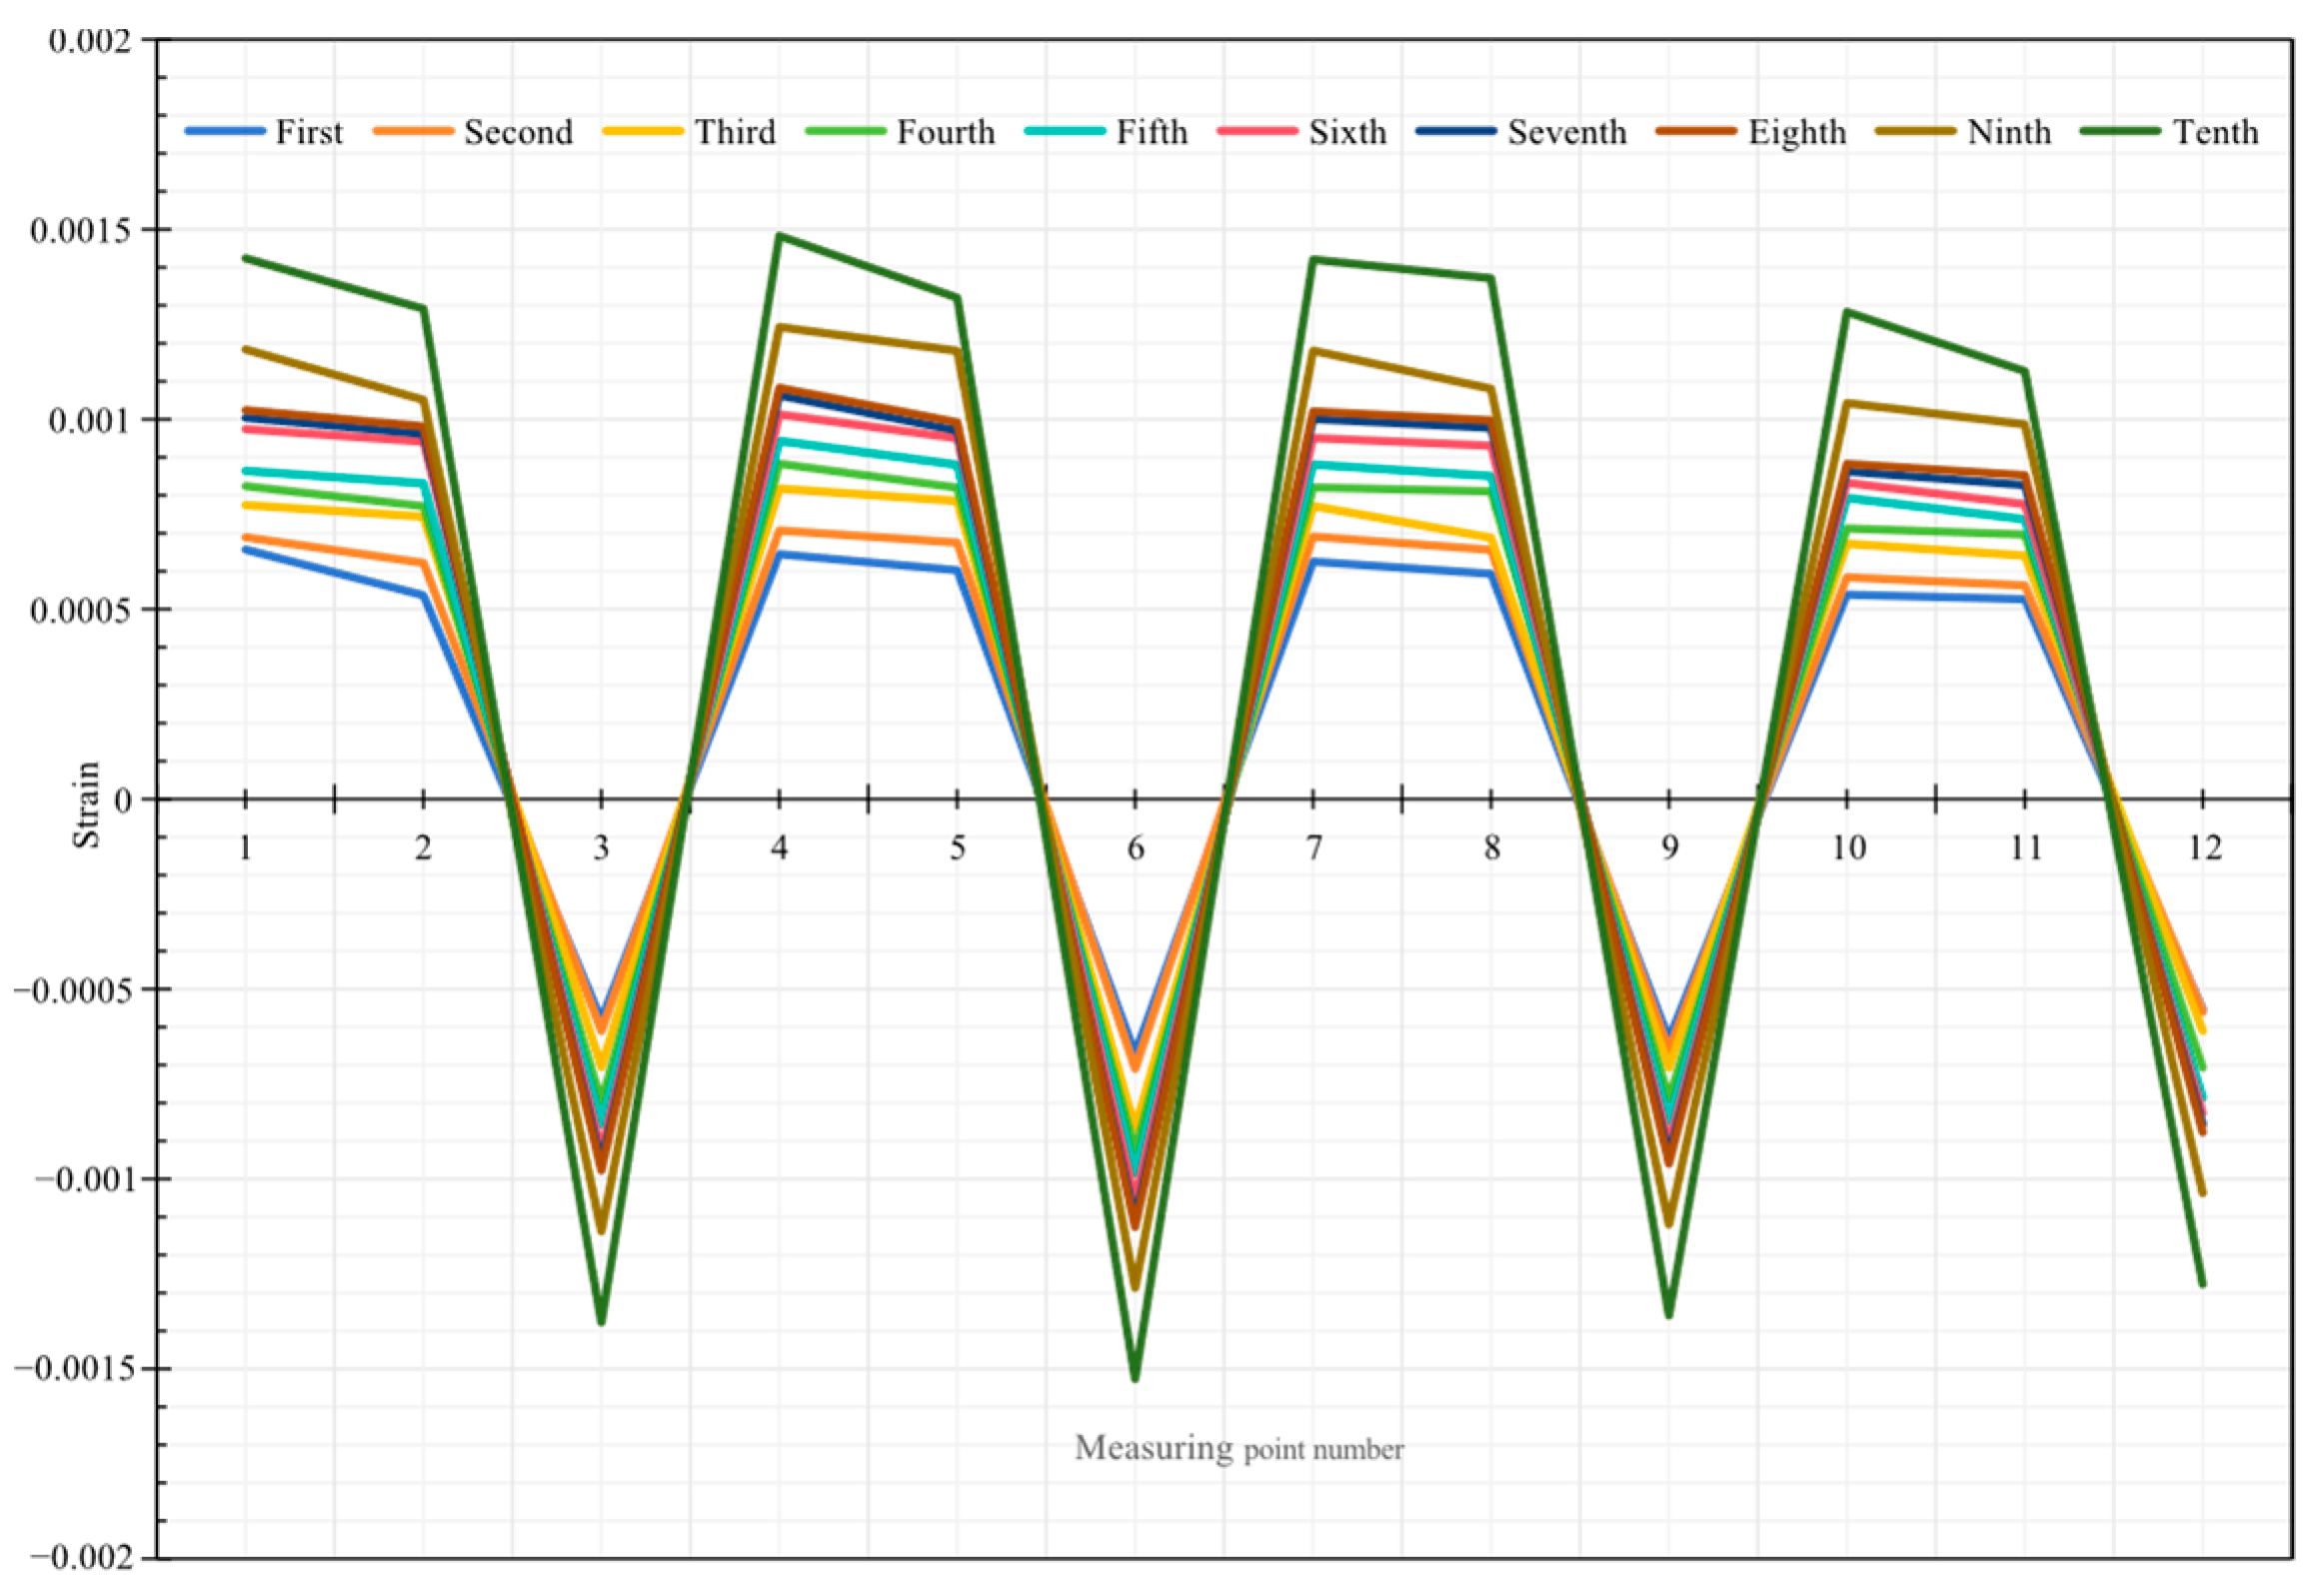
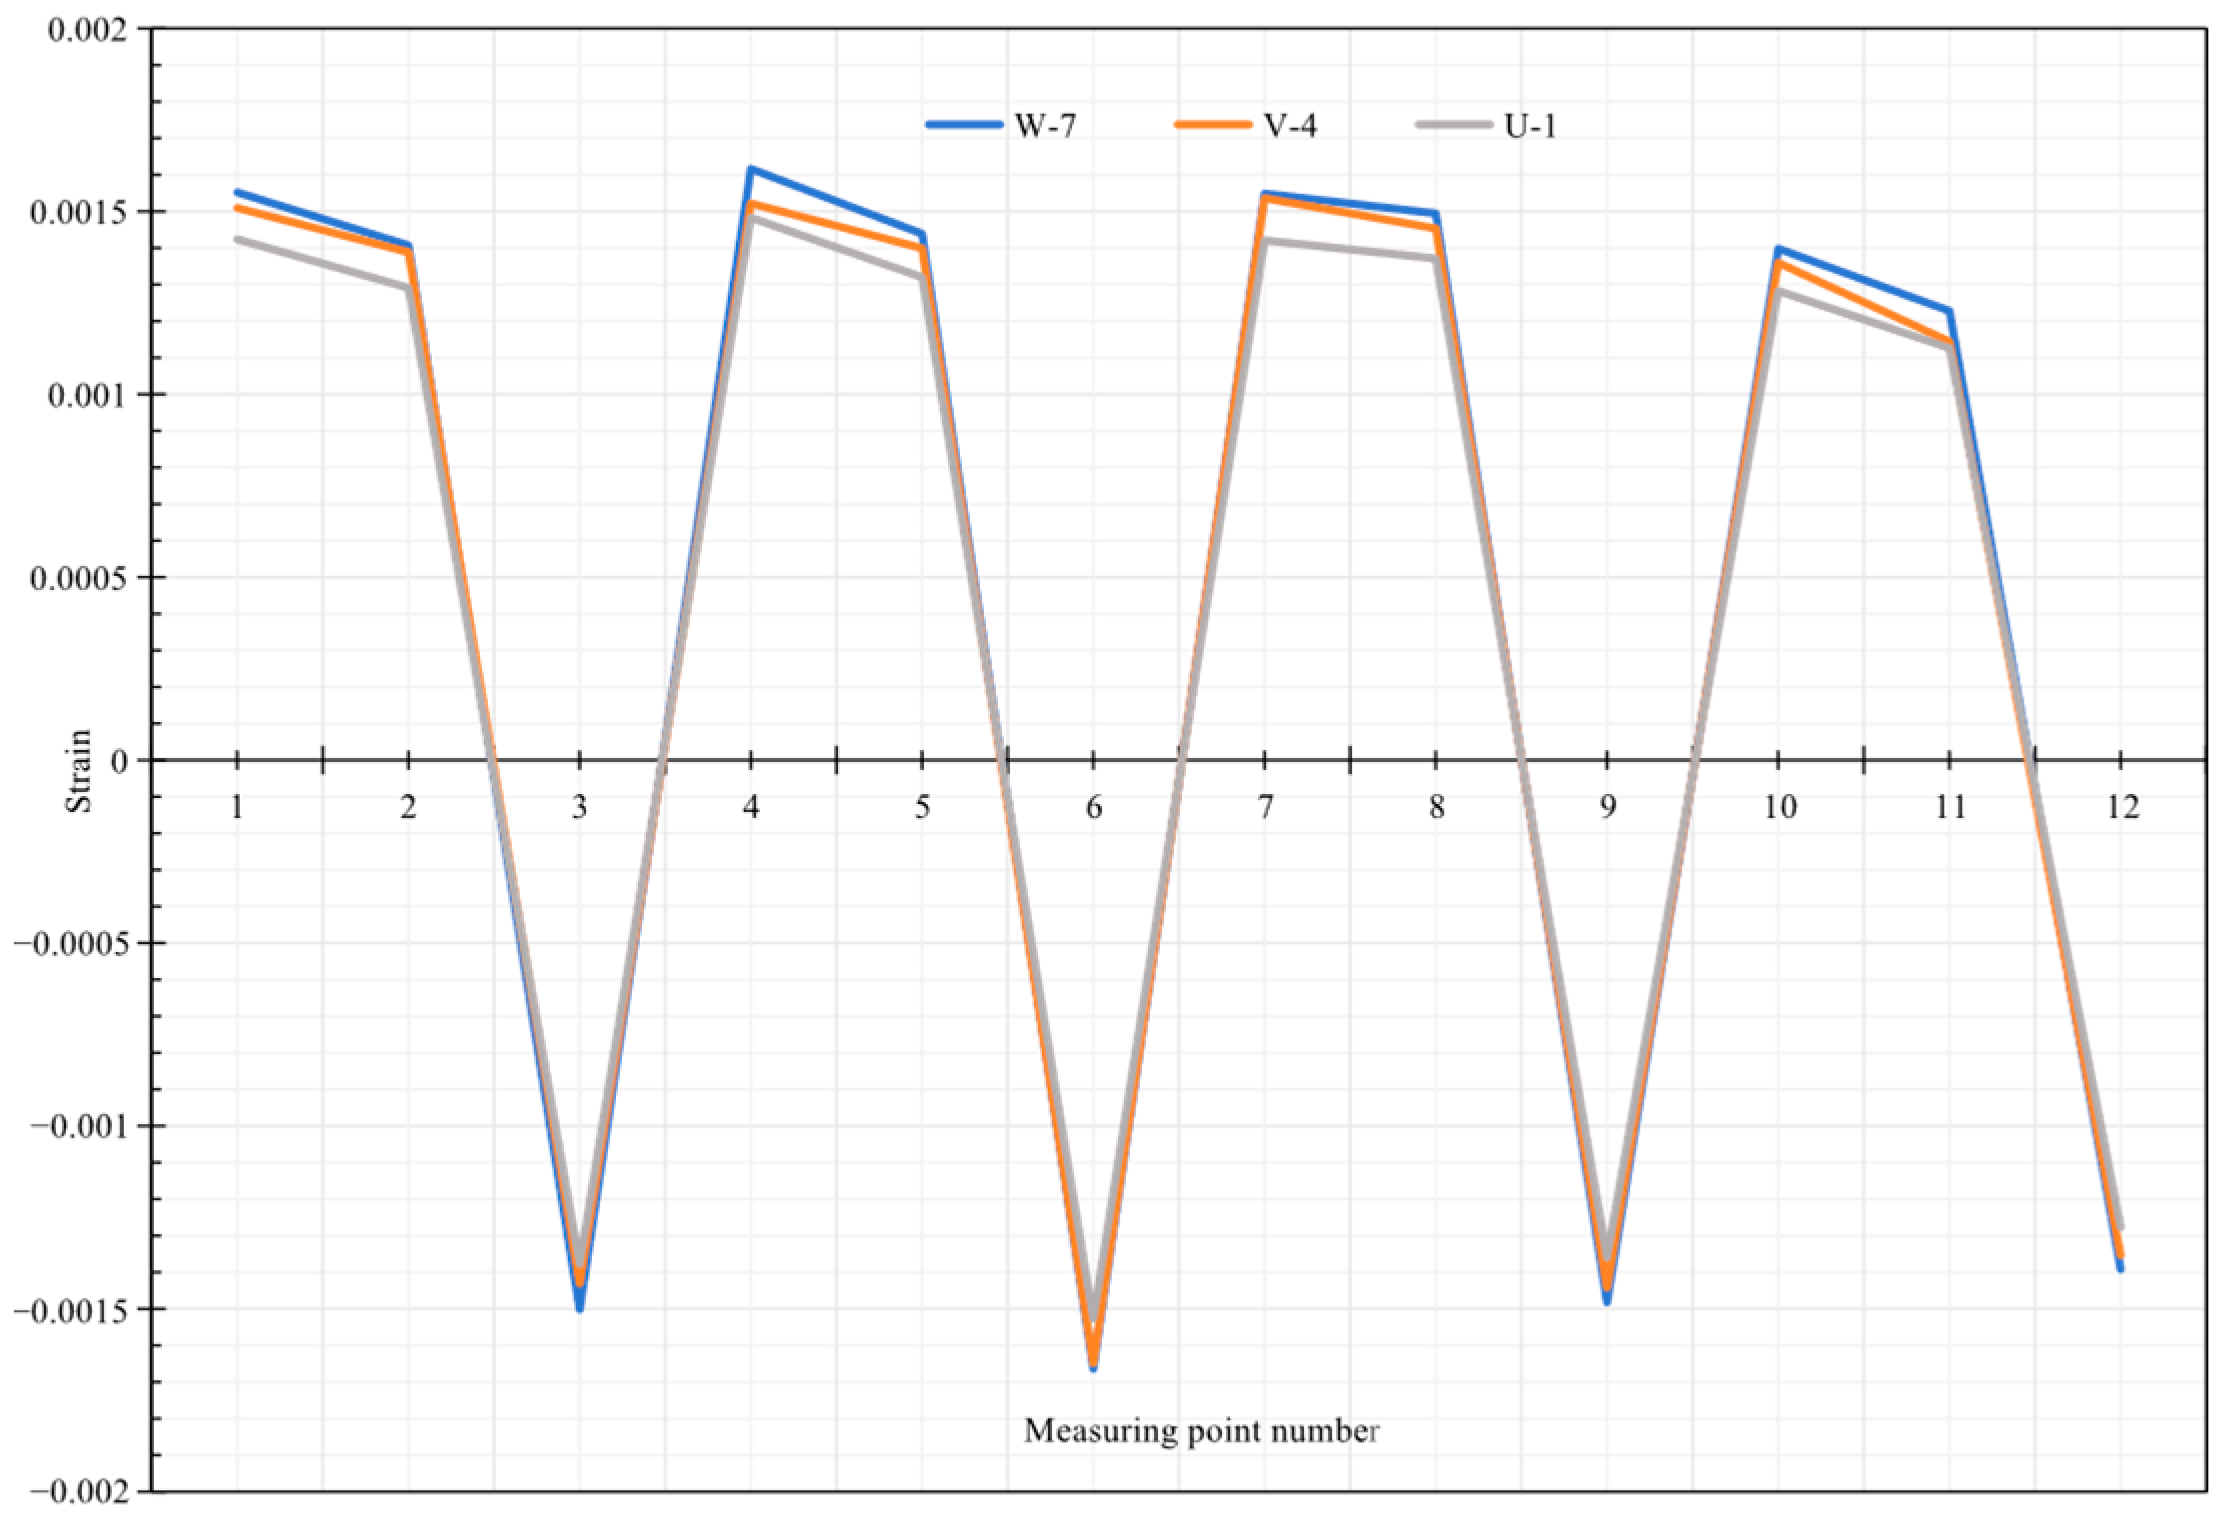
Figure 15.
Strain at each point of the pipe after 10 freeze–thaw cycles.
Figure 15.
Strain at each point of the pipe after 10 freeze–thaw cycles.
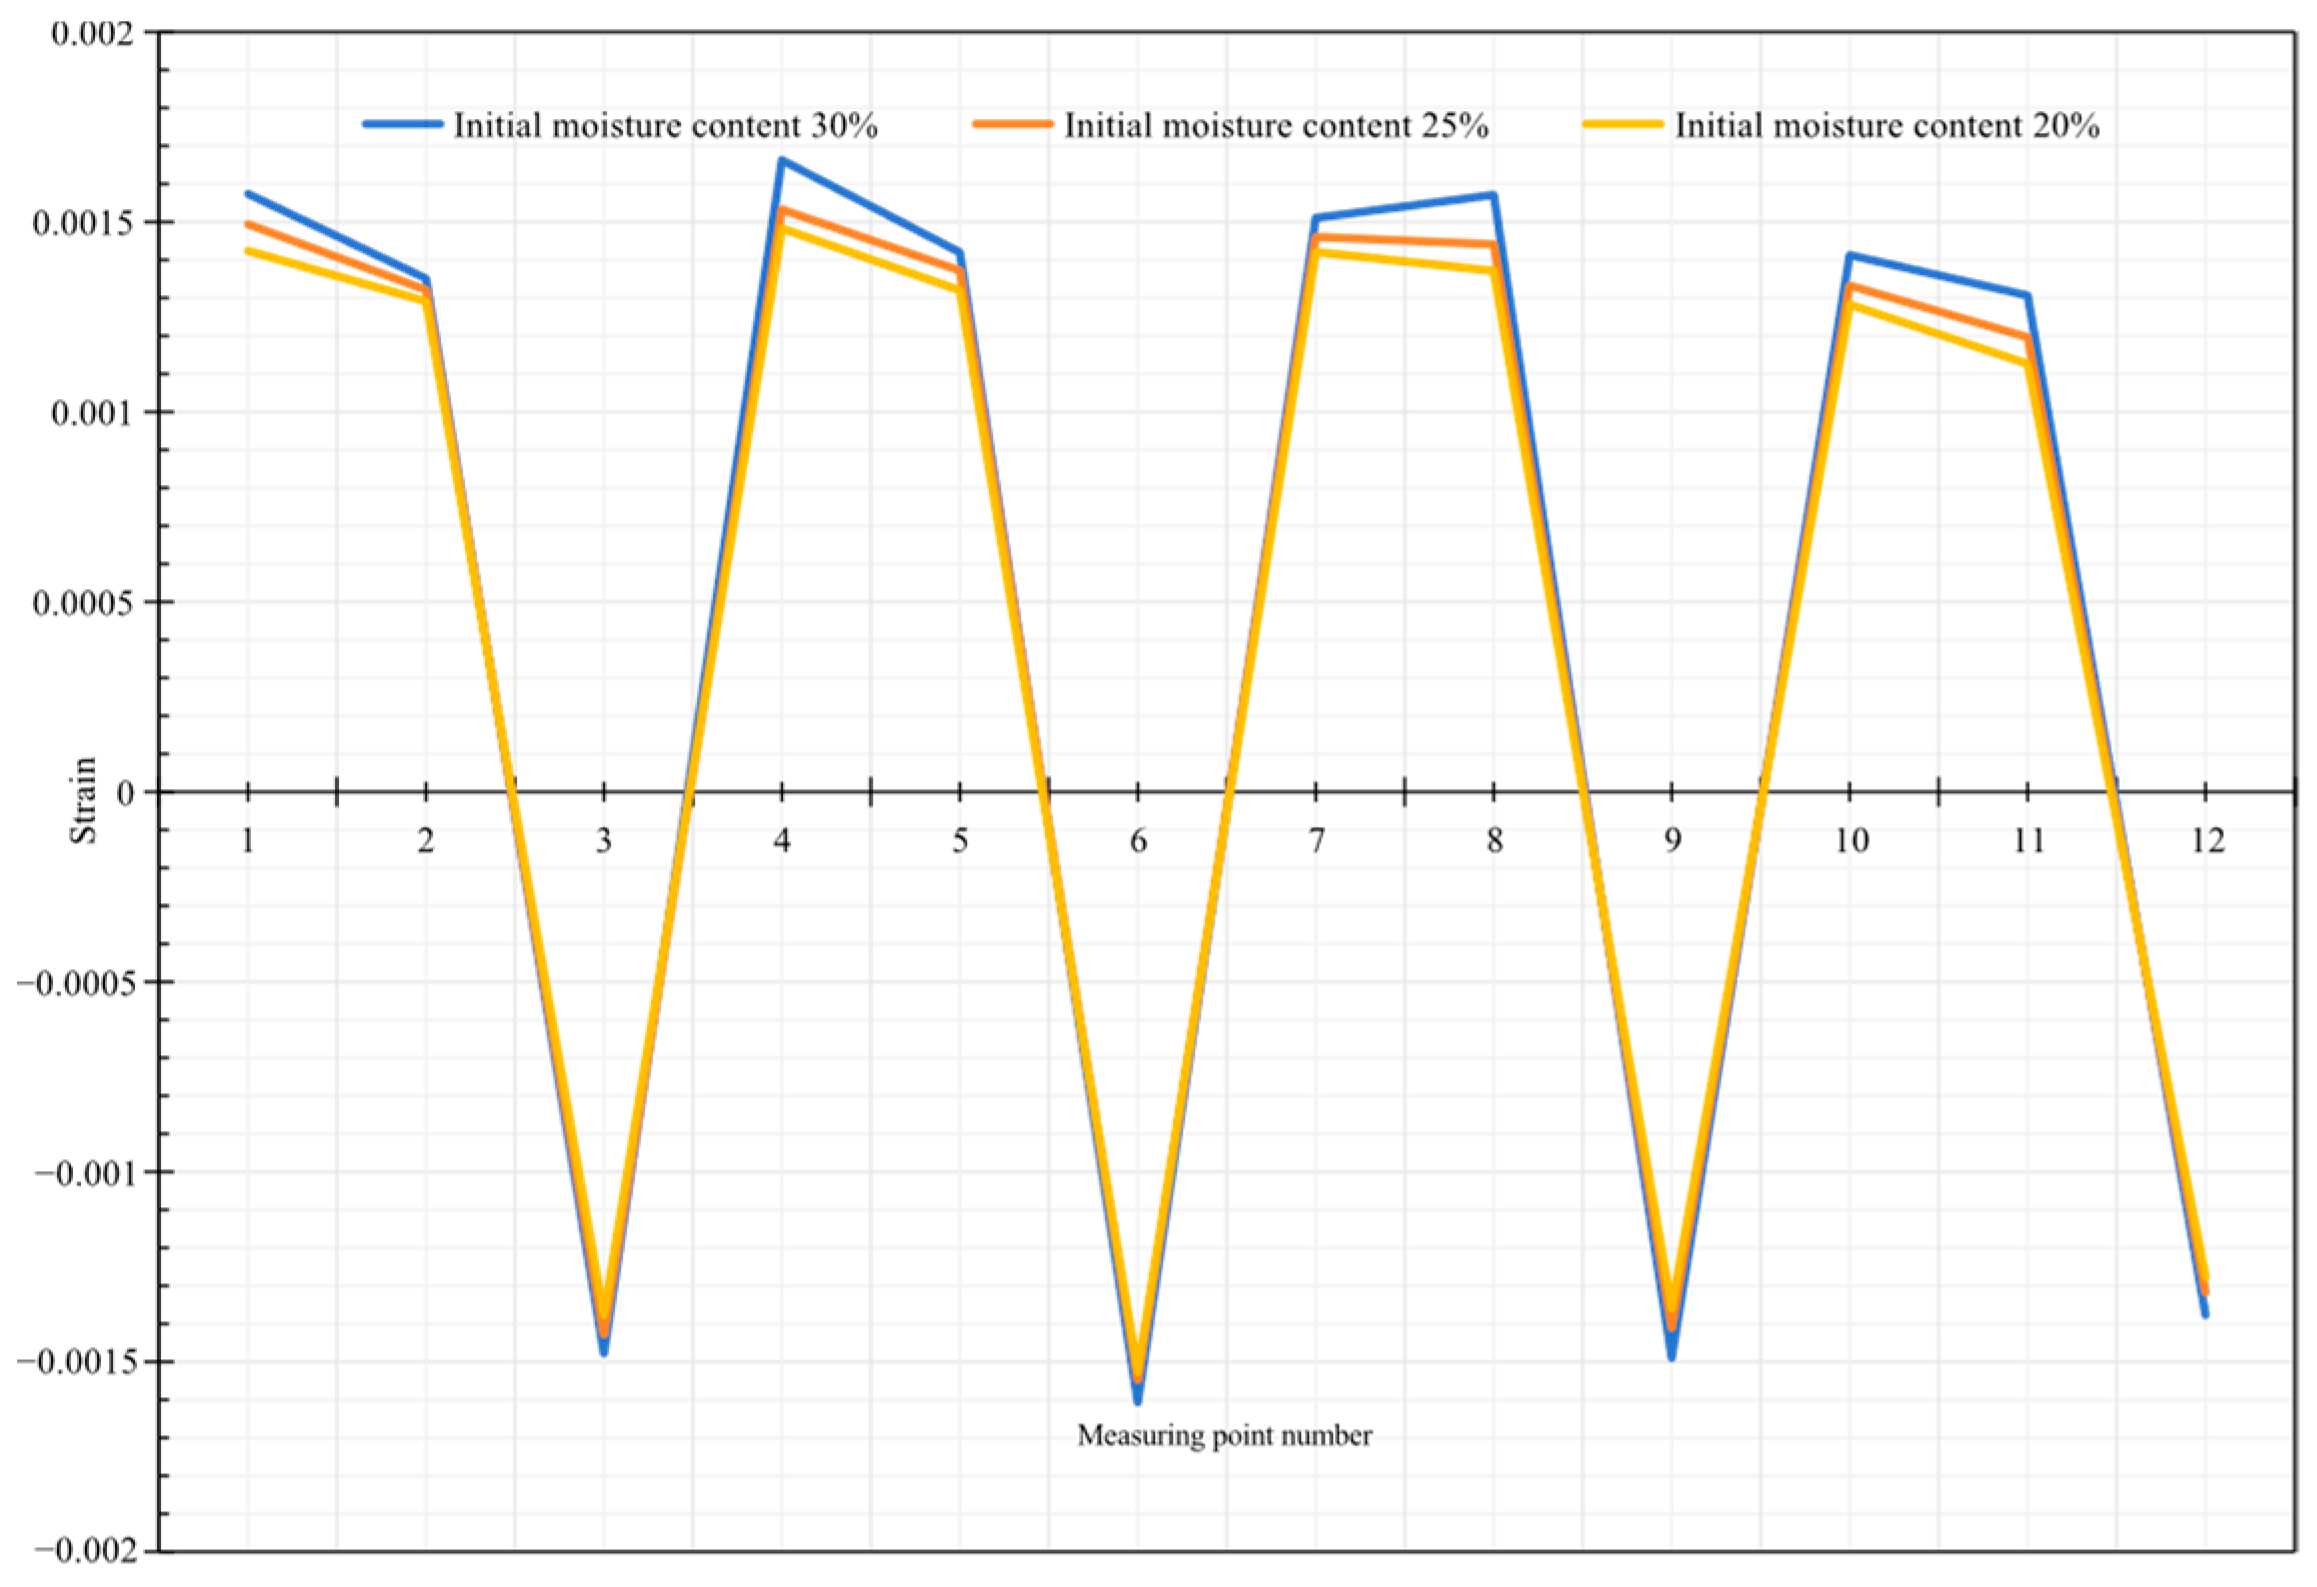
Figure 16.
Pipe strain at different initial moisture contents.
Figure 16.
Pipe strain at different initial moisture contents.
Figure 17.
Effect of different burial depths on pipe strain.
Figure 17.
Effect of different burial depths on pipe strain.
Table 1.
Statistics of pipeline failure probability.
Table 1.
Statistics of pipeline failure probability.
| Reasons for Failure | CHINA | USA | USSR | UK |
|---|
| material defect | 12.4 | 16.9 | 17.1 | 25.6 |
| corrosion defect | 43.6 | 35.4 | 41.0 | 30.2 |
| process damage | 25.3 | 29.8 | 15.8 | 12.8 |
| sabotage by external forces | 18.7 | 17.9 | 26.1 | 31.4 |
Table 2.
Basic Properties of Soil.
Table 2.
Basic Properties of Soil.
| Soil | Density
(kg·m−3) | Moisture | Thermal Conductivity
[(J·(m·h·K)−1] | Specific Heat
[J·(kg·K)−1] | Porosity Ratio |
|---|
| loess | 1970 | 0.3 | 6552 | 982 | 0.63 |
Table 3.
Basic Properties of Pipes.
Table 3.
Basic Properties of Pipes.
| Title | Material | Density
(kg·m−3) | Modulus of Elasticity
(GPa) | Poisson’s Ratio |
|---|
| pipe | X80 | 7850 | 200 | 0.3 |
Table 4.
Grid sensitivity analysis.
Table 4.
Grid sensitivity analysis.
| Number of Grid Cells | Error Analysis |
|---|
| 325,414 | 6.76% |
| 214,789 | 9.43% |
| 573,245 | 4.89% |
Table 5.
Parameter value range.
Table 5.
Parameter value range.
| Parameter Name | Range of Values |
|---|
| initial water content | 0.2~0.3 |
| depth of burial (m) | 1.2~1.5 |
| pipe diameter (mm) | 1011~1417 |
| wall thickness (mm) | 17.5~37.5 |
Table 6.
Stress–strain condition of pipeline under different initial moisture content.
Table 6.
Stress–strain condition of pipeline under different initial moisture content.
| Initial Moisture Content of the Soil | Pipe Equivalent Force (MPa) | Pipeline Isotropic Strain |
|---|
| 0.3 | 327.62 | 0.00164 |
| 0.25 | 297.86 | 0.00149 |
| 0.2 | 262.1 | 0.00135 |
Table 7.
Stress–strain condition of pipeline under different initial water content.
Table 7.
Stress–strain condition of pipeline under different initial water content.
| Pipe Burial Depth (m) | Pipe Equivalent Force (MPa) | Pipeline Isotropic Strain |
|---|
| 1.0 | 315.44 | 0.00157 |
| 1.2 | 297.86 | 0.00149 |
| 1.5 | 285.44 | 0.00143 |
Table 8.
Stress–strain conditions of pipes with different pipe diameters.
Table 8.
Stress–strain conditions of pipes with different pipe diameters.
| Pipe Diameter (mm) | Pipe Equivalent Force (MPa) | Pipeline Isotropic Strain |
|---|
| 1011 | 325.13 | 0.00162 |
| 1219 | 297.86 | 0.00149 |
| 1417 | 261.38 | 0.00133 |
Table 9.
Stress–strain conditions of pipes with different wall thicknesses.
Table 9.
Stress–strain conditions of pipes with different wall thicknesses.
| Wall Thickness (mm) | Pipe Equivalent Force (MPa) | Pipeline Isotropic Strain |
|---|
| 17.5 | 313.62 | 0.00157 |
| 27.5 | 297.86 | 0.00149 |
| 37.5 | 287.48 | 0.00142 |
Table 10.
Test design matrix.
Table 10.
Test design matrix.
| Sample Point Number | h | l | t |
|---|
| 1 | −1 | −1 | 0 |
| 2 | 1 | −1 | 0 |
| 3 | −1 | 1 | 0 |
| 4 | 1 | 1 | 0 |
| 5 | −1 | 0 | −1 |
| 6 | 1 | 0 | −1 |
| 7 | −1 | 0 | 1 |
| 8 | 1 | 0 | 1 |
| 9 | 0 | −1 | −1 |
| 10 | 0 | 1 | −1 |
| 11 | 0 | −1 | 1 |
Table 11.
Sample points and response values by Box–Behnken method.
Table 11.
Sample points and response values by Box–Behnken method.
| Sample Point Number | h (m) | l (m) | t (m) | Maximum Tensile Strain ε (%) |
|---|
| 1 | 1.00 | 1.417 | 0.0275 | 0.001512 |
| 2 | 1.50 | 1.214 | 0.0375 | 0.001513 |
| 3 | 1.25 | 1.417 | 0.0175 | 0.001482 |
| 4 | 1.50 | 1.417 | 0.0275 | 0.001494 |
| 5 | 1.25 | 1.214 | 0.0275 | 0.001530 |
| 6 | 1.25 | 1.011 | 0.0175 | 0.001606 |
| 7 | 1.00 | 1.011 | 0.0275 | 0.001606 |
| 8 | 1.25 | 1.417 | 0.0375 | 0.001465 |
| 9 | 1.00 | 1.214 | 0.0375 | 0.001546 |
| 10 | 1.25 | 1.214 | 0.0275 | 0.001530 |
| 11 | 1.25 | 1.011 | 0.0375 | 0.001529 |
| 12 | 1.50 | 1.011 | 0.0275 | 0.001589 |
| 13 | 1.00 | 1.214 | 0.0175 | 0.001578 |
Table 12.
The eigenvalue of RSM model.
Table 12.
The eigenvalue of RSM model.
| Characteristic Parameters | R-Squared | Adj R-Squared | Pred R-Squared | Adeq Precision |
|---|
| Numerical value | 95.86% | 90.40% | 88.34% | 20.315 |
Table 13.
Comparison table of fitting situation.
Table 13.
Comparison table of fitting situation.
| Sample Point Number | Maximum Tensile Strain for RSM Fitting (%) | Maximum Tensile Strain Calculated by Simulation (%) | Relative Error (%) |
|---|
| 1 | 0.001512 | 0.001512 | 0.00 |
| 2 | 0.001513 | 0.001484 | 1.94 |
| 3 | 0.001482 | 0.001452 | 2.01 |
| 4 | 0.001494 | 0.001455 | 2.59 |
| 5 | 0.001530 | 0.001492 | 2.47 |
| 6 | 0.001606 | 0.001576 | 1.85 |
| 7 | 0.001606 | 0.001596 | 0.62 |
| 8 | 0.001465 | 0.001435 | 2.03 |
| 9 | 0.001546 | 0.001507 | 2.50 |
| 10 | 0.001530 | 0.001492 | 2.47 |
| 11 | 0.001529 | 0.001510 | 1.25 |
| 12 | 0.001589 | 0.001569 | 1.26 |
| 13 | 0.001578 | 0.001568 | 0.64 |
Table 14.
Material and geometrical parameters.
Table 14.
Material and geometrical parameters.
| Test Group | Physical Quantity | Simulation Prototype | Test Selection |
|---|
| Pipe | Piping materials | X80 | X80 |
| Pipe geometry/mm | 1219 × 25 | D60 × t1.0 × L1000 |
| Soil | Soil geometry/m | L75 × W14 × H10 | L1 × W0.6 × H0.6 |
| Soil material | Field prototype soil | Loess |
Table 15.
Test conditions.
Table 15.
Test conditions.
| Test Group | Depth of Burial/mm | Initial Moisture Content | Pipe Diameter/mm | Wall Thickness/mm |
|---|
| U-1 | 200 | 20% | 60 | 1 |
| U-2 | 200 | 25% | 60 | 1 |
| U-3 | 200 | 30% | 60 | 1 |
| V-4 | 240 | 20% | 60 | 1 |
| V-5 | 240 | 25% | 60 | 1 |
| V-6 | 240 | 30% | 60 | 1 |
| W-7 | 300 | 20% | 60 | 1 |
| W-8 | 300 | 25% | 60 | 1 |
| W-9 | 300 | 30% | 60 | 1 |
